Embed Size (px)
Citation preview
9/19/2012
1
PUBLIC OPINION, POLLING, AND THE
SCIENCE OF POLITICAL SCIENCE
GOV T 2302
The
Research
Design
HOW POLITICAL SCIENCE IS A SCIENCE
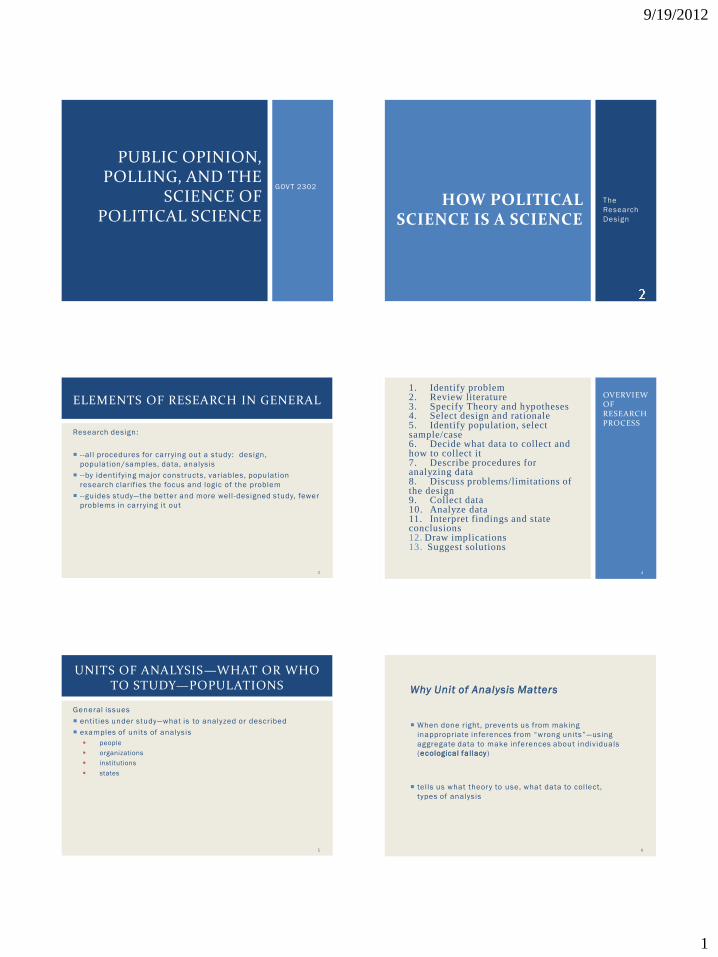
Research design:
- -all procedures for carrying out a study: design,
population/samples, data, analysis
- -by identifying major constructs, variables, population
research clarif ies the focus and logic of the problem
- -guides study—the better and more well -designed study, fewer
problems in carrying it out
ELEMENTS OF RESEARCH IN GENERAL
3
1. Identify problem2. Review literature3. Specify Theory and hypotheses 4. Select design and rationale5. Identify population, select sample/case 6. Decide what data to collect and how to collect it7. Describe procedures for analyzing data 8. Discuss problems/limitations of the design9. Collect data10. Analyze data11. Interpret findings and state conclusions12. Draw implications13. Suggest solutions
OVERVIEW OF RESEARCH PROCESS
4
General issues
entities under study—what is to analyzed or described
examples of units of analysis
people
organizations
institutions
states
UNITS OF ANALYSIS—WHAT OR WHO TO STUDY—POPULATIONS
5
Why Unit of Analysis Matters
When done right, prevents us from making
inappropriate inferences from ―wrong units‖ —using
aggregate data to make inferences about individuals
(ecological fa llacy)
tells us what theory to use, what data to collect,
types of analysis
6

9/19/2012
2
GENERAL ISSUES, CONT’D
Multi- level: multiple units of analysis
qualitative and/or quantitative
Samples or cases
subset of population
often wish to make inferences or draw conclusions based on a small
sample of cases
can do this in a number of ways
7
VARIABLES--WHAT TO STUDY
Constructs, variables, and observations
Constructs: generalized notions or concepts often derived from theory, not directly measurable, observable
Variables: expression of a construct in measurable form
Types of variables--measurement: qualitative or categorical
--e.g., gender, neighborhoods, types of schools
quantitative or numerical variables
--e.g., test scores, voter turnout, income
Observations: actual instruments used to measure variable--e.g., survey data
Ho w to dec ide :
A . sho uld be
based o n ex i s t ing
theo r y/ research
B . m ake use o f
deduc t i ve l o g i c :
co m ing f ro m
theo r y
8
dependent var iables
They are the thing you want to explain: they depend upon…
Example: Test Scores
independent var iables
They are the things that af fect the thing you want to explain
Example: buying the textbook, going to class
in tervening var iables
Things that occur between the independent and dependent variables. Of ten caused by the independent variable and a cause of the dependent variable.
Example: reading the textbook, taking notes in class
TYPES OF VARIABLES
9
1. Types of relationships
a. Between categorical variables: strength of relationship
b. Between quantitative variables: direction and linearity
2. Nature of causal relationships
a. of ten interested in determining causal relationships between dependent and independent variables in order to draw implications for policy or practice
(e.g., Voter Registration Ef for tsHigher Voter Turnout; promote GOT V)
b. Almost impossible to establish direct causality (―direct ef fect‖) in social science research, because we don’t experiment.
RELATIONSHIP AMONG VARIABLES
10
NO
CAN WE ESTABLISH CAUSALITY DEFINITELY ANY OTHER
WAY? 11
Accumulate evidence that strongly suggests causality Show association
(correlation)
Establish direction of influence one way: temporal
relationships between independent and dependent variables not always possible
theory can suggest direction
can test hypothesized direction empirically
Eliminate rival hypotheses (spurious relationships) Always control for other
factors that might influence or explain relationship
Thus the importance of theory
NEXT BEST THING
12

9/19/2012
3
Characteristics of survey research designs:
Par ticipants selected from larger population through
systematic sampling procedures
Standardized procedures for collecting data through interviews
or questionnaires
Data transformed into quantitative measures and analyzed
through statistical analysis
USING SURVEYS IN SOCIAL SCIENCE
13
Strengths can generalize to a very
large population with relatively small sample
cost-efficient
suitable for a variety of research questions from descriptive to explanatory
can be analyzed with sophisticated statistical models
questionnaire data can be augmented with other types of data, such as tests and archival data
Weaknesses can’t provide the depth of
information available from qualitative methods
can’t establish or prove causality as strongly as experimental methods
procedures can be complex and costly to carry out, especially for large-scale studies
STRENGTHS AND WEAKNESSES
14
Cross-sectional most simple, least costly type
good for simple analysis of population—e.g., public opinion polls
limited for inferences over time
Longitudinal more useful for looking at developmental , longitudinal issues
helps untangle life course effects (e.g., aging) vs. cohort effects (although not temporal effects)
types of cohorts: age cohorts, grade cohorts, graduate cohorts
trend studies: repeated cohort studies: e.g., repeated age groups
panel studies; repeated measures of same cohort
Hierarchical multiple samples units
research focus on multiple units
can be longitudinal as well
TYPES OF SURVEY DESIGNS
15
Methods Face-to-face interviews
Telephone interviews
Group-administered questionnaire
Mail questionnaire
Web-based questionnaire
Factors for consideration Population size
Sampling procedures
Types of questions: structured vs. unstructured (purpose of research)
Sensitivity of information: self-administered maybe better; telephone may give more biased information
Response rate
Timeliness
Costs
Staff and facilities required (personnel, training, equipment)
COLLECTING DATA
16
Sources of Error in the data
collection process
• Coverage due to not sampling parts of the population
• Sampling due to variability in sample vs. population
(variance) and due to systematic differences in sample
vs. population (bias)
• Nonresponse
• unit (don’t participate in survey) and
• item (don’t answer certain questions)
• Measurement error not providing accurate or truthful
information17
PO
PU
LA
TIO
N V
SS
AM
PL
E
The population includes all objects of interest whereas the sample is only a portion of the population.Parameters are associated with
populations and statistics with samples.
We compute statistics, and use them to estimate parameters.
There are several reasons why we don't work with populations. They are usually large
It is often impossible to get data for every object we're studying.
Sampling comes at a cost, and the more items surveyed, the larger the cost.
18

9/19/2012
4
Population "The term "population" is
used in statistics to represent all possible measurements or outcomes that are of interest to us in a particular study."
Examples: TAMU-T students
trees in North America
automobiles with four wheels
Sample "The term "sample" refers to
a portion of the population that is representative of the population from which it was selected.“
Examples assuming the populations to the left 47 TAMU-T students chosen
randomly
8463 trees randomly selected in North America;
20 sample autos from each make (e.g., GM, Ford, Toyota, Honda, etc.)
POPULATION VS. SAMPLE
19
Random sampl ing is ana logous to putt ing ever yone's name into a hat and drawing out severa l names. Each element in the populat ion has an equal chance of occur ing . Whi le th is is the preferred way of sampl ing, i t is of ten di f f icul t to do. I t requires that a complete l ist of ever y element in the populat ion be obta ined. Computer generated l ists are of ten used wi th random sampl ing.
Systematic sampl ing is easier to do than random sampl ing. Here the l ist of elements is "counted of f " . That is , ever y k th element is taken. This is s imi lar to l in ing ever yone up and number ing of f "1 ,2,3,4; 1 ,2,3,4; etc" . When done number ing, a l l people numbered 4 would be used.
Convenience sampl ing: readi ly ava i lable data is used. That is , the f i rst people the sur veyor runs into. Ver y easy to do, but i t 's probably the worst technique to use.
Cluster sampl ing is accompl ished by d iv id ing the populat ion into groups - -usua l ly geographica l ly. These groups are ca l led c lusters or b locks. The clusters are randomly selected, and each element in the selected clusters are used.
Strat i f ied sampl ing a lso div ides the populat ion into groups ca l led strata . However, th is t ime i t is by some character ist ic , not geographica l ly. For instance, the populat ion might be separated into males and females. A sample is taken f rom each of these strata using ei ther random, systemat ic, or convenience sampl ing.
TYPES OF SAMPLINGRANDOM, SYSTEMATIC, CONVENIENCE, CLUSTER, STRATIFIED
20
Discrete variables are usually obtained by counting. There are
a f inite or countable number of choices available with discrete
data. You can't have 2.63 people in the room.
Continuous variables are usually obtained by measuring.
Length, weight, and time are all examples of continuous
variables. Since continuous variables are real numbers, we
usually round them. This implies a boundary depending on the
number of decimal places. For example: 64 is really anything
63.5 <= x < 64.5. Likewise, if there are two decimal places,
then 64.03 is really anything 63.025 <= x < 63.035.
Boundaries always have one more decimal place than the data
and end in a 5.
DISCRETE VS. CONTINUOUS VARIABLES
21
There are four levels of measurement: Nominal,
Ordinal, Interval, and Ratio. These go from lowest
level to highest level. Data is classified according to
the highest level which it fits. Each additional level
adds something the previous level didn't have.
Nominal is the lowest level. Only names are meaningful here.
Ordinal adds an order to the names.
Interval adds meaningful differences
Ratio adds a zero so that ratios are meaningful.
You might also think of these as 'types of variables. '
LEVELS OF MEASUREMENT
22
The term
"Average"
is vague
MEASURES OF CENTRAL TENDENCY
23
Average could mean one of four things. The arithmetic mean,
the median, midrange, or mode. For this reason, it is better to
specify which average you're talking about.
AVERAGE….
24
9/19/2012
5
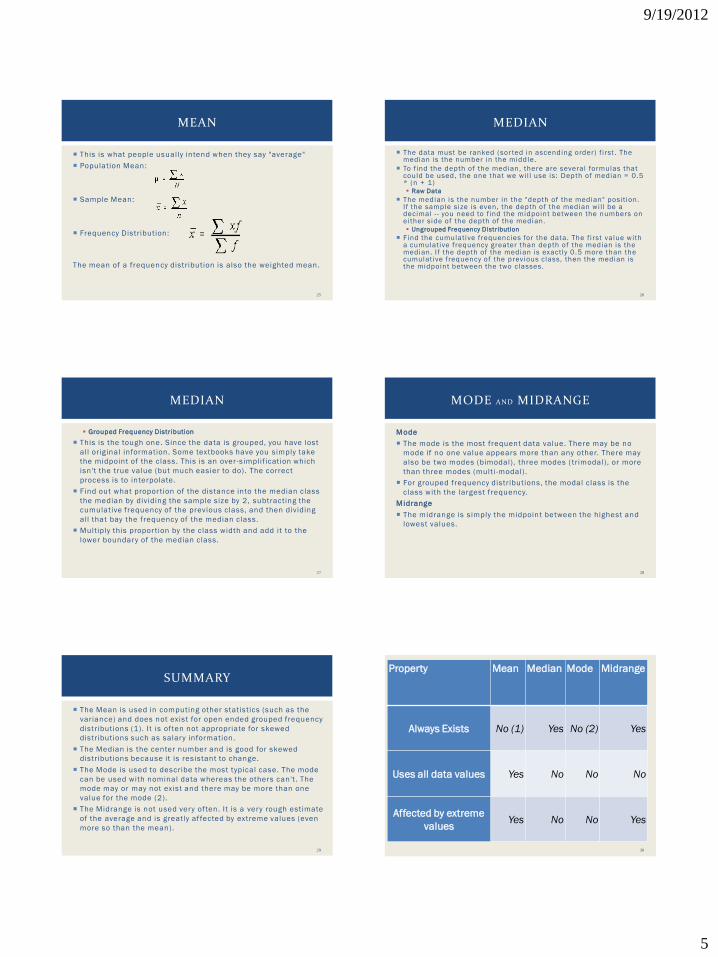
This is what people usually intend when they say "average"
Population Mean:
Sample Mean:
Frequency Distribution:
The mean of a frequency distribution is also the weighted mean.
MEAN
25
The data must be ranked (sor ted in ascending order) f i rst. The median is the number in the middle.
To f ind the depth of the median, there are several formulas that could be used, the one that we wi l l use is: Depth of median = 0.5 * (n + 1) Raw Data
The median is the number in the "depth of the median" position. I f the sample size is even, the depth of the median wi l l be a decimal - - you need to f ind the midpoint between the numbers on either side of the depth of the median. Ungrouped Frequency Distribution
Find the cumulative frequencies for the data. The f i rst value with a cumulative frequency greater than depth of the median is the median. I f the depth of the median is exactly 0.5 more than the cumulative frequency of the previous class, then the median is the midpoint between the two classes.
MEDIAN
26
Grouped Frequency Distribution
This is the tough one. Since the data is grouped, you have lost
all original information. Some textbooks have you simply take
the midpoint of the class. This is an over -simplif ication which
isn't the true value (but much easier to do). The correct
process is to interpolate.
Find out what propor tion of the distance into the median class
the median by dividing the sample size by 2, subtracting the
cumulative frequency of the previous class, and then dividing
all that bay the frequency of the median class.
Multiply this propor tion by the class width and add it to the
lower boundary of the median class.
MEDIAN
27
Mode
The mode is the most frequent data value. There may be no
mode if no one value appears more than any other. There may
also be two modes (bimodal), three modes ( trimodal), or more
than three modes (multi -modal).
For grouped frequency distributions, the modal class is the
class with the largest frequency.
Midrange
The midrange is simply the midpoint between the highest and
lowest values.
MODE AND MIDRANGE
28
The Mean is used in computing other statistics (such as the
variance) and does not exist for open ended grouped frequency
distributions (1). It is of ten not appropriate for skewed
distributions such as salary information.
The Median is the center number and is good for skewed
distributions because it is resistant to change.
The Mode is used to describe the most typical case. The mode
can be used with nominal data whereas the others can't. The
mode may or may not exist and there may be more than one
value for the mode (2).
The Midrange is not used very of ten. It is a very rough estimate
of the average and is greatly af fected by extreme values (even
more so than the mean).
SUMMARY
29
Property Mean Median Mode Midrange
Always Exists No (1) Yes No (2) Yes
Uses all data values Yes No No No
Affected by extreme
valuesYes No No Yes
30

9/19/2012
6
MEASURES OF VARIATION
Because it
matters
why there
is a
dif ference
31
The range is the simplest measure of variation to f ind. It is
simply the highest value minus the lowest value.
RANGE = MAXIMUM - MINIMUM
Since the range only uses the largest and smallest values, it is
greatly af fected by extreme values, that is - it is not resistant
to change.
RANGE
32
"Average Deviation"
The range only involves the smallest and largest numbers, and it would be desirable to have a statistic which involved all of the data values.
The f irst attempt one might make at this is something they might call the average deviation from the mean and define it as:
The problem is that this summation is always zero. So, the average deviation will always be zero. That is why the average deviation is never used.
VARIANCE
33
Population Var iance
So, to keep it from being zero, the deviation from the mean is
squared and called the "squared deviation from the mean".
This "average squared deviation from the mean" is called the
variance.
VARIANCE
34
Unbiased Est imate of the Population Var iance
One would expect the sample variance to simply be the
population variance with the population mean replaced by the
sample mean. However, one of the major uses of statistics is to
estimate the corresponding parameter. This formula has the
problem that the estimated value isn't the same as the
parameter. To counteract this, the sum of the squares of the
deviations is divided by one less than the sample size.
VARIANCE
35
There is a problem with variances. Recall that the deviations
were squared. That means that the units were also squared. To
get the units back the same as the original data values, the
square root must be taken.
The sample standard deviation is not the unbiased estimator
for the population standard deviation.
STANDARD DEVIATION
36

9/19/2012
7
The propor tion of the values that fall within k standard
deviations of the mean will be at least 1-1/k2 , where k is an
number greater than 1 .
"Within k standard deviations"
interprets as the interval: to .
Chebyshev's Theorem is true for any sample set, not matter
what the distribution.
CHEBYSHEV'S THEOREM
37
The empirical rule is only valid for bell -shaped
(normal) distributions. The following
statements are true.
~68% of the data values fall within one standard
deviation of the mean.
~ 95% of the data values fall within two standard
deviations of the mean.
~ 99.7% of the data values fall within three standard
deviations of the mean.
EMPIRICAL RULE
38
Inferential
statistics
SAMPLE AND PROBABILITY
39
A sample space is the set of al l possible outcomes. However, some sample spaces are better than others.
Consider the experiment of f l ipping two coins. I t is possible to get 0 heads, 1 head, or 2 heads. Thus, the sample space could be {0, 1, 2} . Another way to look at i t is f l ip { HH, HT, TH, TT } . The second way is better because each event is as equal ly l ikely to occur as any other.
When wri ting the sample space, i t is highly desirable to have events which are equally l i kely .
Another example is rol l ing two dice. The sums are { 2, 3, 4, 5, 6, 7, 8, 9, 10, 11, 12 } . However, each of these aren't equal ly l ikely. The only way to get a sum 2 is to rol l a 1 on both dice, but you can get a sum of 4 by rol l ing a 1 -3, 2-2, or 3-1. The fol lowing table i l lustrates a better sample space for the sum obtain when rol l ing two dice.
SAMPLE SPACE
40
First Die
Second Die
1 2 3 4 5 6
1 2 3 4 5 6 7
2 3 4 5 6 7 8
3 4 5 6 7 8 9
4 5 6 7 8 9 10
5 6 7 8 9 10 11
6 7 8 9 10 11 12
41
CLASSICAL PROBABILITY
The above table
lends itself to
describing data
another way -- using
a probability
distribution. Let's
consider the
frequency
distribution for the
above sums.
Sum Frequency Relative
Frequency
2 1 1/36
3 2 2/36
4 3 3/36
5 4 4/36
6 5 5/36
7 6 6/36
8 5 5/36
9 4 4/36
10 3 3/36
11 2 2/36
12 1 1/3642

9/19/2012
8
If just the f irst and last columns were written, we would have a
probability distribution. The relative frequency of a frequency
distribution is the probability of the event occurring. This is
only true, however, if the events are equally l ikely.
This gives us the formula for classical probability. The
probability of an event occurring is the number in the event
divided by the number in the sample space. Again, this is only
true when the events are equally l ikely. A classical probability
is the relative frequency of each event in the sample space
when each event is equally l ikely.
P(E) = n(E) / n(S)
CLASSICAL PROBABILITY
43
Empirical probability is based on observation. The
empirical probability of an event is the relative
frequency of a frequency distribution based upon
observation.
P(E) = f / n
EMPIRICAL PROBABILITY
44
A commonly used measurement devise used in political
science research is the Liker t scale. The Liker t scale,
developed in the 1932 by Rensis Liker, is an impor tant tool for
measuring attitudes in public opinion research. Although it can
be a true scale, meaning it is the sum of several individual
items (or what is of ten referred to as an index variable), it is
most of ten used as a single variable or item measuring the
degree of agreement with a proposed statement. Another
impor tant definitional standard of the Liker t scale, or Liker t
items, is the presence of approval and disapproval values with
an obvious middle or undecided point. An example will help
il lustrate what this means:
INDICES AND SCALES
45
Instructions: Please note your agreement or disagreement with the fol lowing statement:
I tem: ―Ronald Reagan was the greatest American president‖.
Response Options:
1 = Strongly Agree2 = Agree
3 = Neither agree nor disagree 4 = Disagree
5 = Strongly Disagree
Note that there are typical ly an odd number of response options (5 or 7 point scale) and an easi ly identi f ied middle point. These are the basic characteristics of this impor tant tool for measuring publ ic atti tudes on just about any question or subject.
EXAMPLE
46
There are two rules which are very impor tant.
Al l probabilities are between 0 and 1 inclusive
0 <= P(E) <= 1
The sum of al l the probabilit ies in the sample space is 1
RULES OF PROBABILITY
47
There are some other rules which are also impor tant.
The probability o f an event which cannot occur is 0 .
The probability of any event which is not in the sample space is
zero.
The probability o f an event which must occur is 1 .
The probability of the sample space is 1 .
The probability o f an event not occurring is one minus the
probability o f i t occurring.
P(E') = 1 - P(E)
MORE RULES
48
9/19/2012
9
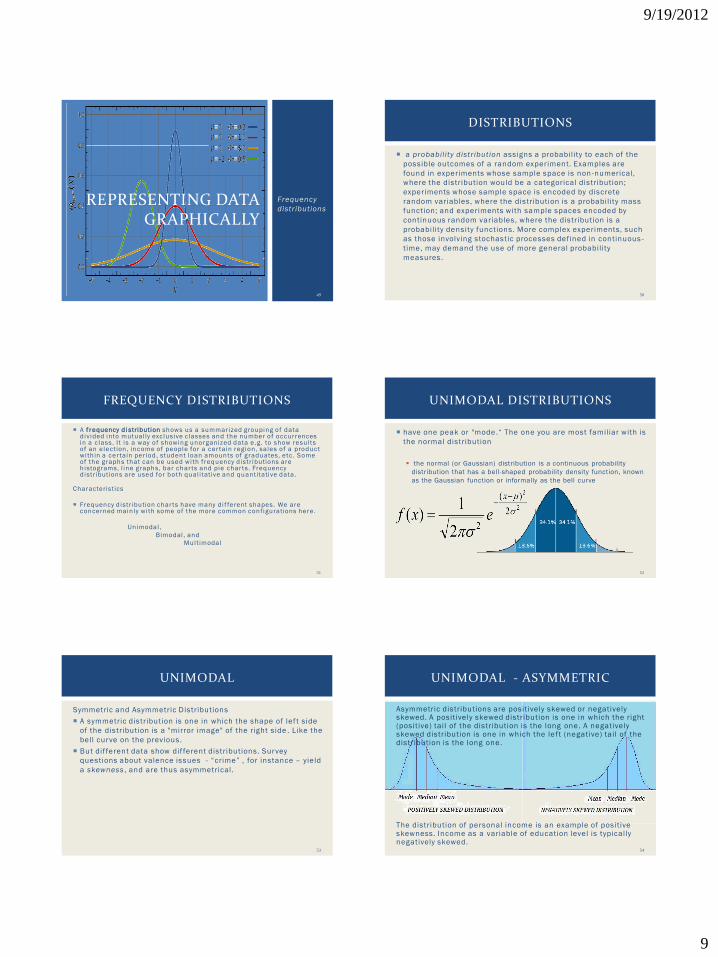
Frequency
distr ibutionsREPRESENTING DATA
GRAPHICALLY
49
a probability distr ibution assigns a probability to each of the
possible outcomes of a random experiment. Examples are
found in experiments whose sample space is non -numerical,
where the distribution would be a categorical distribution;
experiments whose sample space is encoded by discrete
random variables, where the distribution is a probability mass
function; and experiments with sample spaces encoded by
continuous random variables, where the distribution is a
probability density functions. More complex experiments, such
as those involving stochastic processes defined in continuous -
time, may demand the use of more general probability
measures.
DISTRIBUTIONS
50
A f requency d i stribution shows us a summarized grouping of data d iv ided into mutual ly exc lusive c lasses and the number of occurrences in a c lass. I t is a way of showing unorganized data e.g . to show resul ts of an elect ion, income of people for a cer tain region, sales of a product wi th in a cer tain per iod, student loan amounts of graduates, etc . Some of the graphs that can be used wi th f requency d istr ibutions are h istograms, l ine graphs, bar char ts and pie char ts. Frequency d istr ibut ions are used for both qual i tat ive and quantitative data.
Characterist ics
Frequency d istr ibution char ts have many d i f ferent shapes. We are concerned mainly wi th some of the more common conf igurations here.
Unimodal,
Bimodal , and
Mult imodal
FREQUENCY DISTRIBUTIONS
51
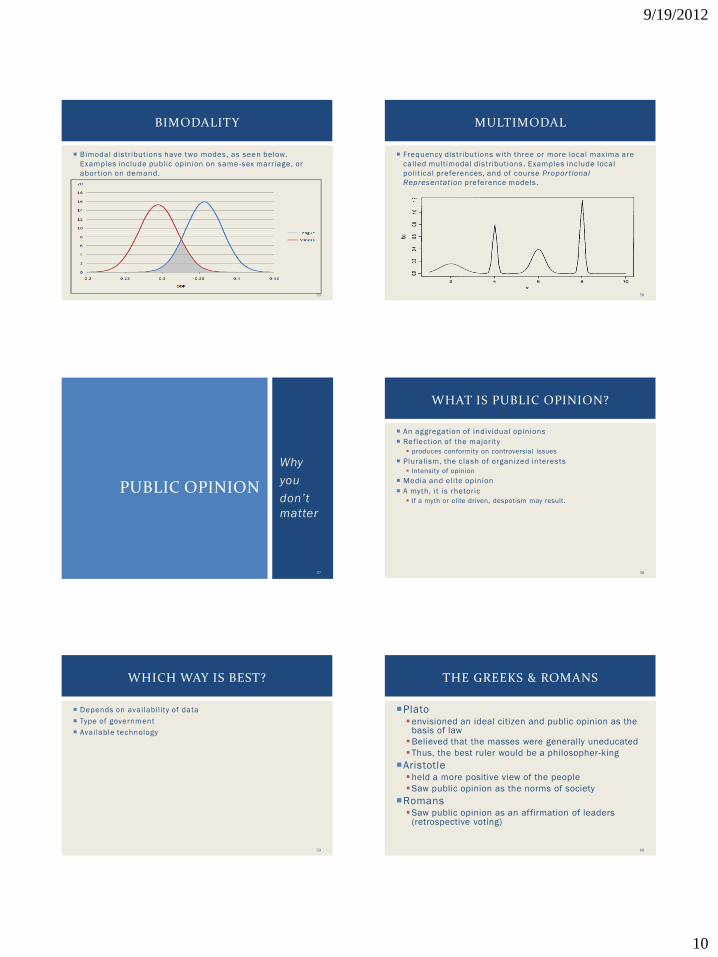
have one peak or "mode .― The one you are most familiar with is
the normal distribution
the normal (or Gaussian) distribution is a continuous probability
distribution that has a bell-shaped probability density function, known
as the Gaussian function or informally as the bell curve
UNIMODAL DISTRIBUTIONS
52
Symmetric and Asymmetric Distributions
A symmetric distribution is one in which the shape of lef t side
of the distribution is a "mirror image" of the right side . Like the
bell curve on the previous.
But dif ferent data show dif ferent distributions. Survey
questions about valence issues - ―crime‖ , for instance – yield
a skewness , and are thus asymmetrical.
UNIMODAL
53
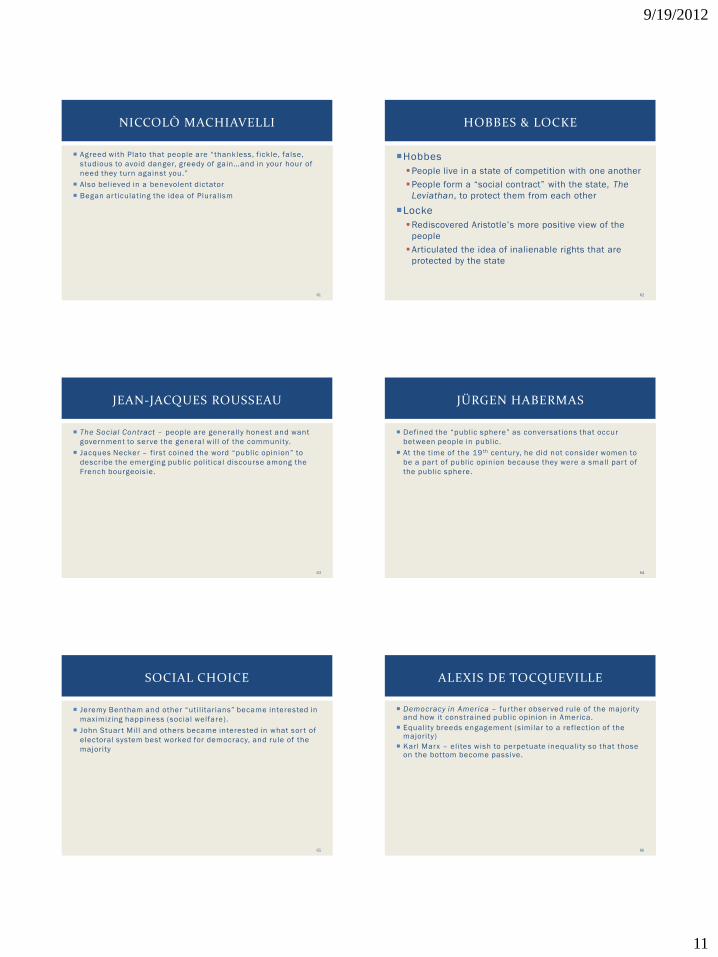
Asymmetric distributions are positively skewed or negatively skewed. A positively skewed distribution is one in which the right (positive) tail of the distribution is the long one. A negatively skewed distribution is one in which the lef t (negative) tail of the distribution is the long one.
The distribution of personal income is an example of positive skewness. Income as a variable of education level is typically negatively skewed.
UNIMODAL - ASYMMETRIC
54
9/19/2012
10
Bimodal distributions have two modes, as seen below.
Examples include public opinion on same -sex marriage, or
abor tion on demand.
BIMODALITY
55
Frequency distributions with three or more local maxima are
called multimodal distributions . Examples include local
political preferences, and of course Proportional
Representation preference models.
MULTIMODAL
56
Why
you
don’t
matter
PUBLIC OPINION
57
WHAT IS PUBLIC OPINION?
An aggregation of individual opinions
Reflection of the majority
produces conformity on controversial issues
Pluralism, the clash of organized interests
Intensity of opinion
Media and elite opinion
A myth, it is rhetoric
If a myth or elite driven, despotism may result.
58
WHICH WAY IS BEST?
Depends on availability of data
Type of government
Available technology
59
THE GREEKS & ROMANS
Plato envisioned an ideal citizen and public opinion as the
basis of law
Believed that the masses were generally uneducated
Thus, the best ruler would be a philosopher-king
Aristotle held a more positive view of the people
Saw public opinion as the norms of society
RomansSaw public opinion as an affirmation of leaders
(retrospective voting)
60
9/19/2012
11
NICCOLÒ MACHIAVELLI
Agreed with Plato that people are ―thankless, f ickle, false,
studious to avoid danger, greedy of gain…and in your hour of
need they turn against you.‖
Also believed in a benevolent dictator
Began ar ticulating the idea of Pluralism
61
HOBBES & LOCKE
Hobbes
People live in a state of competition with one another
People form a ―social contract‖ with the state, The
Leviathan, to protect them from each other
Locke
Rediscovered Aristotle’s more positive view of the
people
Articulated the idea of inalienable rights that are
protected by the state
62
JEAN-JACQUES ROUSSEAU
The Social Contract – people are generally honest and want
government to serve the general will of the community.
Jacques Necker – first coined the word ―public opinion‖ to
describe the emerging public political discourse among the
French bourgeoisie.
63
JÜRGEN HABERMAS
Defined the ―public sphere‖ as conversations that occur
between people in public.
At the time of the 19 th century, he did not consider women to
be a par t of public opinion because they were a small par t of
the public sphere.
64
SOCIAL CHOICE
Jeremy Bentham and other ―util itarians‖ became interested in
maximizing happiness (social welfare).
John Stuar t Mill and others became interested in what sor t of
electoral system best worked for democracy, and rule of the
majority
65
ALEXIS DE TOCQUEVILLE
Democracy in America – fur ther observed rule of the majority and how it constrained public opinion in America.
Equality breeds engagement (similar to a reflection of the majority)
Karl Marx – elites wish to perpetuate inequality so that those on the bottom become passive.
66

9/19/2012
12
THE MODERN ERA
James Bryce – observed the emerging role of the media in
shaping public opinion.
Gabriel Tarde – argued that public opinion f lowed solely from
the media.
Charles Tilly – technological innovation moved the notion of
public sphere from the community to the nation.
67
MODES OF TRANSMISSION
Rhetoric
Demonstrations and Riots
Printing Press
Public forums (cof fee houses, salons)
Elections
Polling
Blogging? Facebook? Twitter?
68
Types of publics:
Everyone
People connected to their government
Citizens
Citizens of voting age
People registered to vote
People likely to vote
Attentive publics
Issue publics
PUBLIC: A GROUP THAT HAS SOMETHING IN COMMON
69
The ―straw poll‖: f irst conducted by the Harrisburg
Pennsylvanian in 1824.
Mail out ballots and tally returned votes.
Also used as a marketing ploy
THE BIRTH OF POLLING:THE STRAW POLL
70
Depend on people to return mail - in cards.
Pierre du Pont straw poll concerning Prohibition was only returned by people who favored repealing it.
People polled can be unrepresentative (haphazard sample)
1936 Literary Digest poll predicted Alf Landon (57%) would be elected president over FDR (43%).
RELIABILITY OF STRAW POLLS
71
Gallup in 1936 predicts FDR wins (55.7% even though FDR won
60.8%).
Used scientif ic ―quota sampling‖ of only about 1,200 people
compared to the 2 million in the Literar y Digest straw poll.
THE BIRTH OF THE MODERN POLL
72

9/19/2012
13
SAMPLING
The Population
The Sample
Unknown
73
The Sample will ―likely‖ look like the Population
But, by random chance it is unlikely that the Sample will be exactly like the Population
SIMPLE RANDOM SAMPLING ERROR
74
Where,
is the observed percentage
N is the number of people in the sample
SIMPLE RANDOM SAMPLING ERROR
N
pp ˆ1ˆError Standard
p̂
75
p̂
SIMPLE RANDOM SAMPLING ERROR
1 S.E.
2 S.E.
p
95% of the time, the
true population value
is +/- 1.96 S.E.
76
95% of the time, the true Population mean will
be within +/- the Sampling Error
5% of the time, it won’t
Sampling Error is dependent on the size of the
Sample (but not the size of the Population!)
Sample Size = Sampling Error
600 = 4% 1,067 = 3%
2,430 = 2%
SIMPLE RANDOM SAMPLING ERROR
77
Quota Samples – use the census to f ind a cer tain
number of people in dif ferent groups to force sample to
be representative of population
The method failed in 1948:
TYPES OF SAMPLING
78

9/19/2012
14
Simple Random Sampling – everyone has an equal chance of
being selected
Mutistage Cluster Sampling – a combination of the two
approaches
Telephone surveys & Random Digit Dialing
TYPES OF SAMPLING
79
56% of people contacted responded to the
2000 National Election Survey.
5% of households don’t have phones
Solution is to weight the surveys to match the
census, but…
Census is not entirely accurate
People who choose not to respond may hold different
opinions than those that do, even within the same
demographic category
THE PROBLEM OF NON-RESPONSE
80
CELL PHONE COVERAGE
Cell Phone Only PopulationNational Health Interview Survey
81
CELL PHONE COVERAGE
82
CELL PHONECOVERAGE
83
CELL PHONECOVERAGE
84
9/19/2012
15
Automated Dialing Polls
Who answers the phone?
Internet Polls
Are they representative?
Push Polls
Campaigns masquerading as pollsters
Letter writing campaigns
OTHER TYPES OF “POLLS”
85
Bias refers to anything that causes the estimate from the survey to differ from the true populationSampling: how representative the poll is Sampling error
Non-response error
Survey design: Question wording
Item ordering
Question ordering
Interviewer and response: Social desirability
BIAS
86
―Suppose an admitted Communist wanted to make a speech in
your community. Should he be allowed to speak or not?
Combines attitudes towards communism with attitudes towards
free speech
QUESTION WORDING: MULTIPLE STIMULI
87
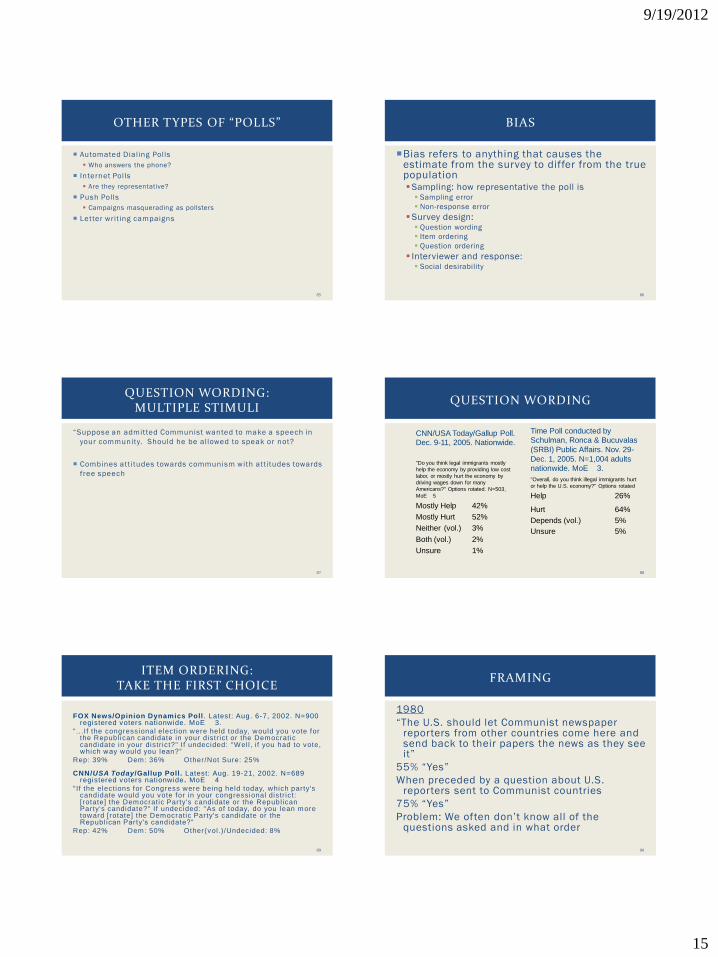
QUESTION WORDING
CNN/USA Today/Gallup Poll.
Dec. 9-11, 2005. Nationwide.
"Do you think legal immigrants mostly
help the economy by providing low cost
labor, or mostly hurt the economy by
driving wages down for many
Americans?" Options rotated. N=503,
MoE 5
Mostly Help 42%
Mostly Hurt 52%
Neither (vol.) 3%
Both (vol.) 2%
Unsure 1%
Time Poll conducted by
Schulman, Ronca & Bucuvalas
(SRBI) Public Affairs. Nov. 29-
Dec. 1, 2005. N=1,004 adults
nationwide. MoE 3.
"Overall, do you think illegal immigrants hurt
or help the U.S. economy?" Options rotated
Help 26%
Hurt 64%
Depends (vol.) 5%
Unsure 5%
88
FOX News/Opinion Dynamics Poll . Latest: Aug. 6-7, 2002. N=900 registered voters nationwide. MoE 3.
" ...I f the congressional election were held today, would you vote for the Republ ican candidate in your distr ict or the Democratic candidate in your distr ict?" If undecided: "Well , i f you had to vote, which way would you lean?“
Rep: 39% Dem: 36% Other/Not Sure: 25%
CNN/USA Today /Gallup Poll. Latest: Aug. 19-21, 2002. N=689 registered voters nationwide . MoE 4
"If the elections for Congress were being held today, which party's candidate would you vote for in your congressional distr ict: [rotate] the Democratic Party's candidate or the Republ ican Party's candidate?" If undecided: "As of today, do you lean more toward [rotate] the Democratic Party's candidate or the Republ ican Party's candidate?“
Rep: 42% Dem: 50% Other(vol.)/Undecided: 8%
ITEM ORDERING:TAKE THE FIRST CHOICE
89
1980
―The U.S. should let Communist newspaper reporters from other countries come here and send back to their papers the news as they see it‖
55% ―Yes‖
When preceded by a question about U.S. reporters sent to Communist countries
75% ―Yes‖
Problem: We often don’t know all of the questions asked and in what order
FRAMING
90
9/19/2012
16
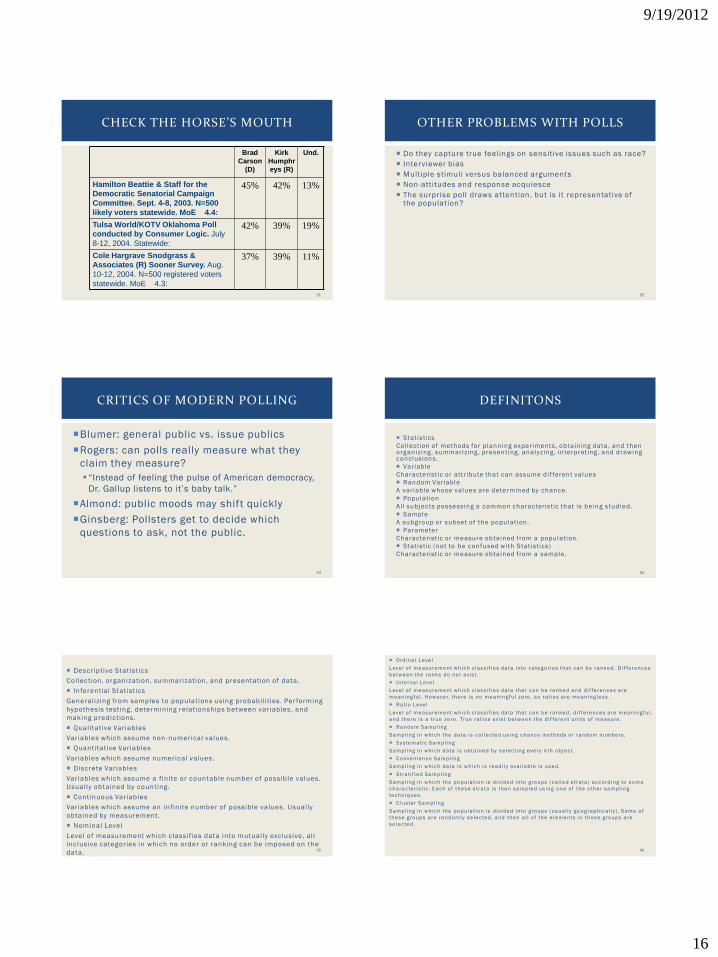
CHECK THE HORSE’S MOUTH
Brad
Carson
(D)
Kirk
Humphr
eys (R)
Und.
Hamilton Beattie & Staff for the
Democratic Senatorial Campaign
Committee. Sept. 4-8, 2003. N=500
likely voters statewide. MoE 4.4:
45% 42% 13%
Tulsa World/KOTV Oklahoma Poll
conducted by Consumer Logic. July
8-12, 2004. Statewide:
42% 39% 19%
Cole Hargrave Snodgrass &
Associates (R) Sooner Survey. Aug.
10-12, 2004. N=500 registered voters
statewide. MoE 4.3:
37% 39% 11%
91
Do they capture true feelings on sensitive issues such as race?
Interviewer bias
Multiple stimuli versus balanced arguments
Non-attitudes and response acquiesce
The surprise poll draws attention, but is it representative of the population?
OTHER PROBLEMS WITH POLLS
92
Blumer: general public vs. issue publics
Rogers: can polls really measure what they
claim they measure?
―Instead of feeling the pulse of American democracy,
Dr. Gallup listens to it’s baby talk.‖
Almond: public moods may shift quickly
Ginsberg: Pollsters get to decide which
questions to ask, not the public.
CRITICS OF MODERN POLLING
93
Stat istics
Col lection of methods for planning exper iments, obtaining data, and then organizing, summariz ing, presenting, analyz ing, interpret ing, and drawing conclusions.
Variable
Characterist ic or attr ibute that can assume di f ferent values
Random Var iable
A var iable whose values are determined by chance.
Populat ion
Al l subjects possessing a common characterist ic that is being studied.
Sample
A subgroup or subset of the populat ion.
Parameter
Characterist ic or measure obtained f rom a populat ion.
Stat istic (not to be confused wi th Stat ist ics)
Characterist ic or measure obtained f rom a sample.
DEFINITONS
94
Descr iptive Stat ist ics
Collect ion, organizat ion, summarization, and presentation of data.
Inferential Stat ist ics
Generalizing from samples to populat ions using probabil i ties. Per forming
hypothesis test ing, determining relat ionships between var iables, and
making predict ions.
Qualitative Var iables
Var iables which assume non -numerical values.
Quant itative Var iables
Var iables which assume numerical values.
Discrete Var iables
Var iables which assume a f inite or countable number of possible values.
Usually obtained by count ing.
Cont inuous Var iables
Var iables which assume an infinite number of possible values. Usually
obtained by measurement.
Nominal Level
Level of measurement which c lassif ies data into mutually exc lusive, al l
inc lusive categor ies in which no order or ranking can be imposed on the
data.95
Ordina l L eve l
L eve l o f m easurem ent w hich c lass i f i es data into ca teg o r ies that can be ranked. D i f fe rences
be tw een the ranks do no t ex i s t .
I nte r va l L eve l
L eve l o f m easurem ent w hich c lass i f i es data that can be ranked and d i f fe rences a re
m eaning ful . Ho w ever, the re i s no m eaning ful ze ro , so ra t io s a re m eaning less .
Rat io L eve l
L eve l o f m easurem ent w hich c lass i f i es data that can be ranked, d i f fe rences a re m eaning ful ,
and the re i s a t rue ze ro . True ra t io s ex i s t be tw een the d i f fe rent uni ts o f m easure .
Rando m Sam pl ing
Sam pl ing in w hich the data i s co l l ec ted us ing chance m etho ds o r rando m num bers .
Sys tem at i c Sam pl ing
Sam pl ing in w hich data i s o bta ined by se lec t ing eve r y k th o bjec t .
C o nvenience Sam pl ing
Sam pl ing in w hich data i s w hich i s readi l y ava i lab le i s used.
Stra t i f i ed Sam pl ing
Sam pl ing in w hich the po pula t io n i s d i v ided into g ro ups (ca l l ed s tra ta ) acco rd ing to so m e
charac te r i s t i c . E ach o f these s tra ta i s then sam pled us ing o ne o f the o the r sam pl ing
techniques .
C lus te r Sam pl ing
Sam pl ing in w hich the po pula t io n i s d i v ided into g ro ups (usua l l y g eo g raphica l ly ) . So m e o f
these g ro ups a re rando m ly se lec ted, and then a l l o f the e lem ents in tho se g ro ups a re
se lec ted.
96