Embed Size (px)
Citation preview
POLISH POLAR RESEARCH (POL. POLAR RES.) 1 4 53—66 1980 POLSKIE BADANIA POLARNE
Ryszard SAMP
Institute of Meteorology and Water Management, Maritime Depart-ment, Gdynia
Selected environmental factors in the waters of Admiralty
Bay (King George Island, South Shetland Islands)
December 1978 — February 1979*)
ABSTRACT: During austral summer 1978/1979 the content of dissolved oxygen, phosphates, nitrates and nitrites was determined in the waters of Admiralty Bay. Environ-mental conditions prevailing in Admiralty Bay are compared with the conditions in the open Antarctic waters.
K e y w o r d s : Antarctica, nutrients, oxygen
1. Introduction
One of the most significant indicators of the state of water environment is the degree of oxygenation and the content of nutrients in water. These environmental factors show great variability in time and space.
The studies in the Scott Sea ( A r s a n o v a 1974) indicate that the southern part of the sea is richer in phosphates (2—2.2 ^mole -H) than the northern part (0.6—2.0 |лпо1е-Н). The content of nutritive substances in water is subject to considerable seasonal changes. This includes also the content of silicates in water.
The studies carried out during austral summer of 1978/1979 by G r e -lowsk i and P a s t u s z a k (1979) in the regions of South Georgia indicate good conditions of water oxygenation in the shelf area. Phosphates, nitrates and silicates concentrations were in the range of 1.7—2.3 | imole-H (these
*) This work was supported by grants the Third Antarctic Expedition of the Polish Academy of Sciences to Arctowski Station 1978—1979, headed by Dr S. Rakusa-Suszczewski, Project MR.II.16.

5 4 Ryszard Samp
Fig. 1. Sampling stations in Admiralty Bay
values approximate those obtained in the Scott Sea by A r s a n o v a 1974), 18—29jimole>H and 33—53 p m o l e - H , respectively.
The studies on the content of nutrients in the waters of Admiralty Bay carried out in the summer season 1977/1978 ( D e r a 1979) indicate that high concentrations of nutrients, typical for the Antarctic waters southwards of the Convergence Zone, remain at the same level, except some inconsiderable fluctuations, in time and space through out the period of investigations. This is ascribed to good circulation of the waters between Admiralty Bay and the open sea.
Selected environmental factors... 5 5
The presented studies dealing with the degree of oxygenation of the waters in Admiralty Bay and the content of nutrients (phosphates, nitrates and nitrites) in water are a continuation of the studies carried out during the Second Antarctic Expedition of the Polish Academy of Sciences in summer 1977/1978 ( D e r a 1979).
2. Methods
The investigations were conducted at 24 sampling stations located in the area of Admiralty Bay (Fig. 1, Table I).
The water samples for analyses were collected with Nansen vessels from the board of a motor-boat at the following depth levels: 0 m, 25 m, 50 m, 100 m, 200 m, and at the bottom of the Bay. In very deep places the water samples were collected not at the bottom but at the depth of 10 m, or exceptionnall 20 m, above the bottom. This was conditioned by sudden changes in the structure ol the bottom and driftage of the boat. The depth of water was measured by means of a block gauge and a steel rope weighted additionally with a 30 kg sounding lead.
T a b l e I
Geographical co-ordinates and depths of the sampling stations in Admiralty Bay
Station No.
Depth (m)
Geographical co-ordinates Station No.
Depth (m) latitude longitude
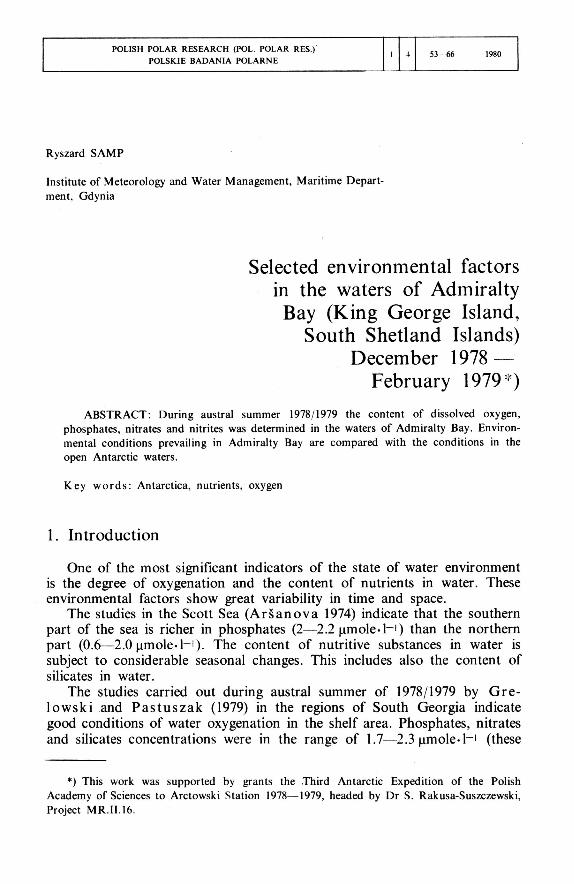
1*) — 62 09'7"S 58°28'4"W 2*) — 62°10'2" 58°30'8" 3*) — 62°10'1" 58c27'9" IB*) — 62"08'9" 58°28'3" 4 102 62°09'5" 58"27'8" 5 410 62°08'8" 58°26'0" 6 103 62°08'1" 58°24'3" 7 80— 90 62°09'3" 58°29'5" 8 240 62°09'0" 58°29'8" 9 270 62°08'7" 58°30'0"
10 270 62°07'4" 58°26'4" U 32 62°05'8" 58°26'7" 12 220 62°05'8" 58°22'7" 13 82—134 62°10'1" 58°32'0" 14 70— 82 62°10'2" 58°32'0" 15 102—113 62°09'7" 58°33'0" 16 55 62°10'7" 58°34'6" 17 81 62°09'9" 58°35'1" 18 62— 78 62°10'9" 58°36'7" 18A 14 62° 11'2" 58°37'5" 19 480 62°09'8" 58°24'2" 20 500 62° 11'7" 58°22'0" 19A — 62°10'5" 58°26'2" 19B — 62°09'5" 58°20'4"
*) littoral stations
5 6 Ryszard Samp
Within the period of investigations from December 1978 to February 1979 14 one-day cruises were made during which 300 water samples were collected. The determination of the content of phosphates, nitrates, nitrites and oxygen was made in the laboratory ashore. The analyses were repeated three times.
The frequency of concentrations of the examined constituens of water were determined in classes: oxygen — 0.2 ml and 2%, phosphates — 0.2 ^imole, nitrates — 2 (.imole and nitrites — 0.05 цто1е. The water samples used for determination of oxygen content was preserved directly after collection. The determination of oxygen, phosphates, nitrates, and nitrites were made on the day of sampling, after going ashore. Conventional analytical methods generally accepted in oceanography were used ( G r a s s h o f f 1976). Absorbency was measured in a UV-Vis, Beckman 26 spectrophotometer.
It was very characteristic that the concentration of oxygen at the bottom of the water was higher in Ezcurra Inlet (7.09 mg 0 - , - H ) than in the other parts of Admiralty Bay (5.89 mg 0 : - H ) .
3. Results and discussion
Oxygen content in the waters of Admiralty Bay ranged throughout the austral summer of 1978/1979 from 9.40 m l - H at the water surface in the littoral stations to 5.40 m l - H at the water bottom at the outlet of the Bransfield Strait.
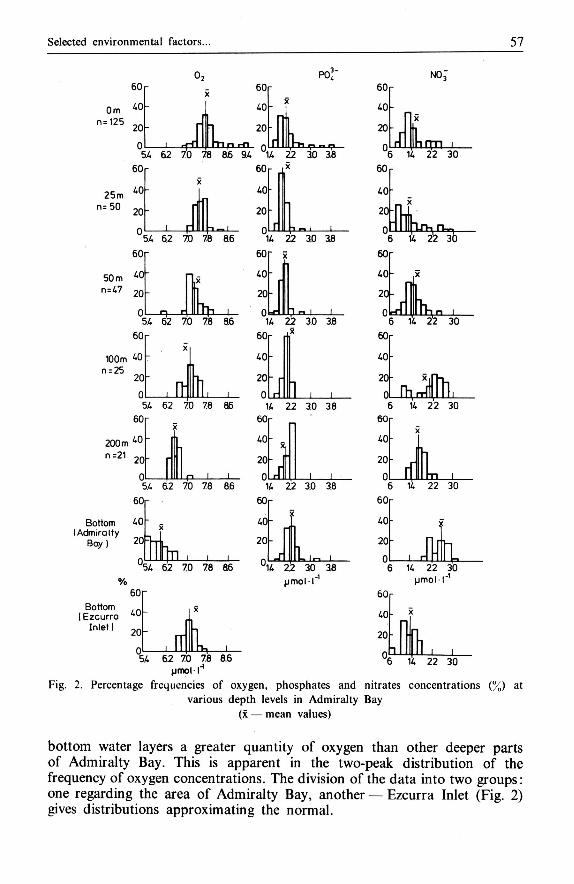
The oxygen concentrations at various depth levels approximated normal values (Table II) except in the bottom zone, where two groups of values were distinctly marked out (Fig. 2). Higher oxygen concentration averaging 7.09 m l - H occurred at the bottom of Ezcurra Inlet. In other parts of Admiralty Bay oxygen concentrations were lower, averaging 5.89 m l - H ,
T a b l e II
Statistical characteristic of frequencies of dissolved oxygen concentrations in the waters of Admiralty Bay
Depth Number of X Dx CTX X Dx CTX
(m) samples (ml 0 2 Г ' ) (% saturation)
0 125 7.76 7.70 0.36 99.1 97.6 4.67 25 50 7.52 7.62 0.23 94.9 96.5 2.56 50 47 7.23 7.15 0.34 92.2 91.2 3.23
100 25 7.11 7.13 0.25 89.0 91.0 3.21 200 21 6.55 6.54 0.19 82.2 82.8 2.85
Bottom 53 6.61 7.13 0.65 82.4 89.2 7.94
x — mean value. Dx —-modal value, rtx Standard Deviation
The greatest variability of oxygen content occurs in the surface water layer, at the depth of 50 m and in the bottom water layer (Fig. 2). Oxygen concentrations at the water surface exceeding 8.2 m l - H occurred mainly in the littoral sampling stations (Fig. 3), where very often water was saturated with oxygen, especially in the periods of smaller waves and the warming up of the waters. The variability of the oxygen content in the bottom water layers is of a local character: the shallow Ezcurra Inlet has in the
Selected environmental factors... 5 7
0m n= 125
25m n= 50
50 m n=47
100m n = 25
. I n n rfL 5A 62 70 78 86 9.4 1A 22 3.0 3.8
i 5.4 62 70 78 86
J_ 5.4 62 70 78 8.6
Л Ш _L 5.4 62 70 78 86
200 m n =21
60
40
J_ 5.4 62 70 78 8.6
Bottom (Admiralty
Bay)
60
40
20
0, ш 54 62 70 78
%
Bottom I Ezcurra
Inlet)
60
40
20
0 Л 5.4
к
POV 60
40
20
0.
60
40
20
0
14 22 3.0 38
60Г х 40
20
0 1
60
40
20
0
_1_
3 ^ 1.4 22 3.0 38
х
ш 1.4 22 3.0 38
60
40
20
0 А _L _L 14 22 3.0 3.8
60
40
20
0.
:
J 1-. In I 14 2.2 30 3.8
ртом"'
60
40
20
0. L
NO;
ГТП I 6 14 22 30
60 г
40
20 п х
fflu 14 22
60
40
20-
0
60г
40-
20-
0 -
и 6 14 30
ж Д Ъ 6 14 22 30
60
40
20
О 6
60г
40
20
О
4 22 30
ж 6 14 22 30
pmol Г1
62 70 78 8.6 pmoll"1
Fig. 2. Percentage frequencies of oxygen, phosphates and various depth levels in Admiralty
(x — mean values)
60
40
20
0, J L 6 14 22 30
nitrates concentrations (%) at Bay
bottom water layers a greater quantity of oxygen than other deeper parts of Admiralty Bay. This is apparent in the two-peak distribution of the frequency of oxygen concentrations. The division of the data into two groups: one regarding the area of Admiralty Bay, another — Ezcurra Inlet (Fig. 2) gives distributions approximating the normal.
5 8 Ryszard Samp
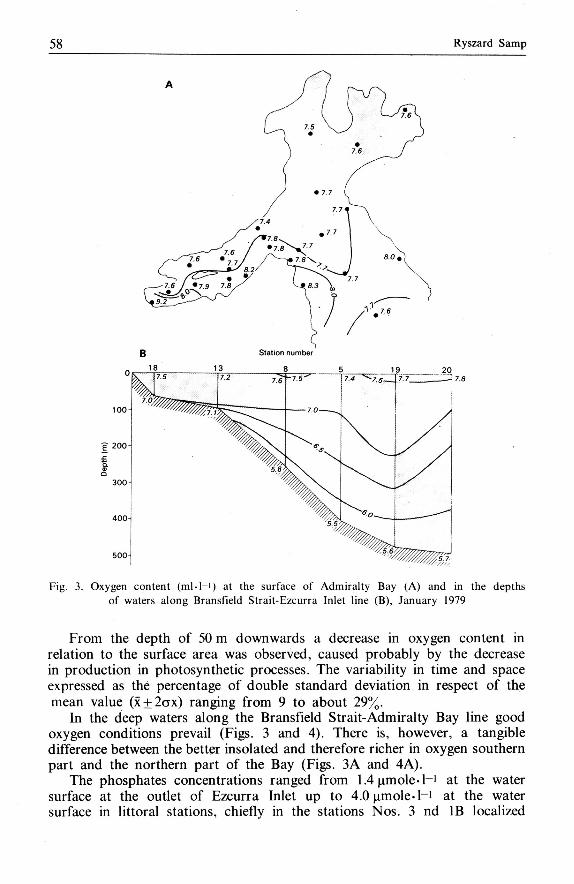
Fig. 3. Oxygen content ( m l - H ) at the surface of Admiralty Bay (A) and in the depths of waters along Bransfield Strait-Ezcurra Inlet line (B), January 1979
From the depth of 50 m downwards a decrease in oxygen content in relation to the surface area was observed, caused probably by the decrease in production in photosynthetic processes. The variability in time and space expressed as the percentage of double standard deviation in respect of the mean value (х±2стх) ranging from 9 to about 29%.
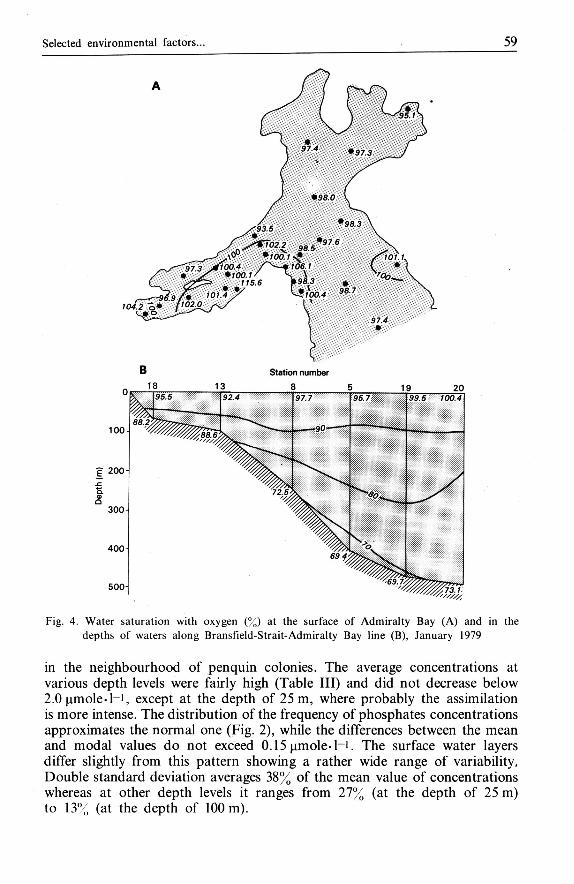
In the deep waters along the Bransfield Strait-Admiralty Bay line good oxygen conditions prevail (Figs. 3 and 4). There is, however, a tangible difference between the better insolated and therefore richer in oxygen southern part and the northern part of the Bay (Figs. ЗА and 4A).
The phosphates concentrations ranged from 1.4 | imole-H at the water surface at the outlet of Ezcurra Inlet up to 4.0 jimole-l-i a t the water surface in littoral stations, chiefly in the stations Nos. 3 nd IB localized
Selected environmental factors... 5 9
Fig. 4. Water saturation with oxygen (%) at the surface of Admiralty Bay (A) and in the depths of waters along Bransfield-Strait-Admiralty Bay line (B), January 1979
in the neighbourhood of penquin colonies. The average concentrations at various depth levels were fairly high (Table III) and did not decrease below 2.0 ( imole-H, except at the depth of 25 m, where probably the assimilation is more intense. The distribution of the frequency of phosphates concentrations approximates the normal one (Fig. 2), while the differences between the mean and modal values do not exceed 0.15 ц т о 1 е - Н . The surface water layers differ slightly from this pattern showing a rather wide range of variability, Double standard deviation averages 38% of the mean value of concentrations whereas at other depth levels it ranges from 27% (at the depth of 25 m) to 13% (at the depth of 100 m).
Ryszard Samp
x> ca
H
я J3
2 СЛ
CL* Z
00
T3 <
3 <T
x Q
x Q
fO't O o.
.o e 3 z
Ł. o D
vi Os v-i m ЧО <N <N <N
ci oo <N f̂ l b̂ vS ЧО —H oo
—-i
ЧО <N (N oo ЧО ЧО 45 К O r̂ o\
r- ЧО Г- O vi oo O О o o
o O о o o o
o m <N —H <N o 1 — 1 1 *
o O о ci o ci
m m <4 (N —H >—i —и o O О o o o
o m m VI <N - ł vS тГ vS vc>
<4 оо v-i vi o< ci rn i—i
(N <N
O (N оо <N _ VI vS ГЛ чо T-H
<N Г4!
Г» г (N (N
o O ci o ci ci
O m ЧО o oo m O CT\ о .—i (N fN <N <Ni <N <N <N
Vi o\ t— VO Tf ™ o\ о o <N (N <N oi oi (N
VI o vi d (N vi t <N <4 Vi
6 С O o O rl V", O o
<N O co
s в
с с
Selected environmental factors... 6 1
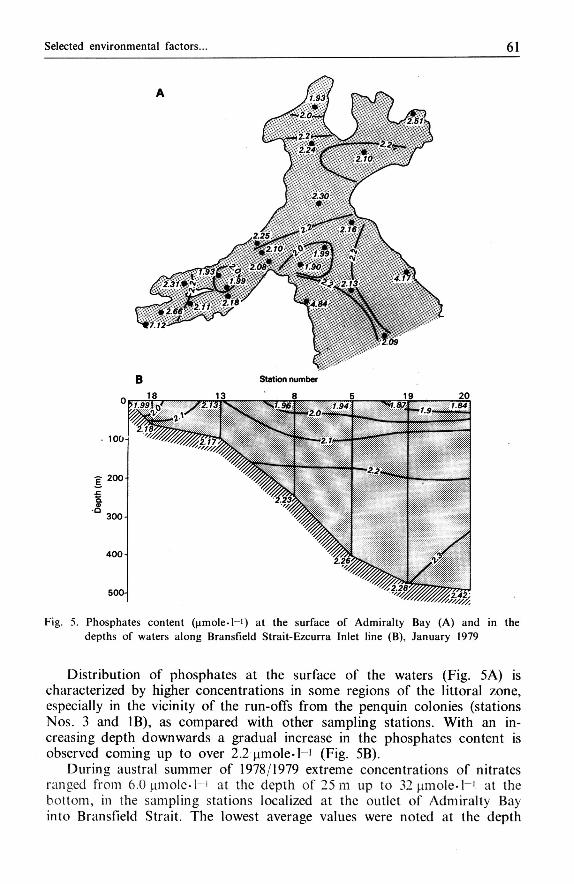
Fig. 5. Phosphates content (^mole- l - 1 ) at the surface of Admiralty Bay (A) and in the depths of waters along Bransfield Strait-Ezcurra Inlet line (B), January 1979
Distribution of phosphates at the surface of the waters (Fig. 5A) is characterized by higher concentrations in some regions of the littoral zone, especially in the vicinity of the run-offs from the penquin colonies (stations Nos. 3 and IB), as compared with other sampling stations. With an in-creasing depth downwards a gradual increase in the phosphates content is observed coming up to over 2.2 |imole- H (Fig. 5B).
During austral summer of 1978/1979 extreme concentrations of nitrates ranged from 6 .0цто1е -Н at the depth of 25 m up to 32 |дто1е-Н at the bottom, in the sampling stations localized at the outlet of Admiralty Bay into Bransfield Strait. The lowest average values were noted at the depth
6 2 Ryszard Samp
of 25 m, slightly higher at the water surface and markedly higher at the bottom (Table III).
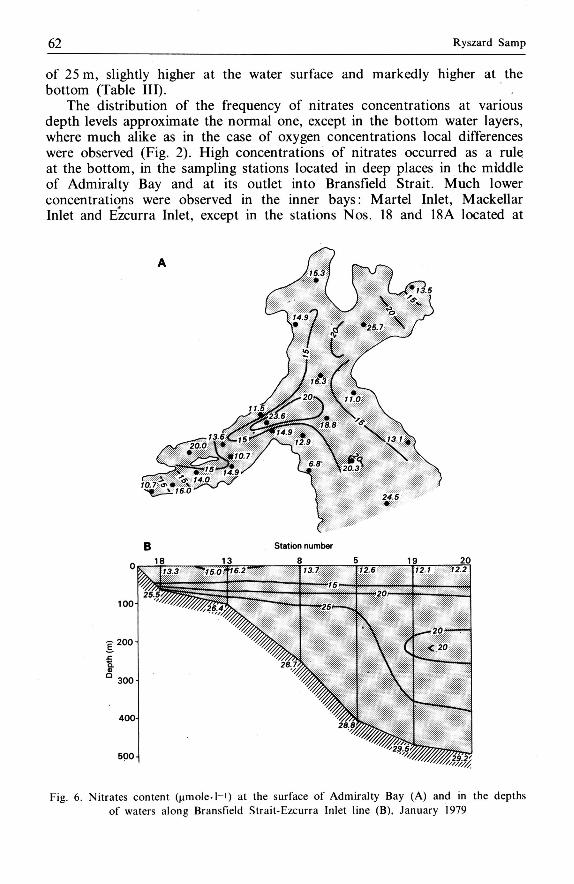
The distribution of the frequency of nitrates concentrations at various depth levels approximate the normal one, except in the bottom water layers, where much alike as in the case of oxygen concentrations local differences were observed (Fig. 2). High concentrations of nitrates occurred as a rule at the bottom, in the sampling stations located in deep places in the middle of Admiralty Bay and at its outlet into Bransfield Strait. Much lower concentrations were observed in the inner bays: Martel Inlet, Mackellar Inlet and Ezcurra Inlet, except in the stations Nos. 18 and 18A located at
Fig. 6. Nitrates content ( ц т о 1 е - Н ) at the surface of Admiralty Bay (A) and in the depths of waters along Bransfield Strait-Ezcurra Inlet line (B), January 1979
Selected environmental factors... 6 3
the end of Ezcurra Inlet. This necessitated dividing the data collected at the bottom into two groups (Fig. 2). The greatest differences between the mean and modal values were noted at the depth of 25 m (4 цто1е -Н) . At this depth the values are very divergent. Double standard deviation averages almost 85% of the mean concentration values. At other depth levels the deviations range from about 30% at the depth of 200 m up to 50—60% in the remaining water layers.
The highest concentrations of nitrates in the surface water layer were noted at the oulet of Ezcurra Inlet. Much alike as in the case of phosphates
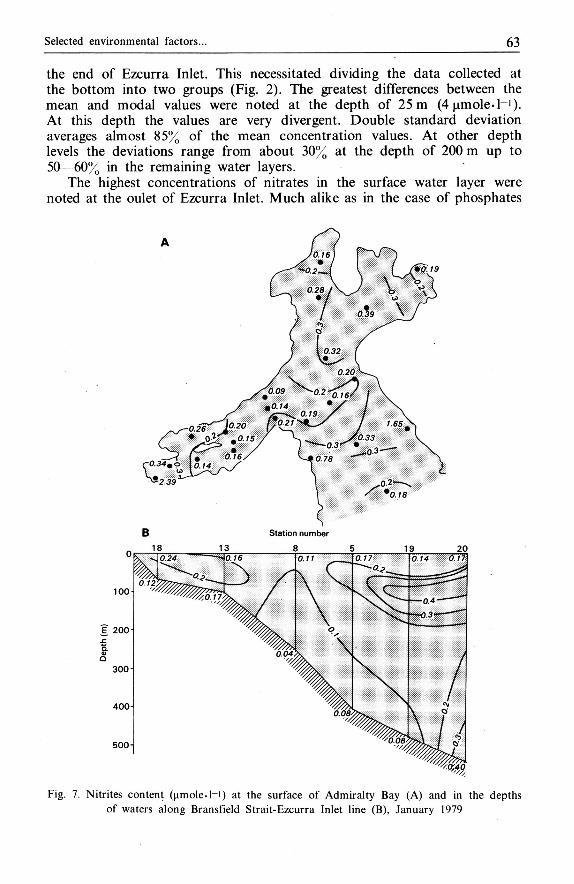
Fig. 7. Nitrites content ( ц т о 1 е - Н ) at the surface of Admiralty Bay (A) and in the depths of waters along Bransfield Strait-Ezcurra Inlet line (B), January 1979

6 4 Ryszard Samp
concentration an increase in nitrates concentration is observed with the in-creasing depth (Fig. 6B), along the Bransfield Strait-Ezcurra Inlet line.
Nitrites concentrations ranged from 0.01 цто1е -Н at the bottom, at the outlet of Bransfield Strait up to 0.90 цто1е -Н in the surface water layers in the littoral sampling stations (chiefly Nos. 3 and IB). The average concentrations at various depth levels ranged from 0.11 |Япо1е-Н at the depth of 200 m up to 0.21 ц т о ! е - Н in the surface water layer (Table III). The greatest differences between the mean and modal values were noted in the surface water layer (0.05 цто1е .Н) - Double standard deviation averages nearly 162% of the mean value. At other depth levels the deviations were within the range of 91—143%.
The highest values of nitrates in the surface water layers are noted in the stations in the vicinity of penguin colonies and at the end of Ezcurra Inlet (Fig. 7A). The maximum content of nitrates (over 0.4 | i inole-H) were noted in the water layer at the depth of 75—125 m at the outlet of Admiralty Bay into Bransfield Strait. The analogous zone in Ezcurra Inlet extends from beneath the water surface to the depth of about 70 m deep (Fig. 7B).
The average molar ratio of the total nitrate and nitrite nitrogen to phosphate phosphorus (Table III) ranged from 5.6 to 7.2 in the euphotic zone. These values are lower than those noted in the regions of South Georgia ( G r e l o w s k i and P a s t u s z a k 1979).
This results from lower values of nitrogen compounds in Admiralty Bay than those in the shelf waters of South Georgia, whereas phosphorus remains at the approximately same level of concentration. The lowest N : P values occur at the depth of 25 m, where the demand for these elements is probably the greatest.
From the depth of 25 m downards the values of the N : P ratio increase and are higher as compared with those values obtained in the shelf area of South Georgia region.
4. Summary
Concentrations of oxygen, phosphates, nitrates, and nitrites were examined in Amdiralty Bay (King George Island, South Shetlands Islands) from December 1978 to February 1979. Water samples for analyses were collected at 24 sampling stations (four of them in the littoral zone) from the water surface to the bottom (Table I).
As results from the analyses the waters of Admiralty Bay are rich in oxygen and phosphorus and nitrogen compounds (Tables II and III). The concentrations of the examined compounds approximate those in the Antarctic open waters.
The frequencies of the concentrations of the analysed compounds are within a relatively narrow range of values (Fig. 2). Higher values of phosphates concentrations were noted in the littoral zone and deeper water layers as compared with those in the surface water layers (Fig. 5). Nitrates concentrations also increase with the increasing depths (Fig. 6, Table III). The highest values of nitrites were noted in the neighbourhood of penguin colonies and at the end of Ezcurra Inlet (Fig. 7).
Selected environmental factors... 6 5
5. Резюме
Исследования концентрации кислорода, фосфатов, нитратов и нитритов в Адмиральты Бей (Кинг Джордж Исланд, Южные Шетланды) проведено в период от декабря 1978 г. до февраля 1979 года. Анализ проведено на 24 станциях (в том на 4 береговых) с поверхности до дна (таблица I).
Из этих исследований вытекает, что воды Адмиральты Бей богаты кислородом, а также фосфорными и азотными солями (таблица II и III). Концентрация исследован-ных элементов среды приблизительно такие же как и концентрация констатированное в открытых антарктических водах.
Посещаемость аущений анализированных элементов, совмещается в относицельно узких пределах (рис. 2). Констатировано повышение величины сгущений фосфатов в прибрежных зонах и в более глубоких слоях в сравнении с поверхностными слоями воды (рис. 5). Также содержание нитратов увеличиваются вместе с ростом глубины (рис. 6. таблица III). Самые большые величины нитратов замечено в близи мест пребывания пингвинов в конце фиорда Эзкурра (рис. 7).
6. Streszczenie
Badania stężenia tlenu, fosforanów, azotanów i azotynów w Zatoce Admiralicji (Wyspa Króla Jerzego, Południowe Szetlandy) prowadzono od grudnia 1978 do lutego 1979 roku. Analizy prowadzono na 24 stanowiskach (w tym 4 brzegowych), od powierzchni do dna (tabela I).
Z przeprowadzonych badań wynika, że wody Zatoki Admiralicji są bogate w tlen oraz sole fosforowe i azotowe (tabela II i III). Stężenia badanych składników środowiskowych są zbliżone do stężeń stwierdzonych w otwartych wodach antarktycznych.
Frekwencja stężeń analizowanych składników mieści się w stosunkowo wąskich granicach (rys. 2). Stwierdzono podwyższone wartości stężeń fosforanów w strefach przybrzeżnych i głęb-szych warstwach wody w porównaniu z warstwami powierzchniowymi (rys. 5). Również stężenia azotanów wzrastają wraz ze wzrostem głębokości (rys. 6, tabela III). Najwyższe wartości azotynów stwierdzono w pobliżu miejsc przebywania pingwinów i w końcu fiordu Ezcurra (rys. 7).
7. References
1. A r s a n o v a N. V. 1974—Raspredelenie mezdugodovye i sezonnyfe izmenenija soderżanija biogennych elementov v More Scotia — Trudy VNIRO, 98: 77—90.
2. D e r a J. 1979 — Oceanographic investigations of the Ezcurra Inlet during the 2nd Antarctic Expedition of the Polish Academy of Sciences — Studia i Mater. Oceanolog. KBM, PAN, 25: 5—38.
3. G r e l o w s k i A., P a s t u s z a k M. 1979 — Preliminary determination of occurrence and mo-vements of water masses in the region of South Georgia Island — ICES, Paper C.M. 1979/C: 12.
4. G r a s s h o f f K. 1976 — Methods of Seawater Analysis—Verlag Chemie, Weinheim, New York, 000 pp.
Paper received 14 January 1980

6 6 Ryszard Samp
AUTHOR'S A D D R E S S :
Dr Ryszard Samp Oddział Morski Instytutu Meteorologii i Gospodarki Wodnej Waszyngtona 42, 81-342 Gdynia, Poland