Embed Size (px)
Citation preview
Page 1 of 32
Polish multinationals go beyond Europe
Report dated June 14, 2012
EMBARGO: The contents of this report must not be quoted or summarized in the print, broadcast
or electronic media before June 14, 2012, 11.00 a.m. Warsaw; 10.00 a.m. GMT; and 5.00 a.m. New
York, United States.
Warsaw and New York, June 14, 2012:
The Institute for Market, Consumption and Business Cycles Research (IBRKK), Poland, and the Vale
Columbia Center on Sustainable International Investment (VCC), a joint center of the Columbia Law
School and the Earth Institute at Columbia University in New York, are releasing the results of a survey
on outward investors today.1 The survey is part of the Emerging Market Global Players (EMGP) Project
focused on the rapid global expansion of multinational enterprises (MNEs) from emerging markets. The
present survey, conducted in 2011, covers the period 2008-2010.
Highlights
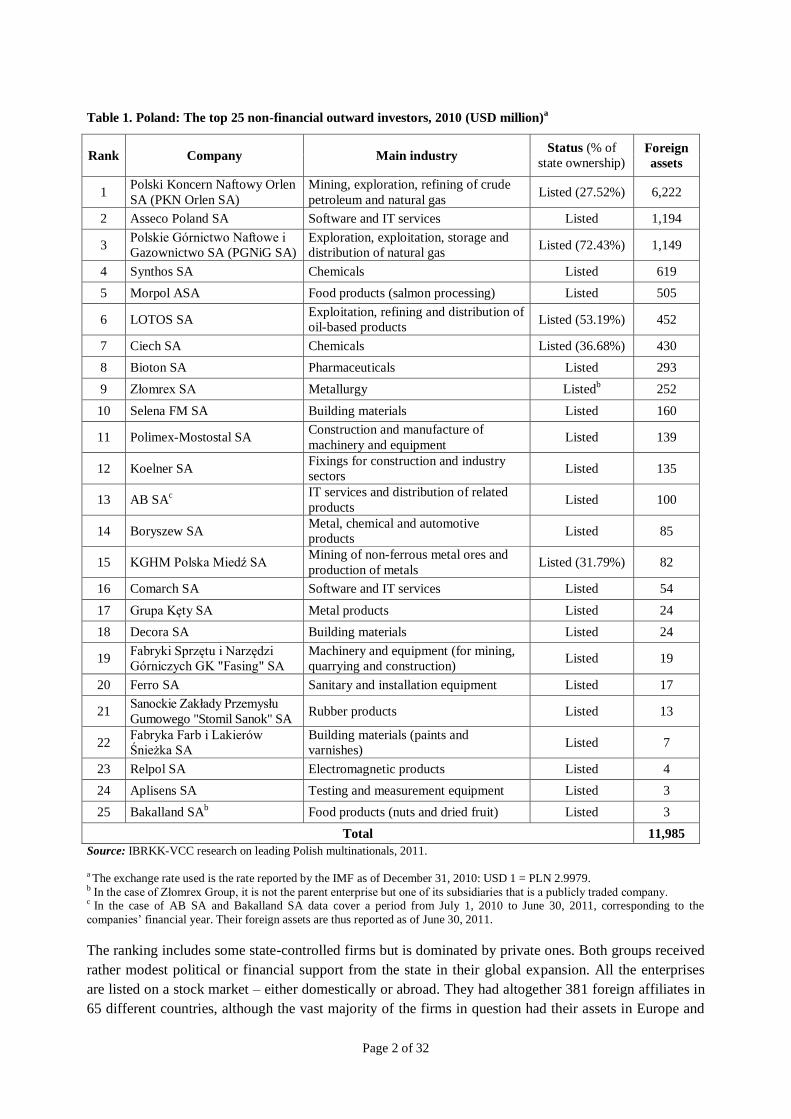
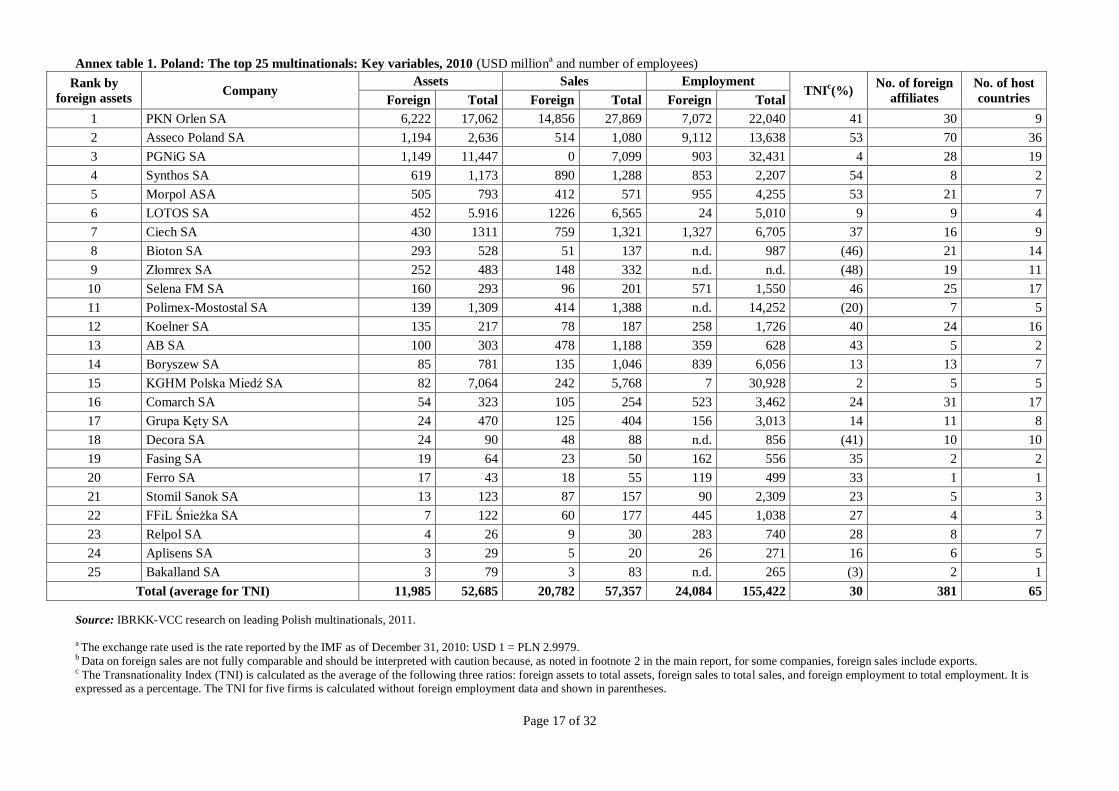
The 25 leading non-financial Polish multinationals ranked by foreign assets (see table 1 below) show
nearly USD 12 billion in foreign assets, USD 21 billion in foreign sales2 and more than 24,000
employees abroad. Slightly over half of foreign assets in table 1 belong to the top-ranked Polish
multinational, PKN Orlen, which is also number one in foreign sales. In terms of foreign employment it
was overtaken by Asseco, which became the runner-up on the list of Polish investors abroad.
The ranking for 2010 shows changes from the 2009 ranking:3 some of the firms improved their
standings, whereas others slipped down. Moreover, seven new Polish multinationals were added to the
list.
The level of internationalization varies among the top 25,4 but the value of the Transnationality Index
(see column headed “TNI” in annex table 1) exceeded 50% only for three of them.
1 The survey was conducted and this report prepared by Ewa Kaliszuk, Head of the European Integration
Department, Marzenna Błaszczuk-Zawiła, Research Fellow, and Agata Wancio, Research Fellow at the Institute for
Market, Consumption and Business Cycles Research. The authors would like to thank Jan Piotrowski and Janusz
Chojna from the IBRKK for their useful comments on the report, and Dariusz Sielski for linguistic proofreading. 2 For several firms, total foreign sales include exports. It has not proved possible to estimate the share of exports in
the total value of the foreign sales of the top 25. 3 The previous survey was carried out in 2010 and covered the period 2007−2009. IBRKK-VCC, “Survey on Polish
multinationals finds geographic concentration and industrial diversity” (March 31, 2011), available at:
http://www.vcc.columbia.edu/files/vale/documents/Poland_3_2011_4.pdf and
http://ibrkk.pl/id/109/Projekt_Emerging_Market_Global_Players (each site last visited June 8, 2012). 4 As not all companies contacted responded to the survey, the 25 multinationals ranked in table 1 below cannot be
said to be the largest Polish multinationals in terms of foreign assets. Nonetheless, they are certainly among the
largest and, as is customary in this project, are referred to in the report as the “top 25.”
INSTITUTE FOR MARKET, CONSUMPTION AND
BUSINESS CYCLES RESEARCH
Page 2 of 32
Table 1. Poland: The top 25 non-financial outward investors, 2010 (USD million)
a
Rank Company Main industry Status (% of
state ownership) Foreign
assets
1 Polski Koncern Naftowy Orlen
SA (PKN Orlen SA)
Mining, exploration, refining of crude
petroleum and natural gas Listed (27.52%) 6,222
2 Asseco Poland SA Software and IT services Listed 1,194
3 Polskie Górnictwo Naftowe i
Gazownictwo SA (PGNiG SA)
Exploration, exploitation, storage and
distribution of natural gas Listed (72.43%) 1,149
4 Synthos SA Chemicals Listed 619
5 Morpol ASA Food products (salmon processing) Listed 505
6 LOTOS SA Exploitation, refining and distribution of
oil-based products Listed (53.19%) 452
7 Ciech SA Chemicals Listed (36.68%) 430
8 Bioton SA Pharmaceuticals Listed 293
9 Złomrex SA Metallurgy Listedb 252
10 Selena FM SA Building materials Listed 160
11 Polimex-Mostostal SA Construction and manufacture of
machinery and equipment Listed 139
12 Koelner SA Fixings for construction and industry
sectors Listed 135
13 AB SAc
IT services and distribution of related
products Listed 100
14 Boryszew SA Metal, chemical and automotive
products Listed 85
15 KGHM Polska Miedź SA Mining of non-ferrous metal ores and
production of metals Listed (31.79%) 82
16 Comarch SA Software and IT services Listed 54
17 Grupa Kęty SA Metal products Listed 24
18 Decora SA Building materials Listed 24
19 Fabryki Sprzętu i Narzędzi
Górniczych GK "Fasing" SA
Machinery and equipment (for mining,
quarrying and construction) Listed 19
20 Ferro SA Sanitary and installation equipment Listed 17
21 Sanockie Zakłady Przemysłu
Gumowego "Stomil Sanok" SA Rubber products Listed 13
22 Fabryka Farb i Lakierów
Śnieżka SA
Building materials (paints and
varnishes) Listed 7
23 Relpol SA Electromagnetic products Listed 4
24 Aplisens SA Testing and measurement equipment Listed 3
25 Bakalland SAb Food products (nuts and dried fruit) Listed 3
Total 11,985
Source: IBRKK-VCC research on leading Polish multinationals, 2011. a The exchange rate used is the rate reported by the IMF as of December 31, 2010: USD 1 = PLN 2.9979. b In the case of Złomrex Group, it is not the parent enterprise but one of its subsidiaries that is a publicly traded company. c In the case of AB SA and Bakalland SA data cover a period from July 1, 2010 to June 30, 2011, corresponding to the
companies’ financial year. Their foreign assets are thus reported as of June 30, 2011.
The ranking includes some state-controlled firms but is dominated by private ones. Both groups received
rather modest political or financial support from the state in their global expansion. All the enterprises
are listed on a stock market – either domestically or abroad. They had altogether 381 foreign affiliates in
65 different countries, although the vast majority of the firms in question had their assets in Europe and
Page 3 of 32
few could be called global rather than regional players. The most preferred locations were the EU
member states, mainly Germany, the Czech Republic, Slovakia, Austria, Lithuania, the United Kingdom
and France as well as some countries from the Commonwealth of Independent States (CIS) (especially
Ukraine and Russia). However, there was also a perceptible tendency to locate foreign direct investment
(FDI) in more distant regions such as the Middle East, South and East Asia.
In terms of value of assets held abroad, their overseas investments primarily went into the mining,
exploration and refining industry, then into chemicals and pharmaceuticals, software and information
technology (IT) services, and food and beverages. Other industries strongly represented in the ranking
include metals and metal products as well as building materials.
Profile of the top 25
Major drivers. The motives of Polish FDI abroad are rather classic, predominantly market and
resource seeking or a mixture of them (Morpol). The investment of PKN Orlen in refineries and
gas stations in Lithuania, the Czech Republic and Germany is an example of a pure market
motive. Access to natural resources continued to be a key strategic driving force for investment
in mining and exploration industries and played a crucial role in the expansion of PGNiG
(natural gas), LOTOS (crude oil) and KGHM (copper and silver). Proximity to clients is a very
significant pull factor, not only for firms manufacturing high-volume goods (Decora – launching
of a production plant in Belarus for the Russian and Ukrainian market) with high transport costs,
but also for service providers such as IT companies (Comarch).
Another important driver for foreign expansion indicated by the surveyed companies was the
need for improving their cost competitiveness (efficiency seeking). Reducing production costs
was an important factor in the case of investment in CIS countries (Śnieżka), with lower energy
and material prices, as well as in emerging Asian countries (Ferro), with lower labor costs.
Investment in the EU countries, except for Romania, was rarely driven by the labor cost factor as
in most EU member states salaries and wages were comparable to or higher than those in Poland.
Other motivations include access to advanced technology (purchase of the Italian pharmaceutical
company Fisiopharma S.r.l. by Bioton), the acquisition of internationally or domestically
established brands (Selena’s investment in Latin America and Italy), and the purchase of
intangible assets (purchase of Maflow’s research and development (R&D) entities in Italy by
Boryszew).
High concentration As shown in table 1 above, there is a considerable concentration of foreign
assets at the top of the list, which is also typical of other emerging markets monitored in the
EMGP Project.5 The foreign assets of PKN Orlen, Poland’s largest MNE, accounted for over
half of the total foreign assets held by the 25 companies ranked in table 1. The assets of the
second- and third-ranking MNEs represented a further 20% (approximately 10% each), which
means that slightly above 70% of foreign assets were controlled by the top three Polish MNEs.
5 See, for instance, Beatriz Nofal and VCC, “Argentine multinationals remain industrially diversified and
regionally focused,” Buenos Aires and New York (November 30, 2011), available at:
http://www.vcc.columbia.edu/files/vale/documents/EMGP-Argentina-Report-2011-Final-30_Nov_11.pdf (last
visited June 8, 2012); Institute for Economic Research (IIEc) and VCC, “Striving to overcome the economic crisis:
progress and diversification of Mexican multinationals’ export of capital,” Mexico City and New York (December
28, 2011), available at: http://www.vcc.columbia.edu/files/vale/documents/EMGP-Mexico-Report-2011-Final.pdf
(last visited June 8, 2012); ICEG European Center and VCC, “MOL Group, the petrol company, continues to lead
the ranking of Hungarian multinationals,” Budapest and New York (April 16, 2012), available at:
http://www.vcc.columbia.edu/files/vale/documents/EMGP_Hungary_Report_2011.pdf (last visited June 8, 2012).
Page 4 of 32
Two of the top three are regional leaders in the oil and gas industry, which additionally
contributed to a high concentration of assets in terms of industry distribution. The other operates
in a very different and more sophisticated sector, i.e., software and IT services.
Transnationality Index (TNI) The average TNI of the 25 companies in the list was 30%, which
means that less than a third of their activities were carried out abroad. However, as data on
foreign employment were unavailable for five multinationals, the TNI could be properly
calculated only for 20 of the top 25. Three companies (Asseco, Morpol, Synthos) stood out for
being slightly more active abroad than in Poland. The value of their TNIs slightly surpassed
50%. For the rest of the companies the TNI levels were lower than 50% and varied widely across
the group. The TNIs for such firms as PKN Orlen and Selena exceeded 40%, whereas for a few
others the TNIs took on extremely low values, not even reaching 10%. In the surveyed group we
did not observe any relationship between the degree of internationalization and the specific
industries in which Polish companies operate.
Location of head offices The headquarters of all the companies except one (Morpol) are located
in Poland. In geographical terms, they are not as concentrated as in many other emerging
markets (e.g. Brazil,6 Chile,
7 and Turkey
8). Admittedly, the most common single location for
establishing headquarters is the Masovian Voivodship9 (eight), specifically Warsaw, but head
offices of the remaining 17 companies are located in other regions, especially in south and west
voivodships. Although Morpol’s head office was established in Oslo, strategic decisions10
are
made in Ustka (Poland, the Baltic Sea coast), where the main processing and packaging plant is
located.
Ownership and status Two (PGNiG, LOTOS) of the top 25 Polish MNEs are majority-owned
by the state; and in three other firms the state has minority but controlling stakes. The
privatization of one of them (LOTOS), launched in 2011, ended in failure, probably due to its
high level of debt. After the unsuccessful attempted sale to a foreign strategic investor, the state
has considered a potential merger of LOTOS with another state-owned company – either with
PKN Orlen or with PGNiG – in order to establish a strong regional player in the fuel market.
6 See, Sociedade Brasileira de Estudos e Empresas Transnacionais e da Globalização Econômica (SOBEET) and
VCC, “Brazilian multinationals positive after the global crisis,” São Paulo and New York (December 7, 2010),
available at: http://www.vcc.columbia.edu/files/vale/documents/EMGP-Brazil-Report-2010-Final.pdf (last visited
June 8, 2012). 7 See, United Nations Economic Commission for Latin America and the Caribbean (ECLAC) and VCC, “The top
20 multinationals from Chile in 2010: Retail, forestry and transport lead international expansion,” Santiago and
New York (October 6, 2011), available at: http://www.vcc.columbia.edu/files/vale/documents/EMGP-Chile-
Report-2011-Final_2.pdf (last visited June 8, 2012). 8 See, Kadir Has University (KHU), KPMG-Turkey (KPMG-T), Foreign Economic Relations Board (DEIK), and
VCC, “Turkish MNEs steady on their course despite crisis, survey finds,” Istanbul and New York (January 31,
2011), available at: http://www.vcc.columbia.edu/files/vale/documents/EMGP-Turkey-Report-2011.pdf (last visited
June 8, 2012). 9 The voivodship is the largest unit of territorial division in Poland having a legal status on the basis of the Act of
July 24, 1998 on Implementing of a New Fundamental Three-tier Territorial Division of the Country (Polish
Journal of Laws No. 96, item 603). 10
The Rules of Procedure for the Board of Directors of Morpol state: “Matters that are of an unusual nature or of
major importance relative to the Company’s situation may only be decided by the Chief Executive Officer pursuant
to authorization by the Board on an ad hoc basis, or when the Board’s decision cannot be awaited without material
inconvenience to the Company. The Board shall be informed of the decision as soon as possible.” Available at:
http://morpol.com/_files/_public/corporate_governance/rules_of_procedure_for_the_board.pdf (last visited April
30, 2012).
Page 5 of 32
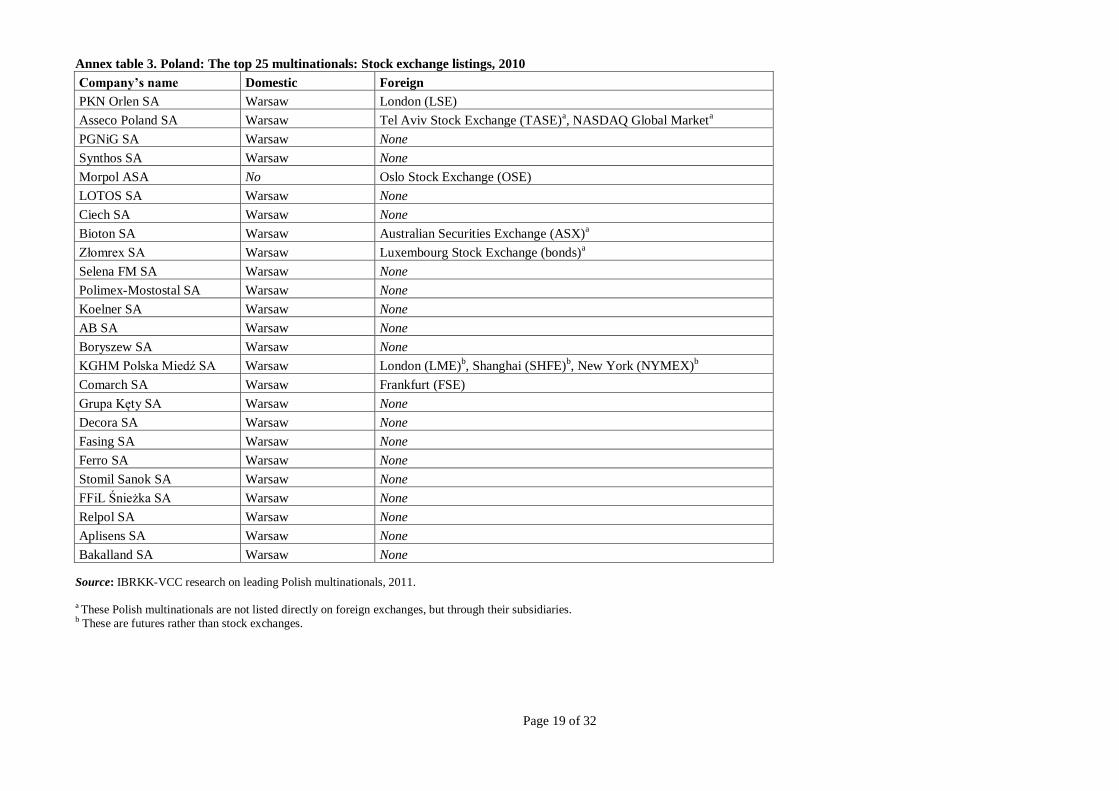
All of the top 25, except Morpol, are listed on the Warsaw Stock Exchange (WSE).11
Seven
companies12
from the ranking are included in the WIG20 Index, which consists of the 20 largest
and most liquid companies on the WSE Main List. Some of the surveyed Polish multinationals
are also listed on foreign stock exchanges (annex table 3).
Official language and the nationality of management In all of the 25 companies except for
one, the official language is Polish. The exception is Morpol, where English is the official
language, whereas Polish and Norwegian are used as auxiliary languages. Morpol is the firm
with the highest share of foreigners in the Board of Directors (four out of seven members) and
among the executive managers. However, the Chief Executive Officer (concurrently the founder
and owner of the company) is Polish. Furthermore, as Morpol is listed on the Oslo Stock
Exchange, the system of management differs from the continental model that is binding for other
companies in the ranking. The latter, under Polish law, are required to have two separate bodies
for management and control – that is an Executive or Management Board and a Supervisory
Council/Board. All of them are led by Polish CEOs and rarely employ foreigners as members of
the boards (3 out of the 24 firms). Although Polish is their official language, most CEOs also
prepare their financial reports, presentations and other materials in English, to a large extent as a
result of adjustments to the rules contained in the Best Practices of WSE Listed Companies.13
Gender equality in the board The Executive Boards of the companies in our ranking are
strongly dominated by men. There are 11 women sitting on the executive boards in seven out of
the 25 Polish multinationals, accounting for 11% of all the board members. In three companies
(including one from the top of the list) women hold the post of chief executive officer. In the
Supervisory Boards of the 25 Polish multinationals, 21 out of the 142 members (15%) are
women.
The data received in the survey and other available sources (companies’ annual reports, their
websites and the Polish press) do not indicate that any enterprises in the top 25 had implemented
any policies on promoting women executives or increasing the number of female board members
until recent years. Some of those recent efforts to promote gender equality include the
commitments made by three Polish multinationals (PGNiG, LOTOS and ORLEN) representing
the energy sector to take initiatives aimed at giving men and women equal career opportunities.14
Corporate social responsibility (CSR) In Poland, CSR considerations seem to be
predominantly implemented by foreign-owned enterprises, whereas very few Polish firms have
incorporated CSR objectives into their business strategies and put them into practice in everyday
business activities. Since 2009, Polish CSR leaders listed on the WSE have been covered by an
index of responsible companies (the Warsaw Responsible Companies Index RESPECT),15
the
first CSR index in Central and Eastern Europe.
11
See, footnote b on Złomrex, under table 1, page 2 of this report. 12
KGHM, PKN Orlen, PGNiG, Asseco, Synthos, Lotos and Boryszew. 13
Code of Best Practice for WSE Listed Companies (effective from 1.01.2012), Appendix to Resolution No.
20/1287/2011 of the [Warsaw Stock] Exchange Supervisory Board dated October 19, 2011, available at:
http://www.corp-gov.gpw.pl/assets/library/english/regulacje/bestpractices%2019_10_2011_en.pdf (last visited June
8, 2012). 14
See, Declaration on Sustainable Development in the Energy Sector in Poland, available at:
http://odpowiedzialna-energia.pl/oenergia/36047/36412/?s,main,language=EN (last visited June 8, 2012). 15
The RESPECT Index comprises listed companies operating in compliance with best corporate governance,
information governance and investor relations standards and also in adherence to certain environmental, social and
Page 6 of 32
The analyzed Polish multinationals vary greatly in their approach to CSR. Three groups can be
identified. The first one comprises five companies from the RESPECT Index: Ciech, KGHM
Polska Miedź, LOTOS, PGNiG and PKN Orlen. Three of them, representing the energy sector,
stand out as businesses participating in the United Nations Global Compact program and a
sectoral initiative on sustainable development,16
and communicating their CSR activities through
various information channels (including regular reports on progress in fulfilling CSR
requirements17
and participation in national CSR contests18
). The second group consists of
companies engaged in selected aspects of CSR. Only some of them have incorporated CSR
issues into their codes of ethics (Polimex-Mostostal SA, Comarch SA). The third and largest
group includes multinationals that seem to have implemented CSR standards in only a very
narrow scope. They have largely associated CSR with ad hoc or repeated public relations actions
(sponsoring social events, charity, human resources development or environmental investment).
However, in the coming years multinationals’ approach to CSR may change. In its newest
Communication on EU strategy for CSR in 2011-1419
the European Commission invites all large
European enterprises20
to make a commitment by 2014 to take account of at least one of the
following sets of principles and guidelines when developing their approach to CSR: the UN
Global Compact, the OECD Guidelines for Multinational Enterprises, or the ISO 26000
Guidance Standard on Social Responsibility. The EU Communication also asks all European-
based MNEs (irrespective of their size) to make a commitment by 2014 to respect the
International Labor Organization Tri-partite Declaration of Principles Concerning Multinational
Enterprises and Social Policy.
Poland, as an OECD Member, is committed to promote the OECD Guidelines for Multinational
Enterprises. Poland’s National Contact Point is located in the Polish Information and Foreign
Investment Agency (Polska Agencja Informacji i Inwestycji Zagranicznych, PAIiIZ).21
Recently,
it has been engaged in a promotional campaign titled “I implement OECD Guidelines –
personnel criteria. For the company evaluation criteria see: Warsaw Stock Exchange, About RESPECT Index –
Company Evaluation Criteria, available at http://odpowiedzialni.gpw.pl/company_evaluation_criteria (last visited
April 30, 2012). 16
UN Global Compact, Participants & Stakeholders, available at:
http://www.unglobalcompact.org/ParticipantsAndStakeholders/index.html (last visited April 30, 2012) and
Declaration on Sustainable Development in the Energy Sector in Poland, op. cit. 17
In their annual reports, companies stated that the reports were prepared in accordance with international
standards, mainly the third generation of the Global Reporting Initiative’s (GRI) Sustainability Reporting
Guidelines (GRI G3). PKN Orlen declared B-level GRI G3.1 guidelines (expanded guidance for reporting on
human rights, local community impacts and gender) (see, PKN Orlen, “Responsible Development. Corporate
Responsibility Report” (2010), available at:
http://www.orlen.pl/EN/CSR/Reports/Documents/ORLEN_CSR_Eng_2011.pdf (last visited June 3, 2012) ); Lotos
– A-level GRI G3 (see, “LOTOS Integrated Annual Report 2011”, available at:
http://raportroczny.lotos.pl/assets/pdf/the-organization-and-the-report_integrated-reporting.pdf (last visited June 3,
2012) ), PGNiG – B-level GRI G3. Starting from 2009, reports by LOTOS include both financial and non-financial
statements in one Annual Report, LOTOS thus being the first Polish company ever to release an integrated report. 18
In Poland, contests on CSR issues have generally attracted CSR leaders. 19
European Commission, A renewed EU strategy 2011-14 for Corporate Social Responsibility, Brussels,
COM(2011) 681 final (October 25, 2011). 20
The European Commission has not defined the phrase “large European enterprises” in the Communication A
renewed EU strategy 2011-14 for Corporate Social Responsibility, op.cit. However, according to the European
Commission, the category of large enterprises is made up of enterprises which employ more than 250 persons and
which have an annual turnover exceeding 50 million euro, and/or an annual balance sheet total not exceeding 43
million euro. See Commission Recommendation 2003/361/EC, the Official Journal of the EU, L 124 of 20.3.2003,
p. 36. 21
See, http://www.paiz.gov.pl/en.
Page 7 of 32
Responsible Business.”22
Poland’s Ministry of Economy has been also increasingly involved in
promoting CSR (e.g., organizing a special task team and conferences, and producing two
manuals on sustainable development based on the ISO 26000 Standard23
).
It is worth noting that in the report “The analysis of institutional models of CSR promotion in
selected countries,” prepared in 2010 by the Polish consulting firm CSRInfo for the Polish
Ministry of Economy, four institutional CSR promotion models were identified: the observer, the
patron, the promoter and the partner.24
The report produced by CSRInfo identified Poland as a
patron country,25
which is defined as a country “in which government units involved in CSR
activity can be identified . . .[, but] there is no one supervisory body that would coordinate
activities.”26
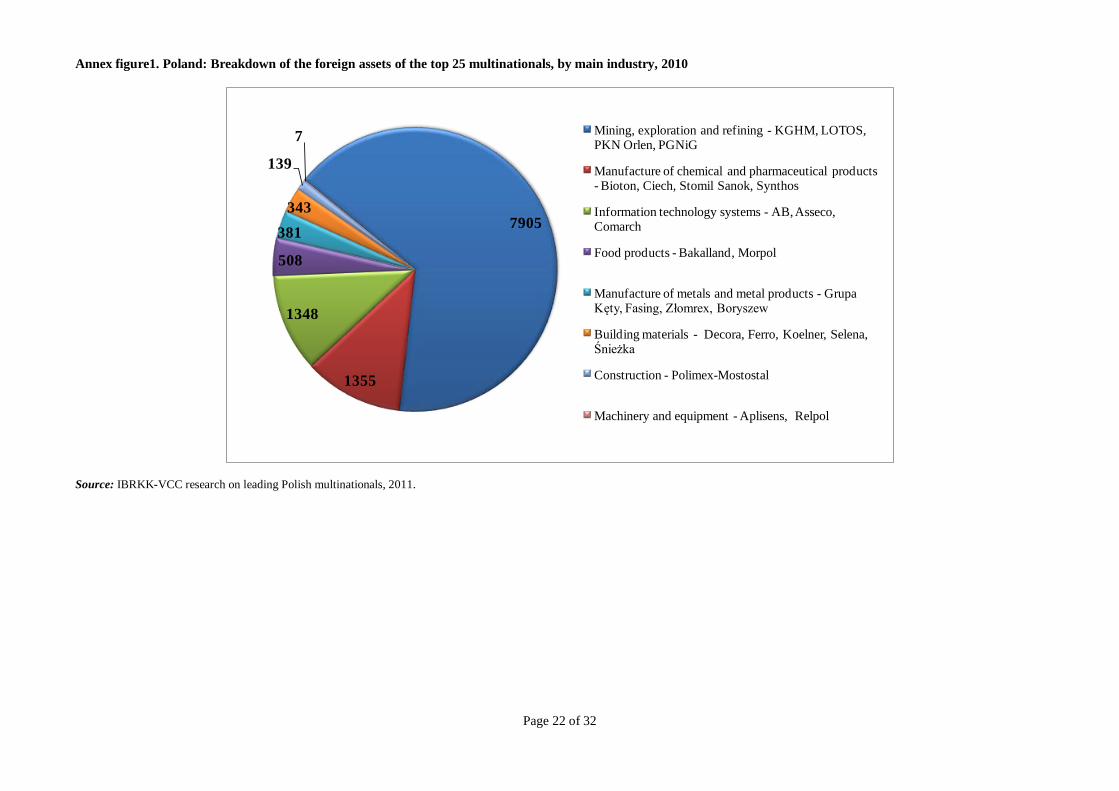
Principal industries The mining, exploration and refining industries clearly dominated in terms
of value of foreign assets (66%); however, there was considerable industrial diversity among the
ranked companies. Two other industries, especially, accounted for significant shares in foreign
assets: IT as well as chemicals and pharmaceuticals put together (11% each) – see annex figure
1. Although the ranking includes only two companies from the food and beverages industry,
representing over 4% of foreign assets, more large Polish multinationals from this industry have
invested abroad recently (e.g. Maspex Wadowice, Mokate, Mispol).27
However, they could not
be ranked in the list as data on their foreign assets were not available. In terms of number of
firms, the building materials industry had the strongest representation (five), with investment in
different segments – paints and varnishes, finishing materials and interior decorations,
construction chemicals, fixings for construction, and sanitary and installation equipment. The
manufacture of metal products was represented by three companies, followed by machinery and
equipment (specifically, electromagnetic, testing and measurement equipment) and construction.
With respect to the level of technology, the majority of surveyed companies from the
manufacturing sector (excluding conglomerates such as Orlen, PGNiG and KGHM) represented
medium-low or medium-high technology industries (in 2010, respectively 58.5% and 28.2% of
the value of total sales, while high and low technology industries accounted for 2.0% and 3.4%
respectively). Comparatively the composition of sold production of industrial products in
manufacturing industries in Poland was as follows: high technology – 6.8%; medium-high
technology – 26.7%; medium-low – 33.0%; and low technology – 33.5%.28
22
OECD, “Annual report on the OECD guidelines for multinational enterprises 2011: a new agenda for the future,”
OECD Publishing (2011), p. 29, available at: http://www.keepeek.com/Digital-Asset-
Management/oecd/governance/annual-report-on-the-oecd-guidelines-for-multinational-enterprises-2011_mne-
2011-en (last visited June 8, 2012). 23
Poland’s Ministry of Economy, Sustainable Business – a Manual for Small and Medium Enterprises (2009);
Poland’s Ministry of Economy, Risk Management for Sustainable Business (2009). 24
CSRInfo, “The analysis of institutional models of CSR promotion in selected countries,” cited in: The Group for
Corporate Social Responsibility Issues, “Recommendations on the implementation of Corporate Social
Responsibility concept in Poland” (2011), p. 5, available at:
http://www.mg.gov.pl/files/upload/13678/CSR_ang_podwojne.pdf. 25
CSRInfo, op.cit., in The Group for Corporate Social Responsibility Issues , op. cit., p. 5. 26 CSRInfo, op.cit., in The Group for Corporate Social Responsibility Issues , op. cit., p. 5. 27
For more information on the important role of food & beverages industry in the expansion of Polish MNEs see
the previous Polish report: IBRKK-VCC, op.cit., p. 7. 28
The Central Statistical Office, Statistical Yearbook of Industry (2011), Table 13 “Structure of sold production of
industrial products in ‘Manufacturing’ section by levels of technology,” p 158. Sector definitions based on the
Statistical Classification of Economic Activities in the European Community – NACE Rev.2.
Page 8 of 32
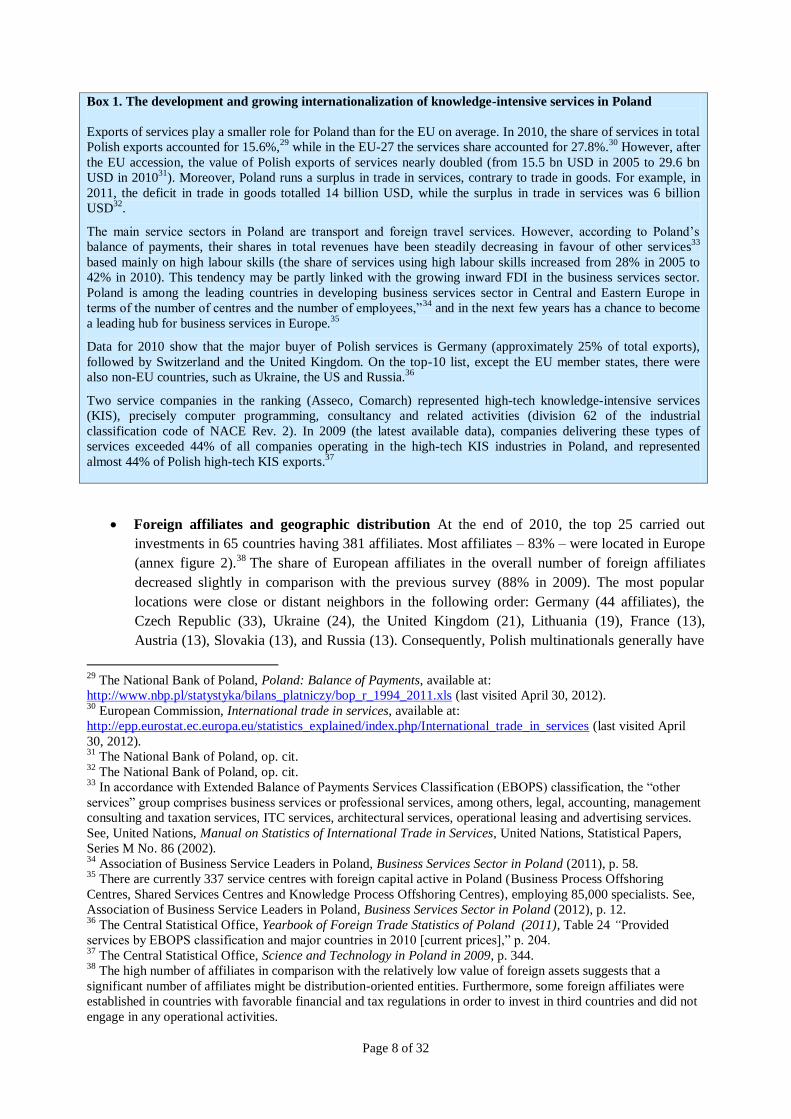
Box 1. The development and growing internationalization of knowledge-intensive services in Poland
Exports of services play a smaller role for Poland than for the EU on average. In 2010, the share of services in total
Polish exports accounted for 15.6%,29
while in the EU-27 the services share accounted for 27.8%.30
However, after
the EU accession, the value of Polish exports of services nearly doubled (from 15.5 bn USD in 2005 to 29.6 bn
USD in 201031
). Moreover, Poland runs a surplus in trade in services, contrary to trade in goods. For example, in
2011, the deficit in trade in goods totalled 14 billion USD, while the surplus in trade in services was 6 billion
USD32
.
The main service sectors in Poland are transport and foreign travel services. However, according to Poland’s
balance of payments, their shares in total revenues have been steadily decreasing in favour of other services33
based mainly on high labour skills (the share of services using high labour skills increased from 28% in 2005 to
42% in 2010). This tendency may be partly linked with the growing inward FDI in the business services sector.
Poland is among the leading countries in developing business services sector in Central and Eastern Europe in
terms of the number of centres and the number of employees,”34
and in the next few years has a chance to become
a leading hub for business services in Europe.35
Data for 2010 show that the major buyer of Polish services is Germany (approximately 25% of total exports),
followed by Switzerland and the United Kingdom. On the top-10 list, except the EU member states, there were
also non-EU countries, such as Ukraine, the US and Russia.36
Two service companies in the ranking (Asseco, Comarch) represented high-tech knowledge-intensive services
(KIS), precisely computer programming, consultancy and related activities (division 62 of the industrial
classification code of NACE Rev. 2). In 2009 (the latest available data), companies delivering these types of
services exceeded 44% of all companies operating in the high-tech KIS industries in Poland, and represented
almost 44% of Polish high-tech KIS exports.37
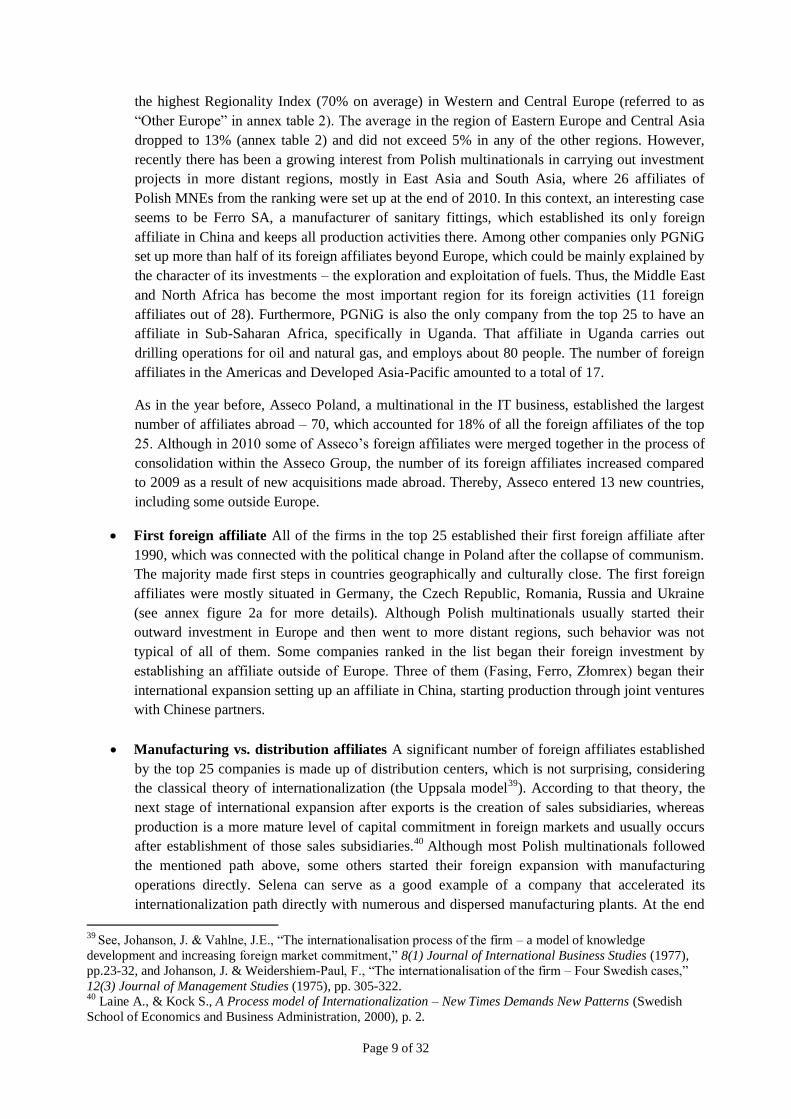
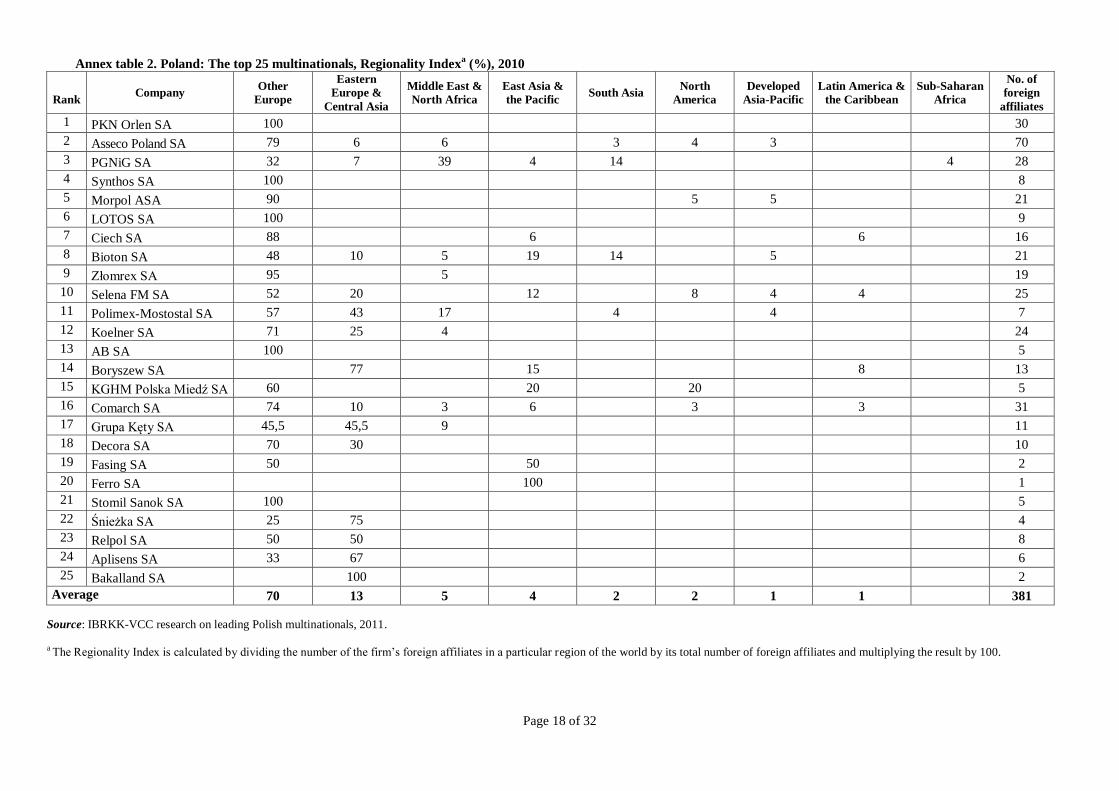
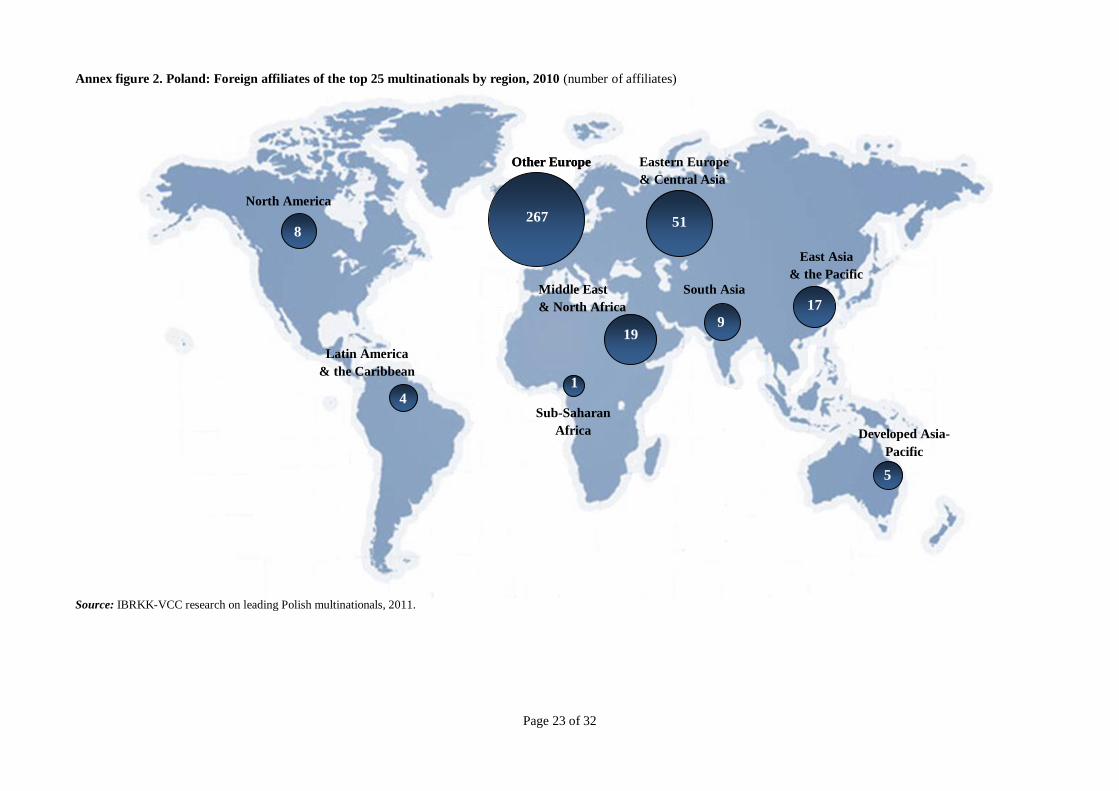
Foreign affiliates and geographic distribution At the end of 2010, the top 25 carried out
investments in 65 countries having 381 affiliates. Most affiliates – 83% – were located in Europe
(annex figure 2).38
The share of European affiliates in the overall number of foreign affiliates
decreased slightly in comparison with the previous survey (88% in 2009). The most popular
locations were close or distant neighbors in the following order: Germany (44 affiliates), the
Czech Republic (33), Ukraine (24), the United Kingdom (21), Lithuania (19), France (13),
Austria (13), Slovakia (13), and Russia (13). Consequently, Polish multinationals generally have
29
The National Bank of Poland, Poland: Balance of Payments, available at:
http://www.nbp.pl/statystyka/bilans_platniczy/bop_r_1994_2011.xls (last visited April 30, 2012). 30
European Commission, International trade in services, available at:
http://epp.eurostat.ec.europa.eu/statistics_explained/index.php/International_trade_in_services (last visited April
30, 2012). 31
The National Bank of Poland, op. cit. 32
The National Bank of Poland, op. cit. 33
In accordance with Extended Balance of Payments Services Classification (EBOPS) classification, the “other
services” group comprises business services or professional services, among others, legal, accounting, management
consulting and taxation services, ITC services, architectural services, operational leasing and advertising services.
See, United Nations, Manual on Statistics of International Trade in Services, United Nations, Statistical Papers,
Series M No. 86 (2002). 34
Association of Business Service Leaders in Poland, Business Services Sector in Poland (2011), p. 58. 35
There are currently 337 service centres with foreign capital active in Poland (Business Process Offshoring
Centres, Shared Services Centres and Knowledge Process Offshoring Centres), employing 85,000 specialists. See,
Association of Business Service Leaders in Poland, Business Services Sector in Poland (2012), p. 12. 36
The Central Statistical Office, Yearbook of Foreign Trade Statistics of Poland (2011), Table 24 “Provided
services by EBOPS classification and major countries in 2010 [current prices],” p. 204. 37
The Central Statistical Office, Science and Technology in Poland in 2009, p. 344. 38
The high number of affiliates in comparison with the relatively low value of foreign assets suggests that a
significant number of affiliates might be distribution-oriented entities. Furthermore, some foreign affiliates were
established in countries with favorable financial and tax regulations in order to invest in third countries and did not
engage in any operational activities.
Page 9 of 32
the highest Regionality Index (70% on average) in Western and Central Europe (referred to as
“Other Europe” in annex table 2). The average in the region of Eastern Europe and Central Asia
dropped to 13% (annex table 2) and did not exceed 5% in any of the other regions. However,
recently there has been a growing interest from Polish multinationals in carrying out investment
projects in more distant regions, mostly in East Asia and South Asia, where 26 affiliates of
Polish MNEs from the ranking were set up at the end of 2010. In this context, an interesting case
seems to be Ferro SA, a manufacturer of sanitary fittings, which established its only foreign
affiliate in China and keeps all production activities there. Among other companies only PGNiG
set up more than half of its foreign affiliates beyond Europe, which could be mainly explained by
the character of its investments – the exploration and exploitation of fuels. Thus, the Middle East
and North Africa has become the most important region for its foreign activities (11 foreign
affiliates out of 28). Furthermore, PGNiG is also the only company from the top 25 to have an
affiliate in Sub-Saharan Africa, specifically in Uganda. That affiliate in Uganda carries out
drilling operations for oil and natural gas, and employs about 80 people. The number of foreign
affiliates in the Americas and Developed Asia-Pacific amounted to a total of 17.
As in the year before, Asseco Poland, a multinational in the IT business, established the largest
number of affiliates abroad – 70, which accounted for 18% of all the foreign affiliates of the top
25. Although in 2010 some of Asseco’s foreign affiliates were merged together in the process of
consolidation within the Asseco Group, the number of its foreign affiliates increased compared
to 2009 as a result of new acquisitions made abroad. Thereby, Asseco entered 13 new countries,
including some outside Europe.
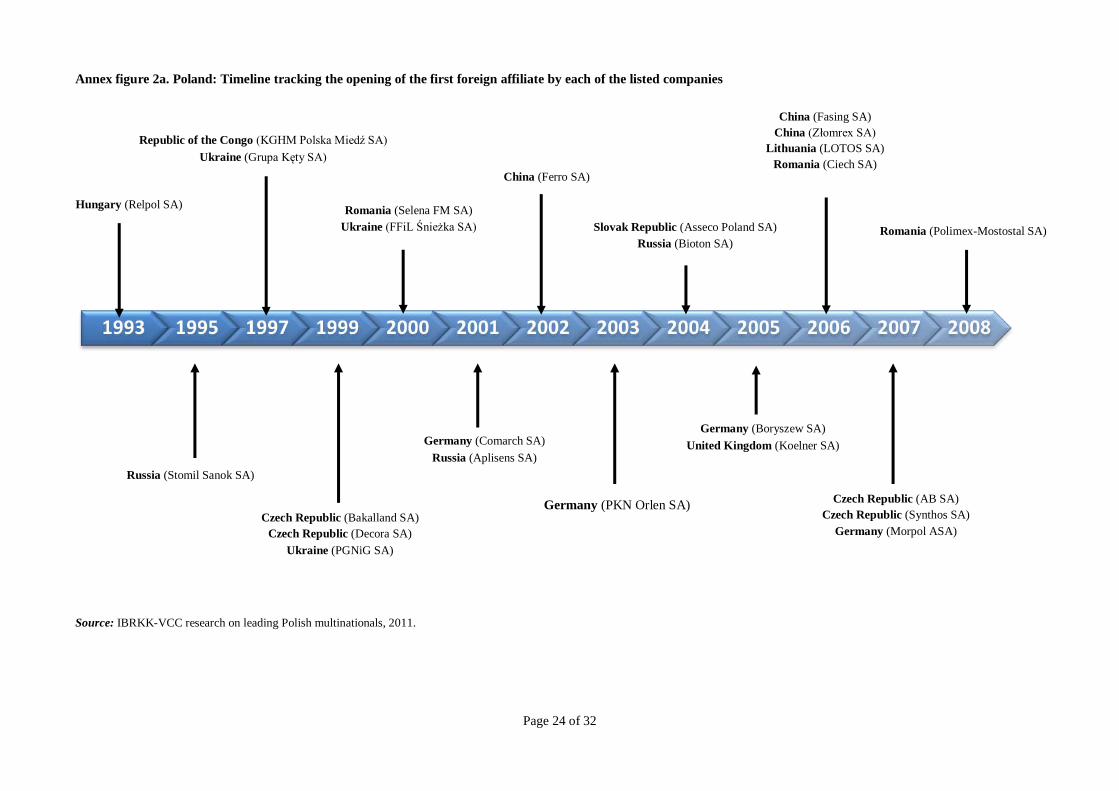
First foreign affiliate All of the firms in the top 25 established their first foreign affiliate after
1990, which was connected with the political change in Poland after the collapse of communism.
The majority made first steps in countries geographically and culturally close. The first foreign
affiliates were mostly situated in Germany, the Czech Republic, Romania, Russia and Ukraine
(see annex figure 2a for more details). Although Polish multinationals usually started their
outward investment in Europe and then went to more distant regions, such behavior was not
typical of all of them. Some companies ranked in the list began their foreign investment by
establishing an affiliate outside of Europe. Three of them (Fasing, Ferro, Złomrex) began their
international expansion setting up an affiliate in China, starting production through joint ventures
with Chinese partners.
Manufacturing vs. distribution affiliates A significant number of foreign affiliates established
by the top 25 companies is made up of distribution centers, which is not surprising, considering
the classical theory of internationalization (the Uppsala model39
). According to that theory, the
next stage of international expansion after exports is the creation of sales subsidiaries, whereas
production is a more mature level of capital commitment in foreign markets and usually occurs
after establishment of those sales subsidiaries.40
Although most Polish multinationals followed
the mentioned path above, some others started their foreign expansion with manufacturing
operations directly. Selena can serve as a good example of a company that accelerated its
internationalization path directly with numerous and dispersed manufacturing plants. At the end
39
See, Johanson, J. & Vahlne, J.E., “The internationalisation process of the firm – a model of knowledge
development and increasing foreign market commitment,” 8(1) Journal of International Business Studies (1977),
pp.23-32, and Johanson, J. & Weidershiem-Paul, F., “The internationalisation of the firm – Four Swedish cases,”
12(3) Journal of Management Studies (1975), pp. 305-322. 40
Laine A., & Kock S., A Process model of Internationalization – New Times Demands New Patterns (Swedish
School of Economics and Business Administration, 2000), p. 2.
Page 10 of 32
of 2010 the company was running factories in Spain, Brazil, the US, China, Turkey, and South
Korea. All in all, production or mining foreign affiliates of Polish multinationals accounted for
less than half of all the affiliates located abroad.
Box 2. Polish financial multinationals
In accordance with the project methodology, the report does not cover financial multinationals. However, there are
few banks and other financial organizations controlled by Polish capital and only some of them invest abroad. The
largest include: Powszechna Kasa Oszczędności Bank Polski (PKO BP), Powszechny Zakład Ubezpieczeń (PZU
Group) and Getin Holding SA. PKO BP is the largest bank in Central Europe, PZU is a leading insurance group in
Poland and Getin Holding is a financial group offering bank services, insurance and leasing. All of them are listed
on the Warsaw Stock Exchange, but only Getin Holding is a privately-owned company. The other two are state-
controlled companies; however, in the case of PZU more than 60% of shares are in free float. In 2011, PKO BP
and PZU were ranked second and third respectively on the list of the most valuable Polish brands.41
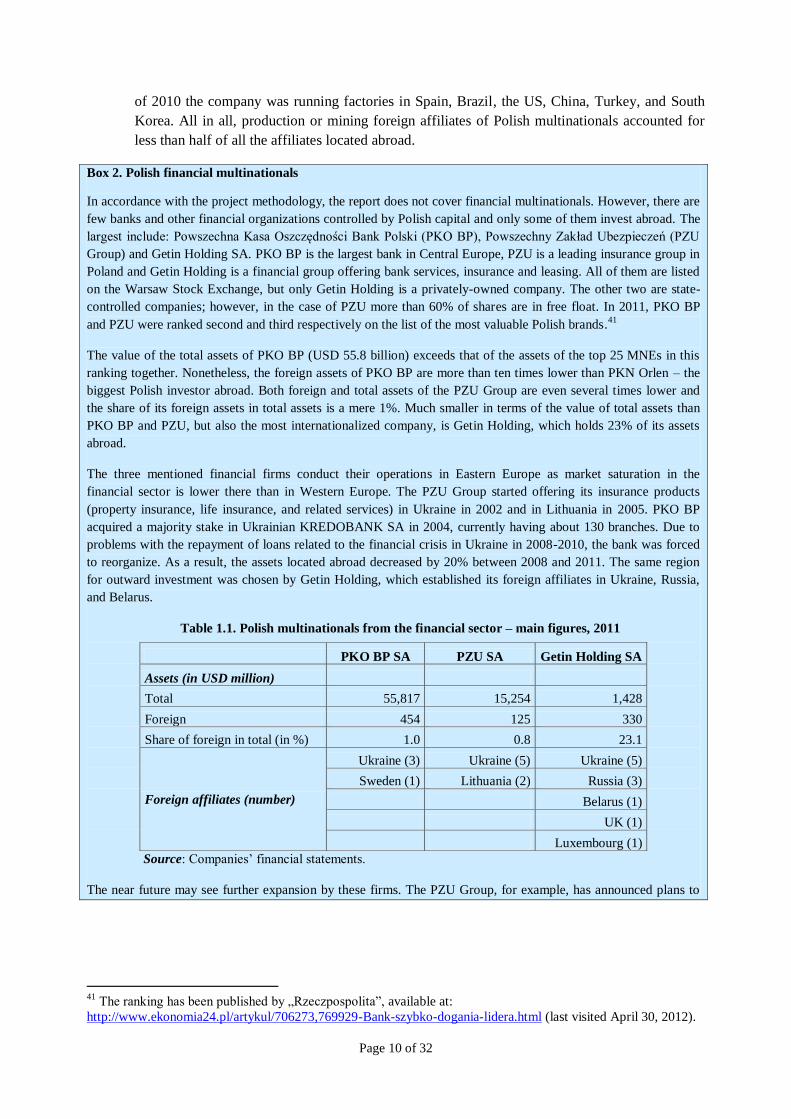
The value of the total assets of PKO BP (USD 55.8 billion) exceeds that of the assets of the top 25 MNEs in this
ranking together. Nonetheless, the foreign assets of PKO BP are more than ten times lower than PKN Orlen – the
biggest Polish investor abroad. Both foreign and total assets of the PZU Group are even several times lower and
the share of its foreign assets in total assets is a mere 1%. Much smaller in terms of the value of total assets than
PKO BP and PZU, but also the most internationalized company, is Getin Holding, which holds 23% of its assets
abroad.
The three mentioned financial firms conduct their operations in Eastern Europe as market saturation in the
financial sector is lower there than in Western Europe. The PZU Group started offering its insurance products
(property insurance, life insurance, and related services) in Ukraine in 2002 and in Lithuania in 2005. PKO BP
acquired a majority stake in Ukrainian KREDOBANK SA in 2004, currently having about 130 branches. Due to
problems with the repayment of loans related to the financial crisis in Ukraine in 2008-2010, the bank was forced
to reorganize. As a result, the assets located abroad decreased by 20% between 2008 and 2011. The same region
for outward investment was chosen by Getin Holding, which established its foreign affiliates in Ukraine, Russia,
and Belarus.
Table 1.1. Polish multinationals from the financial sector – main figures, 2011
PKO BP SA PZU SA Getin Holding SA
Assets (in USD million)
Total 55,817 15,254 1,428
Foreign 454 125 330
Share of foreign in total (in %) 1.0 0.8 23.1
Foreign affiliates (number)
Ukraine (3) Ukraine (5) Ukraine (5)
Sweden (1) Lithuania (2) Russia (3)
Belarus (1)
UK (1)
Luxembourg (1)
Source: Companies’ financial statements.
The near future may see further expansion by these firms. The PZU Group, for example, has announced plans to
41
The ranking has been published by „Rzeczpospolita”, available at:
http://www.ekonomia24.pl/artykul/706273,769929-Bank-szybko-dogania-lidera.html (last visited April 30, 2012).
Page 11 of 32
set up a special company - PZU International - whose aim would be making acquisitions in the insurance market in
Central and Eastern Europe.42
The company is planning to expand first into Latvia and Estonia.43
According to
media reports, it is also interested in taking over the state-controlled Croatian insurer Croatia Osiguranje.44
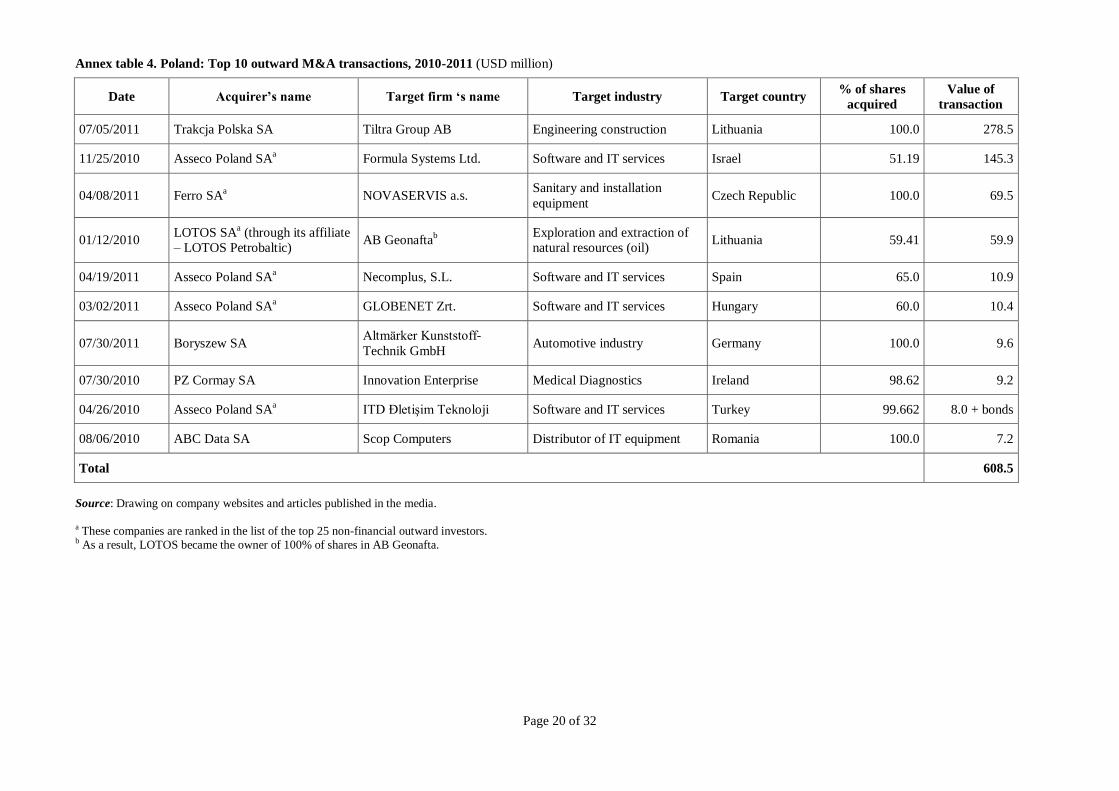
Top mergers and acquisitions In the period of 2010-2011, the most active Polish MNE on the
cross-border M&A market was the Asseco Group. It took over four foreign entities from the IT
business, including the Israeli company Formula Systems bought for USD 145 million. The
value of Asseco’s other transactions abroad was much lower, with each amounting to about USD
10 million. As a result of acquisitions completed in 2010, Asseco has become not only a leader
in the IT market in Central and Eastern Europe, but also a leading IT player across the whole of
Europe and ranked seventh among European software vendors in the Truffle 10045
ranking
published in 2011.46
Four out of the ten deals shown in annex table 4 were undertaken by
companies not ranked in our top 25 list. The largest investment was made by Trakcja Polska,
which acquired a Lithuanian company (Tiltra Group AB) in the infrastructure construction
industry for USD 278 million. However, the value of the top 10 transactions conducted abroad
by Polish firms was rather low and reached a total of approximately USD 609 million.
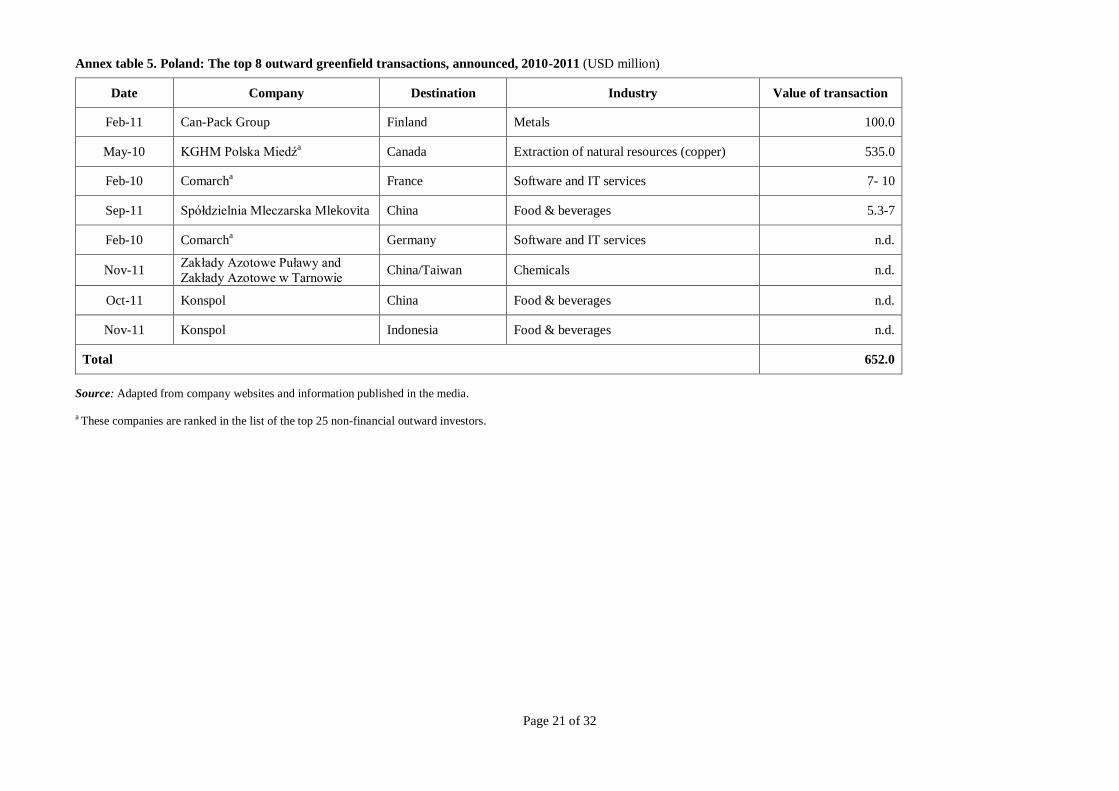
Top greenfield announcements47
Although brownfield investments were more popular among
Polish multinationals in 2010 and 2011, some significant greenfield projects were announced as
well. The expected value of such investment projects is only known for four of them (Can-Pack
Group, KGHM Polska Miedź, Comarch, Spółdzielnia Mleczarska Mlekovita). The largest
greenfield investment was announced by KGHM Polska Miedź, intending to build a copper mine
in Canada for more than USD 500 million. Can–Pack will build a can factory in Finland –
following the plants in Russia and India. Spółdzielnia Mleczarska Mlekovita, a Polish producer
of milk and dairy products, announced its plan to set up a plant in China. It would be the first
foreign affiliate of Mlekovita. As the European Union represents a highly saturated market, the
company has decided to invest in China – a country with a very low intake of milk and a huge
potential in the market of dairy products. To date, the company has been manufacturing all of its
products in several subsidiaries in Poland and then exporting part of them to various countries
(including the Asian region). The expansion into the Asian market has also been planned by
Konspol, a Polish producer of poultry, which in 2011 announced its intention to open three new
42
“The PZU Group strategy for the years 2012-2014” (Warsaw, March 15, 2012), available at:
http://www.pzu.pl/relacje-inwestorskie/raporty-okresowe-biezace (last vistited April 30, 2012). 43
Draudimo grupė PZU pasirinko Lietuvą plėsti verslui į kitas Baltijos šalis [PZU Insurance Group decided to
expand its business in Lithuania into other Baltic states], The announcement of PZU Lietuva published March 16,
2012,
http://www.pzu.lt/naujienos/pranesimai_spaudai/draudimo_grupe_pzu_pasirinko_lietuva_plesti_verslui_i_kitas_bal
tijos_salis/p371 (last vistited April 30, 2012). 44
PZU chce przejąć chorwackiego ubezpieczyciela Croatia Osiguranje [PZU wants to take over Croatian insurer
Croatia Osiguranje], “Gazeta Prawna”, available at:
http://biznes.gazetaprawna.pl/artykuly/601109,pzu_chce_przejac_chorwackiego_ubezpieczyciela_croatia_osiguranj
e.html (last visited April 30, 2012). 45
The Truffle 100 was created in 2006 by Truffle Capital, a leading European Venture Capital firm. Its research is
based on data compiled from surveys and analyses conducted over the years by Centre d'eXpertise des Progiciels
(CXP), organization focused on market research in the field of information technology, and International Data
Corporation (IDC), the global provider of market intelligence. 46
Truffle 100, “Ranking of the Top 100 European Software Vendors” (October 2011), p. 3, available at:
www.truffle100.com (last visited April 30, 2012). 47
This part was prepared pursuant to information published in the surveyed companies’ annual reports, their
websites and the Polish press, such as: http://www.parkiet.com, http://www.ekonomia24.pl,
http://gospodarka.dziennik.pl/.
Page 12 of 32
factories abroad – in China, Indonesia and Argentina. A final example of planned greenfield
projects is Comarch’s plan to build data processing centers in France and Germany. The value of
the remaining greenfield projects listed in annex table 5 has not been made public.
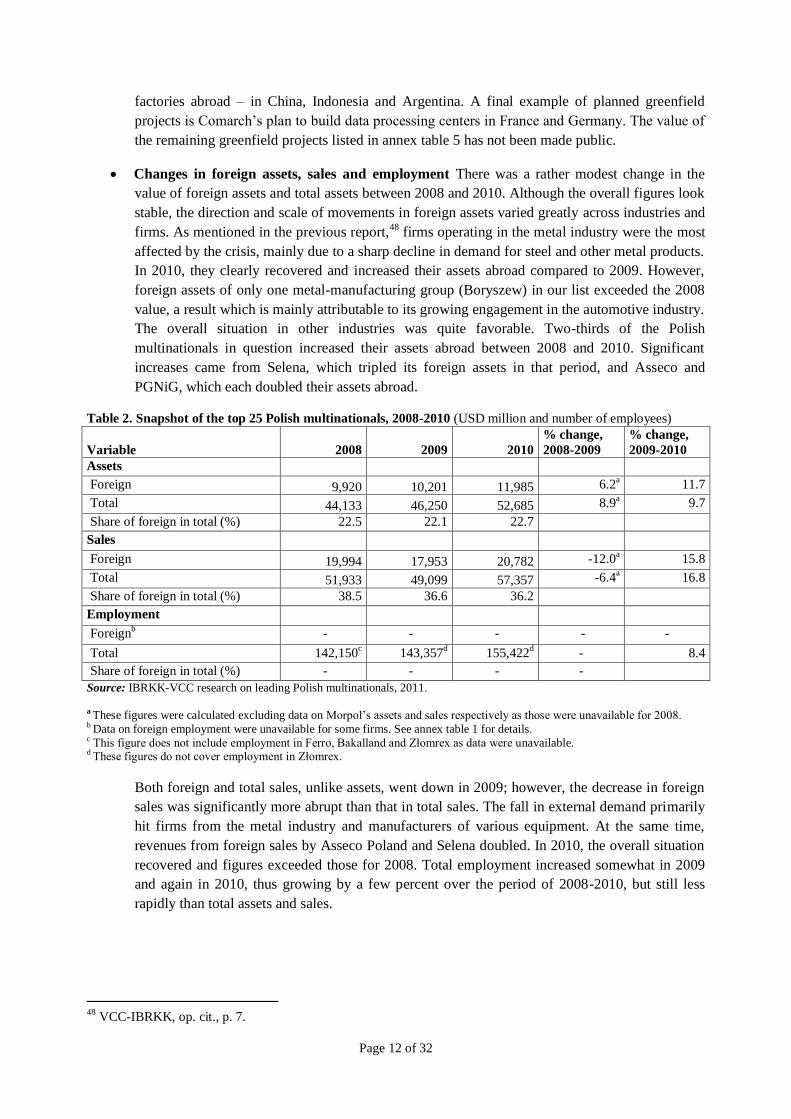
Changes in foreign assets, sales and employment There was a rather modest change in the
value of foreign assets and total assets between 2008 and 2010. Although the overall figures look
stable, the direction and scale of movements in foreign assets varied greatly across industries and
firms. As mentioned in the previous report,48
firms operating in the metal industry were the most
affected by the crisis, mainly due to a sharp decline in demand for steel and other metal products.
In 2010, they clearly recovered and increased their assets abroad compared to 2009. However,
foreign assets of only one metal-manufacturing group (Boryszew) in our list exceeded the 2008
value, a result which is mainly attributable to its growing engagement in the automotive industry.
The overall situation in other industries was quite favorable. Two-thirds of the Polish
multinationals in question increased their assets abroad between 2008 and 2010. Significant
increases came from Selena, which tripled its foreign assets in that period, and Asseco and
PGNiG, which each doubled their assets abroad.
Table 2. Snapshot of the top 25 Polish multinationals, 2008-2010 (USD million and number of employees)
Variable 2008 2009 2010
% change,
2008-2009
% change,
2009-2010
Assets
Foreign 9,920 10,201 11,985 6.2a 11.7
Total 44,133 46,250 52,685 8.9a 9.7
Share of foreign in total (%) 22.5 22.1 22.7
Sales
Foreign 19,994 17,953 20,782 -12.0a 15.8
Total 51,933 49,099 57,357 -6.4a 16.8
Share of foreign in total (%) 38.5 36.6 36.2
Employment
Foreignb - - - - -
Total 142,150c 143,357
d 155,422
d - 8.4
Share of foreign in total (%) - - - -
Source: IBRKK-VCC research on leading Polish multinationals, 2011. a These figures were calculated excluding data on Morpol’s assets and sales respectively as those were unavailable for 2008. b Data on foreign employment were unavailable for some firms. See annex table 1 for details. c This figure does not include employment in Ferro, Bakalland and Złomrex as data were unavailable. d These figures do not cover employment in Złomrex.
Both foreign and total sales, unlike assets, went down in 2009; however, the decrease in foreign
sales was significantly more abrupt than that in total sales. The fall in external demand primarily
hit firms from the metal industry and manufacturers of various equipment. At the same time,
revenues from foreign sales by Asseco Poland and Selena doubled. In 2010, the overall situation
recovered and figures exceeded those for 2008. Total employment increased somewhat in 2009
and again in 2010, thus growing by a few percent over the period of 2008-2010, but still less
rapidly than total assets and sales.
48
VCC-IBRKK, op. cit., p. 7.
Page 13 of 32
The big picture
As we stated in our previous report,49
although Polish multinationals have recently intensified their
investment and Poland is the leading outward investor among the new member states of the European
Union, the amount of Polish capital invested abroad is still modest in comparison with the value of
outward investment made by their counterparts from other emerging markets with similar GDP. The
average value of foreign assets held by Polish firms (USD 137,000) was several times lower than that of
Argentine, Turkish or Taiwanese investors (respectively USD 908,000, 1,647,000 and 3,807,000)50
. This
comparatively modest value of Polish outward investment largely stems from political circumstances as
the Polish economy was closed until 1989 and private capital, as in other post-communist countries, has
only been developing for a relatively short period of time. The vast majority of Polish companies that
started their expansion abroad only established their foreign affiliates a few years ago. Admittedly,
joining the EU has facilitated Polish outward investment within the EU due to such factors as the
freedom of conducting business, settling customs formalities and the unification of the law; nevertheless
the lack of political and financial support by the state has made the progress of the internationalization of
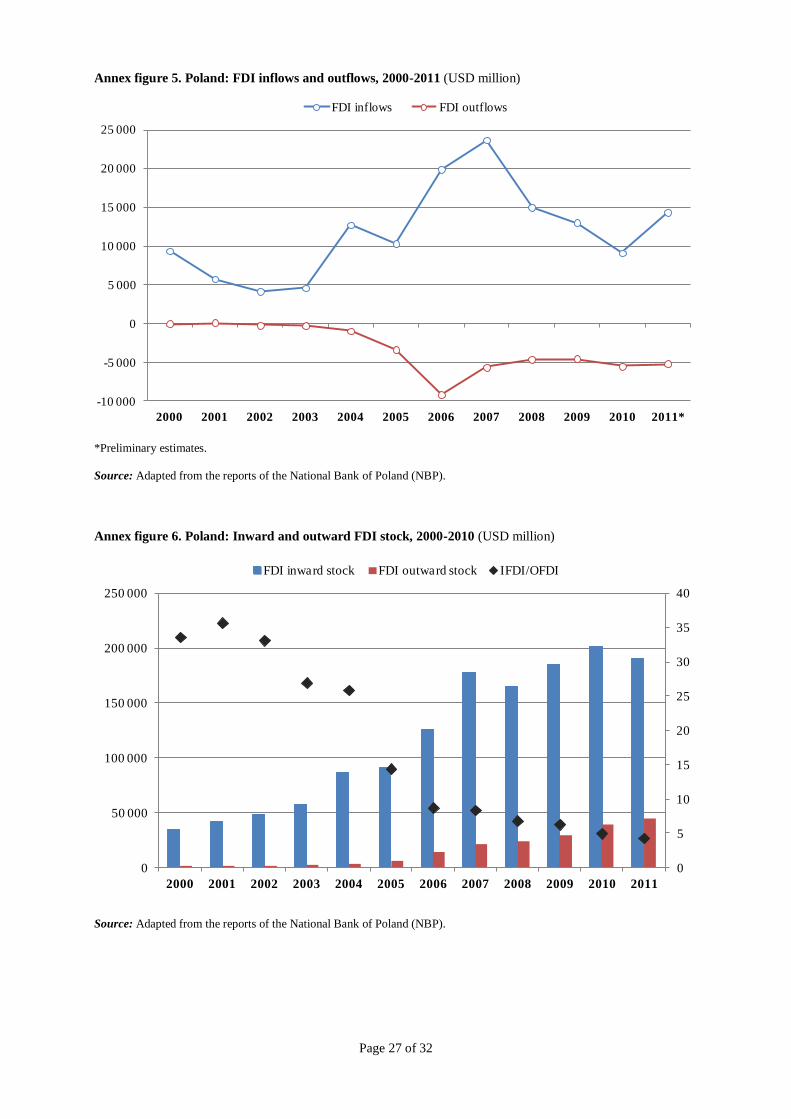
Polish MNEs rather moderate. The annual FDI outflows from Poland have never surpassed USD 10
billion. Although Poland has always been a net recipient of foreign investment, the ratio of inward to
outward FDI has been constantly decreasing since 2001 (see annex figure 6).
Additionally, the process of internationalization of Polish firms was inhibited by the global financial
crisis, which has strongly affected many European countries, the main destination for outward
investment from Poland. As a result, the investment dropped from nearly USD 5.7 billion in 2007 to
around USD 4.6 billion in 2008 and 2009 (see Annex figure 5). Although we did not observe a shrinking
in the value of foreign assets of the top 25 in that period, Polish multinationals were completely inactive
in cross-border acquisitions in 2009 partially due to the financial crisis. Moreover, some firms were
forced to implement reorganization programs concerning their foreign affiliates. For instance, Relpol, a
company from the top 25 list, due to problems with the recovery of receivables from contractors, put into
liquidation its subsidiaries in Germany, the UK and Hungary, and sold its subsidiary in Bulgaria.51
Additionally, the Nowy Styl Group downsized its Ukrainian plant as a consequence of shrinking demand
for furniture in Russia and Ukraine.52
In 2010, the value of Polish outward FDI rose again to over USD 5.5 billion and there was a significant
recovery on the international market of M&A transactions. According to UNCTAD,53
the number of
M&A purchases carried out by Polish MNEs soared from 3 in 2009 to 21 in 2010. A few of them took
advantage of crisis-related deterioration of the financial standing of some foreign companies and
concluded cost-beneficial M&A deals. For instance, Boryszew took over, at an attractive price, selected
assets of Maflow, an automotive group going in liquidation, located in Brazil, China, France, Italy,
Poland, and Spain.54
In 2011, the foreign expansion of Polish investors slowed down, with FDI outflows
just over USD 5.2 billion. However, the beginning of 2012 indicates a slight improvement. Several
49
VCC-IBRKK, op. cit. 50
It was calculated upon the data published in the countries’ reports within the EMGP project, available at:
http://www.vcc.columbia.edu/content/emerging-market-global-players-project. 51
“Management’s Report on Business Operations of the Relpol Group for 2009” (Żary, April 2010), available at:
http://www.relpol.pl/Relacje-Inwestorskie (last visited April 30, 2012). 52
Woźniak A., Ekspansja firm słabnie [The expansion of firms is slackening], “Rzeczpospolita” (January 31,
2009), available at: http://www.ekonomia24.pl/artykul/434047.html (last visited April 30, 2012). 53
UNCTAD, “World Investment Report 2011: Non-Equity Modes of International Production and Development”
(2011), Annex Tables. 54
The Mills and Companies of Maflow Group Bought by Boryszew Group, available at: http://ir.boryszew.com.pl/
(last visited April 30, 2012).
Page 14 of 32
transactions have been already completed; other companies have announced their plans of new
acquisitions in foreign markets or greenfield projects.
A major part of Polish investment abroad goes into Europe, mainly into Germany, the United Kingdom,
the Czech Republic, Lithuania, Romania, Ukraine, and Russia. These countries are either geographically
close to Poland or/and familiar in cultural terms. Previous export experience was an additional push
factor, especially in the case of the Central and East European countries. Admittedly, at the end of 2010
the largest recipient of outward investment from Poland was Luxembourg (23%), but this figure does not
reflect the real scale of investment projects conducted in that country. They were mainly of a financial
nature (the so-called “capital in transition”).55
The United States clearly dominates among destination
countries outside Europe. At the end of 2010 Polish investors located there 3% of total outward direct
investment in terms of stock value, which placed the US in the group of the ten largest recipients of
direct investment from Poland. There is also a rising interest in other regions, especially in emerging
markets in Asia (Singapore, Kazakhstan, India, China, the United Arab Emirates, and Israel, in the given
order).
Although the Polish state has not yet formulated any comprehensive “go global” strategy to promote
outward investment of Polish entities, recently we have observed a significant change in the
government’s approach to this issue compared to the previous years. It continued to provide free
information services for Polish firms exporting or conducting outward investment through the Network
of Investor and Exporter Assistance Centers (Sieć Centrów Obsługi Inwestorów i Eksporterów). There
have also been many meetings and discussions raising the subject of support for outward FDI. As a
result, in 2011, PAIiIZ in agreement with the Ministry of Economy launched a pilot program of “Support
for Polish companies in selected markets.” It is supposed to be implemented on a few selected markets
(Germany, France, the UK, the Czech Republic, Ukraine, and Russia) that are considered the most
important locations for FDI from Poland and is aimed at supporting investment projects of over EUR 1
million. The program includes providing information on investment conditions in the target countries
(legal requirements to start a business, tax systems, possible sources of finance, and incentives to attract
investment in the host countries), cooperating with foreign institutions providing investor services,
searching for strategic partners, monitoring the progress of commenced outward investments and
promoting the expansion of Polish multinationals through contests, conferences and media.56
No
financial support to facilitate foreign operations is offered within the program. Only in a few years we
will be able to evaluate the effectiveness of these initiatives in supporting outward direct investment of
Polish multinationals.
The Polish government recognizes a need to support Polish companies also on prospective but
geographically and culturally distant markets. Political support for doing business in Asia was initiated
by the Polish President Bronisław Komorowski, who signed a strategic agreement between Poland and
China during his visit to Beijing in December 2011. In April 2012, in turn, the Chinese Prime Minister
Wen Jiabao visited Poland. Then in May 2012, on the launching of direct flights between Warsaw and
Beijing, Waldemar Pawlak, the Polish Deputy Prime Minister and Minister of Economy, made an official
visit to China, with representatives of business.
To support Polish-Chinese cooperation on a regular basis, in March 2012 the Ministry of Economy, in
collaboration with other government agencies, launched a special “Go China” program aimed at
stimulating Polish exports, attracting Chinese investors to Poland and encouraging Polish companies to
55
See, NBP, “Międzynarodowa pozycja inwestycyjna Polski w 2006 roku” (2007), pp. 9-10. 56
Plan działań PAIiIZ S.A. wspierania polskich inwestycji za granicą [The action plan of PAIiIZ SA to promote
Polish investments abroad], February 2012, unpublished.
Page 15 of 32
invest in China. These objectives are to be achieved through promotional activities, providing relevant
information as well as establishing cooperation with Chinese business organizations. In order to facilitate
the flow of information, a special web portal containing a compendium of knowledge on the Chinese
market was started within the program.57
The portal also allows Polish investors and exporters to ask
questions on doing business in China. For the purposes of the “Go China” program, the Institute for
Market, Consumption and Business Cycles Research prepared for the Polish government a report on
barriers to and opportunities for export and investment on the Chinese market.
57
See, http://www.gochina.gov.pl/.
Page 16 of 32
For further information, please contact:
Institute for Market, Consumption
and Business Cycles Research
Ewa Kaliszuk
Research Fellow
Head of the European Integration Department
+48-22-621-33-43
Marzenna Błaszczuk-Zawiła
Research Fellow
+48-22-621-33-43
Agata Wancio
Research Fellow
+48-22-621-33-43
Vale Columbia Center on Sustainable International Investment (VCC)
Lisa Sachs
Director
+1(212) 854-0691
Lise Johnson
Lead Investment Law and Policy Researcher
Victor Zitian Chen
Ph.D. Candidate in Strategy and International Business Beedie School of BusinessSimon Fraser UniversityGlobal Coordinator and Editor
Emerging Market Global Players Project, VCC [email protected]
Valentina Bratu
Manager and Editor
Emerging Market Global Players Project, [email protected]
Emerging Markets Global Players Project
This report on Polish multinationals was prepared in the framework of the Emerging Markets Global Players
(EMGP) Project, an international collaborative effort led by the Vale Columbia Center on Sustainable International
Investment. It brings together researchers on FDI from leading institutions in emerging markets to generate annual
reports on the leading multinationals in each participating country. Since 2007, reports have been published on 14
countries: Argentina, Brazil, Chile, China, Hungary, India, Israel, Republic of Korea, Mexico, Poland, Russia,
Slovenia, Taiwan and Turkey. For further information, visit: http://www.vcc.columbia.edu/content/emerging-
market-global-players-project.
Institute for Market, Consumption and Business Cycles Research
The Institute for Market, Consumption and Business Cycles Research is a leading economic research institute
located in Warsaw. Its research focuses on global economic trends, along with their implications for the Polish
economy; sectorial analyses and forecasts; and the development of multilateral and regional integration processes,
with special attention to integration within the European Union and its consequences for Poland. The Institute’s
research areas also include FDI and the internationalization of Polish enterprises. Since 1990, the Institute has been
publishing annual reports on inward FDI in Poland and, since 2006, also reports on Poland’s outward investment.
The Institute provides analyses and recommendations to the Polish Government, government agencies as well as
companies and their associations (such as the Club of Exporters and the chambers of commerce). For more
information on the Institute’s activities and publications, visit: http://www.ibrkk.pl.
Vale Columbia Center on Sustainable International Investment
The Vale Columbia Center on Sustainable International Investment (VCC), a joint center of Columbia Law School
and the Earth Institute at Columbia University, is a leading forum for discussion by scholars, policy makers,
development advocates, practitioners, and other stakeholders of issues related to FDI in the global economy, paying
special attention to the impact of this investment on sustainable development. The VCC bridges education,
scholarship and practice in the field of sustainable investment. Its objectives are to analyze important topical policy-
oriented issues related to investment and to develop and disseminate practical approaches and solutions to promote
development outcomes. For more information, visit http://www.vcc.columbia.edu.
Page 17 of 32
Annex table 1. Poland: The top 25 multinationals: Key variables, 2010 (USD milliona and number of employees)
Rank by
foreign assets Company
Assets Sales Employment TNI
c(%)
No. of foreign
affiliates
No. of host
countries Foreign Total Foreign Total Foreign Total
1 PKN Orlen SA 6,222 17,062 14,856 27,869 7,072 22,040 41 30 9
2 Asseco Poland SA 1,194 2,636 514 1,080 9,112 13,638 53 70 36
3 PGNiG SA 1,149 11,447 0 7,099 903 32,431 4 28 19
4 Synthos SA 619 1,173 890 1,288 853 2,207 54 8 2
5 Morpol ASA 505 793 412 571 955 4,255 53 21 7
6 LOTOS SA 452 5.916 1226 6,565 24 5,010 9 9 4
7 Ciech SA 430 1311 759 1,321 1,327 6,705 37 16 9
8 Bioton SA 293 528 51 137 n.d. 987 (46) 21 14
9 Złomrex SA 252 483 148 332 n.d. n.d. (48) 19 11
10 Selena FM SA 160 293 96 201 571 1,550 46 25 17
11 Polimex-Mostostal SA 139 1,309 414 1,388 n.d. 14,252 (20) 7 5
12 Koelner SA 135 217 78 187 258 1,726 40 24 16
13 AB SA 100 303 478 1,188 359 628 43 5 2
14 Boryszew SA 85 781 135 1,046 839 6,056 13 13 7
15 KGHM Polska Miedź SA 82 7,064 242 5,768 7 30,928 2 5 5
16 Comarch SA 54 323 105 254 523 3,462 24 31 17
17 Grupa Kęty SA 24 470 125 404 156 3,013 14 11 8
18 Decora SA 24 90 48 88 n.d. 856 (41) 10 10
19 Fasing SA 19 64 23 50 162 556 35 2 2
20 Ferro SA 17 43 18 55 119 499 33 1 1
21 Stomil Sanok SA 13 123 87 157 90 2,309 23 5 3
22 FFiL Śnieżka SA 7 122 60 177 445 1,038 27 4 3
23 Relpol SA 4 26 9 30 283 740 28 8 7
24 Aplisens SA 3 29 5 20 26 271 16 6 5
25 Bakalland SA 3 79 3 83 n.d. 265 (3) 2 1
Total (average for TNI) 11,985 52,685 20,782 57,357 24,084 155,422 30 381 65
Source: IBRKK-VCC research on leading Polish multinationals, 2011.
a The exchange rate used is the rate reported by the IMF as of December 31, 2010: USD 1 = PLN 2.9979.
b Data on foreign sales are not fully comparable and should be interpreted with caution because, as noted in footnote 2 in the main report, for some companies, foreign sales include exports. c The Transnationality Index (TNI) is calculated as the average of the following three ratios: foreign assets to total assets, foreign sales to total sales, and foreign employment to total employment. It is expressed as a percentage. The TNI for five firms is calculated without foreign employment data and shown in parentheses.
Page 18 of 32
Annex table 2. Poland: The top 25 multinationals, Regionality Indexa (%), 2010
Rank Company
Other
Europe
Eastern
Europe &
Central Asia
Middle East &
North Africa
East Asia &
the Pacific South Asia
North
America
Developed
Asia-Pacific
Latin America &
the Caribbean
Sub-Saharan
Africa
No. of
foreign
affiliates
1 PKN Orlen SA 100 30
2 Asseco Poland SA 79 6 6 3 4 3 70
3 PGNiG SA 32 7 39 4 14 4 28
4 Synthos SA 100 8
5 Morpol ASA 90 5 5 21
6 LOTOS SA 100 9
7 Ciech SA 88 6 6 16
8 Bioton SA 48 10 5 19 14 5 21
9 Złomrex SA 95 5 19
10 Selena FM SA 52 20 12 8 4 4 25
11 Polimex-Mostostal SA 57 43 17 4 4 7
12 Koelner SA 71 25 4 24
13 AB SA 100 5
14 Boryszew SA 77 15 8 13
15 KGHM Polska Miedź SA 60 20 20 5
16 Comarch SA 74 10 3 6 3 3 31
17 Grupa Kęty SA 45,5 45,5 9 11
18 Decora SA 70 30 10
19 Fasing SA 50 50 2
20 Ferro SA 100 1
21 Stomil Sanok SA 100 5
22 Śnieżka SA 25 75 4
23 Relpol SA 50 50 8
24 Aplisens SA 33 67 6
25 Bakalland SA 100 2
Average 70 13 5 4 2 2 1 1 381
Source: IBRKK-VCC research on leading Polish multinationals, 2011.
a The Regionality Index is calculated by dividing the number of the firm’s foreign affiliates in a particular region of the world by its total number of foreign affiliates and multiplying the result by 100.
Page 19 of 32
Annex table 3. Poland: The top 25 multinationals: Stock exchange listings, 2010
Company’s name Domestic Foreign
PKN Orlen SA Warsaw London (LSE)
Asseco Poland SA Warsaw Tel Aviv Stock Exchange (TASE)a, NASDAQ Global Market
a
PGNiG SA Warsaw None
Synthos SA Warsaw None
Morpol ASA No Oslo Stock Exchange (OSE)
LOTOS SA Warsaw None
Ciech SA Warsaw None
Bioton SA Warsaw Australian Securities Exchange (ASX)a
Złomrex SA Warsaw Luxembourg Stock Exchange (bonds)a
Selena FM SA Warsaw None
Polimex-Mostostal SA Warsaw None
Koelner SA Warsaw None
AB SA Warsaw None
Boryszew SA Warsaw None
KGHM Polska Miedź SA Warsaw London (LME)b, Shanghai (SHFE)
b, New York (NYMEX)
b
Comarch SA Warsaw Frankfurt (FSE)
Grupa Kęty SA Warsaw None
Decora SA Warsaw None
Fasing SA Warsaw None
Ferro SA Warsaw None
Stomil Sanok SA Warsaw None
FFiL Śnieżka SA Warsaw None
Relpol SA Warsaw None
Aplisens SA Warsaw None
Bakalland SA Warsaw None
Source: IBRKK-VCC research on leading Polish multinationals, 2011.
a These Polish multinationals are not listed directly on foreign exchanges, but through their subsidiaries. b These are futures rather than stock exchanges.
Page 20 of 32
Annex table 4. Poland: Top 10 outward M&A transactions, 2010-2011 (USD million)
Date Acquirer’s name Target firm ‘s name Target industry Target country % of shares
acquired
Value of
transaction
07/05/2011 Trakcja Polska SA Tiltra Group AB Engineering construction Lithuania 100.0 278.5
11/25/2010 Asseco Poland SAa Formula Systems Ltd. Software and IT services Israel 51.19 145.3
04/08/2011 Ferro SAa NOVASERVIS a.s.
Sanitary and installation
equipment Czech Republic 100.0 69.5
01/12/2010 LOTOS SA
a (through its affiliate
– LOTOS Petrobaltic) AB Geonafta
b
Exploration and extraction of
natural resources (oil) Lithuania 59.41 59.9
04/19/2011 Asseco Poland SAa Necomplus, S.L. Software and IT services Spain 65.0 10.9
03/02/2011 Asseco Poland SAa GLOBENET Zrt. Software and IT services Hungary 60.0 10.4
07/30/2011 Boryszew SA Altmärker Kunststoff-
Technik GmbH Automotive industry Germany 100.0 9.6
07/30/2010 PZ Cormay SA Innovation Enterprise Medical Diagnostics Ireland 98.62 9.2
04/26/2010 Asseco Poland SAa ITD Đletişim Teknoloji Software and IT services Turkey 99.662 8.0 + bonds
08/06/2010 ABC Data SA Scop Computers Distributor of IT equipment Romania 100.0 7.2
Total 608.5
Source: Drawing on company websites and articles published in the media.
a These companies are ranked in the list of the top 25 non-financial outward investors. b As a result, LOTOS became the owner of 100% of shares in AB Geonafta.
Page 21 of 32
Annex table 5. Poland: The top 8 outward greenfield transactions, announced, 2010-2011 (USD million)
Date Company Destination Industry Value of transaction
Feb-11 Can-Pack Group Finland Metals 100.0
May-10 KGHM Polska Miedźa Canada Extraction of natural resources (copper) 535.0
Feb-10 Comarcha France Software and IT services 7- 10
Sep-11 Spółdzielnia Mleczarska Mlekovita China Food & beverages 5.3-7
Feb-10 Comarcha Germany Software and IT services n.d.
Nov-11 Zakłady Azotowe Puławy and
Zakłady Azotowe w Tarnowie China/Taiwan Chemicals n.d.
Oct-11 Konspol China Food & beverages n.d.
Nov-11 Konspol Indonesia Food & beverages n.d.
Total 652.0
Source: Adapted from company websites and information published in the media. a These companies are ranked in the list of the top 25 non-financial outward investors.
Page 22 of 32
Annex figure1. Poland: Breakdown of the foreign assets of the top 25 multinationals, by main industry, 2010
7905
1355
1348
508
381
343
139
7 Mining, exploration and refining - KGHM, LOTOS, PKN Orlen, PGNiG
Manufacture of chemical and pharmaceutical products - Bioton, Ciech, Stomil Sanok, Synthos
Information technology systems - AB, Asseco, Comarch
Food products - Bakalland, Morpol
Manufacture of metals and metal products - Grupa Kęty, Fasing, Złomrex, Boryszew
Building materials - Decora, Ferro, Koelner, Selena, Śnieżka
Construction - Polimex-Mostostal
Machinery and equipment - Aplisens, Relpol
Source: IBRKK-VCC research on leading Polish multinationals, 2011.
Page 23 of 32
Annex figure 2. Poland: Foreign affiliates of the top 25 multinationals by region, 2010 (number of affiliates)
Source: IBRKK-VCC research on leading Polish multinationals, 2011.
Middle East
& North Africa
1
11
Eastern Europe
& Central Asia
Latin America
& the Caribbean
East Asia
& the Pacific
Other Europe
19
South Asia
Developed Asia-
Pacific
North America
4
8
9
5
Sub-Saharan
Africa
51
267
17
Other Europe
Page 24 of 32
Annex figure 2a. Poland: Timeline tracking the opening of the first foreign affiliate by each of the listed companies
Source: IBRKK-VCC research on leading Polish multinationals, 2011.
Russia (Stomil Sanok SA)
Czech Republic (Bakalland SA)
Czech Republic (Decora SA)
Ukraine (PGNiG SA)
Germany (Comarch SA)
Russia (Aplisens SA)
Germany (PKN Orlen SA)
Germany (Boryszew SA)
United Kingdom (Koelner SA)
Czech Republic (AB SA)
Czech Republic (Synthos SA)
Germany (Morpol ASA)
Hungary (Relpol SA)
Republic of the Congo (KGHM Polska Miedź SA)
Ukraine (Grupa Kęty SA)
Romania (Selena FM SA)
Ukraine (FFiL Śnieżka SA)
China (Ferro SA)
Slovak Republic (Asseco Poland SA)
Russia (Bioton SA)
China (Fasing SA)
China (Złomrex SA)
Lithuania (LOTOS SA)
Romania (Ciech SA)
Romania (Polimex-Mostostal SA)
Page 25 of 32
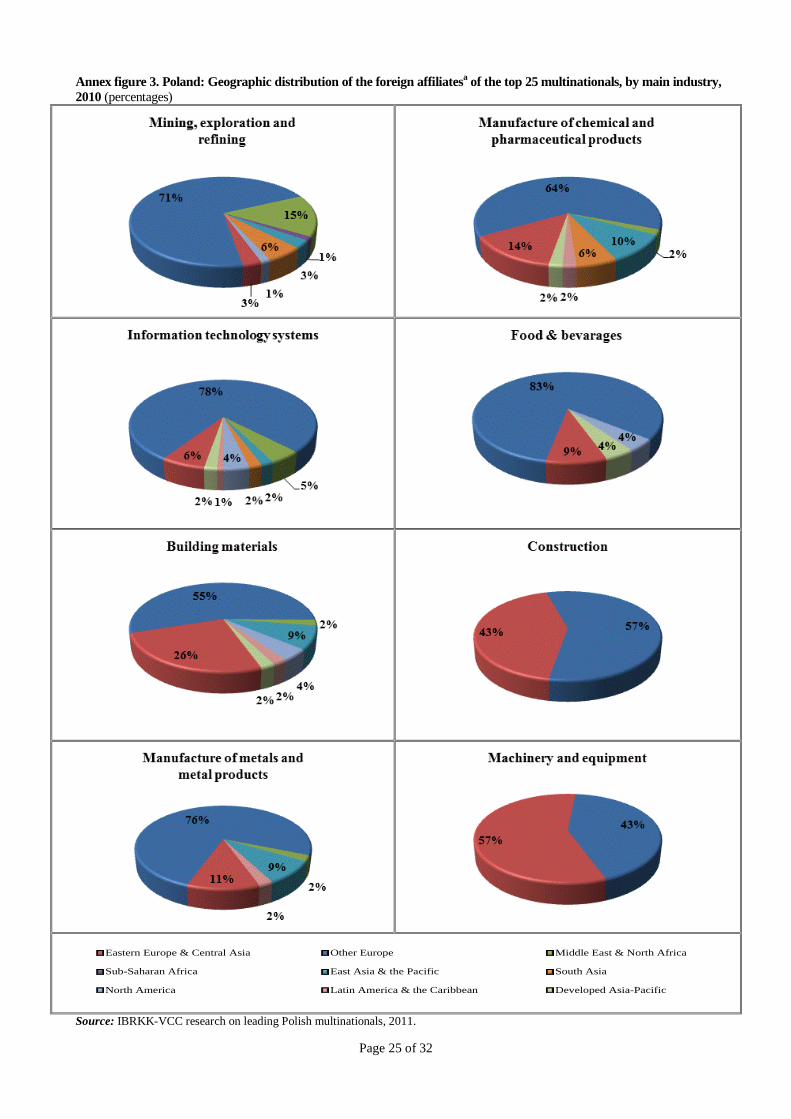
Annex figure 3. Poland: Geographic distribution of the foreign affiliatesa of the top 25 multinationals, by main industry,
2010 (percentages)
Eastern Europe & Central Asia Other Europe Middle East & North Africa
Sub-Saharan Africa East Asia & the Pacific South Asia
North America Latin America & the Caribbean Developed Asia-Pacific
Source: IBRKK-VCC research on leading Polish multinationals, 2011.
Page 26 of 32
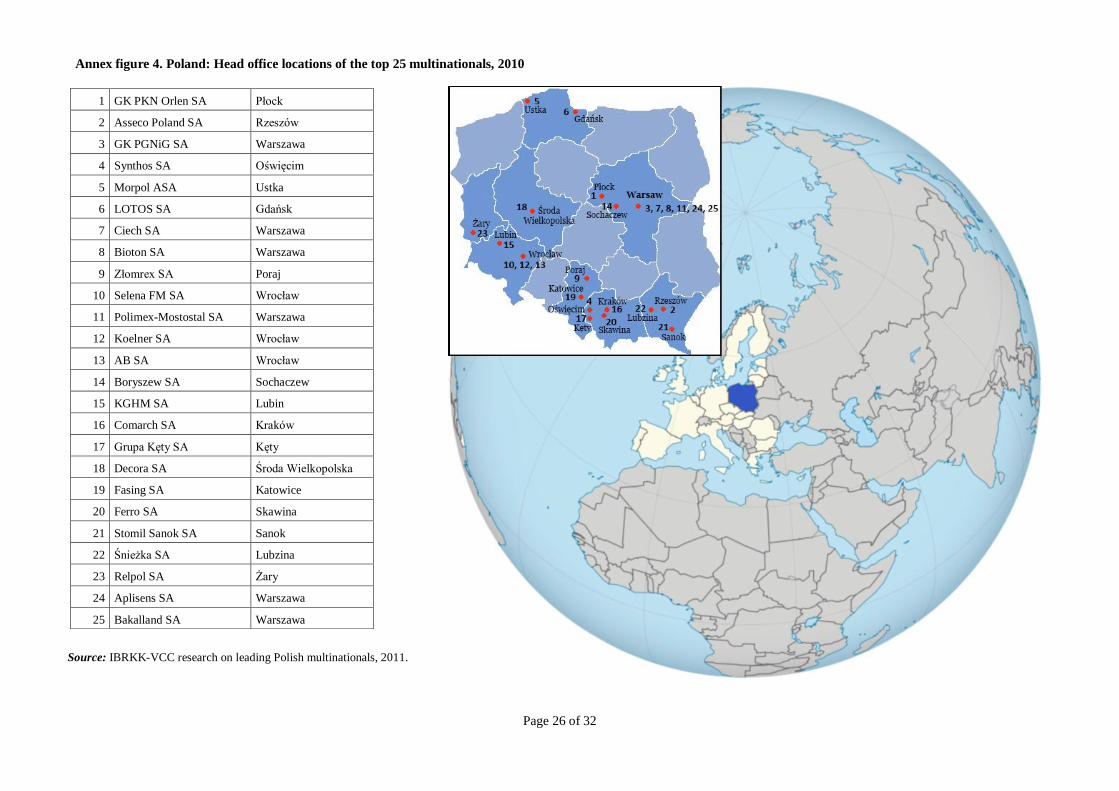
Annex figure 4. Poland: Head office locations of the top 25 multinationals, 2010
1 GK PKN Orlen SA Płock
2 Asseco Poland SA Rzeszów
3 GK PGNiG SA Warszawa
4 Synthos SA Oświęcim
5 Morpol ASA Ustka
6 LOTOS SA Gdańsk
7 Ciech SA Warszawa
8 Bioton SA Warszawa
9 Złomrex SA Poraj
10 Selena FM SA Wrocław
11 Polimex-Mostostal SA Warszawa
12 Koelner SA Wrocław
13 AB SA Wrocław
14 Boryszew SA Sochaczew
15 KGHM SA Lubin
16 Comarch SA Kraków
17 Grupa Kęty SA Kęty
18 Decora SA Środa Wielkopolska
19 Fasing SA Katowice
20 Ferro SA Skawina
21 Stomil Sanok SA Sanok
22 Śnieżka SA Lubzina
23 Relpol SA Żary
24 Aplisens SA Warszawa
25 Bakalland SA Warszawa
Source: IBRKK-VCC research on leading Polish multinationals, 2011.
Page 27 of 32
Annex figure 5. Poland: FDI inflows and outflows, 2000-2011 (USD million)
-10 000
-5 000
0
5 000
10 000
15 000
20 000
25 000
2000 2001 2002 2003 2004 2005 2006 2007 2008 2009 2010 2011*
FDI inflows FDI outflows
*Preliminary estimates.
Source: Adapted from the reports of the National Bank of Poland (NBP).
Annex figure 6. Poland: Inward and outward FDI stock, 2000-2010 (USD million)
0
5
10
15
20
25
30
35
40
0
50 000
100 000
150 000
200 000
250 000
2000 2001 2002 2003 2004 2005 2006 2007 2008 2009 2010 2011
FDI inward stock FDI outward stock IFDI/OFDI
Source: Adapted from the reports of the National Bank of Poland (NBP).
Page 28 of 32
Annex II. Brief company profiles (in the order of the ranking)
No.1. Polski Koncern Naftowy Orlen SA
http://www.orlen.pl/EN/
The company was established as a national petroleum company (Polski Koncern Naftowy, PKN) in 1998 by
merging two Polish oil refineries - Centrala Produktów Naftowych CPN S.A. and Petrochemia Płock S.A. In
2000, PKN adopted a new trade name – ORLEN, under which it is recognized nowadays outside the country. Its
first step toward foreign expansion was buying petrol stations in Germany from BP. Since acquiring a
controlling stake in Lithuanian Mažeikių Nafta (2006), it has become the largest petroleum group in Central
Europe with major operations in Poland, the Czech Republic, Germany, and the Baltic States. In 2011, it was
ranked first in the list of the 500 largest companies in Central and Eastern Europe published by Deloitte and
347th in the Fortune Global 500 in terms of revenues value.
No.2. Asseco Poland SA
http://www.asseco.pl/en
Asseco Poland was established in 1991 as COMP Ltd Sp. At first, it was engaged mainly in the production of
software for cooperative banks, and later expanded operations to the banking and financial sector, insurance
institutions, public administration and industry. In 2004, the company debuted on the WSE. After the acquisition
of Slovak ASSET Soft a.s., it was renamed Asseco Poland SA. Having achieved the leading position in Poland,
the company is continuing to build IT holdings that operate across Europe – from Spain and Portugal to
Scandinavia and the Baltic states. At present, Asseco is the largest IT company listed on the WSE and a major
software producer in Europe.
No.3. Polskie Górnictwo Naftowe i Gazownictwo SA
http://www.pgnig.pl/
PGNiG was established in 1982 as a state-owned enterprise. In 1996, PGNiG was transformed into a joint-stock
company with the State Treasury holding 100% of the shares. Since 2004 it has been listed on the WSE. The
state still owns 72.48% shares but further privatization is in progress. The PGNiG Group, a leader on the
domestic market, is the only vertically integrated company in the Polish gas sector. The enterprise’s activity
covers not only natural gas and crude oil exploration and production but also trade in, storage and distribution of
natural gas to individual and industrial customers. The PGNiG Group includes PGNiG SA, as the parent
company, and more than a dozen production and service companies operating domestically and internationally -
in Denmark, Egypt, Kazakhstan, Norway and Pakistan.
No.4. Synthos SA
http://www.synthosgroup.com/
The company is one of the largest Polish chemical companies, founded in 1946 as Fabryka Paliw Syntetycznych
w Dworach (Factory of Synthetic Fuels in Dwory, Poland). It was privatized in the 1990s and renamed Firma
Chemiczna Dwory S.A. (Chemical Factory Dwory SA). In 2004, the company successfully debuted on the WSE.
After the acquisition of the Czech firm Kaucuk Kralupy a.s., Dwory changed its name to Synthos SA. So far, the
company has established its foreign plants only in the Czech Republic, where it employs almost 50% of its
workers. The Group concentrates on manufacturing three types of products: rubber and synthetic latex, styrene
plastics, and vinyl and copolymer dispersions. It is the largest manufacturer of rubber emulsions and the third
largest manufacturer of polystyrene for foaming applications in Europe.
No.5. Morpol ASA
http://morpol.com/
The company was founded in Ustka on the Baltic coast of Poland by Jerzy Malek in 1996. The original activity
was canning cod liver but it rapidly evolved into salmon processing as Jerzy Malek (the owner and the CEO)
saw the potential of salmon aquaculture in Norway and the growing demand for smoked salmon in Europe.
Morpol’s major processing and packaging plant is situated in Poland, together with sales management. Although
the headquarters of Morpol has been relocated to Norway before entering the Oslo Stock Exchange in 2010,
Poland remained the place where the CEO and the COO carry out the day-to-day management of the Company’s
activities and where strategic decisions are made. The funding raised from the initial public offering was used to
make upstream acquisitions of salmon farming operations. Such activities as well as sales affiliates are located in
several countries, inter alia in Norway, France, the UK, Italy, Germany, Japan, and the US. Investment in
farming operations was also expanded in 2011 and has been continued in 2012. As a result of recent investments,
Page 29 of 32
the Morpol Group has become the world’s leading processor of salmon and the market leader in smoked and
marinated salmon.
No.6. LOTOS Group SA
http://www.lotos.pl/en/
The LOTOS Group was founded in 2003 as a result of the government’s decision to merge the Gdańsk Refinery
with Petrobaltic, extracting oil from the Baltic Sea, and the local refineries from southern Poland. The company
debuted on the stock market in 2005. Over 53% of its shares are owned by the state and the remaining shares are
in free float on the WSE. The LOTOS Group is the second largest oil company in Poland, exploiting, processing
and distributing oil-based products such as lead-free gasoline, diesel oil, diesel fuel, aviation fuel, engine and
industrial oil, asphalt and gases. A nationwide filling station chain operates under the LOTOS brand. The group
consists of approximately 30 direct and indirect subsidiaries, including a few abroad. Through its Norway-based
subsidiary, the company is present on the Norwegian Continental Shelf, where it carries out oil exploration and
exploitation.
No.7. Ciech SA
http://www.ciech.com/
Ciech was established in 1945 as a state-owned company, Centrala Importowo-Eksportowa Chemikalii i
Aparatury Chemicznej (Chemical Products and Equipment Import-Export Enterprise). In 2005 Ciech was partly
privatized and listed on the WSE. Its largest shareholder is the State Treasury (36.7 %), followed by institutional
investors, such as Pioneer Pekao Investment Management and Otwarty Fundusz Emerytalny (Open Pension
Fund) PZU “Złota Jesień”. In 2006, it finalized the acquisition of two chemical synthesis companies, Organika-
Sarzyna and Zachem, and of the first foreign manufacturing company, the Romanian soda plant US Govora. As
a result, the production capacity of the Ciech Chemical Group almost doubled. The Group is currently one of the
leaders in the European chemical market. It comprises more than 30 companies, including 16 located abroad.
The main products of the Group are: soda ash (the second largest producer in Europe) and TDI (number 1 on the
Polish market), plant protection chemicals and phosphate fertilizers, and other basic chemicals used in the glass,
furniture, construction and food industries.
No.8. Bioton SA
http://www.bioton.pl/en
Bioton is a biotechnology company, established in 1989 to manufacture basic pharmaceutical substances. The
company started its foreign expansion relatively late, establishing its first affiliate in Russia in 2004. Since then,
it been has expanding its activities abroad very quickly. By the end of 2009, Bioton had undertaken several
outward M&As, which resulted in the acquisition of a dozen foreign affiliates in over ten countries, including
Italy, Singapore, India, South Korea and Australia. The group produces primarily insulin and generic drugs
(mainly antibiotics). It also conducts R&D activities and is expanding its product portfolio. The company is
building a factory to produce recombinant insulin in India, to be sold in Latin America, the Middle East and
North Africa.
No.9. Złomrex SA
http://www.zlomrex.pl/
Złomrex was established in 1990 as a small business focused on the purchase of scrap metal. Due to systematic
development, it has expanded the scale of its activities and become the leader of a group comprising
manufacturing plants and distribution entities. At present, Złomrex S.A. is a major producer and distributor of
steel and steel products, both in Poland and in Central and Eastern Europe. The Group consists of 25 businesses,
including 19 abroad.
No.10. Selena FM SA
http://www.selenafm.com/
The Selena Group was founded in 1992 to produce modern construction chemicals: polyurethane mounting
foams and silicone sealants. In a relatively short time became a global manufacturer and distributor of a wide
range of construction chemicals for professional contractors and home users. Currently, the Group is the world’s
third largest manufacturer of polyurethane foam used for door and window installation. Since 2008 Selena FM
shares have been listed on the WSE. The Group comprises 35 companies located in Poland and overseas,
including 12 manufacturing plants (six facilities in Poland and plants in Brazil, South Korea, China, the United
States and Turkey).
Page 30 of 32
No.11. Polimex-Mostostal SA
http://www.polimex-mostostal.pl/en
Polimex-Mostostal is an engineering and construction company that has been on the market since 1945. Until
2004 it operated as two separate businesses – Polimex-Cekop and Mostostal Siedlce, which had been privatized
before the merger and one of them was also first listed on the stock exchange in 1997. The company provides
services as a general contractor for the chemical as well as refinery and petrochemical industries, power
engineering, environmental protection, industrial and general construction. It also operates in the field of road
and railway construction as well as municipal infrastructure. The largest production plants are located in Poland,
but the company operates abroad as well. The export activity is facilitated by an international sales network
(agencies or locally registered branch offices) and manufacturing plants in foreign countries.
No.12. Koelner SA
http://www.en.koelner.pl/
The company started business activity as Tworzywa Sztuczne Krystyna Koelner (Plastics Krystyna Koelner) in
1982, producing plastic socket wrench handles, buttons and flowerpots. In 2004, Koelner debuted on the WSE.
Since then it has become an international holding company, comprising manufacturing and distribution
enterprises from 16 countries worldwide. Currently, the company develops innovative solutions for fastening
techniques, their design, production and distribution. The Group’s product portfolio includes high-quality
mechanical fasteners, threaded products, chemical anchors, drills, circular saws, tools and power tools.
No.13. AB SA
http://www.ab.pl/
AB S.A. is one of the largest IT service providers and hardware, software and consumer electronics distributors
in Central and Eastern Europe, established in 1993. Five year later the company attracted a financial investor −
the Polish Enterprise Fund − which accelerated its market expansion. In 2006, AB SA made its debut on the
WSE. In 2007, it purchased a 100% stake in AT Computer Holding a.s., one of the largest IT service providers
and electronic equipment distributors in the Czech Republic and Slovakia. With the acquisition of AT Computer
Holding, AB has become the owner of personal computers manufacturer and service provider, AT Compus.
No.14. Boryszew SA
http://www.boryszew.com.pl/
The company was established in 1911 as a factory producing art silk. After the Second World War, it was
nationalized. Under the communist system, Boryszew was engaged in the production of dental and
pharmaceutical materials, radiator liquids, brake fluids and later plastics. In 1991, the company was entirely
privatized and since 1996 has been listed on the WSE. In 1999 Boryszew gained a strategic investor, Roman
Karkosik, who still controls the company (60.63% of shares). Today, the Boryszew Group, with nearly 30
production and trade entities located on three continents (Europe, Latin America and Asia), becomes a global
company. Its main business lines include semi-finished products made of non-ferrous metals and their alloys, car
cables for global car manufacturers, ball bearings and chemicals. In 2010, implementing its development strategy
aimed at building a strong market position in the automotive sector, Boryszew took control of the Maflow
Group. In 2011, it continued the strategy.
No.15. KGHM Polska Miedź SA
http://www.kghm.pl/
KGHM was established in 1961 under the name of Kombinat Górniczo-Hutniczy Miedzi (Copper Smelting-
Mining Plant), as a state-owned enterprise. In 1991 it was transformed into a joint stock company. Since July
1997 its shares have been listed on the WSE. The state holds 31.79% of the stock. Basic operations of the
company are limited to copper ore mining, copper production, and the production of precious metals and other
non-ferrous metals. KGHM is the seventh largest producer of refined copper and the second largest silver
producer worldwide. The company also owns equity shares in companies involved in diverse activities: health
services, tourism, and telecoms. As far as overseas operations are concerned, KGHM is interested primarily in
the exploration and exploitation of copper ores in countries associated with low political risk (the investment in
Congo in the form of the acquisition of rights to and exploitation of the Kimpe ore deposit resulted in the
voluntary liquidation of the Congolese subsidiary in 2006). In 2012, as a consequence of the friendly takeover of
Quadra FNX, KGHM has become the owner of copper mines in Canada, the US and Chile, as well as the co-
owner of the world-class Sierra Gorda project. The company also has two foreign distribution companies (in
Austria and the UK).
Page 31 of 32
No.16. Comarch SA
http://www.comarch.com/
Comarch was founded in 1993 by Professor Janusz Filipiak from the University of Science and Technology
(AGH) in Kraków. He has been the president and, since the company debuted on the WSE (1999), also the major
shareholder. Comarch is a software house and IT services provider that specializes in innovative IT solutions for
the telecommunications and financial services industries, public institutions and non-financial enterprises. Its
products and solutions cover billing, network management, ERP systems, IT security, CRM and loyalty
management, EDI, sales support, electronic communication and business intelligence. The majority of products
offered by Comarch are developed in-house. In its R&D centers it employs over 1,000 people. In 2007-2010,
expenditure on R&D exceeded USD 110.5 million. The organizational structure of the Comarch Capital Group
comprises a network of subsidiaries located in Poland and abroad, i.e. in Europe, the Americas, the Middle East
and East Asia.
No.17. Grupa Kęty SA
http://www.grupakety.com/en/
Kęty was established in 1950 as Zakłady Metali Lekkich (Light Metals Plant). In 1992, it was transformed into a
sole-shareholder company of the State Treasury. Soon afterwards, it was privatized and then floated on the WSE
(1996). The company has no dominant shareholder, its shares being held by several cooperating private financial
institutions. The main activity of the Kęty Group is manufacturing aluminum profiles and processing them into
intermediate and final products, which are then used in construction, the automotive industry, transportation and
accessories for woodwork. Its foreign affiliates, located mainly in European countries (Germany, Ukraine,
Russia, the Czech Republic, Romania and the UK), are focused on distribution, with the exception of the
production facility in Ukraine.
No.18. Decora SA
http://www.decora.eu
Decora was established in 1994 by a team of four to manufacture ceiling tiles. Within a few years the company
expanded to other interior decorating products: ceiling moldings, rosettes, wall insulation and heat reflectors. As
Decora started its foreign operations relatively late (in 2005), the majority of its foreign affiliates are
distribution-oriented. The only production facility was set up in Belarus to supply the Russian and Ukrainian
markets with baseboards. Since 2005 the company has been listed on the WSE.
No.19. Fabryki Sprzętu i Narzędzi Górniczych Fasing SA
http://www.fasing.pl/
The history of Fasing dates back to 1913. The company changed the owner several times and then was
nationalized after the Second World War. The enterprise manufactured mostly parts for machinery and
equipment, mainly for mining. Since 2000 the company has been listed on the WSE. Today, Fasing is one of the
world’s largest producers of chains for the mining and power industries, fisheries, the sugar, cement and timber
industries. Apart from Poland, the company has manufacturing facilities in China and Germany.
No.20. Ferro SA
http://www.ferrocompany.com/
Ferro was established in the 1990s. The Group operates in the Polish market as well as conducting international
sales activities in Romania, France, Ukraine, Belarus, Bulgaria and Russia, among others. The production of the
Group is carried out in a plant located in China, 50% of whose shares are owned by Ferro SA. Apart from the
head office, the logistic and storage base is situated in Poland. The company debuted on the WSE in 2010. The
capital raised in this way allowed Ferro to acquire a Czech company in 2011.
No.21. Sanockie Zakłady Przemysłu Gumowego Stomil Sanok SA
http://www.stomilsanok.com.pl/ukmain.xml
The company started production under the name of SANOK in 1932. Since 1997 it has been listed on the WSE.
The company operates primarily in the automotive, construction, industrial and agricultural sectors. It designs,
manufactures and distributes products of rubber, rubber-metal and rubber combined with other materials. By
2010, Stomil Sanok established several affiliates abroad, mainly in Russia, Ukraine and Belarus. It announced its
plan to expand production to China in 2012.
Page 32 of 32
No.22. Fabryka Farb i Lakierów Śnieżka SA
http://www.sniezka.pl/en/
The history of FFiL Śnieżka dates back to 1984 (in 1990-1998 it operated under the name of Chemal S.c.
Fabryka Farb i Lakierów – Paints and Varnishes Plant – in Brzeźnica). The high demand for products
manufactured by the plant prompted the owners to set up two further manufacturing subsidiaries – in Lubzina
(1993) and Pustków (1994). Production in its first foreign plant started in 2000 in Ukraine and two years later in
Belarus. Śnieżka has treated Eastern Europe as a key market. In 2003 the shares of Śnieżka Paints and Varnishes
Plant S.A. appeared on the WSE. The company is planning further expansion in foreign markets (production and
distribution); among others it intends to build a new paint factory in Romania.
No.23. Relpol SA
http://www.relpol.com.pl/en/
Relpol has been operating in the electrotechnical industry since 1958. In 1996 it made its debut on the WSE. The
company manufactures electromagnetic relays and relay sockets, widely used in electric circuit control of
various machines and equipment, vehicles, domestic appliances and electronics. Apart from two plants located in
Poland, the company owns two production plants abroad (in Ukraine and Lithuania) and several distribution-
oriented affiliates in other European countries.
No.24. Aplisens SA
http://www.aplisens.pl/en/
The company was founded in 1992 by six workers of the Industrial Research Institute for Automation and
Measurements PIAP. At that time it concentrated on electronic pressure and differential pressure measurement
technology. Today, the Aplisens Group has design, production and distribution affiliates in several European
countries. It regards the CIS countries as strategic markets, given their demand for investment in modernizing
heavy industries in particular.
No.25. Bakalland SA
http://www.bakalland.pl/en.html
Bakalland SA was established in 1994 by a team of three to produce and distribute fresh and then dried fruit.
Currently, it is focused on the production, processing and trade in raisins, dried fruit, nuts, grains and seeds. In
2006, the company entered the WSE. The funds from the issue of securities were used for undertaking its
planned acquisitions. In respect of international expansion, Bakalland established its foreign affiliates in Ukraine
and the Czech Republic, but the latter is currently in liquidation.