Embed Size (px)
Citation preview
TEDS-M TECHNICAL REPORT
TEDS
The Teacher Education and Development Study in Mathematics (TEDS-M)
Policy, Practice, and Readiness to Teach Primary and Secondary Mathematics in 17 Countries
Technical Report
Edited byMaria Teresa Tatto

1
The Teacher Education and Development Study in Mathematics (TEDS-M)
Policy, Practice, and Readiness to Teach Primary and Secondary Mathematics in 17 Countries
Technical Report
Edited byMaria Teresa Tatto
ContributorsKiril BankovAlena BeckerFalk BreseSoo-Yong ByunRalph CarstensJean DumaisLawrence IngvarsonYang LuYukiko MaedaBarbara Malak-Minkiewicz
Sabine MeinckRay PeckInese Berzina-PitcherMarc ReckaseMichael RodríguezGlenn RowleyJohn SchwilleSharon L. SenkMaria Teresa TattoAlana Yu
This material is based on work supported by the National Science Foundation under Grant No. REC 0514431. Any opinions, findings, and conclusions or recommendations expressed in this material are those of the author(s) and do not necessarily reflect the views of the National Science Foundation (NSF).
THE TEACHER EDUCATION AND DEVELOPMENT STUDY IN MATHEMATICS (TEDS-M) TECHNICAL REPORT2
Copyright © 2013 International Association for the Evaluation of Educational Achievement (IEA)
All rights reserved. No part of the publication may be reproduced, stored in a retrieval system or
transmitted in any form or by any means, electronic, electrostatic, magnetic tape, mechanical,
photocopying, recoding, or otherwise without permission in writing from the copyright holder.
ISBN/EAN: 978-90-79549-24-5
Copies of The Teacher Education and Development Study in Mathematics (TEDS-M). Policy, Practice,
and Readiness to Teach Primary and Secondary Mathematics in 17 Countries: Technical Report can be
obtained from:
IEA Secretariat
Herengracht 487
1017 BT Amsterdam, the Netherlands
Telephone: +31 20 625 3625
Fax: + 31 20 420 7136
Email: [email protected]
Website: www.iea.nl
Copyedited by Paula Wagemaker Editorial Services, Oturehua, Central Otago, New Zealand
Design and production by Becky Bliss Design and Production, Wellington, New Zealand
Printed by MultiCopy Netherlands b.v.
3
Table of Contents
List of Exhibits 8
Chapter 1: Overview of the Teacher Education and Development Study 13 in Mathematics Maria Teresa Tatto 1.1 Purpose of TEDS-M 14
1.2 Research Questions 14
1.3 Data Sources 14
1.4 Sampling Procedure 15
1.5 Content of this Report 15
References 16
Chapter 2: The TEDS-M Policy Context Study 17John Schwille, Lawrence Ingvarson, and Maria Teresa Tatto
2.1 Overview 17
2.2 Data Collection 17
2.2.1 Preliminary country questionnaires 17
2.2.2 Country reports from NRCs 18
2.3 Analysis and Reporting 19
2.3.1 International report on the policy study 20
2.3.2 Organization and context of teacher education 20
2.3.3 The distinctive national imprint of each TEDS-M system 28
2.3.4 Crossnational comparison of quality-assurance policies 29
References 30
Chapter 3: Development of the TEDS-M Mathematics Assessment 31 Frameworks, Instruments, and Scoring Guides Kiril Bankov, Sharon L. Senk, Ray Peck, Maria Teresa Tatto, Michael Rodríguez,
and Yukiko Maeda
3.1 Overview 31
3.2 Developing the TEDS-M 2008 Assessment Frameworks 32
3.2.1 The mathematics content knowledge (MCK) framework 32
3.2.2 The mathematics pedagogical content knowledge (MPCK) 34
framework
3.2.3 Developing the mathematics and mathematics pedagogy items 36
3.2.4 Methodological and measurement considerations 36
3.2.5 Initial item review and revision 37
3.2.6 The field trial 37
3.2.7 Item selection for the main study 37
3.2.8 Item compilations and booklet design for the main study 38
3.2.9 Assembling the item blocks for inclusion in the booklets 39
3.3 Scoring the Assessment Items 41
3.3.1 General method used to score the constructed-response items 41
3.3.2 Developing the scoring guides 42
3.3.3 Item release policy 44
References 44

THE TEACHER EDUCATION AND DEVELOPMENT STUDY IN MATHEMATICS (TEDS-M) TECHNICAL REPORT4
Chapter 4: Development of the TEDS-M Survey Questionnaires 47Maria Teresa Tatto, Michael Rodríguez, Lawrence Ingvarson, Glenn Rowley,
Yukiko Maeda, and Soo-Yong Byun
4.1 Overview 47
4.2 Development of the TEDS-M Survey Questionnaires 47
4.2.1 The future teacher questionnaires (FTQs) 48
4.2.2 The educator questionnaire (EQ) 59
4.2.3 The institutional program questionnaire (IPQ) 59
References 70
Chapter 5: Translation and Translation Verification of the TEDS-M Research 71 InstrumentsBarbara Malak-Minkiewicz and Inese Berzina-Pitcher
5.1 Overview 71
5.2 Translating the TEDS-M Instruments 71
5.2.1 Survey languages 71
5.2.2 Instruments requiring translation 72
5.2.3 Translators and reviewers 73
5.2.4 Translation and adaptation guidelines 73
5.2.5 Documenting national adaptations 74
5.2.6 International translation/adaptation and layout verifications 75
5.3 International Quality Control Monitor Review 78
References 78
Chapter 6: Sampling Design 79Jean Dumais, Sabine Meinck, Maria Teresa Tatto, John Schwille, and
Lawrence Ingvarson
6.1 Overview 79
6.2 International Sampling Plan 79
6.2.1 The importance of programs and routes 79
6.2.2 Target populations 80
6.2.3 Sample size requirements and implementation 86
6.2.4 Country-based variations to the international sampling strategies 87
6.2.5 Sampling frames 87
6.2.6 Stratification 88
6.3 Sample Selection 88
6.3.1 Sampling of institutions 88
6.3.2 Sampling from within institutions 88
6.4 Sampling for the Field Trial 90
References 91
Chapter 7: Survey Operations Procedures 93Falk Brese, Alena Becker, Inese Berzina-Pitcher, Maria Teresa Tatto, and
Ralph Carstens
7.1 Overview 93
7.2 Field Trial 93
7.3 NRC Responsibilities 94
7.4 Manuals and Software 94

5TABLE OF CONTENTS
7.5 Procedures for Contacting Institutions and for Within-Institution Sampling 95
7.5.1 Institution coordinators 95
7.5.2 Survey listing and tracking forms 96
7.5.3 Assigning and shipping materials to institution coordinators, 98
educators, and future teachers
7.6 Administering the TEDS-M Questionnaires 98
7.6.1 Survey administrators’ role 99
7.6.2 Timing of the future teacher sessions 99
7.6.3 Documenting participation 100
7.6.4 Receipt of material and data-entry preparation 100
7.6.5 Survey activities questionnaire 101
References 101
Chapter 8: Quality Assurance of the TEDS-M Data Collection 103Barbara Malak-Minkiewicz and Alana Yu
8.1 Overview 103
8.2 International quality control of the TEDS-M survey administration 104
8.2.1 International quality control monitors 104
8.3 National Quality Control of the TEDS-M Survey Administration 112
8.3.1 Effectiveness of the national quality control program 112
8.4 Observations Reported in the Survey Activities Questionnaire 112
References 113
Chapter 9: Creating and Checking the TEDS-M Database 115Ralph Carstens, Falk Brese, and Alena Becker
9.1 Overview 115
9.2 Data Entry and Verification at National Centers 115
9.2.1 Materials and training 115
9.2.2 Codebook adaptation and data entry 116
9.2.3 Double data entry (quality control) 118
9.2.4 Data verification and submission 118
9.3 Data Checking, Editing, and Quality Control at the IEA DPC 119
9.3.1 Import and structure checks 119
9.3.2 Handling adapted and national variables 120
9.3.3 Cleaning of identification variables and linkage 120
9.3.4 Questionnaire data cleaning 121
9.3.5 Handling of missing data 122
9.3.6 Interim data products and reports 123
9.4 Building the International Database (IDB) 123
9.4.1 Removing cases and units not intended for analysis 124
9.4.2 Merging reporting variables 124
9.4.3 Ensuring the confidentiality of information 124
9.4.4 International database for NRC use 126
9.4.5 International database for scientific use 126
References 127

THE TEACHER EDUCATION AND DEVELOPMENT STUDY IN MATHEMATICS (TEDS-M) TECHNICAL REPORT6
Chapter 10: Estimation of Weights, Participation Rates, and Sampling Error 129Jean Dumais and Sabine Meinck
10.1 Overview 129
10.2 Computing the Estimation (or Final) Weight 130
10.2.1 Institution base weight (institution design weight) 132
10.2.2 Institution nonresponse adjustment factor 132
10.2.3 Final institution weight 132
10.2.4 Teacher preparation unit nonresponse adjustment factor 133
10.2.5 Final teacher preparation unit weight 133
10.2.6 Session group base weight 134
10.2.7 Future teacher base weight 134
10.2.8 Future teacher nonresponse adjustment factor 135
10.2.9 Future teacher level weight 136
10.2.10 Final future teacher weight 136
10.2.11 Educator base weight 137
10.2.12 Educator nonresponse adjustment factor 137
10.2.13 Final educator weight 138
10.3 Participation Rates 138
10.3.1 Participation rates for institutions 139
10.3.2 Participation rates for future primary teachers 139
10.3.3 Participation rates for future lower-secondary teachers 141
10.3.4 Participation rates for educators 142
10.3.5 Sampling adjudication outcomes 143
10.4 Estimating Sampling Error with Balanced Repeated Replication (BRR) 144
10.4.1 Reasons for using BRR 144
10.4.2 Creating replicates for BRR 152
10.4.3 Estimating the sampling error 154
10.4.4 Using sampling error when comparing estimates 154
10.4.5 Design effect and effective sample size 155
References 159
Chapter 11: Scale Development and Reporting: Opportunities to Learn, 161 Beliefs, and Mathematics Knowledge for TeachingMaria Teresa Tatto, Michael Rodríguez, Mark Reckase, Glenn Rowley, and Yang Lu
11.1. Methods Used to Develop the Opportunity to Learn and Beliefs Scales: 161
Overview
11.2 Development of the OTL Scales 162
11.2.1 Analysis of the pilot-study responses to the OTL items 163
11.2.2 Initial analyses of the main-study survey results 163
11.2.3 Confirmatory factor analysis 163
11.2.4 Rasch scaling 164
11.3 Development of the Beliefs Scales 165
11.4 Scaling Mathematics and Mathematics Pedagogy Content Knowledge 168
and Determining Anchor Points
11.4.1 Measuring mathematics knowledge for teaching 168
11.4.2 Scale development 169
11.4.3 TEDS-M test reliabilities 170

7
11.4.4 Methods used to determine MCK and MPCK anchor points 171
11.4.5 Reporting knowledge scales 172
References 173
APPEnDICESA: TEDS-M 2008 Route Questionnaire 177
B: TEDS-M Guidelines on Writing Country Reports 201
C: Characteristics of National Samples: Implementations of the International 211
Sampling Design in Participating Countries
Sabine Meinck and Jean Dumais
D: TEDS-M Sampling Frame Questionnaire and Forms 253
E: Mobilizing National Support and Recruiting Institutions 261
F: Future Primary Teachers’ OTL and Belief Indices: International Reliability 268
and Descriptive Statistics
G: Future Secondary Teachers’ OTL and Belief Indices: International Reliability 269
and Descriptive Statistics
H: Future Primary and Secondary Teachers’ and Educators’ OTL and Belief 270
Scales: International Reliabilities
I: Field Trial of the Institutional, Future Teacher, and Educator Questionnaires 271
J: Model Fit Statistics for the Opportunity to Learn Scales 274
K: Model Fit Statistics for the Opportunity to Learn Scales for Future Teachers 288
and Educators by Country
L: Changes for Calibration of MCK/MPCK Primary Items 292
M: Changes for Calibration of MCK/MPCK Secondary Items 293
N: Control Parameters for Model and Case Estimation: Mathematical 294
Content Knowledge and Mathematics Pedagogical Content Knowledge
O: Mathematics Content Knowledge and Mathematics Pedagogical 295
Content Knowledge Scales
P: TEDS-M Test Reliabilities 296
Q: Anchor Point Descriptions 297
R: Program-Groupings: Future Teachers (Primary) 304
S: Program-Groupings: Future Teachers (Secondary) 306
T: Listings of Organizations and Individuals Responsible for TEDS-M 308
TABLE OF CONTENTS

THE TEACHER EDUCATION AND DEVELOPMENT STUDY IN MATHEMATICS (TEDS-M) TECHNICAL REPORT8
List of ExhibitsExhibit 2.1: Organizational characteristics of teacher education program-types 21
in TEDS-M
Exhibit 2.2: Example graphic: TEDS-M program-types in Botswana 28
Exhibit 3.1: Mathematics content knowledge framework: content knowledge 33
subdomains and content areas
Exhibit 3.2: Mathematics content knowledge framework: cognitive subdomains 33
and behaviors associated with them
Exhibit 3.3: Mathematics content knowledge framework: curricular levels 34
Exhibit 3.4: Mathematics pedagogical content knowledge (MPCK) framework 35
Exhibit 3.5: Design for primary blocks 38
Exhibit 3.6: Design for lower-secondary blocks 39
Exhibit 3.7: Primary items by subdomains and blocks 39
Exhibit 3.8: Lower-secondary items by subdomains and blocks 40
Exhibit 3.9: Distribution of the MCK items across the mathematics content 40
subdomains
Exhibit 3.10: Distribution of the MPCK items across the mathematics pedagogy 40
subdomains
Exhibit 3.11: Distribution of item formats by subdomain in both primary and 41
lower-secondary TEDS-M instruments
Exhibit 3.12: Example of generic double-digit scoring guide used for 42
constructed-response items
Exhibit 4.1: Mapping the processes and outcomes of mathematics teacher 48
preparation using the data collected from the TEDS-M surveys
Exhibit 4.2: TEDS-M research model for the TEDS-M surveys 49
Exhibit 4.3: Content of future teacher questionnaire, Part A: general background 50
Exhibit 4.4: Content of future teacher questionnaire, Part B: opportunities 51
to learn
Exhibit 4.5: Content of future teacher questionnaire, Part D: beliefs 57
Exhibit 4.6: Content of educator questionnaire 60
Exhibit 4.7: Content of institutional program questionnaire 65
Exhibit 5.1: Languages used for TEDS-M instruments 72
Exhibit 6.1: Structure of mathematics teacher preparation by participating 81
country
Exhibit 6.2: Nationally defined target populations by participating country 83
Exhibit 6.3: Nationally defined target populations: exclusions and coverage 85
Exhibit 6.4: Sampling stages and units 89
Exhibit 6.5: Response rates within participating institutions: field trial and main 91
survey
Exhibit 7.1: TEDS-M preparation for survey administration 96
Exhibit 7.2: TEDS-M hierarchical identification system codes 98

9
Exhibit 8.1: Number of participating institutions and number of IQCM 105
observations
Exhibit 8.2: Quality of the survey administration’s preliminary activities 106
(percentage of IQCM responses)
Exhibit 8.3: Quality of administration activities immediately preceding 107
answering of future teacher booklets (percentage of IQCM responses)
Exhibit 8.4: Quality of administration of future teacher booklets (percentage of 108
IQCM responses)
Exhibit 8.5: Quality of future teachers’ behaviors when answering the surveys 109
(percentage of IQCM responses)
Exhibit 8.6: Quality of survey administrators’ control over administration 109
process (percentage of IQCM responses)
Exhibit 8.7: Need to replace future teacher survey booklets (percentage of 110
IQCM responses)
Exhibit 8.8: Summary of the institution coordinators’ and survey administrators’ 111
evaluations of TEDS-M future teacher surveys (percentage of IQCM responses)
Exhibit 8.9: Suggestions for improvement (percentage of IQCM responses) 111
Exhibit 8.10: Additional background information (percentage of IQCM 111
responses)
Exhibit 9.1: Overview of iterative data processing at the IEA DPC 119
Exhibit 10.1: Conventional notations used in this chapter 131
Exhibit 10.2: Summary of adjudication results 145
Exhibit 10.3: Unweighted participation rates for institutions, future primary 147
and lower-secondary teachers, and teacher educators
Exhibit 10.4: Institutions: expected and achieved sample sizes 148
Exhibit 10.5: Future primary teachers: expected and achieved sample sizes 149
Exhibit 10.6: Future lower-secondary teachers: expected and achieved sample 150
sizes
Exhibit 10.7: Teacher educators: expected and achieved sample sizes 151
Exhibit 10.8: Example of “BRR-ready” sample design and random assignation 152
of pseudo PSUs
Exhibit 10.9: Future primary teachers: approximated design effects for key 156
variables by participating country
Exhibit 10.10: Future lower-secondary teachers: approximated design effects 157
for key variables by participating country
Exhibit 10.11: Educators: approximated design effects for key variables by 158
participating country
Exhibit 11.1: Opportunity to learn scales 166
Exhibit 11.2: Beliefs scales 167
Appendices
Exhibit C1.1. Sample design in Botswana (institution and future teacher surveys) 214
Exhibit C1.2: Mapping program-types to groups defined for reporting purposes 214
(Botswana)
Exhibit C1.3: Sample design in Botswana (educator survey) 214
LIST OF EXHIBITS

THE TEACHER EDUCATION AND DEVELOPMENT STUDY IN MATHEMATICS (TEDS-M) TECHNICAL REPORT10
Exhibit C2.1: Sample design in Canada, four provinces (institution and 215
future teacher surveys)
Exhibit C2.2: Sample design in Canada, four provinces (educator survey) 216
Exhibit C3.1: Sample design in Chile (institution and future teacher surveys) 217
Exhibit C3.2: Mapping program-types to groups defined for reporting 218
purposes (Chile)
Exhibit C3.3: Sample design in Chile (educator survey) 218
Exhibit C4.1: Explicit stratification and sample allocation in Chinese Taipei 219
(future primary teacher survey)
Exhibit C4.2: Sample design in Chinese Taipei (institution and future teacher 220
surveys)
Exhibit C4.3: Mapping program-types to groups defined for reporting purposes 220
(Chinese Taipei)
Exhibit C.4.4: Explicit stratification and sample allocation in Chinese Taipei 221
(educator and institution surveys)
Exhibit C4.5: Sample design in Chinese Taipei (educator survey) 221
Exhibit C5.1: Sample design in Georgia (institution and future teacher surveys) 222
Exhibit C5.2: Mapping program-types to groups defined for reporting purposes 222
(Georgia)
Exhibit C5.3: Sample design in Georgia (educator survey) 222
Exhibit C6.1: Sample design in Germany (institution and future teacher surveys) 225
Exhibit C6.2: Mapping program-types to groups defined for reporting purposes 226
(Germany)
Exhibit C6.3: Explicit stratification and sample allocation in Germany (educator 227
survey)
Exhibit C6.4: Sample design in Germany (educator survey) 227
Exhibit C7.1: Sample design in Malaysia (institution and future teacher surveys) 228
Exhibit C7.2: Mapping program-types to groups defined for reporting purposes 229
(Malaysia)
Exhibit C7.3: Sample design in Malaysia (educator survey) 229
Exhibit C8.1: Sample design in Norway (institution and future teacher surveys) 231
Exhibit C8.2: Mapping program-types to groups defined for reporting purposes 232
(Norway)
Exhibit C9.1: Sample design in Oman (institution and future teacher surveys) 232
Exhibit C9.2: Mapping program-types to groups defined for reporting 232
purposes (Oman)
Exhibit C9.3: Sample design in Oman (educator survey) 232
Exhibit C10.1: Explicit stratification and sample allocation in the Philippines 234
Exhibit C10.2: Sample design in the Philippines (institution and future teacher 234
surveys)
Exhibit C10.3: Mapping program-types to groups defined for reporting purposes 235
(Philippines)
Exhibit C10.4: Sample design in the Philippines (educator survey) 235

11
Exhibit C11.1: Sample design in Poland (institution and future teacher surveys) 237
Exhibit C11.2: Mapping program-types to groups defined for reporting 238
purposes (Poland)
Exhibit C11.3: National option: sample design in Poland, second-cycle 238
programs (institution and future teacher surveys)
Exhibit C11.4: Mapping program-types to groups defined for reporting 239
purposes (Poland, national option)
Exhibit C11.5: Sample design in Poland (educator survey) 239
Exhibit C12.1: Explicit stratification and sample allocation in the Russian 241
Federation
Exhibit C12.2: Sample design in the Russian Federation (institution and future 241
teacher surveys)
Exhibit C12.3: Mapping program-types to groups defined for reporting 241
purposes (Russian Federation)
Exhibit C12.4: Sample design in the Russian Federation (educator survey) 241
Exhibit C13.1: Sample design in Singapore (institution and future teacher 242
surveys)
Exhibit C13.2: Mapping program-types to groups defined for reporting 243
purposes (Singapore)
Exhibit C13.3: Sample design in Singapore (educator survey) 243
Exhibit C14.1: Sample design in Spain (institution and future teacher surveys) 244
Exhibit C14.2: Mapping program-types to groups defined for reporting 244
purposes (Spain)
Exhibit C14.3: Sample design in Spain (educator survey) 244
Exhibit C15.1: Sample design in Switzerland, German-speaking parts only 245
(institution and future teacher surveys)
Exhibit C15.2: Mapping program-types to groups defined for reporting 246
purposes (Switzerland, German-speaking parts only)
Exhibit C15.3: Sample design in Switzerland, German-speaking parts only 246
(educator survey)
Exhibit C16.1: Sample design in Thailand (institution and future teacher 247
surveys)
Exhibit C16.2: Mapping program-types to groups defined for reporting 248
purposes (Thailand)
Exhibit C16.3: Sample design in Thailand (educator survey) 248
Exhibit C17.1: Explicit stratification and sample allocation in the United States 250
Exhibit C17.2: Sample design in the United States (institution and future 250
teacher surveys)
Exhibit C17.3: Mapping program-types to groups defined for reporting 251
purposes (United States)
Exhibit C17.4: Sample design in the United States (educator survey) 251

THE TEACHER EDUCATION AND DEVELOPMENT STUDY IN MATHEMATICS (TEDS-M) TECHNICAL REPORT12
Exhibit F.1: Future primary teachers’ OTL and belief indices: international 268
reliability and descriptive statistics
Exhibit G.1: Future secondary teachers’ OTL and belief indices: international 269
reliability and descriptive statistics
Exhibit H.1: Future primary and secondary teachers’ and educators’ OTL and 270
belief scales: international reliabilities
Exhibit I.1: Item statistics for the opportunity to learn (OTL) scale—assessment 272
in mathematics teaching (primary level)
Exhibit K.1: Model fit statistics for the opportunity to learn scales for future 288
teachers and educators by country
Exhibit L.1: Changes for calibration of MCK/MPCK primary items 292
Exhibit M.1: Changes for calibration of MCK/MPCK secondary items 293
Exhibit O.1: Mathematics content knowledge and mathematics pedagogical 295
content knowledge scales
Exhibit P.1: TEDS-M test reliabilities 296
Exhibit R.1: Program-groupings: future teachers (primary) 304
Exhibit S.1: Program-groupings: future teachers (secondary) 306

13OVERVIEw OF TEDS-M
CHAPTER 1: OvERviEw Of ThE TEaChER EDuCaTiOn anD DEvElOpMEnT STuDy in MaThEMaTiCS
Maria Teresa Tatto, Michigan State University
The Teacher Education and Development Study in Mathematics (TEDS-M), conducted
under the aegis of the International Association for the Evaluation of Educational
Achievement (IEA), was designed to inform policy and practice in mathematics teacher
education. For educational policymakers, TEDS-M contributes data on institutional
arrangements that are effective in helping future teachers become sufficiently
knowledgeable in mathematics and related teaching knowledge. For the teacher
educators who design, implement, and evaluate teacher education curricula, TEDS-M
contributes a shared terminology, a shared database, and benchmarks for examining
their teacher education provision against what has proved possible and desirable to
do in other settings. For mathematics teachers in schools, TEDS-M provides a better
understanding of what qualified teachers of mathematics learn about the content
and pedagogy of mathematics during their preservice education, as well as about the
arrangements and conditions conducive to acquisition of this knowledge. For educators
in general and for informed laypersons, TEDS-M provides a better understanding about
what and how teachers learn as they prepare to teach.
Seventeen countries participated in TEDS-M.1 They were Botswana, Canada (four
provinces), Chile, Chinese Taipei, Georgia, Germany, Malaysia, Norway, Oman (lower-
secondary teacher education only), the Philippines, Poland, the Russian Federation,
Singapore, Spain (primary teacher education only), Switzerland (German-speaking
cantons only), Thailand, and the USA (public institutions, concurrent and consecutive
teacher education program routes only).
The TEDS-M joint-international research centers at Michigan State University (MSU)
and the Australian Council for Educational Research (ACER) worked from 2006 to
2011 with the study’s national research coordinators (NRCs) in the 17 countries to
develop, implement, and report on the findings of this study. Funding for TEDS-M
came from the collaborating countries, IEA, and the United States of America National
Science Foundation. The TEDS-M framework is detailed in Tatto et al. (2008), and the
study’s findings can be found in the TEDS-M international report (Tatto et al., 2012).
This technical report provides detailed information about the procedures developed
and used during the study.2 First, though, a brief account of the key features of the study
is in order.
1 In the case of Canada, four distinct education systems (four provinces) participated in TEDS-M. The term “country” is used in this report to refer to both the countries and parts of countries that participated in the study.
2 This report provides another supporting document for researchers engaged in secondary analysis of the TEDS-M data. It should be used in conjunction with the TEDS-M 2008 User Guide for the International Database (Brese & Tatto, 2012).

THE TEACHER EDUCATION AND DEVELOPMENT STUDY IN MATHEMATICS (TEDS-M) TECHNICAL REPORT14
1.1 Purpose of TEDS-M
TEDS-M was designed to explore not only how teachers are prepared to teach
mathematics in primary and lower-secondary schools but also variation in the nature
and impact of teacher education programs within and across countries. TEDS-M is
the first crossnational study to provide data on the knowledge that future primary and
lower-secondary school teachers acquire during their mathematics teacher education.
Established with the express aim of providing information to inform policy and practice
in teacher preparation, the study collected and analyzed data from representative national
samples of preservice teacher education institutions (and the programs within them)
as well as from their future primary and lower-secondary teachers and their teacher
educators. The key research questions for the study focused on the relationships between
teacher education policies, institutional practices, and future teachers’ mathematics
content knowledge and mathematics pedagogy content knowledge.
1.2 Research Questions
TEDS-M asked three key questions.
• Question 1: What are the policies that support primary and secondary teachers’
achieved level and depth of mathematics and related teaching knowledge? This
question concerned the policies directed at mathematics teachers, including
recruitment, selection, preparation, and certification.
•Question 2: What learning opportunities available to prospective primary and lower-
secondary mathematics teachers allow them to attain such knowledge? TEDS-M
examined the intended and implemented curriculum of teacher education at the
institutional level in each country, as well as the overall opportunities to learn
embedded in this curriculum.
• Question 3: What level and depth of mathematics and related teaching knowledge
have prospective primary and lower-secondary teachers attained by the end of their
preservice teacher education? The study examined, in relation to this question, the
intended and achieved goals of teacher education.
1.3 Data Sources
The first research question was addressed through individual case study country reports,
questionnaires, and interviews issued by the TEDS-M international study centers.
The second and third research questions were answered via surveys of nationally
representative samples of
1. Teacher education institutions and programs;
2. Teacher educators;
3. Future primary school teachers preparing to teach mathematics; and
4. Future lower-secondary school teachers also preparing to teach mathematics.
The future teacher surveys included questions pertaining to respondents’ backgrounds,
opportunities to learn mathematics content and pedagogy, and beliefs about teaching
and learning mathematics. The surveys also included a knowledge assessment of the
mathematics content knowledge and the mathematics pedagogical content knowledge
of both categories of future teachers (primary and lower secondary). The assessments
were implemented just before these individuals were due to graduate from their
preservice teacher education programs.

15OVERVIEw OF TEDS-M
The survey data elicited came from over 15,000 primary and over 9,000 lower-secondary
future teachers and close to 5,000 teacher educators in 500 institutions of preservice
teacher education. These institutions included 451 units preparing future primary
teachers and 339 units preparing future lower-secondary teachers.
1.4 Sampling Procedure
TEDS-M implemented a two-stage sampling design when drawing the national samples
of teacher education institutions/programs, teacher educators, and future teachers. First,
the sampling unit of the IEA Data Processing and Research Center (DPC) in Hamburg,
Germany, worked with the national research centers in each participating country
to select samples representative of the national population of “teacher preparation”
institutions offering education to the target population of future teachers (i.e., those
preparing to teach mathematics at the primary and/or lower-secondary levels). Once
an institution had been selected, all of its programs associated with preparing future
teachers of mathematics were included in the survey. Second, each national center used
the IEA DPC-provided software package WinW3S to select the samples of future teachers
and educators from within these institutions (and programs). These individuals were
then asked to complete the surveys and/or knowledge assessments. All samples were
drawn using randomization.
The countries participating in TEDS-M were required to provide complete national
coverage of their national desired target populations. Some countries found it necessary
to select all teacher preparation institutions in order to reach the IEA sampling standards.
Nearly every country also found it necessary to survey all eligible educators. Likewise,
in the majority of countries, all eligible future teachers in the sampled institutions were
surveyed. However, organizational and/or operational conditions made it difficult for
some national centers to obtain the complete required coverage. Sampling errors were
computed using balanced half-sample repeated replication (or BRR, a well-established
resampling method).
1.5 Content of this Report
The rest of this report presents the technical detail associated with TEDS-M. A brief
description of the content of each chapter follows.
• Chapter 2 summarizes the study’s framework, instruments for data collection, and
guidelines for analyzing and reporting on the data presented in the participating
countries’ national reports.
• Chapter 3 sets out the development of the assessment frameworks for the future
teachers’ mathematics content knowledge and their mathematics pedagogical content
knowledge, as well as the content of the assessments and their scoring guides.
• Chapter 4 describes the conceptual underpinnings and the development of
the TEDS-M survey questionnaires. This chapter also includes definitions and
descriptions of the TEDS-M target populations (institutions/programs, teacher
educators, and future teachers) and of each item included in the questionnaires.
• Chapter 5 delineates the guidelines and rules for national adaptations to the TEDS-M
questionnaires and assessments, as well as for their translation and layout. It also
explains the procedures used to verify the national instruments.
• Chapter 6 details the sampling design.

THE TEACHER EDUCATION AND DEVELOPMENT STUDY IN MATHEMATICS (TEDS-M) TECHNICAL REPORT16
• Chapter 7 covers the implementation and administration of the surveys.
• Chapter 8 focuses on the procedures for quality assurance of the data collection.
• Chapter 9 describes the process of creating, verifying, and “cleaning” the content of
the TEDS-M database.
• Chapter 10 explains the processes used to estimate sampling weights and participation
rates.
• Chapter 11 describes the study’s data-calibration and scale-development processes.
It additionally provides an account of the process used to report the assessment
and questionnaire data. Also covered is the development of anchor points for the
assessments of mathematics knowledge and mathematics pedagogical content
knowledge.
The report’s appendices detail, amongst other matters, the characteristics of the national
samples, set out the guidelines given to the national centers to help them prepare their
country reports, and provide various item statistics and scale characteristics.
References
Brese, F., & Tatto, M. T. (Eds.). (2012). User guide for the TEDS-M international database. Amsterdam,
the Netherlands: International Association for the Evaluation of Educational Achievement (IEA).
Tatto, M. T., Schwille, J., Senk, S. L., Ingvarson, L., Peck, R., & Rowley, G. (2008). Teacher Education
and Development Study in Mathematics (TEDS-M). Policy practice and readiness to teach primary
and secondary mathematics: Conceptual framework. Amsterdam, the Netherlands: International
Association for the Evaluation of Educational Achievement (IEA).
Tatto, M. T., Schwille, J., Senk, S. L., Ingvarson, L., Rowley, G., Peck, R., Bankov, M., Rodríguez, M.,
& Reckase, M. (2012). Policy, practice, and readiness to teach primary and secondary mathematics
in 17 countries: Findings from the IEA Teacher Education and Development Study in Mathematics
(TEDS-M). Amsterdam, the Netherlands: International Association for the Evaluation of
Educational Achievement (IEA).

17THE TEDS-M POLICY CONTEXT STUDY
CHAPTER 2: ThE TEDS-M pOliCy COnTExT STuDy
John Schwille, Michigan State University
Lawrence Ingvarson, Australian Council for Educational Research
Maria Teresa Tatto, Michigan State University
2.1 OverviewThis chapter focuses on the responsibilities, guidelines, instruments, analysis, and reporting associated with the TEDS-M policy context substudy. This study involved an analysis of the national policies relating to mathematics teacher education and of the national contexts in which this area of education takes place. The questions framing this component were these:
• What are the policies that regulate and influence the design and delivery ofmathematics teacher education for elementary and lower-secondary teachers?
• What institutions and programs have been established at the national level toimplement these policies?
• How do countries’ distinctive political, historical, and cultural contexts influencepolicy and practice in mathematics teacher education?
• What are the policies in each country regarding standards for degrees, coverageof topics, certification practices, recruitment, selection, and preparation of future mathematics teachers?
• Howdothesepoliciesvaryacrosscountries?
2.2 Data Collection
2.2.1 Preliminary Country Questionnaires
The policy study was launched with the implementation of two questionnaires—the TEDS-M sampling frame questionnaire and the TEDS-M route questionnaire. Both were completed at the national level by the TEDS-M national research coordinators (NRCs) or other members of the TEDS-M national teams.
2.2.1.1 TEDS-M sampling frame questionnaire
The sampling frame questionnaire (also known as the route questionnaire) asked the NRCs to identify all routes1 leading to teaching primary school or lower-secondary school mathematics in their system of teacher education. The questionnaire also collected a small amount of information on a few very important characteristics of each of these routes. In particular, the questionnaire asked respondents to provide the grades/standards that the graduates of each route are qualified to teach, the types of school for which they are qualified to teach (e.g., academic, vocational, comprehensive), and the total number of graduates from the route for the latest year in which statistics
were available.
1 TEDS-M defined route as the sequence of opportunities to learn that lead future teachers from the end of their general secondary schooling to the point at which they are considered fully qualified to teach in primary or lower-secondary schools. A route is thus a prescribed pathway through which teacher education programs are made available in a given country. Teacher preparation programs within a given route share a number of common features that distinguish them from teacher preparation programs in different routes. Different countries have different sets of routes available (see Tatto et al., 2008, pp. 25–26).

THE TEACHER EDUCATION AND DEVELOPMENT STUDY IN MATHEMATICS (TEDS-M) TECHNICAL REPORT18
The primary purpose of this questionnaire, included in Appendix A of this report, was
to produce information needed for the design of each country’s probability samples.
Once the sampling frame questionnaire had been completed, each country’s NRC, the
international study centers, the IEA Data Processing and Research Center (DPC), and
the sampling referee discussed the routes to be covered by TEDS-M in that country.
The information gathered during this process produced not only what was needed for
sampling, but also information for the policy study. This information was invaluable
in terms of clarifying understanding of how the respective countries organized their
teacher education provision.
2.2.1.2 TEDS-M route questionnaire
Once the routes to be studied by TEDS-M had been identified, each NRC completed
the route questionnaire, designed to provide further information on each route into and
through teacher education. Developed by the international teams and revised by NRCs
before use, the questionnaire required national centers to draw on diverse sources of
information, including interviews and focus groups, as needed. Topics covered were:
• Thelegislative/regulatoryframeworkforteachereducation;
• Characteristicsoftheinstitutions,programs,andsequencesthatmakeuptheroute
(including duration and numbers of institutions);
• Externalexaminationsrequiredandcredentialsawardedduringeachphase;
• Nationallyprescribedorrecommendedcurriculumcontentfortheroutes;
• Natureandamountofschool-basedpracticumexperienceintheroute;
• Levelsatwhichcurriculumdecisionsaremadefortheroute;and
• Qualificationsrequiredofteachingstaffintheroute.
2.2.2 Country Reports from NRCs
How teacher education is organized varies in many ways, both within and across
countries. Some of these differences are major in the sense that they are likely to have
substantial effects on the amount, scope, and nature of the opportunities to learn
offered to future teachers as well as on what they actually learn. In order to understand
more fully the nature of these differences, NRCs were asked to produce a country report
on national policy pertaining to teacher education in general and its organization and
context in particular. These reports were intended to serve two purposes:
1. As a standalone report that, when combined with the reports from all countries, could
be published as one of the TEDS-M international reports (subsequently designated
the TEDS-M encyclopedia);
2. As input for crossnational analyses of teacher education policy, organization, and
context.
Each country report, written by the TEDS-M NRC and/or other members of the
TEDS-M national team, constituted a response to guidelines prepared by the TEDS-M
international teams. Lawrence Ingvarson and John Schwille took the lead in developing
and implementing these guidelines. To make the crossnational report as useful as
possible, the information sought aligned with the information obtained through the
route questionnaire. The latter produced data that were standardized and therefore
directly comparable, whereas the country reports provided the contextual narratives in
a qualitative form that enabled interpretation of the crossnational summary statistics.

19THE TEDS-M POLICY CONTEXT STUDY
The country report guidelines provided an overall outline for the content of the
national reports as well as an indication of what to include under each heading. The
international teams asked that the report include three main parts:
1. Context and organization of teacher education;
2. Quality-assurance arrangements and program requirements; and
3. Funding and reform of teacher education.
Part 1 asked the NRCs to cover the historical, cultural, and social factors that had played
a significant role in shaping their country’s teacher education system. NRCs were also
directed to focus on current policies and issues related to the teacher workforce, the
teacher labor market, and teacher quality, and then to document the structure and
organization of the teacher education system in their country. The Part 2 guidelines
directed NRCs to focus more specifically on quality-assurance policies and program
requirements, as applied to, for example, entry into teacher education and full entry to the
teaching profession. NRCs were also asked to pay specific attention to teacher education
curricula and the requirements of the teaching practicum (field experience). Part 3 of
the country report required the NRCs to cover the financing of teacher education as
well as any current debates on reforming this area of educational provision.
More specific questions as well as additional guidance were provided under all these
headings (reproduced for this volume in Appendix B). In addition, the guidelines called
for clarity about the within-country differences across types of teacher education, levels
(e.g., elementary, lower secondary), states or provinces in federal systems, and public
and private institutions.
A process of consultation with TEDS-M NRCs that involved discussing any matters in the
reports requiring clarification or meriting further elaboration followed. The TEDS-M
team encouraged NRCs to modify the recommended report outline by tailoring their
descriptions and discussion to the distinctive conditions in their respective countries.
Some of the topics covered in the country reports did not elicit the information sought.
For example, countries generally were not able to report the costs of teacher education
with sufficient accuracy and coverage for this information to be used in reporting
TEDS-M findings at the international level. The sections on curricula were generally
more limited and general than had been intended. This outcome may simply have meant
that discourse at the national level on teacher education and the specific requirements
imposed on it are largely framed in ways that apply to all subjects rather than in terms
limited and specific to mathematics teacher education. Due to lack of resources, the
Russian Federation was unable to provide a country report.
2.3 Analysis and Reporting
The data from the two questionnaires and country reports are described and discussed
in three TEDS-M publications: summarily in the main international report (Tatto et al.,
2012), from a crossnational perspective in the international report devoted exclusively
to the policy context study (Ingvarson et al., 2013), and in the TEDS-M encyclopedia,
which contains condensed versions of each country report (Schwille et al., 2013).

THE TEACHER EDUCATION AND DEVELOPMENT STUDY IN MATHEMATICS (TEDS-M) TECHNICAL REPORT20
2.3.1 International Report on the Policy Study
2.3.1.1 TEDS-M organizational terminology
To avoid ambiguity, some special terminology was developed for TEDS-M. For example,
two key terms denote the structure and organization of teacher education: program
and program-type. Program refers to a prescribed course of study leading to a teaching
credential. Program-type refers to groups of programs that share similar purposes and
structural features, such as the credential earned, the type of institution in which it is
offered, whether the program is concurrent or consecutive, the range of school grade
levels for which teachers are prepared, and the duration and degree of specialization.
In other words, program-type refers to the distinctive organizational features that
differentiate the pathways to becoming qualified to teach. For example, in Poland, one
of the teacher education program-types is a relatively new first-cycle Bachelor’s degree
designed to prepare teachers for integrated teaching in Grades 1 to 3. The opportunities
to learn organized for future teachers in this program-type have certain attributes in
common regardless of which university is the provider. Also, some of these common
features differ from the common features of other program-types in Poland, such as
those that prepare mathematics specialists to teach in Grade 4 and above. In contrast,
the word program in TEDS-M refers to the particular form or the way a program-type
is implemented in a particular institution. In short, the terms program and program-
type are meant to replace using the one word, program, which on its own could refer
ambiguously both to teacher education as organized in one particular institution and
to closely related offerings at multiple institutions.
Thus, whatever National Taiwan Normal University (Chinese Taipei) offers to qualify
students in secondary mathematics teacher education is a program, whereas the
program-type “secondary mathematics teacher education” consists of the common
characteristics of all such programs throughout Chinese Taipei. Multiple programs
of the same type in multiple institutions therefore typically make up a program-type.
Exhibit 2.1 lists, country by country, all program-types included in the TEDS-M target
population together with some of their most important organizational features.
Finally, in order to provide a more comparable and sufficiently large grouping of future
teachers across countries, TEDS-M aggregated program-types into program-groups.
2.3.2 Organization and Context of Teacher Education
How the countries participating in TEDS-M organize their teacher education varies
considerably from one country to another. Ongoing changes in countries’ education
systems and their teacher education provision contribute to this diversity, making it
difficult to give definitive descriptions of teacher education that are likely to apply in
the longer term. Nevertheless, the TEDS-M crossnational data indicated that it would
be possible to characterize and compare the organization of teacher education in terms
of a few key parameters. We discuss each of these below, indicating why they were
chosen and what their likely importance is crossnationally. It is important to note that
countries differ greatly with respect to which parameters they determine nationally and
which they leave to teacher education institutions to decide.

21THE TEDS-M POLICY CONTEXT STUDY
Exh
ibit
2.1
: Org
aniz
atio
nal c
hara
cter
isti
cs o
f tea
cher
edu
cati
on p
rogr
am-t
ypes
in T
ED
S-M
Co
untr
y Pr
og
ram
-Typ
e C
on
secu
tive
/ D
urat
ion
G
rad
e
Spec
ializ
atio
n
Pro
gra
m-G
roup
Te
st
C
on
curr
ent
(Yea
rs)
Span
A
dm
inis
tere
d
Bo
tsw
ana
D
iplo
ma
in P
rimar
y Ed
ucat
ion
C
oncu
rren
t 3
1–7
Gen
eral
ist
3: P
rimar
y–lo
wer
sec
onda
ry (G
rade
10
max
.)
Prim
ary
D
iplo
ma
in S
econ
dary
Edu
catio
n,
Con
curr
ent
3 8–
10
Spec
ialis
t 5:
Low
er s
econ
dary
(Gra
de 1
0 m
ax.)
Se
cond
ary
C
olle
ges
of E
duca
tion
Ba
chel
or o
f Se
cond
ary
Educ
atio
n
Con
curr
ent
4 8–
12
Spec
ialis
t 6:
Upp
er s
econ
dary
(up
to G
rade
11
and
Seco
ndar
y
(Sci
ence
), U
nive
rsity
of
Bots
wan
a
ab
ove)
Can
ada
Ont
ario
Pr
imar
y/Ju
nior
C
onse
cutiv
e 4+
1 1–
6 G
ener
alis
t 2:
Prim
ary
(Gra
de 6
max
.)
NA
Ju
nior
/Int
erm
edia
te
Con
secu
tive
4+1
4–10
G
ener
alis
t an
d
Bo
th 3
(prim
ary–
low
er s
econ
dary
, Gra
de 1
0 m
ax.)
N
A
spec
ialis
t an
d 5
(low
er s
econ
dary
, Gra
de 1
0 m
ax.)
In
term
edia
te/S
enio
r C
onse
cutiv
e 4+
1 7–
12
Spec
ialis
t (in
6:
Upp
er s
econ
dary
(up
to G
rade
11
and
abov
e)
NA
tw
o su
bjec
ts)
Qué
bec
Prim
ary
Con
curr
ent
4 1–
6 G
ener
alis
t 2:
Prim
ary
(Gra
de 6
max
.)
NA
Se
cond
ary
Con
curr
ent
4 7–
11
Spec
ialis
t 6:
Upp
er s
econ
dary
(up
to G
rade
11
and
abov
e)
NA
Nov
a Sc
otia
Pr
imar
y C
onse
cutiv
e 4+
2 1–
6 G
ener
alis
t 2:
Prim
ary
(Gra
de 6
max
.)
NA
Se
cond
ary
(Jun
ior
and
Seni
or)
Con
secu
tive
4+2
7–12
Sp
ecia
list
6: U
pper
sec
onda
ry (u
p to
Gra
de 1
1 an
d ab
ove)
N
A
New
foun
dlan
d-
Prim
ary/
Elem
enta
ry
Con
curr
ent
5 1–
6 G
ener
alis
t 2:
Prim
ary
(Gra
de 6
max
.)
NA
Labr
ador
In
term
edia
te/S
econ
dary
C
onse
cutiv
e 4+
1 7–
12
Spec
ialis
t 6:
Upp
er s
econ
dary
(up
to G
rade
11
and
abov
e)
NA
Ch
ile
Gen
eral
ist
C
oncu
rren
t 4
1–8
Gen
eral
ist
Bo
th 3
(prim
ary–
low
er s
econ
dary
, Gra
de 1
0 m
ax.)
Bo
th
an
d 5
(low
er s
econ
dary
, Gra
de 1
0 m
ax.)
G
ener
alis
t w
ith F
urth
er M
athe
mat
ics
C
oncu
rren
t 4
5–8
Gen
eral
ist
5: L
ower
sec
onda
ry (G
rade
10
max
.)
Seco
ndar
y
Ed
ucat
ion
Ch
ines
e Ta
ipei
El
emen
tary
Tea
cher
Edu
catio
n
Con
curr
ent
4.5
1–6
Gen
eral
ist
2: P
rimar
y (G
rade
6 m
ax.)
Pr
imar
y
Se
cond
ary
Mat
hem
atic
s Te
ache
r
Con
curr
ent
4.5
7–12
Sp
ecia
list
6: U
pper
sec
onda
ry (u
p to
Gra
de 1
1 an
d ab
ove)
Se
cond
ary
Educ
atio
n
Geo
rgia
Ba
chel
or o
f Pe
dago
gy
Con
curr
ent
4 1–
4 G
ener
alis
t 1:
Low
er p
rimar
y (G
rade
4 m
ax.)
Pr
imar
y
Ba
chel
or o
f A
rts
in M
athe
mat
ics
Con
curr
ent
3 5–
12
Spec
ialis
t 6:
Upp
er s
econ
dary
(up
to G
rade
11
and
abov
e)
Seco
ndar
y
M
aste
r of
Sci
ence
in M
athe
mat
ics
Con
curr
ent
5 5–
12
Spec
ialis
t 6:
Upp
er s
econ
dary
(up
to G
rade
11
and
abov
e)
Seco
ndar
y
M
aste
r of
Sci
ence
in M
athe
mat
ics
Con
secu
tive
5 5–
12
Spec
ialis
t 6:
Upp
er s
econ
dary
(up
to G
rade
11
and
abov
e)
Seco
ndar
y

THE TEACHER EDUCATION AND DEVELOPMENT STUDY IN MATHEMATICS (TEDS-M) TECHNICAL REPORT22
Exh
ibit
2.1
: Org
aniz
atio
nal c
hara
cter
isti
cs o
f tea
cher
edu
cati
on p
rogr
am-t
ypes
in T
ED
S-M
(co
ntd.
)
Co
untr
y Pr
og
ram
-Typ
e C
on
secu
tive
/ D
urat
ion
G
rad
e
Spec
ializ
atio
n
Pro
gra
m-G
roup
Te
st
C
on
curr
ent
(Yea
rs)
Span
A
dm
inis
tere
d
Ger
man
y
Teac
hers
for
Gra
des
1–4
with
out
H
ybrid
of
the
two
3.5+
2.0
1–4
Gen
eral
ist
1: L
ower
prim
ary
(Gra
de 4
max
.)
Prim
ary
Mat
hem
atic
s as
a T
each
ing
Subj
ect
(Typ
e 1B
)
Te
ache
rs o
f G
rade
s 1–
9/10
with
H
ybrid
of
the
two
3.5+
2.0
1–9/
10
Spec
ialis
t (in
B
oth
4 (p
rimar
y m
athe
mat
ics
spec
ialis
t)
Both
Mat
hem
atic
s as
a T
each
ing
Subj
ect
two
subj
ects
) an
d 5
(low
er s
econ
dary
, Gra
de 1
0 m
ax.)
(Typ
e 2A
)
Te
ache
rs fo
r G
rade
s 1–
10 w
ithou
t
Hyb
rid o
f th
e tw
o 3.
5+2.
0 1–
4 G
ener
alis
t 1:
Low
er p
rimar
y (G
rade
4 m
ax.)
Pr
imar
y
M
athe
mat
ics
as a
Tea
chin
g Su
bjec
t
(T
ype
2B)
Te
ache
rs fo
r G
rade
s 5/
7–9/
10 w
ith
Hyb
rid o
f th
e tw
o 3.
5 +2
.0
5/7–
9/10
Sp
ecia
list
(in
5: L
ower
sec
onda
ry (G
rade
10
max
.)
Seco
ndar
y
M
athe
mat
ics
as a
Tea
chin
g Su
bjec
t
two
subj
ects
)
(Typ
e 3)
Te
ache
rs fo
r G
rade
s 5/
7–12
/13
with
H
ybrid
of
the
two
4.5+
2.0
5/7–
12/1
3 Sp
ecia
list
(in
6: U
pper
sec
onda
ry (u
p to
Gra
de 1
1 an
d ab
ove)
Se
cond
ary
Mat
hem
atic
s as
a T
each
ing
Subj
ect
two
subj
ects
)
(Typ
e 4)
Mal
aysi
a Ba
chel
or o
f Ed
ucat
ion,
Prim
ary
C
oncu
rren
t 4
1–6
Spec
ialis
t (in
4:
Prim
ary
mat
hem
atic
s sp
ecia
list
Prim
ary
two
subj
ects
)
D
iplo
ma
of E
duca
tion
(Mat
hem
atic
s)
Con
curr
ent
4+1
1–6
Spec
ialis
t (in
4:
Prim
ary
mat
hem
atic
s sp
ecia
list
Prim
ary
two
subj
ects
)
M
alay
sian
Dip
lom
a of
Tea
chin
g C
oncu
rren
t 3
1–6
Spec
ialis
t (in
4:
Prim
ary
mat
hem
atic
s sp
ecia
list
Prim
ary
(Mat
hem
atic
s)
tw
o su
bjec
ts)
Ba
chel
or o
f Ed
ucat
ion
(Mat
hem
atic
s),
C
oncu
rren
t 4
7–13
Sp
ecia
list
(in
6: U
pper
sec
onda
ry (u
p to
Gra
de 1
1 an
d ab
ove)
Se
cond
ary
Seco
ndar
y
two
subj
ects
)
Ba
chel
or o
f Sc
ienc
e in
Edu
catio
n
Con
curr
ent
4 7–
13
Spec
ialis
t (in
6:
Upp
er s
econ
dary
(up
to G
rade
11
and
abov
e)
Seco
ndar
y
(M
athe
mat
ics)
, Sec
onda
ry
tw
o su
bjec
ts)
No
rway
G
ener
al T
each
er E
duca
tion
(ALU
) C
oncu
rren
t 4
1–10
G
ener
alis
t w
ith
Bo
th 3
(Prim
ary–
low
er s
econ
dary
, Gra
de 1
0 m
ax.)
Bo
th
with
Mat
hem
atic
s O
ptio
n
ex
tra
an
d 5
(low
er s
econ
dary
, Gra
de 1
0 m
ax.)
mat
hem
atic
s
G
ener
al T
each
er E
duca
tion
(ALU
) C
oncu
rren
t 4
1–10
G
ener
alis
t B
oth
3 (p
rimar
y–lo
wer
sec
onda
ry, G
rade
10
max
.)
Both
w
ithou
t M
athe
mat
ics
Opt
ion
an
d 5
(low
er s
econ
dary
, Gra
de 1
0 m
ax.)
Te
ache
r Ed
ucat
ion
Prog
ram
(PPU
) C
onse
cutiv
e 3+
1 (o
r 5+1
) 8–
13
Spec
ialis
t (in
6:
Upp
er s
econ
dary
(up
to G
rade
11
and
abov
e)
Seco
ndar
y
tw
o su
bjec
ts)
M
aste
r of
Sci
ence
C
oncu
rren
t 5
8–13
Sp
ecia
list
(in
6: U
pper
sec
onda
ry (u
p to
Gra
de 1
1 an
d ab
ove)
Se
cond
ary
two
subj
ects
)

23THE TEDS-M POLICY CONTEXT STUDY
Exh
ibit
2.1
: Org
aniz
atio
nal c
hara
cter
isti
cs o
f tea
cher
edu
cati
on p
rogr
am-t
ypes
in T
ED
S-M
(co
ntd.
)
Co
untr
y Pr
og
ram
-Typ
e C
on
secu
tive
/ D
urat
ion
G
rad
e
Spec
ializ
atio
n
Pro
gra
m-G
roup
Te
st
C
on
curr
ent
(Yea
rs)
Span
A
dm
inis
tere
d
Om
an
Bach
elor
of
Educ
atio
n, U
nive
rsity
C
oncu
rren
t 5
5–12
Sp
ecia
list
6: U
pper
sec
onda
ry (u
p to
Gra
de 1
1 an
d ab
ove)
Se
cond
ary
Ed
ucat
iona
l Dip
lom
a af
ter
Bach
elor
C
onse
cutiv
e 5+
1 5–
12
Spec
ialis
t 6:
Upp
er s
econ
dary
(up
to G
rade
11
and
abov
e)
Seco
ndar
y
of
Sci
ence
Ba
chel
or o
f Ed
ucat
ion,
Col
lege
s
Con
curr
ent
4 5–
12
Spec
ialis
t 6:
Upp
er s
econ
dary
(up
to G
rade
11
and
abov
e)
Seco
ndar
y
of
Edu
catio
n
Phili
pp
ines
Ba
chel
or in
Ele
men
tary
Edu
catio
n
Con
curr
ent
4 1–
6 G
ener
alis
t 2:
Prim
ary
(Gra
de 6
max
.)
Prim
ary
Ba
chel
or in
Sec
onda
ry E
duca
tion
C
oncu
rren
t 4
7–10
Sp
ecia
list
5: L
ower
sec
onda
ry (G
rade
10
max
.)
Seco
ndar
y
Pola
nd
Ba
chel
or o
f Pe
dago
gy In
tegr
ated
C
oncu
rren
t 3
1–3
Gen
eral
ist
1: L
ower
prim
ary
(Gra
de 4
max
.)
Prim
ary
Teac
hing
, Firs
t C
ycle
M
aste
r of
Art
s In
tegr
ated
Tea
chin
g,
Con
curr
ent
5 1–
3 G
ener
alis
t 1:
Low
er p
rimar
y (G
rade
4 m
ax.)
Pr
imar
y
Lo
ng C
ycle
Ba
chel
or o
f A
rts
in M
athe
mat
ics,
C
oncu
rren
t 3
4–9
Spec
ialis
t B
oth
4 (p
rimar
y m
athe
mat
ics
spec
ialis
t)
Both
Fi
rst
Cyc
le
and
5 (l
ower
sec
onda
ry, G
rade
10
max
.)
M
aste
r of
Art
s in
Mat
hem
atic
s,
Con
curr
ent
5 4–
12
Spec
ialis
t B
oth
4 (p
rimar
y m
athe
mat
ics
spec
ialis
t)
Both
Lo
ng C
ycle
an
d 6
(upp
er s
econ
dary
, up
to G
rade
11
and
abov
e)
Ru
ssia
n
Prim
ary
Teac
her
Educ
atio
n
Con
curr
ent
5 1–
4 G
ener
alis
t 1:
Low
er p
rimar
y (G
rade
4 m
ax.)
Pr
imar
y
Fed
erat
ion
Te
ache
r of
Mat
hem
atic
s
Con
curr
ent
5 5–
11
Spec
ialis
t 6:
Upp
er s
econ
dary
(up
to G
rade
11
and
abov
e)
Seco
ndar
y
Sin
gap
ore
Po
st-G
radu
ate
Dip
lom
a in
Edu
catio
n,
Con
secu
tive
4+1
1–6
Gen
eral
ist
2: P
rimar
y (G
rade
6 m
ax.)
Pr
imar
y
Pr
imar
y O
ptio
n C
Ba
chel
or o
f A
rts
in E
duca
tion,
Prim
ary
Con
curr
ent
4 1–
6 G
ener
alis
t 2:
Prim
ary
(Gra
de 6
max
.)
Prim
ary
Ba
chel
or o
f Sc
ienc
e in
Edu
catio
n,
C
oncu
rren
t 4
1–6
Gen
eral
ist
2: P
rimar
y (G
rade
6 m
ax.)
Pr
imar
y
Pr
imar
y
D
iplo
ma
of E
duca
tion,
Prim
ary
C
oncu
rren
t 2
1–6
Spec
ialis
t (in
4:
Prim
ary
mat
hem
atic
s sp
ecia
list
Prim
ary
Opt
ion
A
tw
o su
bjec
ts)
D
iplo
ma
of E
duca
tion,
Prim
ary
C
oncu
rren
t 2
1–6
Gen
eral
ist
2: P
rimar
y (G
rade
6 m
ax.)
Pr
imar
y
O
ptio
n C
Po
st-G
radu
ate
Dip
lom
a in
Edu
catio
n,
Con
secu
tive
4+1
1–6
Spec
ialis
t 4:
Prim
ary
mat
hem
atic
s sp
ecia
list
Prim
ary
Prim
ary
Opt
ion
A
Po
st-G
radu
ate
Dip
lom
a in
Edu
catio
n,
Con
secu
tive
4+1
7–8
Spec
ialis
t (in
5:
Low
er s
econ
dary
(Gra
de 1
0 m
ax.)
Se
cond
ary
Low
er S
econ
dary
two
subj
ects
)
Po
st-G
radu
ate
Dip
lom
a in
Edu
catio
n,
Con
secu
tive
4+1
7–12
Sp
ecia
list
(in
6: U
pper
sec
onda
ry (u
p to
Gra
de 1
1 an
d ab
ove)
Se
cond
ary
Seco
ndar
y
two
subj
ects
)

THE TEACHER EDUCATION AND DEVELOPMENT STUDY IN MATHEMATICS (TEDS-M) TECHNICAL REPORT24
Spai
n
Teac
her
of P
rimar
y Ed
ucat
ion
C
oncu
rren
t 3
1–6
Gen
eral
ist
2: P
rimar
y (G
rade
6 m
ax.)
Pr
imar
y
Swit
zerl
and
Te
ache
rs fo
r G
rade
s 1–
2/3
C
oncu
rren
t 3
1–2/
3 G
ener
alis
t 1:
Low
er p
rimar
y (G
rade
4 m
ax.)
Pr
imar
y
Te
ache
rs fo
r Pr
imar
y Sc
hool
C
oncu
rren
t 3
1–6
Gen
eral
ist
2: P
rimar
y (G
rade
6 m
ax.)
Pr
imar
y
(G
rade
s 1–
6)
Te
ache
rs fo
r Pr
imar
y Sc
hool
C
oncu
rren
t 3
3–6
Gen
eral
ist
2: P
rimar
y (G
rade
6 m
ax.)
Pr
imar
y
(G
rade
s 3–
6)
Te
ache
rs fo
r Se
cond
ary
Scho
ol
Con
curr
ent
4.5
7–9
Gen
eral
ist,
5:
Low
er s
econ
dary
(Gra
de 1
0 m
ax.)
Se
cond
ary
(Gra
des
7–9)
som
e
spec
ializ
atio
n
Thai
lan
d
Bach
elor
of
Educ
atio
n
Con
curr
ent
5 1–
12
Spec
ialis
t B
oth
4 (
prim
ary
mat
hem
atic
s sp
ecia
list)
Bo
th
an
d 6
(upp
er s
econ
dary
, up
to G
rade
11
and
abov
e)
G
radu
ate
Dip
lom
a in
Tea
chin
g
Con
secu
tive
4+1
1–12
Sp
ecia
list
Bo
th 4
(prim
ary
mat
hem
atic
s sp
ecia
list)
Bo
th
Prof
essi
on
and
6 (u
pper
sec
onda
ry, u
p to
Gra
de 1
1 an
d ab
ove)
Un
ited
Sta
tes
Prim
ary
Con
curr
ent
C
oncu
rren
t 4
1–3/
4/5
Gen
eral
ist
2: P
rimar
y (G
rade
6 m
ax.)
Pr
imar
y
Pr
imar
y C
onse
cutiv
e
Con
secu
tive
4+1
1–3/
4/5
Gen
eral
ist
2: P
rimar
y (G
rade
6 m
ax.)
Pr
imar
y
Pr
imar
y +
Seco
ndar
y C
oncu
rren
t
Con
curr
ent
4 4/
5–8/
9 Sp
ecia
list
Bo
th 4
(prim
ary
mat
hem
atic
s sp
ecia
list)
Bo
th
an
d 5
(low
er s
econ
dary
, Gra
de 1
0 m
ax.)
Pr
imar
y +
Seco
ndar
y C
onse
cutiv
e
Con
secu
tive
4+1
4/5–
8/9
Spec
ialis
t B
oth
4 (p
rimar
y m
athe
mat
ics
spec
ialis
t)
Both
and
5 (l
ower
sec
onda
ry, G
rade
10
max
.)
Se
cond
ary
Con
curr
ent
C
oncu
rren
t 4
6/7–
12
Spec
ialis
t 6:
Upp
er s
econ
dary
(up
to G
rade
11
and
abov
e)
Seco
ndar
y
Se
cond
ary
Con
secu
tive
C
onse
cutiv
e 4+
1 6/
7–12
Sp
ecia
list
6: U
pper
sec
onda
ry (u
p to
Gra
de 1
1 an
d ab
ove)
Se
cond
ary
No
te: N
A =
not
app
licab
le.
Exh
ibit
2.1
: Org
aniz
atio
nal c
hara
cter
isti
cs o
f tea
cher
edu
cati
on p
rogr
am-t
ypes
in T
ED
S-M
(co
ntd.
)
Co
untr
y Pr
og
ram
-Typ
e C
on
secu
tive
/ D
urat
ion
G
rad
e
Spec
ializ
atio
n
Pro
gra
m-G
roup
Te
st
C
on
curr
ent
(Yea
rs)
Span
A
dm
inis
tere
d
Sou
rce:
Tat
to e
t al
. (20
12),
pp.
29–
32.

25THE TEDS-M POLICY CONTEXT STUDY
2.3.2.1 Key organizational parameters
2.3.2.1.1 Concurrent and consecutive program-types
The distinction between concurrent and consecutive program-types is one of the ways
to distinguish the organization of teacher education in TEDS-M, both within and
across countries. Concurrent program-types grant future teachers a single credential
for studies in subject-matter content, pedagogy, and other courses in education. All
of this learning happens simultaneously (concurrently) during the first period of
postsecondary education. In contrast, consecutive teacher education program-types
require completion of two phases of postsecondary education: first, a university degree
with specialization in the subject-matter to be taught, followed by a separate second
phase of study focused primarily on pedagogy and practicum.
The only TEDS-M country for which this distinction did not closely apply was
Germany, where preparation for teaching is spread across two phases. The first takes
place in universities. The second—practical—phase occurs in special institutions within
each federal state and under the jurisdiction of that state. In addition to coursework
in academic subjects, the first phase includes classes in subject-specific pedagogy and
general pedagogy. During the second phase, future teachers pursue further study while
taking full responsibility for teaching assigned classes in primary or secondary schools.
Although the distinction between concurrent and consecutive program-types is widely
used, few systematic crossnational studies have investigated how the two differ in regard
to curricula and practices, except for the fact that consecutive tend to place all or most
of their subject-matter content early in the program and their pedagogical content
and field experience toward its end. The TEDS-M findings have narrowed that gap in
understanding.
A third type of program, namely, the school-based program, is now widely available
in some countries, such as the United States, and runs in addition to the consecutive
and concurrent program-types. The school-based type of program takes more of an
apprenticeship approach to learning to teach. It is not, however, represented in the
TEDS-M database.
2.3.2.1.2 School grade levels for which a program-type prepares teachers
One of the most obvious ways in which to classify teacher education program-types is
in terms of whether they prepare teachers for primary or secondary schools. However,
it quickly became apparent in TEDS-M that this distinction would be an over-
simplification. The terms primary and secondary do not mean the same thing from
country to country.
For example, a number of countries, such as Chinese Taipei, Georgia, and Malaysia,
have primary programs that prepare teachers to teach from Grades 1 to 6 because
these grades constitute primary school in those countries. Other countries, such as
Botswana, Chile, and Thailand, have program-types that also start at kindergarten or
Grade 1 and extend up to Grade 7, Grade 8, and even Grade 12, respectively. At the
other extreme, primary school in most German states is limited to Grades 1 to 4. Chile
and Norway have only one type of program for preparing teachers for primary and
lower-secondary schools and so make little or no distinction between the preparation
of teachers for the early grades and for the middle grades. Their approach is radically
different from the approach in countries such as Chinese Taipei and Germany where
there is considerable differentiation.

THE TEACHER EDUCATION AND DEVELOPMENT STUDY IN MATHEMATICS (TEDS-M) TECHNICAL REPORT26
Grade spread is another useful indicator of policy decisions (albeit shaped by tradition
and history) about the extent to which the teacher workforce should be unified in its
knowledge base and practice. As Exhibit 2.1 shows, these differences in grade span were
reflectedinthedecisionsthattheTEDS-Mresearchersmadeaboutwhichinstruments
to administer for each program-type.
2.3.2.1.3 Program-type duration
The TEDS-M programs preparing primary teachers are usually four years long, but
there is some variation. Exhibit 2.1 shows the duration of the countries’ single-phase
concurrent program-types. It also shows the duration of the first phase and second
phase of countries’ consecutive program-types (e.g., four years for Phase 1 and one
year for Phase 2). Programs preparing secondary teachers also show some variation.
Concurrent program-types commonly require four years of study. The first phase of
consecutive program-types typically lasts four years and the second phase one year.
Germany, where the first phase usually lasts three and a half or four and a half years and
the second phase lasts two years, is again the exception.
As is the case with grade span, program duration is a key aspect of higher education
policy. According to the literature, variation in the duration of teacher education
within and across countries is striking, ranging in the sources consulted from a few
months to eight years (Dembélé, 2005; Lewin & Stuart, 2003; OECD, 2005, Stuart &
Tatto, 2000; Tatto, 1997a, 1997b, 2008; Tatto, Lehman, & Novotná, 2010). This variation
is due to various conditions, including economic constraints, the relationship between
the demand for and the supply of teachers, the education level of available applicants
to teacher education, and (in particular) the amount and quality of those applicants’
subject-based and pedagogical-based content knowledge.
2.3.2.1.4 Subject-matter specialization
Program-types can also be classified according to whether they prepare generalist
teachers or specialist teachers of mathematics. In TEDS-M, the primary school teachers
in most of the participating countries were being prepared as generalists destined to
teach most if not all of the core subjects in the school curriculum. However, some of
the countries were also preparing specialist teachers of mathematics to teach below
Grade 6.
Specialization tended to be the norm in lower-secondary schools across the TEDS-M
countries, although in most cases this meant teaching not one but two main subjects,
such as mathematics and science. Without keeping the degree of specialization in
mind, it would be misleading to compare programs that differ in this respect. A future
teacher being prepared to specialize in teaching mathematics is likely to learn more
mathematics content knowledge than a future teacher being prepared to teach more
than one subject.
However, the differences between being prepared to teach one, two, three, or more
teaching subjects are not necessarily clear-cut. In some of the country reports, authors
spoke of future teachers studying aspects of a second or third subject but were not
explicit about whether and under what conditions these students would be able to teach
those subjects. TEDS-M addressed this problem by classifying each program-type in
terms of primarily teaching only one subject, primarily teaching only two subjects
(mathematics and one other), and primarily teaching three or more subjects (i.e., the
generalist).

27THE TEDS-M POLICY CONTEXT STUDY
Also, in some countries, practicing teachers teach “out of field,” that is, in a subject for
which they are neither adequately prepared nor qualified according to the countries’
official expectations of teachers of those subjects. In this and other respects, the state
of preparation among the future teachers surveyed by TEDS-M may be very different
from the situation among practicing teachers. Exhibit 2.1 above shows the degree of
specialization in each of the program-types included in TEDS-M.
2.3.2.1.5 Relative size of different program-types
Paying attention to the relative size of program-types is essential to understanding the
structure of teacher education in any one country. Nonconsideration of this matter
could easily lead to the assumption that some programs are bigger than they are in
reality, and also that they are less marginal than they actually are in meeting the demand
for new teachers.
The country by country graphs in the summary chapter (Chapter 2) of the TEDS-M
policy report illustrate the extent to which the number of future teachers in the TEDS-M
target population varied across program-types. For each country, the graph indicated
which program-types were producing the most graduates and which the fewest (for an
example, see the right-hand graph in Exhibit 2.2 on the next page). This estimate of
program-type enrollments in the last year of teacher education was based on the sum
of weights from the achieved TEDS-M sample.
These sums of weight were unbiased estimates of the actual total number of future
teachers in the target population broken down by program-type. The estimates were
necessary because countries rarely collect and maintain this type of data, even at national
levels, and especially in the case of teacher education for lower-secondary schools where
interest for TEDS-M lay not in the total number of future teachers preparing to become
lower-secondary teachers, but in those future teachers preparing to teach mathematics
as their only or as one of their two main teaching subjects. National educational statistics
are also not ordinarily maintained on numbers of secondary future teachers by subject-
matter specialization.
2.3.2.2 Usefulness of key parameters in terms of characterizing teacher education at the national level
Examination of the key parameters described in this chapter indicated that classifying
program-types into concurrent versus consecutive and elementary versus secondary
greatly oversimplified the organizational characteristics of teacher education at national
levels. Our more precise crossnational analysis of organizational features suggested that
some of these characteristics, including those examined in depth in other TEDS-M
reports, do have a major impact on the opportunities to learn and outcomes associated
with teacher education. One hypothesis developed during the policy study was that
three of the variables (highest grade level for which future teachers are prepared, the
duration of the program-type, and the greatest degree of subject-matter specialization)
are those especially powerful in shaping opportunities to learn and outcomes.
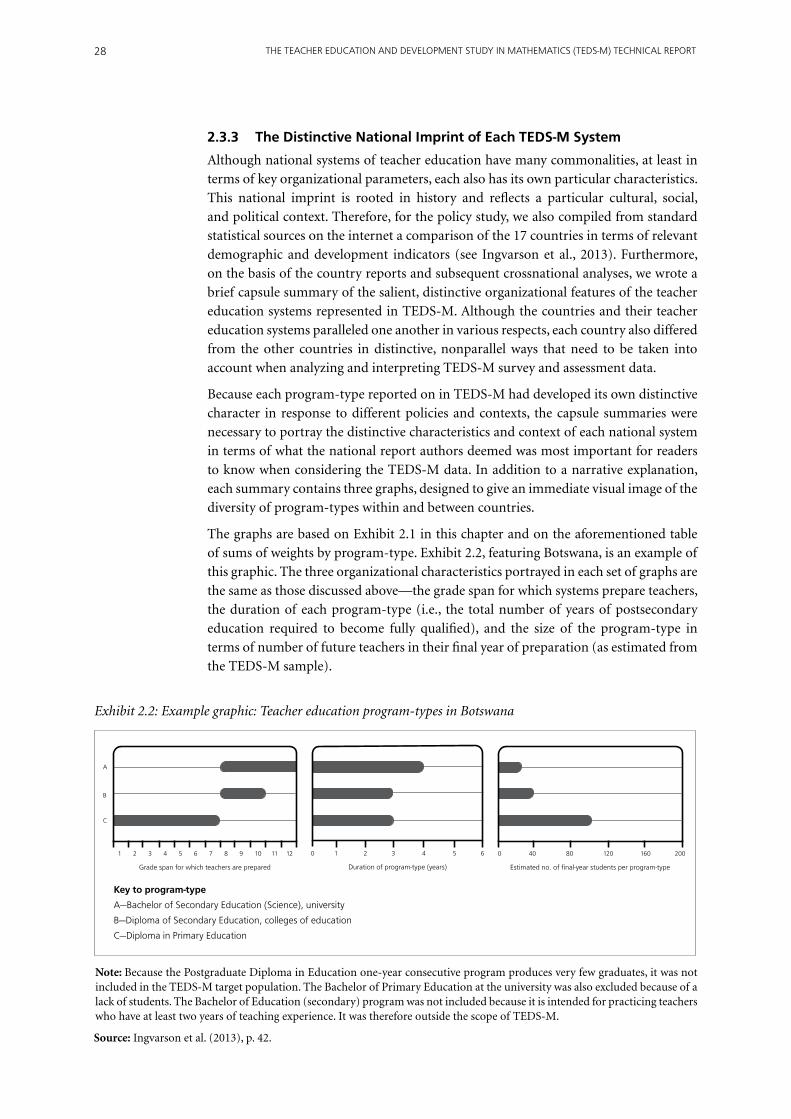
THE TEACHER EDUCATION AND DEVELOPMENT STUDY IN MATHEMATICS (TEDS-M) TECHNICAL REPORT28
2.3.3 The Distinctive National Imprint of Each TEDS-M System
Although national systems of teacher education have many commonalities, at least in
terms of key organizational parameters, each also has its own particular characteristics.
This national imprint is rooted in history and reflects a particular cultural, social,
and political context. Therefore, for the policy study, we also compiled from standard
statistical sources on the internet a comparison of the 17 countries in terms of relevant
demographic and development indicators (see Ingvarson et al., 2013). Furthermore,
on the basis of the country reports and subsequent crossnational analyses, we wrote a
brief capsule summary of the salient, distinctive organizational features of the teacher
education systems represented in TEDS-M. Although the countries and their teacher
education systems paralleled one another in various respects, each country also differed
from the other countries in distinctive, nonparallel ways that need to be taken into
account when analyzing and interpreting TEDS-M survey and assessment data.
Because each program-type reported on in TEDS-M had developed its own distinctive
character in response to different policies and contexts, the capsule summaries were
necessary to portray the distinctive characteristics and context of each national system
in terms of what the national report authors deemed was most important for readers
to know when considering the TEDS-M data. In addition to a narrative explanation,
each summary contains three graphs, designed to give an immediate visual image of the
diversity of program-types within and between countries.
The graphs are based on Exhibit 2.1 in this chapter and on the aforementioned table
of sums of weights by program-type. Exhibit 2.2, featuring Botswana, is an example of
this graphic. The three organizational characteristics portrayed in each set of graphs are
the same as those discussed above—the grade span for which systems prepare teachers,
the duration of each program-type (i.e., the total number of years of postsecondary
education required to become fully qualified), and the size of the program-type in
terms of number of future teachers in their final year of preparation (as estimated from
the TEDS-M sample).
Exhibit 2.2: Example graphic: Teacher education program-types in Botswana
note: Because the Postgraduate Diploma in Education one-year consecutive program produces very few graduates, it was not included in the TEDS-M target population. The Bachelor of Primary Education at the university was also excluded because of a lack of students. The Bachelor of Education (secondary) program was not included because it is intended for practicing teachers who have at least two years of teaching experience. It was therefore outside the scope of TEDS-M.
1 2 3 4 5 6 7 8 9 10 11 12
A
B
C
Grade span for which teachers are prepared
0 1 2 3 4 5 6
Duration of program-type (years)
0 40 80 120 160 200
Estimated no. of final-year students per program-type
Key to program-type
A—Bachelor of Secondary Education (Science), university
B—Diploma of Secondary Education, colleges of education
C—Diploma in Primary Education
Source: Ingvarson et al. (2013), p. 42.

29THE TEDS-M POLICY CONTEXT STUDY
The narrative accompanying this graphic summarizes the distinctive national context
information required for understanding these program-types and for interpreting the
survey and assessment data presented in other TEDS-M reports. These characteristics
are discussed under three headings:
1. Institutions and governance;
2. Program-types and credentials; and
3. Curriculum content, assessment, and organization.
2.3.4 Crossnational Comparison of Quality-Assurance Policies
International interest in policies that promote teacher quality has increased markedly
inrecentyears.Withmountingevidencethatthemajorin-schoolinfluenceonstudent
achievement is teachers’ knowledge and skill, policymakers have been giving closer
attention to strategies likely to recruit, prepare, and retain the best possible teachers.
Each country deals with these issues in its own way. Some countries have specific policies
to ensure that teaching presents an attractive career option in comparison with other
professions. Some have national agencies with responsibility for selecting entrants to
teacher education programs. Others leave the selection to individual universities and
other teacher education providers.
Part 2 of the international report on the policy study documents the quality-assurance
arrangements operating in the countries that participated in TEDS-M. It addresses the
following questions:
• Recruitment and selection: Who decides, and how, which students gain entry to teacher
education programs? What policies and agencies are in place to monitor and assure
the quality of entrants to teacher education? What are the standards or requirements
for eligibility to enter programs for preparing teachers of mathematics? How do the
academic standards of entrants to teacher education compare with standards for
entry to most other university or professional preparation programs?
• Accreditation of teacher education institutions: Who decides, and how, which
institutions are allowed to train teachers? What policies and agencies are in place
to monitor and assure the quality of teacher education institutions and programs?
What procedures are used to assess and accredit the quality of teacher education
institutions or programs? What requirements are laid down for the curriculum, field
experience (practicum in schools), and staffing in teacher education institutions and
programs?
• Entry to the teaching profession: Who decides, and how, which students meet the
requirements for full entry to the profession? What policies and agencies are in place
to monitor and assure that graduates are competent and qualified to gain certification
and full entry to the profession?
The last part of the international policy report brings together the findings generated
by these questions and summarizes arrangements for assuring the quality of teacher
education programs. The TEDS-M international research teams rated each type
of policy in terms of its strength (i.e., a weak through to a strong policy) and then
combined these ratings in an overall rating. This second group of ratings provided the
basis for a preliminary investigation into the relationship between quality-assurance
arrangements and the quality of graduates from teacher education programs. At this
level, the relationship was found to be strongly positive.

THE TEACHER EDUCATION AND DEVELOPMENT STUDY IN MATHEMATICS (TEDS-M) TECHNICAL REPORT30
References
Dembélé, M. (2005). A study of primary teacher education and management in French speaking West
Africa: Comparative synthesis report. Washington, DC: World Bank.
Ingvarson, L., Schwille, J., Tatto, M. T., Rowley, G., Peck, R., & Senk, S. L. (2013). An analysis of teacher
education context, structure, and quality-assurance arrangements in TEDS-M countries: Findings
from the IEA Teacher Education and Development Study in Mathematics (TEDS-M). Amsterdam,
the Netherlands: International Association for the Evaluation of Educational Achievement (IEA).
Lewin, K. M., & Stuart, J. S. (2003). Researching teacher education: New perspectives on practice,
performance and policy: Multi-Site Teacher Education Research Project (MUSTER) synthesis report.
London, UK: Department for International Development.
Organisation for Economic Co-operation and Development (OECD). (2005). Teachers matter:
Attracting, developing and retaining effective teachers. Paris, France: Author.
Schwille, J., Ingvarson, I., & Holdgreve-Resendez, R. (2013). TEDS-M encyclopedia: A guide to teacher
education context, structure, and quality assurance in 17 countries. Findings from the IEA Teacher
Education and Development Study in Mathematics. Amsterdam, the Netherlands: International
Association for the Evaluation of Educational Achievement (IEA).
Stuart, J., & Tatto, M. T. (2000). Designs for initial teacher preparation programs: An international
view. International Journal of Educational Research, 33, 493–514.
Tatto, M. T. (1997a). Limits and constraints to effective teacher education. In W. Cummings & N.
McGinn (Eds.), International handbook of education and development: Preparing schools, students
and nations for the twenty-first century (pp. 213–230). Oxford, UK: Pergamon.
Tatto, M. T. (1997b). The reach and potential of teacher education. In W. Cummings & N. McGinn
(Eds.), International handbook of education and development: Preparing schools, students and nations
for the twenty-first century (pp. 795–812). Oxford, UK: Pergamon.
Tatto, M. T. (2008). Teacher policy: A framework for comparative analysis. Prospects: Quarterly
Review of Comparative Education, 38, 487–508.
Tatto, M. T., Lehman, S., & Novotná, J. (2010). The organization of the mathematics preparation
and development of teachers: A report from the ICMI Study 15. Journal of Mathematics Teacher
Education, 13, 313–324.
Tatto, M. T., Schwille, J., Senk, S. L., Ingvarson, L., Peck, R., & Rowley, G. (2008). Teacher Education
and Development Study in Mathematics (TEDS-M): Conceptual framework. Amsterdam, the
Netherlands: International Association for the Evaluation of Educational Achievement (IEA).
Tatto, M. T. Schwille, J., Senk, S. L. Ingvarson, L., Rowley G., Peck, R., Bankov, K., Rodríguez, M.,
& Reckase, M. (2012). Policy, practice, and readiness to teach primary and secondary mathematics
in 17 countries: Findings from the IEA Teacher Education and Development Study in Mathematics
(TEDS-M). Amsterdam, the Netherlands: International Association for the Evaluation of
Educational Achievement (IEA).

31
CHAPTER 3: DEvElOpMEnT Of ThE TEDS-M MaThEMaTiCS aSSESSMEnT fRaMEwORKS, inSTRuMEnTS, anD SCORinG GuiDES
Kiril Bankov, University of Sofia
Sharon L. Senk, Michigan State University
Ray Peck, Australian Council of Educational Research
Maria Teresa Tatto, Michigan State University
Michael Rodríguez, University of Minnesota
Yukiko Maeda, Michigan State University
3.1 Overview
The knowledge teachers use when teaching mathematics was a key TEDS-M outcome
variable. It consisted of two hypothesized dimensions—mathematics content knowledge
(MCK) and mathematics pedagogical content knowledge (MPCK). The first step that
the TEDS-M research team took when developing the TEDS-M mathematics assessment
instruments was to conceptualize the TEDS-M frameworks for these two dimensions.
The MCK and MPCK frameworks developed for the study that preceded TEDS-M,
known as Mathematics Teaching for the 21st Century or MT21 (Schmidt, Blömeke,
& Tatto, 2011), informed the TEDS-M conceptualizations. However, because MT21
focused on the lower-secondary level only, a considerable amount of work was needed
to extend these conceptualizations to include future primary teachers. The same was
true of the assessment frameworks eventually developed for the two dimensions of
knowledge. That work included drawing on other studies of mathematics education.
The specifications eventually established for the TEDS-M assessment frameworks
required, in turn, the development of a large number of items designed to measure the
MCK and MPCK of the future teachers who participated in the study.
The elaboration of the TEDS-M mathematics assessment frameworks, items, and
instruments was a collaborative process lasting almost four years, from the fall of 2003
tothefallof2007.ToensurethatTEDS-Mreflectedaninternationalperspective,the
people involved in developing both the assessment framework and the test included
prominent mathematicians, mathematics educators, and psychometricians. Together,
they represented a range of nations and cultures.
In this chapter, we describe and discuss the conceptualization and development of the
TEDS-M frameworks for MCK and MPCK. We also explain how the international
pool of items was developed, refined, selected, and categorized. In the final part of the
chapter, we look at the design of the instruments and assessment booklets as well as the
development of the scoring guides.

THE TEACHER EDUCATION AND DEVELOPMENT STUDY IN MATHEMATICS (TEDS-M) TECHNICAL REPORT32
3.2 Developing the TEDS-M 2008 Assessment Frameworks
Building on the work of past studies in mathematics education, the TEDS-M research
team developed an assessment framework for each of the two dimensions of mathematics
knowledge for teaching.
In order to maximize connections with other international studies, the Grades 4
and 8 mathematics frameworks for the 2007 iteration of the Trends in International
Mathematics and Science Study (TIMSS) (Mullis et al., 2005) and the 2008 TIMSS
Advanced frameworks (Garden et al., 2006) were used as the basis of the frameworks
designed to assess the MCK of students enrolled in teacher preparation programs.
The framework for MPCK required more extensive development. While educational
stakeholders accept MPCK as a meaningful and important construct (see, for instance,
Hill, Sleep, Lewis, & Ball, 2007), there is no corresponding consensus worldwide on
how best to categorize and describe the aspects of this dimension of mathematics
knowledge for teaching (Even & Ball, 2009). Differences exist, for example, between
the European notion of didactics (Pepin, 1999) and the Anglo/American notion of
pedagogical content knowledge (Shulman, 1986). The involvement of countries with
an Asian culture of pedagogy in TEDS-M further enriched and added to the complexity
of the development of an MPCK framework that would fairly represent the countries
involved. The careful description and measurement of MPCK during TEDS-M was a
product of the contribution that each country participating in TEDS-M made to these
processes.
3.2.1 The Mathematics Content Knowledge (MCK) Framework
The MCK of interest in TEDS-M was that required to teach primary and lower-
secondary school students. All MCK items developed by TEDS-M were categorized
according to three domains: content, cognitive, and curricular level (Tatto et al.,
2008). After the team of TEDS-M researchers who developed the items for the MCK
assessment had finished categorizing each item to one of these domains, panels of
experts in mathematics education along with members of the national research teams
reviewed the categorizations. This process led to all items in each domain of the MCK
instruments being classified according to subdomains:
1. Content domain (subdomains of number and operations, geometry and
measurement, algebra and functions, data and chance);
2. Cognitive domain (subdomains of knowing, applying, reasoning); and
3. Curricular-level domain (subdomains of novice, intermediate, advanced).
3.2.1.1 Content subdomains
Although the mathematics knowledge that teachers of lower-secondary students need
is not the same as that which teachers of primary school students need, TEDS-M used
the same broad subdomains of number and operations, geometry and measurement,
algebra and functions, and data and chance for both. Exhibit 3.1 shows the content
knowledge framework that TEDS-M adapted from TIMSS 2007 (Mullis et al., 2005)
and TIMSS Advanced 2008 (Garden et al., 2006). As is evident from the exhibit,
TEDS-M researchers considered most of the mathematics content listed in Exhibit 3.1
to be appropriate for both future primary and secondary teachers. However, content
related to advanced topics in algebra and functions was deemed suitable for the lower-
secondary students only.

33ASSESSMENT FRAMEwORKS, INSTRUMENTS, AND SCORING GUIDES
The TEDS-M researchers initially planned to give approximately equal emphasis to all
four content subdomains. However, subsequent analyses of the primary and secondary
mathematics curricula and the teacher preparation curricula in the participating
countries indicated that some countries gave lesser emphasis to data and chance than
to the other three content subdomains. Consequently, number and operations, algebra
and functions, and geometry and measurement received more emphasis than data and
chance in the MCK assessment instruments used in TEDS-M.
3.2.1.2 Cognitive subdomains
TEDS-M adopted the three cognitive subdomains—knowing, applying, and reasoning—
used in TIMSS 2007 and TIMSS Advanced 2008. These subdomains were described by
Garden et al. (2006, p. 17) as follows:
Understanding a mathematics topic consists of having the ability to operate successfully in three cognitive subdomains. The first domain, knowing, covers the facts, procedures, and concepts students need to know, while the second, applying, focuses on the ability of students to make use of this knowledge to select or create models and solve problems. The third domain, reasoning, goes beyond the solution of routine problems to encompass the ability to use analytical skills, generalize, and apply mathematics to unfamiliar or complex contexts.
Exhibit 3.2 sets out the behaviors associated with each of these three cognitive
subdomains. As was the case for TIMSS 2007 and TIMSS Advanced 2008, TEDS-M
aimed to achieve a balance of MCK items across the cognitive subdomains in terms of
approximately 35 percent knowing, 35 percent applying, and 30 percent reasoning.
Exhibit 3.1: Mathematics content knowledge framework: content knowledge subdomains and content areas
Subdomain Content Areas
Number and Operations whole numbers (ps) Fractions and decimals (ps) Number sentences (ps) Patterns and relationships (ps) Integers (ps) Ratios, proportions, and percentages (ps) Irrational numbers (ps) Number theory (ps)
Geometry and Measurement Geometric shapes (ps) Geometric measurement (ps) Location and movement (ps)
Algebra and Functions Patterns (ps) Algebraic expressions (ps) Equations/formulas and functions (ps) Advanced topics, e.g., limits, continuity, matrices (s)
Data and Chance Data organization and representation (ps) Data reading and interpretation (ps) Chance (ps)
note: p = primary level; s = lower-secondary level.
Exhibit 3.2: Mathematics content knowledge framework: cognitive subdomains and behaviors associated with them
Subdomain Associated Behaviors
Knowing Recall, recognize, compute, retrieve, measure, classify/order
Applying Select, represent, model, implement, solve routine problems
Reasoning Analyze, generalize, synthesize/integrate, justify, solve nonroutine problems
Source: Mullis et al. (2005, pp. 33–38).

THE TEACHER EDUCATION AND DEVELOPMENT STUDY IN MATHEMATICS (TEDS-M) TECHNICAL REPORT34
3.2.1.3 Curricular levels
In order to gain a deeper understanding of the knowledge needed to teach mathematics, TEDS-M sought information as to which level of school mathematics curricula each participating future teacher would be able to teach. All MCK items were therefore categorized into one of three curricular levels—novice, intermediate, and advanced. Exhibit 3.3 provides the descriptions of each adopted for TEDS-M.
TEDS-M researchers agreed that, given the limited assessment time available for future teachers to answer each TEDS-M assessment (60 minutes), the focus of the mathematics knowledge items should be on the novice and intermediate levels. For example, future teachers of primary school students would be tested mostly on the mathematics taught up to Grade 8, while future teachers of lower-secondary school students would be tested mostly on mathematics up to Grade 10. However, in order to gain information about future teachers with more advanced MCK, the TEDS-M team also developed some
advanced-level items.
Exhibit 3.3: Mathematics content knowledge framework: curricular levels
Curricular Level Description
Novice Mathematics content that is typically taught at the grades the future teacher is preparing to teach.
Intermediate Mathematics content that is typically taught one or two grades beyond the highest grade the future teacher is preparing to teach.
Advanced Mathematics content that is typically taught three or more years beyond the highest grade the future teacher is preparing to teach.
3.2.2 The Mathematics Pedagogical Content Knowledge (MPCK) Framework
Three studies that particularly informed the development of the TEDS-M MPCK
framework were the international MT21 study (Schmidt et al., 2011), the German-
based COACTIV study (Kunter et al., 2007), and the work of the Learning Mathematics
for Teaching (LMT) project in the USA (see, for example, Ball & Bass, 2000; Hill &
Ball, 2004; Hill, Rowan, & Ball, 2005; Hill, Schilling, & Ball, 2004). The TEDS-M expert
panels (consisting of internationally prominent mathematicians and mathematics
educators) and the TEDS-M national research coordinators (NRCs) provided feedback
on initial drafts of the MPCK framework. As was the case with development of the
MCK assessment framework, the TEDS-M researchers needed to categorize the items
in the MPCK assessment framework to ensure a balanced assessment of MPCK. The
items were therefore classified according to:
1. Content domain (subdomains of number and operations, geometry and measurement, algebra and functions, and data and chance);
2. MPCK-specific domain (subdomains of curricular knowledge, planning for mathematics teaching and learning, enacting mathematics for teaching and learning); and
3. Curricular level (subdomains of novice, intermediate, and advanced levels).
The descriptions immediately below as well as the information contained in Exhibit 3.4
elaborate the final MPCK-specific framework used for both the primary and the lower-
secondary item development.

35ASSESSMENT FRAMEwORKS, INSTRUMENTS, AND SCORING GUIDES
The curricular subdomain refers to mathematical curricular knowledge and comprises
the preliminary theoretical knowledge that a teacher should possess in order to teach
effectively. It covers, among other elements, knowledge about the curriculum and
student learning trajectories, knowledge about teaching goals and formative and
summative assessment, and knowledge of key concepts in school mathematics and their
interconnections.
This planning subdomain refers to the knowledge teachers need to plan their
mathematics teaching and learning and refers to the preparatory work that they need
to do before teaching in the classroom. The items for this subdomain on the assessment
were therefore directed at, for example, assessing lesson-planning activities, selecting
appropriate instruction methods and designs, using classroom assessment to inform
and plan lessons, and predicting students’ reactions and possible misconceptions.
The third subdomain, enacting, refers to the enactment of mathematics for teaching
and learning and includes the main activities that may happen in the classroom during
a lesson. Teachers viewed from this subdomain are seen not only as lecturers but also as
people who play an interactive role in the classroom. The TEDS-M assessment goal in this
area was to measure, among other competencies, ability to analyze teacher and student
interaction following students’ questions, develop solutions, consider and respond to
argumentation and misconceptions, provide explanations, and give feedback.
Exhibit 3.4: Mathematics pedagogical content knowledge (MPCK) framework a
MPCK Subdomain Elaboration
Mathematical Curricular Knowledge • Establishing appropriate learning goals • Knowing different assessment formats • Selecting possible pathways and seeing connections within the curriculum • Identifying the key ideas in learning programs • Knowing the mathematics curriculum
Knowledge of Planning for • Planning or selecting appropriate activitiesMathematics Teaching and Learning • Choosing assessment formats(Preactive) • Predicting typical student responses, including misconceptions b
• Planning appropriate methods for representing mathematical ideas • Linking the didactical methods and the instructional designs • Identifying different approaches for solving mathematical problems • Planning mathematical lessons
Enacting Mathematics • Analyzing or evaluating students’ mathematical solutions or arguments • Analyzing the content of students’ questions • Diagnosing typical student responses, including misconceptions • Explaining or representing mathematical concepts or procedures • Generating fruitful questions • Responding to unexpected mathematical issues • Providing appropriate feedback
notes:
a This framework paid attention to the temporal dimension of teacher knowledge as well as the way in which mathematical categories refer to different types of knowledge.
b Attention to choice of verbs may prove useful in distinguishing between the preactive and interactive dimensions of the categories.

THE TEACHER EDUCATION AND DEVELOPMENT STUDY IN MATHEMATICS (TEDS-M) TECHNICAL REPORT36
3.2.3 Developing the Mathematics and Mathematics Pedagogy Items
Developing the item pool for TEDS-M was an international collaborative process.
Permission was granted to include some items from past studies of mathematics teachers’
knowledge, namely the aforementioned MT21 study and the Learning Mathematics for
Teaching (LMT) project at the University of Michigan (see http://sitemaker.umich.edu/
lmt/home), as well as the Knowing Mathematics for Teaching Algebra (KAT) project
at Michigan State University (see http://www.educ.msu.edu/kat/). The TEDS-M
researchers from the international study centers (ISCs) in Australia (ACER) and the
United States (MSU), the NRCs in the participating countries, and the expert panels of
mathematics researchers and educators from around the world contributed additional
items.
Draft items were submitted to the ISCs for review, a process designed to ensure the
TEDS-M instruments aligned with the assessment frameworks. MSU had primary
responsibility for the pool of items for the future teachers preparing to teach primary
school, and ACER for the items for the lower-secondary future teachers. This process
resulted in an initial item pool of about 500 items across both levels, covering a broad
range of MCK and MPCK topics.
In the remainder of this section, we give a brief overview of the challenges associated
with the item development work, as well as a more detailed account of the steps taken
to develop the two pools of items used in the TEDS-M main study. These steps included
item review and revision, pilot testing of the items and their answer formats, and final
selection of the items for the main survey.
3.2.4 Methodological and Measurement Considerations
These considerations were informed by one of the TEDS-M research questions: How
can the outcomes of teacher education programs for teachers of mathematics be
measured in ways that are reliable and valid? A range of robust items (mathematically
clear, culturally valued, and psychometrically sound) was needed in order to develop
reliable and valid measures of future teachers’ MCK and MPCK.
The TEDS-M researchers faced several challenges when developing the items that could
be used to measure MPCK. We have already discussed one such challenge—identifying
and delineating the two hypothesized dimensions forming mathematical knowledge
for teaching. Creating items that would motivate future teachers to participate in the
TEDS-M research was a second challenge. Determining which of the two dimensions of
teachers’ mathematics knowledge each item contributed to was a third.
To meet the second challenge, the TEDS-M researchers focused their item-development
work on items set in teaching and learning contexts, an approach similar to that taken
in the recent studies of mathematics teachers’ knowledge cited earlier in this chapter
(i.e., MT21, COACTIV, and LMT). Development of the MPCK items also referenced
mathematics problems appropriate to the level at which the future teachers were being
prepared to teach. The assumption here was that items developed according to these
considerations would be interesting for the future teachers because of the items’ close
connection with these preservice teachers’ eventual profession.
The third challenge—whether each item contributed most to MCK or MPCK—arose
when the TEDS-M researchers decided that the items used in the main TEDS-M survey
should contribute to one of the dimensions only. This approach contrasted with that

37ASSESSMENT FRAMEwORKS, INSTRUMENTS, AND SCORING GUIDES
used in the MT21 study and the TEDS-M field trial, where some assessment items
measured both dimensions. The TEDS-M international centers therefore asked the
members of the expert panels as well as the TEDS-M NRCs to classify items as either
MCK or MPCK and then to discuss those items that could not be readily classified or
where there was disagreement over the classification.
3.2.5 Initial Item Review and Revision
The TEDS-M ISCs assembled, reviewed, and revised the draft items and confirmed the
classification of items with respect to the frameworks and submitted them for review
by an expert panel consisting of mathematicians and mathematics educators from the
countries that intended to participate in TEDS-M. Selected draft items were pilot-tested
in four countries.
Finally, working from the frameworks described earlier, two expert panels (one for the
future primary teachers and the other for the future lower-secondary teachers) classified
and rated the items and refined the most promising ones. They also, where necessary,
added in items for those domain and subdomain areas lacking coverage.
3.2.6 The Field Trial
To evaluate the international performance of the items developed for TEDS-M, a
full-scale field trial was conducted at both the primary and lower-secondary levels.
In total, 11 countries submitted data from the field trial. To ensure that an adequate
number of items would be available for selection, substantially more items, particularly
constructed-response ones, were field-tested than were needed in the main study (140%
to 180% more). In total, 179 primary-level items in seven assessment booklets and 199
lower-secondary-level items in five assessment booklets were field-tested.
The IEA Data Processing and Research Center produced data almanacs containing
basic item statistics for each country and internationally. The almanacs reported item
difficulty, how well items discriminated between high-performing and low-performing
students, the frequency of distracters in the multiple-choice items, scoring reliability for
constructed-response items, and the frequency of occurrence of diagnostic codes used
in the scoring guides.
3.2.7 Item Selection for the Main Study
The TEDS-M ISCs conducted an initial review of the field trial results, which identified
translation-related problems that could affect the reliability and validity of the items
used in the main international study. The expert panels also reviewed the field-trial items
and item statistics for any anomalies. Items that had not worked well psychometrically,
such as those which had point-biserial correlations lower than 0.2 or poor fit identified
through item response theory (IRT) modeling, were deleted. Revisions to items
included improving graphics and item layout, clarifying stems, and revising or deleting
distracters selected by very low percentages of respondents. In a few instances, item
format was changed. These prepared items were then submitted to the NRCs for their
review. They recommended a number of additional improvements, most of which were
incorporated into the final instruments.

THE TEACHER EDUCATION AND DEVELOPMENT STUDY IN MATHEMATICS (TEDS-M) TECHNICAL REPORT38
3.2.8 Item Compilations and Booklet Design for the Main Study
Experience gained from MT21 and the TEDS-M item pilot and field trials indicated
the feasibility of reliably assessing three subdomains for MCK (number, algebra, and
geometry) and at least one subdomain for MPCK in the 60 minutes of testing time
available (see below). TEDS-M classifications for the MCK cognitive subdomains and
curricular levels were used solely during test development in order to achieve a good
balance among these categories of the framework, and not for reporting.
In order to ensure the required coverage of all domains and subdomains in the
frameworks, the total pool of items for TEDS-M required much more testing time than
could be allotted to any one individual future teacher. Therefore, as occurs in other IEA
studies, TEDS-M employed a rotated block design. This involved dividing the entire
item pool into unique blocks of items, distributing these blocks across a set of booklets,
and rotating the booklets among the future teachers at both primary and secondary
levels.
Five blocks of items (B1PM to B5PM) were used for the TEDS-M main survey at the
primary level (see Exhibit 3.5). Due to time constraints and the number of items required
per subdomain, it was not possible to achieve a balanced incomplete block (BIB) design
where every pair of blocks appeared together once in a booklet. A primary-level BIB
design reporting on five subdomains would have required an individual primary future
teacher to attempt 75 items in 60 minutes. This was considered too many, especially
given the nature and proportion of the MPCK items and the likelihood of returning
an unacceptably high proportion of missing responses. The design that the TEDS-M
researchers eventually selected required about 50 items to be attempted in 60 minutes.
As can be seen from Exhibit 3.5, the block rotation still ensured that every block
appeared in each position of a test booklet once.
Exhibit 3.5: Design for primary blocks Booklet Primary Mathematics Blocks
Booklet 1 B1PM, B2PM
Booklet 2 B2PM, B3PM
Booklet 3 B3PM, B4PM
Booklet 4 B4PM, B5PM
Booklet 5 B5PM, B1PM
note: B1PM to B5PM = mathematics blocks primary (1–5).
At the lower-secondary level, the small size of the target populations within institutions,
within programs, and within countries imposed still further restrictions. The TEDS-M
research teams therefore considered three blocks of items (B1SM to B3SM) to be
appropriate for the main study’s lower-secondary assessment. Exhibit 3.6 shows the
three-booklet, three-block BIB design used for this target population. It required the
future teachers to answer about 40 items in the 60 minutes available. It also permitted
estimation and analysis of the full covariance matrix. The rotated-block design for both
the primary and lower-secondary assessments included enough items and score points
to generate IRT scales and reports for the subdomains listed above.

39ASSESSMENT FRAMEwORKS, INSTRUMENTS, AND SCORING GUIDES
3.2.9 Assembling the Item Blocks for Inclusion in the Booklets
The item blocks were assembled to create a balance across booklets with respect to
the content and cognitive domains, curricular level, and item format. The TEDS-M
researchers decided that future teachers’ performance on items related to the subdomains
of algebra, geometry, and number would be reported on. However, while they agreed
that the MCK assessment should include data items at both the primary and lower-
secondary levels so as to more completely represent the overall MCK dimension, they
decided that performance on this subdomain would not be reported on for the reason
given in Section 3.2.1.1 above.
The researchers similarly decided that items relating to the curriculum and planning
subdomains for the MPCK dimension at both primary and lower-secondary levels
should be combined so that future teachers’ performance on only two subdomains
(curriculum and planning, and enacting) would be reported (see Brese & Tatto, 2012;
Tatto et al., 2012). The number of items per block for the primary level is shown in
Exhibit 3.7; the numbers for the lower-secondary level can be found in Exhibit 3.8.
Exhibit 3.9 shows the number of MCK items in the content, cognitive, and curricular
domains in the final instruments. Both the primary and lower-secondary instruments
had an approximately equal balance of items assessing knowledge of number, geometry,
and algebra, but only a small number of data items. This outcome led to the previously
mentioned decision not to report the data subdomain. Forty-seven percent of the items
in the final primary instruments were classified as knowing, 33 percent as applying, and
17 percent as reasoning. The lower than intended proportion of reasoning items was a
function of the relatively small number of reasoning items that survived selection into
the final item pool for the primary level.
Exhibit 3.6: Design for lower-secondary blocks Booklet Secondary Mathematics Blocks
Booklet 1 B1SM, B2SM
Booklet 2 B2SM, B3SM
Booklet 3 B3SM, B1SM
note: B1SM to B3SM = mathematics blocks lower secondary (1–3).
note: a Data was not a reporting subdomain.
Exhibit 3.7: Primary items by subdomains and blocks
Number of Items in Block Items
Subdomain B1PM B2PM B3PM B4PM B5PM Total
Algebra 2 6 6 9 2 25
Geometry 4 2 8 4 8 26
Number 8 7 4 5 8 32
Data a 1 1 4 0 1 7
Mathematics Pedagogy 1 5 2 3 3 4 17 (Curriculum and Planning)
Mathematics Pedagogy 2 2 3 4 7 1 17 (Enacting)
Total 22 21 29 28 24 124
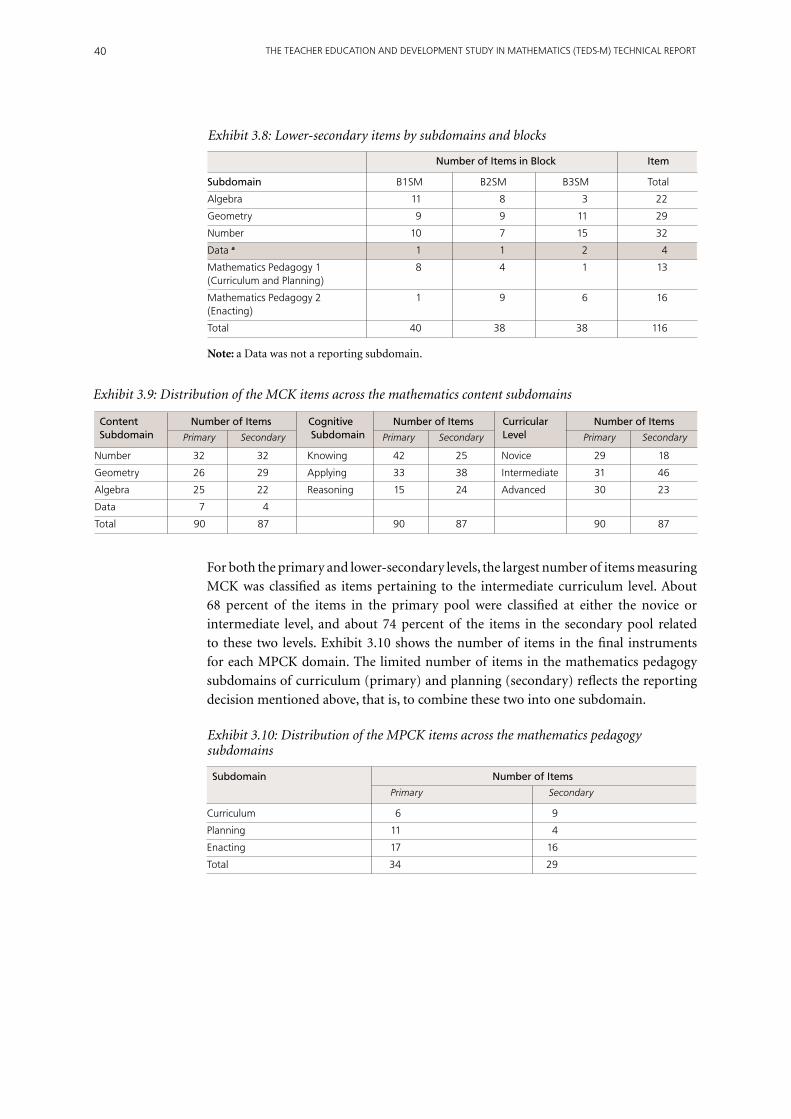
THE TEACHER EDUCATION AND DEVELOPMENT STUDY IN MATHEMATICS (TEDS-M) TECHNICAL REPORT40
For both the primary and lower-secondary levels, the largest number of items measuring
MCK was classified as items pertaining to the intermediate curriculum level. About
68 percent of the items in the primary pool were classified at either the novice or
intermediate level, and about 74 percent of the items in the secondary pool related
to these two levels. Exhibit 3.10 shows the number of items in the final instruments
for each MPCK domain. The limited number of items in the mathematics pedagogy
subdomainsofcurriculum(primary)andplanning(secondary)reflectsthereporting
decision mentioned above, that is, to combine these two into one subdomain.
note: a Data was not a reporting subdomain.
Exhibit 3.8: Lower-secondary items by subdomains and blocks
Number of Items in Block Item
Subdomain B1SM B2SM B3SM Total
Algebra 11 8 3 22
Geometry 9 9 11 29
Number 10 7 15 32
Data a 1 1 2 4
Mathematics Pedagogy 1 8 4 1 13 (Curriculum and Planning)
Mathematics Pedagogy 2 1 9 6 16 (Enacting)
Total 40 38 38 116
Exhibit 3.9: Distribution of the MCK items across the mathematics content subdomains
Content Number of Items Cognitive Number of Items Curricular Number of Items Subdomain Subdomain Level
Primary Secondary Primary Secondary Primary Secondary
Number 32 32 Knowing 42 25 Novice 29 18
Geometry 26 29 Applying 33 38 Intermediate 31 46
Algebra 25 22 Reasoning 15 24 Advanced 30 23
Data 7 4
Total 90 87 90 87 90 87
Exhibit 3.10: Distribution of the MPCK items across the mathematics pedagogy subdomains
Subdomain Number of Items
Primary Secondary
Curriculum 6 9
Planning 11 4
Enacting 17 16
Total 34 29

41ASSESSMENT FRAMEwORKS, INSTRUMENTS, AND SCORING GUIDES
3.2.9.1 Item formats
TEDS-M used three item formats—multiple-choice (MC), complex multiple-choice
(CMC), and constructed-response (CR) to assess both MCK and MPCK. MC and CMC
employ closed responses, whereas CR items require open responses. Exhibit 3.11 shows
how many of the three different item formats were used to assess each dimension of
mathematical knowledge for teaching.1
3.3 Scoring the Assessment Items
Responses to the multiple-choice items and each part of the complex multiple-
choice items received one point if correct and no (0) points if incorrect. Scoring the
constructed-response items was based on the methodology developed for IEA’s Trends
in International Mathematics and Science Study. A description of this method along
with the process used to develop the scoring guide and the scoring training materials
and procedures for these items follows.
3.3.1 General Method Used to Score the Constructed-Response Items
Depending on the degree of complexity that they involved, the TEDS-M constructed-
response (CR) mathematics and mathematics pedagogy items were given either one or
two points for fully correct answers.
• One-point CR items were scored as correct (1 score point) or incorrect (0 score
points).
• Two-pointCRitemswerescoredasfullycorrect(2scorepoints),partiallycorrect(1
score point), or incorrect (0 score points). For example, a response to a MCK item
containing an incorrect solution but a mathematically appropriate reasoning and
procedure received partial credit. A response to a MPCK item that was incomplete or
lacking some clarity was awarded partial credit.
In addition to differentiating between correct and incorrect answers, the design of the
scoring system meant that information could be collected on what the participating future
teachers knew and were able to do. Information sought included common approaches
to solving problems and addressing common misconceptions. The diagnostic scoring
system for CR items used two digits to categorize each response. The first digit was the
score indicating the degree of correctness of the response: 2 for a two-point response, 1
for a one-point response, and 7 for an incorrect response. The second digit, combined
Exhibit 3.11: Distribution of item formats by subdomain in both primary and lower-secondary TEDS-M instruments
Number of Items Number of Items
Primary Secondary
Item Format MCK MPCK Total MCK MPCK Total
MC 23 6 29 10 4 14
CMC 62 14 76 64 23 87
CR 5 14 19 13 2 15
Total 90 34 124 87 29 116
1 Please note that each part of a complex multiple-choice item was counted as one item. Complex multiple-choice items are closed items consisting of several parts. Each part must be answered. For an example, see the released item set MFC202A-D (from the primary item pool) in Brese and Tatto (2012).

THE TEACHER EDUCATION AND DEVELOPMENT STUDY IN MATHEMATICS (TEDS-M) TECHNICAL REPORT42
with the first, was used to classify the method that the future teachers employed to solve
a problem, or it was used to track common errors or misconceptions. The information
from the second digit referenced questions of interest to TEDS-M such as these:
• Doapproachesthatleadtocorrectresponsestotheitemvaryacrosscountries?
• Isthereoneapproachthatfutureteachershavemoresuccesswiththanothers?
• What common misconceptions do future teachers have about the matter being
tested?
• Whatcommonerrorsaremade?
Scorers could use the second digit from within the range of 0 to 5 for predefined
international codes at each correctness level. A second digit of 9 corresponded to “other”
types of responses that fell within the appropriate correctness level but did not fit any of
the predefined international codes. A special code (99) was given for completely blank
responses. Examples of these scoring guides can be seen in the TEDS-M released item
set (Brese & Tatto, 2012). Exhibit 3.12 provides a generic example of a double-digit
scoring guide for a two-point CR item.
Exhibit 3.12: Example of generic double-digit scoring guide used for constructed-response items
Code Response
Correct Response
20 Correct response Type 1
21 Correct response Type 2
… …
29 Other correct
Partially Correct Response
10 Partially correct response Type 1
11 Partially correct response Type 2
… …
19 Other partially correct
Incorrect Response
70 Incorrect response Type 1
71 Incorrect response Type 2
… …
79 Other incorrect (including crossed out, erased, stray marks, illegible, or off task)
Nonresponse
99 Blank
3.3.2 Developing the Scoring Guides
The TEDS-M research teams developed the scoring guides for the field-trial CR items
after investigating the responses of future teachers to pilots containing limited numbers
of items and conducted in Australia, Botswana, Chile, Chinese Taipei, Philippines, and
the United States. Selected student responses from the pilots were included as examples
in the scoring guides and materials that were used to train scorers during the field
trial.
The field trial results, including psychometric analyses, indicated the need for some
revisions to the scoring guides that were to be used in the main study. Feedback from
the NRCs based on their scoring experiences during the field trial also informed

43ASSESSMENT FRAMEwORKS, INSTRUMENTS, AND SCORING GUIDES
improvements to the scoring guides. In addition, sets of student responses from the
field trial were collected from English-speaking field-trial countries as sources of
sample student responses that could be used to clarify codes and prepare the scoring
training materials for the main study. In order to add diversity to these materials, the
non-English-speaking countries participating in TEDS-M were invited to translate
sample students’ responses into English and to send these on to the international study
centers.
3.3.2.1 Scoring training materials and procedures
TEDS-M used a “train-the-trainers” approach to providing training on the international
procedures for scoring the TEDS-M CR items. NRCs and/or other personnel responsible
for training scorers in each country participated in the training sessions for the field
trial and main survey. The national representatives at these sessions suggested a few
additional revisions and clarifications. These were incorporated into the guides prior to
their general distribution.
During each of these sessions, those attending reviewed the general TEDS-M scoring
approach, and the trainee scorers received training on a subset of CR items. The
subsetofitemsselectedreflectedarangeofthetypesofscoringandscoringsituations
encountered across the TEDS-M items. They also related to some of the most complicated
scoring guides. To expedite training, participants received the international version of
the scoring guides and a binder containing a set of prescored future-teacher responses.
These illustrated the diagnostic codes and the rationale used to score the responses, as
well as a set of 5 to 10 unscored practice responses for each item. The future teachers’
responses were selected from the item-pilot and field-trial booklets.
The purpose of the international scoring training was to present a model for use in each
country and an opportunity to practice and resolve the scoring issues associated with
the most difficult items. The training teams discussed the need for NRCs to prepare
comparable materials for training in their own country for all CR items and to have
on hand a larger number of practice responses for the more challenging scoring guides
during the national training sessions. The following general procedure was followed
during the scoring training for each item:
• Participantsreadtheitemanditsscoringguide.
• Trainersdiscussedtherationalebehindandthemethodologyofthescoringguide.
• Trainers presented and discussed the set of prescored example future-teacher
responses.
• Participantsscoredthesetofpracticefuture-teacherresponses.
• Trainersledagroupdiscussionofthescoresgiventothepracticeresponsesinorder
to reach a common understanding of the interpretation and application of the
scoring guide.
At the end of the training sessions, the NRCs were given the example and practice
papers along with their associated coding sheets and were asked to use these during
scoring training in their own countries.

THE TEACHER EDUCATION AND DEVELOPMENT STUDY IN MATHEMATICS (TEDS-M) TECHNICAL REPORT44
3.3.2.2 Scoring reliability
To establish scoring reliability, up to 760 of the booklets (380 primary and 380 lower-
secondary) completed by future teachers during the main study were assigned for
reliability scoring. Two different scorers independently scored the booklets; neither saw
the other’s scores. This approach is known as double “blind” scoring.
During the scoring of the national sets of booklets completed by future teachers, duos
of scorers maintained blind scoring by having one person write down his or her scores
on a separate scoring sheet and the other person write his or her scores in the booklet.
There was one scoring sheet for each survey booklet. The two sets of scores were
compared and the percentage of agreement between scorers in each country calculated.
Agreement above 85 percent was considered good; between 70 percent and 85 percent
was deemed acceptable, and below 70 percent was seen as a concern.
In general, countries were able to apply the scoring guides for the CR items with high
reliability. For 89.5 percent of the items on the primary forms and for 100 percent of the
items on the lower-secondary forms, the international reliability averages were greater
than 85 percent.
3.3.3 Item Release Policy
The ISCs decided to release approximately one third of the items to the public and to
keep the other two-thirds secure for possible use in future research studies. The items
are included in Brese and Tatto (2012).
References
Ball, D. L., & Bass, H. (2000). Interweaving content and pedagogy in teaching and learning to
teach: Knowing and using mathematics. In J. Boaler (Ed.), Multiple perspectives on the teaching and
learning of mathematics (pp. 83–104). Westport, CT: Ablex.
Brese, F., & Tatto, M. T. (Eds.). (2012). User guide for the TEDS-M international database. Amsterdam,
the Netherlands: International Association for the Evaluation of Educational Achievement (IEA).
Even, R., & Ball, D. L. (Eds.). (2009). The professional education and development of teachers of
mathematics: The 15th study of the International Commission on Mathematical Instruction. New
York, NY: Springer.
Garden, R. A., Lie, S., Robitaille, D. F., Angell, C., Martin, M. O., Mullis, I. V. S., Foy, P., & Arora,
A. (2006). TIMSS Advanced 2008 assessment frameworks. Chestnut Hill, MA: TIMSS and PIRLS
International Study Center.
Hill, H. C., & Ball, D. L. (2004). Learning mathematics for teaching: Results from California’s
mathematics professional development institutes. Journal for Research in Mathematics Education,
35(5), 330–351.
Hill, H. C., Rowan, B., & Ball, D. L. (2005). Effects of teachers’ mathematical knowledge for teaching
on student achievement. American Educational Research Journal, 42, 371–406.
Hill, H. C., Schilling, S. G., & Ball, D. L. (2004). Developing measures of teachers’ mathematics
knowledge for teaching. The Elementary School Journal, 105(1), 11–30.
Hill, H. C., Sleep, L., Lewis, J. M., & Ball, D. L. (2007). Assessing teachers’ mathematical knowledge:
What knowledge matters and what evidence counts? In F. K. Lester (Ed.), Second handbook of
research on mathematics teaching and learning: A project of the National Council of Teachers of
Mathematics (pp. 111–155). Charlotte, NC: Information Age.
Kunter, M., Klusmann, U., Dubberke, T., Baumert, J., Blum, W., Brunner, M., Jordan, A., Krauss,

45ASSESSMENT FRAMEwORKS, INSTRUMENTS, AND SCORING GUIDES
S., Löwen, K., Neubrand, M., & Tsai, Y.-M. (2007). Linking aspects of teacher competence to their
instruction: Results from the COACTIV project. In M. Prenzel (Ed.), Studies on the educational
quality of schools: The final report on the DFG Priority Programme (pp. 32–52). Münster, Germany:
Waxmann.
Mullis, I. V. S., Martin, M. O., Ruddock, G. J., O’Sullivan, C. Y., Arora, A., & Erberber, E. (2005).
TIMSS 2007 assessment frameworks. Chestnut Hill, MA: TIMSS and PIRLS International Study
Center.
Pepin, B. (1999). Existing models of knowledge in teaching: Developing an understanding of the
Anglo/American, the French, and the German scene. In B. Hudson, F. Buchberger, P. Kansanen, &
H. Seel (Eds.), TNTEE Publications: Didaktik/Fachdidaktik as Science(s) of the Teaching Profession
(Vol. 2, No. 1, 49–66). Umeå, Sweden: Thematic Network of Teacher Education in Europe.
Schmidt, W. H., Blömeke, S., & Tatto, M. T. (2011). Teacher education matters: A study of middle
school mathematics teacher preparation in six countries. New York, NY: Teachers College Press.
Shulman, L. S. (1986). Those who understand: Knowledge growth in teaching. Educational
Researcher, 15(2), 4–14.
Tatto, M. T., Schwille, J., Senk, S. L., Ingvarson, L., Peck, R., & Rowley, G. (2008). Teacher Education
and Development Study in Mathematics (TEDS-M): Conceptual framework. Amsterdam, the
Netherlands: International Association for the Evaluation of Educational Achievement (IEA).
Tatto, M. T. Schwille, J., Senk, S. L. Ingvarson, L., Rowley G., Peck, R., Bankov, K., Rodríguez, M.,
& Reckase, M. (2012). Policy, practice, and readiness to teach primary and secondary mathematics
in 17 countries: Findings from the IEA Teacher Education and Development Study in Mathematics
(TEDS-M). Amsterdam, the Netherlands: International Association for the Evaluation of
Educational Achievement (IEA).

THE TEACHER EDUCATION AND DEVELOPMENT STUDY IN MATHEMATICS (TEDS-M) TECHNICAL REPORT46

47
CHAPTER 4: DEvElOpMEnT Of ThE TEDS-M SuRvEy QuESTiOnnaiRES
Maria Teresa Tatto, Michigan State University
Michael Rodríguez, University of Minnesota
Lawrence Ingvarson, Australian Council of Educational Research
Glenn Rowley, Australian Council for Educational Research
Yukiko Maeda, Michigan State University
Soo-Yong Byun, Michigan State University
4.1 Overview
The TEDS-M research team developed four survey questionnaires:
• The future teachers’ questionnaire (FTQ) for teachers in primary preparation
programs, which also included an assessment of mathematics knowledge for teaching
at the primary levels;
• Thefutureteachers’questionnaireforteachersinsecondarypreparationprograms,
which also included an assessment of mathematics knowledge for teaching at the
secondary levels;
• Theeducators’questionnaire(EQ);and
• Theinstitutionalprogramquestionnaire(IPQ).
In this chapter we describe the purpose and content of the questionnaires, the process
for their development, and the main constructs underlying the questionnaire items. Part
C of the FTQ, containing items assessing future teachers’ knowledge of mathematics
and mathematics pedagogy, is described in detail in Chapter 3 of the report. The entire
set of questionnaires is available as an appendix to the user guide for the TEDS-M
international database (Brese & Tatto, 2012).
4.2 Development of the TEDS-M Survey Questionnaires
The international study centers (ISCs) at Michigan State University (MSU) and the
Australian Council for Educational Research (ACER) led the design and development
of the TEDS-M survey questionnaires in collaboration with the national research
coordinators (NRCs) of the participating countries, and other experts. The surveys
were piloted in 2005 and field trialed in 2006 (see Chapter 3 of this report). Exhibits 4.1
and 4.2 provide information relating to the variables that the researchers wanted the
questionnaires to capture and the relationships they wanted to explore.
The TEDS-M survey design allowed multilevel analysis at the individual (future teacher)
and at the teacher education program level. The questionnaires were designed to be
consistent with one another in terms of design, layout, question format, and wording.
Parallel questions were used across the questionnaires to measure the same constructs
from different sources. We describe and discuss each questionnaire in the following
sections.

THE TEACHER EDUCATION AND DEVELOPMENT STUDY IN MATHEMATICS (TEDS-M) TECHNICAL REPORT48
4.2.1 The Future Teacher Questionnaires (FTQs)
In addition to questions designed to measure future teachers’ knowledge of mathematics
and mathematics pedagogy, the future teacher questionnaires for the primary and
secondary levels included questions on (1) general background, (2) program learning
opportunities, and (3) beliefs about teaching and learning mathematics.
4.2.1.1 Part A: Background
The FTQs included a number of indicators of the future teachers’ backgrounds and
demographics. These indicators, which related to the variables that the TEDS-M team
wanted to address during the data analysis, are listed below and set out in more detail
in Exhibit 4.3. They were:
• Age,gender,parents’education/socioeconomicstatus,languagespokenathome;
• Natureandlevelofsecondaryschoolmathematicsknowledge;
• Academic/general education, area of specialization, routes into teaching, degrees
obtained;
• Teaching/workexperience,motivation/plans/intentionwithrespect tobecominga
mathematics teacher, special circumstances/personal costs of becoming a teacher,
and how long the future teacher planned to stay in the profession.
Exhibit 4.1: Mapping the processes and outcomes of mathematics teacher preparation using the data collected from the TEDS-M surveys a
National Context Program Structure Program Process Program Outcomes
1. Policy, education, social and economic context
2. Regulatory framework (e.g., requirements set by national or state registration bodies for entry, methods of course assessment and accreditation, graduation and registration)
3. Labor market for teachers (i.e., supply and demand for teachers)
• Sources of recruits (teacher education, career changers, overseas, etc.)
• Relative salaries and working conditions for teachers
• Age profile of teachers
• Retirement and resignation rates
• Teacher skills needed to meet curriculum requirements
1. Staffing profile/ experience
2. Methods of selection
3. Internal quality assurance process
4. Entry levels, degree of selectivity
5. Funding policies/allocation of funds/course costs
1. Structure (e.g., concurrent undergraduate, postgraduate, etc.)
2. Opportunity to learn (e.g., content to be taught, pedagogical content knowledge, practice of teaching, planning, assessment, feedback, reflection, etc.)
3. Course quality (e.g., course coherence, links between theory and practice, quality of teaching, etc.)
4. Practicum arrangements (e.g., length, scheduling, nature, quality of supervision/feedback/assessment, strength of partnership between teacher education institution and schools, etc.)
5. Student intake (e.g., prior achievement, subject background, prior careers, etc.)
1. Surveys of teacher knowledge and beliefs
(measures of teachers’ beliefs, mathematics
knowledge, and mathematics pedagogical content knowledge)
2. Survey of perceived preparedness
note: a The TEDS-M framework (Tatto et al., 2008) provides explicit definitions of the TEDS-M concepts and terminology.

49TEDS-M SURVEY QUESTIONNAIRES
Exhibit 4.2: TEDS-M research model for the TEDS-M surveys
Level 2 Measures(Program Level)
FT Characteristics (from FTQ)– Age– Gender– Socioeconomic
background– Language background– Highest year level
mathematics studied in school
– Most advanced level of mathematics studied
– Prior career– Motivation for
teaching mathematics
Program Characteristics (from IPQ)– Program structure– Program length– Time spent on subject-matter
preparation– Time spent on pedagogy– Entry requirements– Selection policies– Academic achievement level– Curriculum emphases– Field experience
Program Characteristics (aggregated from FTQs)– OTL– Teaching methods– Field experience– Coherence
Program Characteristics (aggregated from EQ)– Professional experience– OTL provided– Educator beliefs
Outcome Measures (from FTQs)– Mathematics knowledge– Mathematics pedagogical knowledge– Preparedness for teaching mathematics– Perceived program effectiveness
Outcome Measures (Individual)
Level 1 Measures (Individual)
4.2.1.2 Part B: Opportunities to learn
TEDS-M considered the concept of opportunity to learn (OTL) integral to explaining the impact of teacher preparation on teacher learning. The FTQs therefore included a number of items and scales developed to allow exploration of several types of OTL experienced by the future teachers both before and during their teacher preparation programs (see also Exhibit 4.4):
• OTL tertiary-level mathematics: The items in this part of the questionnaire were designed to determine whether the future teachers had studied key mathematics topics at tertiary level (e.g., geometry-related topics, algebra, number theory, calculus, functions, etc.). Because opportunities to learn in this area can occur either before future teachers enter teacher preparation (i.e., the consecutive programs) or during teacher preparation (in concurrent programs), these questions asked future teachers whether they had ever studied such topics. The mathematics domains covered were:
− Continuity and functions (e.g., beginning calculus, calculus, multivariate calculus, advanced calculus or real analysis, and differential equations);
− Discrete structures and logic (e.g., linear algebra, set theory, abstract algebra, number theory, discrete mathematics, and mathematical logic);
− Geometry (e.g., foundations of geometry or axiomatic geometry, analytic or coordinate geometry, non-Euclidean geometry, and differential geometry); and
− Probability and statistics (e.g., probability and theoretical or applied statistics).
• OTL school-level mathematics: This section contained items designed to allow exploration of the interaction between mathematics content and mathematics pedagogy within the contexts of the secondary school curriculum, techniques for teaching mathematics topics at this level of the education system, and student

THE TEACHER EDUCATION AND DEVELOPMENT STUDY IN MATHEMATICS (TEDS-M) TECHNICAL REPORT50
learning. This area also included items regarding the depth of mathematics learning (e.g., at the level of the secondary school curriculum or at a deeper level beyond the school curriculum and with no relation to it). The mathematics domains covered included:
− Numbers (e.g., whole numbers, fractions, decimals, integers, rational and real numbers, number concepts, number theory, estimation, ratio, and proportionality);
− Measurement (e.g., measurement units, computations and properties of length, perimeter and area, and volume estimation and error);
− Geometry (e.g., one-dimensional and two-dimensional coordinate geometry, Euclidean geometry, transformational geometry, congruence and similarity, constructions with straightedge and compass, three-dimensional geometry, and vector geometry).
The domains pertaining to mathematics taught at the upper-secondary school level were:
− Data representation, probability, and statistics;
− Calculus (e.g., infinite processes, change, differentiation, integration);
− Functions, relations, and equations (e.g., algebra, trigonometry, analytic geometry); and
− Validation, structuring, and abstracting (e.g., Boolean algebra, mathematical induction, logical connectives, sets, groups, fields, linear space, isomorphism,
homomorphism).
Part A Item Content Item Number Description
General background 1 Age.
2 Gender.
3 The number of books in <future teacher’s>, <parents’, or guardian’s home. The question consisted of four options for the number of books (ranging from “0–10 books” to “more than 200 books”).
4 The possession of specified items in <parents’ or guardian’s> home. The question listed eight common items and three country-specific items.
5 The highest educational attainment by <future teacher’s> mother or female guardian. The question consisted of eight academic categories.
6 The highest educational attainment by <future teacher’s> father or male guardian. The question consisted of eight academic categories.
7 The frequency of speaking the language used for testing at home. The response options ranged from “always” to “never”.
8(a) The highest grade level at which <future teacher> studied mathematics in <secondary school>.
8(b) The most advanced mathematics course in <secondary school>.
9 The level of grades that <future teacher> received during his/her secondary schooling.
10 Whether <future teacher> had another career before commencing his/her teacher education program.
11 Reason for becoming a teacher. The question consisted of nine possible reasons. Each <future teacher> rated the significance of the reason to become a teacher.
12 The circumstances—if any—hindering studies during the teacher education program (such as family responsibility, borrowing money, or having a job).
13 <Future teacher’s> perception of his/her future in teaching.
note: Carets (< >) denote information to be replaced with the nationally-appropriate term.
Exhibit 4.3: Content of future teacher questionnaire, Part A: General background

51TEDS-M SURVEY QUESTIONNAIRES
Exhibit 4.4: Content of future teacher questionnaire, Part B: Opportunities to learn
Part B Item Description Item Content Number
Opportunities to learn: University or tertiary-level mathematics
1 <Future teachers> were asked to indicate whether or not they studied each of the following 19 university-level mathematic topics during their teacher education program: • Foundations of geometry or axiomatic geometry• Analytic/coordinate geometry• Non-Euclidean geometry• Differential geometry• Topology• Linear algebra• Set theory• Abstract algebra• Number theory• Beginning calculus• Calculus• Multivariate calculus• Advanced calculus or real analysis or measure theory• Differential equations• Theory of real functions and theory of complex functions or functional analysis• Discrete mathematics, graph theory, game theory, combinatorics, or Boolean algebra• Probability• Theoretical or applied statistics• Mathematical logic.
<Future teachers> were asked to indicate whether or not they studied each of the following seven topics during their teacher education program:• Numbers• Measurement• Geometry• Functions, relations, and equations• Data representation, probability, and statistics• Calculus• Validation, structuring, and abstracting.
<Future teachers> were asked to indicate the level (i.e., school-level curriculum, more conceptual level than the school curriculum, and/or beyond the school curriculum) of emphasis given to learning mathematics during their teacher education program.
<Future teachers> were asked to indicate whether or not they studied each of the following eight topics during their teacher education program:• Foundations of mathematics • Context of mathematics education• Development of mathematics ability and thinking• Mathematics instruction• Developing teaching plans• Mathematics teaching: observation, analysis, and reflection• Mathematics standards and curriculum• Affective issues in mathematics.
Opportunities to learn: School-level mathematics
2
Opportunities to learn: Mathematics education
4
3
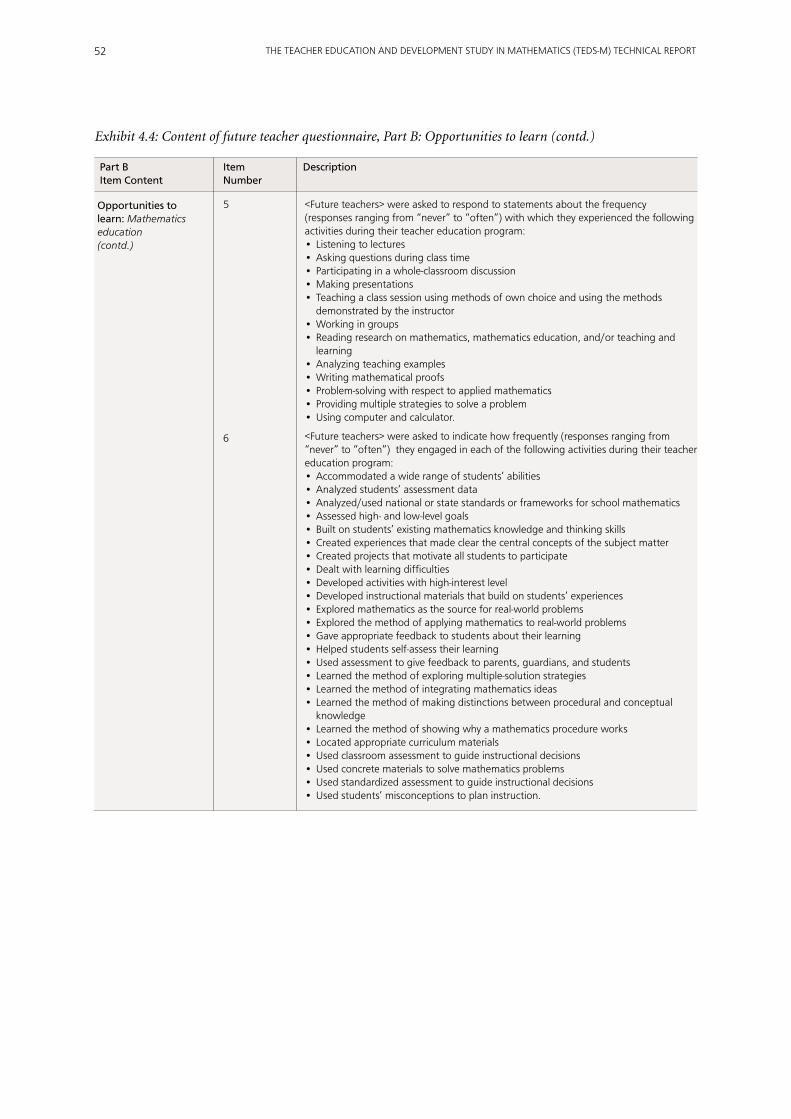
THE TEACHER EDUCATION AND DEVELOPMENT STUDY IN MATHEMATICS (TEDS-M) TECHNICAL REPORT52
Exhibit 4.4: Content of future teacher questionnaire, Part B: Opportunities to learn (contd.)
Part B Item Description Item Content Number
5 <Future teachers> were asked to respond to statements about the frequency (responses ranging from “never” to “often”) with which they experienced the following activities during their teacher education program:• Listening to lectures• Asking questions during class time• Participating in a whole-classroom discussion• Making presentations • Teaching a class session using methods of own choice and using the methods
demonstrated by the instructor• Working in groups• Reading research on mathematics, mathematics education, and/or teaching and
learning• Analyzing teaching examples• Writing mathematical proofs• Problem-solving with respect to applied mathematics• Providing multiple strategies to solve a problem • Using computer and calculator.
<Future teachers> were asked to indicate how frequently (responses ranging from “never” to “often”) they engaged in each of the following activities during their teacher education program:• Accommodated a wide range of students’ abilities• Analyzed students’ assessment data• Analyzed/used national or state standards or frameworks for school mathematics• Assessed high- and low-level goals• Built on students’ existing mathematics knowledge and thinking skills• Created experiences that made clear the central concepts of the subject matter• Created projects that motivate all students to participate• Dealt with learning difficulties• Developed activities with high-interest level• Developed instructional materials that build on students’ experiences• Explored mathematics as the source for real-world problems• Explored the method of applying mathematics to real-world problems • Gave appropriate feedback to students about their learning• Helped students self-assess their learning• Used assessment to give feedback to parents, guardians, and students • Learned the method of exploring multiple-solution strategies • Learned the method of integrating mathematics ideas • Learned the method of making distinctions between procedural and conceptual
knowledge• Learned the method of showing why a mathematics procedure works• Located appropriate curriculum materials• Used classroom assessment to guide instructional decisions• Used concrete materials to solve mathematics problems• Used standardized assessment to guide instructional decisions • Used students’ misconceptions to plan instruction.
6
Opportunities to learn: Mathematics education (contd.)

53TEDS-M SURVEY QUESTIONNAIRES
Exhibit 4.4: Content of future teacher questionnaire, Part B: Opportunities to learn (contd.)
Part B Item Description Item Content Number
7 <Future teachers> were asked to indicate whether or not they studied each of the following topics during their teacher education program:• History of education and educational systems• Philosophy of education• Sociology of education• Educational psychology• Theories of schooling• Methods of educational research• Assessment and measurement• Knowledge of teaching.
<Future teachers> were asked to indicate whether or not they had opportunity to learn each of the following specific skills/strategies related to teaching students with diverse backgrounds during their teacher education program:• Teaching students with behavioral/emotional problems• Teaching students with learning disabilities • Teaching gifted studies• Teaching students from diverse cultural backgrounds• Accommodating the needs of students with physical disabilities • Working with students from disadvantaged backgrounds• Teaching standards and codes of conduct• Reflecting on the effectiveness of their own teaching• Reflecting on their own professional knowledge• Identifying their own learning needs.
<Future teachers> were asked whether or not they learned how to enhance each of their own following listed instruction and teaching skills during their teacher education program:• Stages of child development and learning• The method of developing research projects to test teaching strategies• The relationships between education, social justice, and democracy• New teaching practices by observing teachers• The method of developing/testing new teaching practices• The method of setting appropriate learning expectations for students• The application of research findings to improve knowledge and practice• The method of connecting learning across subject areas• Ethical standards and codes of conduct• Methods of enhancing students’ confidence and self-esteem• Changing schooling practices• Finding appropriate resources for teaching.
<Future teachers> were asked whether or not they spent time in a <primary/secondary school> during their <field experience>.
Future teachers were asked to specify the proportion of time that they were in charge of teaching the class during their field experience. The response range was “(a) less than one quarter of the time,” “(b) a quarter or more, but less than half,” “(c) half or more, but less than three quarters,” “(d) three quarters or more.”
Future teachers were asked to specify the proportion of time that assigned <mentors/instructors/supervisors> were present in the same classroom as them during their field experience.
<Future teachers> were asked to indicate the frequency (response options were “never,” “rarely,” “occasionally,” “often”) with which they experienced each of the following listed activities during their field experience:• Observing modeling of teaching strategies • Putting into practice theories for teaching mathematics• Completing assessment tasks that required them to apply ideas they learned during
their coursework• Receiving feedback on their implementation of teaching strategies• Collecting and analyzing evidence about student learning• Testing findings from educational research• Developing strategies to reflect on their own professional knowledge• Demonstrating the application of teaching methods learned during coursework.
8Opportunities to learn: Teaching for diversity and reflection on practice
9
Opportunities to learn: Education and <pedagogy>
10aOpportunities to learn: School experience and the field experience/practicum
12
13
11

THE TEACHER EDUCATION AND DEVELOPMENT STUDY IN MATHEMATICS (TEDS-M) TECHNICAL REPORT54
Exhibit 4.4: Content of future teacher questionnaire, Part B: Opportunities to learn (contd.)
Part B Item Description Item Content Number
14 <Future teachers> were asked to rate their level of agreement (responses ranging from “disagree” to “agree”) with each of the following statements pertaining to experiences during their teacher education program:• <Future teacher> had a clear understanding of what a school-based <supervising
teacher> expected of him/her in order to pass the <field experience>• The school-based <supervising teacher> valued the ideas and approaches the <future
teacher> brought from his/her teacher education program• The school-based <supervising teacher> used criteria/standards provided by a
university when reviewing lessons with <future teacher>• <Future teacher> learned the same criteria or standards for good teaching during his/
her teacher education coursework and <field experience>• Future teacher in his/her <field experience/practicum> had to demonstrate that he/
she could teach according to the same criteria/standards used in his/her <university/college> courses
• The feedback <future teacher> received from a school-based <supervising teacher> that helped him/her improve his/her understanding of students
• The feedback <future teacher> received from a school-based <supervising teacher> that helped him/her improve his/her understanding of teaching methods
• The feedback <future teacher> received from a school-based <supervising teacher> that helped him/her improve his/her understanding of students, teaching methods, and the curriculum
• The feedback <future teacher> received from a school-based <supervising teacher> that helped him/her improve his/her knowledge of mathematics content
• The teaching methods <future teacher> used during his/her <field experiences> were quite different from the methods he/she learned during the teacher preparation program
• The regular supervising teacher in the <future teacher’s> <field-experience> classroom taught in ways that differed markedly from the methods the <future teacher> learned during his/her teacher education program.
<Future teachers> were asked to state whether they agreed or not with each of the following statements designed to gauge their opinion of the coherence of their teacher preparation program:• The coherence between the teacher education program and <future teachers’> main
needs• The consistency of courses in the program• The coherence between the program’s organization and preparing effective teachers• The logical sequence of program development in terms of content and topics
covered by courses• The coherence of the program with respect to providing explicit standards
expectations for beginning teachers• The clarity of links between the courses in the program.
15Coherence of the teacher education program
Opportunities to learn: School experience and the field experience/practicum (contd.)
notes:
Carets (< >) denote information to be replaced with the nationally-appropriate term.
a If a <future teacher> did not have any field experience, he or she was asked to skip Questions 11 to 14 and answer Question 15.

55TEDS-M SURVEY QUESTIONNAIRES
• OTL mathematics education/pedagogy: This section included items designed to allow exploration of the interaction between mathematics content and pedagogy. Additional scales included items about learning strategies in mathematics. Future teachers were asked to indicate whether or not they had studied each topic as part of their teacher preparation program. Other questions asked them how often they had engaged in a number of activities and learning strategies during their teacher preparation program.
• OTL general knowledge for teaching: These items focused on topics considered relevant for all teachers to know, such as educational theory, general principles of instruction, classroom management, curriculum theory, and so on. These items asked future teachers whether they had studied such topics during their teacher preparation program.
• OTL teaching for diversity and reflection on practice: The items included ones about developing and using materials for teaching as well as items about accommodating diverse levels of student learning. Additional items explored learning how to assess and reflect on one’s own teaching and develop strategies to improve one’s ownprofessional knowledge.
•OTL school experience and the practicum: These items asked future teachers more indepth questions about their school-based (field, practicum) experience in terms of whether they had spent time in the classroom in a primary or secondary school and, if so, for how long; whether a school supervisor had been assigned to them; the particular activities in which they had been engaged and at what levels; and whether they found the experience helpful. An additional set of questions asked about diverse characteristics of the practicum (e.g., the role of the mentor, feedback received, standards, methods used, and level of mathematics knowledge and pedagogy of the classroom teacher or mentor).
• OTL in a coherent program: The items included here were designed to allow exploration of program consistency across the courses and experiences offered to future teachers, and whether their program had explicit standards with respect to what they should learn from it.
4.2.1.3 Part C: Mathematics knowledge for teaching
TEDS-M measured the intended and achieved knowledge of mathematics and mathematics pedagogy of future teachers in their last year of the sampled teacher education programs. As described in Chapter 3, the items used to measure this area of future teacher knowledge built on the Mathematics Teaching for the 21st Century (MT21) study (Schmidt et al., 2007), which employed an earlier and shortened version of this part of the FTQ.
4.2.1.4 Part D: Beliefs
The aim of the questions included in this part of the questionnaire was to elicit information that would help determine whether teacher preparation can positively influencefutureteachers’beliefsaboutwhattheyteachandhowtheyteachorwhetherthese beliefs are an intrinsic characteristic of those individuals who become teachers (Tatto & Coupland, 2003). In TEDS-M 2008, this measurement area was informed by work related to the Teaching and Learning to Teach study at MSU (Deng, 1995; Tatto, 1996, 1998, 1999, 2003), and by work of other international scholars such as Grigutsch, Raatz, and Törner (1998), Ingvarson, Beavis, Danielson, Ellis, and Elliott (2005), and
Ingvarson, Beavis, and Kleinhenz (2007).

THE TEACHER EDUCATION AND DEVELOPMENT STUDY IN MATHEMATICS (TEDS-M) TECHNICAL REPORT56
The TEDS-M beliefs scales encompassed five categories of belief (see also Exhibit 4.5):
• The nature of mathematics: These questions, which asked future teachers to indicate
their perceptions of mathematics as a subject (e.g., mathematics as formal, structural,
procedural, or applied) were based on work by Grigutsch et al. (1998) and Ingvarson
et al. (2005, 2007). The items under this beliefs category formed two distinct scales—
mathematics as a set of rules and procedures, and mathematics as a process of
enquiry.
• Learning mathematics: These questions focused on the appropriateness of particular
instructional activities, school students’ cognition processes, and the purposes of
mathematics as a school subject. The 14 items on beliefs about learning mathematics
formed two distinct scales—learning mathematics through reliance on the teacher,
and learning mathematics through self-reliance.
• Mathematics achievement: The eight items in this section of the questionnaire
tapped into future teachers’ beliefs about various teaching strategies used to facilitate
mathematics learning, how mathematics learning takes place, and the application
of attribution theory to teaching and learning interactions (e.g., innate ability for
learning mathematics). The items used to measure these areas came from a number
of studies, including those by Deng (1995), the MT21 study (Schmidt, Blömeke, &
Tatto, 2011), and several studies by Tatto (1996, 1998, 1999, 2003). The items formed
two scales. The first embraced the notion that achievement in mathematics depends
largely on children’s fixed ability. The second held to the premise that achievement in
mathematics depends largely on children’s efforts to learn.
• Preparedness for teaching mathematics: The questions asked in relation to this belief
concerned the extent to which future teachers perceived their teacher preparation
had given them the capacity to carry out the central tasks of teaching and to meet the
demands of their first year of practice. The items in this area were therefore designed
to explore different dimensions of the impact of teacher preparation on preparedness
to teach. The preparedness items used in TEDS-M came from ACER’s Preparedness
to Teach inventory, a robust measure based on extensive research by Ingvarson and
colleagues (2005, 2007). The items focused on preparedness to (amongst other skills)
conduct assessment, manage learning environments, and engage students in effective
learning. Questions designed to measure the extent to which the future teachers
felt they had become active members of their professional community were also
included.
• Program effectiveness: These questions asked future teachers to indicate how well,
overall, they thought their teacher preparation had been in helping them learn to
teach mathematics. Questions probed future teachers’ beliefs about the degree to
which their instructors modeled good teaching practices and used and promoted
research, evaluation, and reflection in their courses. The questions also asked the
future teachers if their instructors valued future teachers’ various experiences before
and during their teacher preparation program.

57TEDS-M SURVEY QUESTIONNAIRES
Exhibit 4.5: Content of future teacher questionnaire, Part D: Beliefs
Part D Item Description Item Content Number
Beliefs about the nature of mathematics
1 <Future teachers> were asked to state whether or not they agreed with each of the following (abbreviated) statements regarding beliefs about the nature of mathematics: • Mathematics is a collection of rules and procedures that describe how to solve a
problem • Mathematics involves the remembering and application of definitions, formulas,
mathematical facts, and procedures• Mathematics involves creativity and new ideas• When doing mathematics, you can discover and try out many things by yourself• When solving mathematical tasks, you need to know the correct procedure• If you engage in mathematics tasks, you can discover new things (connections, rules,
concepts)• Logical rigor and precision are fundamental to mathematics • Mathematical problems can be solved correctly in many ways• Many aspects of mathematics have practical relevance• Mathematics help us solve everyday problems and tasks• Doing mathematics requires considerable practice, correct application of routines,
and problem-solving strategies• Mathematics means learning, remembering, and applying.
<Future teachers> were asked to state whether or not they agreed with statements reflecting beliefs about learning mathematics. The statements focused on the following:• The best way of doing well in mathematics• Whether or not students need to be taught• The importance of having understood the mathematical problem even when one has
got the answer right • Methods of being good at mathematics• The best way to learn mathematics• The aspect of learning given emphasis when students are working on mathematics
problems• The importance of understanding the reason for the correct answer• The importance of figuring out the method of solving mathematical problems • Nonstandard procedures for solving problems• The value of hands-on mathematics experiences • The value of the time used to investigate the reason for a solution • The need for teachers to help students solve mathematical problems• The need for teachers to encourage students to find their own solutions• Discussion of different ways of solving particular problems.
<Future teachers> were asked to state whether they agreed or not with statements reflecting beliefs about mathematics achievement. The statements focused on the following:• The use of hands-on models and other visual aids for older students• Being good at mathematics• The importance of natural ability and effort in mathematics• Participation in multi-step problem-solving activities• Gender differences in mathematics• The persistence of mathematical ability• Being good at mathematics• Ethnicity and mathematics ability.
Beliefs about learning mathematics
2
Beliefs about mathematics achievement
3
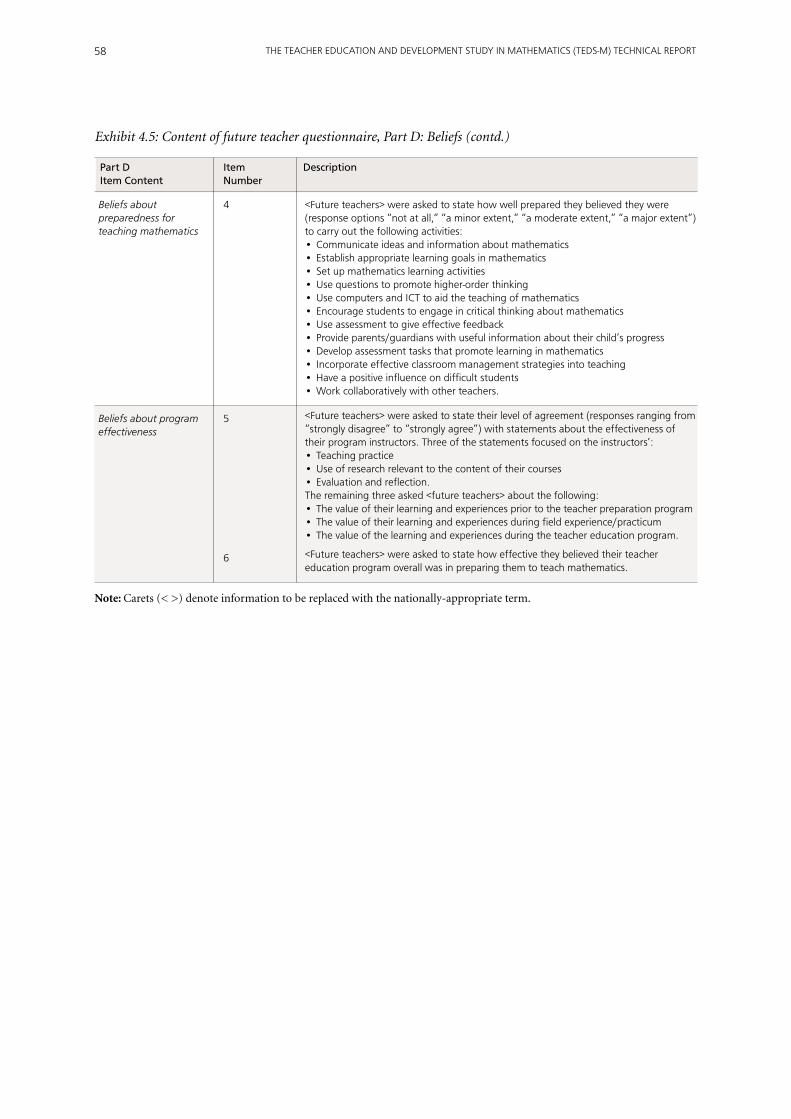
THE TEACHER EDUCATION AND DEVELOPMENT STUDY IN MATHEMATICS (TEDS-M) TECHNICAL REPORT58
Exhibit 4.5: Content of future teacher questionnaire, Part D: Beliefs (contd.)
Part D Item Description Item Content Number
Beliefs about preparedness for teaching mathematics
4 <Future teachers> were asked to state how well prepared they believed they were (response options “not at all,” “a minor extent,” “a moderate extent,” “a major extent”) to carry out the following activities:• Communicate ideas and information about mathematics• Establish appropriate learning goals in mathematics• Set up mathematics learning activities• Use questions to promote higher-order thinking• Use computers and ICT to aid the teaching of mathematics• Encourage students to engage in critical thinking about mathematics• Use assessment to give effective feedback• Provide parents/guardians with useful information about their child’s progress• Develop assessment tasks that promote learning in mathematics• Incorporate effective classroom management strategies into teaching• Have a positive influence on difficult students• Work collaboratively with other teachers.
<Future teachers> were asked to state their level of agreement (responses ranging from “strongly disagree” to “strongly agree”) with statements about the effectiveness of their program instructors. Three of the statements focused on the instructors’:• Teaching practice• Use of research relevant to the content of their courses• Evaluation and reflection.The remaining three asked <future teachers> about the following:• The value of their learning and experiences prior to the teacher preparation program• The value of their learning and experiences during field experience/practicum• The value of the learning and experiences during the teacher education program.
<Future teachers> were asked to state how effective they believed their teacher education program overall was in preparing them to teach mathematics.
Beliefs about program effectiveness
5
6
note: Carets (< >) denote information to be replaced with the nationally-appropriate term.

59TEDS-M SURVEY QUESTIONNAIRES
4.2.2 The Educator Questionnaire (EQ)
TEDS-M conceptualized the educators of future mathematics teachers as particularly
important individuals through whom the intended teacher education curriculum
becomes the implemented curriculum. With that in mind, the TEDS-M researchers
determined that the survey instrument should collect data on the educators’ general
backgrounds and key aspects of the OTL they provided to the future teachers in their
respective programs. The questionnaire also asked the educators to answer questions
about their beliefs relating to the same areas addressed in the FTQs so that the educators’
responses could be compared with those of the future teachers.
4.2.2.1 Definition of educators of future teachers of mathematics
TEDS-M defined these educators as persons with regular, repeated responsibility for
teaching future teachers of mathematics within a given teacher-preparation route and/
or program. The study also classified these educators into three groups:
• Mathematics and mathematics pedagogy educators: Those educators responsible
for teaching one or more of the program’s required courses in mathematics or
mathematics pedagogy during the study’s data-collection year at any stage of the
institution’s teacher preparation program.
• General pedagogy educators: Those educators responsible for teaching one or more
of the program’s required courses in foundations or general pedagogy (other than
a mathematics or mathematics pedagogy course) during the study’s data-collection
year at any stage of the institution’s teacher preparation program.
• Educators: Those individuals belonging to both Groups 1 and 2 as described above
and so responsible for teaching one or more of the program’s required courses in
mathematics and/or mathematics pedagogy and/or general pedagogy during the
study’s data-collection year at any stage of the institution’s teacher preparation
program.
4.2.2.2 Questionnaire content
The EQ asked mathematics, mathematics pedagogy, and general pedagogy educators
of future teachers within the sample of teacher preparation institutions questions
about, amongst other matters, their teaching background, professional and research
experience, and the OTL they offered the students in their courses. Exhibit 4.6 details
the areas covered by the questionnaire.
4.2.3 The Institutional Program Questionnaire (IPQ)
TEDS-M decided to conduct a survey of teacher preparation institutions in order to
elicit the following:
• Dataoninstitutionalprogramcharacteristicsthatmightdifferfromthecharacteristics
in other institutions in the same teacher preparation route;
• Datapertainingtovariablespotentiallyinfluencingthemeasuredoutcomesofthe
study; and
• Datathatcouldnotfeasiblybecollectedbyothermeans.

THE TEACHER EDUCATION AND DEVELOPMENT STUDY IN MATHEMATICS (TEDS-M) TECHNICAL REPORT60
Exhibit 4.6: Content of educator questionnaire
Part Item Item Description Content Number
General and academic backgrounds
1 Current academic status.
2 Gender.
3 Highest educational qualification for six academic areas (i.e., mathematics, mathematics education, education, other mathematics-related discipline or field, and other discipline or field).
4 whether educator considered himself/herself a mathematics specialist.
5 Whether educator held a <teaching certificate, license, or registration> to teach.
6 whether educator held a teaching position in a school.
Teaching background
Part A
1 Years of experience teaching in <primary> and/or <secondary> schools.
2 Years of experience teaching mathematics in <primary> and/or <secondary> schools.
3 Years of employment with current institution.
4 Years of preparation for teaching <future teachers> who will teach at <primary> or <secondary> schools.
5 The proportion of <future teachers> in the course that educator teaches.
6 The level of the course that educator teaches.
Part B
Professional experience 1 Educators were asked to state whether and when (either prior to or after starting work, or never) they received special preparation for teaching.
2 Educators were asked to state whether or not they had received professional training in the areas of mathematics, mathematics <pedagogy>, and/or general <pedagogy> during the last 12 months.
Part C
Research experience 1 Educators were asked to state whether or not they had research experience in the following areas:
• Mathematics • Mathematics education or mathematics <pedagogy>, and/or • Other than mathematics <pedagogy>.
2 Educators were asked to specify the percentage of working time (out of a total 100% for five listed options) that they had devoted over the previous 12 months to the activities:
• Teaching • Research • Administration • <Service> to the profession • Other.
Part D
Field-based instruction 1a Educators were asked to state if their role in <future teachers’> <practicum/field experience> included the following activities:
• Observing <future teachers’> teaching • Providing advice • Assessing <future teachers’> teaching acumen.
2 Educators were asked to state the length of time they spent instructing and/or supervising <future teachers> during their <practicum/field experience>.
Part E
Opportunities to learn in educator’s <course> b
Educators were asked about the career objectives of the <future teachers> enrolled in their course.
Educators were asked to specify the main subject covered by the course.
Part F

61TEDS-M SURVEY QUESTIONNAIRES
Exhibit 4.6: Content of educator questionnaire (contd.)
Part Item Item Description Content Number
Opportunities for <future teachers> to learn mathematics and mathematics <pedagogy> during educator’s <course>
1 Educators were asked to state the level at which the <future teachers> in their course were learning mathematics:
• Level of the school curriculum • A more conceptual level than the school curriculum, and/or • Beyond the school curriculum.
2 Educators were asked to state whether or not the <future teachers> in their course had opportunities to learn each of the following specific skills or areas of knowledge during the course:
• Use of national/state standards or framework for school mathematics • Methods of building on students’ existing mathematics knowledge • Application of mathematics to real-world problems • Use of concrete materials to solve mathematics problems • Methods of exploring multiple solutions • Methods of showing why a mathematics procedure works • Methods of making distinctions between procedural and conceptual
knowledge • Methods of integrating mathematics ideas.
Part G c
Opportunities for <future teachers> to learn general <pedagogy> during educator’s <course>
1 Educators were asked to state whether or not the <future teachers> in their course had opportunities to learn each of the following skills or knowledge areas (aimed at enhancing <future teachers’> instruction and teaching skills) during the course:
• Stages of child development and learning • Methods of developing research projects to test teaching strategies • Relationships between education, social justice, and democracy • New teaching practices through observing teachers • Methods of developing/testing new teaching practices • Methods of setting out learning expectations for students • Application of research findings to improve knowledge and practice • Methods of connecting learning across subject areas • Ethical standards and codes of conduct • Methods of enhancing students’ confidence and self-esteem • Changing schooling practices • Finding appropriate resources for teaching.
2 Educators were asked to state whether or not the <future teachers> in their course had opportunities to learn each of the following skills or knowledge areas relating to teaching students with diverse backgrounds:
• Strategies for teaching students with behavioral/emotional problems • Strategies for teaching students with learning disabilities • Strategies for teaching gifted students • Strategies for teaching students from diverse cultural backgrounds • Accommodating the needs of students with physical disabilities • Working with students from disadvantaged backgrounds • Using teaching standards and codes of conduct • Reflecting on the effectiveness of their teaching • Reflecting on their professional knowledge • Strategies for identifying their own learning needs.
Part H d

THE TEACHER EDUCATION AND DEVELOPMENT STUDY IN MATHEMATICS (TEDS-M) TECHNICAL REPORT62
Exhibit 4.6: Content of educator questionnaire (contd.)
Part Item Item Description Content Number
Opportunities to learn during educator’s <course>
1 Educators were asked to state whether or not they expected the <future teachers> in their course to do each of the following activities:
• Listen to a lecture • Ask questions • Participate in class discussions • Make presentations • Demonstrate teaching using <future teacher’s> selected method • Demonstrate teaching using educator’s selected method • Group work • Read research on mathematics, mathematics education, and/or teaching
and learning • Analyze teaching examples • Write mathematical proofs • Problem-solve in relation to applied mathematics • Provide multiple strategies to solve a problem • Use computer and calculator.
2 Educators were asked to state whether or not they required the <future teachers> in their course to do each of the following activities:
• Observe modeling of teaching strategies • Practice theories for teaching subject-matter content • Conduct assessment • Provide feedback about their teaching • Evaluate their students’ learning • Apply research findings on learning difficulties to their teaching practice • Use strategies to reflect on their professional knowledge • Demonstrate teaching methods.
3 Educators were asked to state whether or not the <future teachers> in their course had opportunities to learn each of the following skills or knowledge areas during the course:
• Accommodate a wide range of student ability • Analyze students’ assessment data • Assess high- and low-level goals • Create experiences that make clear the central concepts of subject matter • Create projects that motivate all students to participate • Deal with learning difficulties • Develop activities with high-interest level • Develop instructional materials that build on students’ experiences • Give students appropriate feedback • Help students self-assess their own learning • Locate appropriate curriculum materials • Use assessment to give feedback to parents, guardians, and students • Use classroom assessment to guide instructional decisions • Use students’ misconceptions to plan instruction • Use standardized assessment to guide instructional decisions.
Part I
Coherence of the teacher education program
1 Educators were asked to state the extent to which they agreed (four response options ranging from “disagree” to “agree”) with statements about the coherence of the education program. The statements focused on the following:
• The coherence of the teacher education program with <future teachers’> main needs
• The consistency of courses in the program • The coherence between the program’s organization and preparing effective
teachers • The logical sequence of development in terms of the content and topics
covered by the program’s courses • The coherence between the program and the explicit standards
expectations for beginning teachers • Clarity of the links across the program’s courses.
Part J d

63TEDS-M SURVEY QUESTIONNAIRES
Exhibit 4.6: Content of educator questionnaire (contd.)
Part Item Item Description Content Number
Beliefs about mathematics
1 Educators were asked to state the extent to which they agreed (six response options ranging from “strongly disagree” to “strongly agree”) with each of the following “abbreviated” statements reflecting beliefs about mathematics:
• Mathematics is a collection of rules and procedures • Mathematics involves remembering and applying definitions, formulas,
mathematical facts, and procedures • Mathematics involves creativity and new ideas • When doing mathematics, you can discover and try out many things by
yourself • When solving mathematical tasks, you need to know the correct procedure • If you engage in mathematics tasks, you can discover new things • Logical rigor and precision is fundamental to mathematics • Mathematical problems can be solved correctly in many ways • Many aspects of mathematics have practical relevance • Mathematics helps us solve everyday problems and tasks • Doing mathematics requires considerable practice, correct application of
routines, and problem-solving strategies • Mathematics means learning, remembering, and applying.
2 Educators were asked to state the extent to which they agreed (six response options ranging from “strongly disagree” to “strongly agree”) with statements reflecting beliefs about mathematics. The statements focused on the following:
• The best way of doing well in mathematics • Whether or not students need to be taught • The importance of having understood the mathematical problem even
when one has got the answer right • Methods of being good at mathematics • The best way to learn mathematics • The aspect of learning given emphasis when students are working on
mathematics problems • The importance of understanding the reason for the correct answer • The importance of figuring out the method of solving mathematical
problems • Nonstandard procedures for solving problems • The value of hands-on mathematics experiences • The value of the time used to investigate the reason for a solution • The need for teachers to help students solve mathematical problems • The need for teachers to encourage students to find their own solutions • Discussion of different ways of solving particular problems.
3 Educators were asked to state the extent to which they agreed (six response options ranging from “strongly disagree” to “strongly agree”) with statements reflecting beliefs about student achievement in mathematics. The statements focused on the following:
• The use of hands-on models and other visual aids for older students • Being good at mathematics • The importance of natural ability and effort in mathematics • Participation in multi-step problem-solving activities • Gender differences in mathematics • The persistence of mathematical ability • Being good at mathematics • Ethnicity and mathematics ability.
Part K
Beliefs about learning mathematics
Beliefs about student achievement in <primary/secondary> mathematics

THE TEACHER EDUCATION AND DEVELOPMENT STUDY IN MATHEMATICS (TEDS-M) TECHNICAL REPORT64
Exhibit 4.6: Content of educator questionnaire (contd.)
Part Item Item Description Content Number
Preparedness for teaching mathematics
1 Educators were asked to state the extent to which they agreed (four response options ranging from “not at all” to “a major extent”) with statements reflecting beliefs about the skills or knowledge areas <future teachers> should possess when they start their teaching career. The statements focused on the following:
• Communicating ideas and information about mathematics • Establishing appropriate learning goals in mathematics • Setting up mathematics learning activities • Using questions to promote higher-order thinking • Using computers and ICT to aid the teaching of mathematics • Challenging students to engage in critical thinking about mathematics • Establishing a supportive environment for learning • Using assessment to give effective feedback • Providing parents and guardians with useful information about their child’s
progress • Developing assessment tasks that promote mathematics learning • Incorporating effective classroom management strategies into teaching • Having a positive influence on difficult students • Working collaboratively with other teachers.
2 Educators were asked to state how effective they believed the teacher education program overall was in preparing teachers of mathematics.
Part L
notes:
Carets (< >) denote information to be replaced with the nationally-appropriate term.
a If an educator did not fit any of the listed roles, he or she was asked to skip the next questions and move to Part F.
b Educators were asked to select one of the courses they taught when answering the questions in Part F.
c Only those educators whose selected course included mathematics content or mathematics <pedagogy> were requested to answer the Part G questions.
d Only those educators whose selected course included general <pedagogy> were asked to answer the Part H questions.
4.2.3.1 Definition of teacher preparation institutions
TEDS-M 2008 defined teacher preparation institutions as secondary or post-secondary
schools/colleges/universities offering structured OTL (i.e., a program or programs) on
a regular and frequent basis to future teachers within a route of teacher preparation.
For the purposes of this questionnaire, the term “program” referred to the set of courses
or units of study and other learning activities that constituted the formal preparation
provided to future primary or lower-secondary teachers of mathematics. These were
the programs (so-called teacher preparation units or TPUs) from which future teachers
were recruited to complete the TEDS-M FTQs.
Eligible teacher education programs were concurrent, consecutive, and apprenticeship.
TEDS-M defined a concurrent teacher preparation program as a single program that
included studies in subjects future teachers would be teaching (academic or subject-
matter preparation), studies of pedagogy and education (pedagogical and professional
studies), and practical experience in the classroom. A consecutive teacher preparation
program was defined as one that included pedagogical and professional studies and
practical experience, preceded by a separate program for academic or subject-matter
preparation (typically leading to a separate degree or diploma) that might or might
not occur in the same institution. An apprenticeship teacher preparation program
referred to a program consisting predominantly of school-based experience, with other
institutions playing only a minor, marginal, or supporting role.
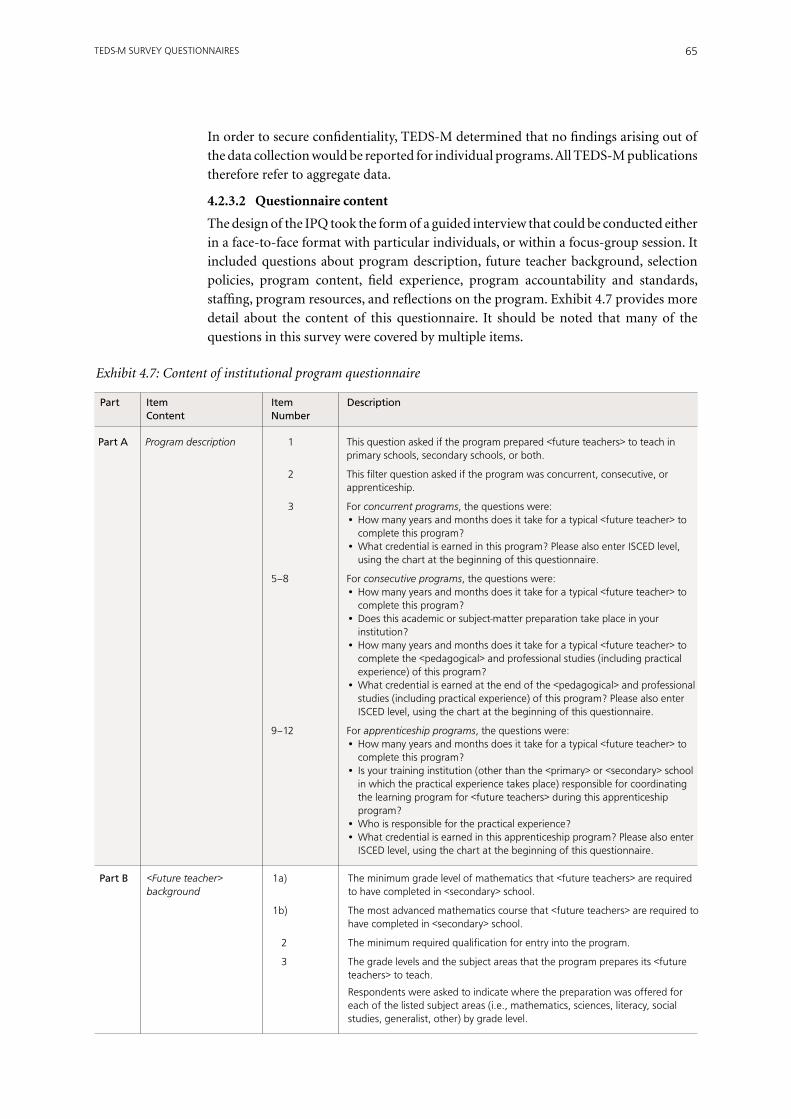
65TEDS-M SURVEY QUESTIONNAIRES
In order to secure confidentiality, TEDS-M determined that no findings arising out of
the data collection would be reported for individual programs. All TEDS-M publications
therefore refer to aggregate data.
4.2.3.2 Questionnaire content
The design of the IPQ took the form of a guided interview that could be conducted either
in a face-to-face format with particular individuals, or within a focus-group session. It
included questions about program description, future teacher background, selection
policies, program content, field experience, program accountability and standards,
staffing,programresources,andreflectionsontheprogram.Exhibit4.7providesmore
detail about the content of this questionnaire. It should be noted that many of the
questions in this survey were covered by multiple items.
Exhibit 4.7: Content of institutional program questionnaire
Part Item Item Description Content Number
Program description 1 This question asked if the program prepared <future teachers> to teach in primary schools, secondary schools, or both.
2 This filter question asked if the program was concurrent, consecutive, or apprenticeship.
3 For concurrent programs, the questions were: • How many years and months does it take for a typical <future teacher> to
complete this program? • What credential is earned in this program? Please also enter ISCED level,
using the chart at the beginning of this questionnaire.
5–8 For consecutive programs, the questions were: • How many years and months does it take for a typical <future teacher> to
complete this program? • Does this academic or subject-matter preparation take place in your
institution? • How many years and months does it take for a typical <future teacher> to
complete the <pedagogical> and professional studies (including practical experience) of this program?
• What credential is earned at the end of the <pedagogical> and professional studies (including practical experience) of this program? Please also enter ISCED level, using the chart at the beginning of this questionnaire.
9–12 For apprenticeship programs, the questions were: • How many years and months does it take for a typical <future teacher> to
complete this program? • Is your training institution (other than the <primary> or <secondary> school
in which the practical experience takes place) responsible for coordinating the learning program for <future teachers> during this apprenticeship program?
• Who is responsible for the practical experience? • What credential is earned in this apprenticeship program? Please also enter
ISCED level, using the chart at the beginning of this questionnaire.
Part A
<Future teacher> background
1a) The minimum grade level of mathematics that <future teachers> are required to have completed in <secondary> school.
1b) The most advanced mathematics course that <future teachers> are required to have completed in <secondary> school.
2 The minimum required qualification for entry into the program.
3 The grade levels and the subject areas that the program prepares its <future teachers> to teach.
Respondents were asked to indicate where the preparation was offered for each of the listed subject areas (i.e., mathematics, sciences, literacy, social studies, generalist, other) by grade level.
Part B

THE TEACHER EDUCATION AND DEVELOPMENT STUDY IN MATHEMATICS (TEDS-M) TECHNICAL REPORT66
Exhibit 4.7: Content of institutional program questionnaire (contd.)
Part Item Item Description Content Number
<Future teacher> background
4 The number of fields that program graduates are normally qualified to teach.
5 The proportion of parttime students during the first year of the program.
6 The location where the program takes place.
7 The number of <future teachers> who began or will begin the program. (Respondents were asked to report by year from 2003 to 2008.)
8a) The number of <future teachers> who successfully completed or will complete the program. (Respondents were asked to report by year from 2003 to 2008.)
8b) The number of <future teachers> who successfully completed or will complete the program with a qualification to teach mathematics. (Respondents were asked to report by year from 2003 to 2008.)
Part B(contd.)
Selection policies 1 who sets the admission policies for the program?
2 The degree of importance of the listed information for the selection of <future teachers> for the program. The list of information included:
• The overall level of attainment of their final year of <secondary schooling> measured by school marks
• The overall level of performance of their final year of <secondary schooling> measured by a national/state examination
• Performance on an examination for admission specially prepared by the institution
• Stability for teaching • Level of mathematics achievement • Gender • Under-represented group in the teaching profession • The order of application • Region of residence • Age.
3 Whether the institution has special strategies to attract <future teachers> into the program.
4 The level of prior academic achievement of <future teachers> in the program with reference to national norms.
5 whether the program makes a special effort to attract fulltime workers with no previous experience of teaching.
6 The proportion of previous fulltime employees among <future teachers> before they entered the program.
Part C
Program content 1 The website address for the program requirement.
2 The program requirement.
3 A: The required number of <liberal arts> courses for the duration of the program.
B: The required number of teaching contact hours per <liberal arts> course.
4 A: The required number of <academic mathematics> courses for the duration of the program.
B: The required number of teaching contact hours per <academic mathematics> course.
5 A: The required number of <mathematics content> courses for the duration of the program.
B: The required number of teaching contact hours per <mathematics content> course.
6 A: The required number of <mathematics pedagogy> courses for the duration of the program.
B: The required number of teaching contact hours per <mathematics pedagogy> course.
Part D

67TEDS-M SURVEY QUESTIONNAIRES
Exhibit 4.7: Content of institutional program questionnaire (contd.)
Part Item Item Description Content Number
<Future teacher> background
7 A: The required number of professional foundation and theory courses for the duration of the program.
B: The required number of teaching contact hours per professional foundations and theory course.
8 A: The required number of general <pedagogy> courses for the duration of the program.
B: The required number of teaching contact hours per general <pedagogy> course.
9 The total number of required courses that <future teachers> needed to complete during the teacher preparation program.
10 The attendance at scheduled <class time> by <future teachers>.
11 The weight (ranging from “little or no weight” to “major weight”) given to goals relating to:
• Curriculum content knowledge • <Pedagogical> content knowledge • General <pedagogy>/educational foundations • Assessing learning • Knowledge of students and diversity • Preparation for further development as a teacher • Understanding the school environment.
12 The institutional requirements to be met in order to successfully complete the program. The question listed eight common institutional requirements. For each of the listed requirements, respondents were asked to select either “Yes” or “No.”
13 a whether or not the program had a document setting out the competencies that <future teachers> needed to have in order to graduate from the program.
14 The origin of the guideline on competencies.
Part D(contd.)
Field experience 1b The type of field experience included in the program (i.e., extended teaching practice or introductory field experiences or both).
2 The number of days that <future teachers> spend in school setting by year (from Year 1 to Year 5).
Respondents were asked to specify the number of days and the average number of hours per day <future teachers> spend in (a) extended teaching practice and (b) introductory field experience.
3 c The frequency of the activities assigned as part of the introductory field experiences in the program. For each of the listed activities, respondents were asked to rate its occurrence during field experiences. The scale ranged from “not at all” to “usually.” The list of activities included:
• Planning lessons • Teaching individual lessons to whole classes • Tutoring individual students • Working with small groups of students • Assisting teachers • Assisting in school activities outside the assigned classroom • Carrying out case studies of selected students • Carrying out classroom observation • Collecting data for research projects • Visiting families in students’ homes • Interviewing teachers • Observing teachers’ meetings.
4 d The frequency with which teacher educator observed <future teachers>.
5 whether practicing teachers received compensation for supervising <future teachers>.
6 whether mathematics specialists had responsibility for supervising <future teachers> in the program.
Part E

THE TEACHER EDUCATION AND DEVELOPMENT STUDY IN MATHEMATICS (TEDS-M) TECHNICAL REPORT68
Exhibit 4.7: Content of institutional program questionnaire (contd.)
Part Item Item Description Content Number
Field experience 7 The percentage of <future teachers> who gained a satisfactory result for their expended teaching practice.
8 The policies regarding <future teachers’> unsatisfactory performance during their extended teaching practice.
9 The assumed responsibilities of supervisors during extended teaching. The question covered five major responsibilities:
• Helping <future teachers> plan • Observations • Instructing, modeling, coaching, etc. • Giving oral feedback and fostering reflection • Assessment.
Each of the major responsibilities also contained two to four specific responsibilities. Respondents were asked to rate the likelihood of having to assume the responsibilities (response options ranged from “definitely yes” to “definitely not”).
10 who determined the structure and nature of the activities undertaken in the school during extended teaching practice.
11 The frequency with which field experience supervisors provided the program with written feedback on individual <future teachers>.
12 The kinds of persons who mentor and/or assess <future teachers> during field experiences. The question asked respondents to indicate whether <future teachers> received mentoring and assessment from the following individuals during their teaching practice:
• Practicing classroom teacher in school • Principal or other administrator • Inspector, <pedagogical> advisor, or other mid-level administrator • Postgraduate students in a university • Senior university teaching staff • Retired school teacher or administrator • Other personnel not included in the above categories.
13 The type of guidance provided on how to assess extended teaching practice.
14 The person responsible for finding extended teaching practice placements.
15 The statement that best describes placement of <future teachers> in schools for extended teaching practice.
Part E(contd.)
Program accountability and standards
1 The level in the institution at which decisions regarding the listed matters pertaining to the program’s curriculum are made. The question listed a number of topics regarding the curriculum. For each topic, respondents were asked to identify who from institution, local district, state or provincial, or national level made the decision.
The listed topics were: • Program goal and emphasis • Selection of textbooks, etc. • Standards of classroom performance • Standards of content knowledge • Subject-matter knowledge to be covered in mathematics • Mathematics <pedagogy> curriculum • General <pedagogy>/educational foundations curriculum/<liberal arts>
curriculum • Number of required credits in program areas • Length of practical training • Location of practical training • Monitoring of <future teachers’> progress • Quality and frequency of supervision during practical training • Type and content of assessments • External examinations.
Part F

69TEDS-M SURVEY QUESTIONNAIRES
Exhibit 4.7: Content of institutional program questionnaire (contd.)
Part Item Item Description Content Number
Staffing 1a) The number of fulltime staff with teaching responsibility in the program.
1b) The number of parttime staff with teaching responsibility in the program.
1c) The distribution of the credentials held by fulltime staff members with teaching responsibilities.
2 The academic rank held by fulltime staff members with teaching responsibilities.
3 The academic background requirement for staff in the program who teach mathematics or mathematics-related content to <future teachers>.
4 The academic background requirement for staff in the program who teach mathematics <pedagogy> to <future teachers>.
5 The academic background requirement for staff in the program who supervise extended teaching practice.
Part G
Program resources 1 The overall annual budget of the program for the year of the study.
2 The budget for instruction.
3 Whether <future teachers> receive direct subsidies for living expenses.
Part H
1 whether historical, social, or cultural factors are essential for <future teachers’> ability to understand the content of the program. If respondents answered “Yes,” they were asked to provide a summary of these factors.
2 The most distinctive strengths of the program.
3 The main problems facing the institution.
4 The important or unique aspects of the program that need to be made known.
Part I
notes:
Carets (< >) denote information to be replaced with the nationally-appropriate term.
a If the answer to Question 13 was “No,” the respondent skipped Question 14 and moved to Part E.
b If the institution did not offer any type of field experience, the respondent skipped the rest of the questions in this part and moved to Part F.
c If the institution did not offer short field experiences, the respondent skipped Question 3.
d If the institution did not offer extended teaching practice, the respondent skipped Questions 4 to 15 and moved to Part F.

THE TEACHER EDUCATION AND DEVELOPMENT STUDY IN MATHEMATICS (TEDS-M) TECHNICAL REPORT70
References
Brese, F., & Tatto, M. T. (Eds.). (2012). User guide for the TEDS-M international database. Amsterdam,
the Netherlands: International Association for the Evaluation of Educational Achievement (IEA).
Deng, Z. (1995). Estimating the reliability of the teacher questionnaire used in the Teacher Education
and Learning to Teach (TELT) study (Technical Series 95–1). East Lansing, MI: National Center for
Research on Teacher Learning Michigan State University. Available online at http://ncrtl.msu.edu/
HTTP/TSeries/TS%2095-1.pdf
Grigutsch, S., Raatz, U., & Törner, G. (1998). Einstellungen gegenüber Mathematik bei
Mathematiklehrern [Mathematics teachers’ epistemological beliefs about the nature of
mathematics]. Journal für Mathematik-Didaktik, 19, 3–45.
Ingvarson, L., Beavis, A., Danielson, C., Ellis, L., & Elliott, A. (2005). An evaluation of the Bachelor of
Learning Management at Central Queensland University. Canberra, ACT: Australian Government
Department of Education, Science, and Technology.
Ingvarson, L., Beavis, A., & Kleinhenz, E. (2007). Factors affecting the impact of teacher education
courses on teacher preparedness: Implications for accreditation policy. European Journal of Teacher
Education, 30(4), 351–381.
Schmidt, W., Blömeke, S., & Tatto, M. T. (2011). Teacher education matters: A study of middle school
mathematics teacher preparation in six countries. New York, NY: Teachers College Press.
Schmidt, W., Tatto, M. T., Bankov, K., Blömeke, S., Cedillo, T., Cogan, L., Hans, S. I., Houang, R.,
Hsieh, F. J., Paine, L., Santillan, M., & Schwille, J. (2007, December). The preparation gap: Teacher
education for middle school mathematics in six countries (MT21 report). East Lansing, MI: Michigan
State University. Available online at http://usteds.msu.edu/MT21Report.pdf
Tatto, M. T. (1996). Examining values and beliefs about teaching diverse students: Understanding
the challenges for teacher education. Educational Evaluation and Policy Analysis, 18(2), 155–180.
Tatto, M. T. (1998). The influence of teacher education on teachers’ beliefs about purposes of
education, roles, and practice. Journal of Teacher Education, 49(1), 66–77.
Tatto,M.T.(1999).Thesocializinginfluenceofnormativecohesiveteachereducationonteachers’
beliefs about instructional choice. Teachers and Teaching, 5(1), 111–134.
Tatto, M. T. (2003, April). Evaluating the effectiveness of the teacher preparation program at Michigan
State University: Analyzing survey and ethnographic evidence. Paper presented at the annual meeting
of the American Educational Research Association, Chicago, IL.
Tatto, M. T., & Coupland, D. (2003). Teaching and measuring attitudes in teacher education. In
J. Raths & A. McAninch (Eds.), Teacher beliefs and classroom performance—the impact of teacher
education: Advances in teacher education (Vol. 6, pp. 123–181). Greenwich, CT: Information Age
Publishing.
Tatto, M. T., Schwille, J., Senk, S., Ingvarson, L., Peck, R., & Rowley, G. (2008). Teacher Education
and Development Study in Mathematics (TEDS-M): Conceptual framework. Amsterdam, the
Netherlands: International Association for the Evaluation of Educational Achievement (IEA).

71
CHAPTER 5: TRanSlaTiOn anD TRanSlaTiOn vERifiCaTiOn Of ThE TEDS-M RESEaRCh inSTRuMEnTS
Barbara Malak-Minkiewicz, IEA Secretariat
Inese Berzina-Pitcher, Michigan State University
5.1 Overview
The international version of the TEDS-M research instruments was developed and
prepared in English, the working language of IEA, by the TEDS-M international study
centers (ISCs) at Michigan State University (MSU) and at the Australian Council
for Educational Research (ACER), with contributions from the national research
coordinators (NRCs) of the 17 participating education systems (hereafter referred to
as countries). The national centers subsequently translated the instruments into local
languages, 12 in total.
When preparing these national versions, each center was expected to follow specific
procedures for translating and adapting the instruments to national contexts. These
procedures were designed to ensure the highest quality of translation possible and
appropriate cultural adaptations, while maintaining international comparability. The
document providing these guidelines, TEDS-M 2008 Survey Operations Procedures,
Unit 3: Translation/Verification (IEA, 2007a), was prepared by the ISCs and further
elaborated and discussed at relevant NRC meetings during the course of the study.
A rigorous process of verifying the translated/adapted instruments was necessary to
ensure the accuracy of the translation and equivalency of the national materials with the
international version. This externally-based process was managed by the IEA secretariat
in Amsterdam, the Netherlands, in association with cApStAn Linguistic Quality Control
(Brussels, Belgium). After language verification, instruments were returned to the NRCs
along with detailed feedback that included suggestions for changes and improvement.
Once necessary changes to the text had been implemented, the ISCs further reviewed
and noted any discrepancies between the layout of the national instruments and the
international version. These needed to be removed before the ISC teams could give final
approval to the printing and administering of the materials.
All TEDS-M participants complied well with the requirements for external verification
of the survey instruments. For the majority of them, translation/layout verification
occurred twice—once before the field trial and once before the main data collection,
thereby assuring the highest quality of each national version.
5.2 Translating the TEDS-M Instruments
5.2.1 Survey Languages
As already noted, the TEDS-M instruments were administered in 12 different languages
(see Exhibit 5.1), with English the most common language used (six countries). The
majority of the participating countries used only one language for administering the

THE TEACHER EDUCATION AND DEVELOPMENT STUDY IN MATHEMATICS (TEDS-M) TECHNICAL REPORT72
survey. Four participants (Canada, Norway, Oman, and Switzerland) used instruments
in two languages. The translation/adaptation process for these countries required
careful checking to ensure the equivalency of the different national-language versions.
Exhibit 5.1: Languages used for TEDS-M instruments
Educational System Language Instruments
Botswana English • • • •
Canada English • • • • French • • • •
Chile Spanish • • • •
Chinese Taipei Traditional Chinese • • • •
Georgia Georgian • • • •
Germany German • • • •
Malaysia English • • • •
Norway a Bokmål • • • • Nynorsk • •
Oman b Arabic • • • English •
Philippines English • • • •
Poland Polish • • • •
Russian Federation Russian • • • •
Singapore English • • • •
Spain c Spanish (Castilian) • • •
Switzerland d French • • • German • • • •
Thailand Thai • • • •
United States English • • • •
Notes:
a Norway incorporated both Bokmål and Nynorsk into the same booklets for future teachers (part of the booklet in one language and part in the other). This procedure is used in Norwegian education.
b Oman did not include future teachers of primary mathematics in the survey. English was used as an alternative to Arabic for the educator questionnaire administered to educators from abroad who did not speak Arabic.
c Spain did not include future teachers of secondary mathematics in the survey. Although instruments were administered in Spanish (Castilian), respondents were permitted to answer in any of the official languages of Spain.
d Switzerland did not administer in French the booklets for future teachers of secondary school mathematics.
Institutional Educator Future teacher Future teacher program questionnaire booklets— booklets— questionnaire primary secondary
5.2.2 Instruments Requiring Translation
These included the following:
• The survey instruments for future mathematics teachers, which also included an
assessment of mathematics knowledge for teaching in primary schools and secondary
schools;
• Thequestionnaireformathematics,mathematicspedagogy,andgeneralpedagogy
teacher educators; and
• The questionnaire for relevant personnel in the participating teacher preparation
institutions.
Those countries administering the surveys in English were expected to adapt the
English of the international versions to the variant of English appropriate for their
context (in addition to implementing any other necessary cultural adaptations).

73TRANSLATION AND TRANSLATION VERIFICATION OF THE TEDS-M RESEARCH INSTRUMENTS
Because some questions and items appeared in more than one instrument, the ISCs
required translation of these common elements to be identical across instruments. The
ISC teams also anticipated a large number of adaptations would be needed because of
specific national (cultural as well as institutional) contexts.
5.2.3 Translators and Reviewers
Each TEDS-M national center was advised to appoint a team of at least two persons—a
translator and a reviewer—to carry out translation and adaptation of the instruments.
Translators were expected to have an excellent knowledge of both English and the target
language, and preferably experience with the educational context of the study and
familiarity with survey development in general.
Reviewers, who were also expected to have an excellent knowledge of both English and
the target language, were required to have experience with the study subject matters
(teacher education and mathematics). These individuals were responsible for checking
the translation’s readability, quality, and appropriateness for the target populations
and contexts. After the reviewers had completed their work, NRCs were required to
incorporate the reviewers’ suggestions into the translations, but they had the discretion
not to implement a change they considered unnecessary or inappropriate.
If more than one translator or reviewer worked on a national version of the instruments,
the ISC required the country in question to have the translation/adaptation further
scrutinized in order to ensure its consistency within and across the instruments.
Similarly, if a country administered an instrument in more than one language, further
inspection of the cross-language consistency of the translation and adaptations was
required. In these instances, NRCs were advised to engage a special reviewer—a person
familiar with both languages—to check the instruments’ comparability.
5.2.4 Translation and Adaptation Guidelines
The survey-instrument translation and adaptation guidelines provided in the TEDS-M
Survey Operations Procedures (IEA, 2007b) and distributed to all NRCs (see Chapter
7 of this current report) were designed to accomplish three purposes: ensure that the
translation followed the rules of the target language and country context; ensure that the
translation was as close to the meaning of the international source version as possible;
and enable the introduction of national adaptations where necessary.
In general, translators were asked to pay particular attention to the following aspects of
their work:
• Findingwordsandphrasesinthetargetlanguagethatwereequivalenttothoseinthe
international version;
• Makingsurethattheessentialmeaningofthetexthadnotchanged;
• Making sure that the translated instruments asked the same questions as the
international version;
• Verifying that national adaptations were equivalent and appropriate in terms of
meaning, context, and cultural appropriateness; and
• Remainingawareofpossiblechangestotheinstrumentlayoutduetotranslation.
The major guidelines for assessing the quality of the translation specified attention to
the following matters:

THE TEACHER EDUCATION AND DEVELOPMENT STUDY IN MATHEMATICS (TEDS-M) TECHNICAL REPORT74
• Translationsshouldhavethesameregister(languagelevel,degreeofformality)as
the source text;
• Translated text should employ correct grammar and usage (e.g., subject/verb
agreement, use of prepositions, verb tenses);
• Translatedtextshouldnotclarify,omit,oraddinformation;
• Translated text should employ equivalent qualifiers and modifiers, in the order
appropriate for the target language;
• Idiomaticexpressionsshouldbetranslatedappropriately,notnecessarilywordfor
word; and
• Spelling,punctuation,andcapitalizationinthetargettextshouldbeappropriatefor
the target language and cultural context of the country.
These guidelines also applied to any adjustments made in order to adapt the
international version to a national context. The design of the TEDS-M international
researchinstrumentsreflectedtheneedforinclusionofvariousnationaladaptations,
such as the national definitions/terms for future teachers, programs, courses, and the
like. NRCs used the ISCED system (UNESCO, 1999) to help them determine, where
necessary, definitions of educational level appropriate to the respective national contexts.
Information to be replaced with the nationally-appropriate term on a mandatory basis
was presented in carets (< >). Optional adaptations (such as names of people) appeared
in cornered brackets ([ ]).
National centers could omit questions or options that they considered did not apply
to their country. They could also add national questions and additional categories if
necessary. Additional questions had to be placed after all international questions, and
changes had to be thoroughly documented. Centers were also required to provide
recoding instructions if they added categories. NRCs were cautioned against making
unnecessary changes when preparing the national version of the instruments, given
that changes increased the likelihood of errors, which could, in turn lead to loss of data
in the international database.
5.2.5 Documenting National Adaptations
The ISC asked the NRCs to document all national adaptations to the international
instruments on a national adaptation form (NAF), one for each instrument. The
NAFs were supplied as electronic documents, and each was accompanied by detailed
instructions on how to complete the form at each stage of the preparation process. The
forms for each survey instrument comprised three sections:
• Questionsrequiringnationaladaptations;
• Otherquestionsfeaturingadaptations;and
• Questionsorquestionpartsthatwouldnotbeadministered.
In addition, the NAFs for the future teacher knowledge booklets included a section
requiring documentation of any adaptations made to question items.
The NAFs were completed and reviewed at various stages of the instrument preparation
process. Version I was completed during the internal translation/adaptation and
review process and was then sent, along with the translated/adapted instruments, for
translation verification. Once verification had been completed, the NRCs updated the
formstoreflectanychangesresultingfromtheverificationandsentVersionIIofthe

75TRANSLATION AND TRANSLATION VERIFICATION OF THE TEDS-M RESEARCH INSTRUMENTS
NAFs, together with feedback on the translation verification, to the ISCs. They also sent the instruments for layout verification.
Version III of the NAFs, containing the results of the layout verification and final documentation by the NRCs, was then prepared and submitted, along with the final versions of the questionnaires and booklets, to the IEA Data Processing and Research Center in Hamburg, which accepted them as the final documentation of national adaptations. Those countries administering the survey instruments in more than one language had to complete and submit a separate set of forms for each language. A list of adaptations made by study participants appears in the user guide for the TEDS-M database (Brese & Tatto, 2012).
5.2.6 International Translation/Adaptation and Layout Verifications
Once the survey instruments had been translated, adapted, and reviewed at the national level, the NRCs sent them and the NAFs to the IEA secretariat for language verification. This process was carried out by an independent language specialist selected in cooperation with cApStAn Linguistic Quality Control, a company which provides translation-verification services for IEA studies. Of the 17 TEDS-M countries, 13 submitted materials for verification in two rounds, once before the field trial and once before the main data collection. Verification for the remaining four countries (Canada, Malaysia, the Russian Federation, and the United States) was conducted once—prior to the main data collection. The TEDS-M ISC at Michigan State University was responsible for carrying out external verification of the layout of the instruments, the last step in the quality assurance of these materials.
5.2.6.1 International translation verifiers
The international translation verifiers for TEDS-M were required to have the target language as their first language, to have formal credentials as translators working in English, to be educated at university level, and—if possible—to have some experience with research in general and with research in the field of education in particular. They were also expected to have lived and worked in the country for which the verification was carried out (or to be in close contact with this country).
5.2.6.2 The translation verification process
The translation verifiers received thorough training in the work that TEDS-M required of them. This preparation included provision of general information about the study and the design of the instruments, together with a description of the translation procedures that the national centers used. The verifiers also received detailed instructions for reviewing the instruments and registering deviations from the international versions.
The primary task of the verifiers was to evaluate the accuracy of the translations and the adequacy of the national adaptations (as reported in the NAFs). The instructions given to verifiers emphasized the importance of maintaining the meaning and complexity level of the questions included in each of the instruments. Specifically, verifiers had to ensure the following:
• Thetranslationhadnotaffectedthemeaningordifficultylevelofthetext;
• Thequestionsanditemshadnotbeenmadesimplerormorecomplex;
• Noinformationhadbeenomittedfromoraddedtothetranslatedtext;and
• Alladaptationsimplementedinthenationaltestinstrumentswerewrittendownin
the NAF.

THE TEACHER EDUCATION AND DEVELOPMENT STUDY IN MATHEMATICS (TEDS-M) TECHNICAL REPORT76
The verifiers documented any errors or suggested changes directly on the submitted
instruments by using the editing functions of MS Word (“Track Changes” and “Insert
Comments”) and eXPert PDF, or by completing separate translation verification report
forms if necessary. Verifiers were asked to provide, when appropriate, suggestions that
would improve the comparability of the instruments and to evaluate the overall quality,
accuracy, and cultural relevance of the translations.
To help NRCs understand the comparability of a translated text with the international
version, verifiers were asked to assign a “severity code” to any deviations. These codes
ranged from 1 (major change or error) to 4 (acceptable change) as follows:
• 1—MAJOR CHANGE OR ERROR: Examples included incorrect order of choices;
mistranslation of items; omission of question or response options; incorrect
translation, resulting in the answer being suggested by the question; incorrect
translation that changed the meaning or level of complexity of the question; and
incorrect order of questions.
• 2—MINOR CHANGE OR ERROR: Examples included spelling errors that did not affect
comprehension; misalignment of margins or tabs; inappropriate changes in font or
font sizes; and discrepancies in the headers and footers of the document.
• 3—SUGGESTION FOR ALTERNATIVE: These deviations usually encompassed
translations that were more or less adequate, but for which the verifier suggested
different wordings.
• 4—ACCEPTABLE CHANGE: The change was acceptable and appropriate but was not
documented on the applicable NAF.
5.2.6.3 International layout verification
The layout verification process required ISC personnel to carry out a careful review
of each page, block, and question in each instrument to ensure its comparability with
the international version. NRCs were responsible for recording any adaptations that
affected the layout of the instruments.
In order to facilitate layout verification, participating countries were expected to submit
fully assembled instruments in PDF format. Once received by the ISC, each instrument
was printed out and a “side by side” comparison, including a careful check of all figures
and graphs, was done to determine the layout’s visual accuracy.
In general, the layout verifiers had to ensure the following:
• Correctwordemphasisandappropriateuseofbolding,italics,underlining,fontsize,
and type;
• All blocks, items, and item options present, properly spaced, and in the correct
order;
• Visualclarityandidenticalnessoffiguresandgraphs;and
• Accuracyofpagination,footers,andotherpageidentifiers.
Reviewers at the ISC also evaluated all discrepancies documented in the NAFs
submitted by the NRCs to determine if each was an appropriate national adaptation or
an actual discrepancy. During this process, the ISC reviewers recorded all discrepancies
that were not noted in the NAFs. The ISC then asked NRCs to address all reviewer
comments, after which it arranged for the review process to be completed. Once all
corrections and comments had been addressed and/or accepted, the ISC notified the

77TRANSLATION AND TRANSLATION VERIFICATION OF THE TEDS-M RESEARCH INSTRUMENTS
national centers that the layout verification was complete and that they could proceed
with assembling, printing, and administering the instruments.
5.2.6.4 Results of the translation, adaptation, and layout verifications
In order to assess the overall quality of the translations and adaptations of the
instruments, the verifiers used a rating scale ranging from very high (“excellent” and
“fluent”), through“good,” to“requiring further improvement.” Typical errors/issues
included, amongst others, the following:
• Translation: Mistranslations, inaccurate translations, “word for word” translations
or overly “free” translations, inconsistencies, inclusion of English words despite there
being a legitimate translation for these words;
• National adaptations: Improper terminology, inconsistencies, undocumented
adaptations, unjustified extensive adaptations;
• Punctuation and capitalization: Improper usage in terms of the conventions of the
target language;
• Grammar: Use of English sentence structure inappropriate for target language
• Spelling: US spellings in other versions of English;
• Missingwordsandtypos.
On receiving feedback from the translation/adaptation verification, each NRC reviewed
the verifier’s suggestions and revised the instruments accordingly. The NRCs accepted
all or almost all suggestions made by the verifiers. The major points of disagreement
concerned adapted terminology used in higher education settings, proposed synonyms,
language register, and use of foreign (English) terms. Rejected suggestions were
documented on a form titled the translation verification summary form in case any
unusual results in the data analysis could be partially or fully explained by errors in the
translation or adaptation of the survey instruments.
During the translation, adaptation, and layout verifications of the international
instruments, the verifiers detected many errata and made these known to the NRCs.
The layout verifiers also ensured, as a final check, that these errors were corrected in the
national instruments.
Most countries completed verification in a timely manner. Only Malaysia submitted
instruments for verification after the survey administration. However, the layout
verifiers identified no problems that had the potential to affect the data analysis for that
country.
5.2.6.5 nRC commentary on the verification processes
Part C of the TEDS-M survey activities questionnaire (SAQ)1askedtheNRCstoreflect
and comment on their experiences during the process of translating and adapting the
TEDS-M research instruments and subjecting them to external verification. Except for
the Russian Federation, all participating countries completed this section of the SAQ.
In all countries, a team of two or more persons (translator and reviewer) prepared
the national version of the survey instruments and documented national adaptations,
as advised by the ISCs. In the majority of cases, these individuals had a stronger
1 The main purpose of the SAQ was to enable documentation of the quality of the data-collection procedures during the various TEDS-M surveys (see Chapter 7 of this report).

THE TEACHER EDUCATION AND DEVELOPMENT STUDY IN MATHEMATICS (TEDS-M) TECHNICAL REPORT78
background in the study subject matter—teacher education and mathematics—than in
linguistics. Seven countries reported some difficulties with adapting and/or translating
the instruments and scoring guides. In such cases, additional experts were consulted.
All respondents found the external translation/adaptation and layout verification of
their instruments helpful for quality improvement.
5.3 International Quality Control Monitor Review
The IEA secretariat hired international quality control monitors (IQCMs) from each
participating country to document the quality of the TEDS-M survey administration.2
A significant part of the IQCMs’ responsibilities involved carefully reviewing the survey
instruments. The IQCMs scrutinized the final (printed) versions of the questionnaires
and booklets against the international translation verifiers’ comments to check whether
the verifiers’ suggestions had been implemented appropriately in the instruments.
The IQCMs also documented any remaining discrepancies in the instruments. These
generally referenced the rare occasions when an NRC did not agree with or rephrased a
verifier’s suggestions. IQCMs also reported printing errors and layout inconsistencies.
References
Brese, F., & Tatto, M. T. (Eds.). (2012). TEDS-M 2008 user guide for the international database.
Amsterdam, the Netherlands: International Association for the Evaluation of Educational
Achievement (IEA).
International Association for the Evaluation of Educational Achievement (IEA). (2007a). Guidelines
for translation verification of the TEDS-M instruments. Amsterdam, the Netherlands: Author.
International Association for the Evaluation of Educational Achievement (IEA). (2007b). TEDS-M
2008 survey operations procedures, Unit 3: Translation/verification. Amsterdam the Netherlands:
Author.
UNESCO. (1999). Operational manual for ISCED-1997 (International Standard Classification of
Education). Paris, France: Author.
2 Chapter 8 of this report provides more information on the TEDS-M international quality control program.

79
CHAPTER 6: SaMplinG DESiGn
Jean Dumais, Statistics Canada
Sabine Meinck, IEA Data Processing and Research Center
Maria Teresa Tatto, Michigan State University
John Schwille, Michigan State University
Lawrence Ingvarson, Australian Council of Educational Research
6.1 Overview
This chapter covers the sample designs prepared for the TEDS-M surveys. It describes
the target populations, sampling strategies, and sample sizes. Only the international
standard is presented in this chapter; Appendix C sets out and discusses the structure
and characteristics of each country’s set of samples. The chapter also describes
implementation of the international sampling design and highlights any deviation
from that design. It furthermore highlights uses of explicit and implicit stratification
procedures, gives an account of coverage and exclusions, and provides sample sizes.
Chapter 10 of this report covers in detail the strategies used to estimate the characteristics
of these populations and their sampling error. Chapter 10 also provides summary
exhibits displaying the expected and achieved sample sizes for all target populations.
A more detailed description of the TEDS-M sampling design and its recommended
implementation can be found in the sample preparation manuals for TEDS-M (IEA,
2006a) and in the survey operations procedures for TEDS-M (IEA, 2006b, 2007).
6.2 International Sampling Plan
TEDS-M employed a stratified multistage probability sampling design for all three
TEDS-M surveys of the following groups:
• Future primary school teachers and future lower-secondary school teachers of
mathematics in their last year of training;
• Theeducatorsofmathematics/mathematicspedagogyandgeneralpedagogyofthe
future teachers; and
• The institutions where the future primary and secondary teachers were receiving
their preparation to teach mathematics.
This design meant that the targeted individuals (future teachers and educators) were
randomly selected from a list of in-scope future teachers and educators within each of
the randomly selected teacher preparation (TP) institutions.
6.2.1 The Importance of Programs and Routes
Two of the TEDS-M key concepts—program and route—have particular relevance to
the TEDS-M sampling plan. Although Chapter 2 provides definitions of these terms,
brief reiteration of the meanings behind them is useful within the context of this current
chapter.
A program is a specific pathway that exists within an institution, requires students
to undertake a set of subjects and experiences, and leads to the award of a common
THE TEACHER EDUCATION AND DEVELOPMENT STUDY IN MATHEMATICS (TEDS-M) TECHNICAL REPORT80
credential or credentials on completion. A route is a set of teacher education programs
available in a given country. TP programs within a given route share a number of
common features that distinguish them from TP programs in other routes, and they
can be identified in similar ways across countries. For the purposes of TEDS-M, three
kinds of routes were defined (Tatto et al., 2008):
• Concurrent: These consist of a single program that includes courses in the subjects
future teachers will be teaching (academic studies), courses on pedagogy and
education (professional studies), and practical experience in the classroom.
• Consecutive: These routes consist of a first phase for academic studies (leading to a
degree or diploma), followed by a second phase of professional studies and practical
experience (leading to a separate credential/qualification). The first and second phases
are not necessarily completed in the same institution. A route can only be considered
consecutive if the institution or the government authorities award a degree, diploma,
or official certificate at the end of the first phase. Also, in some countries, it may be
customary or required for future teachers to complete the first and second phases in
different institutions.
• Apprenticeship (field experience, practicum): These routes consist predominantly of
school-based experience, with other institutions playing only a minor, marginal,
or supporting role. Only one TEDS-M country (the United States) identified an
apprenticeship route, but it was not included in the TEDS-M surveys.
In addition, TEDS-M referred to sets of programs within a country that shared further
common features (e.g., leading to a certain degree) as program-types. Exhibit 6.1 lists the
identified program-types and their sizes (estimated from the sample) in the participating
countries. It also gives the number of institutions in each country that were estimated
to be offering these different program-types as well as the estimated number of future
teachers in each type. The survey samples were drawn from these numbers.
6.2.2 Target Populations
Appendix C provides the characteristics of the three main target populations for each
participating country. The information it contains came from the NRCs’ completed
sampling frame questionnaire (see Exhibit D.1 in Appendix D), comprehensive lists of
institutions, and the data collection itself. Note, however, that not all of the institutions
listed were offering teacher education directed toward both the primary and secondary
levels. Note also that the number of program-types rarely equated with the total
number of institutions in a country since some institutions were offering more than
one program-type and more than one institution was offering a program-type.
As can be seen in Exhibit 6.2, the population sizes that the NRCs estimated before
sampling and data collection (the columns headed “sampling frame”) sometimes
deviated considerably from those estimated from the surveyed sample—the columns
headed“sampleestimate(sumofweights).”Thesedeviationsreflectthefactthat,for
some participating countries, compiling a reliable sampling frame with proper measures
of the size of the institution was a task that proved difficult to fulfill. In general, increased
sampling errors tend to result when sampling is done from imperfect frames.

81SAMPLING DESIGN
Exhibit 6.1: Structure of mathematics teacher preparation by participating country
Country Level a Route Program-Type No. of No. of Future Institutions Teachers
Botswana 1 Concurrent Diploma in Primary Education 4 100
2 Concurrent Bachelor of Secondary Education (Science), 1 25 University of Botswana
2 Concurrent Diploma in Secondary Education, colleges of education 2 35
Chile 3 Concurrent Generalist 36 2,018 b
2 Concurrent Generalist with further mathematics education 8 181
Chinese Taipei 1 Concurrent Elementary teacher education 18 3,595
2 Concurrent Secondary mathematics teacher education 19 375
Georgia 1 Concurrent Bachelor in Pedagogy (four years) 9 636
1 Concurrent Bachelor in Pedagogy (five years) 1 23
2 Concurrent Bachelor of Arts in Mathematics 5 99
2 Concurrent f Master of Science in Mathematics 2 17
Germany c 1 Consecutive Teachers for Grades 1–4 with mathematics as 7 1,286 teaching subject (Type 1A)
1 Consecutive Teachers for Grades 1–4 without mathematics as 4 1,430 teaching subject (Type 1B)
3 Consecutive Teachers for Grades 1–9/10 with mathematics as 7 1,093 b teaching subject (Type 2A)
1 Consecutive Teachers for Grades 1–10 without mathematics as 7 2,433 teaching subject (Type 2B)
2 Consecutive Teachers for Grades 5/7–9/10 with mathematics as 9 1,162 teaching subject (Type 3)
2 Consecutive Teachers for Grades 5/7–12/13 with mathematics 12 1,200 as teaching subject (Type 4)
Malaysia 1 Concurrent Malaysian Diploma of Teaching (Mathematics) 22 558
1 Concurrent Bachelor of Education, primary 1 19
1 Concurrent Diploma of Education (Mathematics) 2 50
2 Concurrent Bachelor of Education (Mathematics), secondary 1 82
2 Concurrent Bachelor of Science in Education (Mathematics), 6 521 secondary
1 Concurrent Bachelor of Education in Teaching of English as 1 d No estimation Second Language with minor in mathematics possible due to
low participation
2 Consecutive Post-Graduate Diploma of Education (Mathematics) 5 d No eligible future teachers at the time of testing
Norway 3 Concurrent General teacher education (ALU) without mathematics 16 b 1,429 b option e
3 Concurrent General teacher education (ALU) with mathematics 16 b 433 b option
2 Consecutive Teacher education program (PPU) 7 78
2 Concurrent Master of Science e 6 28
Oman 2 Concurrent Bachelor of Education, university 1 36
2 Consecutive Educational diploma after Bachelor of Science 1 17
2 Concurrent Bachelor of Education, colleges of education 6 235
Philippines 1 Concurrent Bachelor in Elementary Education 171 2,921
2 Concurrent Bachelor in Secondary Education 252 3,135

THE TEACHER EDUCATION AND DEVELOPMENT STUDY IN MATHEMATICS (TEDS-M) TECHNICAL REPORT82
Exhibit 6.1: Structure of mathematics teacher preparation by participating country (contd.)
Poland 3 Concurrent Bachelor of Arts in Mathematics, first cycle 16 b 459 b (fulltime teacher education programs); Years: 3
3 Concurrent Master of Arts in Mathematics, long cycle 15 b 696 b (fulltime teacher education programs); Years: 5
3 Concurrent Bachelor of Arts in Mathematics, first cycle 4 b 67 b (parttime teacher education programs); Years: 3
3 Concurrent Master of Arts in Mathematics, long cycle 4 b 91 b
(parttime teacher education programs); Years: 5
1 Concurrent Bachelor of Pedagogy Integrated Teaching, first cycle 27 1,206 (fulltime programs); Years: 3
1 Concurrent Master of Arts Integrated Teaching, long cycle 14 864 (fulltime programs); Years: 5
1 Concurrent Bachelor of Pedagogy Integrated Teaching, first cycle 37 2,195 (parttime programs); Years: 3
1 Concurrent Master of Arts Integrated Teaching, long cycle 10 566 (parttime programs); Years: 5
Russian 1 Concurrent Primary teacher education 161 8,563Federation 2 Concurrent Teacher of mathematics 116 5,915
Singapore 1 Concurrent Diploma of Education, Primary Option A 1 53
1 Concurrent Diploma of Education, Primary Option C 1 119
1 Concurrent Bachelor of Arts in Education, primary 1 33
1 Concurrent Bachelor of Science in Education, primary 1 42
1 Consecutive Post-Graduate Diploma in Education, Primary Option A 1 75
1 Consecutive Post-Graduate Diploma in Education, Primary Option C 1 102
2 Consecutive Post-Graduate Diploma in Education, secondary 1 111 (January 2007 intake)
2 Consecutive Post-Graduate Diploma in Education, lower secondary 1 67 (January 2007 intake)
2 Consecutive Post-Graduate Diploma in Education, secondary 1 153 (January 2007 intake)
2 Consecutive Post-Graduate Diploma in Education, lower secondary 1 100 (July 2007 intake)
Spain (primary 1 Concurrent Teacher of primary education 72 3,845 education only)
Switzerland 1 Concurrent Teachers for Grades 1–2/3 (kindergarten and 5 106 (German- Grades 1–2)speaking 1 Concurrent Teachers for Grades 1–2/3 (kindergarten and 2 54 parts only) Grades 1–3)
1 Concurrent Teachers for primary education (Grades 1–6) 2 304 (kindergarten and Grades 1–6)
1 Concurrent Teachers for primary education (Grades 1–6) 12 745
1 Concurrent Teachers for primary education (Grades 3–6) 2 43
2 Concurrent Teachers for secondary education (Grades 7–9) 6 177
Thailand 3 Concurrent Bachelor of Education 45 1,240 b
3 Consecutive Graduate Diploma in Teaching Profession 9 12 b
Country Level a Route Program-Type No. of No. of Future Institutions Teachers

83SAMPLING DESIGN
Notes:
a 1 = primary, 2 = lower secondary, 3 = primary and lower secondary.
b Estimate from sample of future teachers who took the primary test.
c The administrative units of the 16 federal states were considered to be the institutions in the sense of the TEDS-M definition.
d Estimate from sampling frame; could not be estimated from sample data.
e Program was not considered to be part of the TEDS-M core target population. Further information is given in Appendix C.
f According to information given by the national research coordinator after the survey administration, this program-type takes a consecutive structure within one of the two institutions. Note that both programs are labeled “concurrent” in the TEDS-M international database.
Exhibit 6.1: Structure of mathematics teacher preparation by participating country (contd.)
Country Level a Route Program-Type No. of No. of Future Institutions Teachers
United States 1 Concurrent Primary concurrent 382 20,597(public 2 Concurrent Secondary concurrent 303 2,246institutions
3 Concurrent Primary + secondary concurrent 74 b 3,472 bonly) 1 Consecutive Primary consecutive 81 2,031
2 Consecutive Secondary consecutive 85 620
3 Consecutive Primary + secondary consecutive 20 b 172 b
Exhibit 6.2: Nationally defined target populations by participating country
Botswana 7 7 91 100 56 60 44
Canada 30 30 Not available 728 Not available 686 282 (four provinces)
Chile 50 40 2,378 2,018 2,511 2,242 729
Chinese Taipei 34 39 3,589 3,595 444 375 339
Georgia 10 10 697 659 113 116 64
Germany 16 16 8,145 6,242 3,789 3,383 3,944
Malaysia 34 30 3,110 627 845 603 457
Norway 45 45 1,589 1,862 1,689 2,092 Data not processed
Oman 7 7 No primary education 287 288 103 at present
Philippines 417 289 4,593 2,921 3,266 3,135 2,847
Poland 92 91 5,800 6,144 1,308 1,344 1,181
Russian Federation 182 177 15,618 8,563 6,872 5,915 3,135
Singapore 1 1 433 424 462 431 91
Spain (primary 72 72 7,028 3,845 Not covered 770 education only)
Switzerland (German- 16 16 1,230 1,252 175 177 416 speaking parts only)
Thailand 46 46 1,354 1,364 1,354 1,368 354
United States (public 498 408 45,482 26,272 15,160 7,098 9,500 institutions only)
Notes:
a After institution-level exclusions.
b Population figures for educators were not available on the sampling frames.
Sampling Sample Sampling Sample Sampling Sample Sample frame a estimate frame a estimate frame a estimate estimate (sum of (sum of (sum of (sum of weights) weights) weights) weights) b
Country Institutions Future Primary Teachers Future Lower-Secondary Educators Teachers

THE TEACHER EDUCATION AND DEVELOPMENT STUDY IN MATHEMATICS (TEDS-M) TECHNICAL REPORT84
6.2.2.1 Teacher preparation institutions
The international target population of teacher preparation institutions was defined as the
set of secondary or postsecondary schools, colleges, or universities offering structured
“opportunities to learn” (i.e., a program or programs) on a regular and frequent basis to
future teachers of mathematics within a teacher preparation route (Tatto et al., 2008).
It was not necessary within the TEDS-M sampling framework for an institution to be
teaching mathematics as a subject in order to be part of the target population. However,
the institution did have to be teaching mathematics pedagogy (IEA, 2007a).
TEDS-M international study center (ISC) staff asked all TEDS-M national research
coordinators (NRCs) to provide a list of all routes encompassing TP programs and to
indicate which were of principal interest (i.e., a major route) and which were of marginal
interest to TEDS-M. The NRCs were provided with a sampling frame questionnaire to
assist them with this work (see Exhibit A.1 in Appendix A). The sampling team and each
NRC then worked together to determine which routes would constitute the national
desired target population for the respective country. Each country could also opt to
exclude routes or institutions of very small size.
The routes that remained after this process became the national defined target
population (see Exhibit 6.2). Exhibit 6.3 identifies those parts of the target population
in the participating countries that were excluded from sampling. The exhibit also shows
the extent to which (in percentages) the defined target population covered all identified
routes in each country. Appendix D provides the instruments that were used to collect
the necessary information.
6.2.2.2 Teacher educators
The target population of educators was defined as all persons with regular, repeated
responsibility for teaching future teachers of mathematics one of the compulsory
courses of their program at any year of the program. That target population could
comprise up to three subpopulations:
• Educators of mathematics and mathematics pedagogy: Persons responsible for teaching
one or more of the program’s required courses in mathematics or mathematics
pedagogy during the study’s data-collection year at any stage of the institution’s
teacher preparation program.
• General pedagogy educators: Persons responsible for teaching one or more of the
program’s required courses in foundations or general pedagogy (other than a
mathematics or mathematics pedagogy course) during the study’s data-collection
year at any stage of the institution’s teacher preparation program.
• Educators belonging to both Groups 1 and 2 as described above: Persons responsible
for teaching one or more of the program’s required courses in mathematics and/or
mathematics pedagogy and/or general pedagogy during the study’s data-collection
year at any stage of the institution’s teacher preparation program.
6.2.2.3 Future teachers
The target population of future teachers comprised all members of a route in their
last year of training enrolled in an institution offering formal opportunities to learn
to teach mathematics, and explicitly intended to prepare individuals qualified to teach
mathematics in any of Grades 1 to 8.

85SAMPLING DESIGN
Exhibit 6.3: Nationally defined target populations: exclusions and coverage
Country Exclusions a Coverage
Botswana None 100% in all target populations
Chile • 2% of institutions 100% in all target populations • 2% of educators • 3.8% of future primary teachers • 3.6% of future lower-secondary teachers
Chinese Taipei • 26.1% of institutions 100% in all target populations • < 4% of educators • 4.5% of future primary teachers • 4.7% of future lower-secondary teachers
Georgia • 1.4% of future primary teachers 100% in all target populations • 1.7% of future lower-secondary teachers
Germany • 6% of institutions offering primary education 100% in all target populations and 3.7% of future primary teachers • 7% of institutions offering lower-secondary education and 5.6% of future lower-secondary teachers • 22% of institutions participating in the educator survey • < 5% of educators
Malaysia None Due to low participation, program-type Bachelor of Education in Teaching of English as Second Language with minor in mathematics not covered (< 5% of future primary teachers)
Norway None 100% in all target populations
Oman b None 100% in all target populations
Philippines • 7.4% of institutions 100% in all target populations • < 5% of educators • 2.1% of future primary teachers • 1.7% of future lower-secondary teachers
Poland • 3.8% of institutions • Institutions offering only consecutive programs • < 5% of educators not covered (8.5% of institutions) • 3.0% of future primary teachers • Percentage of educators not covered unknown • 0.4% of future lower-secondary teachers • 23.6% of future primary teachers • 29.0% of future lower-secondary teachers
Russian Federation None Secondary pedagogical institutions (percentage of coverage unknown)
Singapore None 100% in all target populations
Spain (primary None Only institutions offering education to future primary education only) teachers covered
Switzerland (German- None Only German-speaking parts covered speaking parts only)
Thailand None 100% in all target populations
United States (public None Only public institutions covereda institutions only)
Notes:
a Refer to Appendix C for reasons for exclusions and for further information.
b Oman had no future primary education teachers during the TEDS-M data-collection period.

THE TEACHER EDUCATION AND DEVELOPMENT STUDY IN MATHEMATICS (TEDS-M) TECHNICAL REPORT86
TEDS-M distinguished between two different groups of future teachers: those who would
be certified to teach primary school students, and those who would be certified to teach
lower-secondary school students. These two groups were referred to as belonging to
two distinct “levels” of education systems (i.e., primary and lower secondary). However,
in some countries, this distinction was not feasible within a program. For example, such
a program may have been preparing teachers for both levels because of the expectation
that these teachers would be able to teach any level (specifically, from Grades 1 to 8) in
the schools where they would eventually work.
6.2.3 Sample Size Requirements and Implementation
To allow for reliable estimation and modelling, while allowing for some amount of
nonresponse, TEDS-M set the minimum sample sizes within each country as follows:
• Fiftyinstitutionsperrouteandlevel;
• Thirtymathematicsandmathematicspedagogyeducatorsper selected institution
(or per route/per level, if possible);
• Thirtyeducatorsofgeneralpedagogyperselectedinstitution;and
• Aneffectivesamplesize1 of 400 future teachers per route and level.
Implementation of TEDS-M’s two-stage sample design, a design that is typically less
precise than a simple random sample due to the clustering effect, meant that the future
teacher sample size required for each route and level was larger than the nominal 400.
The actual number of future teachers required for each route and level within the
selected TP institutions and overall was therefore dictated mainly by the following:
• Thetotalnumberofinstitutionsinthecountry;
• Thevarioussizesoftheinstitutionsinthecountry;and
• The sample selection method (e.g., simple random, cluster random) used in the
institutions.
The teacher preparation institutions offering education to both future primary and
lower-secondary teachers of mathematics could be part of both institution samples.
Similarly, teacher preparation institutions offering more than one route to students
could be part of more than one sample.
Among the 17 countries participating in TEDS-M, 12 identified fewer than 50 (or
only slightly more than 50) eligible institutions. Therefore, in these countries, the
sample design could no longer be described as a two-stage cluster design. Rather, it
had become a stratified simple random sample, which is usually more efficient than a
nonstratified simple random sample because of the high precision of the estimates for
such samples.
For operational purposes, each institution in the sample was divided into subgroups
defined by the level × route × program-type combinations. These subgroups, called
“teacher preparation units” or TPUs (see IEA, 2007), comprised the actual programs
offered in a given institution. All programs within selected institutions were thus
automatically part of the sample.
1 “Effective sample size” means that the sample design had to be as efficient (i.e., precise) as a simple random sample of 400 future teachers from a (hypothetical) list of all eligible future teachers found in a route and level.

87SAMPLING DESIGN
For example, the Philippines at the time of TEDS-M was offering only one teacher education
route (concurrent) per education level (see Exhibit 6.1 above), namely the Bachelor
in Elementary Education and the Bachelor in Secondary Education. Hence, teacher
preparation institutions in the Philippines were offering teacher education for either the
primary or secondary level (not both) and so had only one TPU, or they were offering
teacher education for both the primary and secondary levels and so had two TPUs.
To give another example, Malaysian teacher preparation institutions at the time of
TEDS-M were offering, among them, four different program-types for future primary
teachers and three different program-types for future lower-secondary teachers (see
Exhibit 6.1). Hence, in theory, there could be up to seven TPUs in one institution.
However, in practice, institutions were usually offering only a few of the possible
program-types, if not only one.
Every future teacher in scope for TEDS-M had to be allocated to one TPU only, and
the minimum sample size of future teachers in their final year of training within
institutions was set to 30 such teachers per TPU. This meant that all future teachers in
TPUs with fewer than 30 such teachers or where the sampling of future teachers would
have resulted in a sampling fraction of more than 50 percent were asked to complete the
survey instruments. In countries where, on average, the number of teacher preparation
institutions in a participating country was small or where the institutions themselves
were small, all eligible future teachers were surveyed in order to reach the TEDS-M
precision requirements.
6.2.4 Country-Based Variations to the International Sampling Strategies
Participating countries could suggest variations to or adaptations of the international
sampling plan to better suit their national needs. All changes to the international sampling
plan had to be reviewed and approved by the sampling team and the relevant ISC. One
important modification was a reduction in the scope of the national implementation.
Countries could choose to reduce their national desired target populations if political,
organizational, or operational reasons made it extremely difficult for them to obtain
complete national coverage. For some countries, reduced coverage meant that the survey
results could not be deemed representative of their entire national teacher education
systems. The international reports on the study accordingly used annotations to highlight
those countries with reduced coverage of the national desired target population.
The national desired target population could be further reduced to avoid surveying
very small institutions or programs of marginal importance. The TEDS-M sampling
team specified that these exclusions should not amount to more than five percent of
the national desired target population. Appendix C provides the reasons for exclusions
in each participating country. It was the remaining population, that is, that one that
would be surveyed, that TEDS-M referred to as the national-defined target population.
Exhibit 6.3 above provides a summary of the population exclusions in each participating
country.
6.2.5 Sampling Frames
Participating countries were asked to provide the sampling team with a current and
complete list of institutions, organized by route, level, and any classification variable
deemed relevant to national interests. The lists provided had to correspond with and
grant access to the national-defined target populations.

THE TEACHER EDUCATION AND DEVELOPMENT STUDY IN MATHEMATICS (TEDS-M) TECHNICAL REPORT88
6.2.6 Stratification
The international sampling plan did not require stratification (i.e., forming smaller
units or strata) of the institutions, the educators, or the future teachers. Participating
countries that chose to implement some form of stratification in order to answer
national requirements were invited to discuss their strategy with the international
sampling team. In addition, the sampling team could advise countries to use particular
forms of stratification where reasonable.
Stratification could be implicit or explicit. Implicit stratification consists of ordering the
sampling frame before sampling according to the specified stratification categories in
order to ensure an approximately proportional allocation of the entire sample. Explicit
stratification involves separating the population into strata and then drawing a separate
sample from each one. Appendix C includes information on how stratification was
implemented in each participating country.
6.3 Sample Selection
Because TEDS-M targeted four different populations (institutions, educators, future
primary teachers, and future lower-secondary teachers), four different sampling plans
were designed and implemented. Exhibit 6.4 sets out the sampling units and stages for
these populations.
6.3.1 Sampling of Institutions
The institutions were selected on the basis of systematic random sampling within
explicit strata, according to the national sampling plans. If reliable measures of size for
the institutions were available, institutions were sampled with probability proportional
to size (PPS). If these measures were not available, or if the institutions were so small
that censuses of all targeted individuals within them were expected, institutions were
sampled with equal probabilities. If implicit stratification was used, institutions were
sorted by implicit stratum and a measure of size prior to sampling. Whenever possible,
two replacement units were designated for each unit selected for the sample of the
main survey; this was applicable solely for the sample of institutions. Nonresponding
educators or future teachers could not be replaced. The sampling of institutions also
comprised the first stage of sampling for the educator and future teacher populations.
6.3.2 Sampling from within Institutions
6.3.2.1 Educators
A comprehensive list of eligible educators within each selected institution was
compiled. Each educator had to be allocated to one of the educator-groups described
in Section 0 of WinW3S (Within-institution Sampling Software for Windows). This
program, provided by the IEA Data Processing and Research Center, was used to select a
systematic random sample of at least 30 mathematics/mathematics-pedagogy educators
and a systematic random sample of 30 general-pedagogy educators. In all participating
countries, a census of educators was conducted in the institutions where fewer than 30
educators were found in a given group.
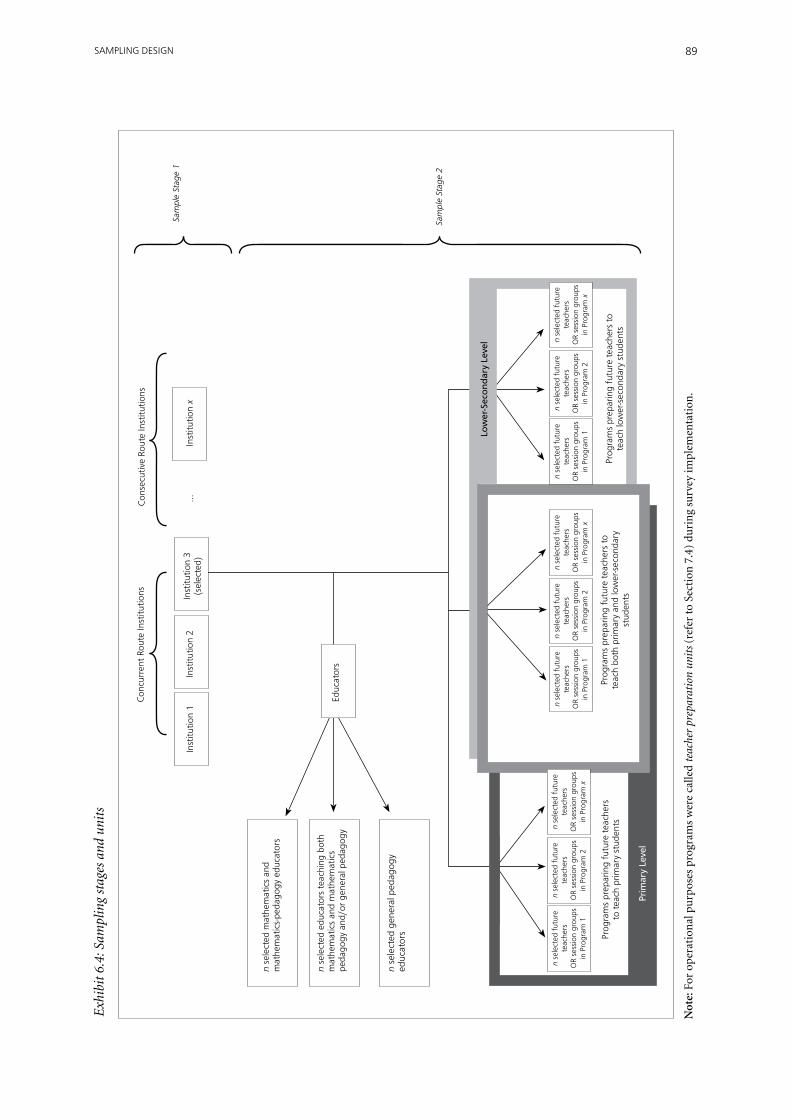
89SAMPLING DESIGN
n se
lect
ed e
duca
tors
teac
hing
bot
h m
athe
mat
ics
and
mat
hem
atic
s pe
dago
gy a
nd/o
r ge
nera
l ped
agog
y
Exh
ibit
6.4
: Sam
plin
g st
ages
and
uni
ts
n se
lect
ed m
athe
mat
ics
and
mat
hem
atic
s-pe
dago
gy e
duca
tors
a se
lect
ed g
ener
al p
edag
ogy
educ
ator
s
Inst
itutio
n 1
Inst
itutio
n 2
Con
curr
ent
Rout
e In
stitu
tions
Con
secu
tive
Rout
e In
stitu
tions
Prog
ram
s pr
epar
ing
futu
re te
ache
rs
to te
ach
prim
ary
stud
ents
Prog
ram
s pr
epar
ing
futu
re te
ache
rs to
te
ach
both
prim
ary
and
low
er-s
econ
dary
st
uden
ts
Prog
ram
s pr
epar
ing
futu
re te
ache
rs to
te
ach
low
er-s
econ
dary
stu
dent
s
Sam
ple
Stag
e 2
Inst
itutio
n x
Sam
ple
Stag
e 1
n se
lect
ed g
ener
al p
edag
ogy
educ
ator
s
n se
lect
ed f
utur
e te
ache
rs
OR
sess
ion
grou
ps
in P
rogr
am 2
n se
lect
ed f
utur
e te
ache
rs
OR
sess
ion
grou
ps
in P
rogr
am x
n se
lect
ed f
utur
e te
ache
rs
OR
sess
ion
grou
ps
in P
rogr
am 1
n se
lect
ed f
utur
e te
ache
rs
OR
sess
ion
grou
ps
in P
rogr
am 2
n se
lect
ed f
utur
e te
ache
rs
OR
sess
ion
grou
ps
in P
rogr
am x
n se
lect
ed f
utur
e te
ache
rs
OR
sess
ion
grou
ps
in P
rogr
am 1
n se
lect
ed f
utur
e te
ache
rs
OR
sess
ion
grou
ps
in P
rogr
am 2
n se
lect
ed f
utur
e te
ache
rs
OR
sess
ion
grou
ps
in P
rogr
am x
Prim
ary
Leve
l
Not
e: F
or o
per
atio
nal
pu
rpos
es p
rogr
ams
wer
e ca
lled
teac
her
prep
arat
ion
unit
s (r
efer
to
Sect
ion
7.4
) du
rin
g su
rvey
impl
emen
tati
on.
Educ
ator
s
Inst
itutio
n 3
(sel
ecte
d)
Low
er-S
eco
nd
ary
Leve
l
n se
lect
ed f
utur
e te
ache
rs
OR
sess
ion
grou
ps
in P
rogr
am 1
...

THE TEACHER EDUCATION AND DEVELOPMENT STUDY IN MATHEMATICS (TEDS-M) TECHNICAL REPORT90
6.3.2.2 Future teachers
Two different procedures, again using WinW3S, were used to select the future teachers within the TPUs:
1. Selection of whole-session groups: Some of the TEDS-M participating countries (e.g., Chinese Taipei, Germany, and the Russian Federation) and some of the selected institutions grouped future teachers together for organizational purposes. TEDS-M termed such groups “session groups.” The international sampling team found it was sometimes operationally desirable and more convenient, especially in very large institutions, to select whole-session groups instead of individual future teachers.
The downside of this sampling approach is that the sampling design tends to be less efficient because of clustering effects. This possibility was countered by appraising each situation and, where deemed necessary, increasing the within-institution sample sizes. Whenever the team chose this approach, it compiled a comprehensive list of session groups. Once each eligible future teacher in a TPU had been allocated to one, and only one, session group, predetermined numbers of session groups were randomly selected with equal probability. All future teachers within the selected session groups were asked to participate in the survey.
2. Selection of individual future teachers: The sampling team compiled a comprehensive list of eligible future teachers within each TPU and then either randomly selected at least 30 future teachers from it or specified that all teachers would be surveyed if there were fewer than 30 teachers within the TPU. Future teachers being prepared to teach both primary and lower-secondary levels were randomly split into two groups, each comprising half of the future teachers. The members of one half were asked to answer the primary-level survey, and the members of the other half were asked to answer the lower-secondary survey.
All sampling procedures and processes were extensively documented either by the sampling team (institution samples) or automatically by WinW3S so that every selection step remained reproducible at any time.
6.4 Sampling for the Field TrialThe field trial conducted before the main data collection took place between January and April 2007 in Botswana, Chile, Chinese Taipei, Georgia, Germany, Oman, the Philippines, Poland, Singapore, Spain, Switzerland, and Thailand. The other countries that participated in TEDS-M joined the study too late to participate in the field trial.
The sampling procedure for the field trial involved drawing convenience samples. Because of overlap in the drawing of the field trial and main survey samples in almost all the field-trial countries, convenience selection gave countries the ability to purposively select institutions that would be willing to participate in both parts of the survey. In almost every country, the respective NRC selected a convenience sample of five institutions for each level and route.
The field trial brought to light one particular challenge—obtaining high participation rates. During the trial, many NRCs reported difficulty not only with picking a convenience sample of institutions but also with ensuring that targeted respondents completed the surveys. This experience led to the development of strategies designed to enhance the willingness of all targeted populations to participate in the main survey (see Appendix E). These strategies proved to be effective. For example, nine of the 10 countries participating in the field trial saw increases in the number of selected future primary teachers completing the main survey (see Exhibit 6.5).

91SAMPLING DESIGN
References
International Association for the Evaluation of Educational Achievement (IEA). (2006a). TEDS-M
2008 sample preparation manual. Amsterdam, the Netherlands: Author.
International Association for the Evaluation of Educational Achievement (IEA). (2006b). TEDS-M
2008 survey operations procedures, Unit 1: Conducting the TEDS-M field test. Amsterdam, the
Netherlands: Author.
International Association for the Evaluation of Educational Achievement (IEA). (2007). TEDS-M
2008 survey operations procedures, Unit 5: Within institution listing and sampling. Amsterdam, the
Netherlands: Author.
Tatto, M. T., Schwille, J., Senk, S., Ingvarson, L., Peck, R., & Rowley, G. (2008). Teacher Education
and Development Study in Mathematics (TEDS-M) conceptual framework: Policy, practice, and
readiness to teach primary and secondary mathematics. Amsterdam, the Netherlands: International
Association for the Evaluation of Educational Achievement (IEA).
Exhibit 6.5: Response rates within participating institutions: field trial and main survey
Countries Response Rate Future Primary Teachers Increase (%) (Percentage over all Participating Institutions)
Field trial Main survey
Botswana 95 86 -9
Chile 66 79 13
Chinese Taipei 46 90 44
Georgia 55 77 22
Germany 77 82 5
Philippines 87 91 4
Poland 63 79 16
Singapore No calculation possible 90 n. a.
Spain 32 87 55
Switzerland 41 76 35 (German-speaking parts only)
Thailand 91 99 8
note: n.a. = not applicable.

THE TEACHER EDUCATION AND DEVELOPMENT STUDY IN MATHEMATICS (TEDS-M) TECHNICAL REPORT92

93
CHAPTER 7: SuRvEy OpERaTiOnS pROCEDuRES
Falk Brese, IEA Data Processing and Research Center
Alena Becker, IEA Data Processing and Research Center
Inese Berzina-Pitcher, Michigan State University
Maria Teresa Tatto, Michigan State University
Ralph Carstens, IEA Data Processing and Research Center
7.1 Overview
The TEDS-M survey operations procedures were developed by using, as a starting
point, procedures successfully applied in IEA’s Trends in International Mathematics
and Science Study (TIMSS) 2003 and Progress in International Reading Literacy Study
(PIRLS) 2006, as well as other IEA studies. However, due to the nature of the TEDS-M
target population and the aims of the study, the TEDS-M survey operations differed
considerably from those employed in student-level studies conducted at primary or
secondary school level. Most importantly, TEDS-M targeted adult populations—future
teachers in their final year of preparation and educators teaching in teacher preparation
programs of the institutions sampled for the study.
The TEDS-M data collection, carried out locally within the participating countries,
followed standards, guidelines, and detailed procedures for all survey activities provided
by the international TEDS-M team. Because the organization of teacher preparation
varied substantially across participating countries, the TEDS-M researchers found it
challenging to develop standardized operational procedures that would ensure the
collection of internationally comparable data and could be readily implemented in all
participating countries. For instance, enumerating the targeted individuals and securing
their participation proved to be much more difficult than in a student-level survey.
Administering questionnaires to teacher preparation institutions, teacher educators,
and future teachers in vastly varying numbers of institutions per country (ranging from
5 to 200 institutions) was a demanding exercise. Conducting a successful data collection
called for close cooperation between and among the international study centers and
associated experts, the national research coordinators (NRCs), the within-institution
liaison people (termed “institution coordinators”) and, eventually, the questionnaire
respondents.
This chapter describes the survey operations for the entire data-collection process.
It outlines the responsibilities of the NRCs, the procedures for listing, sampling,
and tracking future teachers and educators, the steps involved in administering the
questionnaires in a uniform way, and the preparation of materials for data capture.
7.2 Field Trial
All procedures were field trialed in the majority of the participating TEDS-M countries.
The aim of the field trial, conducted in early 2007, was to validate the survey instruments,
operational software, and the various procedures associated with the study. For this
purpose, the TEDS-M sampling team selected a convenience sample of 10 institutions
in most countries.

THE TEACHER EDUCATION AND DEVELOPMENT STUDY IN MATHEMATICS (TEDS-M) TECHNICAL REPORT94
On the basis of the field trial experience and results, the TEDS international teams
refined and improved the instruments, procedures, and software where needed. NRCs
also provided valuable feedback during this stage. Strategies and best practices for
achieving high response rates were presented and discussed during plenary sessions
of the third meeting of the NRCs as well as bilaterally between NRCs facing similar
obstacles, such as securing permission from regional authorities to conduct the survey.
7.3 NRC Responsibilities
In each country, a research center under the direction of the NRC was responsible
for implementing TEDS-M. The NRC was the key contact person for and between all
individuals, institutions, and authorities involved in TEDS-M within the country. The
NRC also represented his or her country at the international level and was responsible
for any national decisions regarding the study in consultation with the TEDS-M
international study centers and experts. In most countries, the NRC appointed a
person to take responsibility for all data-related tasks and issues. This person, called the
national data manager (NDM), supervised and trained data-entry staff and became,
after the TEDS-M survey data had been sent to the IEA DPC, the main contact person
during data processing and cleaning.
7.4 Manuals and Software
A series of survey operation procedure manuals provided the national centers with
instructions, guidelines, and advice on implementing TEDS-M within participating
countries. The manuals were integral to ensuring the quality of the study’s
implementation and the international comparability of its data and results.
The manual series, titled Survey Operation Procedures, constituted nine units
accommodating the different stages of the survey. Each was accompanied, where
necessary, by additional materials or software, as listed below.
• Unit1,Parts1,2,and3:ConductingtheTEDS-M2008fieldtest(IEA,2006a).
• Unit2:Contactinginstitutions(IEA,2007a),accompaniedbysampleletters.
• Unit3:Translation, international translationverification,and international layout
verification (IEA, 2007b).
• Unit4:Instrumentproduction,assembly,andlayout(IEA,2007c).
• Unit5:Within-institutionlistingandsampling(IEA,2007d),accompaniedby:
− WinW3S (Within-institution Sampling Software for Windows), used to
accomplish the following: track sampled institutions; prepare survey tracking
and listing forms for future teachers and educators; enumerate session groups,
educators, and future teachers, and randomly select them; track these individuals’
participation status; assign questionnaires to future teachers; print labels for the
questionnaires; and administer the questionnaires.
• Unit6:Administeringthesurvey(IEA,2007e),accompaniedby:
− Institution coordinator manual (IEA, 2007f), describing the role, responsibilities,
and tasks of the institution coordinator as a main contact person within each
participating institution;
− Survey administrator manual (IEA, 2007g), describing the role, responsibilities,
and tasks of the survey administrator, including the distribution of the future
95SURVEY OPERATIONS PROCEDURES
teacher instruments, supervising the sessions, ensuring the correct timing of the
sessions, and recording future teacher participation;
− National (IEA, 2006b) and international (IEA, 2007h) quality control monitor
manuals, providing the quality control monitors (QCMs) with information about
TEDS-M and describing their role and responsibilities in the project. The manuals
specified the timelines, actions, and procedures that needed to be followed in order
to carry out the international and national quality-assurance programs.
• Unit7:Scoringconstructed-responseitems(IEA,2007i),accompaniedby:
− Scoring guides for the constructed-response items (IEA, 2007j), providing detailed,
explicit guidance on how to score each item.
• Unit8:Syllabianalysiscoding(IEA,2007k).
• Unit9:Creatingthedatafiles(IEA,2007l),accompaniedby:
− Windows Data Entry Manager software (WinDEM) for entering, editing, and
verifying the TEDS-M data;
− Codebooks, describing the properties and the layout of the variables to be entered
from each TEDS-M instrument.
7.5 Procedures for Contacting Institutions and for Within- Institution Sampling
The necessary and, in many cases, critical first step during the TEDS-M survey field
activities was to establish good working relationships with the institutions that had
been sampled to participate in the study.1 NRCs were responsible for contacting these
institutions and encouraging them to participate. In some countries, this process
involved obtaining support from national or regional educational authorities. Appendix
E provides the guidelines on mobilizing national support and recruiting institutions
issued by the TEDS-M international study centers.
7.5.1 Institution Coordinators
National centers identified and trained institution coordinators for all participating
institutions. These individuals could be a respected administrator or member of the
teaching staff in the institution or a representative of the TEDS-M national center.
These individuals needed to have attributes that would enable them to ease entry of
TEDS-M personnel into the institution and facilitate cooperation between the two.
The affiliation nomination of institution coordinators varied across the participating
countries. However, in general, NRCs were encouraged to find a solution that
maximized acceptance and participation among the staff and students in the sampled
institutions and satisfied rules and regulations regarding the confidentiality and sharing
of personally identifiable information.
All institution coordinators received a copy of the TEDS-M Institution Coordinator
Manual (see above), which described their responsibilities. These included:
• Providing the national center with all necessary information about the sampled
institution, including lists of eligible educators and future teachers;
• Coordinatingthedate,time,andplaceforfutureteachersurveysessions;
1 For more information on all sampling procedures, please refer to Chapter 6.

THE TEACHER EDUCATION AND DEVELOPMENT STUDY IN MATHEMATICS (TEDS-M) TECHNICAL REPORT96
• Coordinatingthedistributionandcollectionofeducatorandinstitutionalprogram
questionnaires according to required confidentiality measures; and
• Completing the future teacher and educator tracking forms and recording the
participation status of each sampled individual.
Exhibit7.1,inadditiontoillustratingtheworkflowbetweenthenationalcenterandthe
institutions, outlines the tasks and responsibilities of the institution coordinator.
Exhibit 7.1: TEDS-M preparation for survey administration
National Center Institution
Contacting institutions
• Get started in WinW3S (complete project information and import sampling files).
• Contact sampled institutions.
• Print institution form and send to institution together with institution coordinator manual.
• Print session group listing form for each teacher preparation unit and send it to the respective institution (if applicable).
Prepare listing forms for future teachers and their educators
• Record institution participation.
• Complete/adapt institution information.
• Print educator listing forms.
• Sample session groups (if applicable).
• Print future teacher listing form(s).
Provide institution information
• Decide on participation.
• Appoint institution coordinator.
• Enter contact information, number of session groups (if applicable), and number of educators on institution form.
• List all different groups for the future teacher sessions (e.g., classes/courses) on session listing form (if applicable).
Prepare tracking forms and questionnaire labels
• Enter information from educator and future teacher listing forms.
• Sample future teachers and assign booklets.
• Sample educators.
• Print educator and future teacher tracking forms.
• Print booklets and questionnaire labels.
• Prepare educator and future teacher tracking forms and labelled booklets/questionnaires for administration.
Fill in listing forms
• List all educators.
• List all future teachers, if applicable, for all of the sampled session groups.
Administration
• Administer institutional program/educator questionnaires.
7.5.2 Survey Listing and Tracking Forms
TEDS-M relied on a series of forms to list all in-scope individuals, to prepare the
sampling of session groups, educators, and future teachers, to prepare the assignment
of questionnaires, and to track the participation status of sampled individuals. The
forms not only facilitated the data-collection and data-verification processes but also
provided information from which to compute sampling weights and allow evaluation
of the quality of the sampling process. Most of the tracking and listing forms were
created automatically by the WinW3S software, then completed by institutions and
returned to the national centers.

97SURVEY OPERATIONS PROCEDURES
TEDS-M used six tracking and listing forms, brief descriptions of which follow.
• Institution form: This form, created using WinW3S software, was used to gather
contact information about and the number of teacher educators within each selected
institution.
• Session-group listing form: A separate session-group listing form was created in
WinW3S for each teacher preparation unit (TPU)2 of those selected institutions
in which sampling would encompass future teacher session groups (e.g., classes
or courses). NRCs sent this form to the institution coordinator in each relevant
institution and asked him or her to list all eligible session groups in all TPUs within
it as well as the number of future teachers within each session group.
• Educator listing form: This form was used to list all educators of a sampled institution
who were part of the target population(s). The institution coordinators listed the
names of the educators (or a sequential number if data-protection laws did not allow
for individual names), their date of birth, gender, the ID(s) of the TPU(s) they were
teaching, and the educator-group they belonged to—that is, mathematics and/or
mathematics pedagogy educators, general pedagogy educators, or educators in both
aforementioned groups.
• Educator tracking form: This form listed all sampled educators. Institutional
coordinators used this form to distribute questionnaires to educators and to indicate
their participation.
• Future teacher listing form: This form was created for each TPU or, if applicable,
a sampled session group within a sampled institution, and was then sent to the
institution coordinator for completion. Institution coordinators listed the names (or
a sequential number; see above), date of birth, and gender of the future teachers in
the TPU or session group.
• Future teacher tracking form: This form was used to list all sampled future teachers
and their assigned booklet rotation. The survey administrators used this form to
verify the assignment of the instruments to future teachers and to indicate their
participation.
7.5.2.1 Identification numbers
In order to enable TEDS-M personnel to track each institution, educator, and future
teacher, the WinW3S software assigned hierarchical identification codes (IDs), as set
out in Exhibit 7.2. The first three digits of the ID system identified institutions. The
fourth digit for an institution was always a “0.” Teacher preparation unit IDs also started
with the three-digit institution identifier. A sequential number, starting with “1,” was
then added for the first TPU within an institution. For example, the first sampled
institution for the main study was identified by “101.” Accordingly, the institution ID
was “1010.” The first TPU of that institution was numbered “1011,” the second TPU
of that institution was numbered “1012,” and so on. Note that this rule could not be
applied in Singapore because its teacher preparation institution3 contained 10 TPUs.
Consequently, the IDs of this particular institution had to be increased by one digit
(III+TT+CC+FF). As a result, the TPU IDs in Singapore consisted of five digits, the
educator and session group IDs consisted of seven digits, and the future teacher IDs
nine digits.
2 Chapter 6 provides a definition of the term “teacher preparation unit.”
3 Singapore had only one teacher preparation institution.

THE TEACHER EDUCATION AND DEVELOPMENT STUDY IN MATHEMATICS (TEDS-M) TECHNICAL REPORT98
7.5.3 Assigning and Shipping Materials to Institution Coordinators, Educators, and Future Teachers
Once materials had been printed, they were distributed to the institutions. This process
required careful organization and planning by the NRCs. With the aid of labels and
tracking forms produced by WinW3S, NRCs assigned each sampled future teacher
one questionnaire (booklet) consisting of background and cognitive sections. The
questionnaires were assembled in the format of a rotated block design so that each block
of cognitive items could be assigned to approximately equal numbers of future teachers
(see Chapter 3 of this report for more information on this design). Different cognitive
item blocks were assigned to future primary and future lower-secondary teachers. NRCs
sent the future teacher questionnaires (FTQs) to each survey administrator and asked
him or her to keep this material in a secure place until the day of the survey sessions.
NRCs also assembled and parceled up all other required materials for each survey
session group in the participating institutions. Each packet contained questionnaires
for all educators listed on the educator tracking forms for the institution, as well as
institutional program questionnaires for the people representing each participating
TPU in the institution. NRCs sent these materials to each institution coordinator shortly
before the survey administration period and asked him or her to confirm receipt of
them.
7.6 Administering the TEDS-M Questionnaires
Administering the TEDS-M 2008 survey in each participating country was a
collaborative task shared between the national research center, the institution
coordinator, and the survey administrator. The institution coordinator administered
the institutional program questionnaire(s) (IPQs) and distributed and collected the
educator questionnaires (EQs) and any applicable information for the syllabi analysis.
The IPQ, designed as a guided interview, was administered to one or more executive
representatives of each TPU. The institution coordinator was also responsible for
reminding educators to fill out the questionnaires by certain reference dates and to
record the educators’ participation on the educator tracking forms. The survey
administrator handed out the EQs to the sampled educators and arranged to collect
them at a later, specified stage.
Exhibit 7.2: TEDS-M hierarchical identification system codes
Unit ID Components ID Structure Numeric Example
Institution Institution III + ”0” 1010
Educator Institution III + “0” + EE 101001 + educator within institution
Teacher preparation Institution III + T 1011 unit + teacher preparation unit within institution III + T 1011
Session group Teacher preparation unit III + T + CC 101101 + session group within teacher preparation unit
Future teacher Teacher preparation unit III + T + CC + FF 10110101 + session group within teacher preparation unit + future teacher within session group

99SURVEY OPERATIONS PROCEDURES
7.6.1 Survey Administrators’ Role
Working in collaboration with the institution coordinator, the survey administrator was responsible for organizing the survey session for future teachers. The international TEDS-M researchers strongly recommended that the survey administrator for each institution should be someone from outside it, preferably appointed and supervised by the national center. This approach was seen as one that addressed confidentiality concerns raised by survey respondents and NRCs alike. It also safeguarded the security of the cognitive sections of the FTQs.
In order to ensure that the FTQs were administered in exactly the same way in all participating countries, survey administrators needed to follow a set of precise, scripted procedures, which encompassed these responsibilities:
• Preparing and organizing the survey session in cooperation with the institutioncoordinator (date, time, and location);
• Receiving and securing the survey materials in sufficient time before surveyadministration, usually one week in advance;
• Reviewingallmaterialsastheyarrivedfromthenationalcenterinordertoensurethat they were complete, the questionnaires properly labeled, and the FTQs sorted in a sequence corresponding to the future teacher IDs on the future teacher tracking form;
• Liaisingwiththeinstitutioncoordinatoronthescheduledsurveydateandtimeandsetting up the room immediately prior to the session;
• Ensuringthateachfutureteacherreceivedthecorrectsurveyinstrumentintendedfor him or her;
• Administeringthesessionusinganinternationallystandardizedscript;
• Ensuring the correct timing of the survey sessions, and recording the time whenthe various parts started and ended, along with more general feedback about the administration;
• Accurately recording on the future teacher tracking form the participation status(present or absent) of the selected future teachers during the survey; and
• Returningallmaterials,includingallcompletedandallunusedquestionnaires,tothenational center.
7.6.2 Timing of the Future Teacher Sessions
The TEDS-M international team specified that the FTQs should be administered on the same day with no break in between sections. The national centers asked institutions if the day of the session could preferably not be the first or the last day of the institution’s working week, or be a day directly before or after a holiday or examination. Centers also asked institutions if they could avoid scheduling the future teacher sessions in the early morning or late in the institution’s working day so as to limit absenteeism and reduced response rates.
To ensure that future teachers completed all parts of their respective booklets, the TEDS-M international team set the timing of the FTQ sessions for the TEDS-M main study as follows:
• Approximately5to10minutesforpreparation,whichincludedtheadministratorassigning future teachers to seats, distributing booklets, and reading out
instructions.

THE TEACHER EDUCATION AND DEVELOPMENT STUDY IN MATHEMATICS (TEDS-M) TECHNICAL REPORT100
• Ninetyminutesforcompletingthequestionnaireasfollows:
− Part A: Background—5 minutes;
− Part B: Opportunity to learn—15 minutes;
− Part C: Mathematics knowledge for teaching—60 minutes;
− Part D: Beliefs about mathematics and teaching—10 minutes.
• Approximately 5 to 10 minutes to collect and package materials and finalize the
future teacher tracking form and the survey administration form.
Because a high participation rate was vital for the quality of the collected data,
institutions could schedule a makeup session for those future teachers absent during
the original survey session and/or if participation in the original session was too low
due to unforeseen circumstances (e.g., storms and the like). The survey administrator,
the institution coordinator, and the NRC jointly determined if a makeup session was
likely to substantially increase the response rate. Only those future teachers who were
originally selected as part of the sample and who were listed on the future teacher
tracking form could take part in a makeup session.
7.6.3 Documenting Participation
During each future teacher survey session, the survey administrator recorded the
participation of the future teachers on the future teacher tracking form using four
different codes to record the participation/nonparticipation of these teachers:
• Code“P”ifthefutureteacherparticipatedinthesession;
• Code“A”ifthefutureteacherwasabsentfromthesession;
• Code“NA”ifthefutureteacherhadlefttheTPUpermanently;
• Code“TL”ifthefutureteacherhadlefttheTPUtemporarily(e.g., long-termsick
leave, sabbatical leave, maternity leave).
7.6.4 Receipt of Material and Data-Entry Preparation
In order to maintain the integrity of all information and materials and to monitor the
progress of the survey, the international team sent NRCs guidelines on how to organize
and document the receipt of materials and how to store them in an orderly way prior
to beginning data processing at the national centers. NRCs not only had to organize
allmaterials inaway thatwould facilitate theworkflow fordata scoringandentry
but also ensure that each participating institution returned all survey materials. If an
NRC found some of the survey materials were missing, incomplete, or unusual in any
way, he or she was responsible for contacting the relevant survey administrator and/or
institution coordinator with the aim of rectifying the problems.
More specifically, NRCs were asked to:
• Checkthatallsurveyadministrationformsandsurveytrackingformswerereturned
from the institutions and completed correctly;
• Record the date on which the national center received materials from the
institutions;
• CheckthattheFTQsreceivedwerethoseforthefutureteacherslistedonthefuture
teacher tracking forms;

101SURVEY OPERATIONS PROCEDURES
• ContacttherespectivesurveyadministratorandinstitutioncoordinatorifFTQswere
missing or otherwise irregular, and then record on the future teacher tracking form if
any or all of the missing FTQs could not be found or other problems not solved;
• VerifythatidentificationcodeswerewrittenonallinstrumentsandthateachFTQ
was clearly labeled with a future teacher ID;
• Check that a future teacher’s participation status matched the availability of
instruments; and
• Checktheinformationprovidedontheeducatortrackingformssoastoconfirmthe
return of all EQs.
7.6.5 Survey Activities Questionnaire
In order to document and aid review of the quality of procedures after completion of
the data collection, the international team asked each NRC to provide feedback via a
survey activities questionnaire (SAQ). The SAQ was used to gather feedback about the
assessment materials (e.g., questionnaires, manuals, scoring guides, and software) as
well as countries’ experiences with regard to the survey operations procedures in general
and the specific survey phases and tasks in particular. The questionnaire, designed in
modules that chronologically followed TEDS-M survey activities, was administered
online. A summary of the responses provided by the NRCs at this stage of TEDS-M
appears in Chapter 9 of this report.
References
International Association for the Evaluation of Educational Achievement (IEA). (2006a). TEDS-M
2008 survey operations procedures, Unit 1: Conducting the TEDS-M field test. Amsterdam, the
Netherlands: Author.
International Association for the Evaluation of Educational Achievement (IEA). (2006b). National
quality control monitor manuals. Amsterdam, the Netherlands: Author.
International Association for the Evaluation of Educational Achievement (IEA). (2007a). TEDS-M
2008 survey operations procedures, Unit 2: Contacting institutions. Amsterdam, the Netherlands:
Author.
International Association for the Evaluation of Educational Achievement (IEA). (2007b). TEDS-M
2008 survey operations procedures, Unit 3: Translation/verification. Amsterdam, the Netherlands:
Author.
International Association for the Evaluation of Educational Achievement (IEA). (2007c).
TEDS-M 2008 survey operations procedures, Unit 4: Instrument production/layout. Amsterdam, the
Netherlands: Author.
International Association for the Evaluation of Educational Achievement (IEA). (2007d). TEDS-M
2008 survey operations procedures, Unit 5: Within-institution listing and sampling. Amsterdam, the
Netherlands: Author.
International Association for the Evaluation of Educational Achievement (IEA). (2007e). TEDS-M
2008 survey operations procedures, Unit 6: Administering the survey. Amsterdam, the Netherlands:
Author.
International Association for the Evaluation of Educational Achievement (IEA). (2007f). Institution
coordinator manual. Amsterdam, the Netherlands: Author.
International Association for the Evaluation of Educational Achievement (IEA). (2007g). Survey
administrator manual. Amsterdam, the Netherlands: Author.

THE TEACHER EDUCATION AND DEVELOPMENT STUDY IN MATHEMATICS (TEDS-M) TECHNICAL REPORT102
International Association for the Evaluation of Educational Achievement (IEA). (2007h).
International quality control monitor manuals. Amsterdam, the Netherlands: Author.
International Association for the Evaluation of Educational Achievement (IEA). (2007i). TEDS-M
2008 survey operations procedures, Unit 7: Scoring constructed-response items. Amsterdam, the
Netherlands: Author.
International Association for the Evaluation of Educational Achievement (IEA). (2007j). Scoring
guides for constructed-response items. Amsterdam, the Netherlands: Author.
International Association for the Evaluation of Educational Achievement (IEA). (2007k). TEDS-M
2008 survey operations procedures, Unit 8: Primary and secondary teacher education syllabi analysis
at the institutional program level. Amsterdam, the Netherlands: Author.
International Association for the Evaluation of Educational Achievement (IEA). (2007l). TEDS-M
2008 survey operations procedures, Unit 9: Creating the data files. Amsterdam, the Netherlands:
Author.

103
CHAPTER 8: QualiTy aSSuRanCE Of ThE TEDS-M DaTa COllECTiOn
Barbara Malak-Minkiewicz, IEA Secretariat
Alana Yu, IEA Secretariat
8.1 Overview
Quality assurance in large-scale international surveys is extremely important in terms
of making valid comparisons across many countries. In order to ensure the quality of
the TEDS-M data, considerable effort was put into developing standardized materials
and controlling the procedures for each step of the study, from the preparation of the
assessment framework to the final data reporting. As part of this endeavor, the IEA
Secretariat developed and managed a special international quality control program
designed to document the TEDS-M data-collection activities in the selected teacher
education institutions of the participating countries. The outcomes of this work are the
central focus of this chapter.
In cooperation with the study’s national research coordinators (NRCs), the IEA
Secretariat appointed an international quality control monitor (IQCM) in each
participating country. The IQCMs’ major task was to visit randomly selected teacher
education institutions to observe the data collection from future teachers and to
interview the persons responsible for coordinating and administering this activity in
each institution. The IQCMs were required to record their observations and interview
results on a form called the TEDS-M session observation record. They were also asked
to comment on whether or not the translation verifications of the national research
instruments had been implemented (see Chapter 5). In total, the IQCMs observed
87 sessions (three to eight per country, depending on the number of participating
institutions and their availability). Section 8.2 of this chapter focuses on the IQCMs’
work.
As a counterpart to the international quality control program, all TEDS-M national
centers implemented a national quality control program, which was developed in
accordance with instructions and support materials provided by the IEA Secretariat.
The duties of the national quality control monitors (NQCMs) were similar to those
of the IQCMs, and the NRCs summarized the various aspects of the monitors’ work
on the TEDS-M survey activities questionnaire (SAQ). The results of this process are
covered in Section 8.3 of this chapter. The NRCs also provided other information in
the SAQ on the implementation of the TEDS-M procedures in their local contexts.
This information included feedback on the operational procedures associated with the
quality of the assessment materials. Selected results are summarized in Section 8.4 of
this chapter.

THE TEACHER EDUCATION AND DEVELOPMENT STUDY IN MATHEMATICS (TEDS-M) TECHNICAL REPORT104
8.2 International Quality Control of the TEDS-M Survey Administration
To facilitate implementation of the international quality control program, the IEA
Secretariat organized an extensive two-day training workshop for all IQCMs. This
workshop included an introduction to the TEDS-M project, an overview of all major
survey operations, and detailed information on the data collection. The IEA Secretariat
also produced the TEDS-M international quality control monitor manual (IEA, 2007a),
which was distributed to all IQCMs. It provided comprehensive instructions pertaining
to the monitors’ required duties. In addition, the IQCMs received the TEDS-M session
observation record (IEA, 2007b), which they used to document their monitoring
activities, and a package of other relevant materials that included the international
version of the survey administration manuals.
The main responsibilities of each IQCM consisted of consulting with the NRCs to
gather required information and documentation, observing and reporting on selected
survey administration sessions, and commenting on implementation of the translation
verifications of the survey instruments. More particularly, the IQCMs were required to
accomplish the following:
• Gatheracompletesetofthefinalnationalsurveyinstrumentsandmanuals;
• Select,inconsultationwiththeircountry’snationalresearchcenterandinaccordance
with specific guidelines, the teacher education institutions where the data-collection
sessions would be observed;
• Contact the institution coordinator and survey administrator of each selected
institution to organize the monitoring visit and arrange interviews with these two
people;
• Observetheselectedsurveyadministrationsessionsfortheirlevelofadherenceto
the administration guidelines, in each case documenting the activities of the session
on the session observation record;
• Verifythecompletenessandaccuracyofthelistsoffutureteachersandeducatorsfor
each institution/session;
• Interview the institution coordinator and survey administrator and record their
responses on the session observation record;
• Review the national research instruments and translation verification results, and
document whether the verifiers’ comments had been implemented; and
• SubmitallcollectednationalmaterialsandcompletedobservationrecordstotheIEA
Secretariat.
8.2.1 International Quality Control Monitors
TEDS-M required the IQCMs to be external to the national center, familiar with the
type of institution participating in the study, and acceptable as an observer at the
selected institutions. The IEA Secretariat employed the monitors on a contract basis
and provided them with training, an honorarium for their work, and reimbursement
of travel expenses associated with their participation in the international training
workshop and visits to the institutions and national center. In a few cases, the IQCMs
were permitted to recruit one or more assistants in order to effectively comply with the
data-collection timetable.

105QUALITY ASSURANCE OF THE TEDS-M DATA COLLECTION
8.2.1.1 Selecting institutions for observation and collecting survey materials
In preparation for their monitoring duties during the TEDS-M survey administration,
the IQCMs visited their respective national center in order to select the institutions
that would be included in the international quality control program and to collect the
survey materials used in their country. IQCMs carried out the selection of institutions
jointly with the NRCs in order to prevent the inclusion of institutions that were to take
part in the national quality control program and to eliminate institutions too difficult
to be reached from the IQCM’s home or work because of budget constraints. At least
10 percent but no fewer than three of the institutions participating in TEDS-M in each
country were selected for observation. The exception was Singapore, which had only
one teacher education institution. In total, 85 observations were collected from the
selected institutions. Exhibit 8.1 presents the number of participating institutions in
each country and the number of IQCM observations made across these institutions.
Exhibit 8.1: Number of participating institutions and number of IQCM observations
Country Number of Participating Institutions Number of IQCM Observations
Botswana 7 4
Canada 6 3
Chile 51 6
Chinese Taipei 19 5
Georgia 10 5
Germany 16 5
Malaysia 29 5
Norway 22 5
Oman 7 3
Philippines 80 8
Poland 50 5
Russian Federation 50 5
Singaporea 1 5
Spain 50 5
Switzerland 35 5
Thailand 48 5
United States 60 6
note: a In Singapore, only one institution participated in TEDS-M; observations focused on five different groups of students.
The IEA Secretariat asked the NRCs to prepare necessary documentation and survey
materials for the IQCMs. These included the following:
• National (translated and adapted) versions of the institution coordinator manual
and the survey administrator manual (IEA, 2007c, 2007d);
• Thefinalversionsofthenational(printed)surveyinstrumentstogetherwiththeir
translation verification reports; and
• Listingformsandtrackingformsofsampledfutureteachersandtheireducatorsin
the selected institutions.

THE TEACHER EDUCATION AND DEVELOPMENT STUDY IN MATHEMATICS (TEDS-M) TECHNICAL REPORT106
8.2.1.2 Observations of the TEDS-M survey administration
For each survey administration session observed, the IQCM was required to complete
the TEDS-M session observation record. This document was organized into four
sections (listed below) so as to facilitate the recording of the major activities of the
survey administration and other relevant information. Future teachers were generally
referred to as “students” in these materials.
• SectionA:Preliminaryactivitiesofthesurveyadministrator;
• SectionB:Surveyadministrationactivities;
• SectionC:Summaryobservations;and
• SectionD:Interviewwiththeinstitutioncoordinatorandsurveyadministrator.
8.2.1.2.1 Preliminary activities of the survey administrator
Section A of the session observation record addressed the quality of the preparation
for administration of the future teachers’ surveys. IQCMs were asked to record their
observations of the condition of the survey materials, the survey administrator’s level
of preparation, and the suitability of the room in which the survey took place. Exhibit
8.2 provides a summary of the information that the IQCMs recorded on this section of
the session observation record.
Exhibit 8.2: Quality of the survey administration’s preliminary activities (percentage of IQCM responses)
Questions Yes (%) No (%) Do Not Know/ Not Answered (%)
Did the survey administrator verify adequate supplies of the 96.5 1.2 2.3 future teacher booklets prior to the students’ arrival?
Did the student identification information on the survey 96.5 2.3 1.2 booklets correspond with the information on the future teacher tracking form?
Did the survey administrator familiarize himself or herself 90.6 5.9 3.5 with the survey administration script prior to the session?
was there adequate seating space for the future teachers 97.6 1.2 1.2 to work without distractions?
was there adequate room for the survey administrator to 87.1 11.7 1.2 move around during the session to ensure that students were following directions correctly?
Did the survey administrator have a watch with a second 91.8 5.8 2.4 hand (or stopwatch or timer) for accurately timing the survey session?
In general, the IQCMs observed very few procedural deviations. The most common
issue reported related to those instances when the survey was conducted in a lecture-
style classroom or auditorium. These venues at times made it difficult for survey
administrators to move around the room. In most cases, other problems were either of
a minor nature (e.g., the need to make annotations on the future teacher tracking form
because of recent changes in the class membership) or resolved swiftly (e.g., using the
clock on a cellphone to time a survey session because of the absence of other timepieces)
and did not jeopardize the process of survey administration.

107QUALITY ASSURANCE OF THE TEDS-M DATA COLLECTION
8.2.1.2.2 Survey administration session activities
Section B of the session observation record addressed the key activities that took place
during the administration of the future teacher survey booklets. The information that
had to be registered in this section of the record included the time taken to prepare for
a survey and the time taken to complete the survey, as well as the quality of instruction
before and during the survey.
In the majority of observed cases, the survey administrators followed prescribed
procedures for the activities immediately before the future teachers began work on the
booklets. Generally, when changes to the survey administration script occurred (25
cases), the IQCMs did not consider them to be major issues, typically characterizing
them as additions or revisions. IQCMs reported that some administrators repeated or
summarized instructions for the future teachers (e.g., to accommodate latecomers);
in other instances, the survey administrators added words of clarification or
encouragement (especially in the case of countries where there were concerns about
futureteachers’motivationtoparticipate).Theseadditionswerealsoreflectedinthe
total time survey administrators spent preparing future teachers for the assessment,
which took 20 minutes or longer in five cases, instead of the suggested 5 to 10 minutes
(the average time was about eight minutes). Exhibit 8.3 summarizes the information
that the IQCMs recorded about the pre-survey activities.
Exhibit 8.3: Quality of administration activities immediately preceding answering of future teacher booklets (percentage of IQCM responses)
Questions Yes (%) No (%) Not Answered (%) Minor change Major change
Did the survey administrator follow the script exactly in each of the following tasks?• Preparing the students 81.2 15.2 1.2 2.4• Distributing the booklets 90.5 4.7 2.4 2.4• Giving instructions 76.5 15.3 3.5 4.7
If the survey administrator made changes to the script, how would you describe them?a
• Additions 58.3 37.5 0.0 4.2 • Revisions 54.2 29.2 0.0 16.6 • Deletions 29.2 58.3 0.0 12.5
Did the survey administrator distribute booklets in a manner 97.6 1.2 0.0 1.2to make sure that each student received the booklet specifically prepared for him or her?
Did the survey administrator record attendance correctly on 91.8 2.4 0.0 5.8the future teacher tracking form?
One major task of the IQCMs during administration of the future teacher booklets was
registering whether the time requirements for completing each of the four parts of the
booklet were met. In about 15 percent of cases, the IQCMs observed inconsistencies
between the total allowed and observed times for the survey administration. In general,
however, these differences were minor; on average, reported times for completing each
part of the booklet were within one minute of the allotted times. In one instance, due
to unclear printing of some items in the test booklets, students received five additional
minutes to finish part of the survey. Consistent with earlier observations, IQCMs
reported that some survey administrators had difficulty moving around the room to
check on participants. At the closing of nearly every observed session, future teachers
note: a Percentages relate to 24 observations for which minor or major changes to the administration script were noted.

THE TEACHER EDUCATION AND DEVELOPMENT STUDY IN MATHEMATICS (TEDS-M) TECHNICAL REPORT108
complied well with the instruction to stop work, and the administrators collected
and secured completed booklets as required. Exhibit 8.4 provides a summary of the
observations recorded in relation to these matters.
Exhibit 8.4: Quality of administration of future teacher booklets (percentage of IQCM responses)
Questions Yes (%) No (%) Not Answered (%)
Did the time for all parts equal the time allowed? 82.3 15.3 2.4
Did the survey administrator announce, “You have 5 minutes left” 91.8 8.2 0.0 prior to the end of Part C?
Did the survey administrator announce, “You have 5 minutes left” 88.2 11.8 0.0 prior to the end of Part D?
were there any other “time remaining” announcements made 25.9 72.9 1.2 during the session?
During the session was the survey administrator moving around the 87.1 12.9 0.0 room and checking whether the future teachers were working on the correct part of the booklets?
At the end of the session, how well did the students comply with 97.7 0.0 2.3 the instruction to stop work?• Very well, all students stopped work 87.1• Well, almost all students stopped work 10.6• Fairly well, some students did not stop 0.0• Not well at all; many students did not stop 0.0
were the booklets collected and secured after the surveying session? 97.6 0.0 2.4
8.2.1.2.3 General observations
Section C of the session observation record related to the IQCMs’ general impressions
of the observed survey administration, including students’ behavior and its monitoring
by the survey administrator. Nearly all students who took part in the survey behaved,
in the opinion of the IQCMs, in an orderly and cooperative fashion. In about 73
percent of cases, the participating future teachers were described as extremely orderly
and cooperative, and in just over 22 percent of cases future teachers were described as
moderately orderly and cooperative. There were very few reported instances of future
teachers attempting to cheat or engaging in behavior (such as talking during the session)
that might be construed as cheating. More commonly, IQCMs reported occasions where
futureteachersbrieflylefttheroomduringthesurvey(26%ofsessions)orrefusedto
participate (usually only one or two individuals in each case, but with 10 reported in
one of the sessions). Late-arriving future teachers were observed in 38 percent of all
sessions. They were either not admitted (17%) or could still be admitted before the
survey session began (also 17%). These findings are summarized in Exhibit 8.5.
IQCMs’ general opinions of the overall quality of the survey implementation were
mostly positive, ranging from “excellent” (57% of cases) to “very good” (32%) and
“good” (7%); only 3.5 percent of sessions were characterized as “fair” overall. None
of the sessions was considered “poor.” Canada, Germany, and Norway received the
highest average score from the IQCMs in their evaluations of the survey administrators’
performance.
The IQCMs generally considered that the administrators addressed future teachers’
questions appropriately. In a small number of cases (3 of 22), the IQCMs reported
that the survey administrators did not secure the survey booklet as instructed when a
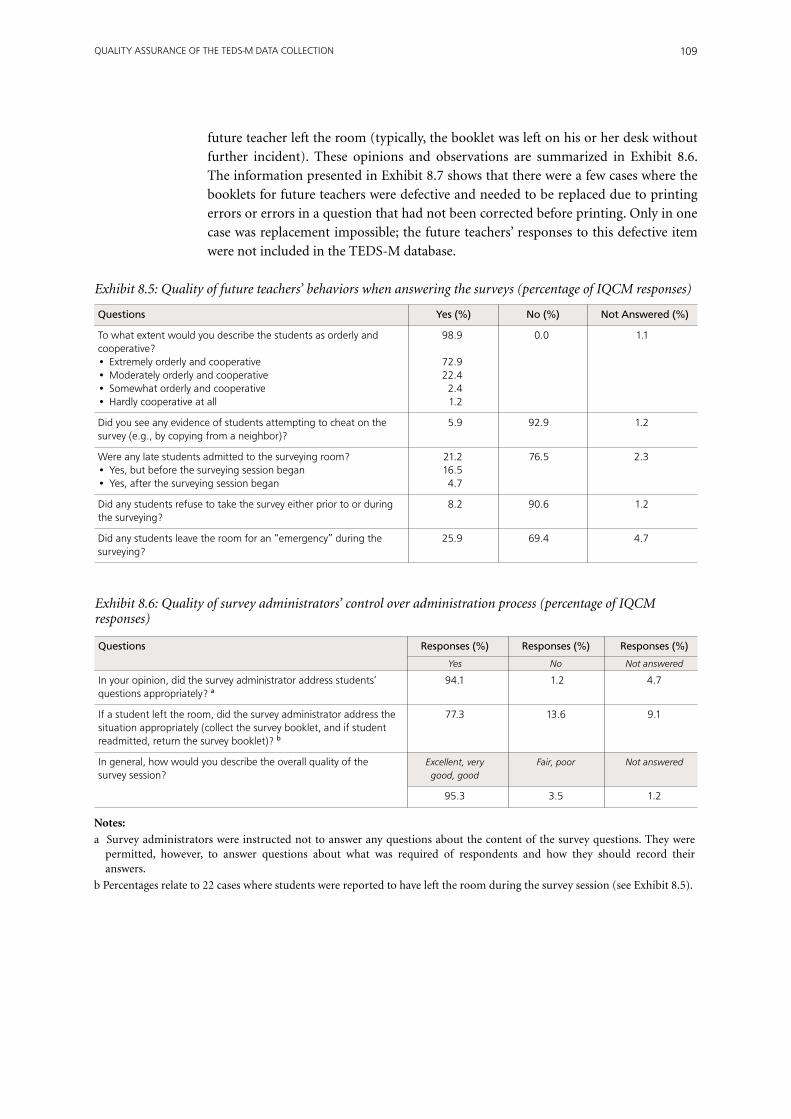
109QUALITY ASSURANCE OF THE TEDS-M DATA COLLECTION
future teacher left the room (typically, the booklet was left on his or her desk without
further incident). These opinions and observations are summarized in Exhibit 8.6.
The information presented in Exhibit 8.7 shows that there were a few cases where the
booklets for future teachers were defective and needed to be replaced due to printing
errors or errors in a question that had not been corrected before printing. Only in one
case was replacement impossible; the future teachers’ responses to this defective item
were not included in the TEDS-M database.
Exhibit 8.5: Quality of future teachers’ behaviors when answering the surveys (percentage of IQCM responses)
Questions Yes (%) No (%) Not Answered (%)
To what extent would you describe the students as orderly and 98.9 0.0 1.1 cooperative?• Extremely orderly and cooperative 72.9• Moderately orderly and cooperative 22.4• Somewhat orderly and cooperative 2.4• Hardly cooperative at all 1.2
Did you see any evidence of students attempting to cheat on the 5.9 92.9 1.2 survey (e.g., by copying from a neighbor)?
were any late students admitted to the surveying room? 21.2 76.5 2.3• Yes, but before the surveying session began 16.5• Yes, after the surveying session began 4.7
Did any students refuse to take the survey either prior to or during 8.2 90.6 1.2 the surveying?
Did any students leave the room for an “emergency” during the 25.9 69.4 4.7 surveying?
Exhibit 8.6: Quality of survey administrators’ control over administration process (percentage of IQCM responses)
Questions Responses (%) Responses (%) Responses (%) Yes No Not answered
In your opinion, did the survey administrator address students’ 94.1 1.2 4.7 questions appropriately? a
If a student left the room, did the survey administrator address the 77.3 13.6 9.1 situation appropriately (collect the survey booklet, and if student readmitted, return the survey booklet)? b
In general, how would you describe the overall quality of the Excellent, very Fair, poor Not answered survey session? good, good
95.3 3.5 1.2
notes:
a Survey administrators were instructed not to answer any questions about the content of the survey questions. They were permitted, however, to answer questions about what was required of respondents and how they should record their answers.
b Percentages relate to 22 cases where students were reported to have left the room during the survey session (see Exhibit 8.5).

THE TEACHER EDUCATION AND DEVELOPMENT STUDY IN MATHEMATICS (TEDS-M) TECHNICAL REPORT110
8.2.1.2.4 Interview with the institution coordinator and survey administrator
The purpose of each IQCM’s interview with the institution coordinator and survey
administrator was to solicit their feedback on the surveying procedures and suggestions
for improvement, and to collect relevant background information (e.g., shipment of
assessment materials, arrangements for survey administration, cooperation with the
NRC). IQCMs were requested to record their summaries of the interviews in Section D
of the session observation record.
Overall, the institution coordinators and survey administrators expressed a favorable
impression of the interviews, indicating that they went very well with few problems.
However, a few (about seven percent) said they would not be willing to repeat their roles,
citing difficulties with timing and motivation. Some coordinators and administrators
experienced problems with completing the required forms due to lack of necessary data
(especially on educators in their institutions), and with persuading the selected persons
to participate in the survey. In some cases, they did not receive survey instruments in
time to check for potential defects. Exhibit 8.8 provides a selection of the coordinators’
and the administrators’ responses.
The coordinators’ and the administrators’ suggestions for improvements related
predominantly to the survey administration manuals (see Exhibit 8.9). Around 14
percent of the administrators stated that the TEDS-M survey administrator manual
needed improvement, noting in particular the necessity for clearer timing procedures,
while about six percent of the institution coordinators suggested the need for more
explicit procedures for including relevant participants on the listing forms.
Important contextual information relating to the survey was solicited through a
question which asked the institution coordinators to rate the attitudes of the involved
institution staff members towards the TEDS-M survey. There was only one instance of
an institution with staff who, according to the coordinator, held negative attitudes. In
77 percent of cases, coordinators said the survey was well received.
Approximately 39 percent of coordinators reported giving survey respondents, including
the future teachers, some kind of special instruction, motivational talk, or incentive to
participate (see Exhibit 8.10). These approaches usually consisted of the coordinator
sending a personal email, making a phone call, or meeting with the individuals selected
to participate in the surveys so they could explain the importance of TEDS-M and thank
them for agreeing to participate. In a few cases, coordinators invited future teachers for
drinks or a meal, or gave them small tokens in recognition of their participation in
TEDS-M.
Exhibit 8.7: Need to replace future teacher survey booklets (percentage of IQCM responses)
Questions Yes (%) No (%) Not Answered (%)
were any defective survey booklets detected and replaced• Before the survey session began? 4.7 90.6 4.7• After the survey began? 2.4 92.9 4.7

111QUALITY ASSURANCE OF THE TEDS-M DATA COLLECTION
Exhibit 8.8: Summary of the institution coordinators’ and survey administrators’ evaluations of TEDS-M future teacher surveys (percentage of IQCM responses)
Questions Yes (%) No (%) Not Answered (%)
According to the institution coordinator and survey administrator, 94.1 2.4 3.5 how well did the survey go?• Very well, no problems 70.6• Satisfactorily, a few problems 23.5
Did they have time to check the shipment of materials from the 76.5 14.1 9.4 TEDS-M national coordinator?
Did they receive the correct shipment of all survey instruments? 84.3 7.7 8.0
was the national coordinator responsive to their questions or 92.9 1.2 5.9 concerns?
Did they have any problems with completing the requested forms? 8.8 81.2 10.0
were the given lists of educators and future teachers in this 73.0 8.7 18.3 institution complete and accurate?
were there any individuals relevant for this study who were not 8.8 75.9 15.3 included in the lists?
If there was another international assessment, would they be willing 84.1 7.1 8.8 to serve as institution coordinator/survey administrator?
Exhibit 8.9: Suggestions for improvement (percentage of IQCM responses)
Questions Worked Needs Not Answered (%) Well (%) Improvement (%)
Overall, did the TEDS-M institution coordinator manual work well or 84.7 5.9 9.4 did it need improvement?
Overall, did the TEDS-M survey administrator manual work well or 71.8 14.1 14.1 did it need improvement?
Exhibit 8.10: Additional background information (percentage of IQCM responses)
Questions Responses (%)
How was the attitude of the other institution staff members towards the TEDS-M survey?• Positive 76.4• Neutral 16.5• Negative 1.2• Question not answered 5.9
How demanding were the steps required to complete the institutional program questionnaire?• Very easy, no problems 27.5• Satisfactory, few problems 28.5• Unsatisfactory, many problems 2.5• Question not answered 41.5
Did any study participants receive any special instruction, motivational talk, or incentives to prepare them for the assessment?• Yes 38.8• No 57.7• Question not answered 3.5

THE TEACHER EDUCATION AND DEVELOPMENT STUDY IN MATHEMATICS (TEDS-M) TECHNICAL REPORT112
8.3 National Quality Control of the TEDS-M Survey Administration
The IEA Secretariat prepared and then sent to all NRCs a manual (IEA, 2007e) for
the national quality control monitors (NQCMs). The Secretariat encouraged NRCs to
amend the manual where they deemed necessary so that it would be relevant in terms
of matters of special importance in their country. Each national center then appointed
a NQCM to visit selected institutions, verify adherence to the survey administration
guidelines during the data-collection session, and document all observations. The
NQCMs’ monitoring tasks were similar to those of the IQCMs outlined earlier in this
chapter. The NRCs documented their experiences with the national quality control
program on the TEDS-M survey activities questionnaire.
8.3.1 Effectiveness of the National Quality Control Program
The national quality control programs were smaller than the international one. In
absolute numbers, this difference meant fewer visited institutions and observed
sessions: 85 IQCM visits against 68 reported NQCM observations in total across the 13
countries responding to the questionnaire. Anywhere from one to seven NQCMs and/
or assistants were appointed in each country. Most NRCs reported using the templates
of the manual for national quality control monitors and the session observation
record without modification. In one country, adaptations to the manual were made to
accommodate national options that required additional attention.
The NQCMs confirmed the good quality of the surveying process overall, but identified
some problems, similar to those reported by the IQCMs, such as logistical deficiencies,
defective survey materials, errors made by some survey administrators, and unmotivated
future teachers. All such matters, if impossible to rectify, were carefully documented.
8.4 Observations Reported in the Survey Activities Questionnaire
The purpose of this questionnaire was to gather information about various aspects of
the participating countries’ implementation of the TEDS-M survey according to the
standards outlined in the survey operations procedures (IEA, 2007f). The standards
focused in particular on:
• Sampling (contacting institutions and working with institution coordinators;
institution and within-institution sampling);
• Survey pre-administration activities (adapting and translating materials; assembling
and printing materials);
• Survey administration activities (administering the survey; NQCM summary);
• Survey post-administration activities (scoring constructed-response items; entering
and submitting data);
• Curriculum analysis activities (syllabi collection and syllabi analysis coding); and
• Miscellaneous (additional feedback).
As noted in Section 8.3 of this chapter, TEDS-M required all NRCs to complete the
survey activities questionnaire, and all but one did (the exception was the NRC for the
Russian Federation). The NRCs completed the form personally, with assistance from
the national center data manager and/or other national center staff where necessary. To
make this data collection more efficient, the questionnaire was administered online.

113QUALITY ASSURANCE OF THE TEDS-M DATA COLLECTION
Some NRCs reported difficulties in convincing selected institutions (eight countries)
and future teachers (10 countries) to participate in the TEDS-M survey. Common
reasons cited were logistical issues (timing, availability of future teachers and staff),
lack of interest, and political/institutional concerns. NRCs from nine participating
countries indicated that they used letters (based on a sample letter written by members
of the TEDS-M international team) to request institution participation in TEDS-M. In
two cases, a supporting letter from the relevant ministry was also used.
In at least 10 countries, some or all of the survey administrators came from organizations
outside the sampled institution, including national center staff, graduate students,
primary school teachers, and hired survey administration specialists. While many
national centers held formal training sessions for their institution coordinators (nine
countries) and survey administrators (also nine countries), others relied more heavily
on the manuals and provided supplementary instruction by telephone and email. All of
the NRCs reported that the institution coordinator and survey administration manuals
were “very helpful” or “somewhat helpful” during the training process.
References
International Association for the Evaluation of Educational Achievement (IEA). (2007a).
International quality control monitor manual. Amsterdam, the Netherlands: Author.
International Association for the Evaluation of Educational Achievement (IEA). (2007b). Session
observation record. Amsterdam, the Netherlands: Author.
International Association for the Evaluation of Educational Achievement (IEA). (2007c). Institution
coordinator manual. Amsterdam, the Netherlands: Author.
International Association for the Evaluation of Educational Achievement (IEA). (2007d). Survey
administrator manual. Amsterdam, the Netherlands: Author.
International Association for the Evaluation of Educational Achievement (IEA). (2007e), National
quality control monitor manual. Amsterdam, the Netherlands: Author.
International Association for the Evaluation of Educational Achievement (IEA). (2007f). TEDS-M
2008 survey operations procedures, Unit 6: Administering the survey. Amsterdam, the Netherlands:
Author.

THE TEACHER EDUCATION AND DEVELOPMENT STUDY IN MATHEMATICS (TEDS-M) TECHNICAL REPORT114

115
CHAPTER 9: CREaTinG anD ChECKinG ThE TEDS-M DaTaBaSE
Ralph Carstens, IEA Data Processing and Research Center
Falk Brese, IEA Data Processing and Research Center
Alena Becker, IEA Data Processing and Research Center
9.1 Overview
Creating the TEDS-M international database (IDB) and ensuring its integrity was a
complex endeavor requiring close coordination and cooperation among not only
the staff at the IEA Data Processing and Research Center (IEA DPC), the TEDS-M
international study centers at Michigan State University (MSU) and the Australian
Council for Educational Research (ACER), but also the national research coordinators
(NRCs) and the national data managers (NDMs) of the participating countries.
This chapter describes the data-entry and verification tasks undertaken by the national
TEDS-M centers, the integration of sampling and response data, the data-editing and
database creation procedures that the DPC implemented, and the steps that all involved
centers took to confirm the integrity of the international database. The primary goals
weretoensurethatanynationaladaptationstothesurveyquestionnaireswerereflected
appropriately in the codebooks and corresponding documentation, that all national
information eventually conformed to the international data structure and coding
schemes, and that errors such as logical inconsistencies or implausible values as a result
of the response or data-capture process were minimized as much as possible. Quality
control measures were applied throughout the whole process.
9.2 Data Entry and Verification at National Centers
Each national center was responsible for transcribing into computer data files the
information from the questionnaires administered in its country at the institutional,
educator, and future teacher levels.
9.2.1 Materials and Training
To facilitate data entry and verification, the IEA DPC supplied national centers with the
Windows Data Entry Manager (WinDEM) software and supporting documentation
in Unit 9 (“creating the data files”) of the TEDS-M 2008 survey operations procedures
manual (IEA, 2007). The DPC also held a three-day data-management seminar in
Hamburg, Germany, in December 2006 prior to the field trial. The seminar covered
software use, procedures for national adaptations, rules and procedures for data entry,
data verification and checking, and (eventually) data submission. The seminar was
specifically targeted at the national team members responsible for data management

THE TEACHER EDUCATION AND DEVELOPMENT STUDY IN MATHEMATICS (TEDS-M) TECHNICAL REPORT116
and liaising with the IEA DPC and the NDMs. A similar training session held in
September 2007 before the main-study data collection provided updated information
and reminders on key processes and important rules.
9.2.2 Codebook Adaptation and Data Entry
National centers entered responses from questionnaires into data files created from
internationally predefined codebooks. These contained information about the names,
lengths, locations, labels, valid ranges (for continuous measures or counts) or valid
values (for nominal or ordinal questions), and missing codes for each variable in each
type of questionnaire. Before data entry commenced, NDMs were required to adapt the
codebookstructuretoreflectanyapprovedadaptationsmadetothenationalversions
of the questionnaires, such as a nationally added response category (see Chapter 5 of
this current report). These adapted codebooks then served as templates for creating the
corresponding data-entry file(s).
Data entry related to the following instruments used to survey the participating teacher
preparation institutions, educators, and future teachers (see Chapters 3 and 4 of this
report):
• Institutionalprogramquestionnaire;
• Educatorquestionnaire;
• Futureteacherbooklets(fiverotationsfortheprimaryschoollevelandthreeforthe
secondary level); and
• ReliabilityscoringsheetsforresponsesinSectionCofthefutureteacherbooklets.
In general, the DPC instructed national centers to securely discard any questionnaires
that were not administered or returned completely empty and to enter only data
from those questionnaires that contained at least one valid response. Although this
procedure considered such questionnaires a “response,” this does not imply that they
were consequently considered as “participating” (in a sampling adjudication sense). For
further information, see Section 10.3 on participation rates in Chapter 10.
National staff were also required, in line with the basic rule for data entry in WinDEM,
to enter data “as is,” that is, without interpretation, correction, truncation, imputation,
or other undue and unapproved cleaning. The resolution of any inconsistencies
remaining after the data-entry stage was intentionally left to the data-cleaning stage at
the international level (see Section 9.3 below). The overall rules for data entry were as
follows:
• Responsestocategoricalquestionsweretobegenerallycodedas“1”ifthefirstoption
(checkbox) was used, “2” if the second option was marked, and so on.
• Responses to “check-all-that-apply” questions were to be coded as either “1”
(checked) or “2” (not checked), and also in cases where all options were unchecked
in the questionnaire.
• Responsestonumericalorscalequestions(e.g.,schoolenrolment)weretobeentered
“as is,” that is, without any correction or truncation, even if the value was outside
the originally expected range. However, data-entry staff were prompted to explicitly
confirm the value in these cases.

117CREATING AND CHECKING THE TEDS-M DATABASE
• Likewise, responses to filter questions and filter-dependent questions were to beentered exactly as filled in by the respondent, even if the information provided was logically inconsistent or otherwise implausible.
• In cases of responses not being given at all, not given in the expected format,ambiguous, or in any other way conflicting (e.g., selection of two options in amultiple-choice question) and not able to be recovered after consulting with the IEA DPC, the corresponding variable was to be coded as “omitted.”
• Incasesofmisprintedquestionsorpages,aseparatecodecalled“notadministered”was to be used.
Once data had been entered with WinDEM, they were automatically validated. First, each entered respondent ID was validated against a “checksum,” a three-digit code generated by Within-institution Sampling Software (WinW3S) during sample selection. A mistype in either the ID or the checksum resulted in an error message that prompted the data-entry person to check the entered values. Second, data were systematically checked for duplicate identification codes as well as for data values outside the expected valid range or values not among the list of defined values (termed “wild codes”). A so-called “column shift check” at the end of every odd-numbered page helped data-entry staff verify and synchronize their position in the data-entry system with the position in the instrument. If a column shift occurred, staff were instructed to review and correct all values entered after the last correct column shift check.
The IEA DPC strongly encouraged every country to use the WinDEM software for manual data entry in order to meet all standards and benefit from the above-mentioned automatic checks. Several countries used alternative data-capture systems routinely utilized by contracted survey organizations (Canada, Singapore, and Spain) or an existing inhouse system (United States). After the IEA DPC reviewed and approved these proposed deviations, these countries were nonetheless required to conform to all specifications established in the international codebooks and all data-entry rules, eventually transfer data to WinDEM, and then verify this information using the same set of consistency and validation checks used by all other countries. The IEA DPC checked and confirmed the consistency and quality of the data captured by the four countries and did not detect any systematic or incidental issues.
The following additional deviations from the standard data-capture procedures occurred.
• Onlyone institutionalprogramquestionnairewasadministeredper institution inCanada given the extreme similarity of the teacher preparation units (TPUs) in it. The remaining data records were created later, and all values, with the exception of one question (MIB003), were copied to these records from the administered questionnaire. The Canadian NRC explicitly verified all values and provided the values for this question that varied across the TPUs in the same institution.
• Norway administered the educator questionnaire using an unapproved onlinequestionnaire system. While data were as successfully converted as if they had been entered in WinDEM, the DPC adjudicated these data as unacceptable because it was impossible to reliably link them to sample design information.
• UnitedStatesdataforfutureteacherscontainedanumberofrecords(23%fortheprimary level, 18% for the secondary level) that were administered and captured
through unapproved procedures (partial collection). Corresponding annotations
were made in the reporting of these data.
THE TEACHER EDUCATION AND DEVELOPMENT STUDY IN MATHEMATICS (TEDS-M) TECHNICAL REPORT118
9.2.3 Double Data Entry (Quality Control)
For the TEDS-M 2008 main study, the IEA DPC required a random sample of five
percent of instruments per instrument type (but including at least 50 instruments of
each type) to be entered twice. This meant that two different data-entry persons entered
the same five percent of instruments (but at least 50 of them) into two separate data
files. To do this, NDMs were asked to create two copies of each data file, with one file
treated as the original, and the other one as the control file. Once data-entry staff had
entered these instruments in both files, NDMs ran a data-entry quality procedure in
WinDEM, crosschecking that the values of all variables of the record in the first file
matched the values of all variables of the record with the same unique identifier in
the second file. The DPC asked the NDMs to initially check the reliability of the data
entry as early as possible during the data capture, and then on a regular basis. This
procedure allowed NDMs and the IEA DPC to identify possible systematic or incidental
misunderstandings or mishandlings of data-entry rules and to initiate appropriate
reactions, for example, retraining staff within national centers.
An error rate of 1.0 percent or less was regarded as acceptable for the institutional
program and educator files. An error rate of 0.1 percent or less (due to item/block
rotation) was accepted for the future teacher data files. Above this level, the IEA DPC
would have requested a complete re-entry of data. The margin of error observed for all
countries participating in the main data collection was well below these thresholds.
9.2.4 Data Verification and Submission
Before sending data to the IEA DPC for further processing, NDMs again carried out
a set of mandatory verification steps on all entered data and undertook corrections
as necessary. NDMs reviewed the corresponding reports produced by the software
package for data capture (WinDEM), resolving any inconsistencies and, where possible,
correcting problems by looking up the original survey questionnaires or documentation.
Additionally, NDMs verified that all returned and nonempty questionnaires were in
fact entered and that the availability of data corresponded to the participation indicator
variables and entries on the tracking forms. Finally, the NDMs used the information
stored in WinW3S and on tracking forms to verify the completeness of the materials
and data records.
The national centers then submitted the data files described above as well as the
finalized and exported WinW3S database. They used an encrypted and secure FTP (file
transfer protocol) connection to do so. Centers also provided the ISCs and the IEA DPC
with any required documentation necessary to process the data files. The deadline for
submitting data for the southern hemisphere was set for February 2008 (given that data
collection was scheduled to conclude at the end of November 2007). The deadline for
the northern hemisphere was set for the end of August 2008 (data collection ending in
May 2008).
Having submitted their data, NRCs were then asked to report on data-capture and
quality-control activities, using the relevant part of the online survey activities
questionnairetodoso.Intheirresponses,NRCsflaggednomajorconcernsorproblems
regarding the data management.

119CREATING AND CHECKING THE TEDS-M DATABASE
9.3 Data Checking, Editing, and Quality Control at the IEA DPC
Once the national centers had submitted their data to the IEA DPC, data processing and
cleaning commenced. In order to document data versions and updates, all incoming
data and documents were registered in a materials receipt database. The date of arrival
was recorded, along with any specific issues meriting attention.
A complex study such as TEDS-M required a correspondingly complex data-cleaning
design. The IEA DPC developed data-processing tools in SAS version 9.1.3 (SAS
Institute Inc., 2008). Before being used with real data, all data-processing programs
were thoroughly tested using simulated datasets containing the majority of expected
problems or inconsistencies. The IEA DPC went to great lengths to ensure that the
data received from participating countries were internationally comparable and of high
quality. The objective of the process was to ensure a reduction in or the elimination of
data-processing errors so that the data adhered to international formats, information
could be reliably linked across different survey files, and the data accurately and
consistentlyreflectedtheinformationcollectedwithineachparticipatingcountry.
Exhibit 9.1 provides a schematic overview of this iterative process conducted in
cooperation with the national centers. The following sections describe in more detail
the sequential data-cleaning steps displayed in the exhibit.
Exhibit 9.1: Overview of iterative data processing at the IEA DPC
Data and codebooks
Reports
StatisticsDocumentation
Databases
IDcleaning
National centers (communication during the cleaning process)
Linkagecleaning
Structure check
Contentcleaning
9.3.1 Import and Structure Checks
Data cleaning began with a review of the submitted data files and any applicable data
documentation. Next, all available codebooks and data were imported from the source
files and combined into SAS databases. Each questionnaire type corresponded to one
SAS database and one SAS codebook file. During the next step of the import, the
data captured from paper instruments were merged with sample data recorded in the
WinW3S database (see Chapter 7 of this report).

THE TEACHER EDUCATION AND DEVELOPMENT STUDY IN MATHEMATICS (TEDS-M) TECHNICAL REPORT120
DPC staff next conducted a “structure check,” which involved looking for differences
between the international and the national file structures. Elements looked for and
identified included:
• Internationalvariablesmissingorhiddeninthenationaldatafiles;
• Nationalvariablesaddedinthenationaldatafiles;
• Changeofvariableorder,type,class,name,orlabel;
• Changeofvariablelengthand/ornumberofdecimals;
• Different number, order, or labels of response categories for categorical/discrete
questions; and
• Differentcodingschemesorvalidationsfornumerical/continuousquestions.
All identified deviations were compared and crosschecked against the national
adaptation forms, the national codebooks, the national instruments, and the data itself.
The results and actions undertaken during this step were presented in reports. In cases
of unexplained data-structure changes, the relevant NRC and/or the international study
center were contacted for advice, justifications, and explanations.
9.3.2 Handling Adapted and National Variables
While all TEDS-M participating countries made mandatory and optional structural
adaptations to the questionnaires, the extent and nature of these changes differed greatly
across the countries. Some countries administered the questionnaires without major
changes, except for translations and necessary cultural adaptations; others inserted
questions or options. Given the associated risk of deviating from the international data
structure, NRCs wishing to make such changes followed strict rules to allow unequivocal
integration of nationally adapted variables for international comparison.
In general, few adaptations were made to the international questionnaires. Where
necessary, the IEA DPC modified values to ensure that the resulting data were
internationally comparable and provided the respective NRCs with detailed
documentation of this procedure. For instance, additional national options in multiple-
choice questions were recoded (mapped) in such a way that they again adhered to the
international code scheme. National variables were created to hold the original values
for later use in national reports. In a few cases, data were not available for certain
variables because the corresponding question was not administered nationally. All
national adaptations and all detected deviations from the international data structure
were recorded in a national adaptation database (NADB).
9.3.3 Cleaning of Identification Variables and Linkage
To uniquely identify, track, and document each respondent and each corresponding
questionnaire in a survey, each record in a data file needed to have a unique identification
(ID) variable. The existence of records without an ID or with a duplicate ID number
implied an error of some kind. If, in TEDS-M, two records shared the same ID number
and contained exactly the same data, one of the records was deleted and the other
remained in the database. If the records contained different data (apart from the ID
numbers), and it was impossible to identify which record contained the “correct” data
even after consultations with the relevant NDM, both records were removed from the
database. Overall, the IEA DPC deleted data in only a very small number of cases.

121CREATING AND CHECKING THE TEDS-M DATABASE
In TEDS-M, institutions served as containers for all data collected within them. For this
reason, all data records in TEDS-M can be associated with an institution. Future teachers
were uniquely and directly associated with one and only one teacher preparation unit
(TPU) via a hierarchical ID numbering system. Educators were associated with one,
many, or all TPUs within an institution. The DPC recorded this many-to-many link as
a special comma-separated ID variable (TPUIDS).
Linkage cleaning also involved looking at and, where necessary, correcting the integrity
of records between the data used for listing, sampling, and tracking in WinW3S and
the actual responses in the questionnaires. This type of cleaning furthermore involved
checking not only the availability of main and reliability scores for future teachers
marked for double scoring but also the consistency of the assigned and actually
administered booklet rotation for future teachers. DPC staff also crosschecked data
between education system levels and corrected any identified inconsistencies in the
linkage between files. The DPC then sent the TEDS-M national centers standardized
reports detailing each identified inconsistency and the implemented edit.
9.3.4 Questionnaire Data Cleaning
Once the DPC was assured that each data file matched the specifications in the
international codebooks, staff applied a set of standard cleaning rules to the files (IEA,
2009). The process, conducted via SAS programs developed at the IEA DPC (SAS
Institute Inc., 2008), involved identifying and, in appropriate cases, automatically
correcting inconsistencies in the data.
Split-variable checks were applied to “yes/no” lists and “check-all-that-apply” questions
for which responses had been coded into several variables. For example, Question 4
in Section A of the future teacher questionnaire listed a number of home possessions
and asked respondents to state whether they had them by checking “yes” or “no.”
Occasionally, respondents marked just the “yes” boxes and left some of the “no” boxes
unchecked, resulting in “omitted” values in the data file. In these cases, it was assumed
that the unmarked boxes actually meant no, and the corresponding variables were
coded accordingly.
Filter questions, which appeared in certain positions in the TEDS-M questionnaires,
were used to direct respondents to a particular question or section of a questionnaire.
Filter questions and their dependent questions were treated automatically, in most cases
according to the following sequence:
• Ifthefilterquestionwascodedto“no”orifitwasomittedbutdependentquestions
were answered and provided more information, then the filter was recoded to “yes/
applicable.”
• Ifthefilterquestionwasstillcodedto“no”(meaningthatalldependentquestions
were omitted), then all dependent questions were recoded to a newly introduced
missing value—“logically not applicable.”
• Ifthefilterquestionwasomittedandthedependentquestionswerecodedto“not
administered,” then the dependent questions were also recoded to “omitted.”
Responses to questions asking for multiple percentages or integer values were also
reviewed. Omitted values in questions asking for counts for which other values were
statedwerecodedtozero(0).Percentagesumsoutsidethe95to105rangewereflagged
for review by the IEA DPC and the TEDS-M countries.

THE TEACHER EDUCATION AND DEVELOPMENT STUDY IN MATHEMATICS (TEDS-M) TECHNICAL REPORT122
The number of inconsistent or implausible responses in the data files varied from one country to another, but no national data were completely free of inconsistent responses. Each problem was recorded in a database, where it was identified by a unique problem number along with a description of the problem and the automatic action taken by the program or the manual action taken by DPC staff. Issues that could not be corrected using systematic rules were reported to the respective NDMs so that original instruments and tracking forms could be checked to trace the source of the inconsistency (e.g., a data-entry mistake). Whenever possible, staff at the IEA DPC suggested a solution and asked the NDMs to accept it or to propose an alternative. Data files were then updated toreflecttheagreedsolutions.Systematicaswellascase-levelcorrectionswereapplieddirectly in SAS program syntax and carried out automatically for each cleaning run.
Where countries could not solve problems or suggest a satisfying explanation, final cleaning rules were defined. In TEDS-M, this procedure affected only the educational attainment of father/mother (variables MFA005/MFA006) in the future teacher booklet. Here, Categories 7 (“<ISCED 5A>, second degree”) and 8 (“Beyond <ISCED 5A>, first degree”) were collapsed for all countries because of a possible overlap in category semantics, and the original values were stored in national variables. In other instances, clear and unambiguous decisions were generally not possible. In these cases, the data remained unchanged and data users were asked to carefully review the variables of interest for any remaining outlying as well as implausible values or combinations that might either warrant edits prior to the analysis of findings or special attention during the interpretation of findings.
9.3.5 Handling of Missing Data
A response to a question can be missing for several reasons. The question may have been deliberately excluded from the questionnaire (“not administered”) or the respondent may have chosen not to respond to the question (“omitted”), may have skipped a questionduetofilterandflowlogic(“logicallynotapplicable”),orsimplydidnothavetime to reach the item in the cognitive section of the instrument (“not reached”).
During the TEDS-M data entry via WinDEM at the national centers, data-entry operators could assign either a valid value or two types of missing value:
• Omitted/invalid: The respondent had the opportunity to respond to the question, but did not do so or provided an invalid response. The code for “omitted/invalid” responses in SPSS files is “9,” “99,” “999,” and so on (depending on the field length of the variable) and is system missing “.” in SAS.
• Not administered: The question was left out or misprinted in a specific copy of an instrument. The code for “not administered” questions is “SYSMIS” (.) in SPSS files and “.A” in SAS files.
During the data processing at the IEA DPC, additional types of missing values were applied to the data for further analyses and to differentiate response behavior.
• Logically not applicable (applied to the institutional program and educator questionnaires as well as Parts A, B, and D of the future teacher booklets): Here, a previous filter question would have been answered in a way that made a response to one or more dependent questions logically impossible. In other words, the respondent skipped the dependent questions. The code for “logically not applicable” responses in SPSS is “6,” “96,” “996,” and so on (depending on the field length of the variable).
The code for logically not applicable responses is “.B” in SAS files.

123CREATING AND CHECKING THE TEDS-M DATABASE
• Not reached (applied only to Part C of the future teacher booklets): A special missing
code was assigned to questions that were deemed “not reached” in order to further
distinguish them from omitted responses during item calibration and scoring. In
SPSS files, “not reached” variables are coded as “6,” “96,” “996,” and so on (depending
on the field length of the variable). The code for “not reached” is “.R” in SAS data
files.
9.3.6 Interim Data Products and Reports
Building the TEDS-M database was an iterative process during which the IEA DPC
provided the TEDS-M international team and NRCs with a new version of data files
whenever a major step in the data processing was completed.
The first main-study data version included 9 of the 17 countries and was produced
towards the end of 2008. During the first calendar quarter of 2009, data for the
remaining countries were received, processed, cleaned, and weighted. At this stage, all
detected and known identification, linkage, and content issues were resolved. Once
the data had been processed to this extent, they were transferred to the IEA DPC’s
sampling unit for calculation of participation rates, exclusion rates, sampling weights,
and variables facilitating variance estimation. This stage resulted in a set of sampling/
weighting-related variables that were added to each file (see Chapter 10).
Distribution of the first data version gave NRCs a chance to review their country
data and to run additional plausibility and statistical checks to validate the data. The
international centers were able to verify the integrity of the data from an analysis and
reporting perspective. NRCs were able to raise any remaining issues concerning their
data that had thus far gone unnoticed before or during the fifth (March 2009) and sixth
(July 2009) NRC meetings. Databases were updated accordingly, and a second, updated
data version that concluded the data-collection work was produced in August 2009. The
TEDS-M international team and its partners used this version of the data as the basis
for analysis and the production of displays and reports.
All interim data products were accompanied by detailed data-processing and data-
weighting documentation (TEDS-M, 2009), codebooks, summary statistics (referred
to as almanacs), cleaning reports, and recoding syntax, as well as cognitive item and
scoring reliability statistics. These summaries were used for a more indepth review of
the data at the international and national levels in terms of plausibility, unexpected
response patterns, suspicious profiles, and so on.
Interim data products were made available to the TEDS-M international team in full
whereas each participating country received its own data only. By default, all data files
were released in fully labeled SPSS format. SAS format and raw text file formats were
made available on request.
9.4 Building the International Database (IDB)
After completing data cleaning and weighting, the TEDS-M international team
assembled, verified, and released different versions of the international database to
analysts and the TEDS-M participating countries.

THE TEACHER EDUCATION AND DEVELOPMENT STUDY IN MATHEMATICS (TEDS-M) TECHNICAL REPORT124
9.4.1 Removing Cases and Units Not Intended for Analysis
The interim data products described above were mainly used to verify that the data
collection had been complete and accurate. Consequently, all interim products included,
regardless of whether a corresponding instrument was completed or not, one record for
each sampled unit (i.e., future primary teachers, educators, etc.). In contrast, the IDB
included only records that satisfied the sampling standards. Data from those units that
either did not participate or did not pass data and sample adjudication (e.g., because
the within-institution participation was insufficient) and were consequently not to
be used in the analysis, were dropped from the files. For details on data adjudication,
please refer to Chapter 10.
However, data for the following samples were retained in the data archive for use by
interested NRCs for further research even though the adjudication determined that they
were unacceptable for international estimation, comparison, and reporting purposes.
• Canada:allsamples;
• Norway:educators;
• Poland:out-of-scopeeducatorsandfutureteachersinsecond-cycleprograms;
• UnitedStates:educators.
The TEDS-M international team and the NRCs received clear advice that these samples
should not be reported together with the corresponding data from the other TEDS-M
countries.
9.4.2 Merging Reporting Variables
As a result of psychometric analysis, a small number of derived prescored (item-level)
variables were added to the international future teacher data files while a number of
cognitive items excluded from calibration and scoring for all countries were set to “not
administered.” Also at this stage, all scale-score variables relating to opportunities to
learn, beliefs, and mathematical and pedagogical content knowledge were added to the
data files along with any other reporting variables such as program-type groupings.
For a detailed account of these variables, please refer to Section 2.2.6 of the TEDS-M
international database user guide (Brese & Tatto, 2012).
9.4.3 Ensuring the Confidentiality of Information
A particularly important issue in surveys is to preserve the confidentiality of individual
respondents during the production and release of micro-datasets. A common challenge
is to prevent the unintended or indirect disclosure that can occur if the release of a
file leads to or allows identification of a respondent. All other matters being equal,
the risk of such disclosure is greatest in cases where the combined characteristics of
a respondent in the data lead to a unique individual in the population. The higher
the sampling fraction and participation is, the more likely it is that a unique record in
the sample will also be unique in the population. In TEDS-M, special challenges arose
from the relatively small size of the surveyed populations and the fact that the entire
population or cohort was selected for participation in a number of countries.
The TEDS-M analysis team received the entire database without any censoring,
perturbation, coarsening, masking, or restrictions. Likewise, each NRC received his
or her own country’s data without restrictions or confidentiality measures applied.
Releases of any dataset beyond the concerned country, initially to all other participating

125CREATING AND CHECKING THE TEDS-M DATABASE
countries and later to interested scientific users (the “NRC-use IDB” and the “scientific-
use IDB” respectively; see below) were subjected to a set of disclosure-avoidance
measures applied consistently to all countries as well as a set of individual measures
concerning only specific national datasets. These measures were agreed on during
discussions between the NRCs, the ISC at MSU, the IEA Secretariat, and the IEA DPC.
They were then implemented centrally by the IEA DPC.
In seeking to manage the risk of disclosure, the TEDS-M team required a number of
modifications to be universally applied to the data in all countries. These modifications
meant that:
• The international TEDS-M data included no direct identifiers for the individual
respondents such as names and telephone numbers but instead held only the
identification numbers used during the field work. These unique identifiers were
scrambled and consequently no longer matched those used during data collection.
New random sequential numbers were created for any primary sampling units
(PSUs), and sequential numbers within a PSU (e.g., for educators) were assigned,
starting with 1 and extending to a value equivalent to the number of records in the
unit. All structural links between files were maintained so that hierarchical IDs could
be changed consistently within and across all files. For each country and file type,
the IEA DPC created a unique matching table and made it available to the respective
NRC only. The scrambling of IDs had no effect on the utility of the micro-data for
secondary analysis.
• Variablesusedforlogisticalortemporarypurposes,suchasadata-entryoperatorID,
were deleted. The removal of these variables had no effect on the analytical utility of
the micro-data.
• Variables used purely for explicit or implicit stratification at the PSU level were
removed to avoid identification of geographical and organizational groups. The
stratum information was mostly of interest for national-level analysis and was always
available to the respective NRC. The removal of these variables limited the analytical
utility of the micro-data to a minor extent. However, the stratification variables could
be requested directly from the concerned NRC.
• VariablesusedpurelyforstratifyingthesamplingframeswithinPSUs,suchastheage
and gender of educators, were removed. This practice had no negative impact on the
analytical utility of the files because the questionnaires also collected corresponding
information for educators and future teachers.
• Information used during the calculation of final sampling weights (base weights,
weighting factors, and no response adjustments) was removed because of the
possibility of reidentification of stratification cells. Removal of this information had
no negative effect on the analytical utility of the micro-data because all information
about the weighting factors and adjustment was fully contained in the final and
replicate weights on the file.
• Replicationzoneandunitvariablesusedonlyduringthecomputationofreplicate
weights were also dropped from the micro-data because of the potential for indirect
identification of PSUs. Their deletion had no negative effect on the analytical utility
of the micro-data because all information about the zone and unit assignments was
fully contained in the set of replicate weights on the file.

THE TEACHER EDUCATION AND DEVELOPMENT STUDY IN MATHEMATICS (TEDS-M) TECHNICAL REPORT126
Germany and Switzerland requested additional confidentiality measures in relation to
a few variables with a higher disclosure risk, and these were applied to the respective
national datasets. The original variables were set to “not administered,” categorical
values were recoded to a shorter list of values, and extreme values were recoded to the
mean value of the group showing an extreme characteristic (such as future teacher
age).
While the clear text names in the database for future teacher programs (variable
TPUPROGR) were not a direct identifier in the true sense of the word, their inclusion
in the NRC/scientific-use databases increased the chances of indirect identification of
institutions offering a particular program. The TEDS-M joint management committee
as well as the NRCs considered this variable to be essential for conducting meaningful
secondary analysis and argued that it could not be removed without seriously reducing
the analytical utility of the database. It was therefore proposed and agreed to retain the
variable in the dataset but to specifically state in a confidentiality undertaking or affidavit
that any user of the NRC or research-use databases must refrain from reidentifying
institutions and from reporting them individually using their names.
9.4.4 International Database for NRC Use
In December 2009, the IEA DPC released a confidential draft international database
(IDB) specifically for NRC use. This release, conditional on a data-release policy and
under embargo, occurred prior to publication of the international report and enabled
countries to prepare national reports and replicate analyses undertaken for the drafts of
the international report. NRCs had to explicitly confirm that they had read, understood,
and agreed to be bound by the terms, restrictions, and conditions of the data-release
policy.
More specifically, the terms of the policy stated that NRCs must not make the IDB
accessible to any third party, and that they must not match any records, other than
those pertaining to their own country, to any other data files because of the risk of
reidentifying the survey units on the files. The policy terms also required NRCs to
ensure that all outputs and publications referred to aggregated data only and did not
therefore reveal information regarding individual sampled units. The embargo relating
to the release of any international results was lifted on 15 April 2010. The data files,
however, continued to be confidential. Late in 2010, NRCs received the final NRC-use
database containing all necessary corrections.
9.4.5 International Database for Scientific Use
Third parties, such as researchers wanting to carry out secondary analyses of TEDS-M
data, can access the scientific-use IDB on request and subject to their signing an affidavit
of nondisclosure and a user agreement between them and IEA. A user guide (Brese &
Tatto, 2012) provides a detailed description of the IDB data files and their variables and
coding. It also offers advice and support on using IEA’s IDB Analyzer to analyze the
complex sample data in TEDS-M.

127CREATING AND CHECKING THE TEDS-M DATABASE
References
Brese, F., & Tatto, M. T. (Eds.). (2012). TEDS-M 2008 user guide for the international database.
Amsterdam, the Netherlands: International Association for the Evaluation of Educational
Achievement (IEA).
International Association for the Evaluation of Educational Achievement (IEA). (2007). TEDS-M
2008 survey operations procedures, Unit 9: Creating the data files. Amsterdam, the Netherlands:
Author.
International Association for the Evaluation of Educational Achievement (IEA). (2009). TEDS-M
2008 general data-processing and cleaning documentation. Amsterdam, the Netherlands: Author.
SAS Institute Inc. (2008). SAS 9.1.3 [Computer software]. Cary, NC: Author.

THE TEACHER EDUCATION AND DEVELOPMENT STUDY IN MATHEMATICS (TEDS-M) TECHNICAL REPORT128

129
CHAPTER 10: ESTiMaTiOn Of wEiGhTS, paRTiCipaTiOn RaTES, anD SaMplinG ERROR
Jean Dumais, Statistics Canada
Sabine Meinck, IEA Data Processing and Research Center
10.1 Overview
The selection of probabilistic samples of institutions, future primary teachers and
lower-secondary teachers, and their educators was a key component of the TEDS-M
survey. As an essential part of their sampling activities, NRCs were responsible for
providing detailed documentation describing their national sampling plans (structure
of mathematics teacher education and educational institutions, including measures of
size and the institution sampling frame). While the IEA Data Processing and Research
Center (DPC) was responsible for selecting the samples of institutions, national teams
were responsible for selecting the samples of future teachers and educators within
selected institutions. They used the Within-institution Sampling Software for Windows
(WinW3S) provided by the IEA DPC to carry out this work. The sampling team at
the DPC then reviewed and completed all sampling documentations, including details
relating to coverage and exclusions, and stratification. This documentation was also
used to evaluate the quality of the samples.1
This chapter covers three important aspects of the quality of the TEDS-M outcomes:
the weighting of the data to produce the population estimates, the participation rates,
and the estimation of sampling error. Although the international sampling plan was
prepared as a self-weighting design, where each individual would have the same final
estimation weight, conditions in the field, such as nonresponse, made execution of that
ideal plan impossible. In the end, each national sampling plan was unique, ranging
from a stratified multistage probability sampling plan with unequal probabilities of
selection to a simple and complete census of all units of interest (see Appendix C).
Section 10.2 describes how each component of the final estimation weight for each
TEDS-M population was defined and how those components were assembled into
the final estimation weight. Section 10.3 describes the participation rates and their
computations. The participation rates for each country are also displayed in this
section.
Because, compared with a simple random sample, a complex sample design and
unequal weights change the sampling error, the latter must be estimated by taking the
complex sample design and the unequal weights into account. Failure to do so can
produce severely biased estimates of sampling error. TEDS-M therefore adopted the
balanced repeated replication (BRR) technique (McCarthy, 1966). The particular
variant used is known as Fay’s method (Fay, 1989), a technique that is well documented
and also used in other international educational studies, such as the Programme for
International Student Assessment (PISA) and the Teaching and Learning International
Survey (TALIS), both of which are conducted by the Organisation for Economic
1 Further details on the sampling design appear in Chapter 6 of this technical report.

THE TEACHER EDUCATION AND DEVELOPMENT STUDY IN MATHEMATICS (TEDS-M) TECHNICAL REPORT130
Co-operation and Development (see OECD, 2006, 2007). Section 10.4 explains how the
replicates were created and how the BRR estimates of sampling error were computed.
These estimates of the sampling error are another key element of the statistical quality
of survey outcomes.
A detailed description of the TEDS-M survey design and its recommended
implementation can be found in the TEDS-M sample preparation manual (IEA, 2006a)
and in the TEDS-M survey operations procedures (IEA, 2006b), as well as in Chapters
6 and 7 of this current report.
10.2. Computing the Estimation (or Final) Weight
Most of the statistics produced for TEDS-M were derived from data obtained through
samples of institutions, teacher educators, and future primary school and lower-
secondary school teachers being prepared to teach mathematics. If these statistics were
tobemeaningfulforacountry,theyneededtoreflectthewholepopulationfromwhich
they were drawn and not merely the sample used to collect them.
In the TEDS-M countries where censuses were conducted, it was sufficient to adjust the
collected data for nonresponse2 in order to obtain unbiased estimates of the population
parameters. However, when the sample design was complex and involved stratification
and unequal probabilities of selection, estimation weights were required to achieve
unbiased estimates (Lohr, 1999).
The estimation or final weight is the device that allows the production of country-level
estimates from the observed sample data. It indicates how many population units are
represented by a sampled unit. The estimation weight is the combination of many
factorsreflectingtheprobabilitiesofselectionatthevariousstagesofsamplingandthe
response obtained at each stage. Basically, estimation weights are the product of one
or more design or base weights and one or more adjustment factors. The former is the
inverse of the selection probability at each selection stage; the latter compensates for
nonresponse. These design weights and adjustment factors are specific to each stage of
the sample design and to each explicit stratum. Clearly, since each country participating
in TEDS-M had to adapt the general sample design of TEDS-M to its own conditions,
the estimation weights had to conform to these national adaptations.
Usually, one set of estimation weights would be produced for each country participating
in a survey. However, in the case of TEDS-M, four sets of estimation weights were
required to reflect the various surveys comprising the study: the institutions, the
educators, the future teachers of mathematics at the primary school level, and the future
teachers of mathematics at the lower-secondary school level.
The following are the conventional notations used throughout this chapter (refer also
to Exhibit 10.1): h, i, k, j, g, l, t, and d are used as subscripts, lower-case letters (n, e, f, s,
r, p, q, v) refer to the sample or the participants, and the upper-case letters (M, H, N, K,
E, G, Q, F, S) refer to the population.
• In each participating country, there were H explicit strata; the index h =1, …, H
pointed to the explicit stratum; if no explicit strata were defined, then H = 1.
2 Under the hypothesis of noninformative response model, or that items are “missing completely at random.”

131ESTIMATION OF wEIGHTS, PARTICIPATION RATES, AND SAMPLING ERROR
• Ineachexplicit stratum,a sampleof sizenh
institutions was drawn from the Nh
institutions comprising stratum h; the index I =1, …, nh pointed to the ith sampled
institution in stratum h. In the case of a census, nh = N
h .
• Eachinstitutionhadameasureofsize(MOS)thatwasusuallythenumberoffuture
teachers in their final year, noted as Mhi. Within the explicit stratum h, the sum of
these size measures was noted as Mh; in the case of simple random sampling, all M
hi
were set to 1 and thus Mh = N
h, that is, the number of institutions in the explicit
stratum.
• All teacher preparation units (TPUs) l =1, …, Qhi found in an institution were
automatically selected.
• Ineachrespondinginstitution,withineachTPU,severalsamplesweredrawn:
− A sample of shil
session groups was drawn and all future teachers Fhild
were
automatically selected within these session groups. The index d =1, …, shil
pointed
to the session groups.
Or
− One single session group per TPU was created, and a sample of fhild
future teachers
was drawn out of Fhild
future teachers, d =1. If the selected institution was large
enough, fhild
= 30 (per TPU) by design; the index t =1, …, fhild
pointed to the
future teachers. However, fhild
could differ from 30 if local conditions dictated that
the sample size should be different. So, for example, if the MOS was 23, all future
teachers were selected and fhild
= 23.
Moreover,
− A sample of ehig
educators was drawn. If the selected institution was large enough,
ehig
= 30 per educator-group g by design. The index j =1, …, ehig
pointed to the
educator; ehig
could differ from 30 if local conditions dictated that the sample size
should be different. Thus, for example, if the number of educators in an educator-
group was 20, all educators were selected and ehig
= 20.
Exhibit 10.1: Conventional notations used in this chapter
Unit Indices Units Participating Units Sampled Units in Population
Explicit stratum h H
Measure of size M
Institution i r n N
Route-level combination k K
Educators j p e E
Educator-group g G
TPU l q Q
Future teacher t v f F
Session group d s S

THE TEACHER EDUCATION AND DEVELOPMENT STUDY IN MATHEMATICS (TEDS-M) TECHNICAL REPORT132
10.2.1 Institution Base Weight (Institution Design Weight)
The first stage of sampling in TEDS-M was the sampling of institutions. As noted
above, in many of the participating countries, or explicit strata of a country, the sample
of institutions was a census sample; in other countries, or explicit strata of a country,
the sample of institutions was drawn according to a systematic random sampling
scheme with selection probabilities proportional to size (PPS). When a census sample
of institutions was implemented in a country or in an explicit stratum of a country,
the institution base weight was set to 1. Use of the notation provided above gave the
institution base weight as
WGTFAC1
hi =
1 Mh
nh x M
hi
for censuses
for random samples
for each institution i =1, …, nh and each explicit stratum h =1, …, H. The institution
base weight was computed once and then fixed, irrespective of which of the subsequent
four different target populations of TEDS-M was concerned.
10.2.2 Institution Nonresponse Adjustment Factor
Despite all efforts to secure the full participation of all selected institutions and their
members, some were unable or unwilling to participate. Those institutions where the
participation of individuals was below 50 percent were deemed to be nonparticipating
for the respective population of interest. However, the institutions that were represented
by the nonparticipating institutions still had to be represented. Therefore, a nonresponse
adjustment factor was required within each explicit stratum. Given the multiplicity of
types of respondents in TEDS-M, a different institution nonresponse adjustment factor
was required for the educators, the future teachers of mathematics at the primary level,
and the future teachers of mathematics at the lower-secondary level.
For each explicit stratum h =1, …, H. If rh out of the n
h selected institutions participated
in TEDS M, the nonresponse adjustment factor was given as
WGTADJ1h =
nh
rh
0
, for participating institutions
for nonparticipating institutions
with the acknowledgment that if the form was identical, the value of the adjustment
factor could change according to the population of interest.
10.2.3 Final Institution Weight
The final institution weight was the product of the institution base weight and the
institution nonresponse adjustment factor. For each participating institution i =1,…,
rh, and each explicit stratum h =1, …, H, the institution final weight was given as
INSWGT
hi = WGTFAC1
hi x WGTADJ1
h
Fh
nh x F
hi
nh
rh
= x
Fh
rh x F
hi
= .
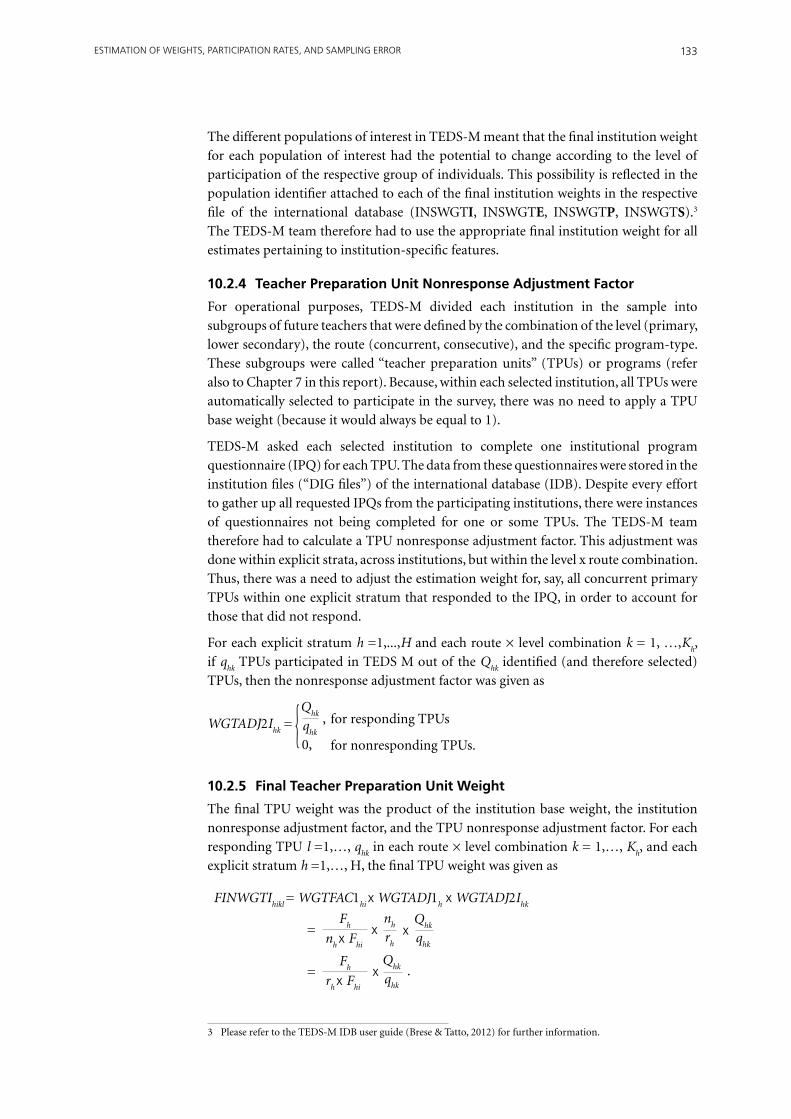
133ESTIMATION OF wEIGHTS, PARTICIPATION RATES, AND SAMPLING ERROR
The different populations of interest in TEDS-M meant that the final institution weight
for each population of interest had the potential to change according to the level of
participationoftherespectivegroupofindividuals.Thispossibilityisreflectedinthe
population identifier attached to each of the final institution weights in the respective
file of the international database (INSWGTI, INSWGTE, INSWGTP, INSWGTS).3
The TEDS-M team therefore had to use the appropriate final institution weight for all
estimates pertaining to institution-specific features.
10.2.4 Teacher Preparation Unit Nonresponse Adjustment Factor
For operational purposes, TEDS-M divided each institution in the sample into
subgroups of future teachers that were defined by the combination of the level (primary,
lower secondary), the route (concurrent, consecutive), and the specific program-type.
These subgroups were called “teacher preparation units” (TPUs) or programs (refer
also to Chapter 7 in this report). Because, within each selected institution, all TPUs were
automatically selected to participate in the survey, there was no need to apply a TPU
base weight (because it would always be equal to 1).
TEDS-M asked each selected institution to complete one institutional program
questionnaire (IPQ) for each TPU. The data from these questionnaires were stored in the
institution files (“DIG files”) of the international database (IDB). Despite every effort
to gather up all requested IPQs from the participating institutions, there were instances
of questionnaires not being completed for one or some TPUs. The TEDS-M team
therefore had to calculate a TPU nonresponse adjustment factor. This adjustment was
done within explicit strata, across institutions, but within the level x route combination.
Thus, there was a need to adjust the estimation weight for, say, all concurrent primary
TPUs within one explicit stratum that responded to the IPQ, in order to account for
those that did not respond.
For each explicit stratum h =1,...,H and each route × level combination k = 1, …,Kh,
if qhk
TPUs participated in TEDS M out of the Qhk
identified (and therefore selected)
TPUs, then the nonresponse adjustment factor was given as
WGTADJ2Ihk
=Q
hk
qhk
0,
, for responding TPUs
for nonresponding TPUs.
10.2.5 Final Teacher Preparation Unit Weight
The final TPU weight was the product of the institution base weight, the institution
nonresponse adjustment factor, and the TPU nonresponse adjustment factor. For each
responding TPU l =1,…, qhk
in each route × level combination k = 1,…, Kh, and each
explicit stratum h =1,…, H, the final TPU weight was given as
FINWGTI
hikl = WGTFAC1
hi x WGTADJ1
h x WGTADJ2I
hk
Fh
nh x F
hi
nh
rh
= x
Fh
rh x F
hi
= .
Qhk
qhk
x
Qhk
qhk
x
3 Please refer to the TEDS-M IDB user guide (Brese & Tatto, 2012) for further information.

THE TEACHER EDUCATION AND DEVELOPMENT STUDY IN MATHEMATICS (TEDS-M) TECHNICAL REPORT134
Because the final TPU weight can be found only in the institution file (DIG), it is necessary to use the final TPU weight for all estimates pertaining to data from the IPQs.
10.2.6 Session Group Base Weight
As explained in Chapter 7, each institution in the sample was divided, for operational purposes, into subgroups of future teachers called TPUs. Because TEDS-M asked each TPU in a selected institution to participate and because the participation status of an institution was determined at the institutional level only (i.e., not on the TPU level), there was no need to apply a TPU base weight or a TPU nonresponse adjustment factor.
However, within each TPU, it was possible to divide future teachers into further subgroups called session groups for organizational purposes and (in rare instances) to select only some session groups from a list of session groups according to the national sampling plan. This selection step had to be taken into account during calculation of the final future teacher weight. For many participating countries, the TEDS-M team decided not to select (some out of many) session groups but rather individual future teachers from an exhaustive list of all future teachers within one TPU. In these instances, the team created one single session group and set its base weight to 1. It needs to be noted here that the session groups were mutually exclusive and exhaustive groups. This meant that every eligible future teacher in an institution had to be allocated to one (and only one) session group.
For each session group d =1,...,shil
in each TPU l=1, ...,Qhi from institution i =1,...,n
h in
explicit stratum h =1,...,H, the session group base weight was given as
WGTAFC2hild
=S
hil
shil
1
, for TPUs with session group sampling
for censuses or TPUs with individual future teacher sampling.
The two populations of interest (future teachers of primary schools and future teachers of lower-secondary schools) meant that the TEDS-M team needed to calculate the sessiongroupbaseweightseparatelyforbothtargetpopulations.Thisisreflectedbyattaching a population identifier to the session-group base weight in the respective file of the international database (WGTFAC2P and WGTFAC2S).
Given that it was operationally impossible to set a whole-session group to nonresponding, there was no need to calculate a session-group nonresponse adjustment factor. Therefore, the nonresponse adjustment was calculated at the future teacher level only, even if none of the future teachers within one whole session group responded to the survey.
10.2.7 Future Teacher Base Weight
In institutions where no session group sampling was conducted, the TEDS-M team selected systematic random samples of future teachers with equal probabilities from each TPU (at least 30 future teachers by design).4 The team used the future teacher base weight (or design weight) to bring the individual future teacher’s information to the level of his or her TPU, and computed it as the inverse of the selection probability of a
future teacher in a TPU.
4 For structural reasons, the future teachers were selected from within the (only) session group and the future teacher base weight was calculated per session group. However, because future teacher sampling was only possible in cases where just one session group was created per TPU, the actual wording of the text is appropriate.

135ESTIMATION OF wEIGHTS, PARTICIPATION RATES, AND SAMPLING ERROR
In institutions where session group sampling was performed, all future teachers within
a selected session group were automatically selected for the survey. In these instances,
the future teacher base weight was set as 1.
For each selected future teacher t =1, …, fhild
in each session group d =1, …, shil
of TPU
l =1, …, Qhi from institution i =1, …, n
h in explicit stratum h =1,…, H, the future
teacher base weight was given as
WGTFAC3hildt
=F
hild
fhild
1
, for TPUs with individual future teacher sampling
for TPUs with no individual future teacher sampling.
Given the two populations of interest (future teachers of primary and future teachers of
lower-secondary schools), the future teacher base weight was calculated separately for
bothtargetpopulations.Thisapproachisreflectedinthepopulationidentifierattached
to the future teacher base weight in each of the two files in the international database
(WGTFAC3P and WGTFAC3S).
10.2.8 Future Teacher Nonresponse Adjustment Factor
Unfortunately, not all selected future teachers were able or willing to participate in
TEDS-M. However, the future teachers who were represented by the nonparticipating
future teachers still needed to be represented by the sample. This fact explains why the
TEDS-M team needed to introduce a nonresponse adjustment factor. This adjustment
was made within each TPU but across session groups.5
In each TPU l =1, …, Qhi , in each participating institution i =1, …, r
h of each explicit
stratum h =1, …, H, if the number of participating future teachers was noted as vhi ,
then the future teachers nonresponse adjustment factor was given as
WGTADJ3hilt
=fhil
vhil
0,
, for participating future teachers
for nonparticipating future teachers.
Again, the two populations of interest (future teachers of primary and of lower-secondary
students) meant the need to calculate the future teacher nonresponse adjustment factor
separatelyforeachtargetpopulation.Thisrequirementisreflectedinthepopulation
identifier attached to the future teacher nonresponse adjustment factor in each of the
two files in the international database (WGTADJ3P and WGTADJ3S).
5 In extremely rare cases, the following situation arose. A selected institution was found to be offering two or more TPUs accommodating the same level of future teacher training (primary or lower secondary). An example is a university that was offering a program producing Bachelor of Primary Education degrees and another program preparing mathematics specialists (also eventually able to teach primary students). Nobody in the second program responded, but the institution still counted as participating because the overall participation rate of future primary teachers was equal to or above 50 percent. Consequently, the nonresponse adjustment for the latter TPU could not be calculated according to the standard procedure since there were no respondents in this TPU who could carry the weight of the nonrespondents. In this instance, the nonresponse adjustment for future teachers in this TPU was done across institutions, but within explicit strata and within the route × level combination.

THE TEACHER EDUCATION AND DEVELOPMENT STUDY IN MATHEMATICS (TEDS-M) TECHNICAL REPORT136
10.2.9 Future Teacher Level Weight
In some participating countries, future teachers were being certified to teach primary
and lower-secondary students. These future teachers were therefore eligible for inclusion
in both target populations of the TEDS-M future teacher survey. However, it would have
been very difficult to convince those future teachers to participate in both surveys; that
is, to complete both a primary and a lower-secondary questionnaire. Thus, in practice,
TEDS-M randomly assigned those future teachers to one of the two surveys. The future
teacher level weight adjusted for this procedure.
In each TPU l =1, …, Qhi in each participating institution i =1, …, r
h of each explicit
stratum h =1, …, H, if the number of selected future teachers eligible for both target
populations but assigned to the primary future teacher survey was noted by fhil_prim
, and
if the number of all selected future teachers in this TPU was noted by fhil
, then the future
teacher level weight (primary) was given as
WGTFAC4Philt
=fhil
fhil_prim
1,
, for TPUs with future teachers who were eligible for primary and secondary teaching
for TPUs with future teachers who were eligible for primary teaching only.
Respectively, in each TPU l =1, …, Qhi, in each participating institution i =1, …, r
h of
each explicit stratum h =1, …, H, if the number of selected future teachers who were
eligible for both target populations but were assigned to the lower-secondary future
teacher survey was noted by fhil_sec
, and if the number of all selected future teachers in
this TPU was noted by fhil
, then the future teacher level weight (lower secondary) was
given as
WGTFAC4Shilt
=fhil
fhil_sec
1,
, for TPUs with future teachers who were eligible for primary and secondary teaching
for TPUs with future teachers who were eligible for secondary teaching only.
10.2.10 Final Future Teacher Weight
The final future teacher weight (estimation weight) was the product of the final
institution weight, the session group base weight, the future teacher base weight, the
future teacher nonresponse adjustment factor, and the future teacher level weight,
calculated for the respective future teacher population (INSWGTP or INSWGTS). All
estimates pertaining to the populations of future teachers should use the final future
teacher weight.
For each participating future primary teacher t =1, ...,fhild
, in each session group d =1,
...,shil
, in each TPU l =1, ...,Qhi
, in each participating institution i =1, …, rh, in explicit
stratum h =1, …, H, the final future teacher weight was given as
FINWGTPhildt
= INSWGTPhi
x WGTFAC2Phild
x WGTFAC3Phildt
x WGTADJ3Philt
x WGTFAC4Philt
Fh
nh x F
hi
= xS
hil
shil
xF
hild
fhild
xfhil
vhil
xf
hil
fhil_prim
.

137ESTIMATION OF wEIGHTS, PARTICIPATION RATES, AND SAMPLING ERROR
For each participating future lower-secondary teacher t =1, ..., fhild
, in each session group
d =1, ..., shil
, in each TPU l =1, ..., Qhi
, in each participating institution i =1, …, rh, in
explicit stratum h =1, …, H, the final future teacher weight was given as
FINWGTShildt
= INSWGTShi
x WGTFAC2Shild
x WGTFAC3Shildt
x WGTADJ3Shilt
x WGTFAC4Shilt
Fh
rh x F
hi
= xS
hil
shil
xF
hild
fhild
xfhil
vhil
xf
hil
fhil_sec
10.2.11 Educator Base Weight
In each participating institution, up to three strata of educators could be created:
mathematics and mathematics-pedagogy educators, general-pedagogy educators, and
those educators teaching all topics.
TEDS-M required samples of 30 educators for each of the two groups of educators
(mathematics and mathematics pedagogy, and general pedagogy). All educators
were asked to complete specific parts of the educator questionnaire. While educators
belonging to Stratums 1 and 2 had to complete only those parts that concerned their
specific teaching responsibilities, educators belonging to Stratum 3 were asked to
complete the whole questionnaire.
For educators, the TEDS-M team selected systematic random samples with equal
probabilities from each stratum. The team then used the educator base weight (or
design weight) to bring the individual educator’s information to the level of his or
her institution. In most cases, all TEDS-M-eligible educators in an institution were
selected.
For each selected educator j =1, ..., ehig
of stratum (or educator-group) g =1, …, G from
institution i =1, ..., nh in explicit stratum h =1, ..., H, the educator base weight was given
as6
WGTFAC2Ehigj
=E
hig
ehig
1,
, for random samples of educators
for censuses of educators.
10.2.12 Educator Nonresponse Adjustment Factor
Not all selected educators were able or willing to participate in TEDS-M. However,
the educators who were represented by the nonparticipating educators still needed to
be represented by the sample, which is why the TEDS-M team needed to introduce a
nonresponse adjustment factor.
Stratum 1:Mathematics + Mathematics Pedagogy
Stratum 2:General Pedagogy
Stratum 3:All topics
6 In extremely rare instances (several institutions in Poland and Switzerland), educators had multiple probability of being selected because they were teaching in more than one institution. In these instances, the educator base weight was divided by the number of institutions where the affected educators were teaching.
.

THE TEACHER EDUCATION AND DEVELOPMENT STUDY IN MATHEMATICS (TEDS-M) TECHNICAL REPORT138
In each of stratum g =1, …, G of each participating institution i =1, ..., rh of each explicit
stratum h = 1, ..., H, if the number of participating educators was noted as phig
, the
educator nonresponse adjustment factor was given as
WGTADJ2Ehigj
=e
hig
phig
0,
, for participating educators
for nonparticipating educators.
In some cases, none of the selected educators in an educator-group within an institution
responded. Consequently, it was not possible to calculate the nonresponse adjustment
using standard procedures because there were no respondents who could carry the
weight of the nonrespondents. In these situations, the TEDS-M team carried out the
nonresponse adjustment for educators in this educator-group in the affected institution
across institutions, but still within explicit strata and within the educator-group.
10.2.13 Final Educator Weight
The final educator weight (estimation weight) was the product of the educator base
weight, the educator nonresponse adjustment factor, and the final institution weight
calculated for the educator population (INSWGTE). The final educator weight should
be used for all estimates pertaining to the populations of educators.
For each participating educator j =1,..., phig
, in each participating institution i=1, …, rh,
in explicit stratum h =1, …, H, the final educator weight was given as
FINWGTE
higj = INSWGTE
hi xWGTFAC2E
higj x WGTADJ2E
higj
Fh
rh x F
hi
= xE
hig
ehig
xe
hig
phig
Fh
rh x F
hi
= xE
hig
phig
10.3 Participation Rates
The TEDS-M quality standards required minimum participation rates for all target
populations of the survey in order to produce statistics purporting to describe
characteristics of those populations. The aim of these standards was to ensure that bias
resulting from nonresponse was kept within acceptable limits.
In TEDS-M, the participation rates for each country were calculated and reported
separately for the four different TEDS-M target populations. Reports describing the
results for each target population thus consider the participation rate for that target
population only. In short, the minimum requirement under which TEDS-M can publish
key statistical data for international comparisons for each population is either that
• The overall (combined) participation rate (weighted or unweighted) of that
population is at least 75 percent;
or
• Theparticipationrate(weightedorunweighted)ofinstitutionsfortheconsidered
population and the participation rate for individuals within the participating
institutions are both at least 85 percent.
.

139ESTIMATION OF wEIGHTS, PARTICIPATION RATES, AND SAMPLING ERROR
The intention in this section of the chapter is to explain in detail the calculation
procedures for the different participation rates.7 All participation rates were calculated
notonlyasunweightedbutalsoasweightedtoreflectthestructureofthesampleineach
rate. However, in many cases, the weighted participation rates deviated little (if at all)
from the unweighted rate. TEDS-M deemed the participation rate requirements to have
been met if either the weighted or the unweighted participation rate was sufficient.
10.3.1 Participation Rates for Institutions
Before the international and national TEDS-M teams could publish statistical
summaries about institutions (or rather their programs) in a given country, they first
had to establish if the number of institutional program questionnaires (IPQs) returned
was sufficient to provide a useful sample of institutions in that country. TEDS-M set the
return criterion as at least 85 percent of the sampled institutions in a country returning
questionnaires. An institution was considered to be a participating one if it returned at
least one IPQ.
If r out of n selected institutions were participating institutions, the unweighted
institutional participation rate (IPRI) was given as
H
h =1
rh
IPRI =
H
h =1
nh
and the weighted institutional participation rate (IPRI-wgt
) as
H
h =1IPR
I–wgt =
rh
i =1WGTFAC1I
hi
H
h =1
rh
i =1WGTFAC1I
hi x WGTADJ1I
hi
10.3.2 Participation Rates for Future Primary Teachers
TEDS-M stipulated that statistical summaries pertaining to future primary teachers in
a given country could only be published if returns of the primary-level future teacher
questionnaire (FTQ) were sufficient to provide a useful sample of future primary
teachers in that country. TEDS-M therefore had to set the criterion for an acceptable
response rate.
TEDS-M accordingly counted an institution as “having participated” in the future
primary teacher survey if the response rate for future primary teachers within
the institution was at least 50 percent.8 Then, if 85 percent or more of the sampled
institutions in the country participated, and if, within those participating institutions,
completed FTQs were received from 85 percent or more of the sampled future primary
teachers, TEDS-M considered the criterion to have been met.
7 Some illustrative examples can be found in Annex 1 of the TEDS-M sample preparation manual (IEA, 2007a).
8 TEDS-M accepted data from institutions if only one additional future teacher respondent would have brought the response rate in that institution to over the 50 percent threshold.
.
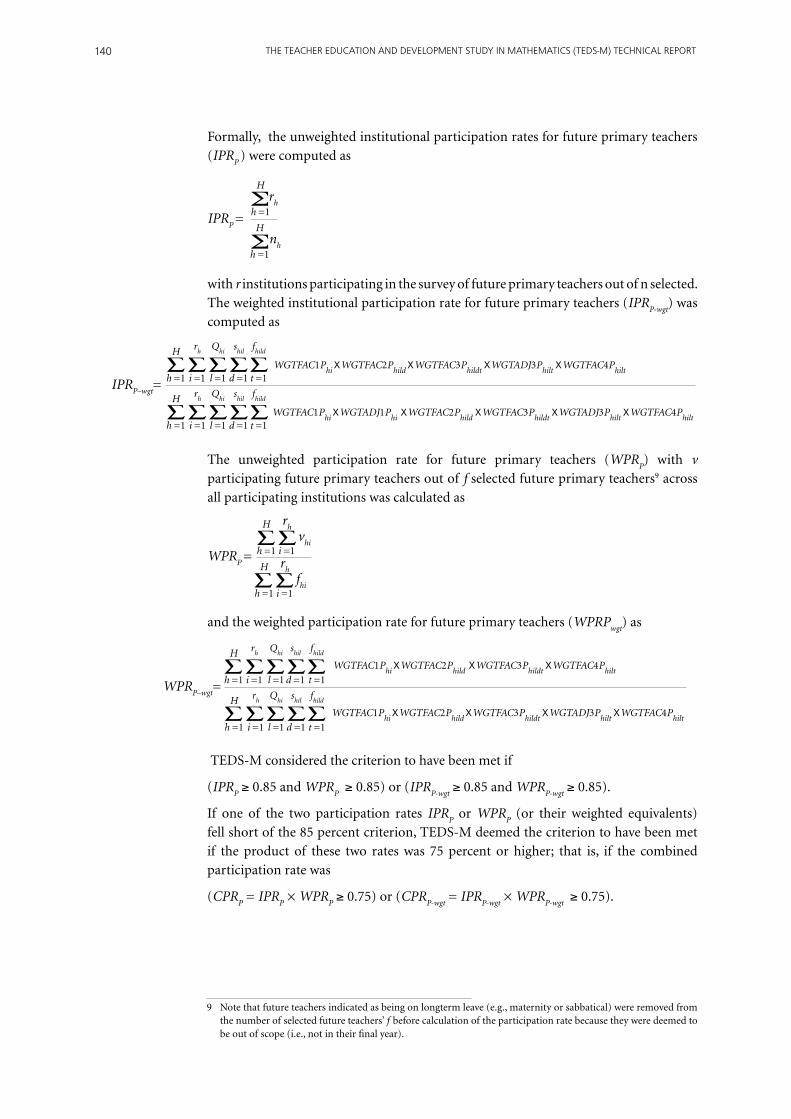
THE TEACHER EDUCATION AND DEVELOPMENT STUDY IN MATHEMATICS (TEDS-M) TECHNICAL REPORT140
Formally, the unweighted institutional participation rates for future primary teachers
(IPRP ) were computed as
H
h =1
rh
IPRP =
H
h =1
nh
with r institutions participating in the survey of future primary teachers out of n selected.
The weighted institutional participation rate for future primary teachers (IPRP-wgt
) was
computed as
The unweighted participation rate for future primary teachers (WPRP) with v
participating future primary teachers out of f selected future primary teachers9 across
all participating institutions was calculated as
H
h =1v
hi
WPRP =
rh
i =1
H
h =1fhi
rh
i =1
and the weighted participation rate for future primary teachers (WPRPwgt
) as
9 Note that future teachers indicated as being on longterm leave (e.g., maternity or sabbatical) were removed from the number of selected future teachers’ f before calculation of the participation rate because they were deemed to be out of scope (i.e., not in their final year).
TEDS-M considered the criterion to have been met if
(IPRP ≥ 0.85 and WPR
P ≥ 0.85) or (IPR
P-wgt ≥ 0.85 and WPR
P-wgt ≥ 0.85).
If one of the two participation rates IPRP or WPR
P (or their weighted equivalents)
fell short of the 85 percent criterion, TEDS-M deemed the criterion to have been met
if the product of these two rates was 75 percent or higher; that is, if the combined
participation rate was
(CPRP = IPR
P × WPR
P ≥ 0.75) or (CPR
P-wgt = IPR
P-wgt × WPR
P-wgt ≥ 0.75).
IPRP–wgt
=
WGTFAC1Phi
x WGTFAC2Phild
x WGTFAC3Phildt
x WGTADJ3Philt
x WGTFAC4Philt
H
h =1
rh
i =1
Qhi
l =1
shil
d =1
fhild
t =1
WGTFAC1Phi
x WGTADJ1Phi
x WGTFAC2Phild
x WGTFAC3Phildt
x WGTADJ3Philt
x WGTFAC4Philt
H
h =1
rh
i =1
Qhi
l =1
shil
d =1
fhild
t =1
WPRP–wgt
=
WGTFAC1Phi
x WGTFAC2Phild
x WGTFAC3Phildt
x WGTFAC4Philt
H
h =1
rh
i =1
Qhi
l =1
shil
d =1
fhild
t =1
WGTFAC1Phi
x WGTFAC2Phild
x WGTFAC3Phildt
x WGTADJ3Philt
x WGTFAC4Philt
H
h =1
rh
i =1
Qhi
l =1
shil
d =1
fhild
t =1

141ESTIMATION OF wEIGHTS, PARTICIPATION RATES, AND SAMPLING ERROR
In effect, the second criterion required that FTQs be received from at least 75 percent
of the sampled future primary teachers. Future teachers whose courses qualified them
to teach both primary and lower-secondary students were taken into the count for both
levels.
10.3.3 Participation Rates for Future Lower-Secondary Teachers
Before the TEDS-M teams could publish statistical summaries about future lower-
secondary teachers in a given country, they first had to establish that the returns of the
lower-secondary future teacher questionnaire (FTQ) were sufficient to provide a useful
sample of future lower-secondary teachers in that country. The process for determining
whether this criterion had been met was identical to that used for the future primary
teacher samples. Hence, TEDS-M counted institutions as “having participated” in this
part of the survey if at least 50 percent of the future lower-secondary teachers in that
institution responded to the FTQ.10
Formally, the unweighted institutional participation rates for future lower-secondary
teachers (IPRS) was calculated as
H
h =1
rh
IPRS =
H
h =1
nh
with r institutions participating in the survey of future lower-secondary teachers out
of n selected. The weighted institutional participation rate for future lower-secondary
teachers (IPRS–wgt
) was computed as
10 Data from institutions were accepted if only one additional future teacher respondent would have brought the response rate in that institution to over the 50 percent threshold.
11 As was the case with the future primary teachers, the secondary future teachers indicated as being on longterm leave (e.g., maternity or sabbatical) were removed from the number of selected future teachers’ f before calculation of the participation rate because they were deemed to be out of scope (i.e., not in their final year).
The unweighted participation rate for future lower-secondary teachers (WPRS) with v
participating future lower-secondary teachers out of f selected future lower-secondary
teachers11 across all participating institution was calculated as
H
h =1 v
hi
WPRS =
rh
i =1
H
h =1fhi
rh
i =1
.IPRS–wgt
=
WGTFAC1Shi
x WGTFAC2Shild
x WGTFAC3Shildt
x WGTADJ3Shilt
x WGTFAC4Shilt
H
h =1
rh
i =1
Qhi
l =1
shil
d =1
fhild
t =1
WGTFAC1Shi
x WGTADJ1Shi
x WGTFAC2Shild
x WGTFAC3Shildt
x WGTADJ3Shilt
x WGTFAC4Shilt
H
h =1
rh
i =1
Qhi
l =1
shil
d =1
fhild
t =1

THE TEACHER EDUCATION AND DEVELOPMENT STUDY IN MATHEMATICS (TEDS-M) TECHNICAL REPORT142
and the weighted participation rate for future lower-secondary teachers (WPRS–wgt
) as
TEDS-M deemed the criterion to have been met if
(IPRS ≥ 0.85 and WPR
S ≥ 0.85) or (IPR
S-wgt ≥ 0.85 and WPR
S-wgt ≥ 0.85).
If one of the two participation rates (IPRS or WPR
S , or their weighted equivalents)
fell short of the 85 percent criterion, TEDS-M considered the criterion to have been
met if the product of these two rates was 75 percent or higher; that is, if the combined
participation rate was
(CPRS = IPR
S × WPR
S ≥ 0.75) or (CPR
S-wgt = IPR
S-wgt × WPR
S-wgt ≥ 0.75).
In effect, the second criterion required receipt of FTQs from at least 75 percent of the
sampled future lower-secondary teachers. Future teachers whose courses qualified them
to teach both primary and lower-secondary students were counted as respondents at
both survey levels.
10.3.4 Participation Rates for Educators
The process for determining whether the participation criterion had been met for the
educator samples was identical to that used for the primary and lower-secondary future
teacher samples. Hence, TEDS-M counted institutions as “having participated” in this
part of the survey if at least 50 percent of the educators in the institution responded to
the educator questionnaire.
Formally, the unweighted institutional participation rates for educators (IPRE) were
computed as
H
h =1
rh
IPRE =
H
h =1
nh
with r institutions participating in the survey of educators out of n selected and the
respective weighted institutional participation rate for educators (IPRE–wgt
) calculated
as
IPRE–wgt
=
WGTFAC1Ehi
x WGTFAC2Ehigj
x WGTADJ2Ehigj
H
h =1
rh
i =1
G
g =1
Phig
j =1
WGTFAC1Ehi
x WGTADJ1Ehi
x WGTFAC2Ehigj
x WGTADJ2Ehigj
H
h =1
rh
i =1
G
g =1
Phig
j =1
.
WPRS–wgt
=
WGTFAC1Shi
x WGTFAC2Shild
x WGTFAC3Shildt
x WGTFAC4Shilt
H
h =1
rh
i=1
Qhi
l =1
shil
d =1
fhild
t =1
WGTFAC1Shi
x WGTFAC2Shild
x WGTFAC3Shildt
x WGTADJ3Shilt
x WGTFAC4Shilt
H
h =1
rh
i=1
Qhi
l =1
shil
d =1
fhild
t =1
.

143ESTIMATION OF wEIGHTS, PARTICIPATION RATES, AND SAMPLING ERROR
The unweighted participation rate for educators (WPRE ) with p participating educators
out of e selected educators across all participating institutions was calculated as
H
h =1P
hi
WPRE =
rh
i =1
H
h =1e
hi
rh
i =1
and the weighted participation rate for educators (WPRE-wgt
) as
TEDS-M deemed the criterion to have been met if
(IPRE ≥ 0.85 and WPR
E ≥ 0.85) or (IPR
E–wgt ≥ 0.85 and WPR
E–wgt ≥ 0.85).
If one of the two participation rates (IPRE or WPR
E , or their weighted equivalents) fell
short of the 85 percent criterion, TEDS-M considered the criterion to have still been
met if the product of these two rates was 75 percent or higher; that is, if the combined
participation rate was
(CPRE = IPR
E × WPR
E ≥ 0.75) or (CPR
E–wgt = IPR
E–wgt × WPR
E–wgt ≥ 0.75).
In effect, the second criterion required receipt of FTQs from at least 75 percent of the
sampled educators.
10.3.5 Sampling Adjudication Outcomes
Adjudication of the data was done separately for each participating country and each
of the four TEDS-M survey populations, in accordance with the recommendations of
the sampling referees12 and in agreement with all further participants of the sampling
adjudication meetings.13 The full adjudication report included information on the
following aspects:
• Targetedandsurveyedpopulations(size,coverage,exclusions);
• Sampling,samplesizes,andparticipationrates(unweighted,weighted);
• Populationcountestimates;
• Relevantadditionalinformation;
• Notesonsurveyoperationsanddataprocessing;and
• Adjudicationcomments.
If a country did not meet the required participation rates for one (or more) of the
populations, the TEDS-M teams still reported statistics for that country. However,
the authors of the international report (Tatto et al., 2012) provided in it annotations
pointing out countries that had failed the requirements. These annotations signaled the
reduced reliability of the data for those countries.
12 Jean Dumais and Marc Joncas, Statistics Canada.
13 Maria Teresa Tatto, John Schwille, and Sharon Senk, as representatives of the international study center; Sabine Meinck as the representative of the IEA DPC sampling team.
.WPRE–wgt
=
WGTFAC1Ehi
x WGTFAC2Ehigj
H
h =1
rh
i =1
G
g =1
Phig
j =1
WGTFAC1Ehi
x WGTFAC2Ehigj
x WGTADJ2Ehigj
H
h =1
rh
i =1
G
g =1
Phig
j =1

THE TEACHER EDUCATION AND DEVELOPMENT STUDY IN MATHEMATICS (TEDS-M) TECHNICAL REPORT144
The following adjudication comments were observed by those members of the TEDS-M
team responsible for reporting TEDS-M data. The comments apply to each of the
sampled populations.
1. Reporting without any annotation: No annotation was made if a country met all
participation rate requirements for the population in scope, had an exclusion rate of
below five, and had full coverage of the target population.
2. Annotation because of low participation rates: This comment was designated for when
a country’s participation rate for the population in scope was below the requirement
but the combined participation rate was still above 60 percent.14
3. Participation rates clearly below standards; reporting together with other countries not
advisable: This comment applied to instances of the combined participation rate for
a population dropping below 60 percent but still being above 30 percent.
4. Unacceptable (move to appendix): This comment applied if the combined participation
rate for a population dropped below 30 percent.
Exhibit 10.2 provides a summary of the adjudication outcomes.
Exhibit 10.3 displays the achieved unweighted participation rates. The weighted
participation rate is reported instead of the unweighted participation rate in cases where
the weighted participation rate affected the data adjudication. Respective occasions are
marked as such. Exhibits 10.4 to 10.7 show the expected versus the achieved sample
sizes for each population.
10.4 Estimating Sampling Error with Balanced Repeated Replication (BRR)
10.4.1 Reasons for Using BRR
As described in Chapter 7 on survey design, surveys with complex designs such as
TEDS-M require special attention with regard to estimation, especially estimation of
the sampling error. Both the survey design and the unequal weights need to be taken
into account to obtain (approximately) unbiased estimates of sampling error. Failure to
do so can lead to severe underestimation of the sampling error. While exact formulae
exist in theory for stratified probability proportional to size (PPS) sample designs, the
required computations become practically impossible to do as soon as the number of
primary units selected per stratum exceeds two.
Researchers and analysts have proposed approximate solutions to cases such as these
over the years. An important class of solutions is that of resampling or replication.
Interpenetrating sub-samples (Mahalanobis), balanced half-samples or balanced repeated
replication (McCarthy, Fay), the jackknife (Quenouille, Tukey, Durbin, Frankel), and the
bootstrap (Efron) are the best-known examples of replication methods (for a review of
these methods, see, for example, Lohr, 1999; Rust & Rao, 1996; Wolter, 2007). TEDS-M
adopted the balanced repeated replication (BRR) (McCarthy, 1966) for estimation of
the sampling error of the estimates produced for the study.
14 Annotations were also advised if the exclusion rate exceeded five percent or if reduced coverage of the target population was observed.

145ESTIMATION OF wEIGHTS, PARTICIPATION RATES, AND SAMPLING ERROR
Exh
ibit
10.
2: S
umm
ary
of a
djud
icat
ion
resu
lts
Co
untr
ies
Inst
itut
ion
s Te
ache
r Ed
ucat
ors
Fu
ture
Pri
mar
y Te
ache
rs
Futu
re L
ow
er-S
eco
nd
ary
Teac
hers
Bots
wan
a N
one
Non
e N
one
Non
e
Can
ada
U
nacc
epta
bly
low
par
ticip
atio
n ra
tes.
U
nacc
epta
bly
low
par
ticip
atio
n ra
tes.
U
nacc
epta
bly
low
par
ticip
atio
n ra
tes.
U
nacc
epta
bly
low
par
ticip
atio
n ra
tes.
(fou
r pr
ovin
ces)
Th
e da
ta re
mai
n un
wei
ghte
d an
d ar
e Th
e da
ta re
mai
n un
wei
ghte
d an
d ar
e Th
e da
ta re
mai
n un
wei
ghte
d an
d ar
e Th
e da
ta re
mai
n un
wei
ghte
d an
d ar
e
no
t re
port
ed
not
repo
rted
no
t re
port
ed
not
repo
rted
Chi
le
Non
e Lo
w p
artic
ipat
ion
rate
s; d
ata
are
C
ombi
ned
part
icip
atio
n ra
te b
etw
een
60
Com
bine
d pa
rtic
ipat
ion
rate
bet
wee
n 60
high
light
ed to
mak
e re
ader
s aw
are
of
75 p
erce
nt.
75
perc
ent.
incr
ease
d lik
elih
ood
of b
ias.
Chi
nese
Tai
pei
Excl
usio
n ra
te >
5%
(ver
y sm
all
Non
e N
one
N
one
in
stitu
tions
wer
e ex
clud
ed).
Geo
rgia
N
one
Non
e N
one
Com
bine
d pa
rtic
ipat
ion
rate
bet
wee
n 60
and
75%
. An
exce
ptio
n w
as m
ade
to
ac
cept
dat
a fr
om t
wo
inst
itutio
ns b
ecau
se,
in
eac
h ca
se, o
ne a
dditi
onal
par
ticip
ant
wou
ld h
ave
brou
ght
the
resp
onse
rate
to
ab
ove
the
50%
thr
esho
ld.
Ger
man
y N
one
Low
par
ticip
atio
n ra
tes;
dat
a ar
e
Non
e N
one
high
light
ed to
mak
e ap
pare
nt th
e in
crea
sed
lik
elih
ood
of b
ias.
Sur
veys
of
inst
itutio
ns
and
teac
hers
wer
e no
t co
nnec
ted
with
su
rvey
of
educ
ator
s.
Mal
aysi
a Lo
w p
artic
ipat
ion
rate
s; d
ata
are
Lo
w p
artic
ipat
ion
rate
s; d
ata
are
Non
e N
one
hi
ghlig
hted
to m
ake
appa
rent
the
high
light
ed to
mak
e ap
pare
nt th
e in
crea
sed
incr
ease
d lik
elih
ood
of b
ias.
lik
elih
ood
of b
ias.
Nor
way
N
one
Part
icip
atio
n ra
tes
coul
d no
t be
cal
cula
ted;
C
ombi
ned
part
icip
atio
n ra
te b
etw
een
60
Low
par
ticip
atio
n ra
tes;
dat
a ar
e
da
ta re
mai
n un
wei
ghte
d an
d ar
e no
t
and
75%
. An
exce
ptio
n w
as m
ade
to
high
light
ed to
mak
e ap
pare
nt th
e in
crea
sed
re
port
ed.
acce
pt d
ata
beca
use
one
addi
tiona
l lik
elih
ood
of b
ias.
Pro
gram
-type
s “A
LU”
pa
rtic
ipan
t w
ould
hav
e br
ough
t th
e an
d “A
LU p
lus
mat
hem
atic
s” a
re p
artly
re
spon
se ra
te to
abo
ve t
he 5
0% t
hres
hold
. ov
erla
ppin
g po
pula
tions
; res
ults
der
ived
Pr
ogra
m-ty
pes
“ALU
” an
d “A
LU p
lus
from
ana
lysi
s ac
ross
pro
gram
-type
s sh
ould
m
athe
mat
ics”
are
par
tly o
verla
ppin
g be
con
duct
ed w
ith c
are
to a
void
und
ue
popu
latio
ns; a
naly
sis
acro
ss p
rogr
am-ty
pes
over
lap
of p
opul
atio
ns.
is
inap
prop
riate
bec
ause
of
this
ove
rlap.

THE TEACHER EDUCATION AND DEVELOPMENT STUDY IN MATHEMATICS (TEDS-M) TECHNICAL REPORT146
Exh
ibit
10.
2: S
umm
ary
of a
djud
icat
ion
resu
lts
(con
td.)
Co
untr
ies
Inst
itut
ion
s Te
ache
r Ed
ucat
ors
Fu
ture
Pri
mar
y Te
ache
rs
Futu
re L
ow
er-S
eco
nd
ary
Teac
hers
Om
an
Prov
ided
edu
catio
n fo
r fu
ture
Pr
ovid
ed e
duca
tion
for
futu
re s
econ
dary
N
ot a
pplic
able
N
one
se
cond
ary
teac
hers
onl
y at
the
tim
e of
te
ache
rs o
nly
at t
he t
ime
of te
stin
g.
test
ing.
Phili
ppin
es
Excl
usio
n ra
te >
5%
(ver
y sm
all
Non
e N
one
Non
e
inst
itutio
ns w
ere
excl
uded
).
Pola
nd
Inst
itutio
ns w
ith c
onse
cutiv
e pr
ogra
ms
C
ombi
ned
part
icip
atio
n ra
te b
etw
een
60
Com
bine
d pa
rtic
ipat
ion
rate
bet
wee
n 60
C
ombi
ned
part
icip
atio
n ra
te b
etw
een
60
only
wer
e no
t co
vere
d.
and
75%
; ins
titut
ions
with
con
secu
tive
and
75%
; ins
titut
ions
with
con
secu
tive
and
75%
; ins
titut
ions
with
con
secu
tive
pro
gram
s on
ly w
ere
not
cove
red.
pr
ogra
ms
only
wer
e no
t co
vere
d.
prog
ram
s on
ly w
ere
not
cove
red.
Russ
ian
Fede
ratio
n Se
cond
ary
peda
gogi
cal i
nstit
utio
ns
Seco
ndar
y pe
dago
gica
l ins
titut
ions
Se
cond
ary
peda
gogi
cal i
nstit
utio
ns
An
unkn
own
perc
enta
ge o
f su
rvey
ed
wer
e no
t co
vere
d.
wer
e no
t co
vere
d.
wer
e no
t co
vere
d.
futu
re te
ache
rs w
ere
alre
ady
cert
ifica
ted
prim
ary
teac
hers
.
Sing
apor
e N
one
Non
e N
one
Non
e
Spai
n (p
rimar
y
Non
e N
one
Non
e N
ot a
pplic
able
educ
atio
n on
ly)
Switz
erla
nd (G
erm
an-
Non
e Lo
w p
artic
ipat
ion
rate
s; d
ata
are
N
one
Non
e
spea
king
par
ts o
nly)
high
light
ed to
mak
e ap
pare
nt t
he
incr
ease
d lik
elih
ood
of b
ias.
Thai
land
N
one
Non
e N
one
Non
e
Uni
ted
Stat
es
Non
e U
nacc
epta
bly
low
par
ticip
atio
n ra
tes;
dat
a
An
exce
ptio
n w
as m
ade
to a
ccep
t da
ta
Com
bine
d pa
rtic
ipat
ion
rate
bet
wee
n 60
(pub
lic in
stitu
tions
)
rem
ain
unw
eigh
ted
and
are
not
repo
rted
fr
om t
wo
inst
itutio
ns b
ecau
se, i
n ea
ch
and
75%
onl
y. A
n ex
cept
ion
was
mad
e to
here
. ca
se, o
ne a
dditi
onal
par
ticip
ant
wou
ld
acce
pt d
ata
from
one
inst
itutio
n be
caus
e
have
bro
ught
the
resp
onse
rate
to a
bove
ra
te w
ithin
it w
as b
elow
50%
. Thi
s
the
50%
thr
esho
ld. I
tem
s w
ith lo
w
brou
ght
the
resp
onse
rate
to a
bove
the
resp
onse
s ar
e cl
early
mar
ked.
50
% t
hres
hold
.

147ESTIMATION OF wEIGHTS, PARTICIPATION RATES, AND SAMPLING ERROR
Exh
ibit
10.
3: U
nwei
ghte
d pa
rtic
ipat
ion
rate
s fo
r in
stit
utio
ns, f
utur
e pr
imar
y an
d lo
wer
-sec
onda
ry te
ache
rs, a
nd te
ache
r ed
ucat
ors
Co
untr
y In
stit
utio
ns
Fu
ture
Pri
mar
y Te
ache
rs
Fu
ture
Lo
wer
-Sec
on
dar
y Te
ache
rs
Ed
ucat
ors
(
Co
mp
osi
tio
n o
f
IP
Qs)
IP
RI (
%)
IPR
l P (
%)
WPR
P (%
) C
PRP
(%)
IPR
l S (
%)
WPR
S (%
) C
PRS
(%)
IPR
E (%
) W
PRE
(%)
CPR
E (%
)
Bots
wan
a 10
0 10
0 86
86
10
0 88
88
10
0 98
98
Can
ada
37
7 69
5
29
72
21
33
79
26
(f
our
Prov
ince
s)
Chi
le
88
86
79
68
83
76
63
70
77
54
Chi
nese
Tai
pei
100
100
90
90
100
97
97
100
95
95
Geo
rgia
10
0 10
0 77
77
10
0 67
67
10
0 97
97
Ger
man
y 10
0 93
82
76
10
0 81
81
92
61
56
Mal
aysi
a 57
96
97
93
86
84
72
73
77
57
Nor
way
96
88
86
75
78
80
63
Dat
a no
t pr
oces
sed
Om
an
100
N
ot a
pplic
able
100
93
93
100
85
85
Phili
ppin
es
85
80
91
75 a
91
92
83
85
94
80
Pola
nd
86
86
79
68
82
84
69
79
86
68
Russ
ian
Fede
ratio
n 91
96
94
91
98
94
92
98
92
91
Sing
apor
e 10
0 10
0 90
90
10
0 91
91
10
0 85
85
Spai
n (p
rimar
y 96
90
87
78
Not
app
licab
le
92
93
85
educ
atio
n on
ly)
Switz
erla
nd (G
erm
an-
94
100
76
76
100
81
81
75
69
52
sp
eaki
ng p
arts
onl
y)
Thai
land
96
98
99
97
98
98
96
93
94
88
Uni
ted
Stat
es
83
85
85*
71
82
84
69
23
58
14
(p
ublic
inst
itutio
ns o
nly)
not
e: a
Wei
ghte
d pa
rtic
ipat
ion
rat
e.

THE TEACHER EDUCATION AND DEVELOPMENT STUDY IN MATHEMATICS (TEDS-M) TECHNICAL REPORT148
Exh
ibit
10.
4: I
nsti
tuti
ons:
exp
ecte
d an
d ac
hiev
ed s
ampl
e si
zes
Co
untr
y N
umb
er o
f In
stit
utio
ns
Inel
igib
le In
stit
utio
ns
Tota
l Num
ber
of
Inst
itut
ion
s N
umb
er o
f Ex
pec
ted
IPQ
s N
umb
er o
f R
etur
ned
in
Ori
gin
al S
amp
le
Pr
ovid
ing
Res
po
nse
to
w
ithi
n P
arti
cip
atin
g IP
Qs
wit
hin
Par
tici
pat
ing
the
IPQ
In
stit
utio
ns
Inst
itut
ion
s
Bots
wan
a
7 0
7 7
7
Can
ada
30
0 11
32
23
(f
our
prov
ince
s)
Chi
le
50
10
35
42
38
Chi
nese
Tai
pei
19
0
19
19
19
Geo
rgia
10
0 10
17
17
Ger
man
y
16
0 16
51
51
Mal
aysi
a
34
4 17
33
20
Nor
way
23
0 22
22
22
Om
an
7
0 7
8 8
Phili
ppin
es
80
20
51
83
82
Pola
nd
92
1
78
130
125
Russ
ian
Fede
ratio
n
58
1 52
98
88
Sing
apor
e
1 0
1 10
10
Spai
n (p
rimar
y
50
0 48
48
48
ed
ucat
ion
only
)
Switz
erla
nd (G
erm
an-
16
0
15
32
28
spea
king
par
ts o
nly)
Thai
land
46
0 44
53
51
Uni
ted
Stat
es
60
0
50
136
117
(p
ublic
inst
itutio
ns o
nly)

149ESTIMATION OF wEIGHTS, PARTICIPATION RATES, AND SAMPLING ERROR
Exh
ibit
10.
5: F
utur
e pr
imar
y te
ache
rs: e
xpec
ted
and
achi
eved
sam
ple
size
s
Co
untr
y N
umb
er o
f In
stit
utio
ns
Inel
igib
le In
stit
utio
ns
Tota
l Num
ber
of
Inst
itut
ion
s N
umb
er o
f Sa
mp
led
Fut
ure
Num
ber
of
Part
icip
atin
g
in O
rigi
nal
Sam
ple
that
Par
tici
pat
ed
Prim
ary
Teac
hers
in
Futu
re P
rim
ary
Pa
rtic
ipat
ing
Inst
itut
ion
s Te
ache
rs
Bots
wan
a
4 0
4 10
0
86
Can
ada
28
0 2
52
36
(fou
r pr
ovin
ces)
Chi
le
50
14
31
83
6
657
Chi
nese
Tai
pei
11
0
11
1,02
3
923
Geo
rgia
9 0
9 65
9
506
Ger
man
y
15
0 14
1,
261
1,
032
Mal
aysi
a
28
4 23
59
5
576
Nor
way
16
0 14
18
5
159
Om
an
N
ot a
pplic
able
Phili
ppin
es
60
19
33
65
3
592
Pola
nd
91
0
78
2,67
3 2,
112
Russ
ian
Fede
ratio
n
52
1 49
2,
403
2,26
6
Sing
apor
e
1 0
1 42
4
380
Spai
n (p
rimar
y
50
0 45
1,
259
1,
093
ed
ucat
ion
only
)
Switz
erla
nd (G
erm
an-
14
0
14
1,23
0
936
sp
eaki
ng p
arts
onl
y)
Thai
land
46
0
45
666
66
0
Uni
ted
Stat
es
60
0
51
1,80
7
1,50
1
(pub
lic in
stitu
tions
onl
y)

THE TEACHER EDUCATION AND DEVELOPMENT STUDY IN MATHEMATICS (TEDS-M) TECHNICAL REPORT150
Exh
ibit
10.
6: F
utur
e lo
wer
-sec
onda
ry te
ache
rs: e
xpec
ted
and
achi
eved
sam
ple
size
s
Co
untr
y N
umb
er o
f In
stit
utio
ns
Inel
igib
le In
stit
utio
ns
Tota
l Num
ber
of
Inst
itut
ion
s N
umb
er o
f Sa
mp
led
Fut
ure
Num
ber
of
Part
icip
atin
g
in O
rigi
nal
Sam
ple
that
Par
tici
pat
ed
Low
er-S
eco
nd
ary
Teac
hers
in
Futu
re L
ow
er-
Pa
rtic
ipat
ing
Inst
itut
ion
s Se
con
dar
y Te
ache
rs
Bots
wan
a
3 0
3 60
53
Can
ada
28
0 8
174
125
(fou
r pr
ovin
ces)
Chi
le
50
10
33
97
7 74
6
Chi
nese
Tai
pei
21
2
19
375
365
Geo
rgia
6 0
6 11
6 78
Ger
man
y
13
0 13
95
2 77
1
Mal
aysi
a
7 0
6 46
2 38
9
Nor
way
25
2 18
24
2 19
4
Om
an
7
0 7
288
268
Phili
ppin
es
60
7
48
800
733
Pola
nd
28
0
23
355
298
Russ
ian
Fede
ratio
n
50
1 48
2,
275
2,14
1
Sing
apor
e
1 0
1 43
1 39
3
Spai
n (p
rimar
y
Not
app
licab
le
ed
ucat
ion
only
)
Switz
erla
nd (G
erm
an-
6
0 6
174
141
spea
king
par
ts o
nly)
Thai
land
46
0 45
66
7 65
2
Uni
ted
Stat
es
59
3
46
726
607
(p
ublic
inst
itutio
ns o
nly)

151ESTIMATION OF wEIGHTS, PARTICIPATION RATES, AND SAMPLING ERROR
Exh
ibit
10.
7: T
each
er e
duca
tors
: exp
ecte
d an
d ac
hiev
ed s
ampl
e si
zes
Co
untr
y N
umb
er o
f In
stit
utio
ns
Inel
igib
le In
stit
utio
ns
Tota
l Num
ber
of
Inst
itut
ion
s N
umb
er o
f Sa
mp
led
N
umb
er o
f Pa
rtic
ipat
ing
in
Ori
gin
al S
amp
le
th
at P
arti
cip
ated
Te
ache
r Ed
ucat
ors
in
Teac
her
Educ
ato
rs
Pa
rtic
ipat
ing
Inst
itut
ion
s
Bots
wan
a
7 0
7 44
43
Can
ada
30
0 10
94
74
(fou
r pr
ovin
ces)
Chi
le
50
10
28
51
0 39
2
Chi
nese
Tai
pei
19
0
19
205
195
Geo
rgia
10
0 10
64
62
Ger
man
y
50
0 46
79
2 48
2
Mal
aysi
a
34
4 22
33
0 25
5
Nor
way
Dat
a no
t pr
oces
sed
Om
an
7
0 7
99
84
Phili
ppin
es
80
20
51
62
6 58
9
Pola
nd
92
1
72
857
734
Russ
ian
Fede
ratio
n
58
1 56
1,
311
1,21
2
Sing
apor
e
1 0
1 91
77
Spai
n (p
rimar
y
50
0 46
57
4 53
3
ed
ucat
ion
only
)
Switz
erla
nd (G
erm
an-
16
0
12
318
220
spea
king
par
ts o
nly)
Thai
land
46
0 43
33
1 31
2
Uni
ted
Stat
es
60
0
14
407
241
(pub
lic in
stitu
tions
onl
y)

THE TEACHER EDUCATION AND DEVELOPMENT STUDY IN MATHEMATICS (TEDS-M) TECHNICAL REPORT152
BRR is a replication method suited to sample designs where exactly two primary
sampling units (PSUs) are selected in each stratum. The principle underpinning BRR
is the following: each of the two PSUs can provide an unbiased estimate of the total
(or other parameter of interest) of its stratum. If the sampling design comprises H
strata, 2H possible unbiased estimates of the parameter of interest can be obtained by
combining either PSU from each of the H strata. The sampling error of the estimate
of the parameter of interest can be directly computed by comparing each of the 2H
estimates with their mean, as one usually does in simple basic statistics. Even with
moderate values of H, the number of unbiased estimates may be quite large (e.g., 25 =
32, 210 = 1 024, 220 = 1 048 576,…). BRR provides a way of extracting from the complete
set of 2H possible replicates a much smaller subset that gives the very same measure of
sampling error as would the full set.
10.4.2 Creating Replicates for BRR
BRR for the sample designs was developed using only two PSUs per stratum. Although
none of the countries participating in TEDS-M had implemented such a sample design,
it was fortunately possible to approximate the implemented sample design by using a
superimposed “BRR-ready” sample plan. Listing the institutions in the order in which
they appeared on the sampling frame allowed pairing of the participating institutions
(of the original sample or the replacements) within explicit strata. Each pair was
dubbed a “pseudo stratum” or “zone.” If the number of participating institutions in an
explicit stratum was odd, a triplet was formed with the last three institutions. The pairs
(or triplets) were then numbered sequentially from 1 to G, spanning the whole sample,
and each institution within a pseudo stratum or zone was assigned a random pseudo
PSU number 1 or 2 (or 3 for a triplet) as depicted in Exhibit 10.8.
Exhibit 10.8: Example of “BRR-ready” sample design and random assignation of pseudo PSUs
Explicit Stratum Institution ID Zone = Pseudo PSU Any Variables of Interest Pseudo Stratum
1 1010 1 1 … …
1 1020 1 2
1 1030 2 1
1 1040 2 2
2 1050 3 2
2 1060 3 1
2 1070 4 1
2 1080 4 2
2 1090 4 3
3 1100 5 1 … …
H … G-1 2
H … G-1 1
H … G 1
H … G 2

153ESTIMATION OF wEIGHTS, PARTICIPATION RATES, AND SAMPLING ERROR
As occurs with the jackknife repeated replication, one of the two pseudo PSUs is dropped
and the remaining PSU is used to compute an estimate of the parameter of interest. The
randomization of the PSUs is, however, somewhat different. First, a label, +1 or -1, is
assigned at random to one of the pseudo PSUs of a zone; the second pseudo PSU is
automatically assigned to the remaining label. A special matrix (of order 4t, t = 1, 2, …)
of +1’s and -1’s then indicates which PSU is to be kept from each pseudo stratum. For
example, the Hadamard matrix of order 8 can be given by
If H is a Hadamard matrix of order 4t , then H’H = 4tI . The orthogonality of the matrix
is the basis for “balanced” in BRR. TEDS-M used a Hadamard matrix of order 32, which
led to 32 replicates.
Because the standard BRR method can become unstable when applied to sparse
samples, TEDS-M applied Fay’s modification to overcome this shortage (Fay, 1989; see
also Judkins, 1990). The idea behind Fay’s modification is not to completely drop one
of the PSUs and double the other but rather to always use some linear combination of
the two pseudo PSUs comprising a zone. For TEDS-M, with respect to pairs, the weight
of one PSU was multiplied by 1.5 and the weight of the corresponding PSU by 0.5.
With triplets, the factors were 1.7071 for a given replicate and 0.6464 for the other two
replicates, or 0.2929 for one and 1.3536 for the other two.
Each of the four TEDS-M data files (i.e., comprising data from the four different survey
populations) contained two sets of BRR variables (pseudo stratum, pseudo PSU, 32
replicates). One set referred to the respective final institution weight (see Section
10.2.3 above). The pseudo strata referring to institutions was created firstly for samples
of institutions as explained above (pairing adjacent institutions) and secondly for
censuses by pairing similar institutions.15 The second set of BRR variables referred to
the respective final population weight (final TPU weight, final future teacher weight
[primary/secondary], and final educator weight). With samples of institutions, adjacent
institutions were again paired in order to build the BRR pseudo strata. If, however, all
institutions in a country were asked to participate (or any institution had a selection
probability of 1), TEDS-M implemented another approach, as follows:
• In the data files comprising data from the institutional program questionnaire,
TPUs were paired, imposing the route × level combination as the explicit stratum.
This step meant that only TPUs preparing future teachers in the same route × level
combination were paired, but the pairing happened across institutions.
• In data files comprising future teacher data, the individual future teachers were
paired, thereby imposing the institutions as explicit strata.
+1 +1 +1 –1 +1 –1 –1 –1
–1 +1 +1 +1 –1 +1 –1 –1
–1 –1 +1 +1 +1 –1 +1 –1
+1 –1 –1 +1 +1 +1 –1 –1
–1 +1 –1 –1 +1 +1 +1 –1
+1 –1 +1 –1 –1 +1 +1 –1
+1 +1 –1 –1 –1 –1 +1 –1
–1 –1 –1 –1 –1 –1 –1 –1
Hadamard8
15 Similarity of institutions was defined as a function of the specific level × route combinations offered by the institutions. For more details, see Appendix C of this report, “Characteristics of National Samples.”

THE TEACHER EDUCATION AND DEVELOPMENT STUDY IN MATHEMATICS (TEDS-M) TECHNICAL REPORT154
• Indatafilescomprisingeducatordata,theindividualeducatorswerepaired,thereby
imposing the educator-groups within the institutions as explicit strata.
Again, in cases where the number of units to be paired within an explicit stratum was
an odd number, triplets were built.
10.4.3 Estimating the Sampling Error
Let θ be the population parameter of interest. Let θ ˆ be the full sample estimate for θ obtained by using the final weight and let θ ˆg, g =1,..., 32, be the BRR replicate estimates
of the same parameter of interest obtained by using the BRR weights described in
Section 10.4.2. Then, setting k = 0.5, Fay’s BRR estimate of the sampling variance of θ ˆ
is given as
VFAY
(θ ˆ) =1
G(1 – k)2
G
g =1(θ ˆ
g–θ ˆ)2 = 0.125
32
g =1(θ ˆ
g–θ ˆ)2
and the sampling error is (finally) the square root of the sampling variance.
10.4.4 Using Sampling Error when Comparing Estimates
When comparing estimates, either variables or groups within a country, across two
countries, or a country value to the international average, one needs to scale this
comparison by using the appropriate estimate of sampling error.
The standard error for the difference of two estimates from one country, say θ ˆ1 and θ ˆ
2,
is given as
VFAY
(θ ˆ1) + V
FAY (θ ˆ
2) – 2Cov
FAY (θ ˆ
1, θ ˆ
2)se (θ ˆ
1–θ ˆ
2) =
= VFAY
(V)
where V = θ 1–θ
2 is the difference between the two characteristics of interest (e.g., number
of lessons in mathematics versus the number of lessons in pedagogy) measured within
the participating institutions. When estimates of differences are required, it is often
simpler to compute the difference for each record as a derived variable to compute the
sampling error of the derived variable.
The standard error for the difference of the estimates for two countries, say θ ˆc and θ ˆ
d,
is given as
VFAY
(θ ˆc) + V
FAY (θ ˆ
d)se (θ ˆ
c–θ ˆ
d) =
The standard error for the difference of an estimate for a given country, say θ ˆc and the
international average θ ˆ is given as
(N2 – 2N)VFAY
(θ ˆc) +
N
k =1V
FAY (θ ˆ
k)
N2se (θ ˆ
c–θ ˆ) =
where θ ˆ = θ ˆk
N N
k =1
, N being the number of countries contributing to the mean θ ˆ , and
θ ˆc
is the estimate for country “c”.
.

155ESTIMATION OF wEIGHTS, PARTICIPATION RATES, AND SAMPLING ERROR
If θ ˆ is one of the statistics described above and se(θ ˆ) is the standard error of θ ˆ, then
confidence intervals can easily be obtained by computing the following boundaries:
lowerα = θ ˆ – t se(θ ˆ) and upperα = θ ˆ + t se(θ ˆ),
where 1-α is the preset confidence level (e.g., 1-α = 0.95), and t is 1-α/2 percentile
of the student t-distribution with df degrees of freedom. In most applications, df will be
large enough to allow the use of the standard normal deviate z1-α/2 (e.g., z1-α/2 = 1.96
for α = 0.05). Nevertheless, users should verify how many zones actually contribute to
the statistic θ ˆ and how many BRR replicates contribute to the computation of se(θ ˆ) in
order to confirm the number of degrees of freedom.
10.4.5 Design Effect and Effective Sample Size
Complex surveys such as TEDS-M are known to be “less efficient” than simple random
samples of the same size. Usual explanations for this lesser efficiency include the fact
that respondents are selected in groups of individuals sharing many characteristics—
school environment, professional training, classroom equipment, textbooks, and so on.
The loss in efficiency is often summarized in a statistic called “design effect” or deff
(Kish, 1965). The design effect (for a statistic and a sampling plan) is the ratio of the
variance of the estimate under the sampling plan to the variance of the same estimate
under simple random sampling of the same size. In the case of TEDS-M, the true design
effect is approximated as
deff (θ ˆ, BRR)=V
BRR(θ ˆ)
VSRS
(θ ˆ)
Alternatively, the design effect can be regarded as the ratio of sample sizes, in which
case the term “effective sample size” is used to describe the sample size of the complex
survey adjusted for the design effect:
n
effective =
nBRR
deff .
Exhibits 10.9 and 10.10 present the estimated design effects for key TEDS-M variables
by participating country for the two future teacher populations. The exhibits display not
only the actual values for the design effects of the achievement variables mathematics
content knowledge (MCK) and mathematics pedagogy content knowledge (MPCK) but
also the average design effects over similar variables for the beliefs and opportunities to
learn (OTL) scales.
As can be seen from the two exhibits, the design effect was often estimated as below 1
in countries where a stratified simple random sample design was applied (census of
institutions) rather than a complex cluster design. In other words, the former designs—
as could be expected—proved to be as efficient as (or, by trend, even slightly more
efficient than) unstratified simple random samples. In countries with complex cluster
samples in all strata (the Philippines, Russian Federation, and United States), it is clearly
evident that the design effect is above 1. Extreme design effects can be observed for the
Russian Federation for the two achievement scores. These effects resulted mainly from
the large differences in the average achievement of future teachers within participating
institutions, in addition to the applied sampling design with two clustering levels.

THE TEACHER EDUCATION AND DEVELOPMENT STUDY IN MATHEMATICS (TEDS-M) TECHNICAL REPORT156
Exh
ibit
10.
9: F
utur
e pr
imar
y te
ache
rs: a
ppro
xim
ated
des
ign
effe
cts
for
key
vari
able
s by
par
tici
pati
ng c
ount
ry
Co
untr
y
Bots
wan
a 1.
30
1.15
1.
13
0.84
0.
82
Chi
le
0.71
1.
10
0.79
0.
97
0.92
Chi
nese
Tai
pei
2.29
1.
07
1.14
1.
23
1.32
Geo
rgia
1.
03
1.23
0.
80
0.97
0.
96
Ger
man
y 1.
04
1.93
2.
15
1.71
1.
52
Mal
aysi
a 0.
66
1.20
1.
08
0.76
1.
03
Nor
way
(pro
gram
-type
ALU
) a 0.
77
0.86
0.
99
0.89
0.
80
Nor
way
(pro
gram
-type
ALU
0.
55
0.98
1.
06
0.93
1.
00
+ m
athe
mat
ics)
a
Phili
ppin
es
12.9
3 12
.40
6.48
6.
02
7.57
Pola
nd
1.04
0.
65
1.30
1.
39
1.18
Russ
ian
Fede
ratio
n 26
.66
21.3
2 7.
17
9.02
11
.62
Sing
apor
e 0.
68
0.88
0.
87
0.97
0.
88
Spai
n 2.
36
1.37
2.
76
4.49
3.
11
Switz
erla
nd (G
erm
an-
0.79
0.
62
0.83
0.
96
0.93
sp
eaki
ng p
arts
onl
y)
Thai
land
0.
62
0.69
1.
03
0.93
0.
66
Uni
ted
Stat
es (p
ublic
3.
65
1.45
3.
13
3.70
3.
08
inst
itutio
ns o
nly)
Des
ign
Eff
ect
for
Ach
ieve
men
t Sc
ales
(sca
led
aro
und
a m
ean
of
500
SD 1
00)
Ave
rag
e D
esig
n E
ffec
t ov
er S
even
B
elie
f Sc
ales
(Ras
ch s
cale
s, c
ente
red
aro
und
10
as
neu
tral
po
siti
on
)
Ave
rag
e D
esig
n E
ffec
t ov
er 1
0 O
TL
Scal
es(s
um s
core
s w
ith
6 as
max
imum
)
Ave
rag
e D
esig
n E
ffec
t ov
er 1
4 O
TL
Scal
es(R
asch
sca
les,
cen
tere
d a
roun
d 1
0 as
n
eutr
al p
osi
tio
n)
MC
KM
PCK
not
e: a
Pro
gram
typ
es “A
LU”
and
“ALU
+ m
ath
emat
ics”
are
par
tly
over
lapp
ing
pop
ula
tion
s; t
he
anal
ysis
was
th
eref
ore
sepa
rate
d by
pro
gram
-typ
e.

157ESTIMATION OF wEIGHTS, PARTICIPATION RATES, AND SAMPLING ERROR
Exh
ibit
10.
10: F
utur
e lo
wer
-sec
onda
ry te
ache
rs: a
ppro
xim
ated
des
ign
effe
cts
for
key
vari
able
s by
par
tici
pati
ng c
ount
ry
Co
untr
y
Bots
wan
a 1.
0 1.
0 0.
97
0.98
0.
78
Chi
le
0.7
1.4
1.04
0.
87
1.01
Chi
nese
Tai
pei
1.0
1.1
1.02
0.
86
0.94
Geo
rgia
0.
9 1.
1 0.
90
0.91
0.
98
Ger
man
y 1.
1 2.
2 2.
23
2.40
1.
86
Mal
aysi
a 0.
9 1.
1 1.
12
0.97
0.
65
Nor
way
(pro
gram
-type
ALU
) a 1.
0 1.
2 1.
04
0.78
0.
93
Nor
way
(pro
gram
-type
ALU
0.
8 1.
1 1.
11
1.00
1.
07
+ m
athe
mat
ics)
a
Nor
way
(pro
gram
-type
0.
5 0.
4 1.
03
1.02
0.
92
Mas
ter’
s) a
Nor
way
(pro
gram
-type
PPU
) a 0.
9 1.
5 0.
97
0.96
1.
01
Om
an
0.7
0.9
0.96
0.
99
1.04
Phili
ppin
es
6.5
4.4
4.57
7.
26
6.29
Pola
nd
0.7
0.8
1.14
1.
37
1.43
Russ
ian
Fede
ratio
n 37
.8
23.8
5.
21
9.18
9.
77
Sing
apor
e 0.
8 1.
2 1.
02
1.11
1.
02
Switz
erla
nd (G
erm
an-
0.8
0.9
0.95
0.
86
0.62
sp
eaki
ng p
arts
onl
y)
Thai
land
0.
5 1.
0 0.
91
0.99
0.
93
Uni
ted
Stat
es (p
ublic
9.
3 5.
9 5.
33
3.56
5.
99
inst
itutio
ns o
nly)
Des
ign
Eff
ect
for
Ach
ieve
men
t Sc
ales
(sca
led
aro
und
a m
ean
of
500,
SD 1
00)
Ave
rag
e D
esig
n E
ffec
t ov
er S
even
B
elie
f Sc
ales
(Ras
ch s
cale
s, c
ente
red
aro
und
10
as
neu
tral
po
siti
on
)
Ave
rag
e D
esig
n E
ffec
t ov
er 1
0 O
TL
Scal
es(s
um s
core
s w
ith
6 as
max
imum
)
Ave
rag
e D
esig
n E
ffec
t ov
er 1
4 O
TL
Scal
es(R
asch
sca
les,
cen
tere
d a
roun
d 1
0 as
n
eutr
al p
osi
tio
n)
MC
KM
PCK
not
e: a
Pro
gram
-typ
es “A
LU”,
“ALU
+ m
ath
emat
ics”
an
d “
Mas
ter’
s” a
re p
artl
y ov
erla
ppin
g p
opu
lati
ons;
th
e an
alys
is w
as t
her
efor
e se
para
ted
by p
rogr
am-t
ype.

THE TEACHER EDUCATION AND DEVELOPMENT STUDY IN MATHEMATICS (TEDS-M) TECHNICAL REPORT158
Exhibit 10.11 shows the average design effects for the beliefs and OTL scales of the
educator population by participating country. Again, it can be seen that the design
effects are clearly higher in the countries with complex cluster samples for this
population (Germany, the Philippines, and the Russian Federation) than in countries
with institution censuses. However, where the values are below 2, the design effects are
still moderate. Considering that the scales were built identically from the future teacher
and the educator questionnaires,16 educators show conclusively lower clustering effects
than future teachers, or, in other words, future teachers from one program tended to be
more alike than were educators belonging to the same institution.
Exhibit 10.11: Educators: approximated design effects for key variables by participating country
Country
Botswana 0.91 0.95
Chile 0.83 1.18
Chinese Taipei 3.42 1.40
Georgia 0.86 0.77
Germany 3.01 5.52
Malaysia 0.87 1.05
Oman 1.10 0.76
Philippines 3.80 2.57
Poland 1.07 1.04
Russian Federation 2.92 3.13
Singapore 0.91 0.88
Spain 1.29 1.06
Switzerland (German- 0.96 0.98 speaking parts only)
Thailand 1.16 0.95
Average Design Effect over Six Belief Scales
(Rasch scales, centered around 10 as neutral position)
Average Design Effect over 12 OTL Scales
(Rasch scales, centered around 10 as neutral position)
16 Major parts of the sections about OTL and beliefs were identical in the future teachers’ and educators’ questionnaires; most OTL and belief scales were built identically for both populations. For more information, see Chapter 4 of this technical report.
159ESTIMATION OF wEIGHTS, PARTICIPATION RATES, AND SAMPLING ERROR
References
Brese, F., & Tatto, M. T. (Eds.). (2012). TEDS-M 2008 user guide for the international database.
Amsterdam, the Netherlands: International Association for the Evaluation of Educational
Achievement (IEA).
Fay, R. E. (1989). Theoretical application of weighting for variance calculation. In Proceedings of the
Section on Survey Research Methods, ASA (1989) (pp. 212–217). Alexandria, VA: American Statistical
Association (ASA). Available online at http://www.amstat.org/sections/srms/Proceedings/
International Association for the Evaluation of Educational Achievement (IEA). (2006a). TEDS-M
2008 sample preparation manual. Amsterdam, the Netherlands: Author.
International Association for the Evaluation of Educational Achievement (IEA). (2006b). TEDS-M
2008 survey operations procedures. Amsterdam, the Netherlands: Author.
Judkins, D. (1990). Fay’s method for variance estimation. Journal of Official Statistics, 3, 6223–
6240.
Kish, L. (1965). Survey sampling. New York, NY: Wiley.
Lohr, S. (1999). Sampling: Design and analysis. New York, NY: Duxbury Press.
McCarthy, P. J. (1966). Replication: An approach to the analysis of data from complex surveys.
Vital and Health Statistics, 2(14).
Organisation for Economic Co-operation and Development (OECD). (2006). PISA 2006 technical
report. Paris, France: Author. Available online at http://www.oecd.org/pisa/pisaproducts/
pisa2006/42025182.pdf
Organisation for Economic Co-operation and Development (OECD). (2007). Teaching and
Learning International Study (TALIS) main survey: Sampling manual (Ref. No. MS-02-03, Version
3, 29 August 2007). Paris, France: Author.
Rust, K., & Rao, J. N. K. (1996). Variance estimation for complex estimators in sample surveys.
Statistics in Medical Research, 5, 381–397.
Tatto, M. T., Schwille, J., Senk, S. L., Ingvarson, L., Rowley, G., Peck, R., Bankov, K., Rodríguez, M.,
& Reckase, M. (2012). Policy, practice, and readiness to teach primary and secondary mathematics
in 17 countries: Findings from the IEA Teacher Education and Development Study in Mathematics
(TEDS-M). Amsterdam, the Netherlands: International Association for the Evaluation of Student
Achievement (IEA).
Wolter, K. (2007). Introduction to variance estimation (2nd ed.). New York, NY: Springer Verlag.

THE TEACHER EDUCATION AND DEVELOPMENT STUDY IN MATHEMATICS (TEDS-M) TECHNICAL REPORT160
161
CHAPTER 11: SCalE DEvElOpMEnT anD REpORTinG: OppORTuniTiES TO lEaRn, BEliEfS, anD MaThEMaTiCS KnOwlEDGE fOR TEaChinG
Maria Teresa Tatto, Michigan State University
Michael Rodríguez, University of Minnesota
Mark Reckase, Michigan State University
Glenn Rowley, Australian Council for Educational Research
Yang Lu, Michigan State University
11.1 Methods Used to Develop the Opportunity to Learn and Beliefs Scales: OverviewThe TEDS-M opportunity to learn (OTL) and beliefs measures for future primary and lower-secondary teachers and their educators were based on scales and items developed in a variety of ways. Several scales and items built on previous research conducted at Michigan State University (MSU) and the Australian Council for Educational Research (ACER), and some were developed specifically for TEDS-M in general and the participating countries in particular.
After conducting an extensive pilot of a larger set of items, members of the TEDS-M international research team selected items that appeared to provide information on program, institution, and country variation. Items that survived initial exploratory factor analyses were used in the operational forms for the main study.
Drawing on a preconceived conceptualization of OTL in four broad categories (mathematics content, mathematics education pedagogy, general education pedagogy, and school-based experiences), the team used a confirmatory factor analysis process to assess the fit between each OTL scale measure and the data as well as the relationships among them. The OTL scales were then created in accordance with the best-fitting models. This process led to identification of several scales pertaining to each of the four broad categories. The total number of distinct OTL scales across all four categories was 24.
In order to form the OTL scales encompassing topics studied in relation to mathematics content, mathematics pedagogy, and general pedagogy, the TEDS-M team summed up the number of topics studied so that all of these scales could be interpreted in terms of the number of topics studied under each scale. For OTL scales based on items requiring the use of response-rating scales (e.g., activities in which future teachers participated from “never” to “often”), the team estimated Rasch logit scores and then centered them at the point on the relevant OTL scale associated with the middle of the rating scale (essentially “neutral”). More specifically, the test characteristic curve (essentially, the one-to-one correspondence table between summed score and Rasch measure) was used to identify the point on the Rasch scale associated with the midpoint on the summed score scale; this value was used to center the OTL scale at a scaled value of 10. All OTL scales based on Rasch logit scores could therefore be interpreted by comparing each such score with the scale midpoint (i.e., 10—the neutral position). The displays created for the OTL measurements can be found in the TEDS-M international report (Tatto et al., 2012).

THE TEACHER EDUCATION AND DEVELOPMENT STUDY IN MATHEMATICS (TEDS-M) TECHNICAL REPORT162
The TEDS-M beliefs scales comprised items measuring beliefs about the nature of mathematics, learning mathematics, mathematics achievement, and preparedness for teaching mathematics. One other developed scale focused on the overall effectiveness of the teacher preparation program. As with development of the OTL scales, a confirmatory factor analysis process was used to assess the fit between each belief scale item and the data and, from there, create belief scale scores from the best-fitting models.
Again, as was done for the OTL items, item response theory (IRT) was used to scale each belief item. The scale was defined so that a score of 10 corresponded to a neutral response (i.e., equal propensity to agree or disagree with the statements presented). Scores above 10 indicated that responses predominantly agreed with the statements; scores below 10 indicated that responses predominantly disagreed with the statements. The TEDS-M team considered these scales, developed in order to obtain the best possible matching of the score to the underlying attribute, particularly suitable for quantifying the relationships among beliefs or between beliefs and other scores (e.g., the standardized scores for future teachers’ mathematics content knowledge and future teachers’ mathematics pedagogy content knowledge) on similarly constructed scales. The displays created for the beliefs measurements appear in the TEDS-M international report (Tatto et al., 2012).
Several OTL and belief scales were also created from the items used in the survey for the future teachers’ educators. The item parameters calibrated from the future teachers’ scores were used as fixed parameters to estimate the scale scores for educators, thus placing the OTL and beliefs scale scores from educators on the same scale as the future teachers’ and thereby facilitating comparative inferences. The TEDS-M team obtained information about the fit between the OTL/beliefs measures and the educator responses by conducting confirmatory factor analyses using the MPlus software (Muthén & Muthén, 1998).
Reliabilities were unweighted and were estimated using jMetrik 2.1 software (Meyer, 2011). The reliability estimates were based on the congeneric measurement model, which allows each item to load on the common factor at different levels and allows item error variances to vary freely. (Each item can be measured with a different level of precision.)Thismeasurementmodelisdeemedthemostflexibleandappropriateonefor measures with few items (see Appendices F, G, and H).
11.2 Development of the OTL ScalesDevelopment of the OTL scales began at the very start of the TEDS-M project. This work drew on information obtained from previous research (Tatto, 1996, 1998, 1999). It also encompassed several existing scales, such as connecting theories of teaching and learning and connecting practice and reflection, developed and used successfully in research conducted at ACER prior to TEDS-M (Ingvarson, Beavis, Danielson, Ellis, & Elliott, 2005; Ingvarson, Beavis, & Kleinhenz, 2007). Information regarding the usefulness and effectiveness of this early work was gathered during development of the TEDS-M pilot study instruments. It provided strong validity-related evidence regarding the content of
(i.e., the survey items making up) the OTL scales.

163SCALE DEVELOPMENT AND REPORTING
11.2.1 Analysis of the Pilot-Study Responses to the OTL Items
The TEDS-M research team conducted several levels of exploratory and confirmatory
analyses on the pilot responses to all OTL items. The team also assessed the pilot
findings against the TEDS-M conceptual framework (Tatto et al., 2008) and against
prior research and evidence (see Chapter 4 of this report). Appendix I provides an
account of the specific methods used during the pilot analyses of the OTL items.
The comprehensive analyses of the pilot results and the close accord between the OTL
scale structures and findings from relevant prior research provided strong validity-
related support for the construct definitions of OTL for future teachers. The national
research coordinators (NRCs) of the participating countries also reviewed all OTL
items before and after the pilot study.
11.2.2 Initial Analyses of the Main-Study Survey Results
Initial analyses to assess the quality of the items used in these surveys employed
exploratory methods, including factor analysis, scale reliability analyses, and some
limited Rasch scaling. Findings were remarkably similar to the pilot findings, and there
was strong consistency between the future primary teacher and future lower-secondary
teacher results. These early commonalities suggested successful identification of the
items making up the OTL scales.
The TEDS-M team analyzed each of the OTL scales for psychometric quality, seeking
out evidence of internal consistency, score reliability, and (in particular) measurement
invariance. These methods were primarily based on confirmatory models, which the
team deemed appropriate given the nature of the data. The results of these analyses are
reported in Appendices J and K.
11.2.3 Confirmatory Factor Analysis
Confirmatory factor analysis (CFA) provided strong construct-related evidence
regarding the factor structure of each OTL scale. Establishing the independence of
each measure of OTL was important in terms of providing clear information about the
extent to which each independent explanatory variable explained variation in the key
outcomes of teacher preparation. CFA not only enables testing of data–model fit but
also provides a means of assessing the usefulness of simpler versus more complex factor
structures. TEDS-M’s goal in this regard was to identify the most parsimonious set of
OTL scales.
In order to complete the CFA for each set of OTL measures, the TEDS-M team used
the statistical software package Mplus 5.2 (Muthén & Muthén, 1998). They initially
assessed the factor structure, made up of the factors identified from prior research and
the pilot results, across countries. To assess the degree to which these factor structures
were invariant across countries, the team used multiple group confirmatory factor
analysis (MCFA), which made it possible to test the fit of a given factor structure in
each country, and from there defend (or otherwise) the meaningfulness of each OTL
scale within and across countries. Particular features of Mplus MCFA, including its
ability to accommodate missing data and complex survey data and to conduct single or
multiple group analyses, made Mplus MCFA a strong application for TEDS-M (Muthén
& Muthén, 1998).

THE TEACHER EDUCATION AND DEVELOPMENT STUDY IN MATHEMATICS (TEDS-M) TECHNICAL REPORT164
Mplus also allows for non-normal continuous factor indicators, which the TEDS-M
team employed when analyzing the OTL scales for the future teacher surveys. Some
OTL scales were based on the numbers of topics studied, for example, the tertiary-level
mathematics topics. The responses from these indicators included “studied”/“never
studied,” resulting in dichotomous responses (0/1). The remaining OTL scales were
based on ordinal indicators on a four-point scale (ranging from either “never” to “often”
or from “disagree” to “agree”). Mplus furthermore allows for proper CFA estimation of
non-normal data, including accommodation of missing data. The default estimator
for this type of analysis is a robust weighted least squares estimator, employing probit
regression for factor estimation.
11.2.4 Rasch Scaling
Rasch scaling was used to produce the reporting score scale for the OTL scales. Rasch
scaling provided measures of OTL with several scale (statistical) properties that made
them stronger variables in general linear model (GLM)-based analyses. When the
assumptions of a model are met, Rasch scales result in interval-level measurement,
providing a scale with properties suited to correlational methods.
The improved scale properties relative to the use of a simple summed score is probably
the most significant benefit of using Rasch scaling. Rasch analysis locates each indicator
on the same scale as person-trait levels, providing for a meaningful ordering of
indicators and so relaying information about the rarity or severity of each indicator (a
form of item difficulty). Rasch scaling, in turn, provides an efficient means of estimating
trait values for individuals who have not responded to every item. Scaling also makes
it possible to conduct weighted analyses when estimating item locations on the trait
scale. However, it is important to note that because the OTL scales conceptualized in
the TEDS-M framework are indicators of program characteristics, they must be used in
their aggregate form at the program level. Person-trait levels, as estimated by Rasch, are
useful in this context as indicators of program characteristics.
To complete the scaling, the TEDS-M team scaled the OTL scales using a combined file
of future primary and lower-secondary teachers across countries. Only those cases from
within the file that responded to more than 50 percent of the items were included in
the scaling. The team then recomputed the weights for each OTL scale, accounting for
the variation in the resulting sample in terms of the inclusion criterion (i.e., response
to more than 50% of the items within a scale). This criterion meant that the proportion
of respondents responding to each scale differed from one country to the next. The
weights were therefore adjusted again so that, in each country, they summed up to 500
for the primary-level population and 500 for the lower-secondary-level population. In
other words, each country with primary and lower-secondary respondents contributed
500 primary and 500 lower-secondary units of observations to the final scaling. The
weights could then be estimated through use of a simple transformation based on the
resulting sample size and the effective sum of 500 for each population in each country.
This first level of analysis with valid cases constituted the calibration sample.
The TEDS-M team estimated the Rasch item calibrations by using Winsteps (Linacre,
2010), with the partial-credit model. This model allowed each item to contribute

165SCALE DEVELOPMENT AND REPORTING
different threshold values to each rating-scale point. The polytomous “partial credit”
model as defined and estimated in Winsteps (Linacre, 2010, p. 18) is
log = Bn – D
gi – F
gj
Pnij
Pni(j–1)
,
where Pnij
is the probability that person n responds to item i in observed category j,
and the Rasch parameters are Bn
, the ability of the person, Dgi
, the difficulty of item
i of grouping g, and Fgj the threshold between categories j–1 and j of grouping g. This
grouping convention allows each item to consist of its own grouping and so form its
own rating-scale response structure. If there is only one grouping, that grouping aligns
with Andrich’s “rating scale” model. If each item forms a grouping of its own, such as
g = i, then that grouping is Masters’ “partial credit” model (Linacre, 2010). The model
that the TEDS-M team used was the partial credit model. In allowing each item to have
its own response structure, it provided a better fit to the data.
The next step involved using calibration values to provide scores for all cases responding
to more than 50 percent of the items, regardless of validity status. This step was taken
in order to provide scores for all cases, even those excluded as a result of sample
adjudication. A country with not-included cases could therefore, if it considered it
meaningful to do so, conduct full analyses of all its cases.
To facilitate improved score interpretation, the TEDS-M team rescaled the scores.
Because of the one-to-one correspondence of summed scores to measure in the Rasch
model, the team members were able to rely on the test characteristic curve to relocate
final scale scores, wherein the scale score of 10 was associated with the midpoint of the
raw score scale (the point half way between “never” and “often,” or between “disagree”
and “agree”). This procedure provided for a common interpretable metric for the OTL
scales, such that 10 was associated with a midpoint regarding frequency, a neutral
perspective regarding agreement, or a midpoint regarding the extent of preparedness
(for example) for each scale.
The OTL scales (see Exhibit 11.1) were thus developed through exploratory and
confirmatory analyses and the scaling procedure described above. Appendix J sets out
the item loadings and model fit statistics for each OTL scale for the primary and lower-
secondary future teacher questionnaires and for the teacher educator questionnaire.
Appendix K includes the model fit statistics by country.
11.3 Development of the Beliefs Scales
The belief scales were based on items from research-based belief scales used in earlier
studies.1 After completion of the TEDS-M pilot, the TEDS-M team selected items from
among those that survived exploratory factor analyses. A subset of highly homogeneous
items per scale was selected for the operational forms. Additional Rasch rating-scale
analyses were conducted to evaluate the effectiveness of the six-point rating scale (used
by some belief scales), and support was found for its continued use. The complete
analytical process mirrored that used for the OTL scales, as described above.
1 For more details, see the TEDS-M conceptual framework (Tatto et al., 2008).
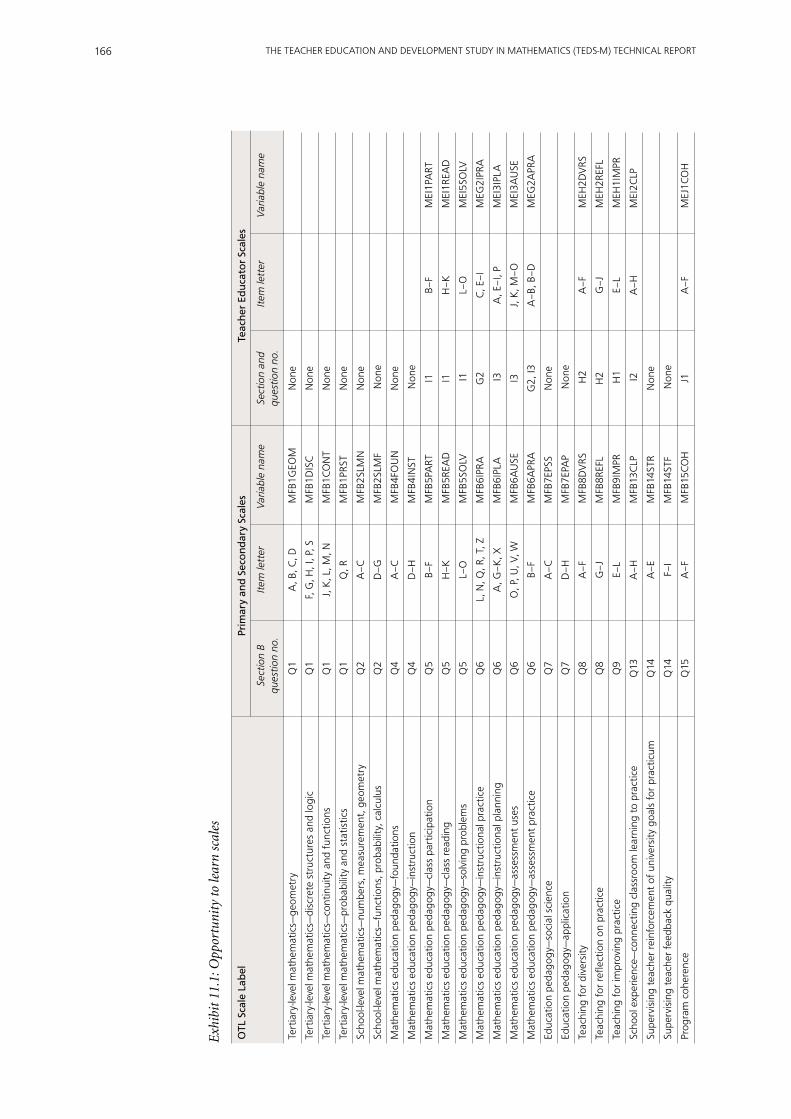
THE TEACHER EDUCATION AND DEVELOPMENT STUDY IN MATHEMATICS (TEDS-M) TECHNICAL REPORT166
Exh
ibit
11.
1: O
ppor
tuni
ty to
lear
n sc
ales
OTL
Sca
le L
abel
Pri
mar
y an
d S
eco
nd
ary
Scal
es
Te
ache
r Ed
ucat
or
Scal
es
Sect
ion
B Ite
m le
tter
Va
riabl
e na
me
Sect
ion
and
Ite
m le
tter
Va
riabl
e na
me
qu
estio
n no
.
qu
estio
n no
.
Tert
iary
-leve
l mat
hem
atic
s—ge
omet
ry
Q1
A, B
, C, D
M
FB1G
EOM
N
one
Tert
iary
-leve
l mat
hem
atic
s—di
scre
te s
truc
ture
s an
d lo
gic
Q1
F, G
, H, I
, P, S
M
FB1D
ISC
N
one
Tert
iary
-leve
l mat
hem
atic
s—co
ntin
uity
and
fun
ctio
ns
Q1
J, K
, L, M
, N
MFB
1CO
NT
Non
e
Tert
iary
-leve
l mat
hem
atic
s—pr
obab
ility
and
sta
tistic
s Q
1 Q
, R
MFB
1PRS
T N
one
Scho
ol-le
vel m
athe
mat
ics—
num
bers
, mea
sure
men
t, g
eom
etry
Q
2 A
–C
MFB
2SLM
N
Non
e
Scho
ol-le
vel m
athe
mat
ics—
func
tions
, pro
babi
lity,
cal
culu
s Q
2 D
–G
MFB
2SLM
F N
one
Mat
hem
atic
s ed
ucat
ion
peda
gogy
—fo
unda
tions
Q
4 A
–C
MFB
4FO
UN
N
one
Mat
hem
atic
s ed
ucat
ion
peda
gogy
—in
stru
ctio
n Q
4 D
–H
MFB
4IN
ST
Non
e
Mat
hem
atic
s ed
ucat
ion
peda
gogy
—cl
ass
part
icip
atio
n Q
5 B–
F M
FB5P
ART
I1
B–
F M
EI1P
ART
Mat
hem
atic
s ed
ucat
ion
peda
gogy
—cl
ass
read
ing
Q5
H–K
M
FB5R
EAD
I1
H
–K
MEI
1REA
D
Mat
hem
atic
s ed
ucat
ion
peda
gogy
—so
lvin
g pr
oble
ms
Q5
L–O
M
FB5S
OLV
I1
L–
O
MEI
5SO
LV
Mat
hem
atic
s ed
ucat
ion
peda
gogy
—in
stru
ctio
nal p
ract
ice
Q6
L,
N, Q
, R, T
, Z
MFB
6IPR
A
G2
C, E
–I
MEG
2IPR
A
Mat
hem
atic
s ed
ucat
ion
peda
gogy
—in
stru
ctio
nal p
lann
ing
Q6
A, G
–K, X
M
FB6I
PLA
I3
A
, E–I
, P
MEI
3IPL
A
Mat
hem
atic
s ed
ucat
ion
peda
gogy
—as
sess
men
t us
es
Q6
O, P
, U, V
, w
MFB
6AU
SE
I3
J, K
, M–O
M
EI3A
USE
Mat
hem
atic
s ed
ucat
ion
peda
gogy
—as
sess
men
t pr
actic
e Q
6 B–
F M
FB6A
PRA
G
2, I3
A
–B, B
–D
MEG
2APR
A
Educ
atio
n pe
dago
gy—
soci
al s
cien
ce
Q7
A–C
M
FB7E
PSS
Non
e
Educ
atio
n pe
dago
gy—
appl
icat
ion
Q7
D–H
M
FB7E
PAP
Non
e
Teac
hing
for
dive
rsity
Q
8 A
–F
MFB
8DV
RS
H2
A–F
M
EH2D
VRS
Teac
hing
for
refle
ctio
n on
pra
ctic
e Q
8 G
–J
MFB
8REF
L H
2 G
–J
MEH
2REF
L
Teac
hing
for
impr
ovin
g pr
actic
e Q
9 E–
L M
FB9I
MPR
H
1 E–
L M
EH1I
MPR
Scho
ol e
xper
ienc
e—co
nnec
ting
clas
sroo
m le
arni
ng to
pra
ctic
e Q
13
A–H
M
FB13
CLP
I2
A
–H
MEI
2CLP
Supe
rvis
ing
teac
her
rein
forc
emen
t of
uni
vers
ity g
oals
for
prac
ticum
Q
14
A–E
M
FB14
STR
Non
e
Supe
rvis
ing
teac
her
feed
back
qua
lity
Q14
F–
I M
FB14
STF
Non
e
Prog
ram
coh
eren
ce
Q15
A
–F
MFB
15CO
H
J1
A–F
M
EJ1C
OH

167SCALE DEVELOPMENT AND REPORTING
Exh
ibit
11.
2: B
elie
fs s
cale
s
Bel
iefs
Sca
le L
abel
Pri
mar
y an
d S
eco
nd
ary
Scal
es
Te
ache
r Ed
ucat
or
Scal
es
Sect
ion
and
Item
lett
er
Varia
ble
nam
e Se
ctio
n an
d
Item
lett
er
Varia
ble
nam
e
ques
tion
no.
ques
tion
no.
BELI
EFS
ABO
UT
THE
NA
TURE
OF
MA
THEM
ATI
CS
Rule
s an
d Pr
oced
ures
D
1 A
, B, E
, G, K
, L
MFD
1RU
LE
K1
A, B
, E, G
, K, L
M
EK1R
ULE
Proc
ess
of In
quiry
C, D
, F, H
, I, J
M
FD1P
ROC
C, D
, F, H
, I, J
M
EK1P
ROC
BELI
EFS
ABO
UT
LEA
RNIN
G M
ATH
EMA
TIC
S
Teac
her
Dire
ctio
n D
2 A
–F, I
, J
MFD
2TEA
C
K2
A–F
, I, J
M
EK2T
EAC
Act
ive
Lear
ning
G, H
, K–N
M
FD2A
CTV
G, H
, K–N
M
EK2A
CTV
BELI
EFS
ABO
UT
MA
THEM
ATI
CS
AC
HIE
VEM
ENT
Fixe
d A
bilit
y D
3 A
–H
MFD
3FIX
D
K3
A–H
M
EK3F
IXD
BELI
EFS
ABO
UT
THE
PRO
GRA
M A
S A
wH
OLE
Prep
ared
ness
for
Teac
hing
Mat
hem
atic
s D
4 A
–M
MFD
4PRE
P L1
A
–M
MEL
1PRE
P
Inst
ruct
iona
l Qua
lity
D5
A–F
M
FD5Q
UA
L N
one

THE TEACHER EDUCATION AND DEVELOPMENT STUDY IN MATHEMATICS (TEDS-M) TECHNICAL REPORT168
Using as their basis the outcomes of a series of confirmatory factor analyses, the TEDS-M
team used the Rasch model to scale the belief scales. They then rescaled the results so
that these centered at the point on the scale associated with the middle of the rating
scale (essentially “neutral”). All TEDS-M belief scales are based on a score scale where
10 is located at the neutral position. The same process used with the OTL scales (i.e.,
based on rating-scale items) was therefore used for the beliefs scales (see Exhibit 11.2).
The team employed a second procedure to allow for descriptive displays of the data.
When answering each belief-item statement in the TEDS-M instruments, respondents
were asked to choose from six response alternatives: “strongly disagree,” “disagree,”
“slightly disagree,” “slightly agree,” “agree,” and “strongly agree.” For descriptive display,
TEDS-M saw Responses 5 and 6 (agree and strongly agree) as endorsing the statement,
and Responses 1 through 4 (strongly disagree through slightly agree) as failing to endorse
the statement. For any group of respondents, the proportion of responses endorsing
the statements could then be presented as a measure of the group’s endorsement of
the belief. If 90 percent of responses fell into the agree and strongly agree categories,
the group responses indicated strong support for the belief; if only 10 or 20 percent of
responses fell into these categories, the belief was seen as receiving little support from
the group. Display of summary data in this form made explicit just how much the
TEDS-M countries and groups within these countries differed in the extent to which
they endorsed the beliefs measured.
The TEDS-M team developed the beliefs scales (see Exhibit 11.2) through exploratory
and confirmatory analyses and the scaling procedure described above. Appendices F,
G, and H show the international reliabilities for the future primary teachers’, future
lower-secondary teachers’, and educators’ beliefs scales. Appendix K includes the model
fit statistics by country.
The team used the item parameters calibrated from the future teachers as fixed parameters
from which to estimate the scale scores for the educators’ belief scales. This process
placed the OTL and beliefs scale scores from educators on the same scales as those
for future teachers, thereby facilitating comparative inferences. Appendix H provides
information about the fit between the OTL and beliefs measures and the educator
responses, as estimated by MPlus through a confirmatory factor analysis process.
11.4 Scaling Mathematics and Mathematics Pedagogy Content Knowledge and Determining Anchor Points
11.4.1 Measuring Mathematics Knowledge for Teaching
TEDS-M built on the Mathematics Teaching in the 21st Century (MT21) study
(Schmidt, Blömeke, & Tatto, 2011), which developed an earlier and shortened version
of a questionnaire designed to measure future lower-secondary teachers’ knowledge of
(1) mathematics, (2) mathematics pedagogy, and (3) general knowledge for teaching.
These instruments were trialed on a small-scale basis in six countries in 2005 (Bulgaria,
Chinese Taipei, Germany, Mexico, Republic of Korea, and the United States), with
promising results, and served to inform the instrument development in TEDS-M.
Lessons learned from MT21 led to the addition of a substantial number of mathematics
and mathematics pedagogy knowledge items to the TEDS-M questionnaire for future
lower-secondary teachers. These additions were necessary in order to sufficiently
test knowledge in these domains and to enable reporting by subscales. Similarly, and

169SCALE DEVELOPMENT AND REPORTING
because MT21 did not study future primary teachers, TEDS-M developed or adapted a
large number of items so that knowledge of these teachers could be sufficiently tested
and enable reporting by subscales in the relevant domains. The TEDS-M research team
developed some items and also solicited items from the Knowing Mathematics for
Teaching Algebra (KAT) project at Michigan State University (Michigan State University
Board of Trustees, 2006), the Learning Mathematics for Teaching (LMT) project at the
University of Michigan (Consortium for Policy Research in Education, 2006), from
researchers in ACER in Australia, and from the countries participating in TEDS-M.
Piloting of the items, which took place in June 2006, was followed by a field trial of the
assessment instruments for most of the participating countries during March and April
2007. Thus, many of the items used in the main study were subject to as many as five
rounds of international trialing in diverse countries.
At each stage of the item development process, expert panels examined the content
validity and appropriateness of the items. These reviews took into consideration clarity,
correctness, cultural relevance, classification within the framework of domains and
subdomains, relevance to teacher preparation, and curricular level. Scoring guides and
rubrics were prepared for all constructed-response items, and sample responses were
collected to provide a basis for training the scoring team in each country.
All these materials were thoroughly reviewed and revised when appropriate in close
collaboration with the NRCs. The scoring training sessions for NRCs were carried out
in preparation for the field trial and in preparation for the main study. Further details
on the methods design of the main study can be found in the TEDS-M conceptual
framework (Tatto et al., 2008).
11.4.2 Scale Development
As described earlier in this report, the TEDS-M surveys assessing mathematics content
knowledge (MCK) and mathematics pedagogical content knowledge (MPCK) used a
balanced-incomplete-block design so that the desired content could be well covered
but completed within a reasonable administration time. This design meant that each
respondent took only part of the full set of items. Because the set of items taken by
each respondent was not comparable, summing the scores on the items taken by each
person would not have yielded meaningful results. To obtain comparable estimates
of performance, the TEDS-M team used item response theory (IRT) in order to
obtain estimates of performance on the same scale even when the set of items taken
by each individual differed (see, for example, de Ayala, 2009, for a description of IRT
methodology).
The first step in the process for obtaining the reporting score scales involved calibrating
the test items and then evaluating the results to determine how well the IRT models fitted
the data. Items with poor fit and items that showed other violations of assumptions
of the models were carefully reviewed. Some of these items were removed from the
computation of the reported scores. Others required modifications to the scoring
procedures, such as combining score categories on items with multiple score points.
Appendices L and M provide a full record of the item modifications and deletions along
with the rationale for each decision.

THE TEACHER EDUCATION AND DEVELOPMENT STUDY IN MATHEMATICS (TEDS-M) TECHNICAL REPORT170
After completing this review and revision process, the team again calibrated the sets
of items using weights to ensure that each country made the same contribution to the
calibration. Details of this process follow.
11.4.2.1 Calibrations and weights
Item response models from the Rasch family were used to carry out calibration. In
order to fit the matrix of item scores, the TEDS-M team used the standard Rasch model
(Rasch, 1980) for the dichotomous items and the partial credit model (Masters, 1982)
for the polytomous items. They then analyzed both item types simultaneously using the
ACER Conquest software (Wu, Adams, Wilson, & Haldane, 2007).
At each stage of the calibrations, analyses were first conducted at ACER, and the results
sent to MSU. Although prior agreement had been reached about the details of the
calibrations (e.g., which items would be included and which excluded, how missing
data would be treated), the two centers conducted their analyses independently and
compared results. If results differed, the reasons were identified and the analyses
repeated until agreement was reached. Appendix N presents the control parameters for
calibration and case estimation for the MCK and MPCK items. Appendix O shows the
individual items that formed each of the knowledge scales.
The final calibration results were used to estimate the location of the examinees on a
common IRT scale for MCK and MPCK for the primary and lower-secondary levels
respectively. These results were then transformed to the reporting score scales. The IRT
scores were transformed so that the international mean for the calibration sample on
each of the MCK and MPCK scales was 500, and the international standard deviation
was 100.
11.4.2.2 Score generation
After calibration, the item parameter estimates were used to estimate achievement
for each respondent. In accordance with standard practice, items at the end of blocks
without responses were considered as “not reached.” These items were treated as
“missing” in the calibration, but were scored as “incorrect” during the estimation of
scores for individuals.
11.4.2.3 Standardization
Standardization was carried out using the data from the calibration. The achievement
estimates (in logits) were standardized to a mean of 500 and a standard deviation of 100,
with all countries weighted so that they would contribute equally to the standardization
sample. This process was repeated for each of the four key measures: MCK (primary),
MCK (lower secondary), MPCK (primary), and MPCK (lower secondary).
Once standardization was completed, the TEDS-M team computed scores for all
respondents for whom MCK and MPCK estimates could be obtained, including those
not included in the standardization sample. The mean of 500 and the standard deviation
of 100 applied to the calibration sample rather than to the complete set of scores.
11.4.3 TEDS-M Test Reliabilities
Appendix P shows the reliabilities for the MCK and the MPCK tests for the primary and
the lower-secondary international samples. Note that the reliability estimates vary from
0.66 to 0.91. These differences occurred because reliability is a sample-specific statistic.
Reliability will be high if there is considerable variation in the sample relative to the size

171SCALE DEVELOPMENT AND REPORTING
of the standard error, as was the case for the TEDS-M international (total) sample. The reliability will be low if one of the following occurs:
• Thereisasmallstandarddeviationofthesample;or
• Ifthereisalargestandarderror(e.g.,thetestistooeasyforsomeoftherespondents,which means the test did not serve as a good measure).
The standard error is a much better indicator of the precision of measurement because it isnot influencedbythestandarddeviationofthesample(smallerstandarderrorsare preferable to larger standard errors). In TEDS-M, the MCK standard errors were much smaller than the MPCK standard errors because of the difference in the number of items used for these respective areas of the survey instruments.
The following formula was used to compute the reliability of the individual scores:
rθθ = s2
–s2θθ ˆ
s2 θ ˆ
.
Here, s2 θ ˆ is the variance of the estimated IRT estimates for the sample being considered,
and s2θ is the mean variance of error for estimating the IRT score for the persons in the
sample. The standard error is computed by taking the square root of s2θ .
Two matters need to be considered when interpreting these reliabilities. First, they are estimates of the reliability of individual scores. However, individual scores are always more variable than group scores, which are at the heart of the TEDS-M conceptual framework. The recommended unit of analysis was a group-level unit, primarily based on the level at which future teachers were being prepared to teach. Because group scores are more consistent and stable, their reliabilities will be significantly higher. Although there are many guidelines on this matter throughout the research literature, most researchers and commentators consider internal-consistency estimates of reliability at or above 0.70 to be adequate for research purposes, whereas reliabilities of 0.90 or higher are desired for making individual-level decisions.
11.4.4 Methods Used to Determine MCK and MPCK Anchor Points
11.4.4.1 Developing the anchor points
TEDS-M also used the calibration results to identify anchor points for the score scales. Anchor points are specific values on a score scale that tie into descriptions of what respondents at those points know and can do. TEDS-M identified two sets of test items that could support the development of descriptions of the skills and knowledge at each of the anchor points. The first set included those items that a person at that anchor point on the scale score would be able, according to the IRT model, to answer correctly with a probability of 0.70 or greater. The other set included those items that a person at that anchor point on the scale score would be able, based on the IRT model, to answer correctly with a probability of 0.50 or less.
The anchor points selected were those that would provide a sufficient number of items (between 10 and 12) of each type and so enable development of a description of the skills and knowledge of a person at that anchor point. Given these requirements, TEDS-M identified two anchor points for the MCK scales for the primary and lower-secondary levels. Anchor Point 1 represented a lower level of performance, and Anchor Point 2 represented a higher level. Only one anchor point was selected for the MPCK scales because there were fewer items measuring MPCK than MCK (see Chapter 3 of
this report).

THE TEACHER EDUCATION AND DEVELOPMENT STUDY IN MATHEMATICS (TEDS-M) TECHNICAL REPORT172
For each of the anchor points, a panel of experts conducted detailed analyses of the
two sets of items so that descriptions of the capabilities of persons near each point
on the scale could be developed. These descriptions were produced by committees
of mathematicians and mathematics educators who participated in workshops set
up specifically for this task (see the appendix to the TEDS-M international report;
Tatto et al., 2012). The resulting anchor point descriptions, provided in Appendix Q,
give tangible meaning to the points on the reporting score scales. Chapter 5 of the
TEDS-M final report (Tatto et al., 2012) includes the graphics depicting the results of
the knowledge tests by program-type grouping. Box plots and horizontal lines show the
locations of the anchor points.
11.4.4.2 Conversion to standard score scales
The mean and standard deviation (SD) for primary MCK were 0.01 and 1.18, respectively,
on the logit scale from ConQuest. The corresponding primary MCK scale scores for
anchor points -0.8 and 0.2 on the scale used for reporting the international results were
431 and 516 respectively. The mean and SD for primary MPCK were -0.07 and 1.07 on
the ConQuest logit scale. For anchor point 0.4, the corresponding scale score was 544.
For lower-secondary MCK, the mean and SD were -0.01 and 1.02 on the ConQuest logit
scale. The corresponding scale scores for -0.2 and 0.5 were 490 and 559 respectively. The
mean and SD for lower-secondary MPCK were -0.11 and 1.16 on the ConQuest logit
scale. The corresponding scale score for 0.0 was 509 on the reporting score scale.
11.4.5 Reporting Knowledge Scales
Although the MCK measures differed for future primary and future lower-secondary
teachers, and were different from the MPCK measures, all measures were standardized
in the same way. Readers unfamiliar with the details may therefore see these measures
as comparable, but they are not. In order to avoid the possibility of confusion, these
measures were reported separately in the TEDS-M international report (Tatto et al.,
2012), and effort was made to ensure that none of the charts presented lined up primary
against lower secondary, or MCK against MPCK.
11.4.5.1 Country comparisons
TEDS-M acknowledges that “teacher education is understood and structured differently
across national settings and even between institutions in the same country” (Tatto et
al., 2008, p. 17). The initial chapters of this report detail the many ways in which the
structure of teacher education programs differed across the 17 countries participating
in TEDS-M. As such, the teaching roles for which the two populations of future teachers
(primary and lower secondary) were being prepared differed substantially.
Among those future teachers who would qualify to teach at the primary level, for
example, most would qualify to become generalist teachers across all primary levels,
which, depending on the country, may have been Grades 6, 7, or 8. Some would become
generalist primary teachers qualified to teach classes no higher than Grade 4. Others
would qualify to become specialist teachers of mathematics throughout primary school
and, in some cases, on into secondary school. Similarly, among those qualifying to teach
mathematics in the lower-secondary school, some would be qualified to teach only up
to Grade 8, while others would become mathematics specialists qualified to teach to
Grade 12 and beyond.

173SCALE DEVELOPMENT AND REPORTING
In other IEA studies, such as the Trends in International Mathematics and Science Study
(TIMSS), the population definitions yield a more consistent pattern of participants
across countries. In TIMSS, the two populations of interest (fourth- and eighth-grade
students) have a high degree of commonality across countries. The samples chosen at
each of these levels differ very little across countries with respect to their average age2
and their years of schooling at the time of testing. It makes sense, therefore, for those
reporting TIMSS results to compare whole countries.
While it is equally possible to provide comparisons of countries in TEDS-M, the intent
of the study has always been to conduct country comparisons only within program-
groups, even though, in some cases (e.g., Chinese Taipei and the Russian Federation),
there was only one program-type at each of the primary and secondary levels. TEDS-M
also has not favored whole-country comparisons because such comparisons typically
compare like with unlike. Presentation of TEDS-M results is therefore directed, to the
greatest extent possible, at comparing like with like: in this case, teachers who are being
prepared to undertake similar roles once they are qualified.
11.4.5.2 Program-groupings
The programs that future teachers undertake can be grouped according to the level
at which these individuals will qualify to teach, and the degree of specialization in
the teaching role that they qualify to undertake. Appendices R and S show how these
program-groups differ from one country to another. In TEDS-M, four program-
groups could be readily identified at the primary level, and two readily identified at the
secondary level:
• Future primary teachers
1. Generalists, no higher than Grade 4
2. Generalists, no higher than Grade 6
3. Generalists, no higher than Grade 10
4. Mathematics specialists.
• Future secondary teachers
5. Lower secondary, no higher than Grade 10
6. Lower and upper secondary, above Grade 10.
These grouping were used as the basis for reporting the MCK and MPCK score
summaries.
References
Consortium for Policy Research in Education (CPRE). (2006). Learning mathematics for teaching
(LMT). Ann Arbor, MI: School of Education, University of Michigan. (Measures development
supported by NSF grants REC-9979873, REC-0207649, EHR-0233456, & EHR 0335411)
de Ayala, R. J. (2009). The theory and practice of item response theory. New York, NY: Guilford
Press.
Ingvarson, L., Beavis, A., Danielson, C., Ellis, L., & Elliott, A. (2005). An evaluation of the Bachelor of
Learning Management at Central Queensland University. Canberra, ACT: Australian Government
Department of Education, Science, and Technology.
2 This is because of the way TIMSS defines grade level.

THE TEACHER EDUCATION AND DEVELOPMENT STUDY IN MATHEMATICS (TEDS-M) TECHNICAL REPORT174
Ingvarson, L., Beavis, A., & Kleinhenz, E. (2007). Factors affecting the impact of teacher education
courses on teacher preparedness: Implications for accreditation policy. European Journal of Teacher
Education, 30(4), 351–381.
Linacre, J. M. (2010). Winsteps (Version 3.70.02) [Computer software]. Chicago, IL: Winsteps.
com.
Masters, G. (1982). A Rasch model for partial credit scoring. Psychometrika, 47(2), 149–174.
Meyer, J. P. (2011). jMetrik (Version 2.1) [Computer software]. Charlottesville, VA: University of
Virginia. Retrieved from http://www.itemanalysis.com
Michigan State University Board of Trustees. (2006). Knowledge of algebra for teaching (KAT). East
Lansing, MI: Author. (Measures development supported by NSF Grant REC-0337595) Retrieved
from http://www.educ.msu.edu/kat/
Muthén, L. K., & Muthén, B. O. (1998). MPlus user’s guide. Los Angeles, CA: Muthén & Muthén.
Rasch, G. (1980). Probabilistic models for some intelligence and attainment tests. Chicago, IL:
University of Chicago Press (originally published 1960).
Schmidt, W., Blömeke, S., & Tatto, M. T. (2011). Teacher education matters: A study of middle school
mathematics teacher preparation in six countries. New York, NY: Teachers College Press.
Tatto, M. T. (1996). Examining values and beliefs about teaching diverse students: Understanding
the challenges for teacher education. Educational Evaluation and Policy Analysis, 18(2), 155–180.
Tatto, M. T. (1998). The influence of teacher education on teachers’ beliefs about purposes of
education, roles, and practice. Journal of Teacher Education, 49(1), 66–77.
Tatto,M.T.(1999).Thesocializinginfluenceofnormativecohesiveteachereducationonteachers’
beliefs about instructional choice. Teachers and Teaching, 5(1), 111–134.
Tatto, M. T., Schwille, J., Senk, S., Ingvarson, L., Peck, R., & Rowley, G. (2008). Teacher Education
and Development Study in Mathematics (TEDS-M): Conceptual framework. Amsterdam, the
Netherlands: International Association for the Evaluation of Educational Achievement (IEA).
Tatto, M. T., Schwille, J., Senk, S. L., Ingvarson, L., Rowley, G., Peck, R., Bankov, K., Rodríguez, M.,
& Reckase, M. (2012). Policy, practice, and readiness to teach primary and secondary mathematics
in 17 countries: Findings from the IEA Teacher Education and Development Study in Mathematics
(TEDS-M). Amsterdam, the Netherlands: International Association for the Evaluation of
Educational Achievement (IEA).
Wu, M., Adams, R., Wilson, M., & Haldane, S. (2007). ACER Conquest: Generalised item response
modelling software (Version 2.0) [Computer software]. Melbourne, VIC, Australia: Australian
Council for Educational Research (ACER).

175
appendices

THE TEACHER EDUCATION AND DEVELOPMENT STUDY IN MATHEMATICS (TEDS-M) TECHNICAL REPORT176

177APPENDICES
APPENDIx A: TEDS-M 2008 Route Questionnaire
Identification Label
IEA – Teacher Education Study in Mathematics (TEDS-M)
TEDS-M 2008ROUTE
QUESTIONNAIRE
<TEDS-M National Research Center Name><Address>
TEDS-M Route Questionnaire
International Association for the Evaluation of Educational Achievement Page 1 ©Copyright IEA, 2008

THE TEACHER EDUCATION AND DEVELOPMENT STUDY IN MATHEMATICS (TEDS-M) TECHNICAL REPORT178
TEDS-M Route Questionnaire
TEDS-M is a study of the routes of mathematics teacher education. By “route” we mean the sequence of opportunities, programs, examinations, etc which lead future teachers from the end of secondary school to being considered fully qualified to teach in primary or lower-secondary school. We identify routes in order to be clear on how they differ in major respects, such as the entry requirements, the structure, the curriculum, the capabilities and backgrounds of their students, the hurdles over which these students must pass and finally of course the different grade levels and types of schools for which each route prepares graduates.
One reason we have to be clear about the routes in each country is that this is essential to comparability of analyses. In comparing routes across countries, we have to be able to distinguish easily, for example, between routes in which formal teacher education follows the completion of a university degree (known as consecutive routes) and routes in which formal teacher education and subject preparation are combined into a single program (concurrent routes).
If you need further clarification on any aspect of this questionnaire before completing it, please send your questions of clarification by email to [email protected].
Country
Person responsible
for preparing this response:
Contact email:
Contact telephone:
Contact fax:
Sources used in answering questionnaire (check all that apply):
Official documents
Research documents
Other documents
Focus groups
Interviews
Firsthand knowledge of person preparing response
Other (please specify)
International Association for the Evaluation of Educational Achievement Page 2 ©Copyright IEA, 2008

179APPENDICES
Special questions and instructions for federalized countries where teacher education policy is set more at the <state/province> level than at the national level: For such countries there are three options for responding to questions in this questionnaire for which there is no appropriate answer at the national level:
• Option1(preferred)—answerquestionsintermsofwhatistypicallythecaseatthe<state/province>level
• Option2—whenitdoesnotmakesensetoanswerintermsofthetypicalcase,answerthequestiontwice,illustratingthecaseofthetwo<states/provinces>whichdifferthemostwithrespecttothequestion being asked.
• Option3—whenthereisnoappropriateanswerateithernationalor<state/province>level,simplywrite on the questionnaire “no policy at state or national level”.
To make sure we are clear about this, please record below the question number for each of the questions in which one of these options was used:
• Option1wasusedinQuestions
• Option2wasusedinQuestions
• Option3wasusedinQuestions
InternationalAssociationfortheEvaluationofEducationalAchievement Page3©Copyright IEA, 2008

THE TEACHER EDUCATION AND DEVELOPMENT STUDY IN MATHEMATICS (TEDS-M) TECHNICAL REPORT180
SECTION ONE—LEGISLATIVE/REGULATORY FRAMEWORKS
1. Inyourcountry,istherealegislative/regulatoryframeworkorframeworkstosetrequirementsthatteacher-preparation programs must meet in order for their graduates to be recognized as qualified for employment as teachers?
Yes
No
If no, skip to Question 6
2. Isthelegislative/regulatoryframeworksetby
The national government?
State or provincial governments?
Bothnationalandstate/provincial?
Other, please describe:
3. Ifpossible,pleaseprovideawebaddressoraddressesfornational-levelinformationonthislegislative/regulatoryframework,oracopyofanyrelevantdocumentationaboutthelegislative/regulatorypolicyframework.
4. Doanyofthelegislative/regulatoryframeworksthatgovernteacherpreparationinyourcountrysetrequirements about the content that students must be taught in their teacher preparation programs?
Yes
No
5. Is there a national written set or sets of competencies or standards that teacher education routes or programs are required to develop in their graduates? (If so, please provide a full reference in the following space and attach a copy.)
Yes
No
Reference:
International Association for the Evaluation of Educational Achievement Page 4 ©Copyright IEA, 2008

181APPENDICES
International Association for the Evaluation of Educational Achievement Page 5 ©Copyright IEA, 2008
SECTION TWO—OVERALL STATISTICS FOR USE IN CALCULATING THE RELATIVE SIZE OF EACH ROUTE
6. What is the total number of ISCED 1 primary school teachers in your country (public and private schools)?
7. What is the highest grade level included in this statistic?
Lowest grade level?
8. What is the total number of ISCED 2 secondary school teachers in your country (public and private schools)?
9. What is the highest grade level included in this statistic?
Lowest grade level?
10. Give the source of these statistics:
11. Attach a listing breaking these numbers of primary and secondary school teachers down by grade level if available.

THE TEACHER EDUCATION AND DEVELOPMENT STUDY IN MATHEMATICS (TEDS-M) TECHNICAL REPORT182
SECTION THREE—ROUTE BY ROUTE DATA
For countries which have more than one route, a SECTION THREE response is required for each route to be studied in TEDS-M (i.e., the selection of routes based on the Frame Questionnaire as agreed upon by the NRC, the TEDS-M sampling reference, and the DPC).
12. TEDS-M route ID
13. Nameofroute
14. Country
Type of Route
Of the following three boxes, answer only the one that is most applicable to this route. These boxes differentiate among three types of routes: concurrent, consecutive, and primarily practice (apprenticeship). These questions expand upon the frame questionnaire in order to document more clearly and adequately the characteristics of each route selected for study.
International Association for the Evaluation of Educational Achievement Page 4 ©Copyright IEA, 2008
Concurrent route: A concurrent route may have one or two phases as follows: If the first phase of a route consists of a single program that includes studies in the subjects future teachers will be teaching (academic studies), studies of pedagogy and education (professional studies) and practical experience in the classroom, the route is indeed a concurrent route. The second phase, if it exists, consistsofon-the-jobprobationaryexperience,requiredfor<certification/licensure/registration>,butnot under the control of the first phase institution.
15. Is this route a concurrent route? yes no
If no, skip to Question 35.
First phase of concurrent route
16. If yes, how long do students following the recommended schedule typically take to complete this first phase of the concurrent route?
months (do not count breaks or vacations of one month or more)
17. By what name is this first phase generally known in your country? (Give national terminology and English translation.)
18. What are the institution(s) in which this first phase takes place called? (Give national terminology and English translation.)
19. In the latest year for which figures are available, how many institutions offered the first phase of this route?
20. Source of data for this response:

183APPENDICES
International Association for the Evaluation of Educational Achievement Page 5 ©Copyright IEA, 2008
21. Whatistheminimalcredential/qualificationnormallyrequiredforentryintothisroute?
Completionof<lower-secondary>school
Completionof<upper-secondary>school
Completion of post-secondary, non-tertiary school
Completionofhigher-educationdegree<ISCED5>
Completionofhigher-educationdegree<ISCED6>
Completionofadegree<ISCED7>
Other (please specify)
22. In terms of their prior academic achievement, students entering the first phase of this route would typically be drawn from:
Very high achievers (e.g. the top 10 percent of their age group)
High achievers (e.g. the top 20 percent of their age group)
Above-average achievers (for their age group)
Average achievers (for their age group)
Average and below-average achievers (for their age group)
Below-average achievers (for their age group)
Other (please explain)
23. Isthecredential/qualificationrequiredforentryintothisroutedeterminedby(checkallthatapply):
Anationallegislative/regulatoryframework?
A state, provincial, or regional regulatory framework?
The requirements set by employers or professional organizations?
Teacher-preparation institutions, by mutual agreement?
Teacher-preparation institutions, acting individually?
24. Whatnationalorregionalexternalexamination(s),ifany,is/aretakenduring or at the end of this first phase? (Use national terminology with brief description of what is being tested and how the results are used.)
25. Whatcredential/qualificationisearnedattheendofthisfirstphase?(GiveISCEDlevel,nationalterminology, and English translation.)
26. What national documents (if any) set standards and requirements for the curriculum content of this route? (Give national title, English translation, and brief description of what the document contains.)
27. Further clarification or explanation if needed:

THE TEACHER EDUCATION AND DEVELOPMENT STUDY IN MATHEMATICS (TEDS-M) TECHNICAL REPORT184
Second phase of concurrent route—an on-the-job phase
28. Is there a second phase of on-the-job probationary experience, not under the control of the first phase institution, but required to be certified as fully qualified? yes no
If no, skip to Question 73.
29. By what name is this second phase generally known in your country? (give national terminology and English translation)
30. Howlongisthisfinalon-the-jobphase? months (do not count breaks or vacations of one month or more)
31.Isthereanytraininginstitution(otherthantheelementaryorsecondaryschoolinwhichtheon-the-job phase takes place) which is responsible for supporting future teacher learning during this phase? yes no
If no, skip to Question 33.
32. Ifyes,whatisthenameofthissupportinstitution?(GivenationalterminologyandEnglishtranslation.)
33. Whatnationalorregionalexternalexamination(s),ifany,is/aretakenduringorattheendofthissecond phase? (Use national terminology with brief description of what is being tested and how the results are used.)
34.Whatcredential/qualificationisearnedattheendofthissecondphase?(Give ISCED level, national terminology, and English translation.)
Skip to Question 73.
International Association for the Evaluation of Educational Achievement Page 6 ©Copyright IEA, 2008

185APPENDICES
International Association for the Evaluation of Educational Achievement Page 7 ©Copyright IEA, 2008
Consecutive route: A consecutive route may have two or three phases as follows: If the route consists of a first phase for academic studies (leading to a degree or diploma), followed by a second phaseofprofessionalstudiesandpracticalexperience(leadingtoaseparatecredential/qualification),the route is indeed a consecutive route. The third phase, if it exists, consists of on-the-job probationaryexperience,requiredfor<certification/licensure/registration>,butnotunderthecontrolof the second phase institution.
35. Isthisrouteaconsecutive route? yes no
If no, skip to Question 35.
First phase of consecutive route
36. Ifyes,howlongdostudentsfollowingtherecommendedscheduletypicallytaketocompletethefirst phase of academic studies? months (do not count breaks or vacations of one month or more)
37. Bywhatnameisthisfirstphasegenerallyknowninyourcountry? (Give national terminology and English translation.)
38. Whataretheinstitution(s)inwhichthisfirstphasetakesplacecalled?(Givenationalterminologyand English translation.)
39. Inthelatestyearforwhichfiguresareavailable,howmanyinstitutionsofferedthefirstphaseofthis route?
40. Source of data for this response:
41. Whatistheminimalcredential/qualificationnormallyrequiredforentryintothisroute?
Completionof<lower-secondary>school
Completionof<upper-secondary>school
Completion of post-secondary, non-tertiary school
Completionofhigher-educationdegree<ISCED5>
Completionofhigher-educationdegree<ISCED6>
Completionofadegree<ISCED7>
Other (please specify)
42.Whatnationalorregionalexternalexamination(s),ifany,is/aretakenduringorattheendofthisfirst phase? (Use national terminology with brief description of what is being tested and how the results are used.)
43. Whatcredential/qualificationisearnedattheendofthisfirstphase?(GiveISCEDlevel,nationalterminology, and English translation.)

THE TEACHER EDUCATION AND DEVELOPMENT STUDY IN MATHEMATICS (TEDS-M) TECHNICAL REPORT186
International Association for the Evaluation of Educational Achievement Page 8 ©Copyright IEA, 2008
44. Further clarification or explanation if needed:
Second phase of consecutive route
45. How long do students following the recommended schedule typically take to complete the second phase of professional studies and practical experience? months (do not count breaks or vacations of one month or more)
46. What are the institution(s) in which this second phase takes place called? (Give national terminology and English translation.)
47. In the latest year for which figures are available, how many institutions offered the second phase of this route?
48. Source of data for this response:
49. Is the second phase of the route (professional studies, including practical experience) normally done in the same institution as the first phase (subject preparation or studies in disciplines other than education)?
Always in the same institution
Sometimes in the same institution, sometimes in other institutions
Never in the same institution
50. Whatnationalorregionalexternalexamination(s),ifany,is/aretakenduringorattheendofthissecond phase? (Use national terminology with brief description of what is being tested and how the results are used.)
51. Whatcredential/qualificationisearnedattheendofthesecondphase?(GiveISCEDlevel,national terminology and English translation.)
52. In terms of their prior academic achievement, students entering the second phase of this
route would typically be drawn from:
Very high achievers (e.g., the top 10 percent of their age group)
High achievers (e.g., the top 20 percent of their age group)
Above-average achievers (for their age group)
Average achievers (for their age group)
Average and below-average achievers (for their age group)
Below-average achievers (for their age group)
Other (please explain) _________________________________

187APPENDICES
53. Isthequalificationrequiredforentryintothesecondphaseofthisroutedeterminedby:
A national regulatory framework?
A state, provincial, or regional regulatory framework?
The requirements set by employers or professional organizations?
Teacher-preparation institutions, by mutual agreement?
Teacher-preparation institutions, acting individually?
54. What national documents (if any) set standards and requirements for the curriculum content of this route (give national title, English translation, and brief description of what the document contains.
55. Further clarification or explanation if needed:
Third phase of consecutive route—an on-the-job phase
56. Is there a third phase of on-the-job probationary experience, not under the control of the first or second phase institution, but required to be certified as fully qualified? yes no
If no, skip to Question 73.
57. How long is this third on-the-job phase? months (do not count breaks or vacations of one month or more)
58. Is there any training institution (other than the elementary or secondary school in which the on-the-job phase takes place) which is responsible for supporting future teacher learning during this phase? yes no
59. If yes, what is the name of the support institution? (Give national terminology and English translation.)
60. Whatnationalorregionalexternalexamination(s),ifany,is/aretakenduringorattheendofthisthird phase? (Use national terminology with brief description of what is being tested and how the results are used.)
International Association for the Evaluation of Educational Achievement Page 9 ©Copyright IEA, 2008

THE TEACHER EDUCATION AND DEVELOPMENT STUDY IN MATHEMATICS (TEDS-M) TECHNICAL REPORT188
International Association for the Evaluation of Educational Achievement Page 8 ©Copyright IEA, 2008
61. Whatcredential/qualificationisearnedattheendofthisthirdphase?(GiveISCEDlevel,nationalterminology, and English translation.)
Skip to Question 73.
Primarily practice (apprenticeship) route: If the route consists predominantly of school-based experience with other institutions playing only a minor, marginal, or supporting role, the route is a primarily practice or apprenticeship route.
62. Is this route a primarily practice (apprenticeship) route? yes no
If no, skip to Question 73.
63. Ifyes,howlongdotraineesfollowingtherecommendedscheduletypicallytaketocompletethisroute? months (do not count breaks or vacations of one month or more)
64. Whatistheminimalcredential/qualificationnormallyrequiredforentryintothisroute?
Completionof<lower-secondary>school
Completionof<upper-secondary>school
Completion of post-secondary, non-tertiary school
Completionofhigher-educationdegree<ISCED5>
Completionofhigher-educationdegree<ISCED6>
Completionofadegree<ISCED7>
Other (please specify)
65. In terms of their prior academic achievement, students entering this route would typically be drawn from:
Very high achievers (e.g., the top 10 percent of their age group)
High achievers (e.g., the top 20 percent of their age group)
Above-average achievers (for their age group)
Average achievers (for their age group)
Average and below-average achievers (for their age group)
Below-average achievers (for their age group)
Other (please explain)
66. Is the qualification required for entry into this route determined by (check as many as apply):
A national regulatory framework?
A state, provincial, or regional regulatory framework?
The requirements set by employers or professional organizations?
Teacher-preparation institutions, by mutual agreement?
Teacher-preparation institutions, acting individually?
67. Is there any training institution (other than the elementary or secondary school in which the on-the-job phase takes place) which is responsible for supporting future teacher learning during this route? yes no
68. If yes, what is the name of the responsible institution (give national terminology and English translation)

189APPENDICES
International Association for the Evaluation of Educational Achievement Page 9 ©Copyright IEA, 2008
69. Whatnationalorregionalexternalexamination(s),ifany,is/aretakenduringorattheendofthisroute? (Use national terminology with brief description of what is being tested and how the results are used.)
70. Whatcredential/qualificationisearnedattheendofthisroute?(GiveISCEDlevel,nationalterminology, and English translation.)
71. What national documents (if any) set standards and requirements for the curriculum content of this route? (Give national title, English translation, and brief description of what the document contains.)
72. Further clarification or explanation if needed:
Continue with Question 73.
73. Ifyouthinkthattheaboveboxesmisrepresentthisroute,pleaseexplainasclearlyaspossiblehow it differs from concurrent, consecutive, and apprenticeship programs as characterized above. Otherwise, leave blank.

THE TEACHER EDUCATION AND DEVELOPMENT STUDY IN MATHEMATICS (TEDS-M) TECHNICAL REPORT190
International Association for the Evaluation of Educational Achievement Page 10 ©Copyright IEA, 2008
74. Which of the following needs for teachers is this route especially designed to address? (Check all that apply.)
General shortage of teachers
Shortage of sufficiently competent teachers
Shortage of mathematics teachers
Shortage of teachers in schools with the most challenging conditions
Shortage of female teachers
Shortage of male teachers
Shortage of teachers from underrepresented ethnic, religious, or regional groups
Other (please specify)
None of the above
75. This route can be undertaken by:
Full-time students only
Part-time students only
Full-time or part-time students
The answer differs by phase (please explain)
76. If the route is available to part-time students, what percent would you estimate of the cohort beginning in year 2005 was enrolled part-time?
%
data not available
77. Is entry to this route restricted to certain types of high schools or tracks within high school? yes no
If yes, specify school types and tracks (English and non-English terms).
78. How many fields are graduates of this route normally qualified to teach?
(By“field”wemeanthefollowingsixgroupingsofschoolsubjects:(1)mathematics,(2)science,(3)official language of the country, including literature, (4) foreign or second languages, (5) social studies, (6) other (art, music, physical education, vocational training, etc.)
Only one
Two
More than two
Varies (no clear national policy)
Other Characteristics of the Route

191APPENDICES
International Association for the Evaluation of Educational Achievement Page 11 ©Copyright IEA, 2008
79. Selection criteria: How much importance, if any, does national policy give to each of the following criteria for selection to and within this route? If selection decisions are made at more than one point in the route, base your judgment on the overall importance of the criterion within the route.
Check one box in each row.
Not Not very Quite Very considered important important important
A. The candidates’ overall level of attainment in their final year of secondary schooling
B. The candidates’ performance on a national tertiary education entrance examination
C. The candidates’ performance in an examination specifically for admission to this training institution
D. Interviews (e.g., about their reasons for wishing to become teachers, etc.)
E. Excellence in mathematics at a level set by this institution
F. Performance on tests of teaching competencies
G. Previous work experience; please describe below
H. Gender (if so, please describe below)
I. Other groups believed to be under-represented in the teaching profession (if so, please describe below)
J. The order in which the candidates apply
K. Their region of residence
L. The age of the candidates
M. Other criteria; please describe below
Additional information on selection:

THE TEACHER EDUCATION AND DEVELOPMENT STUDY IN MATHEMATICS (TEDS-M) TECHNICAL REPORT192
International Association for the Evaluation of Educational Achievement Page 12©Copyright IEA, 2008
80. In selecting students for this route, do you make a special effort to include students who are already in the full-time workforce but are preparing to make a career change?
Yes
No
81. What percent of your national 2005 intake to this route were students who had already been in the full-time workforce and were preparing to make a career change?
%
data not available
82. Content of route: In the documentation containing national policy for this route, how much weight is given to each of the listed goals? (If the program prepares subject-matter specialists, answer in terms of persons preparing to be mathematics teachers.) Also answer in terms of what happens in the route as a whole, not on what happens in just one phase (e.g., in a consecutive route, mathematics content may be given major weight even though it is not addressed at all in the second-phase institution).
Check one box in each row.
Program Goals Little or Some Moderate Major
no weight weight weight weight
Curriculum content knowledge
A. Study of the curriculum content to be taught in schools
B. Study of the mathematics content in the school curriculum
C. Study of mathematics at tertiary level
D. Study of other disciplines at tertiary level
Pedagogical content knowledge
E. Studyofpedagogy/teachingmethodsspecific to the teaching of mathematics
F. Strategies for teaching particular topics in mathematics
G. Knowledge about students learning in mathematics
H. Knowing common misunderstandings in mathematics
I. Knowing how to build on students’ prior knowledge in mathematics

193APPENDICES
InternationalAssociationfortheEvaluationofEducationalAchievement Page13©Copyright IEA, 2008
Check one box in each row.
Program Goals Little or Some Moderate Major
no weight weight weight weight
General pedagogy/educational foundations
J. Learning classroom management skills
K. Managing disruptive students
L. Planning lessons based on recommended pedagogical principles
Assessing learning
M. Knowing how to develop good assessment tools
N. Using formative assessment to plan learning activities
O. Conducting fair and valid summative assessments of student learning
P. Using data from externally-conducted tests to judge the effectiveness of teaching
Knowledge of students and diversity
Q. Studyofchilddevelopment
R. Strategies for teaching students from varied cultural backgrounds
S. Strategies for teaching students with behavioral problems
T. Strategies for teaching students who have learning disabilities
U. Strategies for teaching exceptionally gifted students
V. Strategies for teaching groups of students who are extremely diverse in abilities and interests
Preparation for further development as a teacher
W. Developing the ability to do teacher action research
X. Learning to reflect on one’s own learning and teaching practices
Y. Learning to improve one’s own teaching by working with other teachers

THE TEACHER EDUCATION AND DEVELOPMENT STUDY IN MATHEMATICS (TEDS-M) TECHNICAL REPORT194
International Association for the Evaluation of Educational Achievement Page 14©Copyright IEA, 2008
Program Goals
Little or Some Moderate Major no weight weight weight weight
Understanding the school environment
Z. Study of the context and type of community in which future teachers are likely to teach
AA. Learning to adjust to schools as they really are
AB. Becoming a change agent in the educational system
AC. Knowledge of the school system in a particular nation/state/district
AD. Knowledgeoflegalandprofessionalstandards/ requirements for teachers
Further clarification or explanation if needed:
Check one box in each row.

195APPENDICES
International Association for the Evaluation of Educational Achievement Page 15 ©Copyright IEA, 2008
83. Whichnationalrequirementsdostudentsneedtomeetatleastonceduringthisroute?
(Check all that apply.)
Pass each of the required subjects
Passacomprehensivewrittenexamination/assessment
Passacomprehensiveoralexamination/assessment
Passanexaminationsetbynationalorstate/provincialauthorities
Pass a portfolio required by the institution (not just by individual instructors)
Pass an examination set by one of the institutions in the route
Successfully demonstrate a required level of teaching competence in a classroom
Write and defend a thesis
Others (please specify below)
None of the above
Further clarification or explanation if needed:
84. Field experience and practicum: Practical experience refers to future teachers’ field experience in school settings during their teacher education program. This experience may take many forms and include a range of activities. In TEDS-M, the term practicum is used solely for classroom-based practical experience during the final year of one of the phases in a route.
Please use the following table for all field experience prescribed by national policy, including but not limited to the final year practicum. Indicate, according to national policy, at what times and for how many days future teachers in this route are assigned to school settings (assuming normal progress).
Notprescribedorrecommendedbynationalpolicyinthisdetail—Skip to Question 85.
Fill in the following table for all phases of this route. If the route runs for a more limited number of years, simply leave the remaining cells in the table blank. Conversely, if the route runs for more than five years, add cells to the table as needed.
Year 1 Year 2 Year 3 Year 4 Year 5
Semester 1 2 1 2 1 2 1 2 1 2
Number of days in school setting
Further clarification or explanation if needed:

THE TEACHER EDUCATION AND DEVELOPMENT STUDY IN MATHEMATICS (TEDS-M) TECHNICAL REPORT196
International Association for the Evaluation of Educational Achievement Page 16©Copyright IEA, 2008
85. In the practicum component of a route, the persons assigned to mentor and assess future teachers vary greatly across countries.
In the first column below, check off the category or categories of persons who are typically responsible for mentoring and/or supervising future teachers in the school(s) to which they are assigned for their practicum?
In the second column, check off the category or categories of persons who are typically responsible for overall assessment of the future teacher’s practicum performance?
Mentoring Assessment
Practicing classroom teacher in elementary or secondary school
Headmaster or other administrator in a particular elementary or secondary school
Inspector, pedagogical advisor, or other midlevel administrator in elementary/secondaryschoolsystem
Post-graduate student in a university
Othermoresenioruniversity/collegeteachingstaff
Retired elementary or secondary school teacher or administrator
Other (please specify)
86. For assessment of the practicum component of this route, is there any national guidance provided to those who do the assessment? yes no
87. From a national perspective, finding places for students to complete the practicum component of this route is usually
Quiteeasy;therearemoreplacesavailablethanareneededbytheprogram
A little difficult; there is a fine balance between the number of places available and the number needed
Extremely difficult; there are too few places available
Clarification or explanation if needed: (e.g., if answer differs by phase and/or by <state/province>):
Additional comment if needed:

197APPENDICES
International Association for the Evaluation of Educational Achievement Page 17 ©Copyright IEA, 2008
Program Goals National State or Regional or Institutional Does not
provincial district apply
General pedagogy/educational foundations
A. Program goals and emphasis
B. Selection of textbooks, teaching materials, readings
C. Standards of classroom performance expected of graduates
D. Standards of content knowledge expected of graduates
E. Subject-matter knowledge to be covered in mathematics
F. Mathematics pedagogy curriculum
G. Generalpedagogy/educational foundations curriculum
H. <Generaleducation>curriculum
I. Number of credits required in program areas
J. Length of practical training
K. Location of practical training
L. Monitoring of future teachers’ progress through the program
M. Qualityandfrequencyofthesupervision during practical training
N. Type and content of assessments throughout the program
O. External examinations (if any)
P. Other
88. Where are standards set? Who makes the decisions about the curriculum for all phases of this route, including expected outcomes or standards of performance? If the appropriate answer lies between “State or Provincial” and “Institutional,” please check the answer “Regional or District” and add a brief explanation in the box that follows. Preferably a focus group of teacher education authorities should be used to answer this question.
Mostly determined at which level? (Please check one box in each row)
Additional explanation if necessary:

THE TEACHER EDUCATION AND DEVELOPMENT STUDY IN MATHEMATICS (TEDS-M) TECHNICAL REPORT198
International Association for the Evaluation of Educational Achievement Page 18©Copyright IEA, 2008
89. Which of the following are required of most mathematics content teaching staff in this route? (Check as many as apply.)
Bachelor’s degree (ISCED level )
Master’s degree (ISCED level )
Doctoral degree (ISCED level )
Ateachingcredential/qualificationforelementaryorsecondaryschool
Experienceteachinginelementary/secondaryschool(s)
Acurrentcross-appointmentinanelementary/secondaryschool
Answer differs by phase (please explain)
Other (please specify)
90. Which of the following are required of most mathematics pedagogy teaching staff in this route? (Check as many as apply.)
Bachelor’s degree (ISCED level )
Master’s degree (ISCED level )
Doctoral degree (ISCED level )
Ateachingcredential/qualificationforelementaryorsecondaryschool
Experienceteachinginelementary/secondaryschool(s)
Acurrentcross-appointmentinanelementary/secondaryschool
Answer differs by phase (please explain)
Other (please specify)
91. Policy reform: When was the last major policy change or reform in this route and why was this change undertaken?
Sources:

199APPENDICES
International Association for the Evaluation of Educational Achievement Page 19 ©Copyright IEA, 2008
92. Other contextual factors: Are there other historical, social, or cultural factors that you think are essential for understanding of this route and which might be addressed in various ways later in the study? yes no
If yes, please summarize very briefly.
Sources:

THE TEACHER EDUCATION AND DEVELOPMENT STUDY IN MATHEMATICS (TEDS-M) TECHNICAL REPORT200
International Association for the Evaluation of Educational Achievement Page 20©Copyright IEA, 2008
93. Problems: Nationally, what are some of the main problems facing this route?
Sources:
94. Other: Please suggest other questions (and answers) that you think could help us to better understand this route, especially as they pertain to preparation to teach mathematics.
95. Have you filled in Section Three for each of the routes to be studied in TEDS-M?
Yes Thank you. You have completed the Route Questionnaire.
No Please provide Section Three answers for each route until you have done all the routes to be studied by your country in TEDS-M.

201APPENDICES
TEDS-M Component 1 Country Report Page 1
APPENDIx B: TEDS-M Guidelines on Writing Country Reports
COUNTRY REpORTS ON EDUCATION
GUIDELINES FOR NATIONAL RESEARCH COORDINATORS

THE TEACHER EDUCATION AND DEVELOPMENT STUDY IN MATHEMATICS (TEDS-M) TECHNICAL REPORT202
1.0 InTRODUCTIOn AnD OVERVIEW 3 1.0.1 Structure of the Country Report 3
1.0.2 Context and Organization of Teacher Education 3
1.0.3 Quality-Assurance Arrangements and Program Requirements 3
1.0.4 Resources and Reforms in Teacher Education 5
1.0.5 Timeline 5
1.0.6 Style/Format 6
1.0.7 Total Desired Length 6
2.0 COnTEnT OF COUnTRY REPORT 6
2.01 INTRODUCTION 6
2.1 PART ONE—CONTEXT AND ORGANIZATION 6
2.1.1 Historical, Cultural, and/or Social Factors 6
2.1.2 Teaching Career, Teacher Labor Market, Teacher Working Conditions 7
2.1.3 Structure and Organization of Teacher Education 7
2.2 PART TWO—QUALITY ASSURANCE ARRANGEMENTS AND PROGRAM REQUIREMENTS 8
2.2.1 Entry Standards/Selection 8
2.2.2 Accreditation Systems for Teacher Education 9
2.2.3 Curriculum Requirements 9
2.2.4 Practicum and Field Experience Requirements 10
2.2.5 Staffing Requirements 10
2.2.6 Standards and Requirements for Entry to the Teaching Profession 10
2.3 PART THREE—RESOURCES AND REFORMS 10
2.3.1 Financing of Teacher Education Institutions and Programs 10
2.3.2 Public Debates Concerning Reform of Teacher Education 11
Appendix A: Summary of Additional Insightful National Statistics 12
Appendix B: Bibliographical References of Important Studies Concerning any of the Routes 12
in Question
Appendix C: Biosketches for Authors of this Chapter at NRC 12
TEDS-M Component 1 Country Report Page 2 of 10

203APPENDICES
TEDS-MComponent1CountryReport Page3of10
PREPARInG COUnTRY REPORTS On TEACHER EDUCATIOn: GUIDELInES FOR nATIOnAL RESEARCH COORDInATORS
1.0 INTRODUCTION AND OVERVIEW
As part of Component 1 of the TEDS-M study, NRCs are asked to prepare a brief
report describing the main features of mathematics teacher education in their
country, with a focus on national policies and institutions (or state/provincial level
policies in federal systems).
The country reports will be collected in the TEDS-M international report, elaborating
upon and complementing the chapters reporting on cross-national analyses of data
that NRCs provide by completing the TEDS-M route questionnaire.
Guidelines are provided below to assist NRCs in preparing their country reports. It
is important that country reports reach the stage of being publishable. We hope that
these guidelines will enable you to provide a coherent, well-organized account of
recent history, current policies, and practices in your country. Although the guidelines
are presented as a series of questions, we hope that you will feel encouraged to write
yourresponsesinafree-flowing,readableprosestylethatwillleadtoacountryreport
that is publishable in the TEDS-M international report.
1.0.1 Structure of the Country Report
The report will fall into three main parts:
a) Context and organization of teacher education
b) Quality-assurance arrangements and program requirements
c) Funding and reform of teacher education
1.0.2 Context and Organization of Teacher Education
In this part you will be asked to elaborate on information which was provided in more
standardized form on the route questionnaire. We also need to know more about the
organization of the teaching career in general and implications for the organization of
teacher education in particular. There are therefore three main sections to this part:
• Historical,culturalandsocialfactorsthathaveplayedasignificantroleinshaping
the teacher education system
• Currentpoliciesandissuesrelatedtotheteacherworkforce,theteacherlabor
market, and teacher quality
• Structureandorganizationoftheteachereducationsystem.
1.0.3 Quality-Assurance Arrangements and Program Requirements
The purpose of this part of the report will be to provide readers with an
understanding of national policies, institutions, and practices for monitoring and
assuring the quality of teacher education and entrants to the teaching profession.

THE TEACHER EDUCATION AND DEVELOPMENT STUDY IN MATHEMATICS (TEDS-M) TECHNICAL REPORT204
TEDS-M Component 1 Country Report Page 4 of 10
In broad terms, this section of the report will provide answers to three main questions:
Entry to teacher education: Who decides, and how, which students gain entry to teacher education programs? What policies and agencies are in place to monitor and assure the quality of entrants to teacher education?
Teacher education institutions: Who decides, and how, which institutions are allowed to train teachers? What policies and agencies are in place to monitor and assure the quality of teacher education institutions and programs?
Entry to the teaching profession: Who decides, and how, which students have met the requirements for full entry to the profession? What policies and agencies are in place to monitor and assure that graduates are competent and qualified to gain a license1 to teach?
Each country will deal with these questions in their own way. Most countries have a government agency responsible for auditing the academic quality of their higher education institutions (the European Universities Association and the Asia-Pacific Quality Network are examples of associations of such agencies). These agencies are usually set up by national or state governments.
In addition, some countries also have government or professional agencies with more specific responsibilities for regulating the quality of professional preparation programs and the competence of their graduates. These are the focus of our attention in this report. These agencies may also be established by national or state governments, as statutory authorities, for example, or in some countries they may be set up by professional bodies. In some countries these agencies are known as “accreditation” agencies. Their function is to assess whether a professional preparation course, program, or institution meets specified standards and to approve those that do.
Accreditation is an endorsement by an independent, external agency that a program is able to produce graduates who are competent to begin practice and who meet standards for initial or provisional license. Accreditation agencies may be set up by governments (e.g., the General Teaching Council in Scotland), or they may be established by professional bodies themselves or not-for-profit private bodies (e.g., the National Council for Accreditation of Teacher Education in the USA). They may operate at the national level or the state/province level. They are usually also responsible for providing a license to beginning teachers who graduate from “accredited” professional programs.
In this section you will be asked about requirements set by quality-assurance agencies, if any, for the curriculum content and the practicum experience in teacher education programs. You will also be asked about the standards for exit from teacher education programs and entry to the profession for lower-secondary mathematics teachers and
primary teachers.
1 According to the dictionaries a license is 1 a: permission to act b: freedom of action; 2 a: a permission granted by a competent authority to engage in a business or occupation or in an activity otherwise unlawful; b: a document, plate, or tag evidencing a license granted. In this document we use the word license to mean registration, certification or endorsement that a person has attained a level of knowledge and professional performance necessary to gain full entry to the teaching profession. Please use the term that your country uses to describe a teacher who has attained a level of knowledge and professional performance necessary to gain full entry to the teaching profession.

205APPENDICES
TEDS-M Component 1 Country Report Page 5 of 10
Various terms are used to refer to an endorsement that a person has attained a level of
knowledge and professional performance necessary to gain full entry to the teaching
profession. To avoid confusion throughout this document, we will use the term
license; however please use the term that your country uses to describe a teacher who
has attained a level of knowledge and professional performance necessary to gain full
entry to the teaching profession. This endorsement may be given by a government
agency (e.g., a statutory authority) or a professional body, often the same agency that
is responsible for accreditation of teacher education programs.
A distinction may be made between standards for gaining a university teacher
education qualification and standards for gaining a license to teach. Whereas a
university determines whether an individual has met its academic qualification
standards, in some countries another agency, such as a government employing
authority or professional standards body, may determine whether to grant a license to
teach.
In some countries gaining a university qualification automatically leads to gaining
a license from a professional standards agency and eligibility to be employed as a
teacher in schools. In others, national or state authorities may require graduates of
teacher education programs to meet additional criteria they have set, such as national
subject-matter knowledge tests, thesis completion, or successful completion of a
period of induction or probationary teaching in schools.
We hope the detailed guidelines and questions below will assist NRCs to describe
the way in which their country determines the requirements of teacher education
programs and how it addresses the challenges of monitoring and assuring the quality
of entrants to the profession.
1.0.4 Resources and Reforms in Teacher Education
To complete your country report, you will be asked to deal with two additional
matters that will give readers insight into the nature of and prospects for change in
your country. This part calls for analysis of the financing of teacher education, on the
one hand, and the reform debates over teacher education, on the other.
1.0.5 Timeline
• Routequestionnaireandguidelinesforcountryreportnarrativetobesentto
NRCs—February 2007
• NRCssubmitroutequestionnaireanddraftchaptersinresponsetoguidelines—15
May 2007
• InteractionasrequiredbetweeninternationalcentersandNRCsforeditingofdraft
chapter and preparation of draft international report—May to August 2007
• Discussdraftcountrychaptersanddraftcross-nationalchaptersat3rdNRC
meeting in June 2007
• SubmissionofdraftinternationalreporttoNSFasdeliverable—1Sept2007
• SubmissionofdraftinternationalreporttoIEASecretariatforeditingand
publishing—1 Sept 2007
• PublicationandreleaseofinternationalreportbyIEA—Feb2008

THE TEACHER EDUCATION AND DEVELOPMENT STUDY IN MATHEMATICS (TEDS-M) TECHNICAL REPORT206
1.0.6 Style/Format
• PleaseuseIEAstyleguidelines(enclosedinanattachmentwiththise-mailorvia
the TEDS-M website) and submit electronically as MS Word document if possible.
1.0.7 Total Desired Length
• 20–30single-spaced,12pointfontpages.
2.0 CONTENT OF COUNTRY REPORT
Detailed Guidelines (Suggested Questions, Headings, and Lengths for Each Section)
Below you will find a set of questions to be answered in the country report. The
questions are grouped by section with a suggested page length for each section. If
the questions in the guidelines below do not apply in some way to your country, be
clear in writing about this and stating why it is so. If you need to take some liberties
with the sections, headings, and questions to accurately represent your country, this is
permissible.
Throughout the report, please be clear about what is different and what is similar
among:
• Thevariousteachereducationroutesinyourcountry
• Elementaryvs.lower-secondaryandupper-secondarylevels
• States/provinces
• Publicvs.privateinstitutions.
For some sections you can draw heavily on material produced for other recent reports
at the international (e.g., OECD and Eurydice) and national levels. Please be sure
to give appropriate credit and to integrate the material effectively into the overall
narrative.2
2.01 INTRODUCTION (1 page)
2.1 PART ONE: CONTEXT AND ORGANIZATION
2.1.1 Historical, Cultural, and/or Social Factors (2–3 pages)
Elaborate on Questions 91 and 92 in the route questionnaire concerning historical,
social, or cultural factors that you think are essential for an understanding of these
routes.
TEDS-M Component 1 Country Report Page 6 of 10
2 Please consult the following documents for general information about teacher education in your country:1. The information network on education in Europe, Eurydice [mentioned on page 6 of this document]: http://
www.eurydice.org/portal/page/portal/Eurydice 2. OECD’s Teachers Matter 2005 [mentioned on page 6 of this document] http://www.oecd.org/document/52/0,
2340,en_2649_34859095_34991988_1_1_1_1,00.html3. Education at a Glance 2005 [mentioned on page 7 of this document]: http://www.oecd.org/document/34/0,2340,en_2649_34515_35289570_1_1_1_1,00.html4. Education at a Glance 2006 [mentioned on page 7 of this document]: http://www.oecd.org/document/52/0,2340,en_2649_34515_37328564_1_1_1_1,00.html5. Education at a Glance 2006, list of tables [mentioned on page 7 of this document]: http://www.oecd.org/document/6/0,2340,en_2649_34515_37344774_1_1_1_1,00.html

207APPENDICES
2.1.2 Teaching Career, Teacher Labor Market, Teacher Working Conditions (3–4 pages)
a) How are teachers hired and promoted? Do they belong to a national service, i.e., is teaching a position-based or career-based occupation (as defined in OECD report Teachers Matter)? What proportions of teachers are employed in public and private schools?3
• Table5.1intheOECD’sTeachers Matter (2005) summarizes the employment and dismissal conditions of teachers in public schools, 2004. Could countries that took part in the OECD project update the table, and other countries complete the table? How do these conditions differ for teachers in private schools (if present)?
• Table5.2intheOECD’sTeachers Matter (2005) summarizes the teacher recruitment procedures and selection criteria in public schools, 2004. Could countries that took part in the OECD project update the table, and other countries complete the table? How do these procedures and criteria differ for teachers in private schools (if present)?
b) How specialized are teachers? What grades, subjects, and types of schools are they prepared and assigned to teach for?
c) What are the particular challenges in the working conditions for which teachers must be prepared (e.g., large classes, lack of materials, long hours, remote locations)?
d) Is there a shortage or excess of primary school teachers and/or mathematics teachers in lower-secondary school? (A “shortage” may be indicated by unfilled vacancies, “difficult to fill” vacancies, and/or “out of field” teaching; i.e., teachers who are not appropriately qualified to teach mathematics.) Why does this situation exist?
e) How competitive is teaching with other occupations in terms of salary, working conditions, etc? (Countries could also update or complete Table D3.1 on teachers’ salaries 2004 in the OECD’s Education at a Glance 2006.)
2.1.3 Structure and Organization of Teacher Education (2–3 pages)
a) Who provides teacher education for future primary and secondary teachers? How many providers/institutions are there? What kinds of programs do they offer? How many teacher education programs are there? How many students in each program?
b) Routes to be studied in TEDS-M—for each country, summarize the information provided in the route questionnaire (Questions 15–34 for concurrent routes, 35–61 for consecutive routes, and 62–72 for primarily practice (apprenticeship) routes)
c) Routes not studied in TEDS-M (as identified on the frame questionnaire) and
why not studied
TEDS-M Component 1 Country Report Page 7of 10
3 The OECD’s Education at a Glance glossary defines these terms as follows. A school is classified as public if it is controlled and managed directly by a public education authority or agency; or is controlled and managed either by a government agency directly or by a governing body (council, committee etc.), most of whose members are appointed by a public authority or elected by public franchise. A school is classified as private if it is controlled and managed by a non-governmental organization (e.g., a church or business enterprise), or if its governing board consists mostly of members not selected by a public agency.)

THE TEACHER EDUCATION AND DEVELOPMENT STUDY IN MATHEMATICS (TEDS-M) TECHNICAL REPORT208
2.2 PART TWO—QUALITY ASSURANCE ARRANGEMENTS AND PROGRAM REQUIREMENTS
2.2.1 Entry Standards/Selection (2–3 pages)
We are interested in understanding national policies and practices in each
participating country for monitoring and assuring the quality of teacher education
programs, institutions, and the quality of graduate teachers from those programs.4
(In countries with federal systems, the relevant policies may be formed at the state,
province, or land government level.)
a) Who determines the total number of university places available for teacher
education students?
b) How, or on what basis, is the total number of places available for teacher
education students determined?
c) Who determines the requirements or standards for students to gain entry to
professional preparation programs for teachers?
d) What are the standards or requirements to be eligible to enter programs for
preparing teachers of mathematics at the lower-secondary level? e.g.,
• Whatlevelofsecondaryschooland/oruniversitymathematicscoursesis
required?
• Arethereanyareasofcontentorsubjectmatterinprevioussecondary
school/university mathematics courses that are prescribed or required?
• Arethereanytestsofpre-requisitesubject-matterknowledgethatmustbe
taken or passed?
e) What are the standards or requirements to be eligible to enter programs for
preparing teachers who will teach mathematics at the primary/elementary level?
(For example, what level of secondary school/university mathematics courses is
required? Are there pre-requisite subjects that must have been taken?)
h) How does the responsible agency ensure that its selection standards are complied
with?
i) How do the academic standards of entrants to teacher education programs for
teachers of mathematics at the lower-secondary level compare with standards for
entry to most other mathematics-related professional preparation programs?
(Please refer to the quality indicators that are used in your country: e.g., SAT
scores in the US; “A” levels in England, etc.)
j) How do the academic standards of entrants to teacher education programs for
teachers of mathematics at the primary/elementary and secondary level compare
with standards for entry to most other university or professional preparation
programs?
k) If any other external examinations are required at some point during these
routes, what are the purpose, nature, content, and use of these examinations?
TEDS-M Component 1 Country Report Page 8 of 10
4 The term “program” as used here refers to the total set of courses, units of study, modules, activities, and school experience that a future teacher must complete successfully to gain the status of a qualified and licensed (registered, certified) teacher.
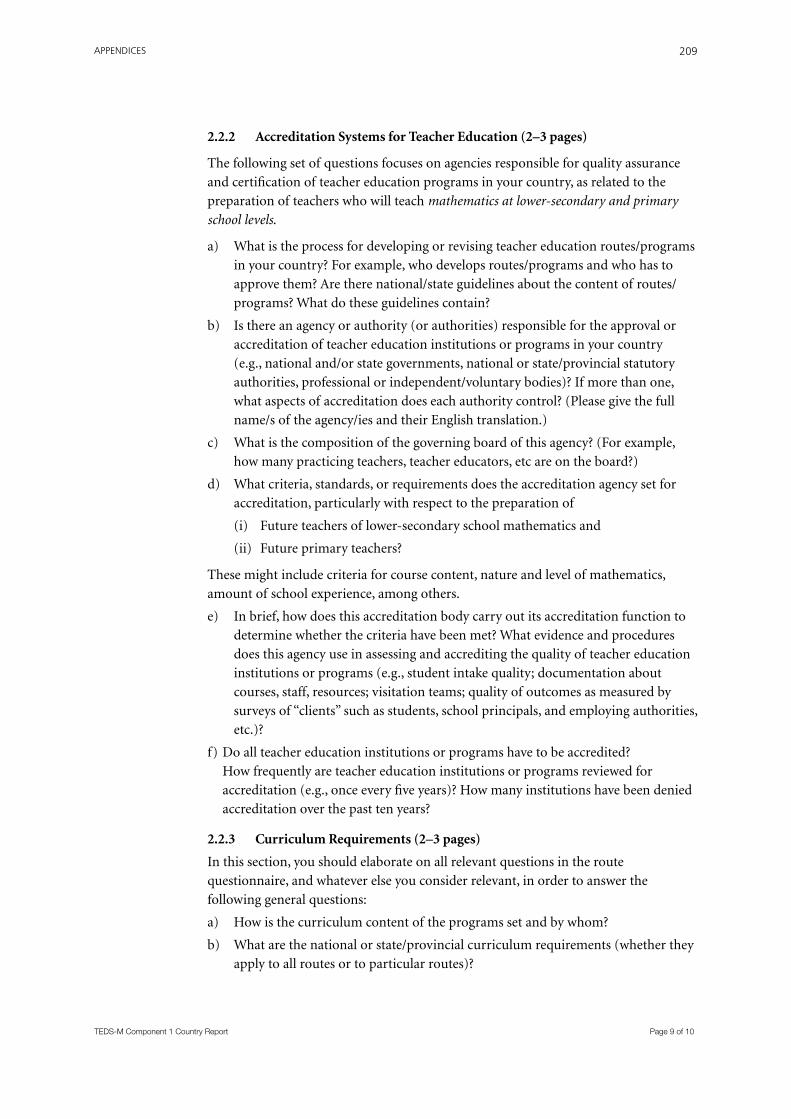
209APPENDICES
TEDS-M Component 1 Country Report Page 9 of 10
2.2.2 Accreditation Systems for Teacher Education (2–3 pages)
The following set of questions focuses on agencies responsible for quality assurance
and certification of teacher education programs in your country, as related to the
preparation of teachers who will teach mathematics at lower-secondary and primary
school levels.
a) What is the process for developing or revising teacher education routes/programs
in your country? For example, who develops routes/programs and who has to
approve them? Are there national/state guidelines about the content of routes/
programs? What do these guidelines contain?
b) Is there an agency or authority (or authorities) responsible for the approval or
accreditation of teacher education institutions or programs in your country
(e.g., national and/or state governments, national or state/provincial statutory
authorities, professional or independent/voluntary bodies)? If more than one,
what aspects of accreditation does each authority control? (Please give the full
name/s of the agency/ies and their English translation.)
c) What is the composition of the governing board of this agency? (For example,
how many practicing teachers, teacher educators, etc are on the board?)
d) What criteria, standards, or requirements does the accreditation agency set for
accreditation, particularly with respect to the preparation of
(i) Future teachers of lower-secondary school mathematics and
(ii) Future primary teachers?
These might include criteria for course content, nature and level of mathematics,
amount of school experience, among others.
e) In brief, how does this accreditation body carry out its accreditation function to
determine whether the criteria have been met? What evidence and procedures
does this agency use in assessing and accrediting the quality of teacher education
institutions or programs (e.g., student intake quality; documentation about
courses, staff, resources; visitation teams; quality of outcomes as measured by
surveys of “clients” such as students, school principals, and employing authorities,
etc.)?
f) Do all teacher education institutions or programs have to be accredited?
How frequently are teacher education institutions or programs reviewed for
accreditation (e.g., once every five years)? How many institutions have been denied
accreditation over the past ten years?
2.2.3 Curriculum Requirements (2–3 pages)
In this section, you should elaborate on all relevant questions in the route
questionnaire, and whatever else you consider relevant, in order to answer the
following general questions:
a) How is the curriculum content of the programs set and by whom?
b) What are the national or state/provincial curriculum requirements (whether they
apply to all routes or to particular routes)?
THE TEACHER EDUCATION AND DEVELOPMENT STUDY IN MATHEMATICS (TEDS-M) TECHNICAL REPORT210
2.2.4 Practicum and Field Experience Requirements (1 page)
Summarize from the content in Questions 84–87 in the route questionnaire.
2.2.5 Staffing Requirements (1 page)
Summarize any national qualifications required for the staffing of instructors/faculty
members within the institutions of the routes being studied.
2.2.6 Standards and Requirements for Entry to the Teaching Profession (2–3 pages)
The general question for this section is, “W
2.3.2 Public Debates Concerning Reform of Teacher Education (2–3 pages)
What if anything about these national policies regarding mathematics teacher
education are matters of strong public debate and why?
APPEnDICES
Appendix A: Summary of Additional Insightful national Statistics Select statistics that are readily available at the national level on the characteristics of
teacher education programs.
Appendix B: Bibliographical References of Important Studies Concerning any of the Routes in Question Please provide English translations for the titles of the references.
Appendix C: Biosketches for Authors of this Chapter at nRC Two hundred words per author.
TEDS-M Component 1 Country Report Page 10 of 10

211APPENDICES
APPENDIx C: Characteristics of National Samples: Implementations of the International Sampling Design in Participating Countries
Sabine Meinck, IEA Data Processing and Research Center
Jean Dumais, Statistics Canada
Introduction: How to Read this AppendixThis appendix details how the international sampling plan was implemented in each participating country. It will help readers of the TEDS-M international report (Tatto et al., 2012) or researchers interested in carrying out secondary analysis of the TEDS-M international database to understand how the target populations were defined, what the specific characteristics of the particular samples were, and how the data were collected. With this knowledge, the audience will be able to embed all findings into correct contexts.
The sections of this appendix are written in a systematic way. This introductory section presents key terms and concepts so that readers can correctly interpret the text and tables in the following country-specific sections.
Key Terms and Concepts Used in the Country-Specific Sections
• Sample design: All country-specific details concerning the sample design such as
sample sizes, stratification (if used), sampling method (simple random sampling
versus sampling with selection probabilities proportional to size), and specific
strategies for within-institution sampling (if deviating from the standard design)
are explicated in this segment of each country section.
• Total number of TEDS-eligible institutions: This refers to the total number of
institutions offering teacher education to targeted future teachers in the country.
These institutions constituted the sampling frame.
• Coverage: Any parts of the targeted populations not covered by the assessment
are given and described in this segment. Note that reduced coverage is also
annotated in the international report. In most countries, however, 100 percent of
the targeted populations were covered.
• Exclusions: This segment of the country sections presents and describes any parts
of the targeted populations that were excluded from an assessment. Exclusions
of future teachers had to be kept below five percent. Exclusion rates above this
percentage are annotated in the international report.
• Particularities:Anyspecificfeatureofthepopulationthathadaninfluenceonthe
sample implementation is given here. Particular attention is given to program-
types producing teachers eligible to teach both primary and lower-secondary
students. Deviations from the international sampling plan are also described.

THE TEACHER EDUCATION AND DEVELOPMENT STUDY IN MATHEMATICS (TEDS-M) TECHNICAL REPORT212
• Exhibit titled “Explicit stratification and sample allocation”: This table is provided
in those instances where an institution sample was selected and explicit
stratification used. It gives the stratum names, stratum sizes, and the allocation
of the sample to the strata.
• Exhibit titled “Sample design (institution and future teacher surveys)”: This table
displays the structure and size of the institution and future teacher samples as
well as the structure and size of the populations, estimated using sample data.
This table is always separated into displays for the two future teacher target
populations (i.e., primary and lower secondary). The program-types defined by
each participating country are listed according to the level for which they were
preparing future teachers. If a program-type was preparing future teachers for
both levels (primary and lower secondary), it is listed in both table sections;
a footnote points the reader to this particularity. The columns dedicated to
institutions give:
a) A sample estimate of the number of institutions providing a specific program-
type in a country1 and the total number of institutions offering education for
the specific level;2
b) The number of institutions that participated in the future teacher surveys;
c) The number of institutions that completed an institutional program
questionnaire (IPQ) for the particular program.
The columns dedicated to future teachers give:
d) A sample estimate of the number of future teachers of a particular program-
type in a country3 and an estimated total number of future teachers belonging
to the specific level (primary, lower secondary);4
e) The number of participating future teachers per program-type and in total
for the particular level.
• Exhibit titled “Mapping program-types to groups defined for reporting purposes”:
Because the program-types specified in each country may have had meaning
only to persons familiar with the particular education system, TEDS-M built,
for reporting purposes, groups of programs that shared common features across
countries. The categorization was based on (i) the degree of specialization, and
(ii) the grade ranges for which future teachers were being prepared to teach.
The program-groups eventuating from this process were the following:
− PRIMARY LEVEL: Lower-primary generalist (to Grade 4 maximum)
Primary generalist (to Grade 6 maximum)
Primary/lower-secondary generalist (to Grade 10 maximum)
Primary mathematics specialist.
1 This number is equal to the sum of the final TPU weights for this program-type.
2 This number is equal to the sum of the final TPU weight for all programs eligible for one particular level.
3 This number is equal to the sum of the final future teacher weights for this program-type.
4 This number is equal to the sum of the final future teacher weight for all programs eligible for one particular level.

213APPENDICES
− LOWER-SECOnDARY LEVEL: Lower-secondary mathematics (to Grade 10 maximum)
Lower-secondary mathematics (to Grade 11 and above).
The table maps the program-types specified in each country to the groups that
were defined for reporting purposes. Program-types preparing future teachers to
teach both primary and lower-secondary students were allocated to one group in
both levels.
• Exhibit titled “Sample design (educator survey)”: In this table, the structure and
size of the educator sample is displayed as are the structure and the size of the
educator population, estimated using sample data. The table is separated by the
three educator-groups that were defined for sampling purposes. The table also
gives the number of participants as well as the estimated number of educators per
group5 and in total6 in the population.
5 This number is equal to the sum of the final educator weight for all educators belonging to one group.
6 This number is equal to the total sum of the final educator weight.

THE TEACHER EDUCATION AND DEVELOPMENT STUDY IN MATHEMATICS (TEDS-M) TECHNICAL REPORT214
Exhibit C1.1. Sample design in Botswana (institution and future teacher surveys)
Route No. Program-Type Institutions Future Teachers
Population Participants Completed Population Participants (sample (future teacher IPQs* (sample estimate) surveys) estimate)
Level: Primary
Concurrent 1 Diploma in Primary 4 4 4 100 86 Education
Total 1 4 4 4 100 86
Level: Lower secondary
Concurrent 2 Bachelor of 2 2 2 25 19 Education
3 Diploma in 1 1 1 35 34 Secondary Education
Total 2 3 3 3 60 53
note: *IPQ = institutional program questionnaire.
Exhibit C1.2: Mapping program-types to groups defined for reporting purposes (Botswana)
Program-Type Program-Group (Level: Primary) Program-Group (Level: Lower Secondary)
Diploma in Primary Education Primary/Lower-secondary generalist – (Grade 10 maximum)
Bachelor of Education – Upper-secondary mathematics (to Grade 11 and above)
Diploma in Secondary Education – Lower-secondary mathematics (to Grade 10 maximum)
Exhibit C1.3: Sample design in Botswana (educator survey)*
Educator-Group Population Participants (Sample Estimate)
Educators of mathematics and mathematics pedagogy 16 16
General pedagogy educators 28 27
Educators of mathematics and of mathematics pedagogy and general pedagogy 0 0
Total 44 43
note: * Number of institutions participating in educator survey: seven.
1. BOTSWANA
Sample design: Census of institutions, educators, and future teachers.
Total number of TEDS-eligible institutions: Seven.
Coverage: One hundred percent in all target populations.
Exclusions: None.
Particularities: Very small target populations.

215APPENDICES
Exhibit C2.1: Sample design in Canada, four provinces (institution and future teacher surveys)
Route No. Program-Type Institutions Future Teachers
Population Participants Completed Population Participants (sample (future teacher IPQs (sample estimate) surveys) estimate)
Level: Primary
Concurrent 1 Bachelor of Arts/ Bachelor of 8 0 2 – 0 Science and Bachelor of Education, Primary (five years)
2 Bachelor of Education, 1 1 1 *** 16 Primary/Elementary (five years)
3 Bachelor of Education, 11 1 3 *** 20 Primary (four years)
Consecutive 4 Bachelor of Education, 12 0 4 – 0 Primary (one year)
5 Bachelor of Education, 4 0 2 – 0 Primary (two years)
Concurrent * Bachelor of Arts and 1 0 0 – 0 Bachelor of Education, Primary (four years)
* Bachelor of Arts (Education), 1 0 0 – 0 Primary (three years)
Total 7 28** 2 12 *** 36
2. CANADA (FOUR PROVINCES)
Sample design: Census of institutions and educators; sample of future teachers within large institutions according to the international sampling plan.
Total number of TEDS-eligible institutions: Thirty.
Coverage: One hundred percent in the four participating provinces: Ontario, Québec, Nova Scotia, and Newfoundland and Labrador.
Exclusions: None.
Particularities: Because of extremely low participation rates in all target populations, data for Canada (four provinces) were not weighted, program-types were not mapped to groups for reporting purposes, and results were not reported together with data from other participating countries.
Table continued on next page

THE TEACHER EDUCATION AND DEVELOPMENT STUDY IN MATHEMATICS (TEDS-M) TECHNICAL REPORT216
Exhibit C2.1: Sample design in Canada, four provinces (institution and future teacher surveys) (contd.)
Route No. Program-Type Institutions Future Teachers
Population Participants Completed Population Participants (sample (future teacher IPQs (sample estimate) surveys) estimate)
Level: Lower secondary
Concurrent 6 Bachelor of Arts/Bachelor of 9 2 2 *** 31 Science and Bachelor of Education, Secondary (five years)
7 Bachelor of Education, Secondary Mathematics (four years) 10 2 2 *** 10
Consecutive 8 Bachelor of Education, Secondary (one year) 12 4 5 *** 61
9 Bachelor of Education, Secondary (two years) 4 2 2 *** 23
Concurrent * Bachelor of Arts (Education), Secondary (three years) 1 0 0 – 0
* Bachelor of Education, Secondary (four years) 1 0 0 – 0
* Bachelor of Science and Bachelor of Education, Secondary (four years) 2 0 0 – 0
Consecutive * Bachelor of Education, Secondary (one and half years) 1 0 0 – 0
Total 8 28** 8** 11 *** 125
notes:
* No number was assigned because no future teachers or educators from this program participated.** The numbers in the column do not add up to the total because some institutions were offering more than one program.***Data remained unweighted; estimates of population totals cannot be given.
Exhibit C2.2: Sample design in Canada, four provinces (educator survey)
Educator-Group Population Participants (Sample Estimate)
Educators of mathematics and mathematics pedagogy * 35
General pedagogy educators * 37
Educators of mathematics and mathematics pedagogy and general pedagogy * 2
Total * 74
notes: Number of institutions participating in educator survey: 10.*Data remained unweighted; estimates of population totals cannot be given.

217APPENDICES
Exhibit C3.1: Sample design in Chile (institution and future teacher surveys)
Route No. Program-Type Institutions Future Teachers
Population Participants Completed Population Participants (sample (future teacher IPQs (sample estimate) surveys) estimate)
Level: Primary
Concurrent 1 Generalists 36 31 31 2,018 657 (Grades 1 to 8)
Total 1 36 31 31 2,018 657
Level: Lower secondary
Concurrent 2 Generalists 34 28 ** 2,061 648 (Grades 1 to 8)
3 Generalists with further 11 9 7 181 98 mathematics education (Grades 5 to 8)
Total 2 40* 33* 38 2,242 746
notes: * The numbers in the column do not add up to the total because some institutions were offering both programs.** Identical to the corresponding entries in the part of the table dedicated to the primary level.
3. CHILE
Sample design: Census of institutions, future teachers, and educators.
Total number of TEDS-eligible institutions: Forty.
Coverage: One hundred percent in all target populations.
Exclusions: One institution was excluded because its future teachers were on practicum in remote areas of the country at the time of the assessments. This omission led to exclusion rates of 2.0 percent of institutions, about 2.0 percent of educators, 3.8 percent of future primary teachers, and 3.6 percent of future lower-secondary teachers.
Particularities: Future teachers following the program-type generalists (Grades 1 to 8) were being prepared to teach mathematics to primary and lower-secondary students. They were therefore considered to be eligible for both future teacher target populations. Because both assessment booklet types (primary booklets and lower-secondary booklets) were distributed evenly among future teachers from that program-type, this program-type appears twice in Exhibit C3.1. Note that only one institutional program questionnaire was completed for each teacher preparation unit belonging to this program-type.
On the original list of institutions, 50 institutions were listed. Fourteen were deemed ineligible for the primary level, and 10 were deemed ineligible for the secondary level (because there were no future teachers in their final year). The exclusion rates, however, were calculated on the basis of the original figures.
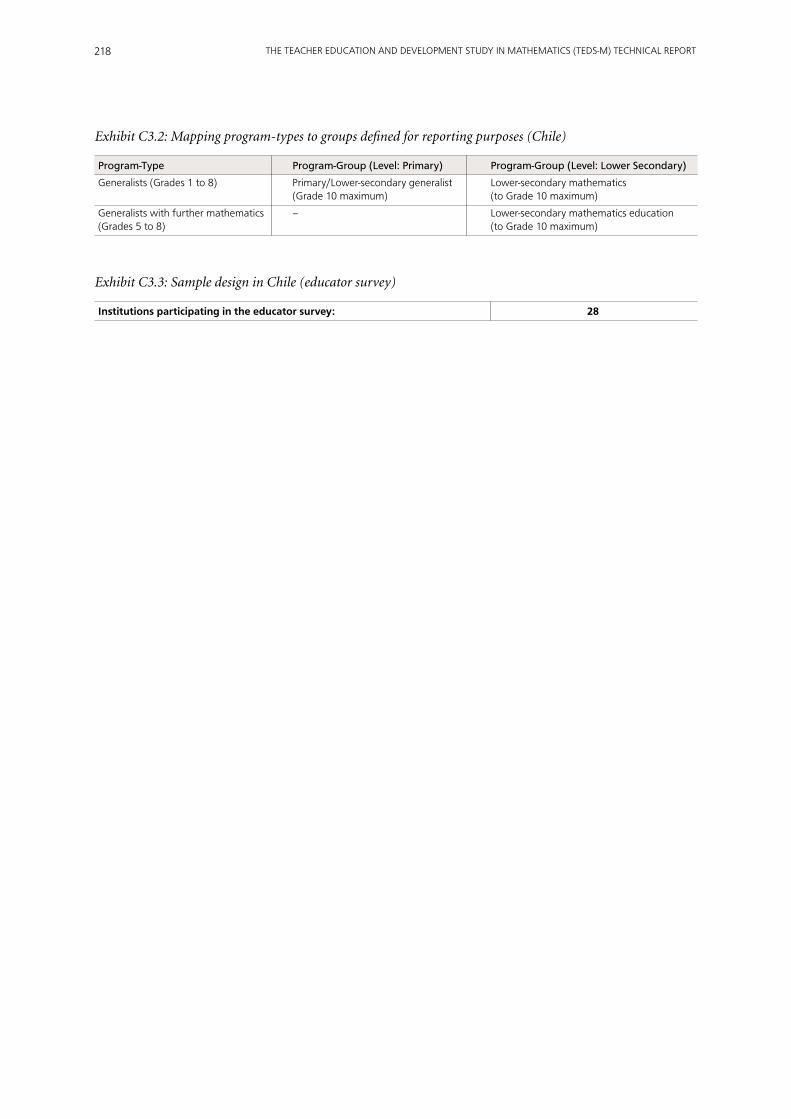
THE TEACHER EDUCATION AND DEVELOPMENT STUDY IN MATHEMATICS (TEDS-M) TECHNICAL REPORT218
Exhibit C3.2: Mapping program-types to groups defined for reporting purposes (Chile)
Program-Type Program-Group (Level: Primary) Program-Group (Level: Lower Secondary)
Generalists (Grades 1 to 8) Primary/Lower-secondary generalist Lower-secondary mathematics (Grade 10 maximum) (to Grade 10 maximum)
Generalists with further mathematics – Lower-secondary mathematics education (Grades 5 to 8) (to Grade 10 maximum)
Exhibit C3.3: Sample design in Chile (educator survey)
Institutions participating in the educator survey: 28

219APPENDICES
4. CHINESE TAIPEI
Introductory note
In deviation from the international sample design, the samples of institutions in Chinese Taipei were customized to the needs of each of the four TEDS-M surveys. Therefore, the strategies used to select the institutions as primary sampling units were reported separately for these different surveys.
Future Teacher Surveys
Sample design—survey of The sample of institutions was stratified by size (refer to Exhibit C4.1). Large future primary teachers: institutions (more than 75 future primary teachers in their final year) were selected
with certainty. From the small institutions stratum, two institutions were selected with equal probability. within selected institutions, all or at least 7 to 10 session groups (building a sample of at least 90 future teachers) were selected. within selected session groups, all future teachers were asked to participate in the survey.
Sample design—survey of future lower-secondary teachers: Census of institutions and future teachers.
Total number of TEDS-eligible institutions: Forty-six.
Coverage: One hundred percent in both future teacher target populations.
Exclusions: Very small institutions (fewer than 26 future primary teachers or fewer than five future lower-secondary teachers, respectively, in their final year) were excluded. This omission led to exclusion rates of 4.5 percent for future primary teachers and 4.7 percent for future lower-secondary teachers, respectively.
Exhibit C4.1: Explicit stratification and sample allocation in Chinese Taipei (future primary teacher survey)
Explicit Stratum No. Stratum Size* Sample Size**
Institutions Future teachers Institutions Future teachers
Small institutions 1 8 323 2 62
Large institutions, 2 9 3,622 9 861 selected with certainty
Total 2 17 3,945 11 923
notes: * As estimated on the sampling frame, after exclusion.** Participants in future teacher survey.

THE TEACHER EDUCATION AND DEVELOPMENT STUDY IN MATHEMATICS (TEDS-M) TECHNICAL REPORT220
Educator and Institution Surveys
Sample design: The sample of institutions was stratified by size (refer to Exhibit C4.3). Large institutions (more than 75 future primary teachers and more than 13 future lower-secondary teachers in their final year, respectively) were selected with certainty. From the small institutions stratum, two institutions were selected per level with equal selection probability.
Total number of TEDS-eligible institutions: Forty-six.
Coverage: One hundred percent.
Exclusions: Very small institutions (fewer than 26 future primary teachers and fewer than five future lower-secondary teachers, respectively, in their final year per institution) were excluded. This omission led to an exclusion rate of 26.1 percent of institutions but of less than 3.5 percent of the educator population.
Completion of IPQ: All institutions selected for the educator survey completed this survey instrument. Eleven IPQs were received from primary teacher education programs. Eight IPQs were received from secondary mathematics teacher education programs.
Particularities: Because of the elective character of general pedagogy courses in Chinese Taipei, the number of TEDS-M eligible general pedagogy educators was, in comparison to the numbers in other participating countries, small.
Because the number of sampled institutions selected for the educator survey and the institutional program survey was smaller than the number of institutions selected for the future lower-secondary teacher survey, no educator and program information was available for most of the small institutions offering education to future lower-secondary teachers.
Exhibit C4.2: Sample design in Chinese Taipei (institution and future teacher surveys)
Route No. Program-Type Institutions Future Teachers
Population Participants Population Participants (sample (future teacher (sample estimate) surveys) estimate)
Level: Primary
Concurrent 1 Elementary teacher education 18 11 3,595 923
Total 1 18 11 3,595 923
Level: Lower secondary
Concurrent 2 Secondary mathematics 19 19 375 365 teacher education
Total 1 19 19 375 365
Exhibit C4.3: Mapping program-types to groups defined for reporting purposes (Chinese Taipei)
Program-Type Program-Group Program-Group (Level: Primary) (Level: Lower Secondary)
Elementary teacher education Primary generalist – (Grade 6 maximum)
Secondary mathematics teacher education – Upper-secondary mathematics (to Grade 11 and above)
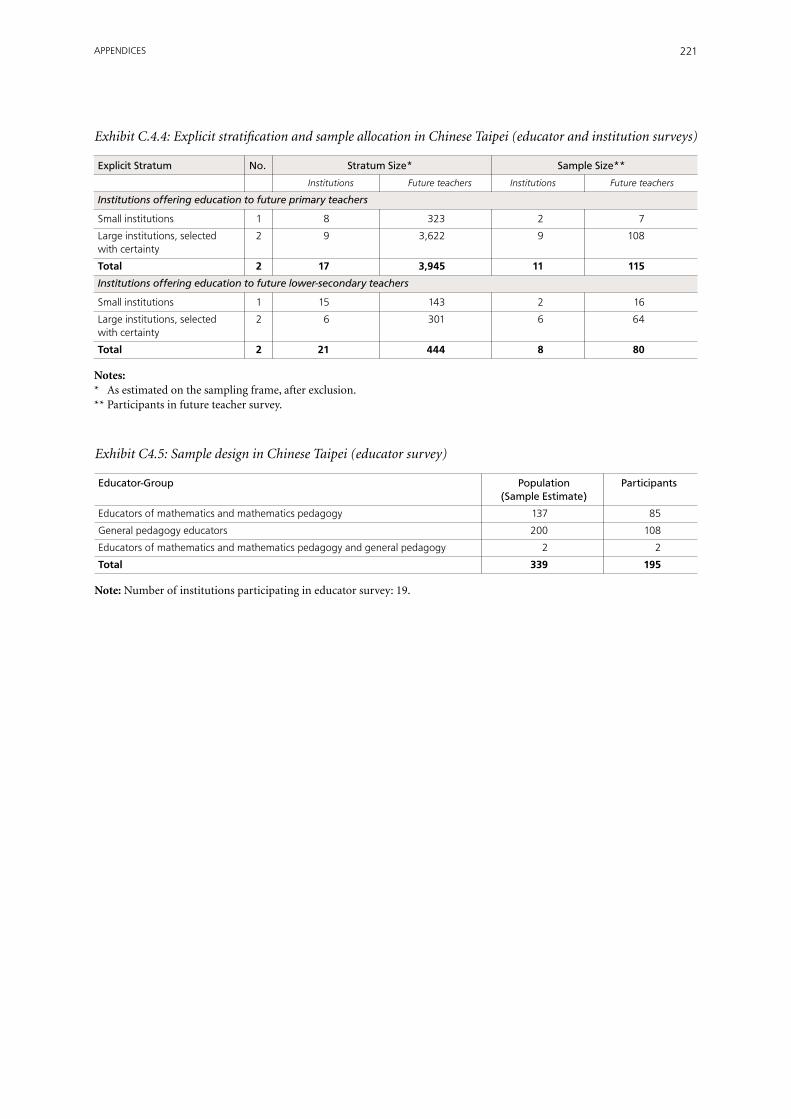
221APPENDICES
Exhibit C.4.4: Explicit stratification and sample allocation in Chinese Taipei (educator and institution surveys)
Explicit Stratum No. Stratum Size* Sample Size**
Institutions Future teachers Institutions Future teachers
Institutions offering education to future primary teachers
Small institutions 1 8 323 2 7
Large institutions, selected 2 9 3,622 9 108 with certainty
Total 2 17 3,945 11 115
Institutions offering education to future lower-secondary teachers
Small institutions 1 15 143 2 16
Large institutions, selected 2 6 301 6 64 with certainty
Total 2 21 444 8 80
notes: * As estimated on the sampling frame, after exclusion.** Participants in future teacher survey.
Exhibit C4.5: Sample design in Chinese Taipei (educator survey)
Educator-Group Population Participants (Sample Estimate)
Educators of mathematics and mathematics pedagogy 137 85
General pedagogy educators 200 108
Educators of mathematics and mathematics pedagogy and general pedagogy 2 2
Total 339 195
note: Number of institutions participating in educator survey: 19.

THE TEACHER EDUCATION AND DEVELOPMENT STUDY IN MATHEMATICS (TEDS-M) TECHNICAL REPORT222
5. GEORGIA
Sample design: Census of institutions, educators, and future teachers.
Total number of TEDS-eligible institutions: Ten.
Coverage: One hundred percent in all targeted populations.
Exclusions: Sectors of institutions with Russian and Azeri as languages of instruction were excluded, leading to exclusion rates of 1.4 percent of future primary teachers and 1.7 percent of future lower-secondary teachers, respectively.
Particularities: The target population of future lower-secondary teachers was very small.
Exhibit C5.2: Mapping program-types to groups defined for reporting purposes (Georgia)
Program-Type Program-Group (Level: Primary) Program-Group (Level: Lower Secondary)
Bachelor in Pedagogy (four years) Lower-primary generalist – (Grade 4 maximum)
Bachelor in Pedagogy (five years) Lower-primary generalist –
Bachelor in Mathematics – Upper-secondary mathematics (to Grade 11 and above)
Master’s in Mathematics – Upper-secondary mathematics (to Grade 11 and above)
Exhibit C5.3: Sample design in Georgia (educator survey)
Educator-Group Population Participants (Sample Estimate)
Educators of mathematics and mathematics pedagogy 42 41
General pedagogy educators 20 20
Educators of mathematics and mathematics pedagogy and general pedagogy 2 1
Total 64 62
note: Number of institutions participating in educator survey: 10.
Exhibit 5C.1: Sample design in Georgia (institution and future teacher surveys)
Route No. Program-Type Institutions Future Teachers
Population Participants Completed Population Participants (sample (future teacher IPQs (sample estimate) surveys) estimate)
Level: Primary
Concurrent 1 Bachelor in Pedagogy 9 9 9 636 485 (four years)
2 Bachelor in Pedagogy 1 1 1 23 21 (five years)
Total 2 9* 9* 10 659 506
Level: Lower secondary
Concurrent 3 Bachelor in Mathematics 5 5 5 99 69
4 Master’s in Mathematics 2 2 2 17 9
Total 2 6* 6* 7 116 78
note: *The numbers in the column do not add up to the total because some institutions were offering more than one program.

223APPENDICES
6. GERMANY
Introductory note
Applying the international sampling design and the TEDS-M definitions to the system of future teacher education in Germany was a particular challenge. Some background information on the structure of this system is essential in terms of understanding the modalities of and adaptations to the international sampling plan and TEDS-M definitions that were needed in order to implement the study successfully in Germany. Because the description of the system given here has been kept to a minimum, please refer to the section describing Germany’s teacher education system in the international report (Tatto et al., 2012) for more detailed information.
Teacher education in Germany is organized in two consecutive phases. The first phase is carried out at universities or teacher training colleges (Pädagogische Hochschule). Its duration is 3.5 to 4.5 years, and it focuses primarily on the transfer of theoretical knowledge. The second phase, lasting from 1.5 to 2.0 years, is carried out at Studienseminare or Ausbildungsschulen, which are relatively small units of teacher training. The focus of this second phase is primarily on the practice-oriented aspects of preparing for the teaching profession. Because every future teacher has to pass successfully through both phases before becoming a certified teacher, the future teachers targeted by TEDS-M (i.e., in their final year) could be found only in facilities offering the second phase of teacher training.
It is also important to understand that there is no direct link between institutions offering the first phase of education and those offering the second phase. This means that future teachers coming from one specific university can be found at any Studienseminar across the country. Completion of the first phase is awarded with a separate university degree, but this does not qualify an individual to teach at schools. What this means with respect to the classification of teacher education programs is that German teacher education must be regarded as consecutive even when parts of the professional training happen during the first phase.
The ministries of education in each of Germany’s federal states provide teacher education institutions with comprehensive instructions on the curriculum and modalities of future teacher education within the respective state, an occurrence which is especially valid for the second phase of teacher education. For this reason, TEDS-M considered the administrative units of the educational ministries of the federal states to be “institutions” in the sense of the TEDS-M definition. TEDS-M considered an expert panel, which included personnel from the respective educational ministry and personnel from universities or teacher training colleges within the federal state, to be the appropriate respondent to complete the institutional program questionnaires.
Although future teachers eligible for TEDS-M could be found only in the second-phase facilities, TEDS-eligible educators could be found in both types of institutions, that is, facilities offering the first or the second phase of teacher education. In fact, educators teaching mathematics could be found only in the first-phase facilities. To make the German educator population comparable to the one defined at the international level, all TEDS-eligible educators—no matter whether they were teaching in the first or the second phase—needed to have a positive selection probability. Implementation of the same approach used in the future teacher and institutional surveys (federal states = institutions) would have necessitated listing all TEDS-eligible educators per federal state. Alternatively, because all federal states were asked to participate, it could have meant compiling a comprehensive list of all educators in Germany.

THE TEACHER EDUCATION AND DEVELOPMENT STUDY IN MATHEMATICS (TEDS-M) TECHNICAL REPORT224
These approaches turned out to be practically impossible. As such, it was necessary to implement another two-stage sampling algorithm in order to select individuals for this part of the survey (for more details, see Section 6.4 in Chapter 6). The “institutions” that served as primary sampling units were now defined as the facilities offering the actual education (i.e., universities, teacher education colleges, Studienseminare, Ausbildungsschulen).
Due to the structure of the sample (and the German system of teacher education), there could be no linkage between the data collected from the populations of educators and the populations of future teachers.
Future Teacher Survey and Institution Surveys
Sample design: All 16 federal states were asked to participate in the study. Due to the specific institution definition for these parts of the assessment (see introductory note above), the design was equivalent to a census of institutions in the other TEDS-M participating countries. For simplicity, the term “institutions” used here always refers to the administrative units of the educational ministries of the federal states.
Future teachers in Germany who fitted the TEDS-M target population definition were allocated to six specific program-types:
• Primary with focus on mathematics (Type 1a)
• Primary without focus on mathematics (Type 1b)
• Primary and Secondary I with focus on mathematics (Type 2a)
• Primary and Secondary I without focus on mathematics (Type 2b)
• Secondary I with focus on mathematics (Type 3)
• Secondary II with focus on mathematics (Type 4).
As stated in the introductory note, all eligible future teachers could be found in the second-phase institutions (Studienseminare, Ausbildungsschulen). Future teachers belonging to different program-types could be found within these facilities. For example, in one Studienseminar, there were four future teachers in Program-Type 2a and 12 future teachers in Program-Type 3. In order to control the selection probabilities of future teachers belonging to the different types, the TEDS-M sampling team split the future teachers within the second-phase institutions into clusters, with the future teachers in each cluster belonging to a program-type that differed from the types in the other clusters. These clusters thus contained mutually exclusive and exhaustive groups of future teachers, each belonging to one program-type. They served as the secondary sampling units.
The goal of the sampling plan was to achieve a sample that represented the German population of TEDS-eligible future teachers within institutions and program-types in fairly even proportions. That meant taking each institution and then selecting a predefined number of clusters from each program-type, while simultaneously taking into account the varying number and size of the clusters within the institutions. All future teachers belonging to one cluster were asked to participate, and all selection procedures were in line with the international sampling design.
During TEDS-M, a randomized preselection of clusters for another ongoing national survey in Germany (CoActiv) took place in one institution (federal state). The IEA DPC selected a simple random sample of 11 Program-Type 3 clusters and 15 Program-Type 4 clusters for CoActiv from this institution in order to avoid any overlap between the CoActiv and TEDS-M surveys. The TEDS-M cluster sample was then selected out of the remaining nonsampled clusters.
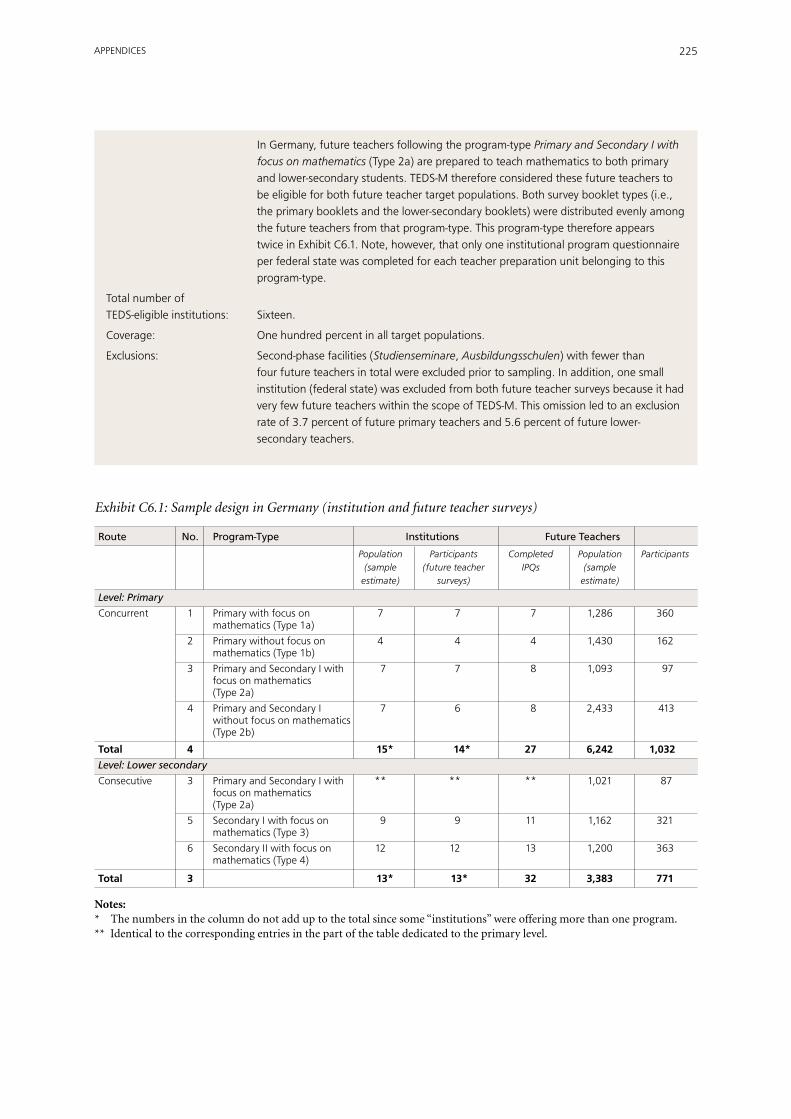
225APPENDICES
In Germany, future teachers following the program-type Primary and Secondary I with focus on mathematics (Type 2a) are prepared to teach mathematics to both primary and lower-secondary students. TEDS-M therefore considered these future teachers to be eligible for both future teacher target populations. Both survey booklet types (i.e., the primary booklets and the lower-secondary booklets) were distributed evenly among the future teachers from that program-type. This program-type therefore appears twice in Exhibit C6.1. Note, however, that only one institutional program questionnaire per federal state was completed for each teacher preparation unit belonging to this program-type.
Total number of TEDS-eligible institutions: Sixteen.
Coverage: One hundred percent in all target populations.
Exclusions: Second-phase facilities (Studienseminare, Ausbildungsschulen) with fewer than four future teachers in total were excluded prior to sampling. In addition, one small institution (federal state) was excluded from both future teacher surveys because it had very few future teachers within the scope of TEDS-M. This omission led to an exclusion rate of 3.7 percent of future primary teachers and 5.6 percent of future lower-secondary teachers.
Exhibit C6.1: Sample design in Germany (institution and future teacher surveys)
Route No. Program-Type Institutions Future Teachers
Population Participants Completed Population Participants (sample (future teacher IPQs (sample estimate) surveys) estimate)
Level: Primary
Concurrent 1 Primary with focus on 7 7 7 1,286 360 mathematics (Type 1a)
2 Primary without focus on 4 4 4 1,430 162 mathematics (Type 1b)
3 Primary and Secondary I with 7 7 8 1,093 97 focus on mathematics (Type 2a)
4 Primary and Secondary I 7 6 8 2,433 413 without focus on mathematics (Type 2b)
Total 4 15* 14* 27 6,242 1,032
Level: Lower secondary
Consecutive 3 Primary and Secondary I with ** ** ** 1,021 87 focus on mathematics (Type 2a)
5 Secondary I with focus on 9 9 11 1,162 321 mathematics (Type 3)
6 Secondary II with focus on 12 12 13 1,200 363 mathematics (Type 4)
Total 3 13* 13* 32 3,383 771
notes: * The numbers in the column do not add up to the total since some “institutions” were offering more than one program.** Identical to the corresponding entries in the part of the table dedicated to the primary level.

THE TEACHER EDUCATION AND DEVELOPMENT STUDY IN MATHEMATICS (TEDS-M) TECHNICAL REPORT226
Exhibit C6.2: Mapping program-types to groups defined for reporting purposes (Germany)
Program-Type Program-Group (Level: Primary) Program-Group (Level: Lower Secondary)
Primary with focus on mathematics Lower-primary generalist – (Type 1a) (Grade 4 maximum)
Primary without focus on mathematics Lower-primary generalist – (Type 1b) (Grade 4 maximum)
Primary and Secondary I with focus on Primary mathematics specialist Lower-secondary mathematics mathematics (Type 2a) (to Grade 10 maximum)
Primary and Secondary I without focus on Lower-primary generalist – mathematics (Type 2b) (Grade 4 maximum)
Secondary I with focus on mathematics – Lower-secondary mathematics (Type 3) (to Grade 10 maximum)
Secondary II with focus on mathematics – Upper-secondary mathematics as (Type 4) (to Grade 11 and above)
Educator Survey
Sample design: In conformity with the international sampling plan, TEDS-M implemented a two-stage sampling design for the German educator survey. All first- or second-phase facilities offering teacher education (universities, teacher education colleges, Studienseminare, Ausbildungsschulen) were considered to be primary sampling units. For simplicity, these facilities are referred to as institutions in the following explanation.
In order to accommodate the different structures and sizes of institutions offering the first or second phase of future teacher training, the TEDS-M sampling team explicitly stratified the sample into three different strata (see also Exhibit C6.3).
• The first stratum contained all institutions offering first-phase education.
• The second stratum contained two second-phase institutions that were relatively large. Both were selected with certainty.
• The third stratum contained all remaining second-phase institutions. Within this third stratum, a two-phase sample was selected in order to accommodate a special request from the TEDS-M national study center.
In each stratum, a simple random sample of institutions was selected. within almost all selected institutions, all TEDS eligible educators were asked to participate in the survey. In a few large institutions, a subsample of educators was selected.
The sample was furthermore implicitly stratified by federal states to ensure a fair allocation of the sample across the country.
Total number of TEDS-eligible institutions: Three hundred and eighty-two.
Coverage: One hundred percent.
Exclusions: Second-phase facilities (Studienseminare, Ausbildungsschulen) with fewer than four future teachers in total were excluded prior to sampling. This omission led to an exclusion rate of 27 percent for the second-phase institutions. The exclusion rate of educators, however, was estimated as being below two percent overall.

227APPENDICES
Exhibit C6.3: Explicit stratification and sample allocation in Germany (educator survey)
Explicit Stratum No. Stratum Size* Sample Size**
Institutions Institutions Educators
Phase 1 1 70 31 371
Phase 2—certainty institutions 2 2 1 10
Phase 2—non-certainty institutions 3 226 14 101
Total 3 298 46 482
notes: * As estimated on the sampling frame, after exclusions.** Participants.
Exhibit C6.4: Sample design in Germany (educator survey)
Educator-Group Population Participants (Sample Estimate)
Educators of mathematics and mathematics pedagogy 476 115
General pedagogy educators 2,444 225
Educators of mathematics and mathematics pedagogy and general pedagogy 1,022 142
Total 3,944 482
note: Number of institutions participating in educator survey: 46.

THE TEACHER EDUCATION AND DEVELOPMENT STUDY IN MATHEMATICS (TEDS-M) TECHNICAL REPORT228
7. MALAYSIA
Sample design: Census of institutions and samples of educators and future teachers within large institutions according to the international sampling plan.
Total number of: TEDS-eligible institutions Thirty.
Coverage: The program-type Bachelor of Education in Teaching of English as a Second Language with minor in mathematics offered by one institution was not covered. Future teachers in that program-type, however, would have been eligible for the primary population. A reduced coverage of 3.4 percent of institutions offering education to future primary teachers was the consequence. The respective percentage of under-coverage for future primary teachers was estimated as being below 5.0 percent.
Exclusions: None.
Particularities: The program-type Post-Graduate Diploma of Education (Mathematics), offered by two institutions, had no future teachers in the final year and was therefore not eligible for the TEDS-M survey.
Exhibit C7.1: Sample design in Malaysia (institution and future teacher surveys)
Route No. Program-Type Institutions Future Teachers
Population Participants Completed Population Participants (sample (future teacher IPQs (sample estimate) surveys) estimate)
Level: Primary
Concurrent 1 Malaysian Teaching Diploma 22 21 9 558 512 (Mathematics)
2 Bachelor of Education in 1 1 1 19 17 Primary Education
3 Diploma of Education 2 2 2 50 47 (Mathematics)
Total 3 24* 23 12 627 576
Level: Lower secondary
Consecutive 4 Bachelor of Education 1 1 2 82 43 (Mathematics), Secondary
5 Bachelor of Science with 6 5 6 521 346 Education (Mathematics), Secondary
Total 2 7 6 8 603 389
note: *The numbers in the column do not add up to the total because some institutions were offering more than one program.

229APPENDICES
Exhibit C7.2: Mapping program-types to groups defined for reporting purposes (Malaysia)
Program-Type Program-Group (Level: Primary) Program-Group (Level: Lower Secondary)
Malaysian Teaching Diploma Primary mathematics specialist – (Mathematics)
Bachelor of Education in Primary Education Primary mathematics specialist –
Diploma of Education (Mathematics) Primary mathematics specialist –
Bachelor Education (Mathematics), – Upper-secondary mathematics Secondary (to Grade 11 and above)
Bachelor of Science with Education – Upper-secondary mathematics (Mathematics), Secondary (to Grade 11 and above)
Exhibit C7.3: Sample design in Malaysia (educator survey)
Educator-Group Population Participants (Sample Estimate)
Educators of mathematics and mathematics pedagogy 270 165
General pedagogy educators 61 21
Educators of mathematics and mathematics pedagogy and general pedagogy 126 69
Total 457 255
note: Number of institutions participating in educator survey: 22.

THE TEACHER EDUCATION AND DEVELOPMENT STUDY IN MATHEMATICS (TEDS-M) TECHNICAL REPORT230
8. NORWAY
Sample design: Census of institutions and future teachers.
Total number of TEDS-eligible institutions: Forty-five.
Coverage: One hundred percent in the target populations of institutions and future teachers.
Exclusions: None.
Particularities: Faculties at universities offering specific program-types were considered to be institutions in the sense of the TEDS-M definition.
Because the individuals pertaining to program-types ALU—general teachers for primary and lower secondary, ALU—general teachers for primary and lower-secondary school with special program for mathematics, and Master’s—teachers in lower- and higher-secondary school were partly overlapping, analysis across these program-types was inappropriate. TEDS-M therefore strongly recommends that researchers conduct analyses separately for each program-type.
Although conducting a census of institutions, TEDS-M calculated the nonresponse adjustment of institutions within program-types.
Future teachers from one program-type (ALU—general teachers for primary and lower secondary) could not be reached in their final year because nearly all of them were spending this time outside the institutions. Therefore, future teachers from this program were tested (in deviation from the international study design) at the time when they were taking their compulsory mathematics courses. This period of study could occur within the future teachers’ fourth or sixth semester.
Future teachers following the program-types ALU—general teachers for primary and lower secondary and ALU—general teachers for primary and lower-secondary schools with special program for mathematics were being prepared to teach mathematics to primary and lower-secondary students. They were therefore considered to be eligible for both future teacher target populations. Both types of survey booklets (primary and lower secondary) were distributed evenly among the future teachers from these program-types. The two program-types therefore appear twice in Exhibit C8.1. Note, however, that only one institutional program questionnaire was completed for each teacher preparation unit belonging to these program-types.
The survey of educators was not implemented according to the international sampling procedures. TEDS-M therefore considered it to be a national option. Educator data from Norway are therefore not part of the international dataset.

231APPENDICES
Exhibit C8.2: Mapping program-types to groups defined for reporting purposes (Norway)
Program-Type Program-Group (Level: Primary) Program-Group (Level: Lower Secondary)
ALU—general teachers for primary and Primary/lower-secondary generalist Lower-secondary mathematics lower secondary (Grade 10 maximum) (to Grade 10 maximum)
ALU—general teachers for primary and Primary/lower-secondary generalist Lower-secondary mathematics lower secondary with special program for (Grade 10 maximum) (to Grade 10 maximum) mathematics
PPU—teachers in lower- and higher- – Upper-secondary mathematics secondary school (to Grade 11 and above)
Master’s—teachers in lower- and higher- – Upper-secondary mathematics secondary school (to Grade 11 and above)
Exhibit C8.1: Sample design in Norway (institution and future teacher surveys)
Route No. Program-Type Institutions Future Teachers
Population Participants Completed Population Participants (sample (future teacher IPQs (sample estimate) surveys) estimate)
Level: Primary
Concurrent 1 ALU—general teachers for 16 12 16 1,429 392 primary and lower secondary
2 ALU—general teachers for 16 14 16 433 159 primary and lower secondary with special program for mathematics
Total 2 32 26 32 * 551
Level: Lower secondary
Concurrent 1 ALU—general teachers for 16 10 ** 1,506 356 primary and lower secondary
2 ALU—general teachers for 16 13 ** 480 151 primary and lower secondary with special program for mathematics
Consecutive 3 PPU—teachers in lower- and 7 5 6 78 43 higher-secondary school
Concurrent 4 Master’s—teachers in lower- 6 5 5 28 22 and higher-secondary school
Total 4 45 33 43 * 572
notes: * Because of partly overlapping populations, a total could not be calculated. The amount of overlap is unknown.** Identical to the corresponding entries in the part of the exhibit dedicated to the primary level.

THE TEACHER EDUCATION AND DEVELOPMENT STUDY IN MATHEMATICS (TEDS-M) TECHNICAL REPORT232
9. OMAN
Sample design: Census of institutions, educators, and future lower-secondary teachers.
Total number of TEDS-eligible institutions: Seven.
Coverage: One hundred percent in the target populations of institutions, educators, and future lower-secondary teachers
Exclusions: None.
Particularities: No future primary teachers were being prepared at the time of the TEDS-M survey.
Exhibit C9.1: Sample design in Oman (institution and future teacher surveys)
Route No. Program-Type Institutions Future Teachers
Population Participants Completed Population Participants (sample (future teacher IPQs (sample estimate) survey) estimate)
Level: Lower secondary
Concurrent 1 Bachelor of Education, 1 1 1 36 30 four years
2 Educational diploma after 1 1 1 17 16 Bachelor of Science, six years
3 Bachelor of Education, 6 6 6 235 222 four years, colleges of education
Total 3 7* 7* 8 288 268
note: *The numbers in the column do not add up to the total because some institutions were offering more than one program.
Exhibit C9.2: Mapping program-types to groups defined for reporting purposes (Oman)
Program-Type Program-Group (Level: Primary) Program-Group (Level: Lower Secondary)
Bachelor of Education, four years – Upper-secondary mathematics (to Grade 11 and above)
Educational diploma after Bachelor of – Upper-secondary mathematics Science, six years (to Grade 11 and above)
Bachelor of Education, four years, – Upper-secondary mathematics colleges of education (to Grade 11 and above)
Exhibit C9.3: Sample design in Oman (educator survey)
Educator-Group Population Participants (Sample Estimate)
Educators of mathematics and mathematics pedagogy 64 51
General pedagogy educators 37 31
Educators of mathematics and mathematics pedagogy and general pedagogy 2 2
Total 103 84
note: Number of institutions participating in educator survey: seven.

233APPENDICES
10. PHILIPPINES
Sample design: Most institutions in the Philippines offering education to future mathematics teachers were very small compared to the corresponding institutions in the other participating TEDS-M countries. The institutions in the Philippines had, on average, 13 primary and 10 lower-secondary future teachers in their final year. About one half of the institutions were offering teacher education for both levels, while one fourth was offering education for the primary level only, and one fourth for the lower-secondary level only. Also, prior to sampling, a reliable measure of size was not available for about two thirds of all institutions. Furthermore, it was expected that a significant proportion of the institutions of an unknown size would not be eligible for TEDS-M (i.e., would not have future mathematics teachers in their final year). The sampling strategy considered these constraints in terms of the explanations provided in the following bullet points.
• Explicit stratification: Prior to sampling, the TEDS-M sampling team stratified the lists of institutions by overlap (institutions offering education to either future primary or future lower-secondary teachers only, or to both, respectively) and size measures. The resulting strata reflected the sizes of the institutions and their allocation to the different levels (see Exhibit C10.1). The first intention of a strictly proportional allocation of the sample across the explicit strata was abandoned because there was a high risk of losing, due to ineligibility, too many institutions in the strata that had institutions of unknown size. Consequently, the sample size in these strata was decreased slightly, but increased significantly in the other strata. The sample sizes were therefore larger than the minimum of 50 selected institutions per level.
• Implicit stratification: Prior to sample selection, the sampling team ordered the sampling frame by region within the explicit stratum. In all strata containing institutions of unknown size (Strata 2, 5, and 8), institutions were selected with equal probability. In the other strata, sampling with probability proportional to size was employed.
In total, 80 institutions were selected for the survey. Selected institutions offering education for both levels were selected for both levels. This led to a sample of 60 institutions per level. within two large institutions, the sampling team selected a sample of future teachers from each. In all other institutions, all eligible future teachers were asked to participate in the survey.
Total number of Four hundred and seventy-six institutions were listed on the sampling frame. During theTEDS-eligible institutions: process of contacting selected institutions, the sampling team found that 25 percent
of these institutions were ineligible for the TEDS-M survey. Consequently, the sample estimate of the number of TEDS-eligible institutions in the Philippines was relatively much smaller (289 institutions) than the number of institutions listed.
Coverage: One hundred percent in all target populations.
Exclusions: Very small institutions (i.e., fewer than five future primary teachers and fewer than three future lower-secondary teachers per institution) were excluded prior to sampling. This omission led to an exclusion rate of 7.4 percent of institutions, 2.1 percent of future primary teachers, and 1.7 percent of future lower-secondary teachers.
Particularities: Explicit Strata Number 2 (primary only—institutions of unknown size) and Number 5 (lower secondary only—institutions of unknown size) were dropped completely because almost all or all of the selected institutions in these strata turned out to be ineligible.

THE TEACHER EDUCATION AND DEVELOPMENT STUDY IN MATHEMATICS (TEDS-M) TECHNICAL REPORT234
Exhibit C10.1: Explicit stratification and sample allocation in the Philippines
Explicit Stratum No. Stratum Size* Sample Size**
Institutions Future teachers Institutions Future teachers
Level: Primary
Primary only—small institutions 1 16 211 2 14
Primary only—institutions of 2 127 1,651 0 0 unknown size
Primary and lower secondary— 6 33 268 3 19 small institutions
Primary and lower secondary— 7 39 1,046 20 416 large institutions
Primary and lower secondary— 8 109 1,417 8 143 institutions of unknown size
Total 5 324 4,593 33 592
Level: Lower secondary
Lower secondary only— 3 57 337 3 28 small institutions
Lower secondary only— 4 29 611 11 203 large institutions
Lower secondary only— 5 31 310 0 0 institutions of unknown size
Primary and lower secondary— 6 33 218 4 18 small institutions
Primary and lower secondary— 7 39 700 21 374 large institutions
Primary and lower secondary— 8 109 1,090 9 110 institutions of unknown size
Total 6 298 3,266 48 733
notes: * As estimated on the sampling frame, after exclusion.
Exhibit C10.2: Sample design in the Philippines (institution and future teacher surveys)
Route No. Program-Type Institutions Future Teachers
Population Participants Completed Population Participants (sample (future teacher IPQs (sample estimate) surveys) estimate)
Level: Primary
Concurrent 1 Bachelor in Elementary 171 33* 33 2,921 592 Education
Total 1 171 33 33 2,921 592
Level: Lower secondary
Concurrent 2 Bachelor in Secondary 252 48** 48 3,135 733 Education
Total 1 252 48 48 3,135 733
notes: * Of the 60 institutions selected, 19 were ineligible. ** Of the 60 institutions selected, 7 were ineligible.

235APPENDICES
Exhibit C10.3: Mapping program-types to groups defined for reporting purposes (Philippines)
Program-Type Program-Group (Level: Primary) Program-Group (Level: Lower Secondary)
Bachelor in Elementary Education Primary generalist (Grade 6 maximum) –
Bachelor in Secondary Education – Lower-secondary mathematics (to Grade 10 maximum)
Exhibit C10.4: Sample design in the Philippines (educator survey)
Educator-Group Population Participants (Sample Estimate)
Educators of mathematics and mathematics pedagogy 840 194
General pedagogy educators 1,309 279
Educators of mathematics and mathematics pedagogy and general pedagogy 698 116
Total 2,847 589
note: Number of institutions participating in the educator survey: 51.

THE TEACHER EDUCATION AND DEVELOPMENT STUDY IN MATHEMATICS (TEDS-M) TECHNICAL REPORT236
11. POLAND
Sample design: Census of institutions and samples of educators and future teachers.
Total number of TEDS-eligible institutions: One hundred and five.
Coverage: Consecutive programs were not covered, thus reducing the coverage rates to the following levels: 81.5 percent of institutions, 76.4 percent of future primary teachers, and 71.0 percent of future lower-secondary teachers. The coverage rate for educators could not be specified because Poland could not provide the needed information.
Exclusions: Four very small institutions were excluded (fewer than five future primary teachers and fewer than three future lower-secondary teachers, respectively, per institution). This omission led to the following exclusion rates: 3.8 percent of institutions, 3.0 percent of future primary teachers, and 0.4 percent of future lower-secondary teachers. The exclusion rate of educators was estimated as being below 5.0 percent.
Particularities: Many universities in Poland have two different departments, each of which offers one of the general routes—mathematics or pedagogy. TEDS-M considered these departments to be different institutions for three reasons:
1. In general, they operate independently from one another;
2. They tend to be located at different places;
3. The educators are associated with one of the departments only and teach only in exceptional instances in the “partner” department.
In a deviation from the international sampling plan, financial restrictions necessitated setting the maximum sample size to 30 future teachers per teacher preparation unit in all institutions.
Future teachers following the route mathematics, concurrent were being prepared to teach mathematics to primary and lower-secondary students. TEDS-M therefore considered them to be eligible for both future teacher target populations. Both survey booklet types (primary and lower secondary) were distributed evenly among the future teachers within the respective program-type. These program-types appear twice in Exhibit C11.1. Note, however, that only one institutional program questionnaire was completed for each teacher preparation unit.
TEDS-M considered the future teachers following the “second-cycle” programs to be out of scope for the TEDS-M core survey because they qualified as practicing teachers after completing their “first-cycle” studies. However, they were still surveyed according to the TEDS-M rules because in Poland very large proportions of first-cycle students enter the second-cycle programs before they enter the teaching profession, and ultimately contribute considerably to the country’s teaching force. TEDS-M deemed the survey of these teachers to be a national option. (For more information, see Exhibit C11.3.)

237APPENDICES
Exhibit C11.1: Sample design in Poland (institution and future teacher surveys)
Route No. Program-Type Institutions Future Teachers
Population Participants Completed Population Participants (sample (future teacher IPQs (sample estimate) surveys) estimate)
Level: Primary
Mathematics, 1 Mathematics (first-cycle 18 16 17 459 134 concurrent fulltime teacher education programs), three years
3 Mathematics (long-cycle 17 15 15 696 123 fulltime teacher education programs), five years
4 Mathematics (first-cycle 2 4 4 67 20 parttime teacher education programs), three years
6 Mathematics (long-cycle 5 4 3 91 23 parttime teacher education programs), five years
Pedagogy, 7 Pedagogy—integrated 33 27 26 1,206 510 integrated teaching (first-cycle fulltime teaching, programs), three years concurrent
9 Pedagogy—integrated 16 14 14 864 268 teaching (long-cycle fulltime programs), five years
10 Pedagogy—integrated 45 37 36 2,195 828 teaching (first-cycle parttime programs), three years
12 Pedagogy—integrated 12 10 10 566 206 teaching (long-cycle parttime programs), five years
Total 8 91* 78* 125 6,144 2,112
Level: Lower secondary
Mathematics, 1 Mathematics (first-cycle 19 15 17 497 135 concurrent fulltime teacher education programs), three years
3 Mathematics (long-cycle 16 13 15 700 122 fulltime teacher education programs), five years
4 Mathematics (first-cycle 5 4 4 73 23 parttime teacher education programs), three years
6 Mathematics (long-cycle 4 3 3 74 18 parttime teacher education programs), five years
Total 4 28* 23* 39 1,344 298
note: *The numbers in the column do not add up to the total because some institutions were offering more than one program.

THE TEACHER EDUCATION AND DEVELOPMENT STUDY IN MATHEMATICS (TEDS-M) TECHNICAL REPORT238
Exhibit C11.2: Mapping program-types to groups defined for reporting purposes (Poland)
Program-Type Program-Group (Level: Primary) Program-Group (Level: Lower Secondary)
Mathematics (first-cycle fulltime teacher Primary mathematics specialist Lower-secondary mathematics education programs), three years (to Grade 10 maximum)
Mathematics (long-cycle full-time teacher Primary mathematics specialist Upper-secondary mathematics education programs), five years (to Grade 11 and above)
Mathematics (first-cycle parttime teacher Primary mathematics specialist Lower-secondary mathematics education programs), three years (to Grade 10 maximum)
Mathematics (long-cycle parttime teacher Primary mathematics specialist Upper-secondary mathematics education programs), five years (to Grade 11 and above)
Pedagogy—integrated teaching Lower-primary generalist – (first-cycle fulltime programs), three years (Grade 4 maximum)
Pedagogy—integrated teaching (long-cycle Lower-primary generalist – fulltime programs), five years (Grade 4 maximum)
Pedagogy—integrated teaching (first-cycle Lower-primary generalist – parttime programs), three years (Grade 4 maximum)
Pedagogy—integrated teaching (long-cycle Lower-primary generalist – parttime programs), five years (Grade 4 maximum)
Exhibit C11.3: National option: sample design in Poland, second-cycle programs (institution and future teacher surveys)
Route No. Program-Type Institutions Future Teachers
Population Participants Completed Population Participants (sample (future teacher IPQs (sample estimate) surveys) estimate)
Level: Primary
2 Mathematics (second-cycle 7 6 6 139 33 fulltime teacher education programs), two years
5 Mathematics (second-cycle 7 6 7 279 60 parttime teacher education programs), two years
8 Pedagogy—integrated 6 4 5 122 72 teaching (second-cycle fulltime programs), two years
11 Pedagogy—integrated teaching 19 14 17 1,265 293 (second-cycle parttime programs), two years
Total 4 30* 23* 35 1,805 458
Level: Lower secondary
2 Mathematics (second-cycle 6 5 6 102 30 fulltime teacher education programs), two years
5 Mathematics (second-cycle 7 6 7 259 59 parttime teacher education programs), two years
Total 2 12* 9* 13 361 89
note: *The numbers in the column do not add up to the total because some institutions were offering more than one program.

239APPENDICES
Exhibit C11.4: Mapping program-types to groups defined for reporting purposes (Poland, national option)
Program-Type Program-Group (Level: Primary) Program-Group (Level: Lower Secondary)
Mathematics (second-cycle fulltime Primary mathematics specialist Upper-secondary mathematics teacher education programs), two years (to Grade 11 and above)
Mathematics (second-cycle parttime Primary mathematics specialist Upper-secondary mathematics teacher education programs), two years (to Grade 11 and above)
Pedagogy—integrated teaching (second- Lower-primary generalist – cycle fulltime programs), two years (Grade 4 maximum)
Pedagogy—integrated teaching (second- Lower-primary generalist – cycle parttime programs), two years (Grade 4 maximum)
Exhibit C11.5: Sample design in Poland (educator survey)
Educator-Group Population Participants (Sample Estimate)
Educators of mathematics and mathematics pedagogy 766 455
General pedagogy educators 386 255
Educators of mathematics and mathematics pedagogy and general pedagogy 28 24
Total 1,180 734
note: Number of institutions participating in educator survey: 72.

THE TEACHER EDUCATION AND DEVELOPMENT STUDY IN MATHEMATICS (TEDS-M) TECHNICAL REPORT240
12. RUSSIAN FEDERATION
Sample design: Of the 182 eligible institutions in the Russian Federation, 58 were selected for the survey, with selection probabilities proportional to their sizes. Future teacher enrollment data were used for the size measure. Sampled institutions offering education to both levels were sampled for both levels. This aspect of the sampling applied to 44 institutions. In addition, eight institutions offering education to future primary teachers and six institutions offering education to future lower-secondary teachers were selected. Up to four session groups were selected from the selected institutions and all future teachers within those groups were then asked to participate in the survey.
• Explicit stratification: Prior to sampling, the sampling frame was stratified by overlap between the levels. This process led to three explicit strata (see Exhibit C12.1).
• Implicit stratification: The sampling frame was ordered by type of institution (supporting organization) prior to sample selection. The different implicit strata were:
− Higher pedagogical institutions
− State universities
− Other higher institutions.
Total number of TEDS-eligible institutions: One hundred and eighty-two.
Coverage: So-called “secondary pedagogical institutions” were not covered because they were about to be phased out at the time of the TEDS-M survey. These institutions provided teacher education for the primary level only. No information was available about the proportion of future primary teachers enrolled in these institutions at the time of testing; also, exactly when these institutions would be phased out remained uncertain.
Exclusions: None.
Particularities: None.

241APPENDICES
Exhibit C12.3: Mapping program-types to groups defined for reporting purposes (Russian Federation)
Program-Type Program-Group (Level: Primary) Program-Group (Level: Lower Secondary)
Teacher of primary school Lower-primary generalist – (Grade 4 maximum)
Teacher of mathematics – Upper-secondary mathematics (to Grade 11 and above)
Exhibit C12.4: Sample design in the Russian Federation (educator survey)
Educator-Group Population Participants (Sample Estimate)
Educators of mathematics and mathematics pedagogy 2,404 920
General pedagogy educators 646 275
Educators of mathematics and mathematics pedagogy and general pedagogy 85 17
Total 3,135 1,212
note: Number of institutions participating in the educator survey: 56.
Exhibit C12.1: Explicit stratification and sample allocation in the Russian Federation
Explicit Stratum No. Stratum Size* Sample Size**
Institutions Future teachers Institutions Future teachers
Level: Primary
Primary only 1 61 3,186 8 248
Primary and lower secondary 3 101 12,432 41 2,018
Total 2 162 15,618 49 2,266
Level: Lower secondary
Lower secondary only 2 19 655 6 205
Primary and lower secondary 3 101 6,217 42 1,936
Total 2 120 6,872 48 2,141
notes: * As estimated on the sampling frame, after exclusion.** Participants in future teacher survey.
Exhibit C12.2: Sample design in the Russian Federation (institution and future teacher surveys)
Route No. Program-Type Institutions Future Teachers
Population Participants Completed Population Participants (sample (future teacher IPQs (sample estimate) surveys) estimate)
Level: Primary
Concurrent 1 Teacher of primary school 161 49 45 8,563 2,266
Total 1 161 49 45 8,563 2,266
Level: Lower secondary
Concurrent 2 Teacher of mathematics 116 48 43 5,915 2,141
Total 1 116 48 43 5,915 2,141

THE TEACHER EDUCATION AND DEVELOPMENT STUDY IN MATHEMATICS (TEDS-M) TECHNICAL REPORT242
13. SINGAPORE
Sample design: Census of institutions, educators, and future teachers.
Total number of TEDS-eligible institutions: One.
Coverage: One hundred percent in all target populations.
Exclusions: None.
Particularities: None.
Exhibit C13.1: Sample design in Singapore (institution and future teacher surveys)
Route No. Program-Type Institutions Future Teachers
Population Participants Completed Population Participants (sample (future teacher IPQs (sample estimate) surveys) estimate)
Level: Primary
Concurrent 1 Diploma in Education 1 1 1 53 45 (General, Primary), Option A
2 Diploma in Education 1 1 1 119 107 (General, Primary), Option C
3 Bachelor of Arts (Education), 1 1 1 33 31 Primary
4 Bachelor of Science 1 1 1 42 36 (Education), Primary
Consecutive 5 Postgraduate Diploma in 1 1 1 75 72 Education (Primary), Option A
6 Postgraduate Diploma in 1 1 1 102 89 Education (Primary), Option C
Total 6 1* 1* 6 424 380
Level: Lower secondary
Consecutive 7 Postgraduate Diploma in 1 1 1 111 105 Education (Secondary), January 2007 intake
8 Postgraduate Diploma in 1 1 1 67 50 Education (Secondary), teacher of lower-secondary mathematics, January 2007 intake
9 Postgraduate Diploma in 1 1 1 153 146 Education (Secondary), July 2007 intake
10 Postgraduate Diploma in 1 1 1 100 92 Education (Secondary), teacher of lower-secondary mathematics, July 2007 intake
Total 4 1* 1* 4 431 393
note: *The numbers in the column do not add up to the total because Singapore provided only one teacher preparation institution, offering all listed programs.

243APPENDICES
Exhibit C13.2: Mapping program-types to groups defined for reporting purposes (Singapore)
Program-Type Program-Group (Level: Primary) Program-Group (Level: Lower Secondary)
Diploma in Education (General, Primary), Primary mathematics specialist – Option A
Diploma in Education (General, Primary), Primary generalist (Grade 6 maximum) – Option C
Bachelor of Arts (Education), Primary Primary generalist (Grade 6 maximum) –
Bachelor of Science (Education), Primary Primary generalist (Grade 6 maximum) –
Postgraduate Diploma in Education Primary mathematics specialist – (Primary), Option A
Postgraduate Diploma in Education Primary generalist (Grade 6 maximum) – (Primary), Option C
Postgraduate Diploma in Education – Upper-secondary mathematics (Secondary), January 2007 intake (to Grade 11 and above)
Postgraduate Diploma in Education – Lower-secondary mathematics (Secondary), teacher of lower-secondary (to Grade 10 maximum) mathematics, January 2007 intake
Postgraduate Diploma in Education – Upper-secondary mathematics (Secondary), July 2007 intake (to Grade 11 and above)
Postgraduate Diploma in Education – Lower-secondary mathematics (Secondary), teacher of lower-secondary (to Grade 10 maximum) mathematics, July 2007 intake
Exhibit C13.3: Sample design in Singapore (educator survey)
Educator-Group Population Participants (Sample Estimate)
Educators of mathematics and mathematics pedagogy 30 25
General pedagogy educators 61 52
Educators of mathematics and mathematics pedagogy and general pedagogy
Total 91 77
note: Number of institutions participating in the educator survey: one.

THE TEACHER EDUCATION AND DEVELOPMENT STUDY IN MATHEMATICS (TEDS-M) TECHNICAL REPORT244
14. SPAIN (PRIMARY EDUCATION ONLY)
Sample design: Fifty institutions, with selection probabilities proportional to their size, were selected from the 72 institutions identified. A sample of educators and a sample of future teachers were selected from each of the selected institutions.
Total number of TEDS-eligible institutions: Seventy-two.
Coverage: One hundred percent in all target populations.
Exclusions: None.
Particularities: Identification of future teachers in their final year according to the TEDS-M definition turned out to be a particular challenge in Spain. First, future teachers in Spain are relatively free to decide in what order they complete their required courses. Second, large numbers of future teachers stay registered at the institutions (for a variety of reasons) by enrolling in a single course without actually attending it. These students were not deemed of interest to TEDS-M. The Spanish national sampling team, however, endeavored to compile an accurate and comprehensive list of future primary teachers within each selected institution who could be deemed of interest to TEDS-M. A student was considered as being in target if (i) he or she was registered in a minimum of two courses, and (ii) if he or she would qualify as a teacher on successfully completing these courses.
Exhibit C14.1: Sample design in Spain (institution and future teacher surveys)
Route No. Program-Type Institutions Future Teachers
Population Participants Completed Population Participants (sample (future teacher IPQs (sample estimate) surveys) estimate)
Level: Primary
Concurrent 1 Teacher of primary education 72 45 48 3,845 1,093
Total 1 72 45 48 3,845 1,093
Exhibit C14.2: Mapping program-types to groups defined for reporting purposes (Spain)
Program-Type Program-Group (Level: Primary) Program-Group (Level: Lower Secondary)
Teacher of primary education Primary generalist (Grade 6 maximum) –
Exhibit C14.3: Sample design in Spain (educator survey)
Educator-Group Population Participants (Sample Estimate)
Educators of mathematics and mathematics pedagogy 160 120
General pedagogy educators 586 400
Educators of mathematics and mathematics pedagogy and general pedagogy 24 13
Total 770 533
note: Number of institutions participating in educator survey: 46.

245APPENDICES
15. SWITZERLAND (GERMAN-SPEAKING PARTS ONLY)
Sample design: Census of institutions and future teachers and sample of educators.
Total number of TEDS-eligible institutions: Sixteen.
Coverage: One hundred percent in all target populations. The TEDS-M target population in Switzerland included only (but in actuality all) institutions where German was the primary language of use and instruction. The population did not include institutions operating in other national languages. within this restriction, full coverage was obtained in all target populations.
Exclusions: None.
Particularities: Because of specific data-protection requirements in Switzerland, TEDS-M collapsed some program-types within the publicly available datasets. Program-Type Numbers 1 and 2 were collapsed into a category called kindergarten/lower primary; Program-Type Numbers 3, 4, and 5 were collapsed into a category called primary.
Exhibit C15.1: Sample design in Switzerland, German-speaking parts only (institution and future teacher
surveys)
Route No. Program-Type Institutions Future Teachers
Population Participants Completed Population Participants (sample (future teacher IPQs (sample estimate) surveys) estimate)
Level: Primary
Concurrent 1 Teacher for kindergarten and 5 5 5 106 75 primary school (kindergarten and Grades 1–3)
2 Teacher for kindergarten and 2 2 2 54 46 primary school (kindergarten and Grades 1–3)
3 Teacher for kindergarten and 2 2 2 304 235 primary school (kindergarten and Grades 1–6)
4 Teacher for primary school 12 12 10 745 556 (Grades 1–6)
5 Teacher for primary school 2 2 2 43 24 (Grades 3–6)
Total 5 14* 14* 21 1,252 936
Level: Lower secondary
Concurrent 6 Teacher for secondary school 6 6 7 177 141
Total 1 6 6 7** 177 141
notes: * The numbers in the column do not add up to the total because some institutions were offering more than one program.** One institution specified two programs of the same type.

THE TEACHER EDUCATION AND DEVELOPMENT STUDY IN MATHEMATICS (TEDS-M) TECHNICAL REPORT246
Exhibit C15.2: Mapping program-types to groups defined for reporting purposes (Switzerland, German-
speaking parts only)
Program-Type Program-Group (Level: Primary) Program-Group (Level: Lower Secondary)
Teacher for kindergarten and primary Lower-primary generalist – school (kindergarten and Grades 1–2) (Grade 4 maximum)
Teacher for kindergarten and primary Lower-primary generalist – school (kindergarten and Grades 1–3) (Grade 4 maximum)
Teacher for kindergarten and primary Primary generalist (Grade 6 maximum) – school (kindergarten and Grades 1–6)
Teacher for primary school (Grades 1–6) Primary generalist (Grade 6 maximum) –
Teacher for primary school (Grades 3–6) Primary generalist (Grade 6 maximum) –
Teacher for secondary school I – Lower-secondary mathematics (to Grade 10 maximum)
Exhibit C15.3: Sample design in Switzerland, German-speaking parts only (educator survey)
Educator-Group Population Participants (Sample Estimate)
Educators of mathematics and mathematics pedagogy 77 51
General pedagogy educators 338 168
Educators of mathematics and mathematics pedagogy and general pedagogy 1 1
Total 416 220
note: Number of institutions participating in educator survey: 12.

247APPENDICES
16. THAILAND
Sample design: Census of institutions, educators, and future teachers.
Total number of TEDS-eligible institutions: Forty-six.
Coverage: One hundred percent in all target populations.
Exclusions: None.
Particularities: Because all future teachers in Thailand are prepared to teach mathematics to both primary and secondary students, TEDS-M considered them to be eligible for both future teacher target populations. Both types of survey booklet (primary and lower secondary) were distributed evenly among the future teachers. Both specified program-types therefore appear twice in Exhibit C16.1. Note that only one institutional program questionnaire was completed for each teacher preparation unit belonging to the respective program-type.
Thailand changed its former Bachelor of Education four-year program to a five-year
program after the 2007 class graduated. Therefore, in order to capture this cohort,
and in deviation from the international sampling plan, the survey was administered to
those future teachers following the program Bachelor of Education at the end of their
penultimate year.
Exhibit C16.1: Sample design in Thailand (institution and future teacher surveys)
Route No. Program-Type Institutions Future Teachers
Population Participants Completed Population Participants (sample (future teacher IPQs (sample estimate) surveys) estimate)
Level: Primary
Concurrent 1 Bachelor of Education 45 44 42 1,240 599
Consecutive 2 Graduate Diploma in 9 9 9 124 61 Teaching Profession
Total 2 46* 45* 51 1,364 660
Level: Lower secondary
Concurrent 1 Bachelor of Education ** ** ** 1,244 596
Consecutive 2 Graduate Diploma in ** ** ** 124 56 Teaching Profession
Total 2 ** ** ** 1,368 652
notes: * The numbers in the column do not add up to the total since some institutions were offering more than one program.** Identical to the corresponding entries in the part of the table dedicated to the primary level.

THE TEACHER EDUCATION AND DEVELOPMENT STUDY IN MATHEMATICS (TEDS-M) TECHNICAL REPORT248
Exhibit C16.2: Mapping program-types to groups defined for reporting purposes (Thailand)
Program-Type Program-Group (Level: Primary) Program-Group (Level: Lower Secondary)
Bachelor of Education Primary mathematics specialist Upper-secondary mathematics (to Grade 11 and above)
Graduate Diploma in Teaching Profession Primary mathematics specialist Upper-secondary mathematics (to Grade 11 and above)
Exhibit C16.3: Sample design in Thailand (educator survey)
Educator-Group Population Participants (Sample Estimate)
Educators of mathematics and mathematics pedagogy 138 121
General pedagogy educators 128 117
Educators of mathematics and mathematics pedagogy and general pedagogy 88 74
Total 354 312
note: Number of institutions participating in the educator survey: 43.

249APPENDICES
17. UNITED STATES OF AMERICA (PUBLIC INSTITUTIONS ONLY)
Sample design: The sampling frame contained all public teacher preparation institutions in the United States. Sixty institutions were selected from the 498 TEDS-eligible institutions, with selection probabilities proportional to their size. Selection was also based on the assumption that all institutions were offering education to both future primary teachers and future secondary teachers. All program-types of interest to TEDS-M from within the selected institutions were included.
Prior to sampling, the sampling frame was stratified explicitly by
• The Carnegie Foundation classification of higher education institutions:
− Type 1: Offering PhDs requiring a high level of research
− Type 2: Offering other PhDs
− Type 3: MA highest degree granted
− Type 4: BA/BSc highest degree granted.
• Middle school certification:
− 1: State grants this certification
− 0: State does not grant this certification.
• Carnegie Foundation size category:
− Large
− Medium/small
− All.
This process led to 10 explicit strata (see C17.1).
Total number of TEDS-eligible institutions: Four hundred and ninety-eight.
Coverage: One hundred percent in all target populations.
Public institutions accounted for 37 percent of the institutions in total and slightly more than 60 percent of the populations of future teachers, setting the sum of public and private institutions to 100 percent. The only routes covered within the public institutions were the concurrent and consecutive ones.
Exclusions: None.
Particularities: In deviation from the international sampling plan, financial restrictions made it necessary to set the maximum sample size to 30 future teachers per teacher preparation unit in all institutions.
In the USA, teachers following the program-types primary and secondary concurrent and primary and secondary consecutive are prepared to teach mathematics to both primary and lower-secondary students. TEDS-M therefore considered these future teachers to be eligible for both future teacher target populations. Both survey booklet types (i.e., primary and lower secondary) were distributed evenly among these future teachers. These program-types therefore appear twice in C17.2. Note that only one institutional program questionnaire was completed for each teacher preparation unit belonging to these program-types.
Because of extremely low participation rates in the target population of educators, educator data for the United States were neither weighted nor reported together with the educator data from the other participating countries.

THE TEACHER EDUCATION AND DEVELOPMENT STUDY IN MATHEMATICS (TEDS-M) TECHNICAL REPORT250
Exhibit C17.1: Explicit stratification and sample allocation in the United States
Explicit Stratum* No. Stratum Size** Sample Size***
Level: Primary Level: Lower secondary
Institutions Future
Institutions Future Institutions Future
teachers teachers teachers
Type1/Cert0/large 1 35 5,710 4 156 4 92
Type1/Cert1/large 2 27 4,385 4 96 4 76
Type2/Cert0/all 3 37 8,258 6 172 5 81
Type2/Cert1/all 4 60 9,019 7 206 6 67
Type3/Cert0/large 5 33 5,002 3 88 3 47
Type3/Cert0/medium–small 6 79 8,980 8 256 7 105
Type3/Cert1/large 7 23 4,315 4 112 4 37
Type3/Cert1/medium–small 8 120 11,247 10 310 10 70
Type4/Cert0/all 9 32 1,358 2 53 2 4
Type4/Cert1/all 10 52 2,368 3 52 1 28
Total 10 498 60,642 51 1,501 46 607
notes: * Full stratum names not available.** As estimated on the sampling frame. This estimation turned out to be highly inaccurate (compared with population estimates from sample data in Exhibit C17.2.).*** Participants in future teacher survey.
Exhibit C17.2: Sample design in the United States (institution and future teacher surveys)
Route No. Program-Type Institutions Future Teachers
Population Participants Completed Population Participants (sample (future teacher IPQs (sample estimate) surveys) estimate)
Level: Primary
Concurrent 1 Primary/concurrent 382 48 46 20,597 1,137
3 Primary and secondary/ 74 15 12 3,472 184 concurrent
Consecutive 4 Primary/consecutive 81 13 10 2,031 173
6 Primary and secondary/ 20 3 3 172 7 consecutive
Total 4 404* 51* 71 26,272 1,501
Level: Lower secondary
Concurrent 2 Secondary/concurrent 303 42 35 2,246 356
3 Primary and secondary/ 87 15 ** 4,036 161 concurrent
Consecutive 5 Secondary/consecutive 85 12 11 620 82
6 Primary and secondary/ 22 3 ** 196 8 consecutive
Total 4 327* 46* 61 7,098 607
note: * The numbers in the column do not add up to the total because some institutions were offering more than one program.** Identical to the corresponding entries in the part of the table dedicated to the primary level.
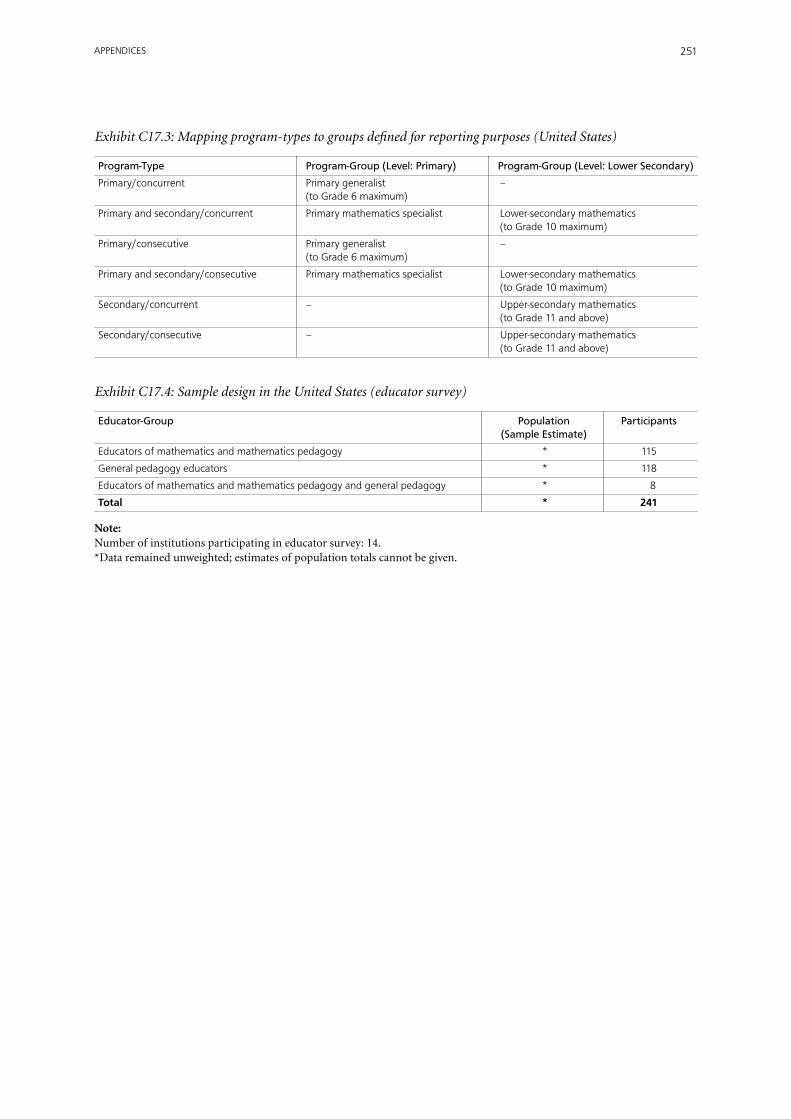
251APPENDICES
Exhibit C17.3: Mapping program-types to groups defined for reporting purposes (United States)
Program-Type Program-Group (Level: Primary) Program-Group (Level: Lower Secondary)
Primary/concurrent Primary generalist – (to Grade 6 maximum)
Primary and secondary/concurrent Primary mathematics specialist Lower-secondary mathematics (to Grade 10 maximum)
Primary/consecutive Primary generalist – (to Grade 6 maximum)
Primary and secondary/consecutive Primary mathematics specialist Lower-secondary mathematics (to Grade 10 maximum)
Secondary/concurrent – Upper-secondary mathematics (to Grade 11 and above)
Secondary/consecutive – Upper-secondary mathematics (to Grade 11 and above)
Exhibit C17.4: Sample design in the United States (educator survey)
Educator-Group Population Participants (Sample Estimate)
Educators of mathematics and mathematics pedagogy * 115
General pedagogy educators * 118
Educators of mathematics and mathematics pedagogy and general pedagogy * 8
Total * 241
note: Number of institutions participating in educator survey: 14.*Data remained unweighted; estimates of population totals cannot be given.

THE TEACHER EDUCATION AND DEVELOPMENT STUDY IN MATHEMATICS (TEDS-M) TECHNICAL REPORT252
253APPENDICES
APPENDIx D: TEDS-M Sampling Frame Questionnaire and Forms
TEDS-M includes a study of the routes of primary and lower-secondary mathematics teacher education in each participating country. By “route” we mean the sequence of opportunities to learn which lead future teachers to being considered fully qualified to teach in primary or lower-secondary school.
TEDS-M seeks to clearly identify routes in order to distinguish how they differ in major respects, such as the structure, the curriculum, the capabilities and backgrounds of their future teachers, and the grade levels and types of schools for which each route prepares graduates.
One reason we have to be clear about the routes in each country is that this is essential to comparability of analyses. In comparing routes across countries, we have to be able to distinguish easily, for example, between routes in which formal teacher education follows the completion of a university degree (known as consecutive routes) and routes in which formal teacher education and subject preparation are combined into a single program (concurrent routes).
Obtaining good information about routes however is not an easy task. In order to be able to compare across countries we need to first understand individual country situations.
This SAMPLING FRAME Questionnaire will be used by the International Study Centers to build the body of knowledge supporting TEDS-M and, in collaboration with our sub-contractors, the Sampling Team of the IEA Data Processing Center, to select the sample for this study in your country.
This sampling frame questionnaire will be complemented by a ROUTE Questionnaire to be sent later in July 2006.
Unless you nominate a sampling expert in your country to select the sample for this study, we will assume that TEDS-M will select the sample. We will do so using the information you are providing in this questionnaire, and if necessary, with further consultation with you.
PLEASE send preferably via e-mail the completed form to the MSU International Center ([email protected]) with a copy to the IEA Data Processing Center ([email protected]) no later than Friday, July 21st 2006.
Thank you very much for your prompt attention to this important questionnaire.
Warm regards,
Maria Teresa Tatto
Maria Teresa Tatto, Principal Investigator and Co-DirectorTeacherEducationStudyinMathematics(IEA/TEDS-M)International Study CenterAssociate ProfessorCollege of EducationMichigan State UniversityEastLansing,[email protected]
Tel.517.353.6418
TEDS-MSamplingFrameQuestionnaire,July3,2006Page 1 of 8
Appendix D TEDS-M 2008 SAMpLING FRAME Questionnaire
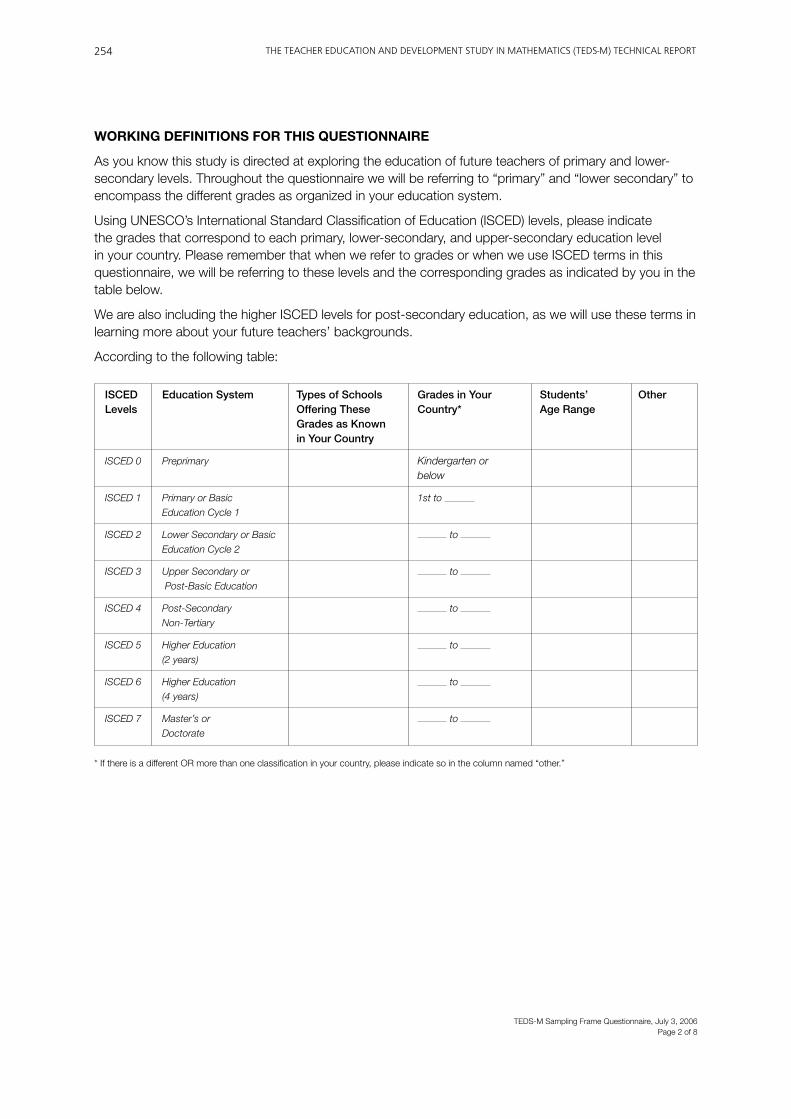
THE TEACHER EDUCATION AND DEVELOPMENT STUDY IN MATHEMATICS (TEDS-M) TECHNICAL REPORT254
WORKING DEFINITIONS FOR THIS QUESTIONNAIRE
As you know this study is directed at exploring the education of future teachers of primary and lower-secondary levels. Throughout the questionnaire we will be referring to “primary” and “lower secondary” to encompass the different grades as organized in your education system.
Using UNESCO’s International Standard Classification of Education (ISCED) levels, please indicate the grades that correspond to each primary, lower-secondary, and upper-secondary education level in your country. Please remember that when we refer to grades or when we use ISCED terms in this questionnaire, we will be referring to these levels and the corresponding grades as indicated by you in the table below.
We are also including the higher ISCED levels for post-secondary education, as we will use these terms in learning more about your future teachers’ backgrounds.
According to the following table:
ISCED Education System Types of Schools Grades in Your Students’ Other Levels Offering These Country* Age Range Grades as Known in Your Country
ISCED 0 Preprimary Kindergarten or below
ISCED 1 Primary or Basic 1st to
Education Cycle 1
ISCED 2 Lower Secondary or Basic to
Education Cycle 2
ISCED 3 Upper Secondary or to
Post-Basic Education
ISCED 4 Post-Secondary to
Non-Tertiary
ISCED 5 Higher Education to
(2 years)
ISCED 6 Higher Education to
(4 years)
ISCED 7 Master’s or to Doctorate
* If there is a different OR more than one classification in your country, please indicate so in the column named “other.”
TEDS-MSamplingFrameQuestionnaire,July3,2006Page 2 of 8

255APPENDICES
TEDS-MSamplingFrameQuestionnaire,July3,2006Page3tof8
SECTION ONE—GENERAL INFORMATION
Country
Name of the individual
answering this questionnaire:
Individual’s email:
Individual’s telephone:
Individual’s fax:
Sources used in answering questionnaire (check all that apply):
Official government statistics Research documents
Other official documents Other documents
First-hand knowledge of person responsible Interviews
for answering this questionnaire
Other (please specify)
SECTION TWO—BACKGROUND (including overall statistics for use in calculating the relative size of each route)
1) What is the total number of ISCED 1 school teachers in your country (all routes, all systems or jurisdictions)? NOTE: If the exact data is not available, please estimate as best as you can, and
indicate your basis for the estimate in a footnote.
1a) What is the lowest grade level included in this statistic?
1b) What is the highest grade level included in this statistic?
2) What is the total number of ISCED 2 school teachers in your country (all routes, all systems or jurisdictions)? NOTE: If the exact data is not available, please estimate as best as you can, and indicate your basis for the estimate in a footnote.
2a) What is the lowest grade level included in this statistic?
2b) What is the highest grade level included in this statistic?
3) Pleasegivethesource(s)ofthesestatistics:

THE TEACHER EDUCATION AND DEVELOPMENT STUDY IN MATHEMATICS (TEDS-M) TECHNICAL REPORT256
Please break down these numbers of ISCED 1 and ISCED 2 school teachers by school and grade level if available and write this information in the indicated space or “cell.” Please indicate, when appropriate, the number of school teachers teaching only mathematics or mathematics plus other subjects. Please usetherowsand/orcolumnsrelevanttoyourcountry;crossouttheunusedrowsorcolumns.Ifa“cell”giveninaspecificcolumn/rowisnotrelevantforyourcountrysituation,pleasemarkwith“NR.”Ifthedatarequested is not available, please write down “NA.”
Standardized Student Age Number of Total Number Number of Number of Name and Name Range Schools of Teachers Teachers Who Teachers WhoGiven in Your Only Teach Teach Country Mathematics Mathematics plus Other Subjects
Grade 1
Grade 2
Grade3
Grade 4
Grade 5
Grade 6
Grade 7
Grade 8
Grade 9
Grade 10
Other
Notes:
(a) Some schools may offer both ISCED 1 and ISCED 2 education; they should be counted in each level.
(b)Pleasefeelfreetomakeasmanycommentsasyouneedtohelpexplain/clarifythesituationinyourcountry.Useasmanyadditionalpagesas
necessary and attach them to this document when sending it to us.
TEDS-MSamplingFrameQuestionnaire,July3,2006Page 4 of 8

257APPENDICES
TEDS-MSamplingFrameQuestionnaire,July3,2006Page 5 of 8
No
tes:
*P
leas
ead
das
man
yro
ws
asn
eede
d.In
sert
cla
rifica
tion
com
men
tso
rad
ditio
nali
nfor
mat
ion
info
otno
tes.
For
any
cel
lwhi
chd
oes
nota
pply
toth
ero
ute
inq
uest
ion,
ent
erN
/Afo
r“N
otA
pplic
able
.”
** T
his
incl
udes
tota
l num
ber
of fu
ture
teac
hers
who
will
teac
h m
athe
mat
ics
as w
ell a
s th
ose
who
will
teac
h m
athe
mat
ics
plus
oth
er s
ubje
cts.
SE
CT
ION
TH
RE
E—
LIS
T O
F R
OU
TE
SId
entif
y al
l Tea
cher
Ed
ucat
ion
Ro
utes
with
in t
he C
oun
try
*
TE
DS
-M S
AM
pLI
NG
FR
AM
E Q
UE
ST
ION
NA
IRE
#
Nam
e of
rout
e R
oute
Im
port
ant
Num
ber
of
Num
ber
of fu
ture
M
ath
Num
ber
of fu
ture
M
ath
Gra
des
qual
ified
to te
ach
Sch
ool t
ypes
type
to
TE
DS
-M
inst
itutio
ns
teac
hers
in la
st y
ear
of
only
? te
ache
rs in
last
yea
r of
on
ly?
Le
ngth
in a
cade
mic
trai
ning
who
will
teac
h
trai
ning
who
will
teac
h
y
ears
(app
rox)
:
mat
hem
atic
s**
m
athe
mat
ics*
*
[O
ne a
cade
mic
yea
r =
=
#
Pro
port
ion
of th
e co
untr
y
Pro
port
ion
of th
e co
untr
y
m
onth
s/12
mon
ths
to
talI
SC
ED
1fu
ture
tota
lIS
CE
D2
futu
re
ca
lend
ar y
ear]
te
ache
rs tr
aine
d in
teac
hers
trai
ned
in
th
is ro
ute
th
is ro
ute
ISC
ED
1
ISC
ED
1
IS
CE
D 2
IS
CE
D 2
ISC
ED
1
ISC
ED
2
nu
mbe
r pe
rcen
t
num
ber
perc
ent
Nam
e
#
Year
s
Nam
e
#
Year
s
Nam
e
#
Year
s
Nam
e
#
Year
s
Nam
e
#
Year
s
Nam
e
#
Year
s
Nam
e
#
Year
s
Nam
e
#
Year
s
TOTA
LS
CO
UN
TRY
NA
ME
:

THE TEACHER EDUCATION AND DEVELOPMENT STUDY IN MATHEMATICS (TEDS-M) TECHNICAL REPORT258
TEDS-MSamplingFrameQuestionnaire,July3,2006Page 6 of 8
DEFINITIONS AND INSTRUCTIONS FOR COMpLETING THE TABLE ABOVE
An example using an imaginary country (we are calling this country “xyz”) showing how to fill out the table provided above is included on page 8 of this document.
As you fill out the table, please enter the required information for each route, whether concurrent, consecutive, or apprenticeship, and whether it applies only to primary education, only to secondary education, or to both.
Please list all the routes in your country that prepare teachers who will teach mathematics in primary or lower-secondary school, regardless of their sizes, and regardless of whether the graduates will teach other subjects (in addition to mathematics) or not.
Completing the table
• TEDS route number: Please assign a consecutive number to the route starting with “1” for the first row, “2” for the second row, etc. After we get this information from the NRCs, TEDS-M will assign a TEDS-M Route ID, including the numbers you assign here (TR – country_name - number) to the routes elected for further study within a given country and for which additional information will be required.
• Name by which route is called in your country: List national terminology as well as English translation. If the route is commonly known with more than one name, include each of the most commonly used names. If the name is too lengthy for the table, use footnotes.
• Length of route in academic years: Write down how many academic years long is a particular route. If it varies, please give an approximate range. To have comparability please tell us how long is an academic year in your context by using the standard calendar year of 12 months (e.g., 9months/12monthscalendaryear).
• Route type: Classify the route(s) in your country according to the following definitions. Use the suggested abbreviations: concurrent = CONCUR, consecutive = CONSEC, and apprenticeship = APPREN.
− Concurrent routes: If a route consists of a single program that includes studies in the subjects future teachers will be teaching (academic studies), studies of pedagogy and education (professional studies), and practical experience in the classroom, the route is a concurrent route. CODE: CONCUR
− Consecutive routes: If the route consists of a first phase for academic studies (leading to a degree or diploma), followed by a second phase of professional studies and practical experience (leadingtoaseparatecredential/qualification),therouteisaconsecutive route. Thus, no route can be considered consecutive if the institution or government authorities do not award a degree, diploma, or official certificate at the end of the first phase. Moreover, it may be customary or required for future teachers to do the first and second phases in different institutions. CODE: CONSEC
− Apprenticeship routes: If the route consists predominantly of school-based experience with other institutions playing only a minor, marginal, supporting role, the route is an apprenticeship route. CODE: APPREN
• Importance of route to TEDS-M: As your country’s NRC, make a judgment about the importance of collecting data from this route in TEDS-M. If you are sure that the route should be included in TEDS-M either because of the number of graduates or because it has special importance as a reform or exemplary program, enter “Y” for “yes.” If you are sure it should not be included because it has none of these attributes, enter “N” for “no.” If you are unsure, enter “P” for “perhaps.”

259APPENDICES
• Number of institutions: Enter the number of teacher education institutions that offer the professional education component of this route. For concurrent routes, this means the institution which offers professional education after the academic studies component (typically it would be the same institution). For consecutive routes, this is the institution which offers the second phase of purely professional education (or so-called “second institution”); we will not be sampling anyone in the so-called “first institution” where future teachers do their academic studies only. Therefore, at this point we do not need information from this first institution. By institution, we mean the school, university, or other organization which offers courses or otherwise organizes the training of co-located groups of future teachers (hence, in multi-campus institutions, each campus with a different group of future teachers should be counted as a separate institution). Some institutions may offer more than one route; they should be counted separately in each of these routes. In the case of apprenticeship routes leave this column blank, since the definition of institutions offering such routes can differ radically across countries. Please total the number of institutions in the last row of the table.
• Number of future teachers in their last year of training who will teach mathematics: This includes the total number of future teachers who will teach mathematics and mathematics plus other subjects in their last year of training. If this number is not available, please enter the number of future teachers graduating the year before. If exact statistics are not available, please estimate as best you can; you may use, for instance, total enrolments. Explain these estimates with footnotes. Please total the number of future teachers in the last row of the table.
• Proportion of the country total ISCED 1 and ISCED 2 trained in this route (percent): In addition please indicate the proportion these teachers represent in relation to the total number of future teachers trained in the country at the ISCED 1 or ISCED 2 levels. Please total the percent of teachers trained in the last row of the table.
• Mathematics only? Enter “Y” for “yes” if the route is exclusively devoted to the production of teachers who are preparing to be mathematics specialists; enter “N” for “no” if the route produces teachers who will normally teach at least one other subject-matter in addition to mathematics. We need this information for both ISCED 1 and ISCED 2 future teachers.
• Grades qualified to teach: Insert the grade levels that persons completing the route are qualified to teach. Use both the national numbering system and an international numbering with the first grade of primary school numbered “1,” second grade “2,” and so on through the end of secondary school (even though the study focuses on lower-secondary school, we need to know whether the route prepares for upper-secondary school as well).
• School types: List all school types for which this route prepares teachers. If the terminology is lengthy, use abbreviations and provide a key. In the key give both the national terminology and English translation. In the table underline the name or abbreviation of the school type which receives the most graduates from this route.
• TOTAL: Please total the columns only for the shaded boxes in this row [includes the following columns: “Number of institutions”; “Number of future teachers in their last year of training who will teach mathematics”; and “Proportion of the country total ISCED 1 and ISCED 2 future teachers trained in this route (expressed as percent)”].
TEDS-MSamplingFrameQuestionnaire,July3,2006Page 7 of 8
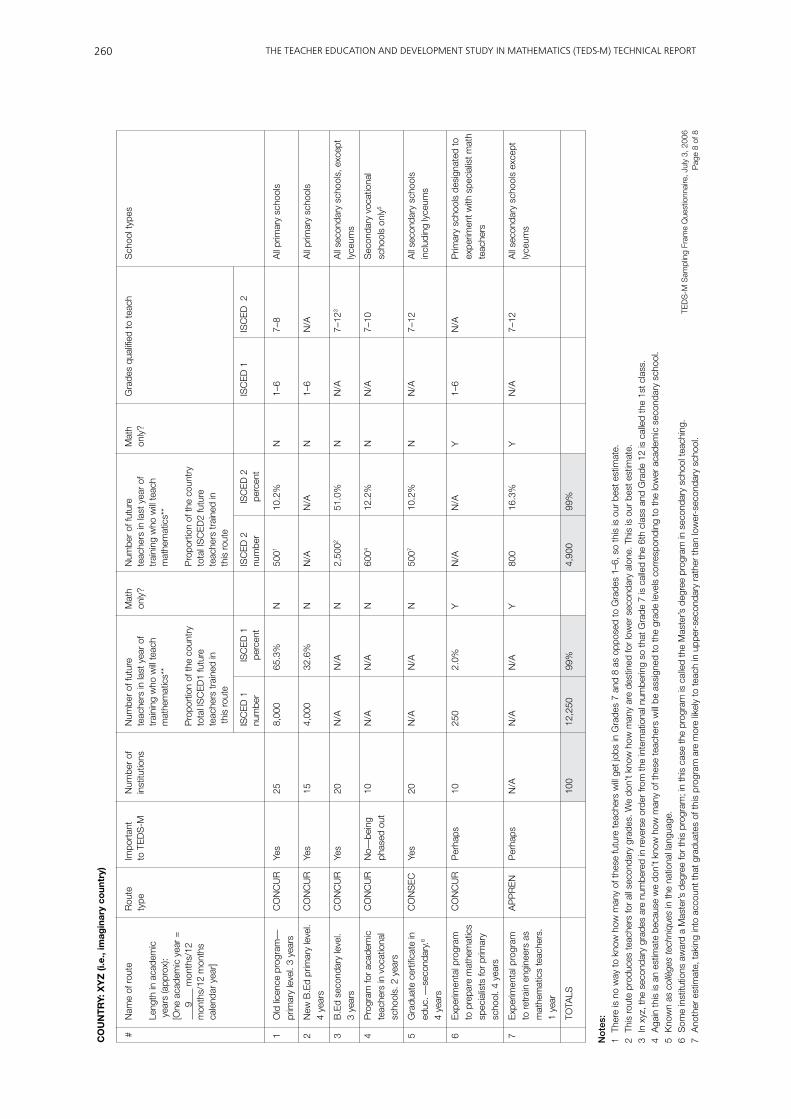
THE TEACHER EDUCATION AND DEVELOPMENT STUDY IN MATHEMATICS (TEDS-M) TECHNICAL REPORT260
No
tes:
1
Ther
e is
no
way
to k
now
how
man
y of
thes
e fu
ture
teac
hers
will
get j
obs
in G
rade
s 7
and
8 as
opp
osed
to G
rade
s 1–
6, s
o th
is is
our
bes
t est
imat
e.2
This
rout
e pr
oduc
es te
ache
rs fo
r al
l sec
onda
ry g
rade
s. W
e do
n’t k
now
how
man
y ar
e de
stin
ed fo
r lo
wer
sec
onda
ry a
lone
. Thi
s is
our
bes
t est
imat
e.3
Inx
yz,t
hes
econ
dary
gra
des
are
num
bere
din
reve
rse
orde
rfro
mth
ein
tern
atio
naln
umbe
ring
soth
atG
rade
7is
cal
led
the
6th
clas
san
dG
rade
12
isc
alle
dth
e1s
tcla
ss.
4 A
gain
this
is a
n es
timat
e be
caus
e w
e do
n’t k
now
how
man
y of
thes
e te
ache
rs w
ill be
ass
igne
d to
the
grad
e le
vels
cor
resp
ondi
ng to
the
low
er a
cade
mic
sec
onda
ry s
choo
l.5
Kno
wn
as c
ollè
ges
tech
niqu
es in
the
natio
nal l
angu
age.
6 S
ome
inst
itutio
ns a
war
d a
Mas
ter’s
deg
ree
for
this
pro
gram
; in
this
cas
e th
e pr
ogra
m is
cal
led
the
Mas
ter’s
deg
ree
prog
ram
in s
econ
dary
sch
ool t
each
ing.
7 A
noth
er e
stim
ate,
taki
ng in
to a
ccou
nt th
at g
radu
ates
of t
his
prog
ram
are
mor
e lik
ely
to te
ach
in u
pper
-sec
onda
ry r
athe
r th
an lo
wer
-sec
onda
ry s
choo
l.
#
Nam
e of
rout
e R
oute
Im
port
ant
Num
ber
of
Num
ber
of fu
ture
M
ath
Num
ber
of fu
ture
M
ath
Gra
des
qual
ified
to te
ach
Sch
ool t
ypes
type
to
TE
DS
-M
inst
itutio
ns
teac
hers
in la
st y
ear
of
only
? te
ache
rs in
last
yea
r of
on
ly?
Le
ngth
in a
cade
mic
trai
ning
who
will
teac
h
trai
ning
who
will
teac
h
y
ears
(app
rox)
:
mat
hem
atic
s**
m
athe
mat
ics*
*
[O
ne a
cade
mic
yea
r =
9
m
onth
s/12
Pro
port
ion
ofth
eco
untr
y
Pro
port
ion
ofth
eco
untr
y
m
onth
s/12
mon
ths
to
talI
SC
ED
1fu
ture
tota
lIS
CE
D2
futu
re
ca
lend
ar y
ear]
te
ache
rs tr
aine
d in
teac
hers
trai
ned
in
th
is ro
ute
th
is ro
ute
ISC
ED
1
ISC
ED
1
IS
CE
D 2
IS
CE
D 2
ISC
ED
1
ISC
ED
2
nu
mbe
r pe
rcen
t
num
ber
perc
ent
1
Old
lice
nce
prog
ram
—
CO
NC
UR
Ye
s25
8,
000
65.3
%
N
5001
10
.2%
N
1–
6 7–
8 A
ll pr
imar
y sc
hool
s
pr
imar
yle
vel.
3ye
ars
2
New
B.E
dpr
imar
yle
vel.
C
ON
CU
R
Yes
15
4,00
032
.6%
N
N
/A
N/A
N
1–
6N
/A
All
prim
ary
scho
ols
4 ye
ars
3
B.E
dse
cond
ary
leve
l.
CO
NC
UR
Ye
s20
N
/A
N/A
N
2,
5002
51
.0%
N
N
/A
7–12
3
All
seco
ndar
y sc
hool
s, e
xcep
t
3ye
ars
lyce
ums
4
Pro
gram
for
acad
emic
C
ON
CU
R
No—
bein
g10
N
/A
N/A
N
60
04
12.2
%
N
N/A
7–
10
Sec
onda
ryv
ocat
iona
l
teac
hers
in v
ocat
iona
l
phas
ed o
ut
sc
hool
s on
ly5
sc
hool
s. 2
yea
rs
5
Gra
duat
ece
rtifi
cate
in
CO
NS
EC
Ye
s20
N
/A
N/A
N
50
07
10.2
%
N
N/A
7–
12
All
seco
ndar
ysc
hool
s
ed
uc.—
seco
ndar
y.6
incl
udin
g ly
ceum
s
4
year
s
6
Exp
erim
enta
lpro
gram
C
ON
CU
R
Per
haps
10
25
02.
0%
Y
N/A
N
/A
Y
1–6
N/A
P
rimar
ysc
hool
sde
sign
ated
to
to p
repa
re m
athe
mat
ics
expe
rimen
t with
spe
cial
ist m
ath
sp
ecia
lists
for
prim
ary
teac
hers
sc
hool
. 4 y
ears
7
Exp
erim
enta
lpro
gram
A
PP
RE
N
Per
haps
N
/A
N/A
N
/A
Y
800
16.3
%
Y
N/A
7–
12
All
seco
ndar
ysc
hool
sex
cept
to re
trai
n en
gine
ers
as
ly
ceum
s
m
athe
mat
ics
teac
hers
.
1 ye
ar
TOTA
LS
100
12,2
50
99%
4,90
0 99
%
CO
UN
TR
Y: X
YZ
(i.e
., im
agin
ary
coun
try)
TED
S-M
Sam
plin
gFr
ame
Que
stio
nnai
re,J
uly
3,2
006
Pag
e 8
of 8

261APPENDICES
APPENDIx E: Mobilizing National Support and Recruiting Institutions
The success of TEDS-M relied on national-level commitment. Because TEDS-M was the first study of higher education institutions using national representative samples ever attempted, few guidelines existed to help NRCs gain access to sample institutions and secure high survey response rates. The international research center (ISC) at Michigan State University therefore drafted the following instructions to the NRCs. These instructions were sent to each NRC after the third TEDS-M NRC meeting in Taipei, June 2007.
Instructions Sent to NRCs to Gain Access to and Secure High Response Rates
Organizing the Campaign to Support TEDS-M at the national Level
What is needed is a national campaign to emphasize the value and importance of TEDS-M and to encourage participation at the institutional and individual respondent level. The purpose is not only to get support for the study, but also to create a sense of ownership for the study among the leaders and decision-makers of teacher education.
We know that the same approach will not work in every country because
countries differ in:
• Customaryproceduresfordoingsocialandeducationalresearch
• Culturalnormsforhowtoworkwithindividuals,associations,and
organizations
• Organizationofhighereducation
• Sizeandheterogeneityofthecountry.
If the ministry responsible for tertiary education in your country requires every selected institution to participate in the study, obtaining permission for the survey administration is probably straightforward. But will it ensure the cooperation needed for high response rates? Getting sufficiently high response rates from educators and future teachers will take willing and enthusiastic participation by institutions, not just minimal compliance.
Moreover, higher education institutions in much of the world operate with a great deal of autonomy and are likely to feel that they can, if they wish, refuse to participate in any survey of higher education which they do not think is in their interest. It is essential in such cases that you prepare very carefully to obtain the cooperation of the institutions in the sample. This can be a long and challenging process. In fact, if you have not started this process already, the timeline needed will be very tight.
Before approaching institutions, it is often necessary to obtain the permission of state/provincial as well as national authorities. Often, the higher-level authorities give permission in such situations, with the understanding that it is ultimately the decision of each sampled institution as to whether or not to participate.

THE TEACHER EDUCATION AND DEVELOPMENT STUDY IN MATHEMATICS (TEDS-M) TECHNICAL REPORT262
Issues to be addressed in planning your campaign include:
• Whatandwhocangivethestudycredibilityandappealamongrespondent
groups?
• Whatwillhelprespondentgroupsfeelasenseofownershipforthestudy?
• WhatmeasurescanNRCstaketomakeallthishappen?Whathastobedoneto
get the support of all these individuals and groups?
• Howcansuchpersonsandorganizationsbemoreinvolvedinthestudythrough
advisory panels, expert panels, consultancies, etc?
• Whowillbeassignedspecificresponsibilitytotakethemeasuresnecessaryfora
successful campaign?
In particular, you should make a checklist of the authorities, leaders, and
organizations at the national level that could support the study. In federalized
countries, this effort will need to be directed at state/provincial leadership in
teacher education as well. These include:
• Relevantministryauthorities
• Influentialprofessionalassociationswithindividualmembership,suchas
associations of mathematicians, mathematics educators, teacher educators,
educational researchers, and teachers of mathematics at the secondary level
• Influentialorganizationswithinstitutionalmembershipsuchasassociations
of universities, faculties of education, teacher training colleges, state/provincial
education ministers and agencies
• Teacherunionsatalllevels
• Well-knownresearchersandpractitionersinmathematicseducationand
teacher education more generally. If possible, get supporters on both sides of
contentious teacher education and mathematics education debates.
Focus Groups
It is not enough to work with mathematicians and mathematics educators in getting support for this study. Faculties of education and teacher training colleges alike are most often run by people from other specialties or backgrounds. They have to be convinced that the study has value.
We have recommended a written plan as a way of working out a realistic, manageable schedule of activities. The plan should include any special meetings or conferences that are needed to publicize the study and to mobilize different target groups to support the study.
Hence, taking a draft plan to persons familiar with the respondent groups and theinfluentialleadersofthesegroupswillhelpyoulearnabouthowperceptionsof the study vary among leaders of these groups and how they differ from those of the NRC team. If the meeting of experts and organizational representatives proves useful in formulating a plan for obtaining cooperation, it can be continued as an informal advisory board or panel to facilitate cooperation and ultimately dissemination throughout the study.

263APPENDICES
The best way to invite the views of stakeholders and respondents at this stage may
be to use focus groups. For best results, the groups should be small and relatively
homogeneous. If a focus group is too heterogeneous in terms of background and
position of participants, the participants will be less candid and even less willing
to talk. Thus, groups might be constituted as follows:
• Groupofnationalleadersinmathematicseducation
• Groupofnationalleadersinteachereducation
• Groupofkeyrepresentativesofinstitutionsthatparticipatedinthefieldtrial
• Othergroupsofequalimportanceandinfluence
• Group(s)offutureteachers.
Within the focus group, pick one or more of the following artifacts to discuss;
ones that you think would get the most relevant, extensive and candid discussion
within the group:
• Yourdraftplantoobtaincooperation
• Yourdraftletterinvitinginstitutionstoparticipate
• APowerPointpresentationand/orabrochuredescribingthestudy.
Be sure to discuss perceptions of how the study is being managed with the focus groups and other respondents. Does the NRC’s institution have sufficient credibility and legitimacy in higher education in general and teacher education in particular to be seen as the appropriate coordinating agency for the study? Is there a need to involve other institutions in overseeing and coordinating the study, especially if the study involves more than one route of teacher education or different types of teacher education institutions?
Use of Field Trial Results
Use the results of the field trial in developing your plan and campaign. In the earlier version of this manual, you were asked to develop a first draft of this plan for obtaining cooperation and acceptable response rates in this field trial. Use the field trial results for feedback on how best to approach institutions in the main study. It should have been easier to line up the institutions in the field trial than in the main study. In most cases, field trial institutions were fewer and they were chosen as a convenience rather than a probability sample or a census. Thus, in the field trial, you were perhaps able to get sufficient cooperation simply by using personal relationships between members of the NRC team and the chosen institutions.
Such personal relationships can prove very important in obtaining cooperation from institutions in the main study as well, but in the latter case it may be necessary to get cooperation from institutions where there are no personal relationships that could help. Thus, every aspect of getting institutional cooperation should be scrutinized at the main study stage and improved if possible. In particular, the Field Trial was an opportunity to find out if the arguments made for the benefits of the study to participating institutions are convincing or not. Also, if the initial group of experts and organizational representatives chosen to help get support for the study proved lacking in some respects at the time of the field trial, it can be revamped before it is too late.

THE TEACHER EDUCATION AND DEVELOPMENT STUDY IN MATHEMATICS (TEDS-M) TECHNICAL REPORT264
Recruiting Sampled Institutions
Once you have obtained your national TEDS-M sample of institutions for the main study, you should prepare to contact them and invite them to participate. Contacting the sampled institutions requires professionalism, patience, and perseverance. It is extremely important that the sampled institutions participate in TEDS-M, since nonparticipation by sampled institutions affects overall participation rates for countries and may lead to bias in the results of the study. This means that success in the study depends on getting excellent cooperation from each of these institutions.
Issues to be addressed include:
• Howdoyouconvinceinstitutionsthatthestudyisimportantandmeaningful
for them?
• Inthatregard,haveyoubeenabletoarticulatethebenefitsofthestudytoeach
institution in a convincing way?
• IstheNRCteamcomfortablewiththeresponseburdenwhichinstitutionsare
being asked to accept? If not, it will be difficult to convince them.
• Istheinstitutionalcoordinatorroledefinedinawaythatisappropriateto
the institutions in your country? Can one person get all the data required and
influenceallthepeoplewhosesupportisrequiredordotheresponsibilities
need to be divided up among different persons to accomplish all these tasks?
We recognize that procedures for obtaining cooperation of institutions are likely to vary from country to country if they are to be successful. Each country has its own culture and customary ways of working with institutions in higher education. Thus, we can give only general guidelines for obtaining the cooperation of the sampled institutions, while encouraging each country to modify the procedures to fit its situation.
The plan mentioned above should include a section on approaching institutions
and asking for their agreement to participate. The following are examples of
the questions that such a plan should address, first to obtain cooperation of the
institution as a whole and then to assure the cooperation of the educators and
future teachers who will be surveyed within the institution:
• Whoatthesampledinstitutionsmustbecontactedandmustagreebefore
TEDS-M can be certain of cooperation from the institution in question? Do the
prospective contacts vary as a function of the type, size, and heterogeneity of
the institution?
• Whenshouldthisapproachbemade?
• Inmanycases,itwillalsobenecessarytovisitthetargetinstitutionstomeet
with key administrators and educators in order to enlist their support before it
will be possible to get the institution to agree, not just to participate, but also
to do so effectively and enthusiastically. In such cases, the organization of such
a meeting, the way in which the study is presented, and the person(s) making
the presentation for TEDS-M are extremely important. For such meetings, it is
essential that TEDS-M be represented by someone with high name recognition
and an excellent reputation in mathematics teacher education or in teacher
education.

265APPENDICES
• Howmuchoftheinitialcontactneedstobeintheformofavisittothe
institution or other face-to-face contacts as opposed to telephone calls and
exchange of emails and written correspondence? We recommend a combination
of a formal written letter of invitation and personal contacts. Cultural norms
and customary ways of doing things will determine the best approach for
each country in deciding, for example, whether the formal letter of invitation
should be preceded, accompanied, or followed by personal contact. Customary
procedures will also determine who should sign the letter. Ordinarily, the
lettershouldbesignedbyahighofficialwhoismostlikelytohaveinfluence
on the institutions being invited. In countries where relationships between
ministries and institutions of higher education are often strained, this should be
considered when phrasing the letter and deciding who should sign it.
• Whatisbeingaskedoftheinstitutionintermsoftime,staffing,and
participation of the respondent groups of future teachers and educators?
• Whatisthebestprocedureforchoosingtheinstitutionalcoordinator?
• Whataretheobstaclestoobtainingadequateresponseratesandhowcanthese
obstacles be overcome?
• Whatincentivesarenecessaryandsufficienttoensurewillingparticipationof
all those within each institution from whom data will be collected or who will
be asked to help with the study in some other way?
• Whatschedulefordatacollectionwillworkbest?Werecommendonethatisas
integrated with the institutional calendar as possible and can be accomplished
with minimal disruption to the schedules of future teachers and educators.
• Whointheinstitutionwillbeneededtoanswertheinstitutionalquestionnaire
and how can we be sure that they will do this as accurately and exhaustively as
possible?
List of Sampled Institutions
For those countries, where the sampling unit of the DPC was responsible for the sampling, you should have received the information about selected institutions and their replacements. Use this file to contact each of the sampled institutions. For more information on institution sampling procedures, please refer to the sample preparation manual.
Letter of Invitation
The letter of invitation should include the following elements, with modifications
appropriate for the country and institution in question:
• The purpose: Explain the purpose of TEDS-M, attaching a short document
describing the project and its significance. This attached document should be
written in easily understood language so that copies can be distributed to the
key administrators, educators, and others who have to be consulted before a
decision is made about whether the institution will participate or not.
• An invitation: Invite the cooperation of the institution, emphasizing the
importance of the institution’s participation in order to achieve a representative
sample.

THE TEACHER EDUCATION AND DEVELOPMENT STUDY IN MATHEMATICS (TEDS-M) TECHNICAL REPORT266
• The institution’s role: In the letter or attachment, outline what institution
participation will involve (e.g., the students and educators who will be involved,
the length of the data-collection sessions, the approximate time required for the
completion of the questionnaires, etc.).
• Dates: Give the proposed dates during which the instruments are to be
administered.
• Benefits: Indicate any benefits that individual institutions might receive from
participating in the study (e.g., ways in which the findings can be used to
improve teacher education within the institution). If it is within your capacity as
NRC, you may offer a visit when the results of the study are published as a way
to inform people about the outcomes of the study.
• Confidentiality: Guarantee the confidentiality of individual students, educators,
and institutions in all publications of results. Discuss compliance with other
human subject protection or other ethical requirements.
• Further discussion: Invite institution officials to contact you at the national
center if they need further information before making a decision, or better yet,
organize a joint session with institutions or offer to make a further visit to their
institution to explain and justify the study to interested parties.
• Institution coordinator’s role: Describe the role of the institution coordinator
who will be responsible for convincing educators and students to participate
as well as administrative arrangements for the TEDS-M main study in the
institution. State that the institution coordinator could be either a staff member
within the institution or a member of the national center in charge of the survey
administration in a particular institution. Indicate that the selection of such a
person needs to be discussed with the authorities at the institution to make sure
the person chosen is satisfactory both for the institution and the national center.
• Additional contacts: Ask for the contact information of any additional person
other than the institution coordinator to whom future correspondence should
be addressed.
Follow-up Letters
Personnel in institutions agreeing to participate become essential partners in the TEDS-M main study. Be sure to follow up all contacts with letters expressing appreciation for cooperation and for whatever was accomplished during the contact.
Institution Coordinator
The choice of institutional coordinator is critical. To get sufficient support from all sampled individuals as well as the sampled institution, the institution coordinator must have status and reputation sufficient to convince others of the importance and value of participating in the study. Although the method of selection may vary greatly in line with differing cultural norms and customary ways of doing things, it is very important that there is sufficient input both from the institution and the national center in the selection of this individual to be sure he/she is capable of and willing to do the job.

267APPENDICES
The institution coordinator should be either a respected administrator or member of the teaching staff in the institution or a representative of the national center with attributes that will ensure good entry and cooperation in the institution. The institution coordinator will be responsible for the data collection, for making sure that the rate of response is as high as possible, and that the instruments are fully and adequately completed and collected. To accomplish this task, this individual may select others to assist him or her with data collection. The final responsibility of ensuring the quality of the data collection lies with the institution coordinator.
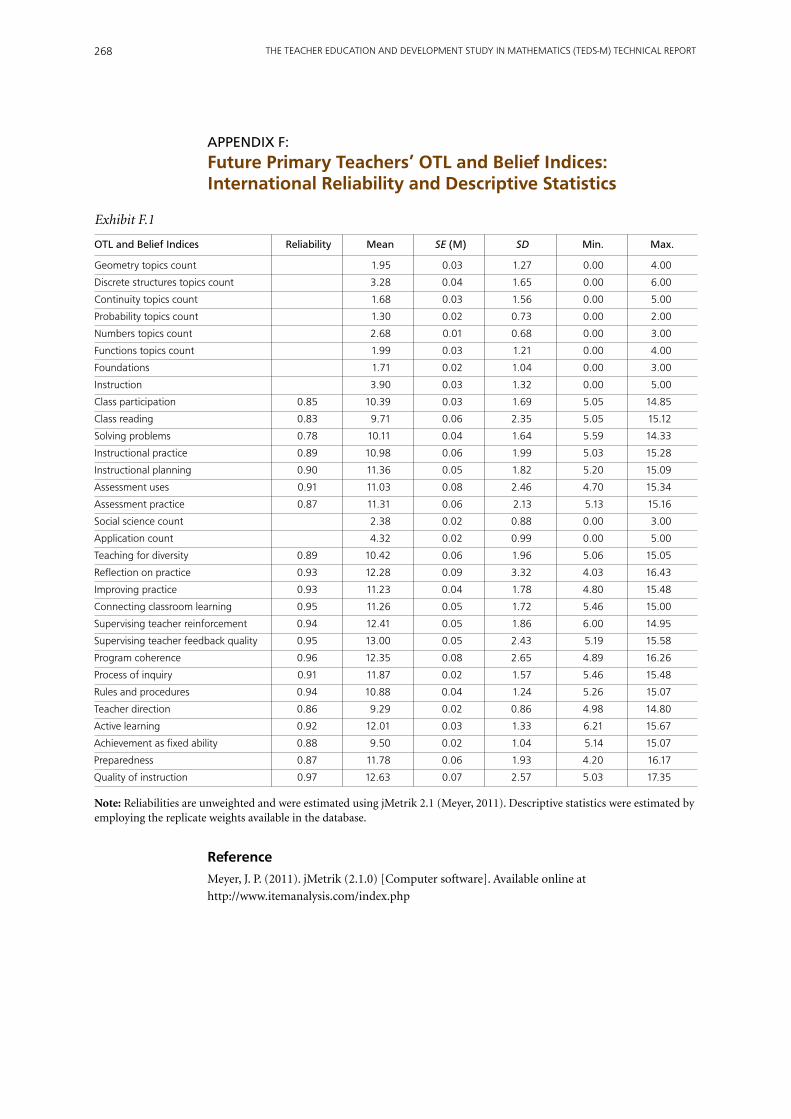
THE TEACHER EDUCATION AND DEVELOPMENT STUDY IN MATHEMATICS (TEDS-M) TECHNICAL REPORT268
APPENDIx F: Future Primary Teachers’ OTL and Belief Indices: International Reliability and Descriptive Statistics
OTL and Belief Indices Reliability Mean SE (M) SD Min. Max.
Geometry topics count 1.95 0.03 1.27 0.00 4.00
Discrete structures topics count 3.28 0.04 1.65 0.00 6.00
Continuity topics count 1.68 0.03 1.56 0.00 5.00
Probability topics count 1.30 0.02 0.73 0.00 2.00
Numbers topics count 2.68 0.01 0.68 0.00 3.00
Functions topics count 1.99 0.03 1.21 0.00 4.00
Foundations 1.71 0.02 1.04 0.00 3.00
Instruction 3.90 0.03 1.32 0.00 5.00
Class participation 0.85 10.39 0.03 1.69 5.05 14.85
Class reading 0.83 9.71 0.06 2.35 5.05 15.12
Solving problems 0.78 10.11 0.04 1.64 5.59 14.33
Instructional practice 0.89 10.98 0.06 1.99 5.03 15.28
Instructional planning 0.90 11.36 0.05 1.82 5.20 15.09
Assessment uses 0.91 11.03 0.08 2.46 4.70 15.34
Assessment practice 0.87 11.31 0.06 2.13 5.13 15.16
Social science count 2.38 0.02 0.88 0.00 3.00
Application count 4.32 0.02 0.99 0.00 5.00
Teaching for diversity 0.89 10.42 0.06 1.96 5.06 15.05
Reflection on practice 0.93 12.28 0.09 3.32 4.03 16.43
Improving practice 0.93 11.23 0.04 1.78 4.80 15.48
Connecting classroom learning 0.95 11.26 0.05 1.72 5.46 15.00
Supervising teacher reinforcement 0.94 12.41 0.05 1.86 6.00 14.95
Supervising teacher feedback quality 0.95 13.00 0.05 2.43 5.19 15.58
Program coherence 0.96 12.35 0.08 2.65 4.89 16.26
Process of inquiry 0.91 11.87 0.02 1.57 5.46 15.48
Rules and procedures 0.94 10.88 0.04 1.24 5.26 15.07
Teacher direction 0.86 9.29 0.02 0.86 4.98 14.80
Active learning 0.92 12.01 0.03 1.33 6.21 15.67
Achievement as fixed ability 0.88 9.50 0.02 1.04 5.14 15.07
Preparedness 0.87 11.78 0.06 1.93 4.20 16.17
Quality of instruction 0.97 12.63 0.07 2.57 5.03 17.35
note: Reliabilities are unweighted and were estimated using jMetrik 2.1 (Meyer, 2011). Descriptive statistics were estimated by employing the replicate weights available in the database.
Reference
Meyer, J. P. (2011). jMetrik (2.1.0) [Computer software]. Available online at
http://www.itemanalysis.com/index.php
Exhibit F.1

269APPENDICES
APPENDIx G: Future Secondary Teachers‘ OTL and Belief Indices: International Reliability and Descriptive Statistics
OTL and Belief Indices Reliability Mean SE (M) SD Min. Max.
Geometry topics count 2.78 0.05 1.25 0.00 4.00
Discrete structures topics count 4.39 0.15 1.70 0.00 6.00
Continuity topics count 3.30 0.14 1.74 0.00 5.00
Probability topics count 1.56 0.03 0.62 0.00 2.00
Numbers topics count 2.77 0.02 0.58 0.00 3.00
Functions topics count 2.87 0.08 1.18 0.00 4.00
Foundations 1.99 0.02 0.96 0.00 3.00
Instruction 3.99 0.04 1.23 0.00 5.00
Class participation 0.83 10.54 0.08 1.62 5.05 14.85
Class reading 0.85 9.94 0.08 2.22 5.05 15.12
Solving problems 0.79 10.85 0.10 1.69 5.59 14.33
Instructional practice 0.88 11.01 0.06 1.81 5.03 15.28
Instructional planning 0.89 11.19 0.05 1.64 5.20 15.09
Assessment uses 0.90 11.01 0.07 2.30 4.70 15.34
Assessment practice 0.86 11.28 0.06 1.90 5.13 15.16
Social science count 2.39 0.02 0.87 0.00 3.00
Application count 4.24 0.03 1.05 0.00 5.00
Teaching for diversity 0.90 9.98 0.12 2.10 5.06 15.05
Reflection on practice 0.93 11.89 0.17 3.32 4.03 16.43
Improving practice 0.93 10.99 0.10 1.86 4.80 15.48
Connecting classroom learning 0.95 11.28 0.06 1.70 5.46 15.00
Supervising teacher reinforcement 0.95 12.35 0.07 1.80 6.00 14.95
Supervising teacher feedback quality 0.96 12.98 0.08 2.41 5.19 15.58
Program coherence 0.97 12.41 0.12 2.56 4.89 16.26
Process of inquiry 0.89 12.08 0.05 1.57 5.46 15.48
Rules and procedures 0.93 10.87 0.07 1.36 5.26 15.07
Teacher direction 0.86 9.44 0.04 0.95 4.98 14.80
Active learning 0.92 12.06 0.04 1.43 6.21 15.67
Achievement as fixed ability 0.88 9.66 0.06 1.05 5.14 15.07
Preparedness 0.96 11.78 0.06 1.79 4.20 16.17
Quality of instruction 0.96 12.46 0.07 2.46 5.03 17.35
note: Reliabilities are unweighted and were estimated using jMetrik 2.1 (Meyer, 2011). Descriptive statistics were estimated by employing the replicate weights available in the database.
Reference
Meyer, J. P. (2011). jMetrik (2.1.0) [Computer software]. Available online at
http://www.itemanalysis.com/index.php
Exhibit G.1
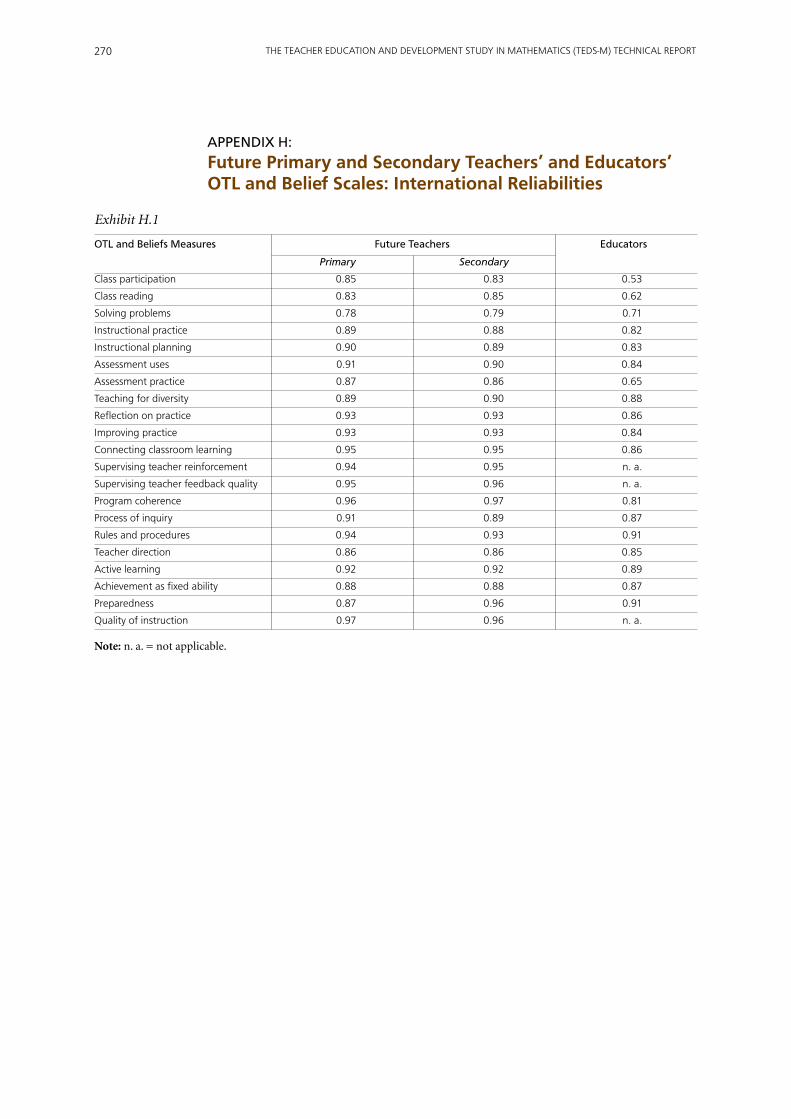
THE TEACHER EDUCATION AND DEVELOPMENT STUDY IN MATHEMATICS (TEDS-M) TECHNICAL REPORT270
APPENDIx H: Future Primary and Secondary Teachers’ and Educators’ OTL and Belief Scales: International Reliabilities
OTL and Beliefs Measures Future Teachers Educators
Primary Secondary
Class participation 0.85 0.83 0.53
Class reading 0.83 0.85 0.62
Solving problems 0.78 0.79 0.71
Instructional practice 0.89 0.88 0.82
Instructional planning 0.90 0.89 0.83
Assessment uses 0.91 0.90 0.84
Assessment practice 0.87 0.86 0.65
Teaching for diversity 0.89 0.90 0.88
Reflection on practice 0.93 0.93 0.86
Improving practice 0.93 0.93 0.84
Connecting classroom learning 0.95 0.95 0.86
Supervising teacher reinforcement 0.94 0.95 n. a.
Supervising teacher feedback quality 0.95 0.96 n. a.
Program coherence 0.96 0.97 0.81
Process of inquiry 0.91 0.89 0.87
Rules and procedures 0.94 0.93 0.91
Teacher direction 0.86 0.86 0.85
Active learning 0.92 0.92 0.89
Achievement as fixed ability 0.88 0.88 0.87
Preparedness 0.87 0.96 0.91
Quality of instruction 0.97 0.96 n. a.
note: n. a. = not applicable.
Exhibit H.1

271APPENDICES
APPENDIx I: Field Trial of the Institutional, Future Teacher, and Educator Questionnaires
Staff at the TEDS-M international study centers (ISCs) reviewed proposed items for the two future teacher questionnaires (FTQs) as well as the institutional program questionnaire (IPQ) and the educator questionnaire (EQ) in terms of how well they worked both across countries and within individual countries. This review led to improvements being made to all of the questionnaires.
Preliminary Analysis
The process of evaluating whether a set of items was appropriate for scaling and then
examining the characteristics of scaled scores (using the data from the field trial)
involved five steps:
1. Carrying out cluster analyses in order to examine the distribution of responses and
complete a first test of inference.
2. Conducting factor and reliability analyses, which included checking the patterns of
missing values and the distribution of item responses. If there was at least one missing
value across the chosen items, the case was dropped through a process known as
list-wise deletion. The analyses were conducted separately for the different target
population samples.
3. Completing a factor analysis to uncover the dimensionality of the measured construct
(factor) during scale development. The factor analysis results provided information
such as factor loadings (i.e., the correlation between an item and a construct or
factor) and variance explained (i.e., the amount of variance explained by a certain
construct or factor), both of which were used to examine the intercorrelations of
items and to identify items that correlated.
A factor indicates the unidimensional measure of a construct, while a loading
indicates a correlation between the item and factor. (The TEDS-M team looked for
positive and relatively high factor loadings—0.50+.) Each item contributes variance,
and the total variance is the sum of the item variances. As a set, the factor accounts
for the variance from all items. If the factor is an efficient summary of all the items,
it will explain a large percentage of the total variance. For the field trial, exploratory
factor analysis (EFA) was used to check dimensionality of the scales with Likert-type
items. The results from this analysis provided empirical grounds for selecting the
final items for the questionnaires.
Ideally, the magnitude of item correlations should be similar across the full set of
items because this indicates that the items are equally correlated to one another.
The item correlations should be relatively large, but not too large and not too small.
Pairs of items with relatively large correlations suggest that the items produce the
same results (measure the same constructs). Pairs of items with relatively small
correlations suggest that the items produce different results (measure something
different). TEDS-M reported this information to indicate the similarity of items
within domains.

THE TEACHER EDUCATION AND DEVELOPMENT STUDY IN MATHEMATICS (TEDS-M) TECHNICAL REPORT272
4. Carrying out reliability analysis to examine the consistency of the total score and the
contribution of each item to the total score, thereby providing information such as
coefficient alpha and item-total correlations. Coefficient alpha is an index of score
reliability. It is the proportion of systematic variance from the observed score variance
that can be explained by differences in individual attitudes, beliefs, and knowledge.
This index tells us the degree to which scores are reliable, consistent, and replicable. It
should be above 0.80 for research purposes (when above 0.90, scores for individuals
can be used). Alpha is not an index of unidimensionality, but it may indicate the
presence of a “common factor.” Item-total correlations suggest correlation between
an item and the total score. In other words, the correlation shows to what extent the
item contributes to the total score (total measure). The coefficient alpha therefore
should be positive and relatively high (0.30+).
5. Using the information produced through the scaling process to select the field trial items
that would be included in the final instruments. Problematic items were either revised
(modified) so they could be included in the main study or they were excluded from
it altogether.
An example serves to illustrate how factor analysis provided empirical grounds for selecting items for the main study. Exhibit I.1 presents the results from the exploratory factor analysis (EFA) for one of the “opportunity to learn” scales—assessment of mathematics teaching. The results show one single latent dimension. Among the items, however, Items A and B have relatively lower factor loadings (less than 0.60). Further analysis done without those two items showed that discarding them increased the variance explained. Note the high coefficient alpha (0.908) and the higher item-total correlations.Ifdiscardingthesetwoitemsdidnotconflictwiththetheoryunderlyingthe scale, the recommendation could be made for dropping both items.
Questions With A and B Without A Alpha = 0.908
In your current teacher preparation program, Factor loading Factor loading Corrected item-total how often did you: correlation
Assess low-level objectives (factual knowledge, routine 0.454 – – procedures, and so forth)?
Assess higher-level objectives (problem-solving, critical thinking, 0.567 – – and so forth)?
Help pupils learn how to assess their own learning? 0.738 0.707 0.672
Use standardized assessments to guide your decisions about 0.793 0.789 0.747 what and how to teach?
Use classroom assessments to guide your decisions about 0.796 0.815 0.767 what and how to teach?
Use assessment to give feedback to pupils about their learning? 0.814 0.834 0.785
Use assessment to give effective feedback to parents or 0.733 0.746 0.706 guardians?
Analyze pupil assessment data to learn how to assess more 0.817 0.837 0.789 effectively?
Percentage of variance explained 52.5 62.3
Exhibit I.1: Item statistics for the opportunity to learn (OTL) scale—assessment in mathematics teaching
(primary level)

273APPENDICES
Item Response Analysis with Rasch Model
The TEDS-M team used the Rasch (1-parameter IRT) (de Ayala, 2009) model to scale items in order to secure meaningful scale scores measuring each construct. The Rasch analysis also provided information about item fit, item difficulty (i.e., the trait or ability level associated with each item), and other measurement properties of the scale, including reliability. This process was appropriate for dichotomously scored items, such as the mathematics knowledge items (i.e., correct/incorrect), and the polytomously scored cognitive items, and for the rating-scale attitudinal items, such as the OTL and beliefs items.
For the field trial, the team used the Winstep software program (Linacre, 2009) to conduct the analyses of the attitude scales (i.e., OTL and beliefs) and the mathematics knowledge scales. The analysis for the mathematics items was done in turn for each block and booklet. Analysis also encompassed the subdomains of mathematics content knowledge (MCK) (i.e., algebra, data, geometry, and number) and mathematics pedagogy content knowledge (MPCK) (i.e., curriculum planning and enacting), as well as in total. As with the factor analysis results, the results from the Winstep analysis (e.g., item statistics, item maps, and item step graphs) provided the empirical grounds for selecting the final items for the main study.
References
de Ayala, R. J. (2009). The theory and practice of item response theory. New York, NY: The Guilford
Press.
Linacre, J. M. (2009). Winsteps (Version 3.68) [Computer software]. Beaverton, OR: Winsteps.
com.

THE TEACHER EDUCATION AND DEVELOPMENT STUDY IN MATHEMATICS (TEDS-M) TECHNICAL REPORT274
APPENDIx J: Model Fit Statistics for the Opportunity to Learn Scales
Tertiary-Level Mathematics
Geometry MFB1GEOM
A. Foundations of Geometry or Axiomatic Geometry (e.g., Euclidean axioms)
B. Analytic/Coordinate Geometry (e.g., equations of lines, curves, conic sections, rigid transformations or isometrics)
C. Non-Euclidean Geometry (e.g., geometry on a sphere)
D. Differential Geometry (e.g., sets that are manifolds, curvature of curves, and surfaces)
Discrete Structures and Logic MFB1DISC
F. Linear Algebra (e.g., vector spaces, matrices, dimensions, eigenvalues, eigenvectors)
G. Set Theory
H. Abstract Algebra (e.g., group theory, field theory, ring theory, ideals)
I. Number Theory (e.g., divisibility, prime numbers, structuring integers)
P. Discrete Mathematics, Graph Theory, Game Theory, Combinatorics or Boolean Algebra
S. Mathematical Logic (e.g., truth tables, symbolic logic, propositional logic, set theory, binary operations)
Continuity and Functions MFB1CONT
J. Beginning Calculus Topics (e.g., limits, series, sequences)
K. Calculus (e.g., derivatives and integrals)
L. Multivariate Calculus (e.g., partial derivatives, multiple integrals)
M. Advanced Calculus or Real Analysis or Measure Theory
N. Differential Equations (e.g., ordinary differential equations and partial differential equations)
Probability and Statistics MFB1PRST
Q. Probability
R. Theoretical or Applied Statistics
1 The CFI depends in large part on the average size of the correlations in the data. If the average correlation between variables is not high, then the CFI will not be very high. An acceptable model is indicated by a CFI larger than 0.93 (Byrne, 1994), but 0.85 is acceptable (Bollen, 1989). The TLI is relatively independent of sample size (Marsh, Balla, & McDonald, 1988). Values over 0.90 or 0.95 are considered acceptable (see, for example, Hu & Bentler, 1999). The RMSEA is another test of model fit. Good models are considered to have a RMSEA of 0.05 or less. Models whose RMSEA is 0.1 or more have a poor fit.
Model Fit Statistics 1
Primary Secondary
CFI TLI RMSEA CFI TLI RMSEA
0.911 0.954 0.044 0.969 0.986 0.032
note: CFI (Comparative Fit Scale), TLI (Tucker Lewis Scale), RMSEA (Root Mean Square Error of Approximation).

275APPENDICES
Factor Loadings (Estimate), Loading SEs, and Factor Correlations
Primary Secondary
Estimate SE Estimate SE
GEOM by: GEOM by:
B001A 0.63 0.02 B001A 0.73 0.03
B001B 0.80 0.01 B001B 0.79 0.02
B001C 0.60 0.02 B001C 0.65 0.02
B001D 0.78 0.01 B001D 0.75 0.02
DISC by: DISC by:
B001F 0.74 0.01 B001F 0.89 0.02
B001G 0.67 0.01 B001G 0.66 0.02
B001H 0.72 0.01 B001H 0.88 0.01
B001I 0.77 0.02 B001I 0.42 0.04
B001P 0.60 0.01 B001P 0.71 0.02
B001S 0.68 0.01 B001S 0.74 0.02
CONT by: CONT by:
B001J 0.77 0.01 B001J 0.91 0.01
B001K 0.87 0.01 B001K 0.98 0.01
B001L 0.93 0.01 B001L 0.96 0.01
B001M 0.84 0.01 B001M 0.86 0.02
B001N 0.80 0.01 B001N 0.82 0.02
PRST by: PRST by:
B001Q 0.92 0.02 B001Q 0.86 0.04
B001R 0.74 0.02 B001R 0.64 0.04
DISC with: DISC with:
GEOM 0.85 0.01 GEOM 0.91 0.02
CONT with: CONT with:
GEOM 0.71 0.02 GEOM 0.83 0.02
DISC 0.74 0.01 DISC 0.88 0.01
PRST with: PRST with:
GEOM 0.61 0.02 GEOM 0.73 0.04
DISC 0.66 0.02 DISC 0.73 0.04
CONT 0.42 0.02 CONT 0.62 0.04
note: All p-values associated with the loading estimates are less than 0.005.

THE TEACHER EDUCATION AND DEVELOPMENT STUDY IN MATHEMATICS (TEDS-M) TECHNICAL REPORT276
School-Level Mathematics
Numbers, Measurement, and Geometry MFB2SLMN
A. Numbers (e.g., whole numbers, fractions, decimals, integer, rational, and real numbers; number concepts; number theory; estimation; ratio and proportionality)
B. Measurement (e.g., measurement units; computations and properties of length, perimeter, area, and volume; estimation and error)
C. Geometry (e.g., 1-D and 2-D coordinate geometry, Euclidean geometry, transformational geometry, congruence and similarity, constructions with straightedge and compass, 3-D geometry, vector geometry)
Functions Probability Calculus MFB2SLMF
A. Functions, Relations, and Equations (e.g., algebra, trigonometry, analytic geometry)
B. Data Representation, Probability, and Statistics
C. Calculus (e.g., infinite processes, change, differentiation, integration)
D. Validation, Structuring, and Abstracting (e.g., Boolean algebra, mathematical induction, logical connectives, sets, groups, fields, linear space, isomorphism, homomorphism)
Model Fit Statistics
Primary Secondary
CFI TLI RMSEA CFI TLI RMSEA
0.97 0.973 0.057 0.892 0.846 0.085
note: CFI (Comparative Fit Scale), TLI (Tucker Lewis Scale), RMSEA (Root Mean Square Error of Approximation).
Factor Loadings (Estimate), Loading SEs, and Factor Correlations
Primary Secondary
Estimate SE Estimate SE
SLMN by: SLMN by:
B002A 0.99 0.01 B002A 0.95 0.03
B002B 0.92 0.01 B002B 0.86 0.03
B002C 0.86 0.01 B002C 0.82 0.03
SLMF by: SLMF by:
B002D 0.90 0.01 B002D 0.82 0.02
B002E 0.72 0.01 B002E 0.63 0.03
B002F 0.62 0.02 B002F 0.83 0.02
B002G 0.60 0.02 B002G 0.85 0.02
SLMF with: SLMF with:
SLMN 0.84 0.01 SLMN 0.49 0.03
note: All p-values associated with the loading estimates are less than 0.005.

277APPENDICES
Factor Loadings (Estimate), Loading SEs, and Factor Correlations
Primary Secondary
Estimate SE Estimate SE
FOUN by: FOUN by:
B004A 0.54 0.02 B004A 0.51 0.03
B004B 0.77 0.02 B004B 0.72 0.02
B004C 0.80 0.02 B004C 0.72 0.03
INST by: INST by:
B004D 0.80 0.02 B004D 0.77 0.03
B004E 0.75 0.01 B004E 0.74 0.02
B004F 0.86 0.01 B004F 0.82 0.02
B004G 0.80 0.01 B004G 0.76 0.02
B004H 0.73 0.02 B004H 0.68 0.02
INST with: INST with:
FOUN 0.69 0.02 FOUN 0.68 0.03
note: All p-values associated with the loading estimates are less than 0.005.
Mathematics Education Pedagogy
Foundations MFB4FOUN
A. Foundations of Mathematics (e.g., mathematics and philosophy, mathematics epistemology, history of mathematics)
B. Context of Mathematics Education (e.g., role of mathematics in society, gender/ethnic aspects of mathematics achievement)
C. Development of Mathematics Ability and Thinking (e.g., theories of mathematics ability and thinking; developing mathematical concepts; reasoning, argumentation, and proving; abstracting and generalizing; carrying out procedures and algorithms; application; modeling).
Instruction MFB4INST
A. Mathematics Instruction (e.g., representation of mathematics content and concepts, teaching methods, analysis of mathematical problems and solutions, problem-posing strategies, teacher–student interaction)
B. Developing Teaching Plans (e.g., selection and sequencing the mathematics content; studying and selecting textbooks and instructional materials)
C. Mathematics Teaching: Observation, Analysis, and Reflection
D. Mathematics Standards and Curriculum
E. Affective Issues in Mathematics (e.g., beliefs, attitudes, mathematics anxiety)
Model Fit Statistics
Primary Secondary
CFI TLI RMSEA CFI TLI RMSEA
0.969 0.971 0.036 0.966 0.963 0.033
note: CFI (Comparative Fit Scale), TLI (Tucker Lewis Scale), RMSEA (Root Mean Square Error of Approximation).

THE TEACHER EDUCATION AND DEVELOPMENT STUDY IN MATHEMATICS (TEDS-M) TECHNICAL REPORT278
Mathematics Education Pedagogy
Class Participation MFB5PART
B. Ask questions during class time
C. Participate in a whole-class discussion
D. Make presentations to the rest of the class
E. Teach a class session using methods of my own choice
F. Teach a class session using methods demonstrated by the instructor
Class Reading MFB5READ
H. Read about research on mathematics
I. Read about research on mathematics education
J. Read about research on teaching and learning
K. Analyze examples of teaching (e.g., film, video, transcript of lesson)
Solving Problems MFB5SOLV
L. write mathematical proofs
M. Solve problems in applied mathematics
N. Solve a given mathematics problem using multiple strategies
O. Use computers or calculators to solve mathematics problems
Model Fit Statistics
Primary Secondary Educator
CFI TLI RMSEA CFI TLI RMSEA CFI TLI RMSEA
0.922 0.964 0.066 0.941 0.966 0.058 0.868 0.858 0.182
note: CFI (Comparative Fit Scale), TLI (Tucker Lewis Scale), RMSEA (Root Mean Square Error of Approximation).

279APPENDICES
Factor Loadings (Estimate), Loading SEs, and Factor Correlations
Primary Secondary Educator
Estimate SE Estimate SE Estimate SE
PART by: PART by: PART by
B005B 0.73 0.01 B005B 0.68 0.01 I001B 0.43 0.03
B005C 0.81 0.01 B005C 0.75 0.01 I001C 0.64 0.02
B005D 0.67 0.01 B005D 0.63 0.01 I001D 0.74 0.01
B005E 0.76 0.01 B005E 0.74 0.01 I001E 0.94 0.01
B005F 0.75 0.01 B005F 0.72 0.01 I001F 0.77 0.01
READ by: READ by: READ by:
B005H 0.90 0.01 B005H 0.86 0.01 I001H 0.95 0.01
B005I 0.95 0.01 B005I 0.95 0.01 I001I 0.85 0.01
B005J 0.80 0.01 B005J 0.85 0.01 I001J 0.49 0.02
B005K 0.60 0.01 B005K 0.56 0.02 I001K 0.49 0.02
SOLV by: SOLV by: SOLV by:
B005L 0.58 0.01 B005L 0.58 0.02 I001L 0.87 0.01
B005M 0.75 0.01 B005M 0.81 0.01 I001M 0.94 0.00
B005N 0.86 0.01 B005N 0.84 0.01 I001N 0.96 0.00
B005O 0.56 0.01 B005O 0.53 0.02 I001O 0.83 0.01
READ with: READ with READ with
PART 0.60 0.01 PART 0.57 0.02 PART 0.65 0.02
SOLV with: SOLV with: SOLV with:
PART 0.46 0.01 PART 0.30 0.03 PART -0.14 0.03
READ 0.56 0.01 READ 0.49 0.02 READ 0.68 0.01
note: All p-values associated with the loading estimates are less than 0.005.

THE TEACHER EDUCATION AND DEVELOPMENT STUDY IN MATHEMATICS (TEDS-M) TECHNICAL REPORT280
Mathematics Education Pedagogy
Instructional Practice MFB6IPRA
L. Explore how to apply mathematics to real-world problems
A. Explore mathematics as the source for real-world problems
Q. Learn how to explore multiple solution strategies with pupils
R. Learn how to show why a mathematics procedure works
T. Make distinctions between procedural and conceptual knowledge when teaching mathematics concepts and operations to pupils
Z. Integrate mathematical ideas from across areas of mathematics
Instructional Planning MFB6IPLA
A. Accommodate a wide range of abilities in each lesson
G. Create learning experiences that make the central concepts of subject matter meaningful to pupils
H. Create projects that motivate all pupils to participate
I. Deal with learning difficulties so that specific pupil outcomes are accomplished
J. Develop games or puzzles that provide instructional activities at a high interest level
K. Develop instructional materials that build on pupils’ experiences, interests, and abilities
X. Use pupils’ misconceptions to plan instruction
Model Fit Statistics
Primary Secondary Educator
CFI TLI RMSEA CFI TLI RMSEA CFI TLI RMSEA
0.921 0.981 0.063 0.918 0.975 0.059 0.946 0.955 0.05
note: CFI (Comparative Fit Scale), TLI (Tucker Lewis Scale), RMSEA (Root Mean Square Error of Approximation).
Factor Loadings (Estimate), Loading SEs, and Factor Correlations
Primary Secondary Educator
Estimate SE Estimate SE Estimate SE
IPRA by: IPRA by: IPRA by:
B006L 0.85 0.01 B006L 0.80 0.01 G002C 0.85 0.02
B006N 0.76 0.01 B006N 0.66 0.01 G002E 0.87 0.01
B006Q 0.80 0.01 B006Q 0.78 0.01 G002F 0.75 0.02
B006R 0.79 0.01 B006R 0.75 0.01 G002G 0.68 0.02
B006T 0.75 0.01 B006T 0.74 0.01 G002H 0.75 0.02
B006Z 0.79 0.01 B006Z 0.74 0.01 G002I 0.69 0.02
IPLA by: IPLA by: IPLA by:
B006A 0.68 0.01 B006A 0.63 0.01 I003A 0.57 0.03
B006G 0.82 0.01 B006G 0.77 0.01 I003E 0.73 0.03
B006H 0.80 0.01 B006H 0.73 0.01 I003F 0.69 0.02
B006I 0.80 0.01 B006I 0.78 0.01 I003G 0.76 0.02
B006J 0.80 0.01 B006J 0.75 0.01 I003H 0.73 0.02
B006K 0.84 0.01 B006K 0.80 0.01 I003I 0.82 0.02
B006X 0.67 0.01 B006X 0.62 0.01 I003P 0.58 0.02
IPLA with: IPLA with: IPLA with:
B005L 0.58 0.01 B005L 0.58 0.02 I001L 0.87 0.01
note: All p-values associated with the loading estimates are less than 0.005.

281APPENDICES
Mathematics Education Pedagogy
Assessment Uses MFB6AUSE
O. Give useful and timely feedback to pupils about their learning
P. Help pupils learn how to assess their own learning
U. Use assessment to give effective feedback to parents or guardians
V. Use assessment to give feedback to pupils about their learning
w. Use classroom assessments to guide your decisions about what and how to teach
Assessment Practice MFB6APRA
A. Analyze and use national or state standards or frameworks for school mathematics
B. Analyze pupil assessment data to learn how to assess more effectively
C. Assess higher-level goals (e.g., problem-solving, critical thinking)
D. Assess low-level objectives (factual knowledge, routine procedures, and so forth)
F. Build on pupils’ existing mathematics knowledge and thinking skills
Model Fit Statistics
Primary Secondary Educator
CFI TLI RMSEA CFI TLI RMSEA CFI TLI RMSEA
0.955 0.984 0.072 0.928 0.977 0.067 0.911 0.924 0.089
note: CFI (Comparative Fit Scale), TLI (Tucker Lewis Scale), RMSEA (Root Mean Square Error of Approximation).
Factor Loadings (Estimate), Loading SEs, and Factor Correlations
Primary Secondary Educator
Estimate SE Estimate SE Estimate SE
AUSE by: AUSE by: AUSE by:
B006O 0.81 0.01 B006O 0.82 0.01 I003J 0.87 0.01
B006P 0.78 0.01 B006P 0.80 0.01 I003K 0.85 0.01
B006U 0.84 0.01 B006U 0.82 0.01 I003M 0.70 0.02
B006V 0.92 0.00 B006V 0.91 0.01 I003N 0.88 0.01
B006w 0.87 0.00 B006w 0.80 0.01 I003O 0.84 0.01
APRA by: APRA by: APRA by:
B006B 0.68 0.01 B006B 0.63 0.02 I003B 0.85 0.02
B006C 0.84 0.01 B006C 0.82 0.01 I003C 0.78 0.02
B006D 0.83 0.01 B006D 0.82 0.01 I003D 0.75 0.02
B006E 0.78 0.01 B006E 0.73 0.01 G002A 0.53 0.04
B006F 0.78 0.01 B006F 0.75 0.01 G002B 0.58 0.04
APRA with: APRA with: APRA with:
AUSE 0.78 0.01 AUSE 0.78 0.01 AUSE 0.74 0.03
note: All p-values associated with the loading estimates are less than 0.005.

THE TEACHER EDUCATION AND DEVELOPMENT STUDY IN MATHEMATICS (TEDS-M) TECHNICAL REPORT282
Education Pedagogy
Social Science MFB7EPSS
A. History of Education and Educational Systems (e.g., historical development of the national system, development of international systems)
B. Philosophy of Education (e.g., ethics, values, theory of knowledge, legal issues)
C. Sociology of Education (e.g., purpose and function of education in society, organization of current education systems, education and social conditions, diversity, educational reform)
Application MFB7EPAP
A. Educational Psychology (e.g., motivational theory, child development, learning theory)
B. Theories of Schooling (e.g., goals of schooling, teacher’s role, curriculum theory and development, didactic/teaching models, teacher–pupil relations, school administration and leadership)
C. Methods of Educational Research (e.g., read, interpret, and use education research; theory and practice of action research)
D. Assessment and Measurement: Theory and Practice
H. Knowledge of Teaching (e.g., knowing how to teach pupils of different backgrounds, using resources to support instruction, managing classrooms, communicating with parents)
Model Fit Statistics
Primary Secondary
CFI TLI RMSEA CFI TLI RMSEA
0.946 0.943 0.031 0.977 0.974 0.024
note: CFI (Comparative Fit Scale), TLI (Tucker Lewis Scale), RMSEA (Root Mean Square Error of Approximation).
Factor Loadings (Estimate), Loading SEs, and Factor Correlations
Primary Secondary
Estimate SE Estimate SE
EPSS by: EPSS by:
B007A 0.63 0.02 B007A 0.58 0.03
B007B 0.72 0.02 B007B 0.73 0.02
B007C 0.78 0.02 B007C 0.77 0.03
EPAP by: EPAP by:
B007D 0.46 0.04 B007D 0.68 0.04
B007E 0.71 0.02 B007E 0.71 0.03
B007F 0.78 0.02 B007F 0.73 0.02
B007G 0.61 0.02 B007G 0.66 0.03
B007H 0.69 0.02 B007H 0.74 0.02
EPAP with: EPAP with:
EPSS 0.73 0.02 EPSS 0.79 0.03
note: All p-values associated with the loading estimates are less than 0.005.

283APPENDICES
Education Pedagogy
Teaching for Diversity MFB8DVRS
A. Develop specific strategies for teaching students with behavioral and emotional problems
B. Develop specific strategies and curriculum for teaching pupils with learning disabilities
C. Develop specific strategies and curriculum for teaching gifted pupils
D. Develop specific strategies and curriculum for teaching pupils from diverse cultural backgrounds
E. Accommodate the needs of pupils with physical disabilities in your classroom
F. work with children from poor or disadvantaged backgrounds
Model Fit Statistics
Primary Secondary Educator
CFI TLI RMSEA CFI TLI RMSEA CFI TLI RMSEA
0.959 0.974 0.087 0.953 0.98 0.082 0.964 0.97 0.09
note: CFI (Comparative Fit Scale), TLI (Tucker Lewis Scale), RMSEA (Root Mean Square Error of Approximation).
Factor Loadings (Estimate), Loading SEs, and Factor Correlations
Primary Secondary Educator
Estimate SE Estimate SE Estimate SE
DVRS by: DVRS by: DVRS by:
B008A 0.82 0.01 B008A 0.84 0.01 H002A 0.82 0.01
B008B 0.86 0.01 B008B 0.87 0.01 H002B 0.87 0.01
B008C 0.75 0.01 B008C 0.73 0.01 H002C 0.72 0.02
B008D 0.74 0.01 B008D 0.79 0.01 H002D 0.79 0.01
B008E 0.73 0.01 B008E 0.80 0.01 H002E 0.75 0.02
B008F 0.71 0.01 B008F 0.75 0.01 H002F 0.75 0.02
note: All p-values associated with the loading estimates are less than 0.005.

THE TEACHER EDUCATION AND DEVELOPMENT STUDY IN MATHEMATICS (TEDS-M) TECHNICAL REPORT284
Education Pedagogy
Teaching for Reflection on Practice MFB8REFL
G. Use teaching standards and codes of conduct to reflect on your teaching
H. Develop strategies to reflect upon the effectiveness of your teaching
L. Develop strategies to reflect upon your professional knowledge
J. Develop strategies to identify your learning needs
Improving Practice MFB9IMPR
E. Develop and test new teaching practices
F. Set appropriately challenging learning expectations for pupils
G. Learn how to use findings from research to improve knowledge and practice
H. Connect learning across subject areas
I. Study ethical standards and codes of conduct expected of teachers
J. Create methods to enhance pupils’ confidence and self-esteem
K. Identify opportunities for changing existing schooling practices
L. Identify appropriate resources needed for teaching
Model Fit Statistics
Primary Secondary Educator
CFI TLI RMSEA CFI TLI RMSEA CFI TLI RMSEA
0.973 0.993 0.053 0.967 0.991 0.053 0.977 0.981 0.053
note: CFI (Comparative Fit Scale), TLI (Tucker Lewis Scale), RMSEA (Root Mean Square Error of Approximation).
Factor Loadings (Estimate), Loading SEs, and Factor Correlations
Primary Secondary Educator
Estimate SE Estimate SE Estimate SE
REFL by: REFL by: REFL by:
B008G 0.82 0.01 B008G 0.83 0.01 H002G 0.83 0.01
B008H 0.92 0.00 B008H 0.91 0.01 H002H 0.89 0.01
B008I 0.96 0.00 B008I 0.95 0.00 H002I 0.89 0.01
B008J 0.91 0.00 B008J 0.91 0.01 H002J 0.88 0.01
IMPR by: IMPR by: IMPR by:
B009E 0.68 0.01 B009E 0.72 0.01 H001E 0.65 0.03
B009F 0.81 0.01 B009F 0.79 0.01 H001F 0.72 0.02
B009G 0.72 0.01 B009G 0.78 0.01 H001G 0.54 0.03
B009H 0.71 0.01 B009H 0.76 0.01 H001H 0.66 0.02
B009I 0.76 0.01 B009I 0.77 0.01 H001I 0.70 0.02
B009J 0.82 0.01 B009J 0.83 0.01 H001J 0.76 0.02
B009K 0.69 0.01 B009K 0.72 0.01 H001K 0.67 0.02
B009L 0.68 0.01 B009L 0.68 0.01 H001L 0.73 0.02
IMPR with: IMPR with: IMPR with:
REFL 0.81 0.01 REFL 0.81 0.01 REFL 0.78 0.02
note: All p-values associated with the loading estimates are less than 0.005.

285APPENDICES
School Experience
Connecting Classroom Learning to Practice MFB13CLP
A. Observe models of the teaching strategies you were learning in your <courses>
B. Practice theories for teaching mathematics that you were learning in your <courses>
C. Complete assessment tasks that asked you to show how you were applying ideas you were learning in your <courses>
D. Receive feedback about how well you had implemented teaching strategies you were learning in your <courses>
E. Collect and analyze evidence about pupil learning as a result of your teaching methods
F. Test out findings from educational research about difficulties pupils have in learning in your <courses>
G. Develop strategies to reflect upon your professional knowledge
H. Demonstrate that you could apply the teaching methods you were learning in your <courses>
Model Fit Statistics
Primary Secondary Educator
CFI TLI RMSEA CFI TLI RMSEA CFI TLI RMSEA
0.953 0.978 0.064 0.951 0.976 0.065 0.961 0.957 0.061
note: CFI (Comparative Fit Scale), TLI (Tucker Lewis Scale), RMSEA (Root Mean Square Error of Approximation).
Factor Loadings (Estimate), Loading SEs, and Factor Correlations
Primary Secondary Educator
Estimate SE Estimate SE Estimate SE
CLP by: CLP by: CLP by:
B013A 0.67 0.01 B013A 0.70 0.01 I002A 0.65 0.02
B013B 0.73 0.01 B013B 0.72 0.01 I002B 0.63 0.03
B013C 0.81 0.01 B013C 0.80 0.01 I002C 0.64 0.02
B013D 0.76 0.01 B013D 0.71 0.01 I002D 0.75 0.02
B013E 0.78 0.01 B013E 0.78 0.01 I002E 0.78 0.02
B013F 0.76 0.01 B013F 0.79 0.01 I002F 0.72 0.02
B013G 0.68 0.01 B013G 0.73 0.01 I002G 0.60 0.02
B013H 0.75 0.01 B013H 0.76 0.01 I002H 0.77 0.02
note: All p-values associated with the loading estimates are less than 0.005.

THE TEACHER EDUCATION AND DEVELOPMENT STUDY IN MATHEMATICS (TEDS-M) TECHNICAL REPORT286
School Experience
Supervising Teacher Reinforcement of University Goals for Practicum MFB14STR
A. I had a clear understanding of what my school-based <supervising teacher/mentor/instructors> expected of me as a teacher in order to pass the <field experiences/practicum>.
B. My school-based <supervising teacher/mentor/instructors> valued the ideas and approaches I brought from my <university/college> teacher education program.
C. My school-based < supervising teacher/mentor/instructors > used criteria/standards provided by my <university/college> when reviewing my lessons with me.
D. I learned the same criteria or standards for good teaching in my <courses> and in my <field experiences/practicum>.
E. In my <field experience/practicum> I had to demonstrate to my supervising teacher that I could teach according to the same criteria/standards used in my <university/college> <courses>.
Supervising Teacher Feedback Quality MFB14STF
F. The feedback I received from my <supervising teacher/mentor/instructors> helped me improve my understanding of pupils.
G. The feedback I received from my <supervising teacher/mentor/instructors> helped me improve my teaching methods.
H. The feedback I received from my <supervising teacher/mentor/instructors> helped me improve my understanding of the curriculum.
I. The feedback I received from my <supervising teacher/mentor/instructors> helped me improve my knowledge of mathematics content.
Model Fit Statistics
Primary Secondary
CFI TLI RMSEA CFI TLI RMSEA
0.968 0.982 0.057 0.968 0.981 0.059
note: CFI (Comparative Fit Scale), TLI (Tucker Lewis Scale), RMSEA (Root Mean Square Error of Approximation).
Factor Loadings (Estimate), Loading SEs, and Factor Correlations
Primary Secondary
Estimate SE Estimate SE
STR by: STR by:
B014A 0.66 0.01 B014A 0.65 0.02
B014B 0.78 0.01 B014B 0.75 0.02
B014C 0.80 0.01 B014C 0.77 0.01
B014D 0.74 0.01 B014D 0.73 0.01
B014E 0.74 0.01 B014E 0.76 0.01
STF by: STF by:
B014F 0.89 0.01 B014F 0.90 0.01
B014G 0.93 0.01 B014G 0.93 0.01
B014H 0.87 0.01 B014H 0.85 0.01
B014I 0.77 0.01 B014I 0.79 0.01
STF with: STF with:
STR 0.72 0.01 STR 0.69 0.02
note: All p-values associated with the loading estimates are less than 0.005.

287APPENDICES
Program Coherence
Program Coherence MFB15COH
A. Each stage of the program seemed to be planned to meet the main needs I had at that stage of my preparation.
B. Later <courses> in the program built on what was taught in earlier <courses> in the program.
C. The program was organized in a way that covered what I needed to learn to become an effective teacher.
D. The <courses> seemed to follow a logical sequence of development in terms of content and topics.
E. Each of my <courses> was clearly designed to prepare me to meet a common set of explicit standard expectations for beginning teachers.
F. There were clear links between most of the <courses> in my teacher education program.
Model Fit Statistics
Primary Secondary Educator
CFI TLI RMSEA CFI TLI RMSEA CFI TLI RMSEA
0.99 0.995 0.058 0.992 0.996 0.049 0.994 0.995 0.049
note: CFI (Comparative Fit Scale), TLI (Tucker Lewis Scale), RMSEA (Root Mean Square Error of Approximation).
Factor Loadings (Estimate), Loading SEs, and Factor Correlations
Primary Secondary Educator
Estimate SE Estimate SE Estimate SE
COH by: COH by: COH by:
B015A 0.84 0.01 B015A 0.83 0.01 J001A 0.83 0.01
B015B 0.78 0.01 B015B 0.74 0.01 J001B 0.78 0.01
B015C 0.89 0.01 B015C 0.87 0.01 J001C 0.89 0.01
B015D 0.88 0.01 B015D 0.86 0.01 J001D 0.84 0.01
B015E 0.88 0.01 B015E 0.87 0.01 J001E 0.88 0.01
B015F 0.85 0.01 B015F 0.84 0.01 J001F 0.84 0.01
note: All p-values associated with the loading estimates are less than 0.005.
References
Bollen, K. A. (1989). Structural equations with latent variables. New York, NY: Wiley.
Byrne, B. M. (1994). Structural equation modeling with EQS and EQS/Windows. Thousand Oaks, CA: Sage Publications.
Hu, L. T., & Bentler, P. M. (1995). Evaluating model fit. In R. H. Hoyle (Ed.), Structural equation modeling: Concepts, issues,
and applications (pp. 76–99). Thousand Oaks, CA: Sage Publications.
Marsh, H. W., Balla, J. R., & McDonald, R. P. (1988). Goodness-of-fit scales in confirmatory factor analysis: The effect of
sample size. Psychological Bulletin, 103, 391–410.

THE TEACHER EDUCATION AND DEVELOPMENT STUDY IN MATHEMATICS (TEDS-M) TECHNICAL REPORT288
APPENDIx K: Model Fit Statistics for the Opportunity to Learn Scales for Future Teachers and Educators by Country
Primary Future Teachers Secondary Future Teachers Educators
CFI TLI RMSEA CFI TLI RMSEA CFI TLI RMSEA
Tertiary Mathematics
Q1_Chile 0.877 0.886 0.053 0.889 0.894 0.046
Q1_Chinese Taipei 0.824 0.845 0.104 – – –
Q1_Georgia 0.942 0.950 0.034 0.736 0.824 0.120
Q1_Germany 0.986 0.988 0.044 0.912 0.931 0.100
Q1_Malaysia 0.965 0.978 0.050 0.711 0.761 0.129
Q1_Norway 0.924 0.944 0.064 0.863 0.886 0.071
Q1_Philippines 0.888 0.888 0.072 0.804 0.788 0.050
Q1_Poland 0.971 0.982 0.059 – – –
Q1_Russian Fed. 0.907 0.877 0.064 0.928 0.962 0.046
Q1_Singapore 0.966 0.978 0.070 0.957 0.967 0.088
Q1_Spain 0.913 0.917 0.057 – – –
Q1_Switzerland 0.900 0.925 0.058 – – –
Q1_Thailand 0.803 0.813 0.054 – – –
Q1_United States 0.893 0.944 0.071 0.964 0.974 0.049
School Mathematics
Q2_Chile 0.913 0.870 0.067 0.994 0.991 0.016
Q2_Chinese Taipei 0.968 0.956 0.076 0.938 0.945 0.092
Q2_Georgia 0.940 0.905 0.067 0.746 0.704 0.192
Q2_Germany 0.996 0.995 0.042 0.866 0.832 0.075
Q2_Malaysia 0.976 0.972 0.152 0.999 0.999 0.008
Q2_Norway 0.949 0.942 0.029 0.825 0.803 0.080
Q2_Philippines 0.974 0.974 0.089 – – –
Q2_Poland 0.956 0.950 0.137 0.858 0.763 0.125
Q2_Russian Fed. 0.898 0.824 0.057 0.973 0.964 0.072
Q2_Singapore 0.959 0.945 0.081 0.973 0.969 0.081
Q2_Spain 0.968 0.955 0.039 – – –
Q2_Switzerland 0.991 0.989 0.029 0.566 0.518 0.164
Q2_Thailand 0.905 0.893 0.108 0.912 0.912 0.101
Q2_United States 0.981 0.974 0.060 0.861 0.778 0.193
FOUN/INST
Q4_Chile 0.970 0.965 0.039 0.926 0.926 0.069
Q4_Chinese Taipei 0.951 0.949 0.060 0.963 0.955 0.051
Q4_Georgia 0.968 0.964 0.037 0.985 0.982 0.040
Q4_Germany 0.994 0.993 0.034 0.996 0.994 0.020
Q4_Malaysia 0.987 0.988 0.032 0.989 0.992 0.066
Q4_Norway 0.898 0.886 0.080 0.832 0.821 0.076
Q4_Philippines 0.981 0.978 0.032 0.987 0.988 0.026
Q4_Poland 0.967 0.962 0.044 0.891 0.844 0.063
Q4_Russian Fed. 0.963 0.961 0.041 0.975 0.972 0.040
Q4_Singapore 0.967 0.960 0.044 0.920 0.892 0.055
Q4_Spain 0.946 0.942 0.053 – – –
Q4_Switzerland 0.928 0.915 0.056 – – –
Q4_Thailand 0.981 0.978 0.037 0.940 0.935 0.060
Q4_Unoted States 0.945 0.938 0.053 0.980 0.975 0.024
Exhibit K.1

289APPENDICES
Primary Future Teachers Secondary Future Teachers Educators
CFI TLI RMSEA CFI TLI RMSEA CFI TLI RMSEA
PART/READ/SOLV
Q5_Chile 0.892 0.930 0.118 0.903 0.938 0.121 0.989 0.989 0.121
Q5_Chinese Taipei 0.941 0.961 0.099 0.959 0.963 0.101 0.828 0.841 0.280
Q5_Georgia 0.812 0.837 0.181 0.862 0.876 0.187
Q5_Germany 0.974 0.983 0.063 0.958 0.965 0.061 0.931 0.920 0.167
Q5_Malaysia 0.953 0.972 0.120 0.918 0.948 0.175 0.941 0.944 0.153
Q5_Norway 0.883 0.875 0.154 0.846 0.855 0.145
Q5_Philippines 0.949 0.966 0.063 0.943 0.973 0.055 0.962 0.966 0.182
Q5_Poland 0.899 0.915 0.100 0.924 0.937 0.117 – – –
Q5_Russian Fed. 0.941 0.957 0.086 0.944 0.962 0.111 0.788 0.799 0.260
Q5_Singapore 0.955 0.967 0.091 0.907 0.926 0.115
Q5_Spain – – – – – – 0.950 0.947 0.191
Q5_Switzerland 0.914 0.919 0.088 0.833 0.839 0.126 0.916 0.920 0.142
Q5_Thailand 0.967 0.977 0.085 0.973 0.977 0.088 0.964 0.969 0.198
Q5_United States 0.905 0.940 0.102 0.908 0.937 0.078 – – –
IPRA/IPLA
Q6a_Chile 0.859 0.955 0.120 0.929 0.975 0.102 0.961 0.970 0.076
Q6a_Chinese Taipei 0.856 0.946 0.118 0.858 0.936 0.123 0.929 0.924 0.097
Q6a_Georgia 0.865 0.919 0.117 0.929 0.975 0.102
Q6a_Germany 0.926 0.973 0.097 0.868 0.940 0.085 0.889 0.874 0.090
Q6a_Malaysia 0.901 0.968 0.131 0.923 0.974 0.117 0.979 0.985 0.093
Q6a_Norway 0.882 0.939 0.109 0.858 0.919 0.099
Q6a_Philippines 0.936 0.968 0.062 0.955 0.976 0.065 0.984 0.988 0.050
Q6a_Poland 0.908 0.966 0.096 0.951 0.977 0.089 0.931 0.927 0.093
Q6a_Russian Fed. 0.939 0.975 0.064 0.933 0.978 0.068 0.937 0.944 0.060
Q6a_Singapore 0.888 0.954 0.114 0.873 0.947 0.103
Q6a_Spain 0.893 0.967 0.109 – – – 0.927 0.950 0.090
Q6a_Switzerland 0.893 0.944 0.087 0.960 0.979 0.076 0.959 0.951 0.069
Q6a_Thailand 0.934 0.977 0.087 0.909 0.962 0.101 0.934 0.954 0.088
Q6a_United States 0.938 0.977 0.088 0.945 0.976 0.077 – – –
AUSE/APRA
Q6b_Chile 0.952 0.977 0.102 0.937 0.972 0.124 0.935 0.935 0.122
Q6b_Chinese Taipei 0.922 0.956 0.097 0.919 0.956 0.096 – – –
Q6b_Georgia 0.764 0.789 0.189 0.932 0.950 0.134
Q6b_Germany 0.952 0.976 0.145 0.971 0.976 0.088 – – –
Q6b_Malaysia 0.931 0.959 0.172 0.952 0.976 0.119 0.973 0.973 0.120
Q6b_Norway 0.946 0.960 0.103 0.943 0.964 0.101
Q6b_Philippines 0.970 0.981 0.061 0.963 0.973 0.061 – – –
Q6b_Poland 0.954 0.971 0.129 0.941 0.969 0.134 0.958 0.964 0.110
Q6b_Russian Fed. 0.962 0.979 0.075 0.960 0.981 0.073 0.974 0.974 0.068
Q6b_Singapore 0.929 0.951 0.158 0.911 0.954 0.118
Q6b_Spain 0.945 0.971 0.129 – – – 0.974 0.971 0.079
Q6b_Switzerland 0.930 0.959 0.113 0.896 0.915 0.131 – – –
Q6b_Thailand 0.949 0.977 0.100 0.948 0.976 0.111 0.958 0.958 0.085
Q6b_United States 0.957 0.984 0.086 0.923 0.982 0.080 – – –
Exhibit K.1 (contd.)

THE TEACHER EDUCATION AND DEVELOPMENT STUDY IN MATHEMATICS (TEDS-M) TECHNICAL REPORT290
Primary Future Teachers Secondary Future Teachers Educators
CFI TLI RMSEA CFI TLI RMSEA CFI TLI RMSEA
EPSS/EPAP
Q7_Chile 0.949 0.949 0.038 1.000 1.022 0.000
Q7_Chinese Taipei 0.953 0.933 0.042 – – –
Q7_Georgia 0.989 0.987 0.021 1.000 1.066 0.000
Q7_Germany 0.931 0.916 0.035 0.855 0.815 0.064
Q7_Malaysia 0.996 0.995 0.016 0.934 0.928 0.088
Q7_Norway 0.975 0.975 0.035 0.982 0.981 0.034
Q7_Philippines 0.934 0.934 0.035 0.906 0.906 0.043
Q7_Poland 0.962 0.959 0.046 0.946 0.930 0.065
Q7_Russian Fed. 0.982 0.984 0.017 1.000 1.001 0.000
Q7_Singapore 0.994 0.992 0.028 0.532 0.532 0.181
Q7_Spain 0.894 0.879 0.065 – – –
Q7_Switzerland 1.000 1.008 0.000 0.960 0.951 0.044
Q7_Thailand 0.928 0.961 0.034 0.985 0.982 0.020
Q7_United States 0.979 0.979 0.029 0.929 0.910 0.050
Diversity
Q8_Chile 0.954 0.971 0.132 0.977 0.985 0.111 0.980 0.984 0.130
Q8_Chinese Taipei 0.980 0.982 0.132 0.972 0.975 0.111 0.961 0.953 0.241
Q8_Georgia 0.944 0.944 0.158 0.966 0.983 0.142
Q8_Germany 0.912 0.912 0.116 0.920 0.908 0.108 0.942 0.942 0.198
Q8_Malaysia 0.965 0.980 0.166 0.961 0.978 0.145 0.975 0.986 0.150
Q8_Norway 0.967 0.971 0.120 0.941 0.949 0.140
Q8_Philippines 0.955 0.966 0.090 0.935 0.954 0.128 0.966 0.972 0.131
Q8_Poland 0.973 0.980 0.097 0.975 0.979 0.114 0.952 0.962 0.199
Q8_Russian Fed. 0.956 0.963 0.116 0.963 0.974 0.121 0.951 0.958 0.145
Q8_Singapore 0.968 0.977 0.151 0.959 0.964 0.160
Q8_Spain 0.946 0.969 0.141 – – – 0.942 0.962 0.214
Q8_Switzerland 0.943 0.943 0.149 0.956 0.939 0.183 0.902 0.902 0.303
Q8_Thailand 0.945 0.953 0.183 0.955 0.961 0.168 0.975 0.986 0.127
Q8_United States 0.972 0.983 0.101 0.974 0.985 0.094 – – –
REFL/IMPR
Q89_Chile 0.969 0.990 0.094 0.964 0.989 0.098 0.959 0.972 0.093
Q89_Chinese Taipei 0.977 0.989 0.078 0.977 0.989 0.107 0.964 0.964 0.088
Q89_Georgia 0.935 0.970 0.128 0.942 0.950 0.146
Q89_Germany 0.940 0.968 0.079 0.959 0.971 0.064 0.929 0.929 0.123
Q89_Malaysia 0.974 0.993 0.102 0.977 0.992 0.109 0.980 0.991 0.078
Q89_Norway 0.974 0.986 0.071 0.968 0.986 0.065
Q89_Philippines 0.979 0.989 0.053 0.977 0.992 0.056 0.987 0.991 0.058
Q89_Poland 0.974 0.992 0.080 0.977 0.990 0.110 0.941 0.975 0.120
Q89_Russian Fed. 0.965 0.981 0.084 0.956 0.986 0.087 0.945 0.968 0.078
Q89_Singapore 0.978 0.992 0.085 0.973 0.990 0.084
Q89_Spain 0.967 0.990 0.074 – – – 0.953 0.964 0.085
Q89_Switzerland 0.950 0.970 0.073 0.942 0.962 0.094 0.891 0.926 0.114
Q89_Thailand 0.969 0.991 0.080 0.974 0.990 0.082 0.971 0.984 0.122
Q89_United States 0.963 0.987 0.074 0.974 0.985 0.070 – – –
Exhibit K.1 (contd.)

291APPENDICES
Primary Future Teachers Secondary Future Teachers Educators
CFI TLI RMSEA CFI TLI RMSEA CFI TLI RMSEA
Connecting to Practice
Q13_Chile 0.960 0.983 0.105 0.979 0.991 0.082 0.907 0.925 0.171
Q13_Chinese Taipei 0.926 0.966 0.132 0.900 0.953 0.159 0.922 0.948 0.172
Q13_Georgia 0.975 0.988 0.093 0.928 0.937 0.245
Q13_Germany 0.946 0.946 0.059 0.914 0.938 0.059 0.895 0.863 0.092
Q13_Malaysia 0.953 0.975 0.138 0.975 0.987 0.098 0.977 0.982 0.129
Q13_Norway 0.935 0.948 0.091 0.956 0.964 0.066
Q13_Philippines 0.951 0.951 0.101 0.986 0.989 0.053 0.956 0.970 0.116
Q13_Poland 0.912 0.903 0.124 0.879 0.925 0.152 0.949 0.949 0.110
Q13_Russian Fed. 0.932 0.941 0.088 0.911 0.948 0.115 0.940 0.964 0.089
Q13_Singapore 0.940 0.962 0.107 0.915 0.940 0.124
Q13_Spain 0.959 0.970 0.086 – – – 0.951 0.965 0.098
Q13_Switzerland 0.950 0.961 0.075 0.932 0.947 0.099 0.920 0.925 0.093
Q13_Thailand 0.931 0.963 0.106 0.951 0.966 0.103 0.952 0.976 0.186
Q13_United States 0.962 0.983 0.076 0.973 0.984 0.074 – – –
Supervising Teacher
Q14_Chile 0.972 0.982 0.105 0.982 0.991 0.076
Q14_Chinese Taipei 0.991 0.993 0.064 0.998 0.998 0.036
Q14_Georgia 0.993 0.996 0.062 0.997 0.997 0.073
Q14_Germany 0.973 0.977 0.064 0.946 0.950 0.074
Q14_Malaysia 0.980 0.990 0.121 0.981 0.993 0.099
Q14_Norway 0.955 0.958 0.109 0.960 0.965 0.086
Q14_Philippines 0.981 0.982 0.053 0.996 0.997 0.037
Q14_Poland 0.978 0.986 0.059 0.987 0.993 0.058
Q14_Russian Fed. 0.978 0.978 0.053 0.980 0.988 0.060
Q14_Singapore 0.957 0.974 0.130 0.968 0.977 0.125
Q14_Spain 0.959 0.964 0.080 – – –
Q14_Switzerland 0.871 0.878 0.116 0.986 0.986 0.052
Q14_Thailand 0.900 0.933 0.111 0.916 0.942 0.095
Q14_United States 0.973 0.985 0.074 0.980 0.982 0.062
Coherence
Q15_Chile 0.988 0.994 0.078 0.975 0.986 0.125 0.990 0.991 0.077
Q15_Chinese Taipei 0.949 0.957 0.139 0.907 0.893 0.186 0.959 0.959 0.169
Q15_Georgia 0.997 0.998 0.049 0.962 0.962 0.182
Q15_Germany 0.976 0.985 0.071 0.960 0.960 0.074 0.983 0.986 0.082
Q15_Malaysia 0.984 0.992 0.133 0.993 0.996 0.089 0.958 0.958 0.197
Q15_Norway 0.978 0.981 0.080 0.955 0.960 0.117
Q15_Philippines 0.983 0.980 0.075 0.982 0.988 0.080 0.995 0.996 0.055
Q15_Poland 0.980 0.986 0.093 0.992 0.995 0.057 0.975 0.986 0.105
Q15_Russian Fed. 0.983 0.988 0.049 0.990 0.992 0.056 0.981 0.986 0.067
Q15_Singapore 0.989 0.992 0.116 0.990 0.994 0.075
Q15_Spain 0.972 0.983 0.088 – – – 0.991 0.994 0.054
Q15_Switzerland 0.954 0.948 0.089 0.995 0.995 0.043 – – –
Q15_Thailand 0.980 0.982 0.097 0.973 0.973 0.138 0.986 0.988 0.118
Q15_United States 0.990 0.995 0.074 0.993 0.994 0.058 – – –
note: CFI (Comparative Fit Scale), TLI (Tucker Lewis Scale), RMSEA (Root Mean Square Error of Approximation).
Exhibit K.1 (contd.)

THE TEACHER EDUCATION AND DEVELOPMENT STUDY IN MATHEMATICS (TEDS-M) TECHNICAL REPORT292
APPENDIx L: Changes for Calibration of MCK/MPCK Primary Items
Item Action Comment
101 Drop 101B and 101D 101B directly contradicts 101A.
101D cannot be true; otherwise A, B, and C would be unanswerable.
102 Drop 102C Redundancy but no dependency. 102C has poorest fit (MNSQ = 1.18).
103 Retain 103A
Combine 103B and 103B2 to one item Some dependency between 103A and 103B.
Score 2 if B1 and B2 correct; 1 if one correct, 0 if neither correct.
107 No change No dependencies among items. Each had good fit (1.01 < MNSQ < 1.09).
202 No change No dependencies among items. Each had good fit (0.84 < MNSQ < 1.13).
205A Deleted
209B Deleted
301 Deleted B1,B2
302 Deleted A1, A4
305B Deleted
306B Deleted
308 Recoded Recoding response 1 as 0 and response 2 as 1.
311 No change No dependencies among items. Each had good fit (0.87 < MNSQ < 1.07).
403 Convert to one item Serious dependencies—should have been a single MC item.
All three correct, score 2, any correct score 1, otherwise 0.
411 Deleted
413 Deleted 413B
510 Convert to three items:
A1A2, A3A4, A5A6 Serious dependencies in each pair.
Score each new item 1 if both correct, otherwise 0.
Exhibit L.1: Primary items

293APPENDICES
APPENDIx M: Changes for Calibration of MCK/MPCK Secondary Items
Item Action Comment
601 No change No dependencies, satisfactory fit (0.5 < MNSQ < 1.11).
603C Deleted
609F Deleted
609 Convert to two items: All items are dependent on knowledge that .999… = 1.
Delete C and F Score each newly constructed item 1 if all correct, otherwise 0
Combine A and E
Combine B and D.
610B Deleted
613 Drop C Some dependency in that answering A correctly makes C obvious. No fit problems.
614 Drop 614A Dependency because 614A and 614B contradict each other. Only one can be true.
713 No change No dependencies; adequate fit (0.94 < MNSQ < 101).
808 Convert to three items: Serious dependencies in each pair.
A1A2, A3A4, A5A6 Score each new item 1 if both correct, otherwise 0
809D Deleted
812 812B4 rescaled 812B2 has already been deleted.
812B4 has already been recoded. Both of the responses 1 and 2 in the raw file are coded as correct response and scored as 1. Response 3 is coded as incorrect response and scored as 0.
Exhibit M.1: Secondary items

THE TEACHER EDUCATION AND DEVELOPMENT STUDY IN MATHEMATICS (TEDS-M) TECHNICAL REPORT294
APPENDIx N: Control Parameters for Model and Case Estimation: Mathematical Content Knowledge and Mathematics Pedagogical Content Knowledge
CALIBRATION
codes 0,1,2,3,4,5,7,9; Note: Code 6 (Not reached) is set update=yes,warnings=no, iterlimit=200, constraint=cases; counted as missing
caseweight eqweight;
model item + item*step;
estimate ! method=quadrature,iter=15000,
nodes=100,conv=0.00001,stderr=quick,fit=yes;
export parameters >> Item parameters.dat;
ESTIMATION
codes 0,1,2,3,4,5,6,7,9; Note: Code 6 (Not reached) is set update=yes,warnings=no, iterlimit=200, constraint=cases; counted as incorrect
import anchor_parameters Item parameters.dat;
model item + item*step;
estimate ! method=quadrature,iter=15000,
nodes=100,conv=0.00001,stderr=quick,fit=yes;
show cases ! estimates=mle >> Case Estimates.dat;

295APPENDICES
Scale Variable Name Dichotomously-Scored Items Partial Credit Items
APPENDIx O: Mathematics Content Knowledge and Mathematics Pedagogical Content Knowledge Scales
Mathematics Content Knowledge (Primary)
MCK MFC101A MFC101C MFC102A MFC102B MFC103A MFC104 MFC106 MFC109 MFC110 MFC111 MFC201A MFC202A MFC202B MFC202C MFC202D MFC203 MFC204 MFC205B MFC205C MFC206A MFC207 MFC209A MFC209C MFC211 MFC301A MFC301C MFC302A2 MFC302A3 MFC303 MFC304 MFC305A MFC305C MFC306A MFC306C MFC307A MFC308 MFC309A MFC309B MFC309C MFC309D MFC310 MFC401 MFC402A MFC402B MFC402C MFC402D MFC404A MFC404B MFC404C MFC404D MFC407A MFC407B MFC408 MFC412A MFC412B MFC413A MFC501 MFC502A MFC503A MFC503B MFC503C MFC503D MFC504 MFC507A MFC507B MFC507C MFC508 MFC510A MFC510B MFC510C
MFC509 MFC511 MFC103B12 MFC403ABC
Mathematics Pedagogical Content Knowledge (Primary)
MPCK MFC107A MFC107B MFC107C MFC107D MFC108 MFC206B MFC210 MFC311A MFC311B MFC311C MFC311D MFC312 MFC405A MFC405B MFC406A MFC406B MFC406C MFC406D MFC413B MFC506 MFC512
MFC105A MFC105B MFC201B MFC208A MFC208B MFC302B MFC307B MFC409 MFC410 MFC502B MFC505 MFC513
Mathematics Content Knowledge (Secondary)
MCK MFC601A MFC601B MFC601C MFC601D MFC602 MFC604A1 MFC604A2 MFC606 MFC607 MFC608 MFC609A MFC609B MFC610A MFC610C MFC610D MFC612 MFC613A MFC613B MFC613D MFC614B MFC614C MFC615 MFC701B MFC705A MFC705B MFC706A MFC706B MFC706C MFC706D MFC707A MFC707B MFC707C MFC708A MFC708B MFC708C MFC708D MFC710A MFC710B MFC710C MFC713A MFC713B MFC713C MFC713D MFC801A MFC801B MFC801C MFC801D MFC801E MFC802A MFC802B MFC802C MFC802D MFC803A MFC803B MFC803C MFC803D MFC804 MFC806A MFC809A MFC809B MFC809C MFC811B MFC813 MFC609BD MFC609A MFC808A MFC808B MFC808C
MFC605A MFC605B MFC703 MFC704 MFC711 MFC714 MFC805 MFC807 MFC812A MFC814
Mathematics Pedagogical Content Knowledge (Secondary)
MPCK MFC603A MFC603B MFC603D MFC604B MFC611A MFC611B MFC611C MFC611D MFC701A1 MFC701A2 MFC701A3 MFC701A4 MFC702 MFC709A MFC709B MFC709C MFC712A MFC712B MFC712C MFC712D MFC715 MFC806B MFC810 MFC811A MFC812B1 MFC812B3 MFC812B4
Exhibit O.1

THE TEACHER EDUCATION AND DEVELOPMENT STUDY IN MATHEMATICS (TEDS-M) TECHNICAL REPORT296
APPENDIx P: TEDS-M Test Reliabilities
Exhibit P.1
Primary MCK
Sample Mean Standard deviation Reliability Standard error of measurement
International 0.078 1.156 0.83 0.482
Primary MPCK
Sample Mean Standard deviation Reliability Standard error of measurement
International -0.060 1.024 0.66 0.594
Secondary MCK
Sample Mean Standard deviation Reliability Standard error of measurement
International 0.120 1.110 0.91 0.331
Secondary MPCK
Sample Mean Standard deviation Reliability Standard error of measurement
International 0.087 1.223 0.72 0.644

297APPENDICES
APPENDIx Q: Anchor Point Descriptions
Anchor Point 1
Future teachers of primary school mathematics at Anchor Point 1 are successful
at performing basic computations with whole numbers, understand properties of
operations with whole numbers, and are able to reason about related concepts such
as odd or even numbers. They are able to solve some problems with fractions. Future
teachers at this anchor point are successful at visualizing and interpreting two-
dimensional and three-dimensional geometric figures, and can solve simple problems
about perimeter. They can also understand straightforward uses of variables and the
concept of equivalence, and can solve problems involving simple expressions and
equations.
Future teachers at Anchor Point 1 are able to apply whole number arithmetic in simple
problem-solving situations; however, they tend to over-generalize and have difficulty
solving abstract problems and those requiring multiple steps. They have limited
understanding of the concept of least common multiple, the number line, and the
density of the real numbers. Their knowledge of proportionality and multiplicative
reasoning is weak. They have difficulty solving problems that involve coordinates and
problems about relations between geometric figures. Future teachers at this anchor
point can make simple deductions, but they have difficulty reasoning about multiple
statements and relationships among several mathematical concepts.
Anchor Point 2
Future teachers at Anchor Point 2 are successful at the mathematical tasks at Anchor
Point 1. In addition, future teachers at Anchor Point 2 are more successful than future
teachers at Anchor Point 1 at using fractions to solve story problems, and they can
recognize examples of rational and irrational numbers. They know how to find the
least common multiple of two numbers in a familiar context, and can recognize that
some arguments about whole numbers are logically weak. They are able to determine
areas and perimeters of simple figures, and have some notion of class inclusion among
polygons. Future teachers at Anchor Point 2 also have some familiarity with linear
expressions and functions.
However, while future primary teachers at Anchor Point 2 can solve some problems
involving proportional reasoning, they have trouble reasoning about factors, multiples,
and percentages. They are unable to solve problems about area of obtuse-angled triangles
involving coordinate geometry. They do not recognize applications of quadratic or
exponential functions, and have limited skills in algebraic reasoning.
Overall, future teachers at Anchor Point 2 do well on items testing “knowing,” and on
standard problems about numbers, geometry, and algebra classified as “applying,” but
they are not able to answer problems that require more complex reasoning in applied
or nonroutine situations.

THE TEACHER EDUCATION AND DEVELOPMENT STUDY IN MATHEMATICS (TEDS-M) TECHNICAL REPORT298
Examples
The examples below refer to the TEDS-M released items. For more detail on these
items and for a complete listing of the TEDS-M released items, consult the User
Guide for the TEDS-M International Database (Brese & Tatto, 2012).
Anchor Point 1
Following are examples of items that future primary teachers at Anchor Point 1
answered successfully at least 70 percent of the time.
• Reason about fractions to interpret simple numerical statements relating to a
word problem.
• Identify the least likely outcome for a simple random experiment involving
fractions with different denominators.
• Determinewhether subtractionanddivisionare commutativeandaddition is
associative. (See released items MFC202A, MFC202B, and MFC202C)
• Interpret a diagram of a pan balance to determine the mass of an unknown
quantity. (See released item MFC303)
• Determinewhethertheresultsofparticularoperationswithevenoroddnumbers
are odd or even. Recognize a net for a triangular-based prism. (See released item
MFC501)
• Interpretabarchartandsomeverbalcluestosolveaproblemaboutthenumber
of items sold. (See released item MFC502A)
• Identifycommonrationalnumbers.(SeereleaseditemMFC503B)
Following are examples of items that future primary teachers at Anchor Point 1
answered successfully less than 50 percent of the time.
• Determinewhether subtractionofwholenumbers is associative. (See released
item MFC202D)
• IdentifythecorrectVenndiagramtoillustratetherelationbetweenfourtypesof
quadrilateral. (See released item MFC204)
• Understandthatthereareaninfinitenumberofdecimalnumbersbetweentwo
given numbers. (See released item MFC304)
• Findalinearalgebraicruletodescribeageneralsituationillustratedbyadiagram.
(See released item MFC308)
• Findtheareaofatriangledrawnonagrid.(SeereleaseditemMFC408)
• Identifyanalgebraic representationofanumerical relationshipbetween three
consecutive even numbers.
Anchor Point 2
The following are examples of items that future primary teachers at Anchor Point 2
answered successfully at least 70 percent of the time.
• Identifythetruthofastatementaboutthesolvabilityofawordprobleminvolving
proportional reasoning.
• Determinewhether subtractionofwholenumbers is associative. (See released
item MFC202D)

299APPENDICES
• Determinetheareaofawalkwayaroundarectangularpool.(Seereleaseditem
MFC203)
• InterpretVenndiagramsrepresentingrelationshipsbetweenquadrilaterals.(See
released item 204)
• Identify the solution to a word problem involving a rate and requiring some
proportional reasoning. (See released item 206A)
• Recognizewhethersomestoryproblemscorrectlymodelthesubtractionoftwo
fractions.
• Identifythedifferencebetweentheperimeterandareaofarectangledrawnon
dot paper.
• Indicate whether π and 49 are rational or irrational. (See released items
MFC503A and MFC503C)
• Identify a future term in a linear rule represented visually. (See released item
MFC508)
The following are examples of items that future teachers at Anchor Point 2 answered
successfully less than 50 percent of the time.
• Useproportionalreasoningtointerpretnumericalstatementsinvolvingpercentage
relating to a word problem.
• Identifythetrueprobabilitystatementrelatingtoagameinvolvingtwodice.(See
released item MFC106)
• Writeacorrectstatementaboutthereflectionimageofthepointwithcoordinates
(a, b) over the x-axis.
• Identifyasetofgeometricstatementsthatuniquelydefineasquare.
• Describe properties of the function defined by the ratio of the area and
circumference of a circle
• Identifywhether – 32
is rational or irrational. (See released item MFC503D)
• Determine the conditions for which one linear algebraic expression is greater
than or equal to another. (See released item MFC509)
• Comparelengthsonacubeandacylinderwithcommondimensions.(Seereleased
item MFC513)
Anchor Point Descriptions for the MPCK of Future Teachers Who Took the Primary Test
note: There was only one anchor point for the MPCK test.
Future primary teachers at this anchor point are able to recognize the correctness of a
teaching strategy for a particular concrete example, and are able to evaluate students’
work when the mathematics content is conventional or typical of primary grades. They
areabletoidentifythearithmeticelementsofsingle-stepstoryproblemsthatinfluence
their difficulty (see released item MFC505).
While future primary teachers at the primary MPCK anchor point have some ability to
interpret student solution methods, identify the skills inherent in a task, and identify
student difficulties, they may not be able to articulate them as clearly and concisely as

THE TEACHER EDUCATION AND DEVELOPMENT STUDY IN MATHEMATICS (TEDS-M) TECHNICAL REPORT300
more able future teachers (see released item MFC502B). Similarly, future teachers at
this anchor point can partially identify and compare the attributes of the graphical
representations of young children but not as well as their more able counterparts (see
released item MFC410).2
However future teachers at this anchor point may not know how to use concrete
representations to support students’ learning (see released item MFC312), and may not
recognize how a student’s thinking is related to a particular algebraic representation (see
released item MFC108). They may not sufficiently understand some measurement or
probability concepts in order to reword or design a task (see released item MFC307B).
Future teachers at this anchor point may not know why a particular teaching strategy
would make sense (see released item MFC513), whether a strategy can be generalized to
a larger class of problems, or if it will always work. They may be unaware of common
misconceptions and unable to conceive useful representations of numerical concepts
(see released items MFC208A & MFC208B).
Anchor Point Descriptions for the MCK of Future Teachers Who Took the Lower-Secondary Test
Anchor Point 1
Future teachers of lower-secondary school mathematics who perform at Anchor Point
1 know concepts related to whole numbers, integers, and rational numbers and can do
computations with them. They also can evaluate algebraic expressions and solve simple
linear and quadratic equations, particularly those that are solvable by substitution or
trial and error. They are familiar with standard geometric figures in the plane and space,
and can identify and apply simple relations in plane geometry. They are also able to
interpret and solve more complex problems in number, algebra, and geometry if the
context or the problem type is a commonly taught topic in lower-secondary schools.
However, future teachers at Anchor Point 1 have difficulty describing general patterns,
solving multistep problems if these have complex linguistic or mathematical relations,
and relating equivalent representations of concepts. They tend to over-generalize
concepts and do not have a good grasp of mathematical reasoning. In particular, they do
not consistently recognize faulty arguments or are able to justify or prove conclusions.
Anchor Point 2
Future teachers who perform at Anchor Point 2 successfully answer all the mathematics
problems in Anchor Point 1. In addition, they seem to have a more robust notion of
function, especially of linear, quadratic, and exponential functions, are better able to
read, analyze, and apply abstract definitions and notation, and have greater ability
than a future lower-secondary teacher at Anchor Point 1 to make and recognize simple
arguments. They also know some definitions and theorems from university-level
courses such as calculus, abstract algebra, and college geometry, and can apply them in
straightforward situations.
However, future teachers at Anchor Point 2 are rarely consistently successful in solving
problems stated in purely abstract terms, or with problems containing foundational
material such as axiomatic systems in geometry. Additionally, they make errors in
2 MFC410 and MFC502B are examples of where future teachers at the anchor point have been awarded partial credit for their responses, thereby indicating some proficiency.

301APPENDICES
logical reasoning, such as not attending to all conditions of definitions or theorems
and confusing the truth of a statement with the validity of an argument. They are also
unable to recognize valid proofs of more complex statements. Even though they may
be able to make some progress in constructing a mathematical proof, future teachers
performing at Anchor Point 2 are not generally successful at completing mathematical
proofs.
Examples
The examples below refer to the TEDS-M released items. For more detail on these
items and for a complete listing of the TEDS-M released items, consult the User
Guide for the TEDS-M International Database (Brese & Tatto, 2012).
Anchor Point 1
The following are examples of items that future lower-secondary teachers at Anchor
Point 1 answered successfully at least 70 percent of the time.
• Solve a simple linear or quadratic equation and identify the smallest set of
numbers to which the solution belongs.
• Solve word problems involving ratios of whole numbers (see released item
MFC604A1) or sums of consecutive integers.
• Determineifanglesinatrianglearecongruentusinggiveninformation.
• Determinethenumberoflinesofsymmetryinaregularpolygon.(Seereleased
items MFC808A1, MFC808A2, MFC808B1, and MFC808B2)
• Determinewhetheragiventranslationorreflectionmapsonefiguretoanother.
The following are examples of items that future lower-secondary teachers at Anchor
Point 1 answered successfully less than 50 percent of the time.
• Solveawordproblemwithamorecomplexlinguisticorlogicalstructureorone
in which the choice of variable is not obvious. (See released item MFC604A2)
• Generalizepatternsinvolvinglinearandnonlineargrowth.
• Determine whether a given composite of transformations maps one figure to
another.
• Solveequationsinonevariableanddescribethesolutionsetinthecoordinate
plane or space. (See released items MFC705A and MFC705B)
• Writeaproofofastatementaboutthesumoftwofunctions.(Seereleaseditem
MFC711)
• Identifyanappropriatedefinitionforafunctionthatiscontinuousatapoint.
• Identifytheconsequencesofreplacingaparticularaxiomingeometry.
Anchor Point 2
The following are examples of items that future lower-secondary teachers at Anchor
Point 2 answered successfully at least 70 percent of the time.
• Solveproblemsaboutpropertiesofanglesortriangles.
• Determine if the relation“is similar to” satisfies the reflexive, symmetric, and
transitive properties.

THE TEACHER EDUCATION AND DEVELOPMENT STUDY IN MATHEMATICS (TEDS-M) TECHNICAL REPORT302
• Identifya situation that ismodeledbyanexponential function. (Seereleased
items MFC710A, B, and C)
• Identifytheconsequencesofreplacingaparticularaxiomingeometry.
• Makesomeprogresstowardsolvingaproblemaboutconditionalprobability.
• Writepartofaproof related to the sumof two functions. (See released item
MFC711)
• Recognizethataparticularalgebraicargumentaboutthedivisibilityofasquare
of any natural number is a valid proof. (See released item MFC802B)
The following are examples of items that future lower-secondary teachers at Anchor
Point 2 answered successfully less than 50 percent of the time.
• Determinepropertiesofabsolutevalue.
• Findsolutionstoequationsinthesetofcomplexnumbersorintegersmodulo
6.
• Interpretstandarddeviationwhendistributionsarepresentedvisually.
• Determinewhetherstatementsaboutabstractconceptsareequivalent.
• Workwithfoundationalmaterialssuchasaxiomaticsystemsingeometry.
• Write a complete proof about the sum of two functions. (See released item
MFC711)
• Solveproblemsaboutcombinations.(SeereleaseditemMFC804)
Anchor Point Descriptions for the MPCK of Future Teachers Who Took the Lower-Secondary Test
note: There was only one anchor point for the MPCK test.
Future lower-secondary teachers who are at the anchor point on the MPCK scale have
a variable range of knowledge of the lower-secondary curriculum and of planning for
instruction. For instance, they know prerequisite knowledge and steps for teaching a
derivation of the quadratic formula (see released items MFC712A, B, C, and D) and
can determine the consequences of moving the concept of square root from the lower-
secondary to the upper-secondary school mathematics curriculum. However, they have
difficulty deciding what would be a helpful mathematics concept to use in a proof about
isosceles triangles.
Future teachers at this anchor point also have some skill in enacting school mathematics.
They can sometimes correctly evaluate students’ mathematical work. For example,
they can determine whether a student’s diagram satisfies certain given conditions in
geometry, and they can recognize a student’s correct prose argument about divisibility
of whole numbers (see released item MFC709A).
However, they cannot identify the correct solution to a trigonometry problem, and
cannot consistently apply a rubric with descriptions of three performance levels to
evaluate students’ solutions to a problem about linear and nonlinear growth.

303APPENDICES
Future teachers at this anchor point are successful at analyzing students’ errors when the
students’ work involves single-step or short explanations, but they are less successful at
identifying or analyzing errors in more complex mathematical situations. For instance,
future teachers at this level can identify an error in misreading a histogram (see released
item MFC806B), but cannot explain why one word problem is more difficult for students
than another (see released item MFC604B).
In general, future teachers’ own depth of mathematical understanding seems to
influence their ability to interpret students’ thinking or to determine appropriate
responses to students. Because future teachers at this level lack a well-developed concept
of the meaning of a valid mathematical argument, they have difficulty evaluating some
invalid arguments. In particular, they do not recognize that examples are not sufficient
to constitute a proof (see released item MFC709B). They also are not able to recognize
whether certain word problems correctly exemplify expressions involving the division
of fractions.
Reference
Brese, F., & Tatto, M. T. (Eds.). (2012). User guide for the TEDS-M international database. Amsterdam,
the Netherlands: International Association for the Evaluation of Educational Achievement (IEA).

THE TEACHER EDUCATION AND DEVELOPMENT STUDY IN MATHEMATICS (TEDS-M) TECHNICAL REPORT304
APP
END
Ix R
: Pr
og
ram
-Gro
up
ing
s: F
utu
re T
each
ers
(Pri
mar
y)
Pro
gra
m-G
roup
C
oun
try
Pro
gra
ms
Num
ber
of
G
rad
e Sp
an
R
esp
on
den
ts
Low
H
igh
Geo
rgia
Ba
chel
or in
Ped
agog
y (fi
ve y
ears
) 21
1
4
Ba
chel
or in
Ped
agog
y (f
our
year
s)
485
Ger
man
y Pr
imar
y w
ith m
athe
mat
ics
as a
focu
s (T
ype
1A)
360
1 4
Pr
imar
y w
ithou
t m
athe
mat
ics
as a
focu
s (T
ype1
B)
162
1 4
Pr
imar
y an
d Se
cond
ary
gene
ralis
t (T
ype
2B)
413
1 4
Pola
nd *
B.
Ped
agog
y, in
tegr
ated
teac
hing
(fir
st c
ycle
, ful
ltim
e)
510
1 3
B.
Ped
agog
y, in
tegr
ated
teac
hing
(lon
g cy
cle,
ful
ltim
e)
268
1 3
B.
Ped
agog
y, in
tegr
ated
teac
hing
(fir
st c
ycle
, par
ttim
e)
828
1 3
B.
Ped
agog
y, in
tegr
ated
teac
hing
(lo
ng c
ycle
, par
ttim
e)
206
1 3
B.
Ped
agog
y, in
tegr
ated
teac
hing
(se
cond
cyc
le, f
ullti
me)
72
1
3
B.
Ped
agog
y, in
tegr
ated
teac
hing
(se
cond
cyc
le, p
artt
ime)
29
3 1
3
Russ
ian
Fede
ratio
n Pr
imar
y te
ache
r ed
ucat
ion
2,26
6 1
4
Switz
erla
nd
Teac
her
for
kind
erga
rten
and
prim
ary
to G
rade
2
75
K
2
Te
ache
r fo
r ki
nder
gart
en a
nd p
rimar
y to
Gra
de 3
46
K
3
Chi
nese
Tai
pei
Elem
enta
ry te
ache
r ed
ucat
ion
923
1 6
Phili
ppin
es
Bach
elor
in E
lem
enta
ry E
duca
tion
592
1 6
Sing
apor
e Ba
chel
or o
f A
rts
in E
duca
tion
(Prim
ary)
, fou
r ye
ars
31
1
6
Ba
chel
or o
f Sc
ienc
e in
Edu
catio
n (P
rimar
y), f
our
year
s 36
1
6
D
iplo
ma
of E
duca
tion
(Prim
ary)
, Opt
ion
C, t
wo
year
s (c
onse
cutiv
e)
107
1 6
Po
st-G
radu
ate
Dip
lom
a in
Edu
catio
n (P
rimar
y), O
ptio
n C
, one
yea
r (c
onse
cutiv
e)
89
1 6
Spai
n Te
ache
r of
prim
ary
educ
atio
n 1,
093
1 6
Uni
ted
Stat
es
Teac
her
for
prim
ary
scho
ol G
rade
s 1
to 6
55
6 1
6
Te
ache
r fo
r pr
imar
y sc
hool
, Gra
des
3 to
6
24
3 6
Te
ache
r fo
r ki
nder
gart
en a
nd p
rimar
y sc
hool
, Gra
de 6
23
5 K
6
Pr
imar
y te
ache
r ed
ucat
ion
(con
curr
ent)
1,
137
1 4–
5
Prog
ram
-Typ
e 2.
Prim
ary
Gen
eral
ists
(to
Gra
de 6
M
axim
um)
Prog
ram
-Typ
e 1.
Low
er P
rimar
y G
ener
alis
ts
(to
Gra
de 4
M
axim
um)
Exh
ibit
R.1

305APPENDICES
Pro
gra
m-G
roup
C
oun
try
Pro
gra
ms
Num
ber
of
G
rad
e Sp
an
R
esp
on
den
ts
Low
H
igh
Bots
wan
a D
iplo
ma
in P
rimar
y Ed
ucat
ion
86
1 7
Chi
le
Gen
eral
ist
teac
hers
(Gra
des
1 to
8)
657
1 8
Nor
way
**
ALU
–gen
eral
teac
hers
for
prim
ary
and
low
er s
econ
dary
(plu
s m
athe
mat
ics)
15
9 1
10
A
LU–g
ener
al te
ache
rs fo
r pr
imar
y an
d lo
wer
sec
onda
ry
392
1 10
Ger
man
y Pr
imar
y an
d se
cond
ary—
mat
hem
atic
s as
a fo
cus
97
1 10
Mal
aysi
a Ba
chel
or o
f Ed
ucat
ion
(Prim
ary)
17
1
6
D
iplo
ma
of E
duca
tion
(Mat
hem
atic
s)
47
1 6
M
alay
sian
Tea
chin
g D
iplo
ma
(Mat
hem
atic
s)
512
1 6
Pola
nd *
M
athe
mat
ics
(firs
t cy
cle,
ful
ltim
e, te
ache
r ed
ucat
ion)
_1
134
4 9
M
athe
mat
ics
(long
cyc
le, f
ullti
me,
teac
her
educ
atio
n)_3
12
3 4
12
M
athe
mat
ics
(firs
t cy
cle,
par
ttim
e, te
ache
r ed
ucat
ion)
_4
20
4 9
M
athe
mat
ics
(long
cyc
le, p
artt
ime,
teac
her
educ
atio
n)_6
23
4
12
Sing
apor
e D
iplo
ma
of E
duca
tion,
Prim
ary
Opt
ion
A, t
wo
year
s 45
1
6
Po
st-G
radu
ate
Dip
lom
a of
Edu
catio
n (P
rimar
y), O
ptio
n A
, one
yea
r 72
1
6
Thai
land
Ba
chel
or o
f Ed
ucat
ion
(five
yea
rs)
599
1 12
G
radu
ate
Dip
lom
a in
the
Tea
chin
g Pr
ofes
sion
61
1
12
Uni
ted
Stat
es
Prim
ary
and
seco
ndar
y te
ache
r ed
ucat
ion
(con
curr
ent)
18
4 4
9
Pr
imar
y an
d se
cond
ary
teac
her
educ
atio
n (c
onse
cutiv
e)
7 4
9
Not
es:
* P
olan
d da
ta in
clu
de s
econ
d-cy
cle
prog
ram
s th
at d
id n
ot m
eet
IEA
sam
plin
g re
quir
emen
ts a
nd
are
ther
efor
e re
por
ted
sepa
rate
ly.
** N
orw
ay d
ata
incl
ude
ALU
pro
gram
s th
at d
id n
ot m
eet
IEA
sam
plin
g re
quir
emen
ts a
nd
are
ther
efor
e re
por
ted
sepa
rate
ly.
Prog
ram
-Typ
e 3.
Prim
ary/
Low
er-
Seco
ndar
y G
ener
alis
ts (t
o G
rade
4
Max
imum
Prog
ram
-Typ
e 4.
Prim
ary
Mat
hem
atic
s Sp
ecia
lists
Exh
ibit
R.1
(co
ntd.
)

THE TEACHER EDUCATION AND DEVELOPMENT STUDY IN MATHEMATICS (TEDS-M) TECHNICAL REPORT306
Bots
wan
a D
iplo
ma
in S
econ
dary
Edu
catio
n 34
8–
10
Chi
le
Gen
eral
ists
teac
hers
(Gra
des
1 to
8)
648
1–8
G
ener
alis
t te
ache
rs +
mat
hem
atic
s (G
rade
s 5
to 8
) 98
5–
8
Ger
man
y Pr
imar
y an
d se
cond
ary
gene
ralis
t (T
ype
2A)
87
1–10
Se
cond
ary
I with
mat
hem
atic
s as
a fo
cus
(Typ
e 3)
32
1 5–
10
Nor
way
*
ALU
35
6 1–
10
A
LU (p
lus
mat
hem
atic
s)
151
1–10
Phili
ppin
es
Bach
elor
in S
econ
dary
Edu
catio
n 73
3 7–
10
Pola
nd
Mat
hem
atic
s (fi
rst
cycl
e, f
ullti
me,
teac
her
educ
atio
n)_1
13
5 4–
9
M
athe
mat
ics
(firs
t cy
cle,
par
ttim
e, te
ache
r ed
ucat
ion)
_4
23
4–9
Sing
apor
e Po
st-G
radu
ate
Dip
lom
a in
Edu
catio
n (L
ower
-Sec
onda
ry),
one
yea
r, Ja
nuar
y 20
07 in
take
50
7–
8
Po
st-G
radu
ate
Dip
lom
a in
Edu
catio
n (L
ower
-Sec
onda
ry),
one
yea
r, Ju
ly 2
007
inta
ke
92
7–8
Switz
erla
nd
Teac
her
for
seco
ndar
y sc
hool
14
1 7–
9
Uni
ted
Stat
es
Prim
ary
and
seco
ndar
y te
ache
r (c
oncu
rren
t)
161
4/5–
8/9
Pr
imar
y an
d se
cond
ary
teac
her
(con
secu
tive)
8
4/5–
89
Pro
gra
m-G
roup
C
oun
try
Pro
gra
ms
Num
ber
of
G
rad
e Sp
an
R
esp
on
den
ts
Prog
ram
-Typ
e 5:
Low
er-S
econ
dary
M
athe
mat
ics
(to
Gra
de 1
0 M
axim
um)
APP
END
Ix S
: Pr
og
ram
-Gro
up
ing
s: F
utu
re T
each
ers
(Sec
on
dar
y)
Exh
ibit
S.1
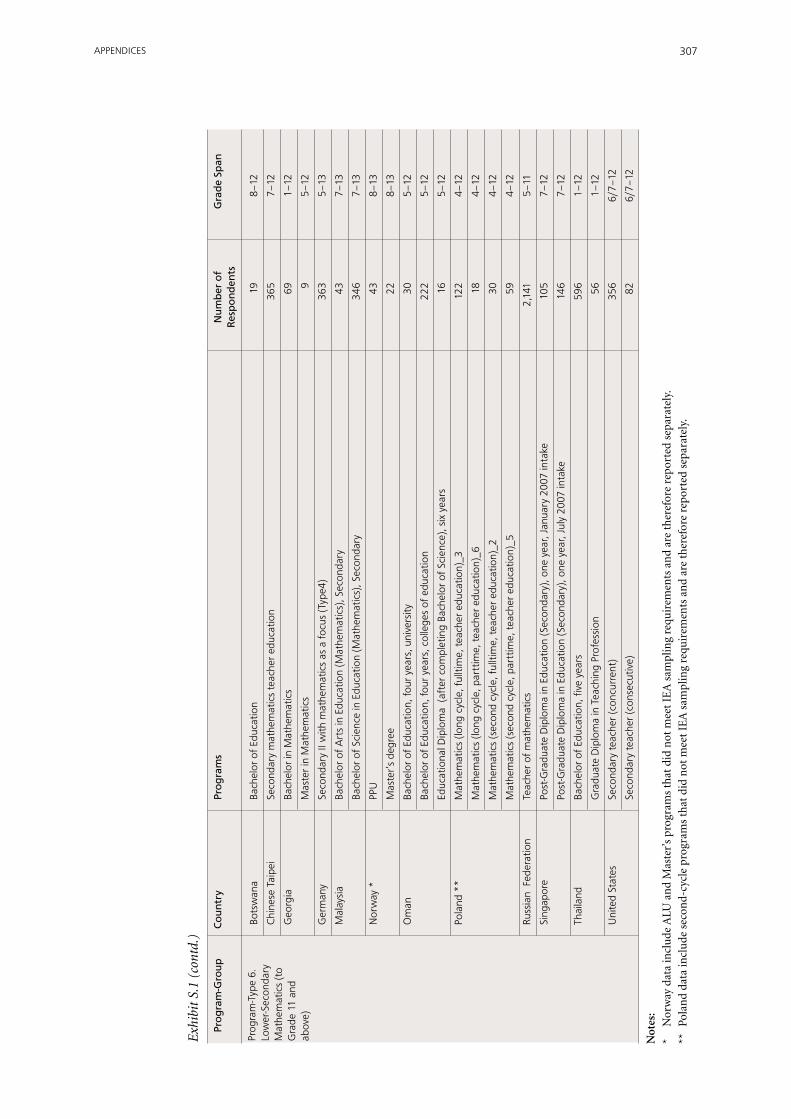
307APPENDICES
P
rog
ram
-Gro
up
Co
untr
y Pr
og
ram
s N
umb
er o
f
Gra
de
Span
Res
po
nd
ents
Bots
wan
a Ba
chel
or o
f Ed
ucat
ion
19
8–12
Chi
nese
Tai
pei
Seco
ndar
y m
athe
mat
ics
teac
her
educ
atio
n 36
5 7–
12
Geo
rgia
Ba
chel
or in
Mat
hem
atic
s 69
1–
12
M
aste
r in
Mat
hem
atic
s 9
5–12
Ger
man
y Se
cond
ary
II w
ith m
athe
mat
ics
as a
focu
s (T
ype4
) 36
3 5–
13
Mal
aysi
a Ba
chel
or o
f A
rts
in E
duca
tion
(Mat
hem
atic
s), S
econ
dary
43
7–
13
Ba
chel
or o
f Sc
ienc
e in
Edu
catio
n (M
athe
mat
ics)
, Sec
onda
ry
346
7–13
Nor
way
*
PPU
43
8–
13
M
aste
r’s
degr
ee
22
8–13
Om
an
Bach
elor
of
Educ
atio
n, fo
ur y
ears
, uni
vers
ity
30
5–12
Ba
chel
or o
f Ed
ucat
ion,
four
yea
rs, c
olle
ges
of e
duca
tion
222
5–12
Ed
ucat
iona
l Dip
lom
a (a
fter
com
plet
ing
Bach
elor
of
Scie
nce)
, six
yea
rs
16
5–12
Pola
nd *
* M
athe
mat
ics
(long
cyc
le, f
ullti
me,
teac
her
educ
atio
n)_3
12
2 4–
12
M
athe
mat
ics
(long
cyc
le, p
artt
ime,
teac
her
educ
atio
n)_6
18
4–
12
M
athe
mat
ics
(sec
ond
cycl
e, f
ullti
me,
teac
her
educ
atio
n)_2
30
4–
12
M
athe
mat
ics
(sec
ond
cycl
e, p
artt
ime,
teac
her
educ
atio
n)_5
59
4–
12
Russ
ian
Fed
erat
ion
Teac
her
of m
athe
mat
ics
2,14
1 5–
11
Sing
apor
e Po
st-G
radu
ate
Dip
lom
a in
Edu
catio
n (S
econ
dary
), o
ne y
ear,
Janu
ary
2007
inta
ke
105
7–12
Po
st-G
radu
ate
Dip
lom
a in
Edu
catio
n (S
econ
dary
), o
ne y
ear,
July
200
7 in
take
14
6 7–
12
Thai
land
Ba
chel
or o
f Ed
ucat
ion,
five
yea
rs
596
1–12
G
radu
ate
Dip
lom
a in
Tea
chin
g Pr
ofes
sion
56
1–
12
Uni
ted
Stat
es
Seco
ndar
y te
ache
r (c
oncu
rren
t)
356
6/7–
12
Se
cond
ary
teac
her
(con
secu
tive)
82
6/
7–12
Prog
ram
-Typ
e 6.
Low
er-S
econ
dary
M
athe
mat
ics
(to
Gra
de 1
1 an
d ab
ove)
Not
es:
*
Nor
way
dat
a in
clu
de A
LU a
nd
Mas
ter’
s pr
ogra
ms
that
did
not
mee
t IE
A s
ampl
ing
requ
irem
ents
an
d ar
e th
eref
ore
rep
orte
d se
para
tely
.
**
Pola
nd
data
incl
ude
sec
ond-
cycl
e pr
ogra
ms
that
did
not
mee
t IE
A s
ampl
ing
requ
irem
ents
an
d ar
e th
eref
ore
rep
orte
d se
para
tely
.
Exh
ibit
S.1
(co
ntd.
)

THE TEACHER EDUCATION AND DEVELOPMENT STUDY IN MATHEMATICS (TEDS-M) TECHNICAL REPORT308
APPENDIx T: Listings of Organizations and Individuals Responsible for TEDS-M
TEDS-M Joint Management Committee
• MSU:MariaTeresaTatto(chair),SharonSenk,JohnSchwille
• ACER:LawrenceIngvarson,RayPeck,GlennRowley
• IEA:HansWagemaker,BarbaraMalak(ex-officio)
• DPC: Dirk Hastedt (ex-officio), Ralph Carstens (ex-officio), Falk Brese (ex-officio),
and Sabine Meinck (ex-officio)
• StatisticsCanada:JeanDumais(ex-officio)
The International Study Center at Michigan State University (TEDS-M Lead Institution)
• MariaTeresaTatto,TEDS-Mexecutivedirectorandprincipalinvestigator
• SharonL.SenkandJohnSchwille,co-directorsandco-principalinvestigators
• KirilBankov,UniversityofSofia,seniorresearchcoordinatorformathematicsand
mathematics pedagogy knowledge
• MichaelRodriguez,UniversityofMinnesota,seniorresearchcoordinatorforstatistics,
measurement, and psychometrics
• MartinCarnoy,StanfordUniversity,seniorresearchcoordinatorforthecoststudy
• YukikoMaeda,researchassociateforstatistics,measurement,andpsychometrics
• Soo-YongByun,researchassociateforstatisticsanddataanalysis
• Mustafa Demir, Todd Drummond, Richard Holdgreve-Resendez, Nils Kauffman,
Wangjun Kim, Patrick Leahy, Yang Lu, Sungworn Ngudgratoke, Irini Papaieronymou,
Eduardo Rodrigues, and Tian Song, research assistants
• IneseBerzina-Pitcher,consortiumcoordinator
• AnnPitchford,administrativeassistant
The Australian Council for Educational Research (ACER)
• LawrenceIngvarson,co-director
• RayPeck,co-director,primarymathematics
• GlennRowley,co-director,statisticsandmeasurement
Todd Drummond, Patrick Leahy, and Richard Holdgreve-Resendez are also
acknowledged for their assistance during the TEDS-M project.
International Association for the Evaluation of Educational Achievement (IEA)
• HansWagemaker,executivedirector
• BarbaraMalak,managermembershiprelations
• JuriaanHartenberg,financialmanager
IEA Data Processing and Research Center (IEA DPC)
• DirkHastedt,co-director
• FalkBrese,projectcoordinator
• RalphCarstens,projectcoordinator
• SabineMeinck,samplingmethodologist/coordinator

309APPENDICES
Country Name Affiliation
Botswana Thabo Jeff Mzwinila Tuelo Martin Keitumetse
Tlokweng College of Education
Canada Pierre Brochu Council of Ministers of Education, Canada, Pan-Canadian Assessment Program
Chile Beatrice Avalos Ministry of Education, Chile, Unit of Curriculum Evaluation
Chinese Taipei Feng-Jui Hsieh National Taiwan Normal University, Department of Mathematics Pi-Jen Lin National Hsinchu University of Education, Department of Applied Mathematics
Georgia Maia Miminoshvili Tamar Bokuchava
National Assessment and Examination Center
Germany Sigrid Blömeke Humboldt University of Berlin, Faculty of Arts IV
Malaysia Mohd Mustamam Abd. Karim Rajendran Nagappan
Universiti Pendidikan Sultan Idris
Norway Liv Grønmo University of Oslo, Department of Teacher Education and School Development
Oman Zuwaina Al-maskari Ministry of Education, Math Curriculum Department
Philippines Ester Ogena Evangeline Golla
Science Education Institute, Department of Science and Technology
Poland Michał Sitek Polish Academy of Sciences, Institute of Philosophy and Sociology
Russian Federation Galina Kovaleva Russian Academy of Education, Center for Evaluating the Quality of Education, Institute for Content of Methods of Learning,
Singapore Khoon Yoong wong Nanyang Technological University, National Institute of Education
Spain Luis Rico Pedro Gomez
University of Granada
Switzerland Fritz Oser Horst Biedermann
University of Fribourg
Thailand Precharn Dechsri The Institute for the Promotion of Teaching Science and Technology Supattra Pativisan
United States william Schmidt Michigan State University
TEDS-M National Research Coordinators (NRCs)
TEDS-M International Sampling Referee
• JeanDumais,StatisticsCanada
TEDS-M International Sampling Adjudicator
• MarcJoncas,StatisticsCanada

THE TEACHER EDUCATION AND DEVELOPMENT STUDY IN MATHEMATICS (TEDS-M) TECHNICAL REPORT310
TEDS-M Expert Panels and Meetings
Specialist Advisory/Expert Panel Meetings for TEDS-M, November 2002
Meeting Participants Country/Affiliation
Fernand Rochette
Belgium (Flemish)
Liselotte Van De Perre Belgium (Flemish)
Ann Van Driessche Belgium (Flemish)
Marcel Crahay Belgium (French)
Julien Nicaise Belgium (French)
Per Fibæk Laursen Denmark
Bjarne wahlgren Denmark
Gerard Bonnet France
Catharine Regneir France
Ranier Lehmann Germany
Georgia K. Polydores Greece
Bruno Losito Italy
Ryo watanabe Japan
Andris Kangro Latvia
Jean-Claude Fandel Luxembourg
Jean-Paul Reeff Luxembourg
Seamus Hegarty UK
Arlette Delhaxe Eurydice
Barbara Malak-Minkiewicz IEA Secretariat
Maria Teresa Tatto MSU
Specialist Advisory/Expert Panel Meetings for TEDS-M, June 2003
Meeting Participants Country/Affiliation
Peter Fensham Australia
Kiril Bankov Bulgaria
Martial Dembele Burkina Faso and Québec-Canada
Beatrice Avalos Chile
Per Fibæk Laursen Denmark
Sigrid Blömeke Germany
Frederick Leung Hong Kong SAR
Losito Bruno Italy
Ciaran Sugrue Ireland
Lee Chong-Jae Korea
Loyiso Jita South Africa
Marilyn Leask UK
Christopher Day UK
Michael Eraut UK
Drew Gitomer USA
Susanna Loeb USA
Lynn Paine USA
David Plank USA
Paul Sally USA
william Schmidt USA
Adrian Beavis IEA-TEDS-M ACER
Lawrence Ingvarson IEA-TEDS-M ACER
Jack Schwille IEA-TEDS-M MSU
Maria Teresa Tatto IEA-TEDS-M MSU
Special IEA advisory meeting on approval of TEDS-M Study, Brussels, Belgium November 4–5, 2002
IEA TEDS-M expert panel meeting, Amsterdam, The Netherlands,June 16–21, 2003
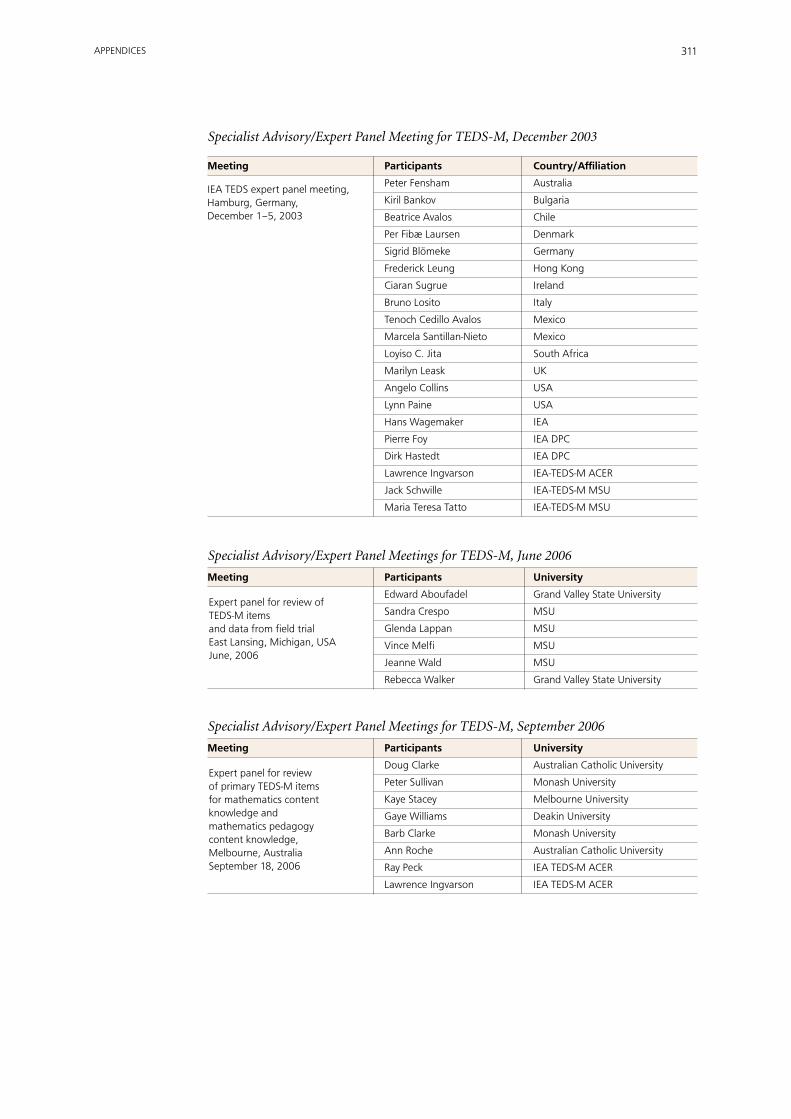
311APPENDICES
Specialist Advisory/Expert Panel Meeting for TEDS-M, December 2003
Meeting Participants Country/Affiliation
Peter Fensham Australia
Kiril Bankov Bulgaria
Beatrice Avalos Chile
Per Fibæ Laursen Denmark
Sigrid Blömeke Germany
Frederick Leung Hong Kong
Ciaran Sugrue Ireland
Bruno Losito Italy
Tenoch Cedillo Avalos Mexico
Marcela Santillan-Nieto Mexico
Loyiso C. Jita South Africa
Marilyn Leask UK
Angelo Collins USA
Lynn Paine USA
Hans wagemaker IEA
Pierre Foy IEA DPC
Dirk Hastedt IEA DPC
Lawrence Ingvarson IEA-TEDS-M ACER
Jack Schwille IEA-TEDS-M MSU
Maria Teresa Tatto IEA-TEDS-M MSU
Specialist Advisory/Expert Panel Meetings for TEDS-M, June 2006
Meeting Participants University
Edward Aboufadel Grand Valley State University
Sandra Crespo MSU
Glenda Lappan MSU
Vince Melfi MSU
Jeanne wald MSU
Rebecca walker Grand Valley State University
Specialist Advisory/Expert Panel Meetings for TEDS-M, September 2006
Meeting Participants University
Doug Clarke Australian Catholic University
Peter Sullivan Monash University
Kaye Stacey Melbourne University
Gaye williams Deakin University
Barb Clarke Monash University
Ann Roche Australian Catholic University
Ray Peck IEA TEDS-M ACER
Lawrence Ingvarson IEA TEDS-M ACER
IEA TEDS expert panel meeting,Hamburg, Germany,December 1–5, 2003
Expert panel for review of primary TEDS-M items for mathematics content knowledge and mathematics pedagogy content knowledge,Melbourne, AustraliaSeptember 18, 2006
Expert panel for review of TEDS-M items and data from field trialEast Lansing, Michigan, USAJune, 2006

THE TEACHER EDUCATION AND DEVELOPMENT STUDY IN MATHEMATICS (TEDS-M) TECHNICAL REPORT312
Expert panel for review of TEDS-M test items and questionnaires,Grand Rapids, Michigan, USASeptember 29–30, 2006
TEDS-M Mathematics and Mathematics Pedagogy Scale Anchoring workshops in East Lansing, MI.
Note: The objective of these workshops was to develop descriptions of the characteristics of persons whose scores on the mathematics and mathematics pedagogy tests placed them at various locations on the scales.
Specialist Advisory/Expert Panel Meetings for TEDS-M, September 2006
Meeting Participants Country/Affiliation
Kiril Bankov Bulgaria
Jarmila Novotna Czech Republic
Paul Conway Ireland
Ruhama Even Israel
Kyungmee Park Korea
Maarten Dolk Netherlands
Ingrid Munck Sweden
Hyacinth Evans west Indies
Lynn Paine IEA-TEDS-M MSU
Sharon Senk IEA-TEDS-M MSU
Jack Schwille IEA-TEDS-M MSU
Maria Teresa Tatto IEA-TEDS-M MSU
Specialist Advisory/Expert Panel Meetings for TEDS-M, June and July 2009
Meeting Participants University
Mathematicians Primary
Anna Bargagliotti University of Memphis
Hyman Bass MSU
Michael Frazier University of Tennessee
Mathematicians Lower Secondary
Roger Howe Yale University
Cathy Kessel Independent consultant
Alejandro Uribe University of Michigan
Jeanne wald MSU
Mathematics Educators—Primary
Lillie Albert MSU
Sandra Crespo MSU
Cynthia Langrall Illinois State University
Edward Silver University of Michigan
Alejandra Sorto Texas State University
Rebecca walker Grand Valley State University
Mathematics Educators—Lower-Secondary
Jennifer Bay williams University of Louisville
Jeremy Kilpatrick University of Georgia
Glenda Lappan MSU
Xuihui Li California State University
Sharon McCrone University of New Hampshire
Rheta Rubenstein University of Michigan
Denisse Thompson University of South Florida

During the 55 years of its activities, IEA has conducted over 30 comparative research studies focusing on educational policies, practices, and outcomes in various school subjects in more than 80 countries around the world. The Teacher Education and Development Study in Mathematics (TEDS-M), the first IEA project addressing tertiary education, examined the mathematics preparation of future teachers for both primary and secondary school levels in 17 countries.
The study’s key research questions focused on the relationships between teacher education policies, institutional practices, and the mathematics and pedagogy knowledge of future teachers at the end of their preservice education. Data were gathered from approximately 22,000 future teachers from 750 programs in about 500 teacher education institutions. Teaching staff within these programs were also surveyed. They included close to 5,000 mathematicians, mathematics educators, and general pedagogy educators.
TEDS-M collected data on policies, practices, and outcomes of mathematics teacher education. These data permitted comparisons of teacher education-related national policies, organization, and curricula across the participating countries. The data also elucidated the main characteristics of institutions preparing primary and lower-secondary teachers of mathematics. Analyses of the various national teacher education programs show the opportunities to learn that they offer and—in this context—future teachers’ mathematics content knowledge and mathematics pedagogy knowledge, as well as their beliefs related to mathematics and the learning of mathematics.
Findings from TEDS-M were published in a series of reports presenting study outcomes. These reports are complemented by the international database (together with its user guide) and this latest technical report. It includes detailed information on instrument development, translation and verification procedures, sampling, field operations and quality control, data management, database construction, weighting procedures, scaling methodology, and the reporting of data from the surveys of future teachers of mathematics and their educators. The technical report enables fellow researchers in the field to evaluate the published reports, monographs, and articles based on TEDS-M data and to conduct their own secondary analyses.