Embed Size (px)
Citation preview

Policy instrument design to reduce financing
costs in renewable energy technology projects David de Jager and Max Rathmann
Ecofys International BV
P.O. Box 8408
NL-3503 RK Utrecht
Kanaalweg 16-G
NL-3526 KL Utrecht
The Netherlands
W: www.ecofys.com
T: +31 (0)30 280 83 00
F: +31 (0)30 280 83 01
David de Jager and Max Rathmann
with contributions from
Corinna Klessmann, Rogier Coenraads, Chiara Colamonico, and Marco Buttazzoni
October 2008
PECSNL062979
by order of the:
IEA Implementing Agreement on Renewable Energy Technology Deployment
(RETD)
www.iea-retd.org
Policy instrument design to reduce financing costs in renewable energy technology projects


III
Summary
This report concerns the role of policies and policy instrument design in reducing
the financing cost of renewable energy technology projects. What are key elements
of successful policy schemes? What conditions should be set for successful design
of future policies? What risk management measures can be included in policy
schemes to mitigate or transfer risks away from investors and therewith reduce the
cost of financing RES and can we apply this to other policy schemes in other
countries?
These questions are answered by presenting the interactions of risks and policy
design in general, and by considering the specific project finance case of four large-
scale renewable energy project cases in more detail: a 20 MWe onshore wind
energy project, a 100 MWe offshore wind energy project, a 0.5 MWe solar
photovoltaic energy plant, and a 10 MWe / 26 MWth biomass co-generation plant.
Their financial performance was evaluated under different representative policy
support schemes (Germany, France, Netherlands, United Kingdom, California, and
Québec).
Ensure long-term commitment towards renewable energy Before looking at the exact design of the various elements in the support schemes, a
clear political and societal long-term commitment towards renewable energy is
required. Based on this, a stable and reliable support mechanism can be designed,
that effectively meets the policy goal, at acceptable levels of investor risk, and at
acceptable social costs. Commitment, stability, reliability and predictability are all
elements that increase confidence of market actors, reduce regulatory risks, and
hence significantly reduce cost of capital. A proper translation of this commitment
in the design and timeframe of the support instruments, is the key challenge in this
respect.
This effect can be significant: as compared to a support scheme with no particular
attention to risk mitigation, the levelised cost of electricity can be reduced by 10 to
30%, with different values for different technologies. Countries with feed-in tariff
schemes (Germany, France, and tender procedures in California and Québec) are
10%to
30%
Good policy instrument design can reduce the cost of renewable electricity by 10 to 30%.
IV
believed to have already realised a significant part of this reduction potential for on-
and offshore wind energy and solar photovoltaic energy (e.g. more than 20%).
Remove risks by removing barriers Policies that improve the success rate of the project development phase will reduce
the project investment and hence levelised energy costs of renewable energy
technologies. This refers to amongst others:
• improve permitting procedures (e.g. pre-planning, streamlining and
simplification of procedures, one-stop agencies, maximum response periods),
and
• improve grid connection procedures (e.g. technical and operational standards,
transparent procedures, non-discriminatory access).
The overall effect on the cost of capital of removing barriers is hard to quantify.
The direct effect on the levelised cost of electricity can be in the range of 5 to 10%
due to increased project cost. But a poor development climate will also result in a
higher required return on equity, which could result in a cost increase of the same
order of magnitude.
Remove risk by sharing risk Although not encountered in the case studies, the following instruments can
significantly reduce the cost of capital:
• Government loan guarantees
By underwriting all or part of the debt for a project, lenders have significant
lower risk in case of default or underperformance of the project. This risk
reduction is translated in lower interest rates (e.g. 1-2%, resulting in reductions
upto 5-10% in the levelised cost of electricity), but potentially also in longer
debt terms and more favourable debt service requirements with even higher
reductions in the cost of capital.
• Government project participation and/or investments in infrastructure
Government project participation, for instance by investing in large-scale
electrical infrastructure solutions for offshore wind energy, can reduce levelised
cost of electricity by for instance 15% or more (with about one third as a direct
effect of a reduction in the cost of capital).
Investment subsidies: for demonstration and market introduction Investment subsidies are believed to be more effective at the demonstration and
market introduction phase, than during the deployment phase with a larger
emphasis on stimulating production of renewable energy. Investment grants could
be converted in equity (government participation) or debt after successful
commissioning of a project. Doing so the effect on the government budget can be
kept to a minimum.
5%to
20%
5%to
15%
V
Debt measures: provide low interest loans and align the debt term with the technical lifetime Policies that anticipate on risk assessment practices by lenders can reduce costs of
capital significantly by creating market conditions and designing support schemes
that result in debt terms being close to technical lifetimes (e.g. longer duration of
production support and power purchase agreements (PPAs)). Low-interest loans,
with discounts on interest rate that are typically in the range of 1-2%, can contribute
to this. The direct overall effect of these kind of debt schemes is upto 5-10% on
levelised cost of electricity. But indirectly they can affect other key financial
parameters used by investors and other lenders, such as the economic lifetime, debt
term and debt service conditions. The alignment of the debt period in the German
low-interest government loan (e.g. KfW Umwelt Program) with the period of the
feed-in tariff scheme, both contribute to significantly lower cost of capital.
Fiscal measures Fiscal measures can have a significant impact on the levelised cost of electricity of
a project. Investment tax deduction, production tax deduction, and flexible or
accelerated depreciation schemes reduce levelised cost of electricity from several
percent upto 10-20% in the examined cases. Not all projects and finance models
will be able to reap the tax benefits of these schemes. A critical issue is the
dependency on policies as the fiscal measures result in lower tax income.
Production support An improved design of current production support schemes, and notably a good
alignment with other support policies, can result in additional cost reductions in the
range of 2-30%. The high end concerns projects with relative high project risk, such
as offshore wind energy or biomass co-generation. For onshore wind energy, these
potential improvements are smaller (several percentages to 10-15%), notably for
some feed-in tariff and -premium schemes.
Feed-in tariff (FIT) and -premium (FIP) schemes: The most important element of
FIP and FIT schemes is that they fully (FIT) or partially (FIP) remove the market
risks of a project during a fixed period of time. The longer this period of guaranteed
prices, the lower the cost of capital. Because of this, FIT/FIP have in general a
relatively large debt schare. For the technologies considered in this report a
timeframe of 15 to 20 years is preferred. In feed-in premium schemes the risk of
variations in electricity market prices is reflected by a premium in the tariff in the
purchase power agreement. It may be hard to acquire a PPA with the same 15 to 20
year tenure at reasonable risk premium levels.
5%to
10%
2%to
20%
2%to
30%

VI
Other production incentives: In some schemes a certain production incentive is
given for each unit of renewable electricity produced over a given period of time
(e.g. 10 CAN$/MWh over 10 year, in the EcoENERGY for Renewable Power in
Canada). This production incentive is not intended to fully bridge the gap between
electricity market prices and the price of renewable electricity, but apart from
generating additional revenues, it contributes to removing part of the market risks
for a project.
Tendering schemes: The tendering schemes discussed in this report (Québec,
California) all result in guaranteed project-specific contract prices for a specific
period of time. The tendering process is used to let the market determine what the
required level of support should be. After winning the tender, a project developer
has certainty about his operating income and can use and negotiate favourable
financing terms. The project development phase has higher risks, as not all bids will
be successful.
Obligation schemes: The cost of capital will generally be higher for obligation
schemes due to both higher market risks and perceived regulatory risks. The
certificate market - by its design - can not offer a fixed price directly as is the case
in FIT/FIP schemes. Furthermore, the level and timeframe of the obligation as well
as other key design parameters (e.g. penalties, issuing of certificates), are set by
government policies and hence susceptible to policy changes. This results in lower
contract periods in the PPA, lower debt terms and higher debt reserve conditions,
or, in other words, in a higher levelised cost of electricity.
Reducing the cost of capital in quota obligation schemes can be achieved via
various routes, but is not as easily done as with FIT and FIP schemes. A strong
government commitment towards the scheme is essential in this respect. Changes in
the scheme can seriously affect the continuity of existing projects and have to be
applied with specific care. Increasing the economic lifetime, the contract period in
the PPA, and the debt maturity will reduce the cost of capital. This could be
achieved via the instruments discussed above: by seting favourable conditions in
loan guarantees, (low-interest) government loans and/or government participation.
The government can also oblige obligated parties to offer long-term contracts. This
will be reflected in a risk premium, but – provided that a competitive market is
functioning – this premium can be minimised. The main advantage is that the
financing cost will be reduced due to the increased security.

VII
General observations Continuously improve the policy design
Policies that reduce the required return on equity by investors potentially have
significant cost reduction implications. Improved design of existing policy support
schemes may be more effective in this respect, than a switch to a different policy
scheme. Reducing the required return on equity encompasses a wide range of
measures that create stability and predictability of markets, amongst others:
(i) long-term and sufficiently ambitious targets should be set,
(ii) the policy instrument should remain active long enough to provide sta-
ble planning horizons and for a given project, the support scheme
should not change during its lifetime,
(iii) stop-and go policies are not suitable and a country’s ‘track record’ in
renewable energy policies probably influences perceived stability very
much.
Keep the financing of the support scheme outside the government budget
In general, it is recommended that the financing of the support scheme is kept
outside the government budget, especially when a country has a track record of
multiple changes in policy design and/or allocation of budgets.
Anticipate for different financing models in the policy instrument design
In designing new policy instruments and schemes, the changing landscape of
renewable energy financing solutions should be closely monitored and incorporated
in this design. In designing support schemes, all market actors should be involved.
Especially investment funds and banks will be able to provide feedback on the risks
related to the design of these instruments.


1
Table of contents
Summary i i i
1 Introduct ion 5
1.1 Scope of the report 5
1.2 Objectives 5
1.3 Report structure 6
2 Financing r isks of renewable energy projects 7
2.1 Policies affect cost 7
2.2 Risk classes 8
2.3 Risks and the project cycle 9
2.3.1 Project development and financial closure 10
2.3.2 Construction 12
2.3.3 Operation 13
2.3.4 Decommissioning 15
2.3.5 Conclusion 15
2.4 Financing renewable energy projects 15
2.4.1 Project finance 17
2.4.2 Corporate finance 19
2.4.3 Sensitivity of renewable energy costs for changes in key
financial parameters 20
3 Overview of pol ic ies and measures in selected IEA countries 33
3.1 Policy types and general design aspects 33
3.2 Feed-in tariffs and premium tariffs 37
3.3 Quota obligations 38
3.4 Tendering schemes 39
3.5 Fiscal and other support incentives 40
3.6 Policies to reduce administrative and grid barriers 44
3.7 Climate change mitigation policies 46

2
4 Analysis of selected pol ic ies and measures with respect to cost of f inance 47
4.1 Introduction 47
4.2 Renewable energy technologies and policy support schemes
for detailed analysis 49
4.3 Technology characterisations 51
4.4 Country characterisations 53
4.4.1 Germany 53
4.4.2 France 60
4.4.3 Netherlands 65
4.4.4 United Kingdom 69
4.4.5 California 76
4.4.6 Québec 91
5 Comparative assessment 97
5.1 Generic financial assumptions 97
5.2 Onshore wind energy (20 MW) 100
5.3 Offshore wind energy (100 MW) 108
5.4 Solar photovoltaic energy (0.5 MW) 112
5.5 Solid biomass co-generation (10 MWe and 26 MWth) 114
6 Conclusions and recommendations 119
6.1 Long-term commitment 119
6.2 Removing risk by removing barriers 120
6.3 Removing risk by sharing risk 121
6.4 Investment subsidies 123
6.5 Debt measures 124
6.6 Fiscal measures 125
6.7 Production support 127
6.8 General observations 129
References 131
3
Annexes ( sep a r a t e do cument , a va i l a b l e a t www. i e a - r e t d . o r g )
Annex 1: Country sheets
Canada
Denmark
France
Germany
Ireland
Italy
Japan
Netherlands
Norway
Portugal
Spain
United Kingdom
USA
Annex 2: Ecofys cash f low model

4

5
1 Introduction
1.1 Scope of the report
Making investments comes with a cost: both investor and lender have financial
criteria that have to be met, resulting in increased project costs as compared to a
situation where capital is freely available. The assessment of the associated risk of a
project has a major impact on this cost of capital. Higher (perceived) risks will
result in applying more stringent criteria, and hence higher cost of capital.
As with all investments, investing in renewable energy technologies1 (RES) is not
without risk. Apart from possible inherent risks of the specific technology, the
policy and social context can be perceived to be or actually be an important risk
factor. Most RES still require policy support (both financial and regulatory) and
when investors and lenders consider this support as inadequate, unreliable, or too
risky in general, this will increase the cost of capital and thus the overall project
cost. In turn, this might hinder the further deployment of renewable energy, or
result in too high (societal) cost.
1.2 Objec t i ves
This report concerns the role of policies and policy instrument design in reducing
the financing cost of renewable energy technology projects. What are key elements
of successful policy schemes? What conditions should be set for successful design
of future policies? What risk management measures can be included in policy
schemes to mitigate or transfer risks away from investors and therewith reduce the
cost of financing RES and can we apply this to other policy schemes in other
countries?
The objectives are to:
• identify design elements in policy instruments reducing perceived risks,
• give best practice examples of implemented international, national or regional
policy designs reducing perceived risks, and
• make concrete recommendations for policy design.
1 In this document renewable energy sources and technologies will be referred to as RES. RES-E refers to production of renewable electricity, RES-H to heat, and RES-F to fuels.

6
These objectives will be met by presenting the interactions of risks and policy
design in general, and by considering the specific project finance of four large-scale
RES project cases in more detail:
• a 20 MWe onshore wind energy project,
• a 100 MWe offshore wind energy project,
• a 0.5 MWe solar photovoltaic energy plant, and
• a 10 MWe biomass co-generation plant.
Their financial performance will be evaluated under different representative policy
support schemes (Germany, France, Netherlands, United Kingdom, California, and
Québec). This should generate more detailed insight in the interplay of the various
elements of these support schemes, and contribute to the formulation of more
generic recommendations.
1.3 Report s t ructure
The report has the following outline:
• Financing risks of renewable energy projects (chapter 2)
Introduction to the key elements that contribute to risk and uncertainty in
financing RES. This introduction will frame the subsequent assessment and
discussion of policies.
• Overview of policies and measures in selected IEA countries (chapter 3 and
Annex 1)
Which policy schemes and instruments have been implemented? What are key
uncertainties and risks with respect to financing? What are key success factors
that reduce financing cost? What generic lessons can be learned for other
policy schemes?
• Analysis of selected policies and measures with respect to the cost of finance
(chapter 4 and 5)
What can be learned from a more detailed analysis of a selected set of policy
instruments? What are specific risks and uncertainties and how can they be
mitigated? What specific lessons can be learned for other policy schemes?
• Conclusions and recommendations: Options for policy designs that reduce the
financing cost for RES, including opportunities of coordinating internationally
different support policies (chapter 6)
What recommendations can be made regarding policy designs that reduce the
financing cost for RES?

7
2 Financing r isks of renewable energy projects
This chapter will discuss the risks that affect renewable energy projects, their
effect on financial variables and overall cost of capital.
2.1 Pol ic i es af fect cost
There is no straight cause-and-effect chain that perfectly describes how policies
affect the cost of renewable energy. However, the following model helps to
illustrate several elements that are of importance to the development of renewable
energy technologies that currently can not compete with conventional energy
conversion technologies on existing markets (see Figure 2-1). In the next section
we will provide more detail for each phase of the project cycle.
Political setting
(commitment towards RES)
Policies and measures
(RETs, climate, energy)
Risks and Risk perception
•Financial parameters
•Costs of capital
Costs of renewable energy
Costs of technology
Political setting
(commitment towards RES)
Policies and measures
(RETs, climate, energy)
Risks and Risk perception
•Financial parameters
•Costs of capital
Costs of renewable energy
Costs of technology
Figure 2-1 Pol ic ies a f fect costs of renewable energy
It starts with the political setting: is there commitment towards renewables and if
so, how is this being substantiated? RES can contribute to the security and
reliability of the energy supply system, reduce emissions of greenhouse gases and
other air-pollutants, enforce the position of national industries and create jobs, and
so on. What is the key driver? And is this commitment felt by all actors in society
or only by a restricted group? E.g. on a national versus regional or municipal
institutional level, in one or all government departments, by energy companies, by
society and its individual citizens, et cetera.
8
In cases where there is some kind of political commitment, this may be
substantiated in policies and measures. This could be in the form of concrete
objectives for the share of RES in total energy consumption or for the total installed
capacity of RES, via financial support schemes, dedicated standards or legislation,
energy market restructuring, or in dedicated administrative procedures. In general,
the policies and measures aim to reduce or eliminate the main barriers that RES are
confronted with, such as perceived higher costs, or licensing issues.
Project developers, equity investors and debt lenders will assess the technical and
financial performance of a RES project. In this assessment they will incorporate
both the specific risks associated with the technology, and risks associated with the
policy context. This is being translated in the specific financial terms that are being
applied in the project financing. Higher risks will result in higher cost of capital and
hence higher project costs and resulting energy costs. Policies and measures that
reduce (regulatory) risks, generally reduce the (societal) cost of renewable energy.
2.2 Risk c lasses
In this section we will briefly present the risks associated with renewable energy
technology projects, both in general terms and related to the phase in the project
cycle. In general we can talk about six levels of risk which can affect the cost of
capital for a project1:
• Project level risk
Project level risk concerns the risk that is specific to the selected technology
and project, notably during the construction and operation phase. This risk level
will be discussed in more detail in the next section for each project phase.
• Regulatory risk Regulatory or institutional risk concerns the risk of adverse changes in the
policy context discussed earlier. Policies and measures might change during the
project cycle which may have significant impacts on the profitability of a
project. Examples are changes to or even ending of policy support schemes or
changes to the market design. As most markets for renewables are being
regulated under policy schemes, this risk is of particular importance to
renewable energy technologies.
1 There are other risk elements that can affect the success and profitability of a project. Within the scope of this report they are not - or less - important.

9
• Financial risk and Market risk Financial risk relates to the risk of adverse changes in financial and/or
economic parameters, such as interbank offered interest rates (e.g. EURIBOR,
LIBOR, TIBOR) which are the basis for interest rates offered to the market,
currency exchange rates, and inflation rates. Market risk concerns variations in
prices of commodities, such as prices of biomass and electricity market prices.
• Legal risk
The legal system of a country forms the basis of agreements and contracts
between parties. The legal risk comprises the risk that enforcement of these
contract obligations is not completely ensured by the legal system.
• (Geo)Political risk The political risk concerns the risk of major changes in key economic areas,
such as a change in foreign-exchange rates by a central bank (sovereign risk).
• Force Majeure risk Force Majeure risk concerns the risk of any natural catastrophes (e.g. extreme
weather, flooding) or human induced calamities (e.g. war or strike).
Project level risk and regulatory risk are of particular relevance to the
deployment of RES, with a significant role for policies. Financial or market risk
may be important as well, but the mechanisms are similar to or the same as for
conventional energy projects. The remaining risk categories are less important for
RES in most OECD countries. The weight given to each risk category differs for
each technology, country or even region.
A wide range of instruments is available to transfer these risks to other parties
which can help to reduce the overall cost of capital or to make the project bankable.
Contracts with equipment suppliers or with service companies including
performance guarantees over the project lifetime are an example. Furthermore,
insurances and other financial derivatives are available to reduce risks for both
investor and lender to the project.
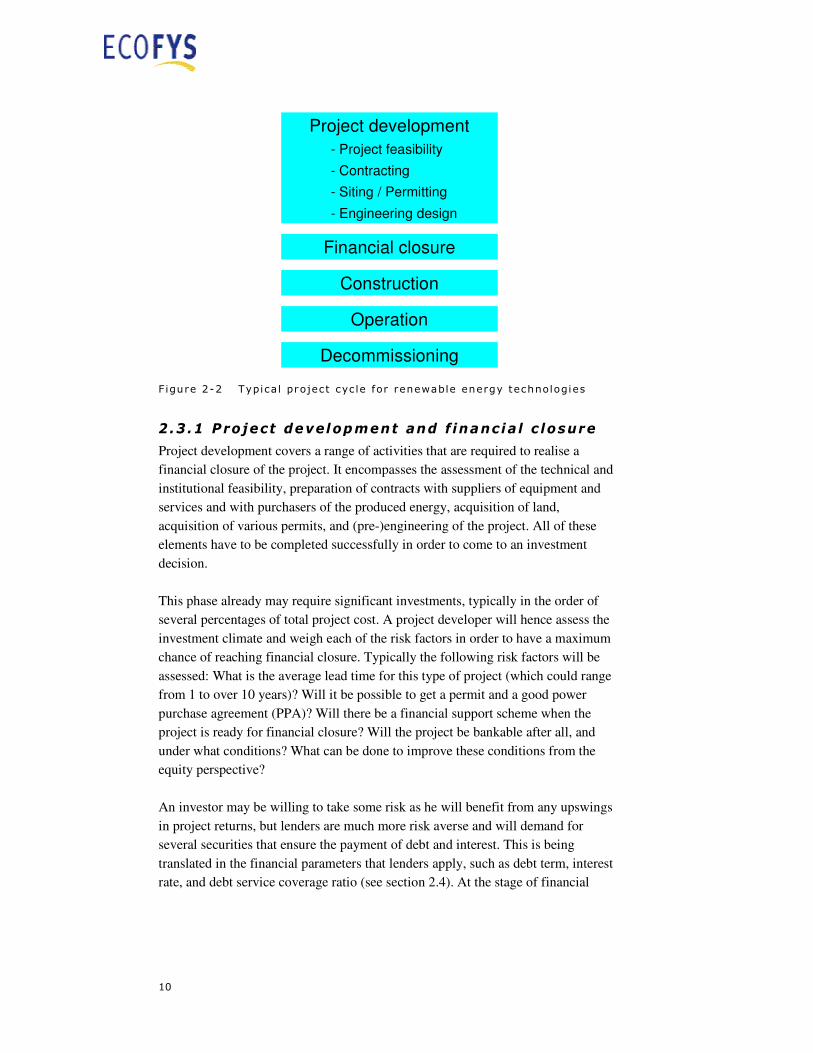
2.3 Risks and the project cyc le
The project cycle of the large-scale renewable energy projects that are covered in
this report, generally have the (simplified) structure as depicted in Figure 2-2. Each
phase has its own risks, risk management opportunities and sensitivity for policy
changes.
10
Project development
- Project feasibility
- Contracting
- Siting / Permitting
- Engineering design
Financial closure
Construction
Operation
Decommissioning
Figure 2-2 Typical project cyc le for renewable energy technologies
2.3 .1 Project development and f inancia l c losure
Project development covers a range of activities that are required to realise a
financial closure of the project. It encompasses the assessment of the technical and
institutional feasibility, preparation of contracts with suppliers of equipment and
services and with purchasers of the produced energy, acquisition of land,
acquisition of various permits, and (pre-)engineering of the project. All of these
elements have to be completed successfully in order to come to an investment
decision.
This phase already may require significant investments, typically in the order of
several percentages of total project cost. A project developer will hence assess the
investment climate and weigh each of the risk factors in order to have a maximum
chance of reaching financial closure. Typically the following risk factors will be
assessed: What is the average lead time for this type of project (which could range
from 1 to over 10 years)? Will it be possible to get a permit and a good power
purchase agreement (PPA)? Will there be a financial support scheme when the
project is ready for financial closure? Will the project be bankable after all, and
under what conditions? What can be done to improve these conditions from the
equity perspective?
An investor may be willing to take some risk as he will benefit from any upswings
in project returns, but lenders are much more risk averse and will demand for
several securities that ensure the payment of debt and interest. This is being
translated in the financial parameters that lenders apply, such as debt term, interest
rate, and debt service coverage ratio (see section 2.4). At the stage of financial

11
closure, the risk assessment will concern the remaining phases of the project cycle
only.
The following risks may be encountered during the project development phase2:
Project development phase towards financial closure
Risks: • Acquisition of permits is not successful.
• Connection to the electricity grid is impossible or too expensive.
• Energy purchase agreement is not reached or does not meet the
conditions posed by lenders (e.g. the contract period is too short).
• Delay in project development due to legal or institutional procedures,
resulting in the project being not viable due to:
- Higher costs of equipment and services
- Unfavourable changes to or elimination of policy support schemes
Risk
mitigation:
Providing information to stakeholders and/or offering the opportunity to
participate in the project can increase the chance of acquiring permits.
Role of
policies:
The role of policies is of crucial importance for the project development
phase. The regulatory risk can be reduced by creating a stable and reliable
policy framework, for instance by formulating long-term targets, with policy
schemes that have sufficient long lifetimes.
The political commitment towards RES needs to be embodied in the
complete government organisation. If legal and institutional procedures are
geared to a smooth but responsible introduction of renewable energy
technologies, the lead time and success rate of projects can be improved,
resulting in a faster deployment at lower project costs. This asks for
supportive legislation, a facilitating bureaucracy and a fair and transparent
organisation of the (energy) markets.
Investment subsidies and/or fiscal measures can contribute to the
bankability of a project by reducing the debt leverage.
By making energy resource data available to the market, more certainty in
predicted energy yields can be provided to financers resulting in lower cost
of capital. As an example: wind speed data could be made available to
project developers.
2 UNEP (2006, 2007ab), De Noord and Sambeek (2003) and Cleijne and Ruijgrok (2004)

12
Impact on
costs:
The impact on overall project costs can be significant. Delays in the project
development phase can increase total project costs even above 10%, in
cases with long legal procedures under changing market conditions. The
market value of projects that successfully have completed the development
phase can be high in a context where only few project initiatives reach this
stage, after longer average lead times. This results in higher overall project
costs.
The impact on the cost of capital is medium, as the cost of capital at this
stage is mainly determined by the risks of the subsequent phases.
Specific to
RES:
Given the major impact of policies on the success rate of the project
development phase, this is very specific to RES.
2.3 .2 Construct ion
The construction phase concerns the actual construction of the project, usually by
several subcontractors, either subcontracted individually or as a consortium. The
construction phase has several risks with potentially high impacts, which are
generally not specific to renewable energy projects. It concerns for example cost
and/or time overruns which negatively affect the cash flow of the project. Another
risk is that subcontractors or suppliers are not able to meet the agreed technical
specifications or underperform in other ways. Several generic risk mitigation
strategies can be applied, such as insurances and specific contract conditions. The
role of policies in reducing the risk during the construction phase is limited, as all
permits should have been acquired in the project development phase. However, for
new technologies that not yet have an institutional track-record, new institutional
barriers might occur during construction. Some governments provide (export)
credit facilities to suppliers in order to remove the risk of non-compliance by the
supplier due to financial constraints. The perceived effectiveness of the risk
mitigation measures is a crucial element in the determination of the financial
parameters that are being applied by investors and lenders to the project.
Construction phase
Risks: Construction risk
- Time and/or cost overrun
- Technical specifications are not met
- Assumptions prove to be not realistic
Counterparty risk
- Construction contractor does not perform as per contract
13
Risk
mitigation:
• Insurance
• Turnkey contract
• Performance guarantees
• Liquidated damages on non-performance
• Due diligence process for subcontractors and suppliers
Role of
policies:
Limited. Some government reduce risks for project investors by providing
credit facilities to suppliers.
Impact on
costs:
High, given the potential high impact on the cash flow of the project.
Specific to
RES:
The risks of this phase are in general not specific to renewable energy
technologies. However, some technologies might be more sensitive for
particular incidents. For example construction of offshore wind energy
projects might suffer delays from (severe) weather conditions.
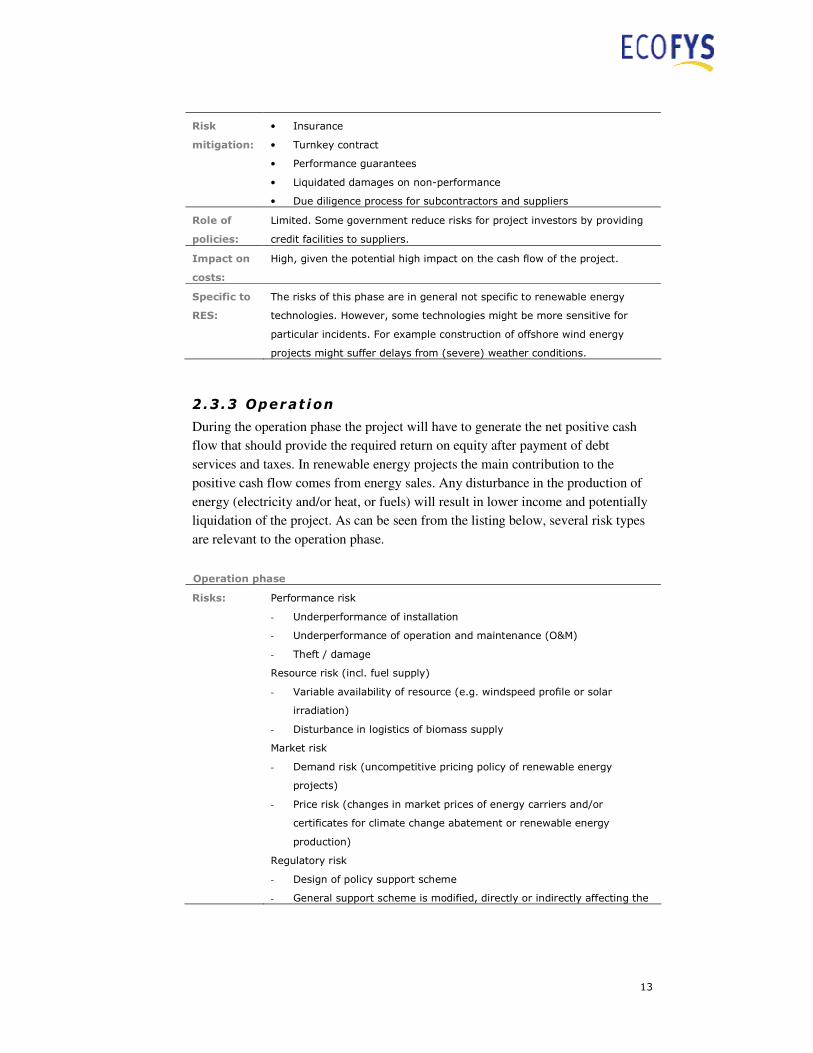
2.3.3 Operat ion
During the operation phase the project will have to generate the net positive cash
flow that should provide the required return on equity after payment of debt
services and taxes. In renewable energy projects the main contribution to the
positive cash flow comes from energy sales. Any disturbance in the production of
energy (electricity and/or heat, or fuels) will result in lower income and potentially
liquidation of the project. As can be seen from the listing below, several risk types
are relevant to the operation phase.
Operation phase
Risks: Performance risk
- Underperformance of installation
- Underperformance of operation and maintenance (O&M)
- Theft / damage
Resource risk (incl. fuel supply)
- Variable availability of resource (e.g. windspeed profile or solar
irradiation)
- Disturbance in logistics of biomass supply
Market risk
- Demand risk (uncompetitive pricing policy of renewable energy
projects)
- Price risk (changes in market prices of energy carriers and/or
certificates for climate change abatement or renewable energy
production)
Regulatory risk
- Design of policy support scheme
- General support scheme is modified, directly or indirectly affecting the

14
cash flow of the project
Credit risk
Counterparty risk (e.g. of subcontractor responsible for operation and
maintenance (O&M))
Risk
mitigation:
Performance risk
- Outsourcing of O&M: e.g. to same EPC (Engineering, Procurement and
Construction) contractor, incorporating incentives to perform optimally
- Equipment warranties
- Insurances
Resource risk
- Insurances, e.g. weather insurance and weather derivatives for wind
energy projects
- Long-term biomass supply contracts
- Multi-fuel input concepts for bioenergy projects
- Biomass storage
Market risk
- Long-term power purchase agreements (PPA)
- Long-term contracts for renewable energy certificates
Role of
policies:
Policies can help to reduce the regulatory and market risks for a project, by
optimising the following parameters:
• Design of renewable energy policies and/or targets
• Design of support schemes (e.g. feed-in, feed-in premium, quota)
• Stability of policy context
• Energy market design
• Role of transmission system operator (TSO)
• Role of regulator
Impact on
costs:
The impact on costs and cost of finance are high (see section 2.4.3).
Specific to
RES:
Given the important role of policy support schemes during the operation
phase, this is very specific to the deployment of RES.
The risk profile of the operation phase is again a crucial element in the
determination of the financial parameters at financial closure. Several generic and
RES-specific risk mitigation strategies can be applied, which reduce risks or
remove them from the project. Examples are weather insurances or weather
derivates. Apart from the effectiveness of the risk mitigation measures, the design
and perceived stability of the policy support scheme is a key parameter (this is
illustrated in section 3.1).
15
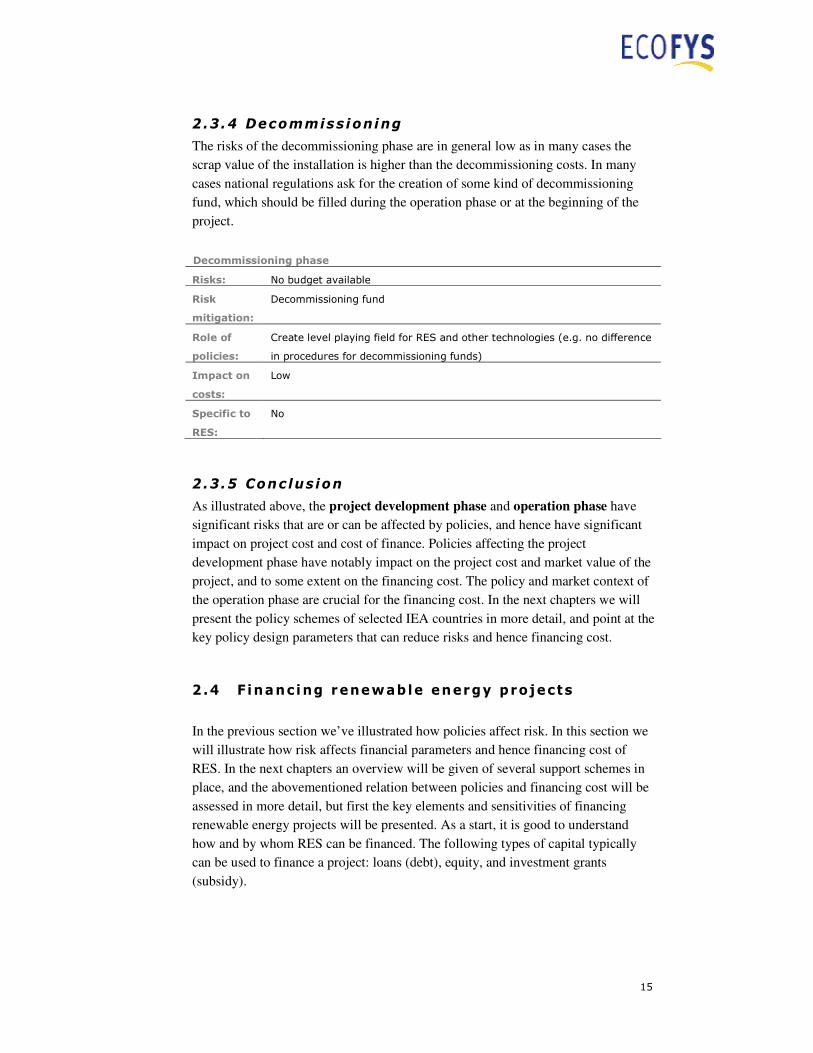
2.3.4 Decommiss ioning
The risks of the decommissioning phase are in general low as in many cases the
scrap value of the installation is higher than the decommissioning costs. In many
cases national regulations ask for the creation of some kind of decommissioning
fund, which should be filled during the operation phase or at the beginning of the
project.
Decommissioning phase
Risks: No budget available
Risk
mitigation:
Decommissioning fund
Role of
policies:
Create level playing field for RES and other technologies (e.g. no difference
in procedures for decommissioning funds)
Impact on
costs:
Low
Specific to
RES:
No
2.3.5 Conc lus ion
As illustrated above, the project development phase and operation phase have
significant risks that are or can be affected by policies, and hence have significant
impact on project cost and cost of finance. Policies affecting the project
development phase have notably impact on the project cost and market value of the
project, and to some extent on the financing cost. The policy and market context of
the operation phase are crucial for the financing cost. In the next chapters we will
present the policy schemes of selected IEA countries in more detail, and point at the
key policy design parameters that can reduce risks and hence financing cost.
2.4 Financing renewable energy projects
In the previous section we’ve illustrated how policies affect risk. In this section we
will illustrate how risk affects financial parameters and hence financing cost of
RES. In the next chapters an overview will be given of several support schemes in
place, and the abovementioned relation between policies and financing cost will be
assessed in more detail, but first the key elements and sensitivities of financing
renewable energy projects will be presented. As a start, it is good to understand
how and by whom RES can be financed. The following types of capital typically
can be used to finance a project: loans (debt), equity, and investment grants
(subsidy).
16
A loan or debt is the amount of money that is provided to the project by a third
party under the condition that this will be (entirely or partially) repaid during or at
the end of the agreed debt term. Furthermore, interest has to be paid at regular
intervals over the amount of money that is borrowed. Loans are typically provided
by banks, but also individuals or organisations can directly or indirectly (via funds)
act as lenders. There are many types of loans, each differently incorporating and
securing (perceived) risk, such as senior debt, junior or subordinate debt, or lease
finance.
Equity is capital from investors or shareholders that receive dividends from the
project in regular intervals (from the so-called free cash flow, the profits after debt
service of both senior and junior debt, and after tax payment). The accumulation of
dividends over the lifetime of the project should significantly outweigh the initial
investment in order to be attractive for investors. The risk for equity providers is
much higher than for lenders, resulting in higher costs of finance expressed in the
required return on equity (RoE, after tax) being much higher than the interest rate
asked by lenders. Equity can be provided by different type of investors, such as
individuals or companies providing their own capital, private equity funds, venture
capital funds, and shareholders that acquire shares via stock markets. Each have
their own risk strategies and will hence apply their own criteria for return on
investment.
Often projects are financed with so-called mezzanine capital (or mezzanine debt),
which is a hybrid form of finance incorporating a wide variety of both debt and
equity arrangements. Typically mezzanine finance will consist of a subordinated
debt with additional securities, preference shares, or convertible bonds.
Investment grants (or subsidies), typically provided by governmental organisations,
do not need to be repaid and require no payment of dividends. Grants are typically
provided to projects that are not commercially feasible or bankable. Sometimes the
conditions of the grant may involve conversion into debt or equity in case of
commercial success.
There are different financing models that can be used: project finance and corporate
(on-balance sheet) finance being the most predominant. But several other models
can be used, such as lease financing. Within this study we will concentrate on
project finance. For large RES projects with investments ranging from several tens
to hundreds of million euros, the project initiator often has not enough capital
available to finance the project on its balance sheet and therefore project finance is
used.

17
2.4.1 Project f inance
In project finance, the cash flow of the project itself determines the structure of the
financing model and its key financial parameters. In this section we will illustrate
this using an example of a 20 MW onshore wind project in an arbitrary country
with no particular support scheme. Assumptions on the key technical, cost, fiscal
and financial parameters are given in Table 2-1. The technical parameters
determine the total annual energy production and hence the positive cash flow into
the project that can be attained by selling the electricity to the market and/or by
acquiring production related fees from RES support schemes. The negative cash
flow is mainly determined by the operation cost and preventive and reconstructive
maintenance cost, the debt service to lenders (i.e. interest and amortization of the
debt), and tax payments.
Table 2-1 S impl i f ied project parameters of a typical 20 MW onshore
wind project in an arbi t rary country w ith no support scheme
for renewable energy
Technical parameters Financing parameters
Capacity 20 MW Equity parameters
Full load hours 2000 h - Equity shareb 25 %
Technical lifetime 15 yr - Return on equity (RoE) 15 %
Cost parameters - Equity term 15 yr
Investment 22 M€ Debt parameters (annuity)
Operation & Maintenance 0.8 M€/yr - Debt shareb 75 %
Inflation ratea 0 %/yr - Interest rate 6 %/yr
Power purchase agreement - Debt term 10 yr
Electricity tariff 50 €/MWh - Debt Service Coverage Ratioc 1.35
PPA term 10 yr WACCd 6.9 %
Fiscal parameters
Corporate tax 30 %
Tax loss carry-forward no
Depreciation type linear (10 yr) Nominal levelised cost (15 yr) 96 €/MWh
a In this example, with the inflation rate set at 0%/yr, nominal costs equal real costs.
b The shares of equity and debt are the result of on optimisation routine in the cash flow analysis. At
this equity/debt ratio levelised costs are at a minimum, while total project costs have a net present
value of zero, and the minimum debt service coverage ratio condition is fulfilled.
c Annually constrained.
d WACC: Weighted Average Cost of Capital
de RtaxCorporate
ED
DR
ED
EWACC ∗−∗
+
+∗
+
= )1(
with E : Equity share; D : Debt share; Re : Return on Equity (after tax); Rd : Debt interest rate

18
The data of Table 2-1 are used as input to a generic cash flow model (see Annex 2),
in essence similar to the one described by Wiser and Kahn (1996)3. The cash flow
model incorporates all relevant technical, economic and fiscal variables, and allows
for a sophisticated analysis of different policy schemes and technologies4. If the net
present value of the free cash flow over the project lifetime is larger than or equal
to zero, valued against the return on equity required by the investor, the project
basically is viable from the equity perspective. However, in cases where part of the
project investment cost is to be covered by debts, the lenders (typically banks) will
ask for securities to minimise risks during the operation phase of the project. As
discussed in the previous section, several risk mitigation strategies can be applied to
satisfy the demands of the lender. But in the end, the lender will lend money against
financing conditions that further reduce the risk of non-compliance by the project.
Elements of these conditions are the debt term, the debt interest rate and the
minimum required debt service coverage ratio (DSCR)5.
The DSCR is the total net operating income divided by the debt service. If DSCR
equals unity, all net operating income is used for repayment of interest and
amortization, provided that the project exactly performs as described in the
business plan. Hence, lenders ask for a DSCR larger than unity, in order to ensure
fulfilment of the debt service in cases where the project performs less than
projected, for instance due to lower actual wind speeds or reconstructive
maintenance. For renewable energy projects, the DSCR typically ranges from 1.3 to
2, depending on the maturity of the technology and other risk factors. If the net
operating income of the project is too low to meet the DSCR requirements, the size
of the debt fraction has to be reduced and more equity is required.
The nominal levelised cost of electricity presented in Table 2-1, is the minimum
price of the generated electricity that would be required to make the project viable
from the equity perspective (net present value of free cash flow ≥ 0) and bankable
from the lenders perspective (DSCR ≥ 1.35 in this particular example). This price
(including an electricity price growth rate (here taken as 0%/year)) is assumed to be
paid for the electricity over the full economic lifetime of the project. Because of the
debt service requirements, there is a direct relation with the debt/equity ratio, as
illustrated in Figure 2-3. In this particular example the optimum is at about 25%
equity. At higher rates, the levelised cost increases as the cost of equity is higher
than that of debt (15% versus 6% in this example). At lower rates, the minimum
debt service requirement demands higher operating income and hence shows higher
levelised cost. Figure 2-3 also illustrates the effect of applying different values for
the DSCR. Higher DSCRs result in a shift towards higher equity shares and a
3 Wiser and Kahn (1996) 4 The Ecofys cash flow model for analysis of renewable energy projects has been developed since 1996. For a short description see Annex 2. 5 Other debt service conditions are being used as well.

19
higher levelised cost of electricity. The DSCR determines the minimum levelised
cost of electricity and the related equity share that can be attained. At higher equity
shares, the DSCR can allways be met and is not constraining the debt/equity ratio.
In this example, the levelised cost at 25% equity is about 96 €/MWh for a period of
15 years, whereas the power purchase agreements in this example covers only an
income of 50 €/MWh over a 10 year period. It is clear that without additional
financial support this project will not be feasible.
90
100
110
120
130
0% 20% 40% 60% 80% 100%
Equity (% of total investments)
Le
ve
lis
ed
co
st
(€/M
Wh
e)
DSCR:
1.6
1.5
1.4
1.3
1.35
Figure 2-3 Level i sed cost of e lectr ic i ty for the 20 MW onshore wind
energy reference project: as a funct ion of equ i ty fract ion,
and debt service coverage requirement (DSCR)
2.4.2 Corporate f inance
For comparison we shortly address the case of corporate finance, where the project
is financed on the balance sheet of a company. The main implication is that the
financing of the project is based on the risk profile of the company as a whole, and
not of the particular project. With larger, utility-like companies this usually results
in lower risk factors and hence lower cost of capital: Debt rates and debt terms are
generally more favourable, and the required return on equity by the company is
often lower. Furthermore, there are no restrictions on the debt service of the
particular project. This generally results in a reduction of the levelised cost of
electricity. The design of both the general fiscal regime and the specific renewable
energy support schemes in place, determine the overall difference in levelised cost
of project versus corporate finance.
20
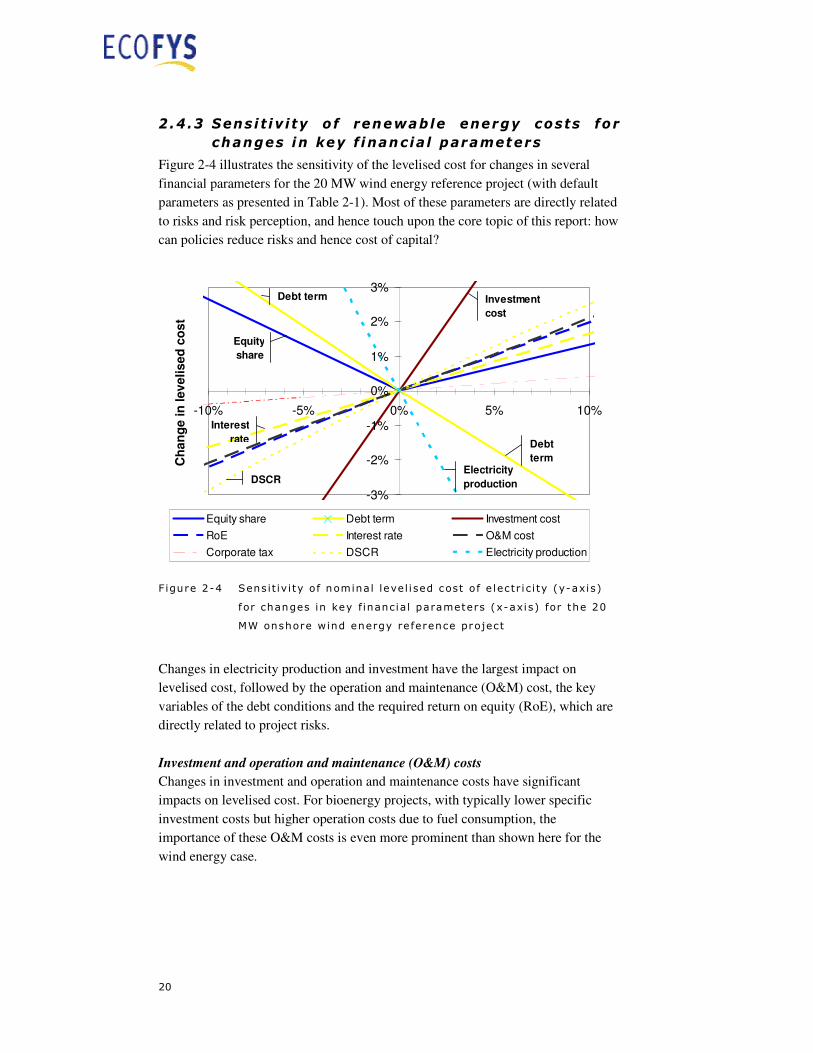
2.4 .3 Sensi t i v i ty o f renewable energy costs for
changes in key f inancia l parameters
Figure 2-4 illustrates the sensitivity of the levelised cost for changes in several
financial parameters for the 20 MW wind energy reference project (with default
parameters as presented in Table 2-1). Most of these parameters are directly related
to risks and risk perception, and hence touch upon the core topic of this report: how
can policies reduce risks and hence cost of capital?
-3%
-2%
-1%
0%
1%
2%
3%
-10% -5% 0% 5% 10%
Change in variable
Ch
an
ge
in
lev
eli
se
d c
os
t
Equity share Debt term Investment cost
RoE Interest rate O&M cost
Corporate tax DSCR Electricity production
Debt
termElectricity
production
Investment
cost
Debt term
Equity
share
DSCR
Interest
rate
Figure 2-4 Sens i t iv i ty of nomina l level i sed cost of e lectr i c i ty (y-axis)
for changes in key f inancial parameters (x-axis) for the 20
MW onshore wind energy re ference project
Changes in electricity production and investment have the largest impact on
levelised cost, followed by the operation and maintenance (O&M) cost, the key
variables of the debt conditions and the required return on equity (RoE), which are
directly related to project risks.
Investment and operation and maintenance (O&M) costs
Changes in investment and operation and maintenance costs have significant
impacts on levelised cost. For bioenergy projects, with typically lower specific
investment costs but higher operation costs due to fuel consumption, the
importance of these O&M costs is even more prominent than shown here for the
wind energy case.
21
As discussed before, investment costs are partly related to policies and measures
via the success rate of project development. The lower this rate, the higher the
market value of developed projects, which is translated in higher investment costs
and/or higher required return on equity (see below). Impacts on levelised cost are
significant. In this particular example a 10% higher investment results in an 8%
higher levelised cost. At financial close the investment costs are known. During
construction cost overruns might occur, but as indicated before several risk
mitigation strategies can be applied to reduce the impact on overall project
performance.
Operation and maintenance costs are generally less affected by policies. One
exception concerns the use of biomass in bioenergy projects. Changes in policies
affecting the key drivers of different biomass markets (e.g. for biofuels, electricity
and/or heat, materials) will affect biomass prices and hence operation costs of these
type of projects. This may concern changes in biomass sustainability criteria,
targets for biofuels, and so on. This uncertainty will be reflected in the debt and
equity parameters and hence contribute to a higher cost of capital.
Based on the above, the following generic statements can be made (see also
OPTRES (2007)):
Debt parameters
The key debt parameters are debt term, interest rate, minimum required debt service
coverage ratio (DSCR), and debt share. Figure 2-5 shows the levelised cost of
electricity and the equity share as a function of the former three parameters (see
also Figure 2-3). The dependency is straightforward: higher debt terms, lower
interest rates and lower debt service requirements will result in lower levelised cost.
In project finance the debt term is typically related to the terms of energy purchase
contracts and/or support schemes, restricted by the technical lifetime of the
� Policies that improve the success rate of the project development phase will reduce
the project investment and hence energy costs of renewable energy technologies.
This refers to amongst others:
� Improving permitting procedures (e.g. pre-planning, streamlining and
simplification of procedures, one-stop agencies, maximum response
periods)
� Improving grid connection procedures (e.g. technical and operational
standards, transparent procedures, non-discriminatory access)
� A stable and predictable long-term policy context will contribute to this improved
success rate and reduce both investment cost and cost of capital.
22
technology but rarely larger than 15 year. Hence, energy market characteristics and
renewable energy policies have a direct and strong impact on this parameter. In this
particular example an extension of the debt term from 10 to 15 years will reduce
levelised cost by 12%. It should be noted that (large) projects can often be
refinanced after a period of satisfactory operation. With more uncertainties being
eliminated (the project operates as expected, or even better) more favourable debt
conditions can often be negotiated.
The interest rate that lenders negotiate with the project owners reflects many
general economic conditions (such as interbank interest rates) as well as project
related technical and situational aspects. This includes an assessment of the
effectiveness of various risk mitigation measures (see section 2.3) and of the
maturity of the renewable energy technology or the practices and technologies used
for construction and operation of this technology (notably relevant for offshore
wind or geothermal energy projects). If detailed site-specific resource and risk
conditions are well known and understood, this will reduce cost of capital by
improved debt conditions. For instance, the availability of wind speed data can
reduce negotiated interest rates by several tens of percent points in particular cases.
A reduction of the interest rate from 6% to 5% will result in cost reductions of
about 3% in the current example.
The debt service coverage ratio shows a similar reflection of the risk-assessment by
lenders as is the case for the interest rate. New, unproven technologies will
generally encounter a higher DSCR value than proven technologies (typically 2 or
higher). In our example, an increase in the DSCR from 1.35 to 2 will result in a cost
increase of 10%. A reduction from 1.35 to 1.3 results in a cost reduction of 1%. If
debt reserves can be created, annual DSCR constraints can be partly covered by
banking the surplus of previous years. This increases the leverage of a project.
As discussed before, the equity/debt ratio is typically the result of finding the
optimum configuration of financial parameters. In our (simplified) case this means
achieving the highest return on investment, while at the same time meeting the debt
service requirements, which is clearly shown in Figure 2-3. In actual project
finance cases this optimisation will concern many more parameters.
A reduction in (perceived) risks typically affects more than one of the debt
parameters at the same time. The combined effect of the above changes in debt
parameters for the wind energy example (debt rate 5%, debt term 15 year, DSCR =
1.3) can be larger than the sum of the individual effects: the combined cost
reduction as compared to the reference case (see Table 2-1) is about 16%.
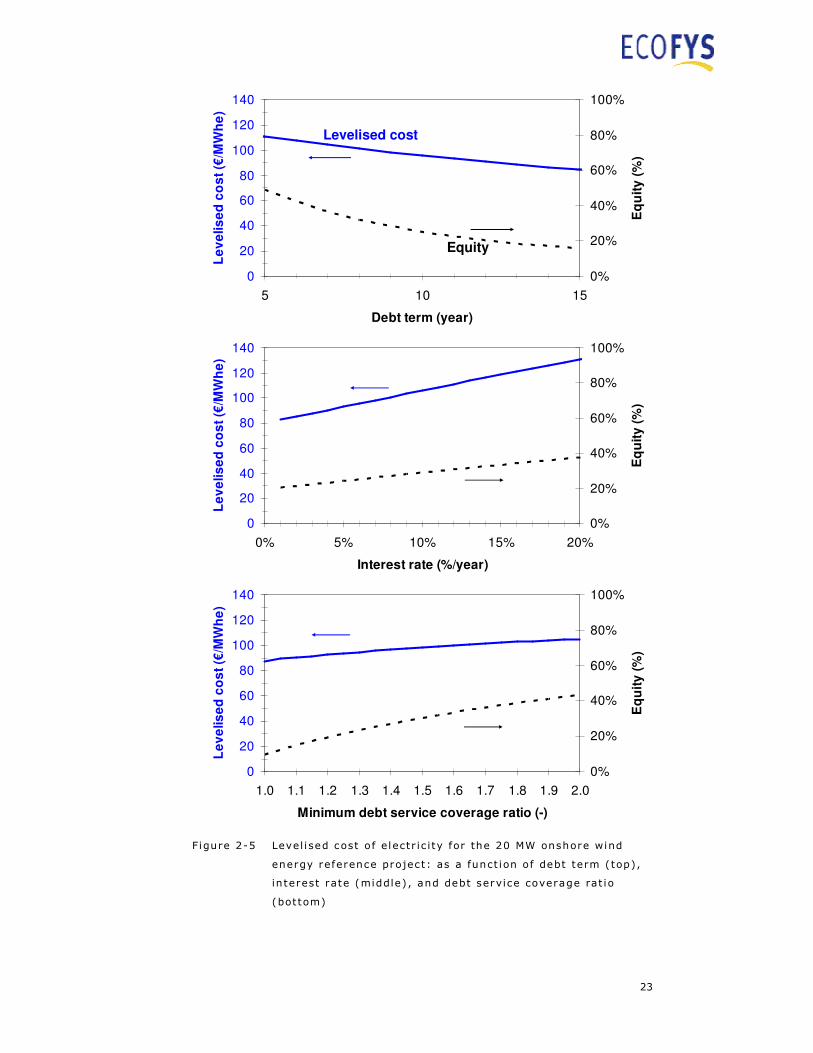
23
Figure 2-5 Level i sed cost of e lectr ic i ty for the 20 MW onshore wind
energy reference project: as a funct ion of debt term (top),
interest rate (middle) , and debt service coverage rat io
(bottom)
0
20
40
60
80
100
120
140
0% 5% 10% 15% 20%
Interest rate (%/year)
Le
ve
lis
ed
co
st
(€/M
Wh
e)
0%
20%
40%
60%
80%
100%
Eq
uit
y (
%)
0
20
40
60
80
100
120
140
5 10 15
Debt term (year)
Le
ve
lis
ed
co
st
(€/M
Wh
e)
0%
20%
40%
60%
80%
100%
Eq
uit
y (
%)
0
20
40
60
80
100
120
140
1.0 1.1 1.2 1.3 1.4 1.5 1.6 1.7 1.8 1.9 2.0
Minimum debt service coverage ratio (-)
Le
ve
lis
ed
co
st
(€/M
Wh
e)
0%
20%
40%
60%
80%
100%
Eq
uit
y (
%)
Levelised cost
Equity

24
The policy implications can be summarised as follows:
Equity parameters
The most important equity parameters are the required return on equity after taxes
(RoE) by the investor, and the equity share. As illustrated in Figure 2-3, the latter is
closely related to the conditions of the lender, such as the debt service coverage
ratio.
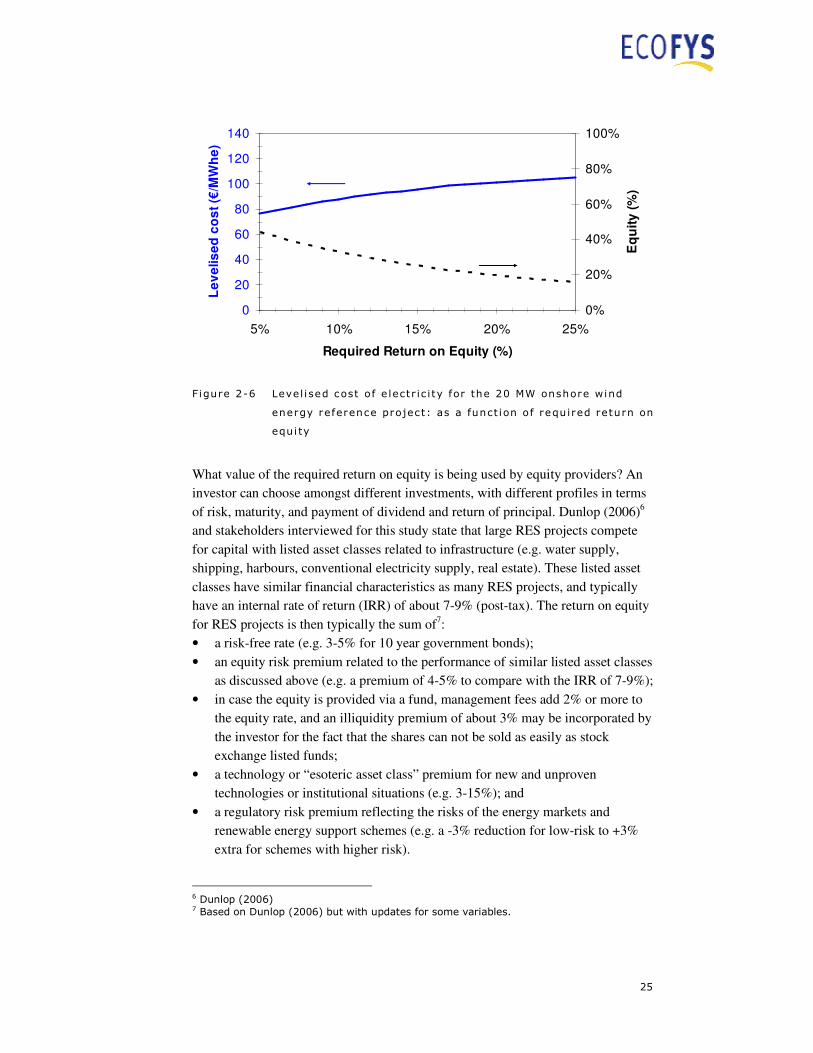
Figure 2-6 shows that a higher required return on equity results in a shift from
equity to debt. In order to meet debt service requirements, the levelised cost needs
to increase at the same time. If the required return on equity decreases from 15% to
10% the levelised cost declines by about 8% in this example.
Policies that anticipate on risk assessment practices by lenders can reduce costs of
capital significantly:
� Create market conditions and design support schemes that result in debt terms
being close to technical lifetimes (e.g. longer duration of production support and
PPAs).
� For large investments in infrastructure (e.g. offshore electricity grids with technical
lifetimes of components ranging from 20 to 40 year), this could imply investments
by transmission system operators (TSOs) based on corporate finance at more
favourable debt conditions (much longer term, lower interest rate due to lower
risk, et cetera).
� Take measures that result in lower interest rates, e.g.:
- offer low (state bank) interest rates
- offer tax deductions for investments in renewable energy funds
- facilitate the collection and disclosure of site-specific resource and other
relevant data, such as meteorological, geological or bathymetric data (e.g.
wind, solar, wave and tidal energy resource)
� Facilitate the demonstration of new technologies that will result in improved
knowledge on the risk profiles of these technologies and hence reduce the debt
service requirements and required return on equity for future projects.
� Reduce risks, e.g. by offering bank guarantees, or by participating as co-investor in
projects.
25
0
20
40
60
80
100
120
140
5% 10% 15% 20% 25%
Required Return on Equity (%)
Le
ve
lis
ed
co
st
(€/M
Wh
e)
0%
20%
40%
60%
80%
100%
Eq
uit
y (
%)
Figure 2-6 Level i sed cost of e lectr ic i ty for the 20 MW onshore wind
energy reference project: as a funct ion of required return on
equi ty
What value of the required return on equity is being used by equity providers? An
investor can choose amongst different investments, with different profiles in terms
of risk, maturity, and payment of dividend and return of principal. Dunlop (2006)6
and stakeholders interviewed for this study state that large RES projects compete
for capital with listed asset classes related to infrastructure (e.g. water supply,
shipping, harbours, conventional electricity supply, real estate). These listed asset
classes have similar financial characteristics as many RES projects, and typically
have an internal rate of return (IRR) of about 7-9% (post-tax). The return on equity
for RES projects is then typically the sum of7:
• a risk-free rate (e.g. 3-5% for 10 year government bonds);
• an equity risk premium related to the performance of similar listed asset classes
as discussed above (e.g. a premium of 4-5% to compare with the IRR of 7-9%);
• in case the equity is provided via a fund, management fees add 2% or more to
the equity rate, and an illiquidity premium of about 3% may be incorporated by
the investor for the fact that the shares can not be sold as easily as stock
exchange listed funds;
• a technology or “esoteric asset class” premium for new and unproven
technologies or institutional situations (e.g. 3-15%); and
• a regulatory risk premium reflecting the risks of the energy markets and
renewable energy support schemes (e.g. a -3% reduction for low-risk to +3%
extra for schemes with higher risk).
6 Dunlop (2006) 7 Based on Dunlop (2006) but with updates for some variables.
26
Depending on the investment strategy of the equity provider (and the actual macro-
economic parameters) the required return on equity will vary from about 12-15%
for proven technologies (such as onshore wind energy) in markets with no
additional regulatory risk. As mentioned, one of the aspects affecting the required
return on equity is the regulatory context and the renewable energy support scheme
in place.
Following a slightly different approach, the European Wind Energy Association8
has derived estimates for the Weighted Average Cost of Capital (WACC) for
renewable electricity projects in Europe under different support schemes. From this
the required return on equity can be derived9 which results in similar results, as
shown in Figure 2-7.
The figure shows that the values are lowest for feed-in schemes, followed by feed-
in premium and tendering schemes, obligation schemes with tradable green
certificates, and finally investment subsidies. Furthermore, the figure shows that
significant improvements can be achieved in designing more advanced schemes
where several barriers are being removed. As discussed before, this has significant
impact on the levelised cost of energy. The advanced schemes have the following
elements: apply sufficient long periods of support (e.g. 10 to 20 year) in feed-in
tariff (FIT) and –premium (FIP) schemes, use technology-specific tariffs/premiums
or investment subsidies, allow for changes in cost structures (for new capacity), use
stepped tariffs (FIT) for different resource categories (e.g. reflecting differences in
wind classes), allow for longer term power purchase agreements (e.g. minimal 15
years in tender schemes), use clear tender procedures with deadlines and
meaningful penalties, and long-term (> 20 year) mandatory targets for obligation
schemes.
It should be emphasized that the RoE’s depicted in Figure 2-7 are generic and will
change over time depending on changes in general economic conditions,
technologies, design and organisation of market, and design of policy schemes; and
due to advanced experience with these schemes. Furthermore, the data are not
technology specific, whereas in practice there will be a discrepancy between
technologies.
8 EWEA (2005), note the calculations of the WACC in this EWEA report are not consistent with conventional WACC calculations 9 Using the default values for interest rate, equity share and corporate tax as given in Table 2-1.

27
0%
5%
10%
15%
20%
Feed-in Tariff Feed-in Premium Tender Tradable Green
Certificates
Investment
Subsidies
Re
qu
ire
d r
etu
rn o
n e
qu
ity
(%
)
Generic support scheme
Advanced support scheme
Figure 2-7 Required return on equi ty as a funct ion of the renewable
e lectr ic ity support scheme, both for current generic schemes
and more advanced schemes 8
The policy implications can be summarised as follows:
Tax parameters
The fiscal regime present in a country or region is important for the feasibility and
bankability of a renewable energy project. Important factors are (amongst others)
the corporate tax level, the applicable tax depreciation methods, and the amount of
flexibility built in the tax system (e.g. with regards to accounting practices
regarding loss carry-back or carry-forward).
� Policies that reduce the required return on equity by investors potentially have
significant cost reduction implications.
� Improved design of existing policy support schemes may be more effective in this
respect, than a switch to a different policy scheme.
� Reducing the required return on equity encompasses a wide range of measures that
create stability and predictability of markets, amongst others:
� long-term and sufficiently ambitious targets should be set
� the policy instrument should remain active long enough to provide sta-
ble planning horizons and for a given project, the support scheme
should not change during its lifetime
� stop-and go policies are not suitable and a country’s ‘track record’ in
RES policies probably influences perceived stability very much
28
0
20
40
60
80
100
120
140
15% 20% 25% 30% 35% 40% 45%
Corporate tax (%)
Le
ve
lis
ed
co
st
(€/M
Wh
e)
0%
20%
40%
60%
80%
100%
Eq
uit
y (
%)
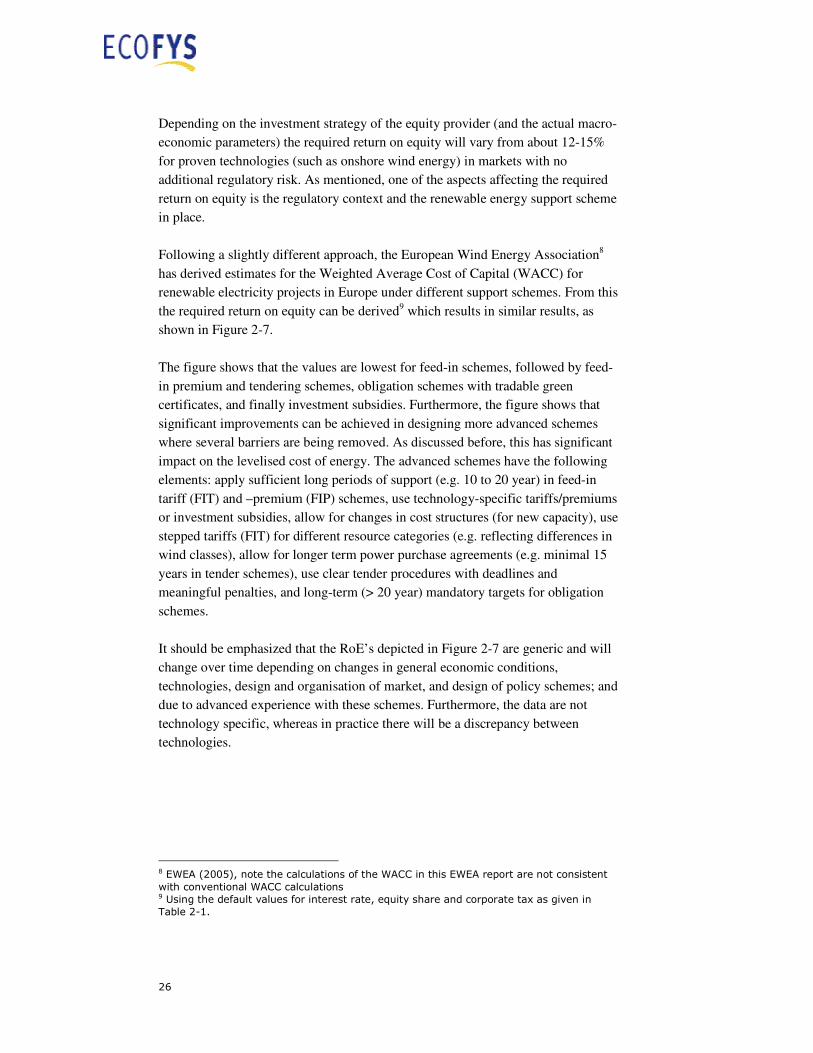
Figure 2-8 Level ised cost of e lectr ic i ty for the 20 MW onshore wind
energy reference projec t: as a funct ion of corporate tax
levels ( l inea r f i s ca l de prec iat i on ove r 10 ye a r)
Corporate taxes vary around the world, from 0% in the Cayman Islands to 55% and
even more for foreign investors in oil projects in the United Arab Emirates.
However, most countries have tax levels within the range of 15% to 40%10. As can
be seen from Figure 2-8, changes in corporate tax levels only have a limited effect
on the levelised cost of electricity: a reduction from 30% to 20% results in a cost
reduction of about 1% in the considered example.
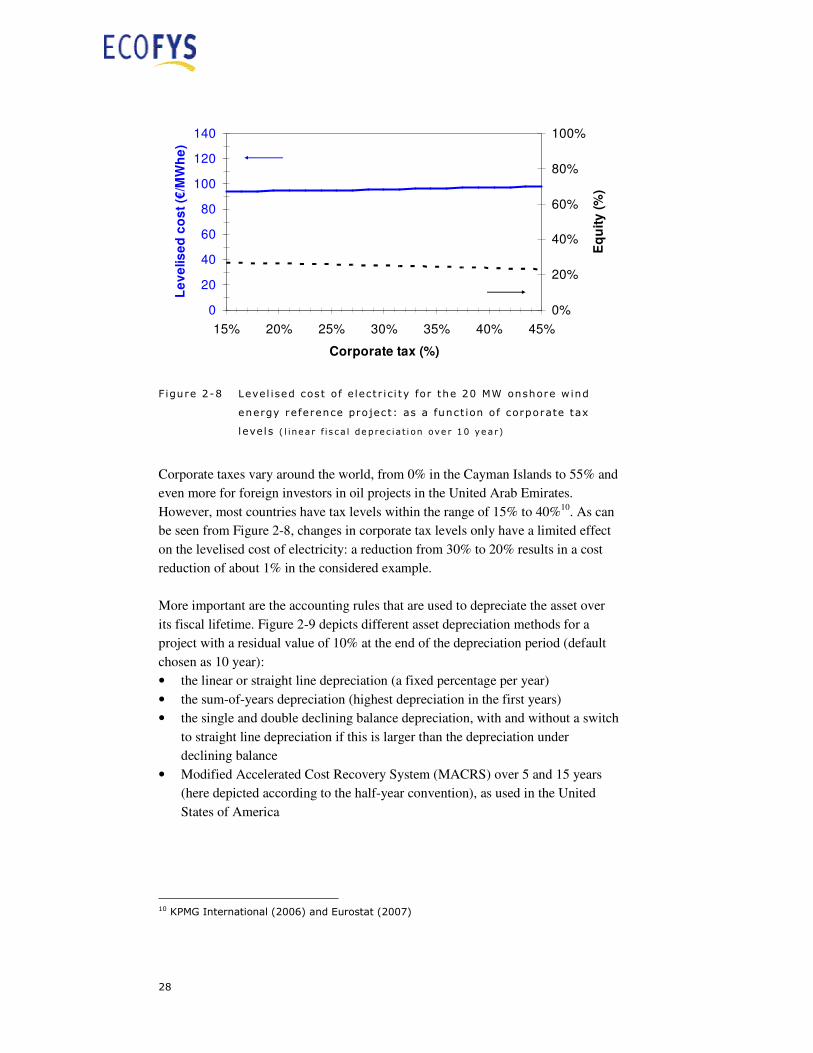
More important are the accounting rules that are used to depreciate the asset over
its fiscal lifetime. Figure 2-9 depicts different asset depreciation methods for a
project with a residual value of 10% at the end of the depreciation period (default
chosen as 10 year):
• the linear or straight line depreciation (a fixed percentage per year)
• the sum-of-years depreciation (highest depreciation in the first years)
• the single and double declining balance depreciation, with and without a switch
to straight line depreciation if this is larger than the depreciation under
declining balance
• Modified Accelerated Cost Recovery System (MACRS) over 5 and 15 years
(here depicted according to the half-year convention), as used in the United
States of America
10 KPMG International (2006) and Eurostat (2007)
29
0%
5%
10%
15%
20%
25%
30%
35%
0 5 10 15Year
De
pre
cia
tio
n o
f a
ss
ets
(min
us s
alv
ag
e v
alu
e)
Straight line
Sum-of-years
Declining balance
Declining balance, withswitch to straight lineDouble Declining Balance
Double Declining Balance,with switch to straight lineMACRS 5 year
MACRS 15 year
Figure 2-9 Example o f f iscal deprec iat ion of assets under di f ferent
methods, re lat ive to the book value at the start of project
( res i dua l va l ue at t he end o f deprec i at i on: 10%; deprec iat i on
pe r iod: 10 yea r , ex cept fo r MACRS: 5 and 15 yea r (ha l f - yea r
conven t ion) )
15 yr
15 yr
15 yr
15 yr
15 yr
10 yr
10 yr
10 yr
10 yr
5 yr
85
90
95
100
Linear/
Straight line
Sum-of-
Year
SDB DDB MACRS
Le
ve
lis
ed
co
st
(€/M
Wh
e)
De
fau
lt
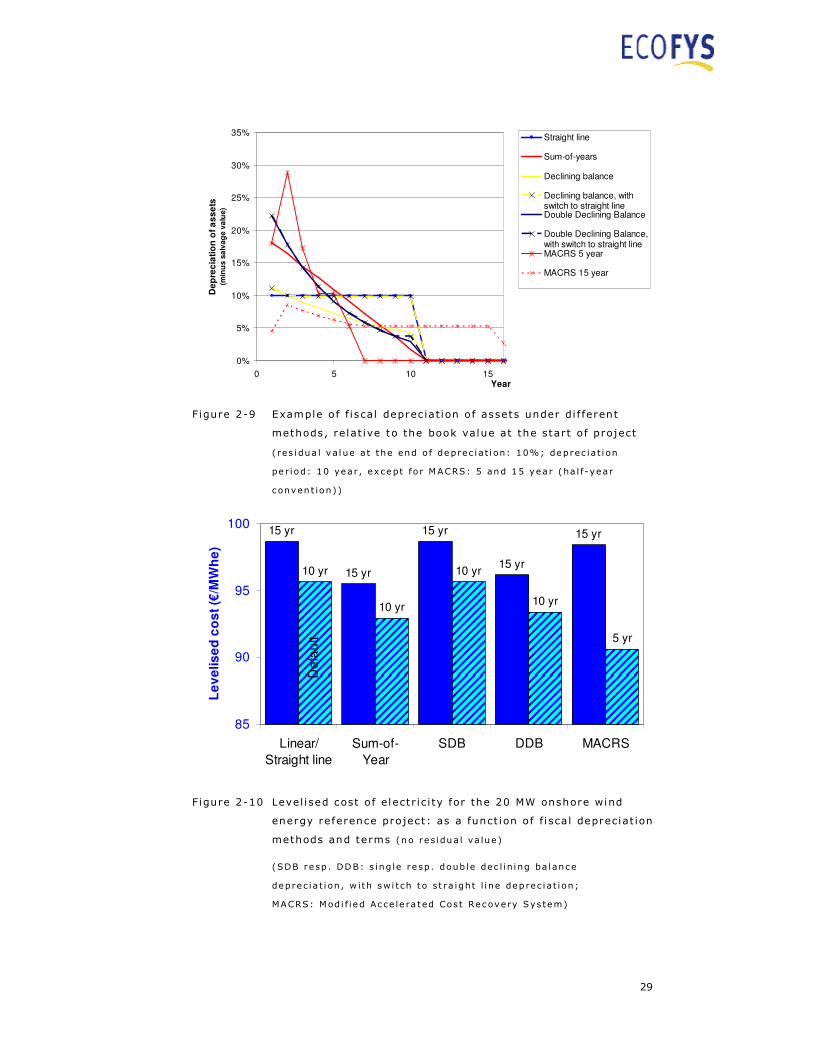
Figure 2-10 Level i sed cost of e lectr ic i ty for the 20 MW onshore wind
energy reference project: as a funct ion of f i sca l depreciat ion
methods and terms (n o re s idua l va lue )
(SDB resp . DDB: s ing le re sp . doub le dec l in i ng ba lance
deprec ia t i on , w i th swi tch t o s t ra ight l i ne dep rec ia t i on ;
MACRS: Mod i f i ed Acce le ra ted Cost Rec ove ry Sys tem)
30
The faster the asset can be depreciated, the higher the net present value of the tax
reductions will be and the lower the levelised cost of the project (provided that the
project itself will generate income, or that loss carry-forward can be applied). This
is shown in Figure 2-10 for the 20 MW wind onshore reference case. It clearly
shows that the 5 year MACRS depreciation (which is applicable to RES in the
USA) results in the lowest levelised cost, due to both the shape and the short term
of the depreciation. As compared to the default reference case, costs vary from -5%
to +3%. The ‘sum-of-year’ and ‘double declining balance with shift to straight line’
methods result in the largest cost reductions.
The availability of tax loss carry-back or -forward is used to harvest the tax benefit
of spreading negative EBT (earnings before tax) over years with positive EBT, thus
reducing taxable income. In the comparative assessment for this study only tax loss
carry-forward is considered, which is allowed in the countries considered. As we
assume project financing cases without any provisions to deduct negative EBT
from other taxable income, tax loss carry-forward arrangements generally result in
lower levelised cost of electricity.
The policy implications can be summarised as follows:
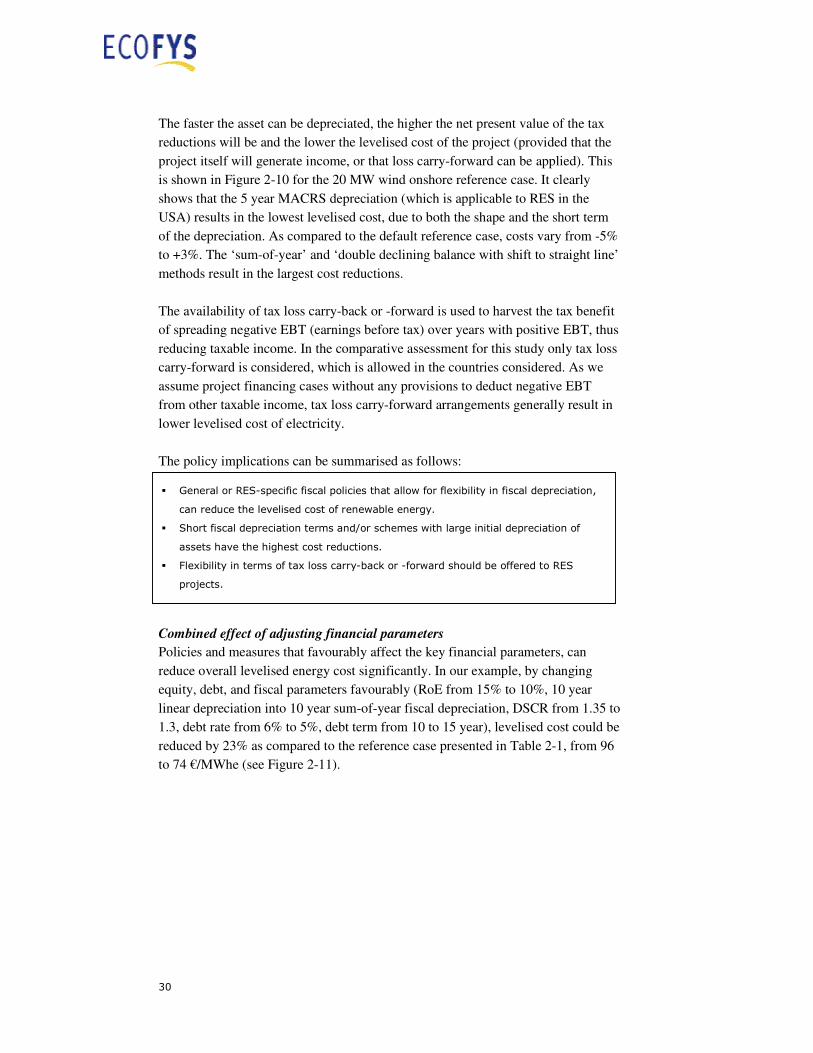
Combined effect of adjusting financial parameters
Policies and measures that favourably affect the key financial parameters, can
reduce overall levelised energy cost significantly. In our example, by changing
equity, debt, and fiscal parameters favourably (RoE from 15% to 10%, 10 year
linear depreciation into 10 year sum-of-year fiscal depreciation, DSCR from 1.35 to
1.3, debt rate from 6% to 5%, debt term from 10 to 15 year), levelised cost could be
reduced by 23% as compared to the reference case presented in Table 2-1, from 96
to 74 €/MWhe (see Figure 2-11).
� General or RES-specific fiscal policies that allow for flexibility in fiscal depreciation,
can reduce the levelised cost of renewable energy.
� Short fiscal depreciation terms and/or schemes with large initial depreciation of
assets have the highest cost reductions.
� Flexibility in terms of tax loss carry-back or -forward should be offered to RES
projects.
31
-20
0
20
40
60
80
100
Lev
elise
d c
ost
of ele
ctr
icity
(€/M
Wh
e)
Equity
Debt
service
O&M
Taxes
RoE
from 15%
to 10%
Depreciation
from linear
to Sum of Year
DSCR
from 1.35
to 1.3
Debt rate
from 6%
to 5%
Debt term
from 10 yr
to 15 yr
25%33% 35% 33% 32%
22%Equity
fraction
Figure 2-11 Level i sed cost of e lectr ic i ty and equity fract ion for the 20
MW onshore wind energy reference project: as a funct ion of
cumulat ive improvement in key f inanc ial parameters:
required return on equi ty (RoE) , f i sca l depreciat ion scheme,
debt service coverage rat io (DSCR), debt rate , and debt
term.
Figure 2-11 illustrates that the effect of changing the required return on equity and
the debt term has the largest impact on the levelised cost of electricity in this
example. Both parameters can directly be influenced by policies and measures, and
the design of associated support schemes. The figure shows that a stable and
reliable policy and market context (resulting in longer debt terms and a lower
required return on equity) potentially has significant impact on the cost of capital.
Note that the cost data in the figure are still without assuming any production
support from feed-in, feed-in premium, or certificates. However, their design does
highly affect the risk assessment by the financial sector, and hence the cost of
capital.
The policy implications can be summarised as follows:
� A favourable generic and RES-specific investment climate can result in levelised cost
savings of over 20%. These savings can be attributed to reductions in the cost of
capital.
� Policies and measures and associated support schemes that anticipate on the risk
perception by investors and lenders, have lowest costs of capital. In designing
support schemes, the expertise of the financial sector should be involved.

32
In real project finance, more design parameters play a potentially important role
than the ones presented above. The selection presented here concerns a rather
conventional, generic approach, typical for a sensitivity analysis that would be
made in the early project development phase. Especially for large-scale projects,
“financial engineering” will provide tailor-made solutions, which make optimal use
of fiscal and financial instruments.
In the next chapter we will discuss how renewable energy policy schemes affect the
key financial parameters that determine the cost of capital. We will also address
how these policies could be improved based on a more detailed assessment of some
reference cases for a selected set of national policy schemes (chapters 4 and 5).

33
3 Overview of policies and measures in selected IEA countries
This chapter gives an overview of policies and measures which are (suitable to
be) applied in selected IEA countries for stimulating increased deployment of
renewable energies. Major design features of these instruments – especially those
potentially affecting financing risk – are briefly described.
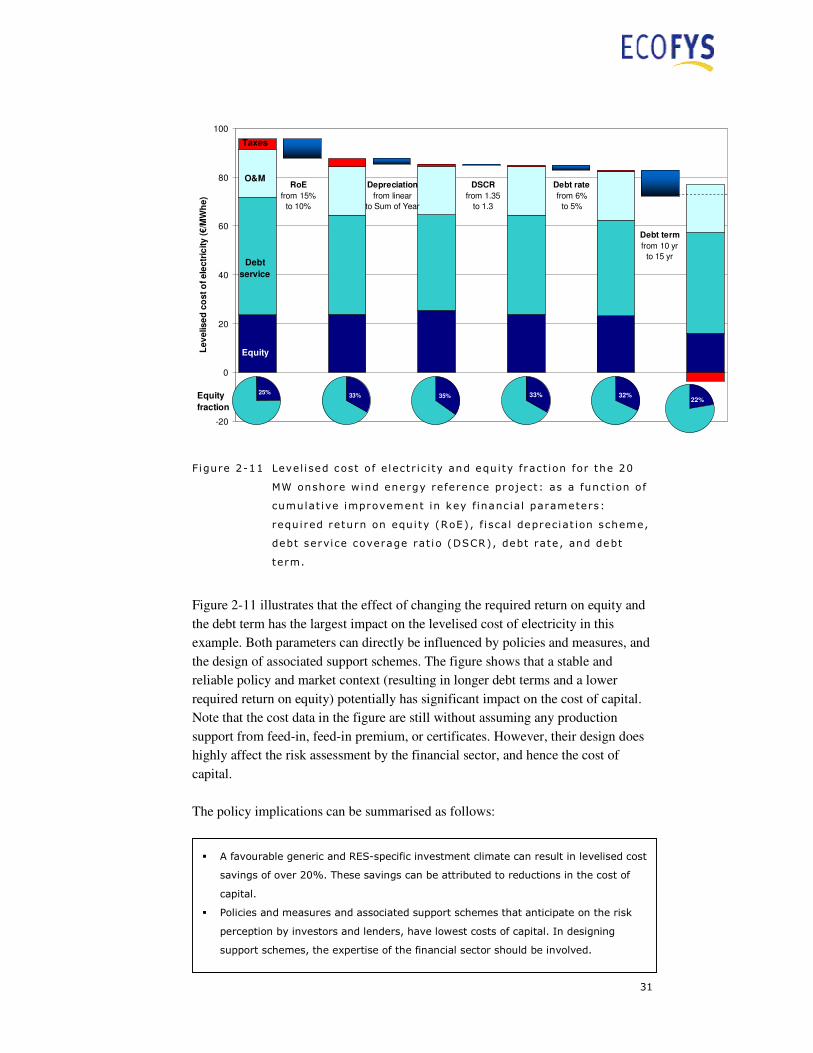
3.1 Pol icy types and genera l des ign aspects
A range of different policy instruments is available to support increased
deployment of RES. The next sections cover the main financial support instruments
that are being applied in different forms, such as:
• feed-in and premium tariffs,
• quota obligations,
• tendering schemes, and
• fiscal and other support incentives such as direct production support,
investment subsidies, low interest loans and different kinds of tax measures.
Besides financial support, RES projects heavily depend on permitting and grid
connection procedures, thus section 3.6 covers policies to reduce administrative and
grid barriers, which will notably affect the costs of renewable energy by affecting
the market value of projects that are being offered for financial closure. Climate
change mitigation policies, which do affect the competitiveness and the long-term
prospects of RES and thus the investor confidence are touched upon in the last
section.
Figure 3-1 shows the dominant financial support systems that can be found in
selected IEA countries for electricity generated from renewable energy sources
(RES-E) (see Annex 1 for a presentation of the respective country fact sheets1).
Note that this classification is not rigid: Some countries have different support
systems for different technologies, whereas Spain for example allows producers to
choose between two systems. In Minnesota and Ontario projects receive support
from two support systems in parallel. Note also that even within each category of
1 The following countries/regions were assessed in more detail: Canada (Ontario and Québec), Denmark (DK), France (FR), Germany (DE), Ireland (IE), Italy (IT), Japan (JP), The Netherlands (NL), Norway (NO), Portugal (PT), Spain (ES), United Kingdom (UK), and the United States of America (California and Minnesota)
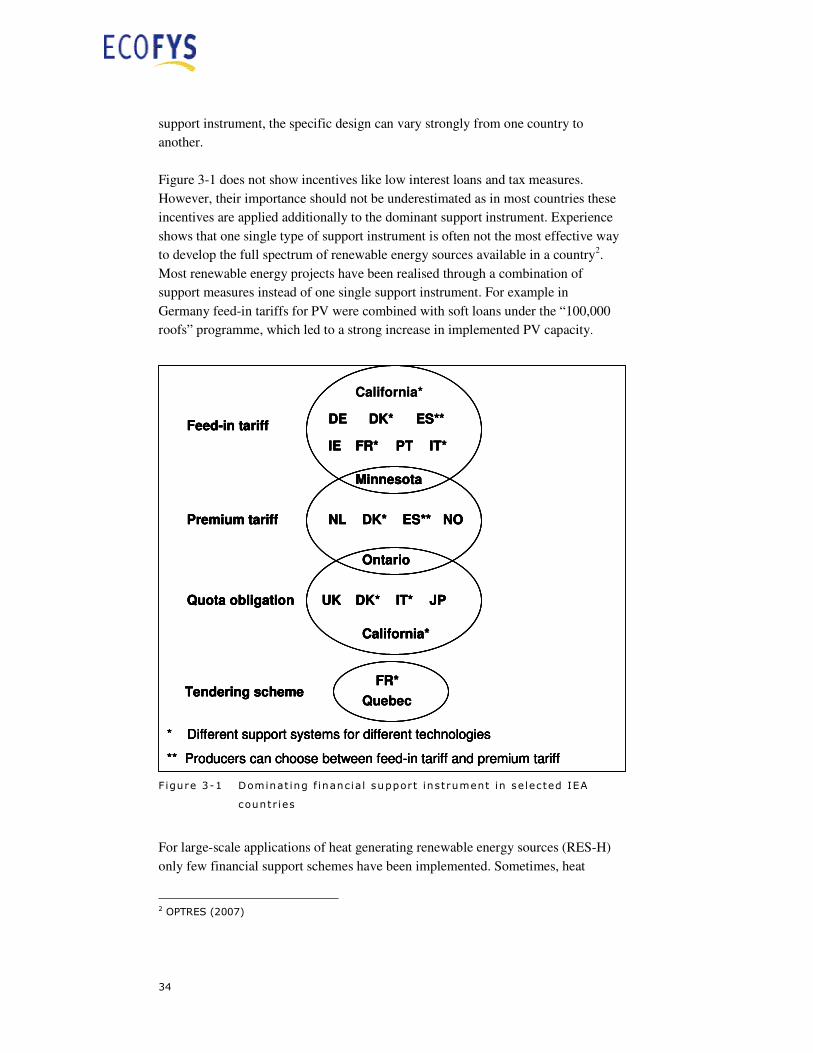
34
support instrument, the specific design can vary strongly from one country to
another.
Figure 3-1 does not show incentives like low interest loans and tax measures.
However, their importance should not be underestimated as in most countries these
incentives are applied additionally to the dominant support instrument. Experience
shows that one single type of support instrument is often not the most effective way
to develop the full spectrum of renewable energy sources available in a country2.
Most renewable energy projects have been realised through a combination of
support measures instead of one single support instrument. For example in
Germany feed-in tariffs for PV were combined with soft loans under the “100,000
roofs” programme, which led to a strong increase in implemented PV capacity.
Figure 3-1 Dominat ing f inancial support instrument in selected IEA
countr ies
For large-scale applications of heat generating renewable energy sources (RES-H)
only few financial support schemes have been implemented. Sometimes, heat
2 OPTRES (2007)
California*
Tendering scheme
Feed-in tariff
Premium tariff
Quota obligation
NL
DE
ES**DK*
UK IT*
NO
FR*
California*
PTIE
JP
* Different support systems for different technologies
** Producers can choose between feed-in tariff and premium tariff
Ontario
Minnesota
FR*
DK*
DK* ES**
IT*
Quebec
California*
Tendering scheme
Feed-in tariff
Premium tariff
Quota obligation
NL
DE
ES**DK*
UK IT*
NO
FR*
California*
PTIE
JP
* Different support systems for different technologies
** Producers can choose between feed-in tariff and premium tariff
Ontario
Minnesota
FR*
DK*
DK* ES**
IT*
QuebecTendering scheme
Feed-in tariff
Premium tariff
Quota obligation
NL
DE
ES**DK*
UK IT*
NO
FR*
California*
PTIE
JP
* Different support systems for different technologies
** Producers can choose between feed-in tariff and premium tariff
Ontario
Minnesota
FR*
DK*
DK* ES**
IT*
Tendering scheme
Feed-in tariff
Premium tariff
Quota obligation
NL
DE
ES**DK*
UK IT*
NO
FR*
California*
PTIE
JP
* Different support systems for different technologies
** Producers can choose between feed-in tariff and premium tariff
Ontario
Minnesota
FR*
DK*
DK* ES**
IT*
Quebec
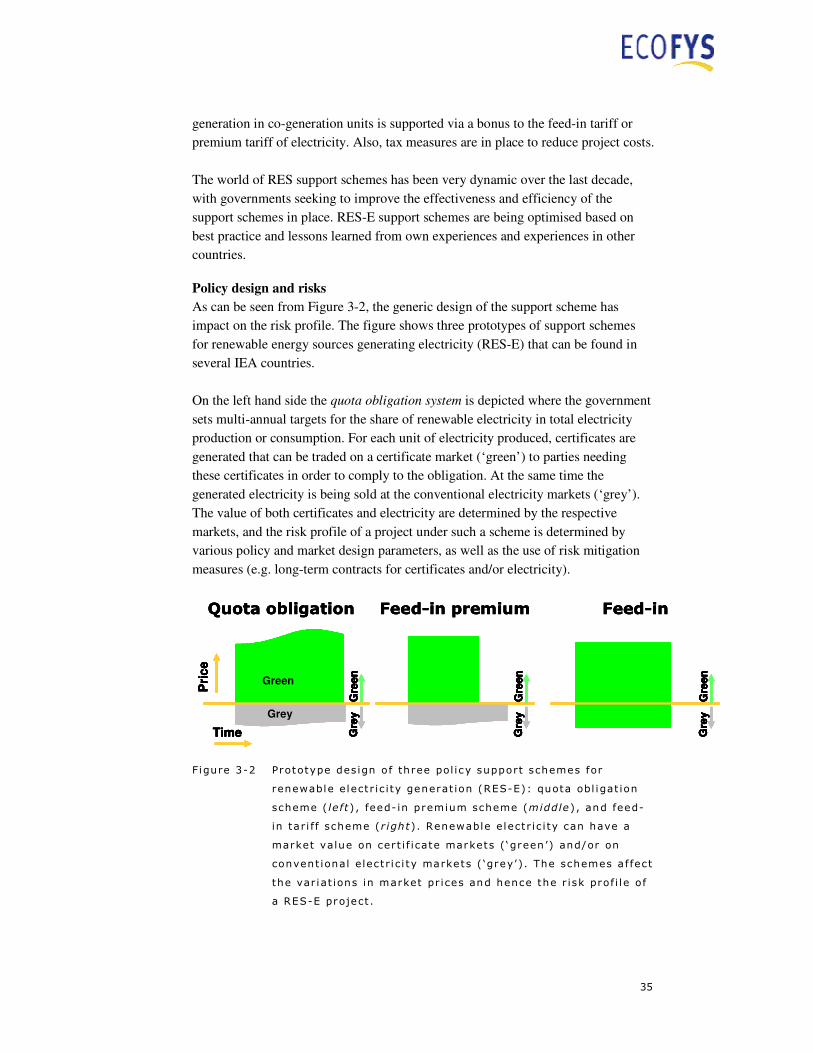
35
generation in co-generation units is supported via a bonus to the feed-in tariff or
premium tariff of electricity. Also, tax measures are in place to reduce project costs.
The world of RES support schemes has been very dynamic over the last decade,
with governments seeking to improve the effectiveness and efficiency of the
support schemes in place. RES-E support schemes are being optimised based on
best practice and lessons learned from own experiences and experiences in other
countries.
Policy design and risks As can be seen from Figure 3-2, the generic design of the support scheme has
impact on the risk profile. The figure shows three prototypes of support schemes
for renewable energy sources generating electricity (RES-E) that can be found in
several IEA countries.
On the left hand side the quota obligation system is depicted where the government
sets multi-annual targets for the share of renewable electricity in total electricity
production or consumption. For each unit of electricity produced, certificates are
generated that can be traded on a certificate market (‘green’) to parties needing
these certificates in order to comply to the obligation. At the same time the
generated electricity is being sold at the conventional electricity markets (‘grey’).
The value of both certificates and electricity are determined by the respective
markets, and the risk profile of a project under such a scheme is determined by
various policy and market design parameters, as well as the use of risk mitigation
measures (e.g. long-term contracts for certificates and/or electricity).
Quota obligation
Pri
ce
Gre
en
Gre
y
Green
Grey
Time
Feed-in premium
Gre
en
Gre
y
Feed-in
Gre
en
Gre
y
Quota obligation
Pri
ce
Gre
en
Gre
y
Green
Grey
Time
Quota obligation
Pri
ce
Gre
en
Gre
y
Green
Grey
Time
Pri
ce
Pri
ce
Gre
en
Gre
y
Green
Grey
Gre
en
Gre
yG
reen
Gre
yG
reen
Gre
y
Green
Grey
Green
Grey
TimeTime
Feed-in premium
Gre
en
Gre
y
Feed-in premium
Gre
en
Gre
yG
reen
Gre
yG
reen
Gre
yG
reen
Gre
y
Feed-in
Gre
en
Gre
y
Feed-in
Gre
en
Gre
yG
reen
Gre
yG
reen
Gre
yG
reen
Gre
y
Figure 3-2 Prototype des ign of three pol icy support schemes for
renewable e lectr ic i ty generat ion (RES-E): quota obl igat ion
scheme ( le ft) , feed- in premium scheme (middle ) , and feed-
in tar i f f scheme (r ight). Renewable e lectr ic i ty can have a
market value on cert i f icate markets ( ‘green ’) and/or on
convent ional e lectr i c i ty markets ( ‘grey’). The schemes af fect
the var iat ions in market pr ices and hence the r isk prof i l e of
a RES-E project .
36
Feed-in premium schemes as depicted in the middle of Figure 3-2 eliminate part of
the market risks of the quota obligation system, by offering a fixed price for the
‘greenness’ of the generated electricity during a fixed period of time. On the right
hand side the feed-in system is depicted: for each unit of electricity a fixed feed-in
tariff is being payed to the producer for a fixed period of time. This scheme largely
eliminates the market risk for most RES.
General design aspects Some general aspects described below apply regardless of the chosen policy
instruments.3
Long-term and ambitious targets Long-term and sufficiently ambitious targets should be set in order to ensure a
sufficient level of investor security. As soon as deployment levels are
approaching targets, a revision of the targets should be triggered.
Stable support policy The policy instrument should remain active long enough to provide stable
planning horizons. It follows that stop-and go policies are not suitable and that,
for a given project, the support scheme should not change during its lifetime.
Policy changes should only apply to new projects and should be announced
well-ahead in order to give projects under development planning reliability,
ideally reflecting typical project development duration of one to four years.
Source of funding Funding for support can either be sourced from the state budget or from a
surcharge on energy tariffs. The latter has the advantage that support schemes
are affected less by budget constraints.
For example, the funds for the premium tariffs in the Netherlands are on the
government budget, whereas in Germany the feed-in tariffs are paid for by the
electricity consumers. Given the significant rise in government expenses for
RES-E, the history of Dutch support for RES-E has shown several changes in
budgets and assigned tariffs, whereas the even larger rise in RES-E support in
Germany hardly had any impact on tariffs or total levels of support.
Duration of support Duration of the support for single projects should not be unlimited but be
restricted to a certain time frame in order to avoid over-funding. The duration
should ideally reflect the technology’s economic lifetime in order to allow for
longer debt terms and/or refinancing, which reduces financing cost.
3 Compare also Ragwitz et al. (2007)
37
3.2 Feed- in tar i f fs and premium tar i f fs
Feed-in tariffs guarantee a fixed financial payment per unit of electricity produced
from renewable energy sources. This support can be for both the physical electricity
and the green value together (fixed feed-in tariff) or it can just be a premium for the
green value, while the producer receives the rest of his income from selling the
electricity on the regular electricity market (premium tariff). A combination of both
fixed feed-in tariffs and premium tariffs is also possible and currently operational in
Spain, where RES-E producers can choose every year which support system they
want to use.
Duration of tariffs Tariff levels are usually guaranteed for a longer period, e.g. 10 up to 20 years.
In this way they provide long-term certainty about receiving financial support,
which is considered to lower investment risks considerably.
Technology-specific tariffs Technology-specific tariffs can be used in order to support different
technologies while avoiding windfall profits for cheaper technologies.
Stepped tariffs Tariffs can be stepped according to site conditions (for example average wind
speed) in order to avoid windfall profits for projects at the more favorable sites.
Tariff degression A fixed or regularly determined degression of tariffs over time for new
installations can be used in order to reflect for economies of scale and learning.
Tariff levels should be evaluated in regular intervals and be adjusted if
necessary, but changes should only apply to new installations.
Front loading the payment stream Instead of having a constant tariff level for the complete support duration, it can
be considered to increase tariffs for the first years of a project while decreasing
tariffs in the last years4. Without increasing the total sum of financial support,
this can help to reduce financing cost. This is for example applied in the
German support for wind energy, where for most projects feed-in tariffs are
reduced in later years.
4 Compare Wiser and Pickle (1997)
38
3.3 Quota ob l igat ions
Quota obligations, also called renewable obligations or renewable portfolio
standards (RPS) impose a minimum share of renewables in the overall electricity
mix. This obligation can be imposed on consumers, retailers or producers. A quota
obligation system is often combined with tradable green certificates (as in the UK),
although this does not necessarily have to be the case (as in California). Financial
support for the RES-E producer comes from the fact that an obligated party failing
to meet its quota obligation faces a penalty. The financial value of RES-E or the
green certificates is determined by the level of the quota obligation, the size and
allocation of the penalty, and the duration of RES-E being eligible under the quota
system. Appropriate fine tuning of a quota obligation system is of utmost
importance for effective promotion of RES-E. If the quota obligation is set too low,
or if the penalty is too low or not enforced, then the value of RES-E in the market
will be low, generating insufficient stimulation to initiate new RES-E projects.
Time horizon of the quota obligation Obligation levels need to be set well in advance and the quota obligation should
be guaranteed to be in place for a sufficiently long time period in the future in
order to guarantee future demand for RES-E. For instance, in the UK the
obligation level has been set until 2016 while the obligation itself is guaranteed
to remain in place at least until 2027.
Penalty Penalties should be set well in advance, significantly above green certificate
prices, and enforcement should be guaranteed. For example in Sweden the
penalty is set at 150% of the certificate price. Recycling of penalties to RES-E
projects as applied in UK can add a ‘positive’ incentive for RES-E projects to
the ‘negative’ incentive for obliged parties. However, in an oligopolistic market
the penalty can loose its effectiveness if obliged parties manage to negotiate
contracts for certificate purchase that foresee the recycling to be paid to them,
and thus a loop is created where a large share of the penalty paid by the obliged
party is recycled to its own pocket.
Market liquidity In order to have markets functioning well, market design, size and competition
are key parameters. Via the obligation a demand is being created, but with
barriers still existing on the supply side (e.g. grid access, siting problems) no
real supply can be generated. This in turn could result in high prices being paid
for only few realised projects.

39
Minimum tariff Minimum tariffs can be introduced in order to increase investment security in
case of fluctuating prices. For instance in Belgium the obligation to purchase at
a minimum price is on the Transmission and Distribution System Operator.
Peculiar to the Belgian system are the technology-specific minimum tariffs, a
feature which is usually only known from feed-in tariffs.
Technology-specific support There are several options to support currently less economic technologies while
avoiding windfall profits for cheaper technologies: Separate quotas (bands) per
technology, technology-specific certification periods (duration), or
differentiated values (more or less than one certificate per MWh). But also a
combination with a feed-in premium can be envisaged.
Long-term contracts Long-term contracts (e.g. 10 years) for both the physical electricity and the
green certificates can reduce price risks for both RES-E producers and obliged
parties. Obliged parties might not always be interested in signing long-term
contracts, especially if certificate prices are expected to decrease.5 Therefore
the government can oblige obligated parties to offer long-term contracts as it is
done for example in the Californian system.
3.4 Tender ing schemes
A call for tender for renewable energy projects can be issued by a national
government or other institutions, asking project developers to submit bids to
develop renewable energy projects. Tenders usually specify the capacity and/or
production to be achieved and can be technology- or even project/site-specific.
Winning parties are usually offered standard long-term purchase contracts while the
price is determined competitively within the tender procedure. Purchase can also be
limited to green certificates in case of RES-E. Thus the support itself can be
compared to feed-in tariffs/premium tariffs, while the support level is determined
by the market. Quota systems with mandatory long-term contracts also have
comparable features, despite for the counterparty risk in case of quota systems.
Tendering allows for incorporation of additional conditions, e.g. regarding local
manufacturing of technology.6
A disadvantage of the system however is the risk that the actual cost of realisation
of the project turns out to be higher than that predicted when drafting the bid, or
that the project will not be bankable after all. This might lead to the granted project
5 Agnolucci (in press) 6 Lewis and Wiser (2006)

40
not being realised. In several countries that had a tender scheme in place, such as
Ireland and the UK, the overall number of projects actually implemented has been
very low, resulting in a much lower penetration of renewable energy projects from
tender schemes than originally anticipated. These countries abolished their tender
schemes. In California, the tendering scheme that is used under the renewable
portfolio standard (RPS) scheme encounters similar difficulties, either related to
projects not being bankable or to grid issues. In France and Canada (Ontario and
Québec, see section 4.4.6) tendering schemes are in place for large-scale RES-E
projects, whereas Denmark has had tenders for offshore wind energy only.
Another disadvantage is that a successful tender procedure might result in many
project initiatives being prepared in vain. The second call for tender in Québec for
2000 MW onshore wind energy was overbooked by almost a factor of 4.
Penalties A penalty for non-compliance can be implemented in order to avoid
unreasonably low bids. Penalties can also be applied to projects exceeding
deadlines.
Share part of the price risk By incorporating corrections for inflation, currency exchange rates and market
prices of key commodities (e.g. steel, biomass) between tender closure and
realisation of the project, a significant part of the financial risk can be
transferred from the project developer to the tendering body (see the example
of Québec, section 4.4.6).
Continuity of calls Long-term continuity and predictability of calls should be ensured in order to
avoid stop-and-go development of the renewable industry.
Streamlining of interacting policies Other policies affecting the realisation of winning projects, like for example
spatial planning, should be streamlined in order to ensure the tendered
capacities can actually be realised.
3.5 Fi sca l and other support incent ives
Fiscal and other support incentives aim to promote renewable energy by investment
subsidies, low-interest loans, and different tax measures like for instance tax
deductions or flexible depreciation schemes. Fiscal incentives play an important
role in the promotion of RES, although unlike for biofuels - where tax exemptions
have recently stimulated substantial development in some countries - fiscal

41
incentives are secondary instruments to support other RES-E instruments rather
than being the main support instrument in the majority of countries. An exemption
is Finland, where tax measures combined with investment subsidies are the main
support instrument for the development of RES-E.
The largest shortcoming of fiscal incentives is their instability: They usually rely on
government budgets and are thus subject to frequent political negotiations and
annual budget constraints. Frequent policy changes increase risk in the project
development phase and hinder the development of the renewable energy industry.
Alternatively, fiscal incentives could be announced and guaranteed for a couple of
years in advance. They could theoretically be financed through a surcharge on
energy consumption, which adapts automatically to the amount of support paid,
like it is done in some feed-in schemes. These measures are likely to increase
stability and reduce regulatory risk.
Direct production incentives In certain schemes a certain production incentive is given for each unit of
renewable electricity produced over a given period of time (e.g. 10 CAN$/MWh
over 10 year, in the EcoENERGY for Renewable Power in Canada). This
production incentive is not intended to fully bridge the gap between electricity
market prices and the price of renewable electricity, but it contributes to removing
part of the market risks of a project. The direct production incentive is considered
as gross revenue and hence taxable. This incentive typically requires other
complementary measures to make the project viable and bankable. In Canada, these
additional measures are designed at the provincial level (tendering schemes,
renewable portfolio standard (RPS).
Investment subsidies Investment subsidies - also called capital grants - are paid up-front on the basis of
installed capacity and thus help to reduce risk and capital cost. They have
successfully been applied for instance in developing the Japanese PV sector.
Support levels can be determined like in the case of feed-in and premium tariffs,
depending on technology and/or site and the economics of an average project. The
support level can also be determined based on cash flow analysis for individual
projects like in the Norwegian system. The latter implicitly considers technology-
and site-specific conditions which helps to give sufficient support while avoiding
windfall profits but it limits the economic incentive for increasing efficiency.
Low interest loans and loan guarantees Interest rates and repayment periods of loans have a major impact on the overall
cost of RES projects. Especially new technologies, smaller projects or project
developers without a proven track record often experience difficulties in obtaining
42
commercial loans at reasonable conditions. Governments can increase commercial
viability of projects significantly by offering low interest loans or loan guarantees.
Governments can offer low interest loans for specific technologies directly through
state-owned banks or through subsidies to commercial banks. These loans can be
characterised by lower interest rates and/or longer repayment periods. Low interest
loans have been applied successfully in for example Spain and Germany.
Governments can also offer just loan guarantees for certain projects. In that case the
government guarantees debt repayment to the lending bank, thus reducing risk and
hence interest rate (e.g. 1 to 2%), debt term and debt service conditions of the loan7.
Flexible/accelerated depreciation schemes Flexible/accelerated depreciation schemes allow writing off a project faster (or
differently) than usually would be allowed. Doing so, the tax benefit of
depreciation can be maximised by the equity provider, provided that this equity
provider has a net income that is large enough to absorb this tax deduction. In
general, an accelerated depreciation scheme will result in a higher overall net
present value of the project. The 5 year MACRS depreciation for RES in the US is
an example of an accelerated depreciation with significant cost reductions as a
consequence (see Figure 2-9 and Figure 2-10).
Investment or production tax exemptions
Investment or production tax exemptions (also called tax relief or tax credits)
reduce the tax burden of a project. The former support is linked to installed
production capacity while the latter is in relation to the amount of energy
production. The effect of the former is similar to that of an investment subsidy
(which benefits the project), whereas the latter only increases the profit for the
equity provider. In project finance, the former has a favourable impact on the
debt/equity structure under the same debt service requirements, the latter not.
The Production Tax Credit in the US for example has stimulated considerable
deployment of especially wind energy. However, success has been impaired by the
stop-and-go nature of the policy.
Consistency with minimum tax requirements Minimum tax requirements, like the Alternative Minimum Tax in the US,
can set minimum tax rates for individuals or companies, and thus limit the
extent to which tax exemptions, accelerated depreciation schemes and the
like can be applied (cumulated) by taxpayers. This also limits the
potential incentive from these kinds of policies under a minimum tax
regime.
7 Harris and Navarro (1999)

43
Consistency with preferred debt-equity ratio Some tax measures only concern the equity (provider) within a project. At
the same time the majority of project developers strives to minimise the
equity within a project (while maximizing the debt) in order to maximise
return on equity. Thus, projects with a very low equity share might not be
able to take advantage of all tax measures to the full extent. The US
Production Tax Credit for example can only be fully utilised with an
unusually high equity share, which on the other hand would negatively
influence the return on equity.8 Only entities with other higher income can
benefit from this scheme.
Support of capacity versus production If the amount of investment subsidies, investment tax exemptions or
accelerated depreciation a project can receive is linked to installed
capacity, project developers can be stimulated to focus on capacity rather
than production. For example, as part of industry support for the Dutch
wind industry in the 1980s, the Dutch investment subsidy scheme for
wind energy lead in the past to wind turbines which were optimised with
regard to capacity, not to energy production. On other markets with
production support these turbine-designs were not competitive9. This
example shows that support should not exclusively be linked to installed
capacity. However, combining a capacity-based support with any form of
production incentive can overcome this problem. Capacity-based support
might be especially helpful in case of prototype/demonstration projects,
where the risk of lower than envisaged production would be prohibitive
for the project in case of production-based support.
Non-taxpaying companies benefiting from tax measures A possibility to allow also not (yet) taxpaying companies to profit from
tax measures is applied in the Canadian Renewable and Conservation
Expenses scheme (CRCE). “A flow-through share is available to certain
types of renewable energy companies to facilitate financing their
exploration and project development activities. Eligible companies issue
these equity shares to new investors. Investors receive an equity interest
in the company and income tax deductions associated with new
expenditures incurred by the company on exploration and
development.”10
8 Wiser and Kahn (1996) 9 Kamp (2002) 10 www.cra-erc.gc.ca

44
3.6 Pol ic ies to reduce admin istrat i ve and gr id
barr iers
Apart from the economic barriers related to the design of the support schemes,
further deployment of renewable energy sources also faces a number of non-
economic barriers. Administrative barriers are most severe in the authorisation
procedures for new renewable energy projects. Grid barriers can be an important
obstacle especially in the case of large-scale RES projects and variable sources like
wind. These non-economic barriers need to be addressed in order to enable support
schemes to be effective. Potential policies for reducing barriers are explained
below.
One-stop authorisation Often numerous authorities (national, regional and municipal) are
involved in the permitting process. Lack of coordination between
authorities often leads to delays, investment uncertainty and a
multiplication of necessary efforts. One reponsible authorisation agency
appointed by the government, such as for example the Bundesamt für
Seeschifffahrt und Hydrographie for offshore wind in Germany, can
drastically reduce the administrative burden for the developer related to
authorisation of new projects.
Response periods & approval rates Currently, time needed to obtain all necessary permits for the construction
of a RES plant can take many years. For onshore wind projects
authorisation procedures may take several years, which negatively affects
the development of the market. sometimes it can also be unclear to the
developer what the exact length of a procedure will be. This increases risk
and cost of a RES project. To overcome these obstacles, clear guidelines
for authorisation procedures can be implemented: Obligatory response
periods for the authorities involved can be incorporated in such
procedures. Setting approval rates can be a tool for checking the
streamlining of authorisation procedures.
Pre-planning Obtaining a permit related to spatial planning is often the step which takes
most time in the authorisation procedure, especially for biomass and wind
energy projects. This is due to the fact that future developments of RES
projects are usually not taken into account when national and regional
authorities draw up their spatial plans. As adjustment of existing spatial
plans to new RES initiatives can take a very long time, and can heavily
frustrate the realisation of the initiative, authorities could be stimulated to
anticipate the development of future RES projects in their region by

45
allocating suitable areas. Pre-planned areas currently exist in Denmark
and Germany, where municipalities are required to assign locations
available to project developers for a targeted level of RES capacity. In
these areas, permit requirements are reduced and authorisation procedures
are shorter. Also in Sweden areas of national interest for wind exist, while
in France the assignment of areas for wind energy is currently under
preparation.
Increase grid capacity Many parts of the existing electricity grid have little capacity available for
the connection of large-scale RES power plants. In addition, the existing
grid was designed focusing on the transmission of electricity generated by
large conventional power plants. The profile of electricity generation
from intermittent sources like wind sometimes poses challenges to the
current design of the grid. The geographical spread between availability
of RES-E sources on the one hand and electricity demand on the other
hand can result in grid barriers. For example in the UK there is limited
grid capacity between wind abundant Scotland and electricity consuming
Southern England, which calls for important enforcement of the north-
south grid connection. In some areas in for example Italy and Portugal,
grid expansion and reinforcement is urgently needed in order to prevent
frustration of future RES developments. For the future development of
grid-connected RES-E, it is of utmost importance that when grid
expansion and reinforcement plans are being developed, future
realisations of renewable energy projects are taken into account, like it
was done in the German multi-stakeholder grid studies.11
Transparent grid connection procedures Procedures related to grid connection and accounting rules for the grid
costs are not always transparent to the developer. This is often caused by
the fact that countries have not yet formulated transparent and non-
discriminatory rules for bearing and sharing of necessary grid investment
costs. In many cases in the past, including for example wind park
developments in France and Spain, the attribution of costs for grid
connection has been controversial. The European Commission
recommended obliging grid operators to cover costs associated with grid
infrastructure development necessary for new RES projects.12
11 DENA (2005) 12 European Commission COM (2005) 627
46
3.7 Cl imate change mi t igat ion pol i c ies
RES support policies as mentioned above are currently necessary for most RES in
order to be competitive with conventional production technologies based on fossil
fuels, nuclear energy or large hydro. Thus the level of support needed does not only
depend on the RES technology, but also on the reference cost for conventional
production. These reference cost depend on the one hand on the existing subsidy
and tax regime which applies for conventional production and on the other hand
increasingly on the climate change mitigation policies in place in a country.
Climate change mitigation policies include:
• Emission reduction targets (both domestic and internationally binding)
• Emission taxes and emission trading, both leading to a price for greenhouse gas
emissions
• Energy taxes
Increasing reference cost due to higher prices for fuel or technologies, reduction of
subsidies or increasing impact of climate change mitigation policies, reduces the
level of support needed for RES. Ambitious and stable climate change mitigation
policies improve long-term prospects for RES and will thus help increasing
investor confidence.

47
4 Analysis of selected pol icies and measures with respect to cost of finance
This chapter presents a more detailed analysis of the impact of selected policies
and measures on the financing risks and costs for different large-scale RES
projects.
4.1 Introduct ion
In this chapter a more detailed analysis of selected policies and measures will be
made, for a selection of reference technologies. This exercise could be seen as a
pre-feasibility assessment for a fictitious corporation that wants to invest in large-
scale renewable energy projects in several countries and under different policy
support schemes (assuming that the technologies have the same technological
performance in each country). What would be the required revenues to make the
project viable from both the investor’s and lender’s perspective?
For each of these combinations of reference technologies and policy frameworks
the impact of policies and policy instruments will be assessed:
• quantitatively: what impact have policy instruments on the costs of RES (based
on a simple cash flow model1)?
• semi-quantitatively: how are perceived risks translated in financial parameters
(e.g. interest rate, internal rate of return (IRR), weighted average cost of capital
(WACC)), how do they differ from conventional energy technologies and how
do they affect financing costs)?
• qualitatively: what is the level of complexity of the support measure? is the
support measure (seen as) reliable and stable? what are other effects of the
measure (e.g. development of national industry)?
Comparison of results for the reference projects across the selected national policy
frameworks will provide key lessons on the impact of policy design on RES
financing. What barriers are encountered by this corporation that result in higher
financial costs? What best practice examples illustrate the successful
1 The cash flow model determines the levelised cost of electricity or heat from the RES. Key inputs are project investments, revenues, capital structure (debt/equity ratio), debt interest rates, debt term and taxes, all depreciated over the technical lifetime of the RES. The model results show the sensitivity of RES costs to changes in financial parameters (see Annex 2).

48
implementation of policy designs on either international, national and regional
level, that reduce perceived risks of RES? Existing policy measures aimed at
reducing costs of capital will be addressed.
The semi-quantitative analysis is partially based on interviews with key stakeholder
representatives, as information is often not published or confidential. Based on this
analysis, alternative policy designs will be discussed as well as other measures that
reduce the risk to investors.
Table 4-1 Select ion of technologies
Technology Typical size Remarks
Wind onshore > 20 MWe
Wind offshore > 100 MWe
Biomass – CHP > 10 MWe Forestry residues co-generation (combustion)
(efficiencies: 25% electrical and 65% heat)
Solar photovoltaic > 0.5 MWe
Table 4-2 Select ion of combinat ions o f countr ies/regions and
technologies
Renewable energy technology Country Main type of support Wind
onshore Wind
offshore Solar PV Biomass
CHP
Germany Feed-in tariff X X X X
France Feed-in tariff + Tax measures X X X X
Netherlands Feed-in premium + Tax measures X X X
United Kingdom Quota obligation X X X
USA/California Production Tax Credit (federal) +
Quota obligation (RPS) (+ Feed-in
premium)
X X X
Canada/Québec Direct production incentive
(federal) / Contract price based on
tendering scheme for wind energy
X
49
4.2 Renewable energy technologies and po l i cy
support schemes for detai led analys is
To better understand the way support schemes affect the costs of financing, six
countries/regions will be assessed in more detail, for four large-scale RES projects.
In consultation with the steering committee for this study the technologies
presented in Table 4-1 will be assessed in more detail for the countries/regions that
are presented in Table 4-2. The assessment will concern the situation in 2006.
With this selection it is believed that the different types of policy schemes are well
represented for a group of technologies with different specific investment
characteristics. In other words, it is believed that a more detailed financial
assessment will provide us with new insight in the effects of different policy
schemes on the costs of capital for different technologies.
Technologies Wind onshore (> 20 MWe) Onshore wind energy conversion is a well demonstrated and commercially
available technology. For most locations, the project risks are well understood or
known. An onshore wind project of 20 MWe equals 5 to 20 windturbines and total
investments in the range of 22 to 36 M€.
Wind offshore (> 100 MWe) Offshore wind energy conversion has considerable more risks as compared to
onshore wind energy: the specific conditions at sea ask either for considerable
modifications to windturbine concepts that are normally used in onshore situations,
or for development of dedicated offshore windturbines. Furthermore, production
yields have often more uncertainties, both under normal operating conditions and in
case of failures (immediate repair will generally not be an option at sea). Due to the
significant costs of grid connection, wind projects will be typically larger than 100
MW. This equals 20 to 50 windturbines and total investments in the range of 200 to
240 M€ (depending on water depth and distance to shore).
Solar photovoltaic (> 0.5 MWe) Solar photovoltaic energy is a commercial technology with well known risks. A
500 kWe project would have investment costs in the range of 2 to about 4 M€. In
this study we consider open space installations only.
Solid biomass combustion – CHP (> 10 MWe) Electricity production and - even more - co-generation of heat and power (CHP) by
combustion of biomass is not a standardised renewable energy technology. System
50
parameters are highly influenced by availability and type of biomass (which
determines fuel costs or even fuel savings), and in case of CHP also heat demand,
heat prices, and heat demand patterns, et cetera. Biomass to energy conversion has
higher operational expenses (OPEX) as compared to RES without fuel
consumption. In the detailed assessment a default biomass-CHP will be defined
(with electrical and heat efficiencies of 25% and 65% respectively), fired with
forestry residues and with default assumptions on the project context, fuel costs, the
value and pattern of the delivered heat, et cetera, for all countries. The combustion
technology is commercially available and project risks are often well understood or
known. Investment costs for a 10 MWe plant are typically in the range of 30 to 50
M€.
Note that for this reference case we will have to make (over)simplifications on
several design parameters that most likely will not do justice to the real investment
climate in individual countries. The specific implications of CHP (as compared to
the electricity-only case) on the costs of capital will be addressed in the overview
section.
Policy schemes In Annex 1 an overview table is presented of the main support schemes for large-
scale applications of renewable electricity and heat in selected countries. These
countries cover the main support schemes for renewable energy technologies. In
several support schemes combinations of support mechanisms can be found.
With the selected countries (see Table 4-2) a good representation of these schemes
is achieved. The selection covers both feed-in tariff, feed-in premium and quota
obligation support schemes, as well as additional tax support instruments and a
tendering scheme. Only those policy schemes are incorporated that were in place
during 2006 (either at country or regional level) and that result in a significant
reduction in the gap between the costs of (new) renewable energy technologies
(‘green’) and market prices (‘grey’). As an indicative benchmark, production costs
for onshore and offshore wind energy and combustion of forestry residues in a co-
generation plant are usually within the range of 60 to 140 €/MWhe. For large-scale
projects of solar photovoltaic energy this range is typically above 200 €/MWhe in
the countries with significant resource potentials. The support schemes for the
selected combinations result in a significant reduction of he levelised cost of
electricity.
The selection also covers relative emerging markets and (more) established
markets, both in terms of countries and technologies (e.g. offshore versus onshore
wind energy).
51
For onshore wind energy a comparison of all countries is possible. Biomass co-
generation will be assessed for all countries except Canada/Québec. Due to lack of
resources and/or specific (significant) policy support for offshore wind energy and
solar photovoltaic energy, these options will only be assessed for three or four
countries/regions.
4.3 Technology character isat ions
In Table 4-3 the technology characterisations that will be used in this analysis are
presented. In order to account for the different resource characteristics of different
regions, both a default (D) and variant (V) value for the full load hours (or capacity
factor) are presented.
The data in this table are based on several studies2. The reported range in costs is
significant (after correction for exchange and inflation rates), even for technologies
that can be regarded to compete on a global market such as solar photovoltaic
modules and wind turbines. Local market conditions can largely affect balance of
system costs such as system integration and grid connection. For the purpose of this
study, we consider the default and variant data in the table to be fairly
representative for the countries assessed.
2 Van Sambeek, et al. (2004), Van Tilburg et al. (2006), Eurelectric (2007), UK-DTI (2007), Ernst & Young (2007), IEA Wind Energy (2006), IEA PVPS (2007), IEA Bioenergy (2007), NREL (2006a,b), Ragwitz et al. (2003)
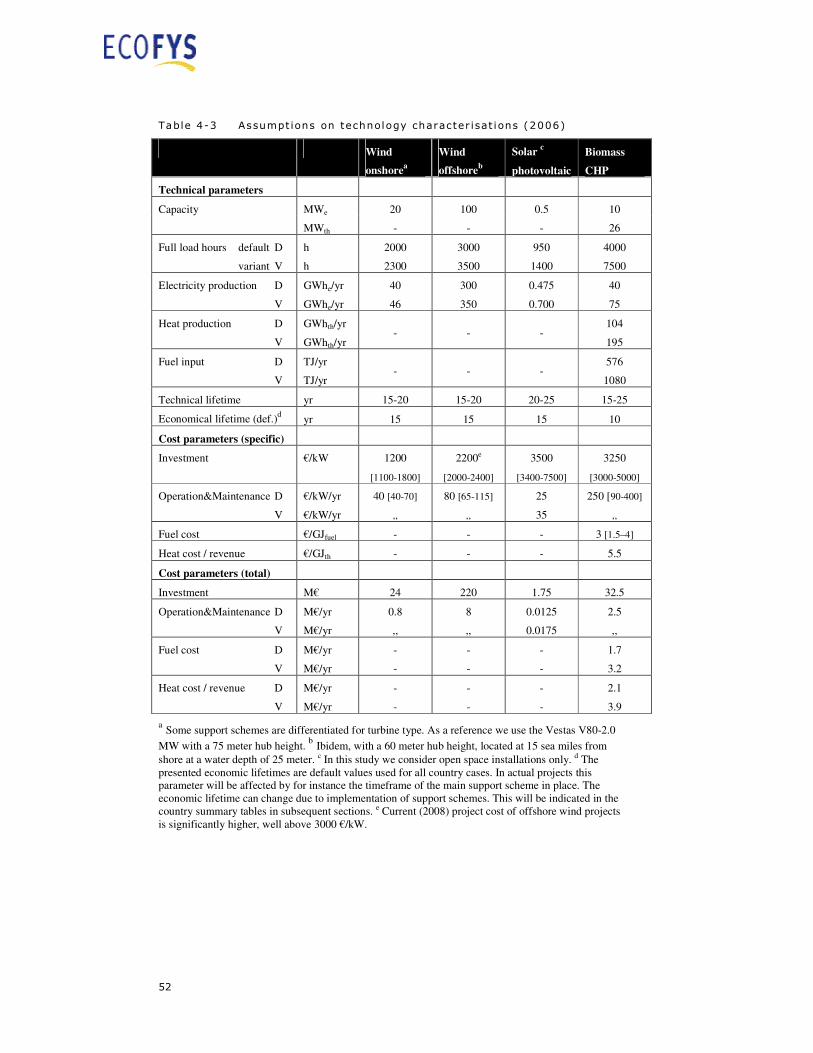
52
Table 4-3 Assumpt ions on technology character isat ions (2006)
Wind
onshorea
Wind
offshoreb
Solar c
photovoltaic
Biomass
CHP
Technical parameters
Capacity MWe 20 100 0.5 10
MWth - - - 26
Full load hours default D
variant V
h
h
2000
2300
3000
3500
950
1400
4000
7500
Electricity production D
V
GWhe/yr
GWhe/yr
40
46
300
350
0.475
0.700
40
75
Heat production D
V
GWhth/yr
GWhth/yr - - -
104
195
Fuel input D
V
TJ/yr
TJ/yr - - -
576
1080
Technical lifetime yr 15-20 15-20 20-25 15-25
Economical lifetime (def.)d
yr 15 15 15 10
Cost parameters (specific)
Investment €/kW 1200
[1100-1800]
2200e
[2000-2400]
3500
[3400-7500]
3250
[3000-5000]
Operation&Maintenance D
V
€/kW/yr
€/kW/yr
40 [40-70]
,,
80 [65-115]
,,
25
35
250 [90-400]
,,
Fuel cost €/GJfuel - - - 3 [1.5–4]
Heat cost / revenue €/GJth - - - 5.5
Cost parameters (total)
Investment M€ 24 220 1.75 32.5
Operation&Maintenance D
V
M€/yr
M€/yr
0.8
,,
8
,,
0.0125
0.0175
2.5
,,
Fuel cost D
V
M€/yr
M€/yr
-
-
-
-
-
-
1.7
3.2
Heat cost / revenue D
V
M€/yr
M€/yr
-
-
-
-
-
-
2.1
3.9
a Some support schemes are differentiated for turbine type. As a reference we use the Vestas V80-2.0
MW with a 75 meter hub height. b Ibidem, with a 60 meter hub height, located at 15 sea miles from
shore at a water depth of 25 meter. c In this study we consider open space installations only. d The presented economic lifetimes are default values used for all country cases. In actual projects this parameter will be affected by for instance the timeframe of the main support scheme in place. The economic lifetime can change due to implementation of support schemes. This will be indicated in the country summary tables in subsequent sections. e Current (2008) project cost of offshore wind projects is significantly higher, well above 3000 €/kW.
53
4.4 Country character i sat ions
In the next sub-sections the key characteristics of the support schemes for the
selected country/technology combinations will be presented. This will form the
input for the cost assessment in the next section.
4.4.1 Germany
The most important mechanism for financing renewable electricity projects in
Germany is the feed-in tariff scheme. It is complemented by low-interest loans
from the state-owned KfW bank. Based upon the investment certainty of the feed-in
tariff scheme, investment brokers have created a wide portfolio of renewable
energy investment funds that attract private equity for RE investments. After tax
incentives for renewable energy investment funds were abandoned in 2005 (see
below), general tax law applies.
In the following paragraphs, the different financing schemes will be presented in
more detail.
Th e f e e d - i n t a r i f f s c h eme
Germany has continuously utilized a feed-in tariff scheme for more than 15 years.
From 1991-2000, a first feed-in law (Stromeinspeisegesetz) provided one single
fixed feed-in tariff for all RES-E technologies. It mainly supported the development
of wind energy. Further fast market growth for all RES-E technologies was
stimulated by the Renewable Energy Sources Act (Erneuerbare-Energien-Gesetz,
EEG) that was enacted in 2000 and amended in 2004. It grants privileged grid
access, priority feed-in and technology specific payment rates for a predefined set
of renewable energy technologies.
Tariff structure
The feed-in tariffs are technology specific and usually apply for a period of 20
years (except for hydropower with a term of 30 years for small and 15 years for
medium plants). This way a high level of investment certainty is provided that
lowers the cost of investment capital for project developers. The philosophy behind
the technology differentiation is to support each renewable technology on its own
cost level instead of privileging least-cost technologies only.
The year a plant is put into operation is relevant for the level of the tariffs, a the
tariffs for newly installed plants are decreased each year with a technology specific
degression rate, assuming technological learning curves that will lead to cost
reductions. At the same time, an incentive is given to build plants as soon as
possible. Degression rates are higher for less mature technologies like PV and not
applied for mature technologies like hydropower. The tariff reductions do not
always reflect real market developments, however. For example, prices for wind
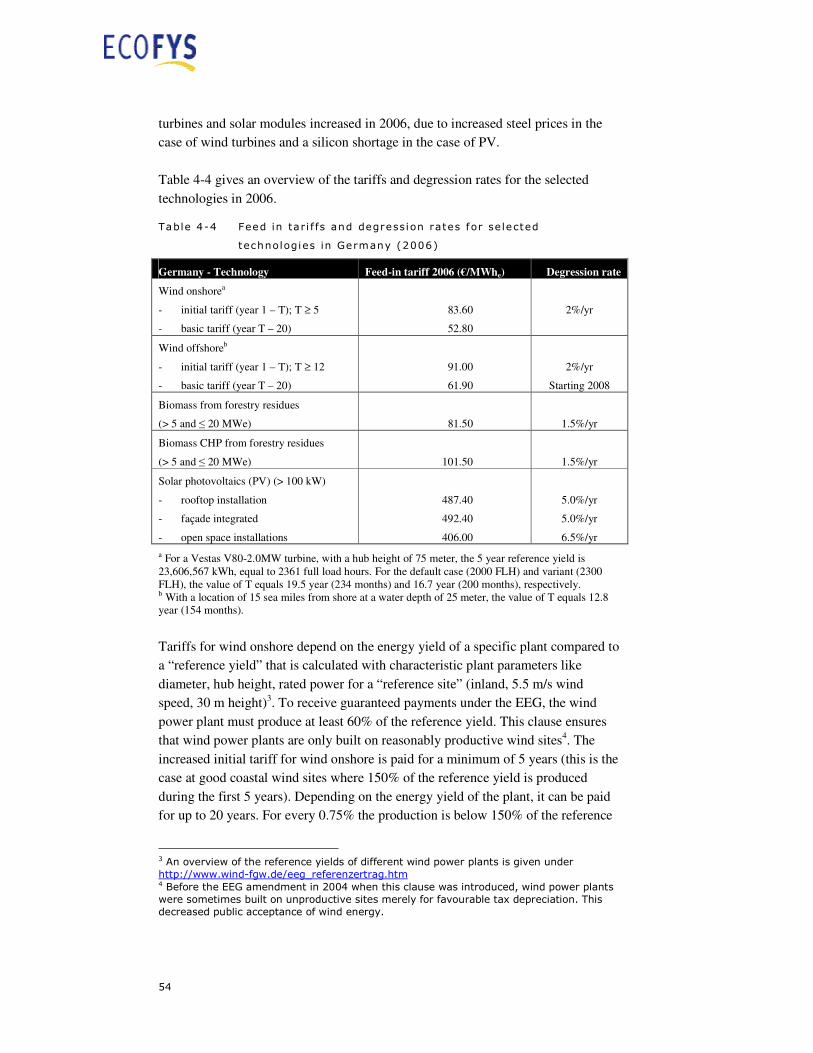
54
turbines and solar modules increased in 2006, due to increased steel prices in the
case of wind turbines and a silicon shortage in the case of PV.
Table 4-4 gives an overview of the tariffs and degression rates for the selected
technologies in 2006.
Table 4-4 Feed in tar i f fs and degression rates for selected
technologies in Germany (2006)
Germany - Technology Feed-in tariff 2006 (€/MWhe) Degression rate
Wind onshorea
- initial tariff (year 1 – T); T ≥ 5
- basic tariff (year T – 20)
83.60
52.80
2%/yr
Wind offshoreb
- initial tariff (year 1 – T); T ≥ 12
- basic tariff (year T – 20)
91.00
61.90
2%/yr
Starting 2008
Biomass from forestry residues
(> 5 and ≤ 20 MWe)
81.50
1.5%/yr
Biomass CHP from forestry residues
(> 5 and ≤ 20 MWe)
101.50
1.5%/yr
Solar photovoltaics (PV) (> 100 kW)
- rooftop installation
- façade integrated
- open space installations
487.40
492.40
406.00
5.0%/yr
5.0%/yr
6.5%/yr
a For a Vestas V80-2.0MW turbine, with a hub height of 75 meter, the 5 year reference yield is 23,606,567 kWh, equal to 2361 full load hours. For the default case (2000 FLH) and variant (2300 FLH), the value of T equals 19.5 year (234 months) and 16.7 year (200 months), respectively. b With a location of 15 sea miles from shore at a water depth of 25 meter, the value of T equals 12.8 year (154 months).
Tariffs for wind onshore depend on the energy yield of a specific plant compared to
a “reference yield” that is calculated with characteristic plant parameters like
diameter, hub height, rated power for a “reference site” (inland, 5.5 m/s wind
speed, 30 m height)3. To receive guaranteed payments under the EEG, the wind
power plant must produce at least 60% of the reference yield. This clause ensures
that wind power plants are only built on reasonably productive wind sites4. The
increased initial tariff for wind onshore is paid for a minimum of 5 years (this is the
case at good coastal wind sites where 150% of the reference yield is produced
during the first 5 years). Depending on the energy yield of the plant, it can be paid
for up to 20 years. For every 0.75% the production is below 150% of the reference
3 An overview of the reference yields of different wind power plants is given under http://www.wind-fgw.de/eeg_referenzertrag.htm 4 Before the EEG amendment in 2004 when this clause was introduced, wind power plants were sometimes built on unproductive sites merely for favourable tax depreciation. This decreased public acceptance of wind energy.
55
yield, the period is prolonged by 2 months. By this differentiation wind power
plants at medium wind sites receive a higher average remuneration than plants at
good wind sites.
For wind offshore, the initial tariff is paid for a minimum of 12 years if the plant is
put into operation before 2011. If the plant is built more than 12 sea miles offshore
and/or deeper than 20 meters, the period is prolonged by 0.5 months per extra sea
mile distance and 1.7 months per extra meter sea depth.
For biomass, a wide range of tariffs apply that are differentiated by plant size, type
of biomass (forestry or agricultural residues, general wood or industrial waste
wood), utilization for CHP and application of innovative technologies (e.g.
gasification or fuel cells). For larger plant sizes (> 5 and ≤ 20 MWe), only two
tariffs apply (see Table 4-4). Plants > 20 MWe do not receive support under the
EEG.
For solar PV, tariffs are differentiated by plant size and type of installation (rooftop,
façade integrated or open space).
All feed-in tariffs will be reviewed in 2007 according to the regular schedule. First
announcements of the Ministry of Environment indicate that tariffs for offshore
wind will be increased and the degression rate for wind onshore will be decreased.
Tariffs for PV will be decreased at a higher degression rate.
Priority grid access and feed-in
Network operators are obliged to grant renewable energy project developers access
to the nearest grid connection point. The RES project developer only pays the grid
costs up to this point (“shallow” grid connection charges). If grid reinforcements
become necessary in the distribution or transmission grid, the grid operator is
obliged to carry out these reinforcements. This regulation minimizes the risk of
unforeseen grid costs for the project developer. On the other hand, it increases the
burden on the network operator, and reinforcement costs will increase total costs
for consumers. In practice, necessary reinforcements require long lead times and
administrative procedures, especially in the case of transmission networks;
therefore the reinforcement process does not match the speed of RES development.
The grid connection of offshore wind farms is a special infrastructural challenge,
because it requires long and costly sea cables. Until autumn 2006, it was not clear
who would pay for these costs; this uncertainty constituted a major risk factor to all
project developers. To speed up the stagnating German offshore development, a
law was passed in November 2006 (Gesetz zur Beschleunigung der
Infrastrukturplanung) that assigned the responsibility and costs for the grid

56
connection of offshore wind farms to the network operators until 2011. The new
law greatly reduces the costs and risks of offshore wind development in Germany.
It also reduces the total costs of the infrastructural investment: network operators
will be granted better financing conditions than individual project developers.
Once RES-E plants are connected and operating, the network operator is obliged to
accept and remunerate the renewable electricity with priority. The additional costs
for the feed-in tariffs are passed via the electricity suppliers to all electricity
consumers. The transmission system operator is responsible for forecasting and
balancing the RES feed-in. The RES operator does not pay for imbalance
settlement, and therefore does not carry any balancing risk. If wind energy
operators were to be responsible for balancing, this would increase their costs
significantly.
In principle, the feed-in of renewable electricity is guaranteed by law. However, the
network operator can cut off RES plants if the network is already congested with
electricity from other renewable energy plants. This means that plants that have
been connected last will be cut off the network first. In regions with high RES feed-
in and weak grid infrastructure (especially Northern Germany), such congestion
management by now poses a considerable risk to the RES operator, since the times
of cut-off mean a loss of income to the RES project. For a project developer, it is
very difficult to predict how many hours a year a particular plant will be cut off the
network.
L oa n p r og r amme s f o r e n v i r o nmen t a l i n v e s tmen t s
The State owned KfW Bank offers low interest loan programmes for renewable
energy investments that can help project developers to optimize their cash flow.
KfW Umwelt Programm
The KfW Umwelt (Environment) Programme provides low interest loans to private
companies. It finances max. 75% of investment costs, up to a maximum volume of
€ 10 million. Typically loans are given for a period of 10 years, but 20 years are
also possible. Interest rates depend on the capital market and range at the lower end
of capital market rates. Details are given in Table 4-5. In all cases, 4% of the credit
volume are retained by the bank. For the cost calculations in this study we assume
that the interest rates are 0.5 to 1.5% below average market rates. This is only a
rough estimate, however, since the conditions depend on the financial
circumstances of the individual borrower.

57
Table 4-5 German KfW Umwel t Programm loan condit ions
Germany - Term Effective interest rate
(July 2006)
Usually max. 10 years, with max. 2 years free of redemption 4.21 – 7.26%
(depending on credit worthiness)
May be changed to 12 years, 12 year free of redemption 4.51 – 7.56%
Rate fixed for
10 yrs
4.38 – 7.43%
On request max. 20 years and 3 years free of
redemption, if the technical and economic
life-cycle of the investment is more than 10
years
Rate fixed for
20 yrs
4.53 – 7.60%
May be changed to 20 years, 20 years free of redemption 4.79 – 7.86%
The programme may be combined with the KfW ERP Programme up to 100%
financing.
KfW ERP Programm
The KfW ERP Programme focuses on the support of Small and Medium
Enterprises (SMEs) and favours investment in East Germany. The programme has a
lower ceiling than the KfW Umwelt: € 500,000 in West Germany (Alte
Bundesländer) and € 1 million in East Germany (Neue Bundesländer). SMEs can
receive up to 75% financing, while other companies only receive max. 50%. Loans
are given for 10 (West) or 15 years (East). The interest rates range at the lower end
of the interest rates on the capital markets. For investments in East Germany, they
are approx. 0.25% lower than in West Germany. Details are provided in Table 4-6.
In contrast to the ERP Umwelt Programme, no agio is retained by the bank.
Table 4-6 German KfW ERP loan condit ions
Germany - Term Effective debt rate
(July 2006)
West Germany (Alte Bundesländer):
10 yr, max. 2 yr free of redemption
4.22 – 7.19%
(depending on solvency)
East Germany (Neue Bundesländer):
15 yr, max. 5 yr free of redemption, interest rate fixed for 10 yr
3.96 – 6.92%
(depending on solvency)
For the cost calculations in this study, we assume that the projects can maximally
benefit from both KfW Umwelt Programm (restricted to either € 10 million or 75%
of investment, 4% agio) and ERP Programm (restricted to either € 0.5 million, or
50% of investment). In case additional debt is required, this is acquired under
conventional market conditions. For both KfW schemes a 1.5% lower debt rate
than for default market conditions is assumed. For the KfW Umwelt we use the 20
year fixed rate option, with 3 years free of redemption. Other financial parameters
are kept the unchanged.

58
O th e r s u pp o r t p r o g r amme s
There are a number of other support programmes that a relevant for RES
investments in principle, but not applicable for the selected technology case studies:
• The KfW low interest loan programme “Solarstrom Erzeugen” finances
investments in smaller PV plants up to € 50,000.
• The low interest loan programme “Sonderkreditprogramm Umweltschutz und
Nachhaltigkeit” finances investments in agricultural biogas plants.
• The KfW low interest loan porgramme “Erneuerbare Energien” finances
investments in renewable heat technologies.
• The Market Incentive Programme (Marktanreizprogramm) provides subsidies
for investments in renewable heat technologies.
The CO2 Building Rehabilitation Programme provides subsidies for energy
efficient building modernisation. It also supports investments in solar thermal, PV
and biomass heating installations.
F i s c a l i s su e s
The net corporate tax to be paid in Germany has both a federal component and a
local component that is determined by the municipality (via the ‘Hebesatz’). This
results in actual corporate taxes ranging from 33% to 41%. Here we take 38% as an
average for Germany5.
Except for biofuels, no specific tax deduction schemes exist for RES. There are also
no RES specific tax depreciation schemes, but specific depreciation terms (see
BMF Afa tables6):
• Wind power plants: 16 years
• PV plants: 20 years
• CHP plants: 10 years
Tax payers can choose between two depreciation methods: the straight-line method
(linear) and declining balance method (degressive); a change from the declining-
balance method to the straight-line method is permitted, but not vice versa. The
declining balance method is normally limited to two times the allowable straight-
line rate (double declining balance, with an overall maximum of 20%), but for the
period 1/1/2006 to 31/12/2007 a three times higher rate is allowed (with a
maximum of 30%).
Until 2005, a generic tax saving scheme existed that was not designed for
renewable energies but made RES investment funds attractive to private investors.
Initial losses from RES and other investment funds could be balanced against
taxable income, thus reducing income taxes significantly. The scheme triggered a
5 Based on a 25% federal corporate tax, a 5.5% solidarity tax, and an average ‘Hebesatz’ of 388% for germany. Source: KPMG International (2006) 6http://www.bundesfinanzministerium.de/cln_03/nn_3792/DE/Steuern/Veroeffentlichungen__zu__Steuerarten/Betriebspruefung/005.html

59
lot of private RES investments, but also led to the creation of funds that would
never be profitable. The generic scheme was abandoned in October 2005.
Summa r y o f f i n a n c i a l a s s ump t i o n s f o r G e rman y ( A l t e
B und e s l ä nd e r )
Table 4-7 Summary of f inancial assumpt ions for Germany (Al te
Bundesländer) (2006)
Germany
Alte Bundesländer
Wind
onshore
Wind
offshore
Solar
photovoltaic
Biomass
CHP
Corporate tax % 38% (German average)
Fiscal
depreciation
Type Straight-linea
Declining balance (single, double (max. 20%), triple
(max. 30%) with or without a shift to straight-line
Period yr 16 16 20 10
Debt measures Type a) KfW Umwelt Program (linear, 4% agio)
b) KfW ERP Program (linear)
Period yr a) 20 (3 yr redemption free)
b) 10 (2 yr redemption free)
Rate %/yr a) Default – 1.5%
b) Default – 1.5%
Tax measures Declining balance (triple (max. 30%)) with shift to
straight-linea
Investment subsidiy €/kW - - - -
Feed-in tariff Initial €/MWh 83.60 91.00
Basic €/MWh 52.80 61.90 406 101.50
Period of initial tariff
D (default):
V (variant):
yr
yr
19.5
16.7
12.8
12.8
Total duration of scheme yr 20 20 20 20
Economic lifetime yr 20 20 20 20
a The straight-line depreciation is assumed for the default case; the triple declining balance is assumed
in the policy-support case. The triple declining balance is only applicable for projects started in 2006
and 2007.
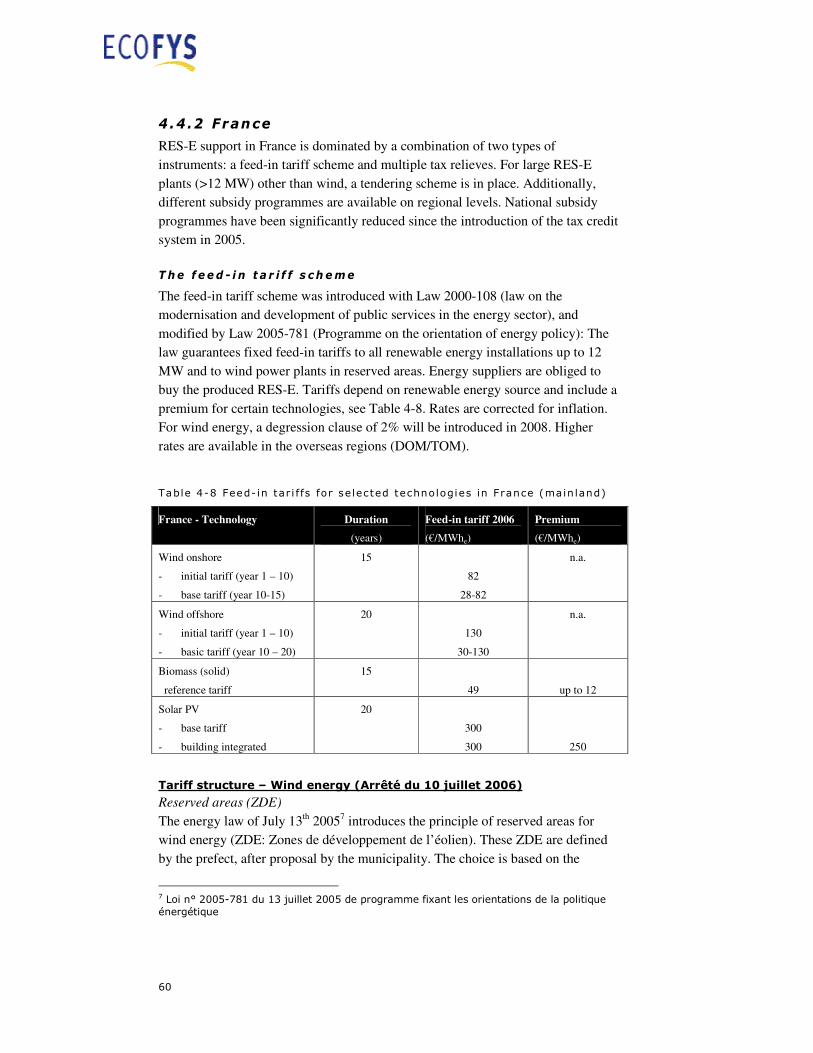
60
4.4 .2 France
RES-E support in France is dominated by a combination of two types of
instruments: a feed-in tariff scheme and multiple tax relieves. For large RES-E
plants (>12 MW) other than wind, a tendering scheme is in place. Additionally,
different subsidy programmes are available on regional levels. National subsidy
programmes have been significantly reduced since the introduction of the tax credit
system in 2005.
T he f e e d - i n t a r i f f s ch eme
The feed-in tariff scheme was introduced with Law 2000-108 (law on the
modernisation and development of public services in the energy sector), and
modified by Law 2005-781 (Programme on the orientation of energy policy): The
law guarantees fixed feed-in tariffs to all renewable energy installations up to 12
MW and to wind power plants in reserved areas. Energy suppliers are obliged to
buy the produced RES-E. Tariffs depend on renewable energy source and include a
premium for certain technologies, see Table 4-8. Rates are corrected for inflation.
For wind energy, a degression clause of 2% will be introduced in 2008. Higher
rates are available in the overseas regions (DOM/TOM).
Table 4-8 Feed- in tar i f fs for selected technologies in France (main land)
France - Technology Duration
(years)
Feed-in tariff 2006
(€/MWhe)
Premium
(€/MWhe)
Wind onshore
- initial tariff (year 1 – 10)
- base tariff (year 10-15)
15
82
28-82
n.a.
Wind offshore
- initial tariff (year 1 – 10)
- basic tariff (year 10 – 20)
20
130
30-130
n.a.
Biomass (solid)
reference tariff
15
49
up to 12
Solar PV
- base tariff
- building integrated
20
300
300
250
Tariff structure – Wind energy (Arrêté du 10 juillet 2006)
Reserved areas (ZDE)
The energy law of July 13th 20057 introduces the principle of reserved areas for
wind energy (ZDE: Zones de développement de l’éolien). These ZDE are defined
by the prefect, after proposal by the municipality. The choice is based on the
7 Loi n° 2005-781 du 13 juillet 2005 de programme fixant les orientations de la politique énergétique
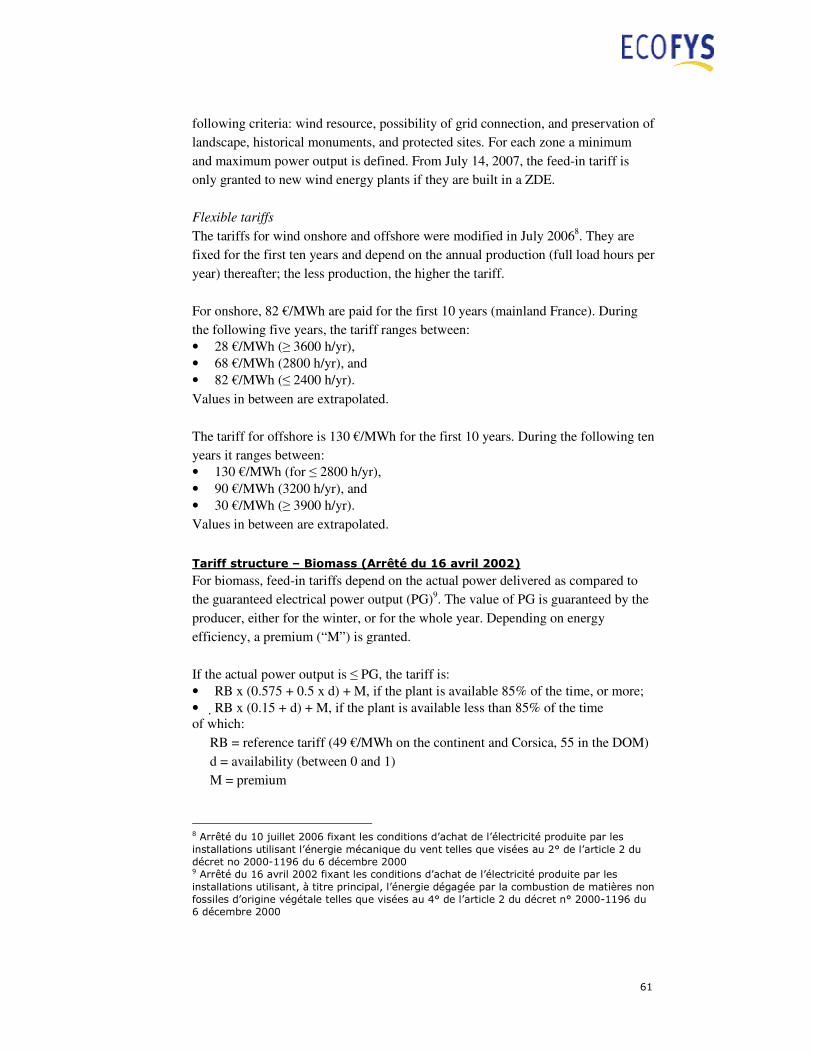
61
following criteria: wind resource, possibility of grid connection, and preservation of
landscape, historical monuments, and protected sites. For each zone a minimum
and maximum power output is defined. From July 14, 2007, the feed-in tariff is
only granted to new wind energy plants if they are built in a ZDE.
Flexible tariffs
The tariffs for wind onshore and offshore were modified in July 20068. They are
fixed for the first ten years and depend on the annual production (full load hours per
year) thereafter; the less production, the higher the tariff.
For onshore, 82 €/MWh are paid for the first 10 years (mainland France). During
the following five years, the tariff ranges between:
• 28 €/MWh (≥ 3600 h/yr),
• 68 €/MWh (2800 h/yr), and
• 82 €/MWh (≤ 2400 h/yr).
Values in between are extrapolated.
The tariff for offshore is 130 €/MWh for the first 10 years. During the following ten
years it ranges between:
• 130 €/MWh (for ≤ 2800 h/yr),
• 90 €/MWh (3200 h/yr), and
• 30 €/MWh (≥ 3900 h/yr).
Values in between are extrapolated.
Tariff structure – Biomass (Arrêté du 16 avril 2002)
For biomass, feed-in tariffs depend on the actual power delivered as compared to
the guaranteed electrical power output (PG)9. The value of PG is guaranteed by the
producer, either for the winter, or for the whole year. Depending on energy
efficiency, a premium (“M”) is granted.
If the actual power output is ≤ PG, the tariff is:
• RB x (0.575 + 0.5 x d) + M, if the plant is available 85% of the time, or more;
• RB x (0.15 + d) + M, if the plant is available less than 85% of the time of which:
RB = reference tariff (49 €/MWh on the continent and Corsica, 55 in the DOM)
d = availability (between 0 and 1)
M = premium
8 Arrêté du 10 juillet 2006 fixant les conditions d’achat de l’électricité produite par les installations utilisant l’énergie mécanique du vent telles que visées au 2° de l’article 2 du décret no 2000-1196 du 6 décembre 2000 9 Arrêté du 16 avril 2002 fixant les conditions d’achat de l’électricité produite par les installations utilisant, à titre principal, l’énergie dégagée par la combustion de matières non fossiles d’origine végétale telles que visées au 4° de l’article 2 du décret n° 2000-1196 du 6 décembre 2000
62
M depends on the value of V = [valorized thermal energy + valorized electric
energy]/energy output of boiler.
• if V ≤ 40 % M = 0 €/MWh
• if V = 50% M = 5 €/MWh
• if V = 60% M = 10 €/MWh
• if V ≥ 70% M = 12 €/MWh
Values in-between are extrapolated.
If the actual power output is > PG the formulae above are used with d = 0.15.
Tariff structure – solar photovoltaics (Arrêté du 10 juillet 2006)
The tariffs for solar photovoltaic installations were modified in July 200610. They
are fixed for twenty years of operation (300 €/MWh). For building integrated PV, a
premium of 250 €/MWh is given.
Gr i d a c c e s s a n d b a l a n c i n g
Regarding grid access, RES-E are treated the same as other energy technologies; if
they comply with the grid code requirements, they are connected. In practice,
connection procedures can be quite lengthy. The RES-E project pays the cost for
the connection to the assigned grid connection point. It also bears the cost for
project related grid reinforcement on the voltage level the plant is connecting to. If
the network needs to be reinforced on higher voltage levels, the TSO pays the cost.
So far, RES-E plants have no balancing responsibility, i.e. they don’t pay balancing
charges.
T end e r i n g s c h eme
Law 2000-10811 gives the government the possibility of setting up tenders if the
RES-E development is not high enough for a specific RES and/or in a specific
region. Several tenders have been published: onshore wind and offshore wind in
2005; biomass and biogas in 2005; biomass in 2006. In on of the last tenders for
biomass and biogas plants >12 MW, 14 biomass projects with a cumulated capacity
of 216 MW and one biogas project of 16 MW were selected. The projects had to be
put into operation until January 1, 2007. The average contract price is 86 €/MWh.
F i s c a l i s su e s
The corporate tax in France is 33.33%.In case of a turnover exceeding € 7,630,000,
an additional social surcharge of 3.3% is levied on that part of the corprate tax,
exceeding € 763,000. In this study we use a fixed rate of 33,33%.
10 Arrêté du 10 juillet 2006 fixant les conditions d’achat de l’électricité produite par les installations utilisant l’énergie radiative du soleil telles que visées au 3o de l’article 2 du décret no 2000-1196 du 6 décembre 2000 11 Loi n° 2000-108 du 10 février 2000, Loi relative à la modernisation et au développement du service public de l'électricité

63
Fiscal depreciation can be calculated according to the straight-line depreciation.The
declining balance can be used as well. For assets with a useful life exceeding 6
years, the declining balance rate is calculated by multiplying the rate of the straight-
line depreciation by a factor of 2.25.
Special depreciation of energy investments for enterprises (L'amortissement exceptionnel pour investissements destinés à économiser
l'énergie)12
Enterprises could write-off renewable energy investments within 12 months. As
these investments had to be made 12 months before January 2007, this (potentially
very effective) tax measure is not included in the analysis of this study. There are
further tax measures that apply to individuals, but not to companies or
municipalities (and hence not to the case studies in this report):
Tax credit (“crédit d’impôt”) for private households Private households installing renewable energy technologies can claim a tax credit
of 50% of the capital costs (increased from 40% to 50% in 2006). The maximum
credit volume is € 8000 per person. The credit has the disadvantage that it requires
100% pre-financing; therefore the financial benefit takes effect only after 1 year.
Reduced sales tax Sales tax for residential renewable energy equipment (e.g. PV and solar thermal
plants) is lowered to 5.5% in mainland France and 2.1% in DOM/TOM (compared
to 19.6% general sales tax). A new tax credit for companies is expected for 2008
Fu r t h e r su ppo r t me a su r e s
Public deficiency guarantee for SMEs (“FOGIME”) The FOGIME fund provides financial guarantees for bank loans to SMEs used
(among others) for renewable energy investments. The maximum guarantee is
€750,000, covering a maximum of 70% of the loan.
Financing via leasing (“Crédit-bail”) Special financing institutions (Sofergies) may provide financing to renewable
energy projects via leasing. There are a number of other support programmes that a
relevant for RES investments in principle, but not applicable for the selected
technology case studies:
Sustainable development savings account (livret de développement durable) Funds collected on these savings accounts will allow banks to finance loans with
12 Arrêté du 27 décembre 2005 relatif aux matériels destinés à économiser l'énergie et aux équipements de production d'énergie renouvelables pouvant bénéficier d'un amortissement exceptionnel et modifiant l'article 2 de l'annexe IV au code général des impôts

64
attractive rates for energetic building renovation. The interest rate is currently
2.75%, and the interest is not subject to tax. The maximum credit volume is €6000.
The eligible equipments are the ones eligible for the tax rebate.
ADEME programmes ADEME gives investment subsidies for certain technologies: biogas, electricity
production (small hydro, PV), geothermal energy, wood boiler, and solar heat (only
under certain conditions). The amount of subsidy is defined by region.
Until 2005, ADEME offered up to 80% co-financing for RES investments to
private households, enterprises and public entities. These subsidies have been
reduced (and for private households abandoned) after the introduction of the tax
credit scheme in 2005.
S umma r y o f f i n a n c i a l a s s ump t i o n s f o r F r a n c e
Table 4-9 Summary of f inanc ial assumpt ions for France (2006)
France Wind
onshore
Wind
offshore
Solar
photovoltaic
Biomass
CHP
Corporate tax % 33.33%
Fiscal
depreciation
Type Straight-linea
Declining balance with 2.25 times the straight-lineb
Period yr 15 20 20 15
Debt measures - - - -
Tax measures -c
Investment subsidiy €/kW - - - -
Feed-in tariff Initial €/MWh 82 130 - -
Basic €/MWh D: 82d
V: 82
D: 110e
V: 64
D: 300
V: 300
D: 61f
V: 61
Period of initial tariff yr 10 10 - -
Total duration of scheme yr 15 20 20 15
Economic lifetime yr 15 20 20 15
a The straight-line depreciation is used for the calculation of the unsopported case. b The declining
balance method is used for the case with policy support. c The accelerated 12 months depreciation for
RES is not included in the analysis, as it is only relevant for investments prior to 1/1/2006. d Both the
default (D, 2000 h/yr) and variant case (V, 2300 h/yr) have full load hours below the 2400 h/yr
threshold. e Default: 3000 h/yr, variant: 3500 h/yr. f The tariff for biomass is based on an assumed
availability of 85% below the guaranteed power production for both default (e.g. production during
winter) and variant case. With an overall conversion efficiency of 90%, the full premium can be
utilised.
65
4.4.3 Nether lands
The most important support instruments in the Netherlands in 2006 were the feed-
in premium MEP and the tax deduction scheme EIA. They are complemented by
low-interest loans available through green funds which are exempt from income
tax. Premium tariffs in the MEP were put to zero in August 2006. A new premium
scheme is introduced in 2008.
Th e f e e d - i n p r em i um MEP
As of 1 July 2003, the policy programme MEP (Environmental Quality of Power
Generation) to support RES-E has been in operation. The MEP includes
technology-specific premium tariffs that are paid for 10 years on top of the market
price for electricity, with a maximum of 20,000 full load hours for wind power.
Premium tariffs are adjusted every year. In May 2005 feed-in premiums for large
scale pure biomass (>50 MWe) and offshore wind were temporarily set at zero. The
reason was an expected lack of budget due to an anticipated strong development of
especially offshore wind farms (available budget is partly financed through a fee
for every electricity consumer, which is always defined one year ahead). The
premium tariffs of the MEP scheme were put to zero in August 2006 by the
Ministry of Economic Affairs for all newly applying projects, as the Ministry
expected that the RES-E target for the Netherlands would be reached if all projects
that already applied for the MEP would be realised. The MEP-scheme is replaced
by a modified preium scheme, called SDE (Support scheme for Renewable
Energy), as of 2008. The description below applies to the situation in the first half
of 2006, and 2005 for wind offshore and large biomass respectively.
Table 4-10 Feed-in premiums as appl icable in 2005/2006 in The
Netherlands
Duration 1 Jan 2005 to 30 June 2006 Netherlands – Technology
(years) Premium (€/MWh)
Mixed biomass and waste 29
Wind on-shore 77a
Wind off-shore 97b
Pure biomass large scale > 50 MWe 70b
Pure biomass small scale 10-50 MWe 97c
PV, tidal and wave, hydro
10
97
a Restricted to max. 20,000 full load hours for onshore wind. Reduced to 65 €/MWh as of
July 1, 2006 b Tariffs for offshore wind and large biomass were put to 0 €/MWh on May 10,
2005. c In 2006 the premium tariff was reduced to 60 €/MWh
There are no special premiums for biomass CHP. The biomass premium applies
only for the electricity part. Alternatively, a biomass CHP could choose to receive
the CHP-MEP, which is not to be confused with the MEP for renewable electricity.
66
The CHP-MEP is a completely independent instrument dedicated for CHP, but has
no special incentive for biomass use. The standard CHP-MEP premium is around
20 €/MWh. Hence, no special incentive is given for combined heat and power
production based on biomass and accordingly this combination is only rarely
realized in the Netherlands. Some biomass power plants use a small part of heat
production for treatment of the biomass feedstock.
Gr i d a c c e s s a n d b a l a n c i n g c o s t
The Energy Research Centre of the Netherlands (ECN) regularly calculates the
level of the feed-in premium MEP on behalf of the government. This calculation is
based on a survey of the actual cost situation. Currently balancing cost of 6 €/MWh
are assumed for wind energy.
Grid connection costs have to be covered by the project developer, while grid
reinforcement has to be paid by the grid operator.
F i s c a l i s su e s
The corporate tax in The Netherlands is 29.6% (with 25.5% for the first € 22,689 of
the earnings before taxation) (2006).
Fiscal depreciation can be calculated according to all approaches used in
accordance with sound business practice (e.g. the straight-line depreciation,
declining balance, et cetera). A change from the declining-balance method to the
straight-line method is permitted, but not vice versa. Usually projects are written
off linear over the period MEP is received, as this is considered the economic
lifetime of the project.
Tax deduction scheme EIA
The EIA (Energy Investment Allowance) allows companies to deduct investments
from their taxable profit. In addition to the usual depreciation rate, 44% of the
eligible investment costs are deductible from the fiscal profit in the investment
year. The net advantage of all projects under EIA is on average about 11 to 13% of
the investment cost. The investment cost for which EIA can be granted was should
be within the range of € 2,100 and € 108 million per company in 2006. Subsidies
from other schemes should be deducted from the purchase or production costs, but
operational subsidies need not be deducted, thus EIA can be combined with the
feed-in premium MEP.
The government budget for the EIA is fixed annually. In 2006 and 2007 it was
€ 139 million. If the available EIA budget threatens to be insufficient, the Minister
of Finance can limit the scheme or stop it temporarily, which has happened in the
past.

67
The EIA applies to most RE technologies and to all technologies selected for our
case studies:
- For wind, the maximum investment amount eligible under the EIA scheme is
1100 €/kW for onshore wind and 2250 €/kW for offshore wind.
- For onshore wind, on average about 85% of the investment is eligible.
- For CHP, an energetic efficiency of at least 65% is required (heat part is
counted for 2/3).
- PV is generally eligible.
Low interest loans from green funds
Interest or dividends derived from funds investing for more than 70% in renewable
energy or other ‘green’ projects are exempt from income tax and are thus attractive
for investors. This results in loans at interest rates which are on average 1% below
usual market interest rates. The funds are established and managed by banks and
various conditions apply.
Projects are only eligible for a green fund if they have received a ‘green statement’
from the responsible authority. The minimum loan sum is € 22.689 and it can be
restricted to a maximum of € 34.033.516. The maximum loan period is 10 years.
Most renewable energy projects are eligible, amongst others those analysed in our
cases, except for wind offshore. Biomass is restricted to clean wood and energy
crops.

68
S umma r y o f f i n a n c i a l a s s ump t i o n s f o r T h e Ne t h e r l a n d s
Table 4-11 Summary of f inanc ial assumpt ions for The Nether lands
(2005/2006)
Netherlands Wind
onshore
Wind
offshore
Solar
photovoltaic
Biomass
CHP
Corporate tax % 29.6%
Fiscal
depreciation
Type Straight-line
Declining balance with or without a shift to straight-line
Period yr 10 10 10 10
Debt measures Type Low interest loans from green funds (typical 1% below
default rates)
Rate %/yr Def. – 1% n/a Def. – 1% Def. – 1%
Tax measures Tax deduction scheme EIA, 44% of eligible investment
between € 2,100 and € 108 million
Typical eligible investment % 85% 100% 100% 100%
Additional restriction on
investment
€/kW 1100 2250 - -
Investment subsidiy €/kW - - - -
Feed-in premium Tariff €/MWh 77a 97b 97 97c
Period yr 10a 10 10 10
Market value electricity €/MWh 45-50 45-50 45-50 50-55
Economic Lifetime yr 15 15 15 10
a Restricted to 20,000 full load hours. Premium reduced to 65 €/MWh as of July 1, 2006.
b Tariffs for offshore wind were put to 0 €/MWh on May 10, 2005. c Premium reduced to 60
€/MWh as of January 1, 2006

69
4.4.4 Uni ted K ingdom
The most important mechanism for financing renewable electricity projects in the
UK is the Renewables Obligation, a quota scheme with tradable green certificates.
Combined heat and power from biomass is also supported through the Enhanced
Capital Allowance and the Bio-energy Capital Grant Scheme. Several further
support instruments exist but do not apply to the selected cases.
Quo t a w i t h T r a d ab l e G r e e n C e r t i f i c a t e s ( T GC ) :
T h e Renewab l e s Ob l i g a t i o n
The primary RES-E policy mechanism in the UK is the Renewables Obligation
(RO), which came into force on 1 April 200213,14 and is guaranteed until at least
March 2027. The RO requires electricity suppliers to supply an increasing
percentage of electricity from RES (excluding large hydro). This percentage
increases until 2015-16, although the RO is guaranteed to remain in place until
2027 in order to give investment certainty also for projects commissioned in 2017
(see table below for annual targets). Electricity suppliers can meet their obligation:
• by surrendering Renewables Obligation Certificates (ROCs) to the electricity
regulator Ofgem as evidence of renewable electricity generation;
• by paying the non-compliance ‘buyout’ price;
• by a combination of the two.
ROCs are issued for every 1 MWh of eligible renewable electricity generated from
an accredited generating station. Separate ROCs are issued to generators in
Scotland (SROCs)15 and Northern Ireland (NIROCs)16, but the three types of
certificate are fully tradable and all can be used by any UK electricity supplier for
compliance with the RO.
The non-compliance buyout price is adjusted annually in line with the retail price
index. Payments are fed into a buyout fund that is recycled annually to electricity
suppliers in proportion to the number of ROCs they surrendered in the compliance
period. This provides an added incentive to meet the obligation by holding ROCs
and keeps the trading price of ROCs above the buyout price (see table below for
buyout price and an indicative value of ROCs). Annual compliance periods run
from 1 April one year to 31 March the following year. ROC auctions are held each
quarter.
13 UK SI 2002/914: Statutory Instruments SI 2002/914, The Renewables Obligation Order 2002 - Electricity, England and Wales (see www.opsi.gov.uk) 14 UK SI 2005/926: Statutory Instruments SI 2005/926, The Renewables Obligation Order 2005 - Electricity, England and Wales (see www.opsi.gov.uk) 15 UK SSI 2005/185: Scottish Statutory Instruments SSI 2005/185, The Renewables Obligation (Scotland) Order 2005 – Electricity (see www.opsi.gov.uk) 16 UK SR 2005/38: Statutory Rules of Northern Ireland SR 2005/38, The Renewables Obligation (Northern Ireland) Order 2005 – Electricity (see www.opsi.gov.uk)

70
A medium-term target has been specified for 2016, target setting is planned for
2020, and duration of the scheme is guaranteed until 2027. This aims to provide
long-term security for renewable energy investors. The RO is currently technology
neutral and mainly develops the lowest cost technologies and does not stimulate
promising technologies with still higher costs, as wave, tidal or photovoltaic
energy. Biomass CHP receives ROCs only for the electricity part.
Table 4-12 RO targets, buyout pr ices & ROC values in the Uni ted
K ingdom (status Ju ly 2007)17
RES
consumption
target
Value of recycled
ROC
Total value of ROC
to a supplier
(buyout+recycle)
United
Kingdom
EW,Sa N-Ia
Compli-
ance to
UK
target
Buyout
price
EWa Sa EWa Sa
Average
ROC
auction
priceb
Year % % % £/MWh £/MWh £/MWh £/MWh £/MWh £/MWh
2002-03 3 - 59% 30 15.94 23.55 45.94 53.55 47.30
2003-04 4.3 - 56% 30.51 22.92 23.70 53.43 54.21 47.09
2004-05 4.9 - 69% 31.39 13.66 19.99 45.05 51.38 48.62
2005-06 5.5 2.5 76% 32.33 EW,S, N-Ia: 10.21 EW,S, N-Ia: 42.54 41.82
2006-07 6.7 2.6 33.24
2007-08 7.9 2.8 34.30
2008-09 9.1 3.0
2009-10 9.7 3.5
2010-11 10.4 4.0
2011-12 11.4 5.0
2012-13 12.4 6.3
2013-14 13.4 6.3
2014-15 14.4 6.3
2015-16 15.4 6.3
Increases
in line
with
retail
price
index
a EW: England and Wales; S: Scotland; N-I: Northern Ireland b Average ROC value at ROC auctions by the Non-fossil Purchasing Agency,
www.nfpa.co.uk
Envisaged changes to the Renewables Obligation The government currently considers to:
• Increase the level of the Obligation above the level previously announced to a
maximum level of 20%.
• Introduce a mechanism intended to maintain Renewables Obligation Certificate
(ROC) prices in a situation of ROC oversupply.
17 Ofgem, 2007: Renewables Obligation: Annual report 2005-06; Ofgem, Ref. 36/07, 28 february 2007

71
• Band the RO to provide differentiated levels of support for different
technologies:
- Established technologies like sewage gas, landfill gas and co-firing of non-
energy crops would receive 0.25 ROCs/MWh.
- Reference technologies like onshore wind, hydropower and co-firing of
energy crops would receive 1 ROC/MWh.
- Post-demonstration technologies like offshore wind and dedicated regular
biomass would receive 1.5 ROCs/MWh.
- Emerging technologies like tidal and wave, solar-PV, geothermal,
dedicated biomass burning energy-crops and advanced biomass conversion
technologies (anaerobic digestion, gasification and pyrolysis) would
receive 2 ROCs/MWh.
• Create separate obligations for the different technologies, with different buy-out prices and targets.
Changes to the scheme will be introduced at 1 April 2009 at the earliest.
C l ima t e c h a nge l e v y e x emp t i o n
Since 2002 renewable electricity and CHP has been exempt from the Climate
Change Levy, which is a tax on electricity (excluding domestic and transport
sectors), gas and coal. Until April 1, 2007 the CCL for electricity was 4.30 £/MWh
(6.23 €/MWh)18; since that date an inflation correction is applied. Levy Exemption
Certificates (LECs) are earned to prove exemption from the Climate Change Levy.
The Climate Change Levy exemption has no influence on the production cost of
renewable electricity and CHP, but on its price for industrial and commercial
consumers and thus its competitiveness. If demand for LECs would drop below
supply, the LEC value will drop. Furthermore, changes in climate change policies,
e.g. the design of the European emissions trading system, might effect the level or
overall existence of the CCL. In general, the benefits of the exemption are to be
shared among producer, supplier, and consumer. For large-scale projects the
producer might receive 80 to 90% of the LEC-value.
PPA s , RO p u r c h a se a nd b a l a n c i n g
Usually power and ROCs are sold within one long-term contract to one of the (few)
electricity suppliers. In that case the electricity suppliers are responsible for
balancing. One would normally deal with the balancing and settlement issues
during negotiation of the power purchase agreement (PPA).
The electricity price one can achieve in a contract with electricity suppliers will be
a combination of:
18 UK SI 2001/838: Statutory Instruments SI 2001/838, The Climate Change Levy (General) Regulations 2001 (see www.opsi.gov.uk)

72
• the ‘grey’ electricity price (which may be fixed or based upon the System Sell
Price / System Buy Price, the prices which are paid/charged in case of
imbalance, defined by the Balancing and Settlement Code),
• the negotiated value of the ROC, which in turn depends on:
- how well-covered the electricity supplier is in terms of ROC purchase
- their perceived exposure to penalty charges for the duration of the PPA
- price level of ROC buyout and recycled ROC
• the value of the Climate Change Levy Exemption Certificate (LEC, which
often will be shared among producer, supplier, and consumer, see above)
• an assessment of the balancing and settlement risk against the PPA duration
and negotiated value of the PPA, leading to a reduction in price, either per
MWh or per time frame.
The shorter the time frame for the PPA, the greater the achieved overall electricity
price, but the higher the financing risk. Here we will assume a PPA contract period
of 15 year.
As a consequence of the above, only part of the value of the ROC or ROC buyout,
the recycled ROC, LEC, and the electricity market value is transferred to the RES
producer. The other fraction stays with the electricity utility and can be considered
as a risk premium. The actual amount can be highly variable, depending on specific
project characteristics and contract negotiations19. The producer can for instance
negotiate a fixed price contract incorporating all of the above elements (low risk,
low value), or make the decision to sell them by himself on the respective market
places (high risk, potentially high value). The latter is not applicable for project
financing as lenders will simply not be willing to finance the project. Often an
intermediate model is used that provides enough securities for lenders by offering a
floor price, but that also provides enough returns on equity by upside sharing. For
this study we use this intermediate contract model with the following assumptions
for the prices paid to the project developer/producer:
• 70 to 90% of the projected conventional wholesale electricity price, e.g. 35 to
40 £/MWh with prices for wind energy on the low-end, and for biomass-CHP
on the high-end
• 90% of the ROC buyout value (32.33 £/MWh in 2006, adjusted for inflation
during the project lifetime),
• 85% of the value of the recycled ROC (10 £/MWh in 2006, changing each year
depending on the level of compliance to the renewables obligation),
• 85% of the LEC (4.3 £/MWh)
• A floor price equal to 70 to 75 £/MWh over the full project lifetime (in practice
the floor price might change over time: from higher (e.g. 80 £/MWh) to lower
values 60 £/MWh))
19 Toke (2003)

73
For 2006 we derive under the listed assumptions an actual value of about 76 to 81
£/MWh, which would be higher than the assumed floor price. The ‘risk premium’
taken by the utility for the ROC and LEC is approximately 5 £/MWh, for the
electricity volatility this is of the same order of magnitude.
Gr i d a c c e s s
The developer bears the full cost for grid connection and grid reinforcement and
these are sometimes the prohibitive factor. The cost estimates given here are very
approximate (they could easily double in some circumstances). They are classified
by the voltage level at the point of connection to the system operator. The costs
exclude the switchgear, cables, transformers and other equipment within the
project. Costs for reinforcement of the network at remote locations are also
excluded from these estimates. The costs include capitalised charges to cover future
operation and maintenance of the system operator equipment provided specifically
for the project. System operator’s often insist this is paid as a capitalised charge,
typically 25% of the capital cost. Others allow this to be paid as an annual charge.
• Low Voltage: This is only feasible for very small generators connecting
directly to the existing network. Costs will vary so widely that it would be
misleading to state any here.
• 11 kV Grid connection equipment: £20,000 - £60,000
Overhead line: £15,000 - £30,000/km
• 33 kV Grid connection equipment: £120,000 - £150,000
Overhead line: £20,000 - £35,000/km
• 132 kV Grid connection equipment: £800,000 - £1,000,000
Overhead line: Insufficient information
In our comparison, we will assume that grid integration costs are the same for all
countries considered.
B i o - e n e r g y c a p i t a l g r a n t s c h eme
Capital grants are available for heat or combined heat and power from biomass.
Grants cover up to 40% of the difference in cost compared to installing a fossil fuel
alternative. Grants can be between £25,000 and £1 million. Round 3 of the Bio-
energy Capital Grants Scheme was launched in December 2006. Defra intends to
run further rounds of the scheme but has not announced them yet. Here we will
assume that our 10 MWe biomass-CHP case replaces a gas-fired CHP unit and
could receive the maximum capital grant of £1 million in 2006, or 100 £/kW.
O the r t e c hn o l o g y s p e c i f i c s u pp o r t
Several further support instruments exist but are less relevant for the specified
cases:
• The capital grant scheme provided grants for demonstration projects (Wind
offshore, biomass, PV).
74
• Low Carbon Buildings Programme – capital grants for small installations in the
built environment.
• Zero-interest loans for renewable energy projects conducted by SMEs up to
£100,000 .
• Regional programmes in Scotland and Northern Ireland addressing communes
and households.
• DEFRA Energy crops scheme – establishment grants for short rotation coppice
and miscanthus.
• Marine Renewables Deployment Fund – tidal and wave energy demonstration
projects.
F i s c a l i s su e s
The general corporate tax rate in the United Kingdom is 30%. This rate is assumed
to be applicable to the companies that would be set up to develop the RES-projects
in this study.
The default depreciation rule applying to renewable energy projects is 25%
annually on the reducing balance basis. This applies for projects with an economic
lifetime of less than 25 years. This is formulated as a capital allowance that is given
to the investor. There could also be ways of qualifying for a 40% first year
allowance if the special purpose company that owned and operated the plant
qualified as a small to medium enterprise (SME), i.e. a company with fewer than
250 employees, and either annual turnover not exceeding € 50 million or a balance
sheet totalling € 43 million, and which is not part of a larger enterprise that would
fail these tests. This would apply for the projects under consideration.
Depreciation: Enhanced Capital Allowances
CHP components are eligible for increased depreciation under the Enhanced
Capital Allowances (ECA). Businesses can claim up-front tax relief on their capital
spending on designated energy-saving plant and machinery. The Energy
Technology List (ETL) details the criteria for each type of technology, and lists
those products that meet them. In order to qualify, biomass CHP has to obtain a
Combined Heat and Power Quality Assurance Certificate (CHPQA), criteria
depend on size and type of the CHP installation. Other large-scale RES are not
included in the ECA scheme. 100% first-year Enhanced Capital Allowances allow
the full cost of an investment in designated energy-saving plant and machinery to
be written off against the taxable profits of the period in which the investment is
made. All parts of a CHP unit despite the building housing the unit qualify for
ECA. Here we will assume that 85% of the costs are eligible. The tax benefits of
the 100% first-year ECA can not be carried forward to subsequent years, which
makes it not interesting for a real project financing case without any provisions to
deduct negative EBT (earnings before taxes) from other taxable income. This

75
measure is hence more favourable for on-balance financing and is not incorporated
in the analysis.
It has been announced by the UK Chancellor (March 2007) that it is intended to
make wind turbines eligible in the near future, although no official confirmation is
yet available on the ECA website (www.eca.gov.uk).
Summa r y o f f i n a n c i a l a s s ump t i o n s f o r t h e Un i t e d K i n gdom
Table 4-13 Summary of f inancial assumpt ions for the Uni ted K ingdom
(2006)
United Kingdom
£ 1 = € 1.44
Wind onshore Wind offshore Biomass CHP
Corporate tax % 30%
Fiscal
depreciation
Type 25% reducing balance, with a 40% first year allowance
for SMEs
Period yr 15 15 15
Debt measures Type - - -
Tax measures Type ECA first-year allowance (tax deduction)
Rate % - - (100% c)
Investment subsidy £/kW - - 100
ROC-value (2006)a £/MWh 90%*32+85%*10 = 37.6b (54 €/MWh)
LEC-value (CCL)a £/MWh 85%*4.3 = 3.7b (5.3 €/MWh)
Market value electricityb £/MWh 35-40 35-40 35-40
Floor priceb £/MWh 70-75 70-75 70-75
(low-end) (low-end) (high-end)
Economic lifetime yr 15 15 10
a Only part of the value of ROC and LEC are available to the project. The remaining 5 £/MWh is kept
by the electricity supplier with the renewables obligation. Part of the LEC value can also be shared
with the consumer. b Note that in actual PPAs these values can differ significantly. c The tax benefits
of the 100% first-year ECA can not be carried forward to subsequent years. This measure is not
incorporated in the comparative assessment, as it is not effective in our project finance case.

76
4.4 .5 Cal i fornia
Renewable energy project developers in California can leverage a number of
supporting measures, both from the State and Federal Government.
State support schemes
The main support instrument to promote renewable electricity at the state level is
the Renewable Portfolio Standard (RPS), which was implemented in 2002. The
RPS is complemented with the production incentive scheme called the Renewable Facilities Program (RFP). As part of the RFP the Supplemental Energy Payments (SEP) has the role to cover or mitigate above-market costs of meeting
the RPS.
Federal support schemes
Main Federal support schemes include the Production Tax Credit (PTC), the
Renewable Energy Production Incentive (REPI) and the Modified Accelerated Cost-Recovery System (MACRS).
In the following paragraphs, the different financing schemes will be analysed in
more detail.
S t a t e s u ppo r t : R e n ewab l e P o r t f o l i o S t a n da r d ( R PS )
California introduced a RPS, in 2002, pursuant to Senate Bill 1078. Under the
provisions of this law, retail sellers of electricity were required to increase their
procurement of eligible renewable energy resources to at least 20% by 201020. As
of January 1, 2003, each electricity distribution company had the obligation to
increase its total sale of eligible renewable energy resources by at least an
additional 1 percent of retail sales per year so that 20 percent of its retail sales are
from eligible renewable energy resources by 201021. In 2006 about 11% of the
electricity was generated by RPS-eligible renewables.
Table 4-14 Targets under the Cal i fornian RPS
Year Percent of total sales derived from renewable electricity
2003 At least 1 % above base load renewable use
2004-2010 At least 1 % above previous year
2010 20% of total sales
2020 33% of total sales
For purposes of setting annual procurement targets, the California Public Utility
Commissions (CPUC) established an initial baseline for each utility based on the
20 Originally the target was 20% by 2017. Senate Bill 107 of September 2006 accelerated to 20 percent by 2010 21 SB 1078 (modified by SB 107) 399.15, (3) (b) (1)
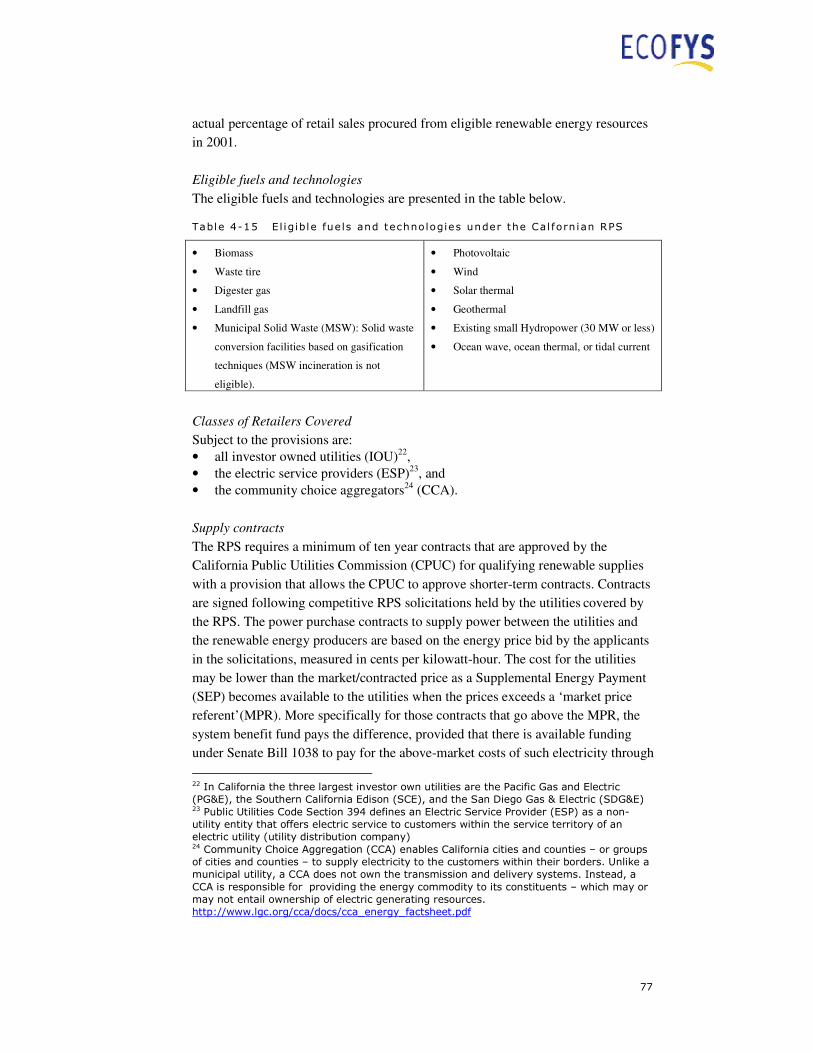
77
actual percentage of retail sales procured from eligible renewable energy resources
in 2001.
Eligible fuels and technologies
The eligible fuels and technologies are presented in the table below.
Table 4-15 E l igible fuels and technologies under the Cal forn ian RPS
• Biomass
• Waste tire
• Digester gas
• Landfill gas
• Municipal Solid Waste (MSW): Solid waste
conversion facilities based on gasification
techniques (MSW incineration is not
eligible).
• Photovoltaic
• Wind
• Solar thermal
• Geothermal
• Existing small Hydropower (30 MW or less)
• Ocean wave, ocean thermal, or tidal current
Classes of Retailers Covered
Subject to the provisions are:
• all investor owned utilities (IOU)22,
• the electric service providers (ESP)23, and
• the community choice aggregators24 (CCA).
Supply contracts
The RPS requires a minimum of ten year contracts that are approved by the
California Public Utilities Commission (CPUC) for qualifying renewable supplies
with a provision that allows the CPUC to approve shorter-term contracts. Contracts
are signed following competitive RPS solicitations held by the utilities covered by
the RPS. The power purchase contracts to supply power between the utilities and
the renewable energy producers are based on the energy price bid by the applicants
in the solicitations, measured in cents per kilowatt-hour. The cost for the utilities
may be lower than the market/contracted price as a Supplemental Energy Payment
(SEP) becomes available to the utilities when the prices exceeds a ‘market price
referent’(MPR). More specifically for those contracts that go above the MPR, the
system benefit fund pays the difference, provided that there is available funding
under Senate Bill 1038 to pay for the above-market costs of such electricity through
22 In California the three largest investor own utilities are the Pacific Gas and Electric (PG&E), the Southern California Edison (SCE), and the San Diego Gas & Electric (SDG&E) 23 Public Utilities Code Section 394 defines an Electric Service Provider (ESP) as a non-utility entity that offers electric service to customers within the service territory of an electric utility (utility distribution company) 24 Community Choice Aggregation (CCA) enables California cities and counties – or groups of cities and counties – to supply electricity to the customers within their borders. Unlike a municipal utility, a CCA does not own the transmission and delivery systems. Instead, a CCA is responsible for providing the energy commodity to its constituents – which may or may not entail ownership of electric generating resources. http://www.lgc.org/cca/docs/cca_energy_factsheet.pdf

78
the Supplemental Energy Payment (SEP) fund, collected from the “Public Goods
Charges”25.
The CPUC sets the reference price for the contracts which is applicable for each
solicitation conducted by an electrical corporation. On December 2006 the CPUC
adopted the Resolution E-4049 approving the 2006 Market Price Referents (MPR).
This Resolution formally adopted the 2006 MPR values for a baseload proxy plant
for the use in the 2006 RPS solicitations. The previously adopted benchmark cost
for renewable energy was 53.7 US$/MWh.
Table 4-16 Adapted 2006 Market Pr ice Referents (nominal US$/MWh)
Resource typea 10-year 15-year 20-year
2007 Baseload MPR 80.80 82.12 84.60
2008 80.14 82.31 85.19
2009 79.60 82.60 85.86
2010 79.65 83.33 86.91
2011 78.91 83.08 86.89
2012 79.62 84.21 88.21
2013 80.73 85.67 89.82
2014 82.30 87.47 91.69
2015 84.36 89.65 93.93 a Using 2007 as the base year, the Resolution calculates MPRs for 2008 – 2015 that reflect different
project on-line dates.
Source : http ://www.cpuc.ca.gov/WORD_PDF/FINAL_RESOLUTION/63132.PDF
To satisfy their RPS requirements, California utilities used to contract a prevalence
of wind and solar thermal electricity projects, as show by Table 4-17.
The California system currently does not separate the renewable energy attribute
from the physical electricity (i.e. does not allow the creation of separately tradable
Renewable Energy Certificates). Prices for renewable energy power are determined
by competitive bidding and these prices are set in fixed-price, long-term contracts
with individual electric utilities. Similar contracts are also prevalent for gray energy
bought by utilities, as the CPUC limits the amount of power that investor-owned
utilities can buy on the spot market to approximately 5 percent. As both renewable
energy and grey energy are negotiated privately and price data are not made
available, assessing the price impact of California’s RPS is arduous.
25 California Energy Commission administers SEP, but cannot assure that the State does not use the targeted funds for other purposes.
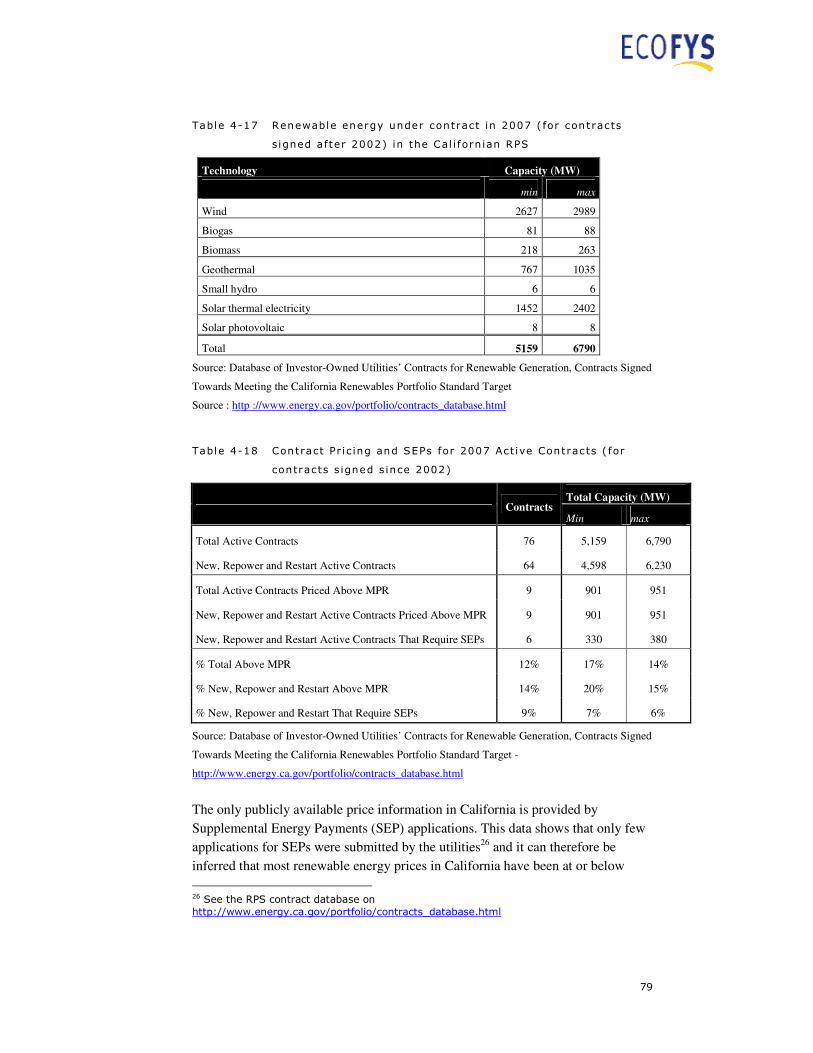
79
Table 4-17 Renewable energy under contract in 2007 ( for contracts
s igned after 2002) in the Cal i forn ian RPS
Technology Capacity (MW)
min max
Wind 2627 2989
Biogas 81 88
Biomass 218 263
Geothermal 767 1035
Small hydro 6 6
Solar thermal electricity 1452 2402
Solar photovoltaic 8 8
Total 5159 6790
Source: Database of Investor-Owned Utilities’ Contracts for Renewable Generation, Contracts Signed
Towards Meeting the California Renewables Portfolio Standard Target
Source : http ://www.energy.ca.gov/portfolio/contracts_database.html
Table 4-18 Contract Pr ic ing and SEPs for 2007 Act ive Contracts ( for
contracts s igned s ince 2002)
Total Capacity (MW)
Contracts
Min max
Total Active Contracts 76 5,159 6,790
New, Repower and Restart Active Contracts 64 4,598 6,230
Total Active Contracts Priced Above MPR 9 901 951
New, Repower and Restart Active Contracts Priced Above MPR 9 901 951
New, Repower and Restart Active Contracts That Require SEPs 6 330 380
% Total Above MPR 12% 17% 14%
% New, Repower and Restart Above MPR 14% 20% 15%
% New, Repower and Restart That Require SEPs 9% 7% 6%
Source: Database of Investor-Owned Utilities’ Contracts for Renewable Generation, Contracts Signed
Towards Meeting the California Renewables Portfolio Standard Target -
http://www.energy.ca.gov/portfolio/contracts_database.html
The only publicly available price information in California is provided by
Supplemental Energy Payments (SEP) applications. This data shows that only few
applications for SEPs were submitted by the utilities26 and it can therefore be
inferred that most renewable energy prices in California have been at or below
26 See the RPS contract database on http://www.energy.ca.gov/portfolio/contracts_database.html
80
MPR. Specifically, for contracts signed between 2002 and 2007, only about 12% of
the contracts had a price that was higher then the market referent price. The
operational status of all these contracts, however, remains “not on line”.
However, the reform of some RPS’ elements is under discussion: the Governor is
considering to introduce new legislation (Senate bill 1036) passed by the California
Senate and Assembly in September 2007 that will end the SEP process.
Considering that only a few contracts have gone above the MPR (which is levelled
on price for energy generation with natural gas), and that none of such projects is
currently operational, it can be argued that the Californian RPS did not lead to an
increase in renewable energy (wholesale) prices vis a vis non renewable energy.
Market observers have in fact highlighted that the main benefits of the support
scheme has probably been the removal of institutional barriers, which hindered the
development of renewable energy projects that made perfect economic sense, when
utilities and developers, pre RPS, could select more familiar fossil-fuel-based
projects.
S t a t e s u ppo r t : R e n ewab l e F a c i l i t i e s P r o g r am
Existing Renewable Facilities Program
The ‘Existing Renewable Facilities Program’ (1998 – present) was designed to help
support the operation of existing (i.e. renewable projects that began operating
before 26 September 1996) renewable technologies during the first years of the
electric industry restructuring. The funds from the existing account were distributed
monthly to renewable suppliers though a cents per kilowatt-hour (kWh) payment
for eligible renewable electricity generation. The existing account was initially
allocated US$ 243 million to be divided among three tiers:
• Tier 1 (biomass, waste tire and solar thermal) was allocated US$ 135 million
• Tier 2 (wind) was allocated US$ 70.2 million
• Tier 3 (geothermal, small hydro, digester gas, landfill gas and municipal solid waste) was allocated US$ 37.8 million
The amount of funds available in each tier declined each year as renewable
generation facilities were expected to become more cost effective and therefore
require less financial help to compete in an unregulated market.27
The maximum incentive price provided by this scheme was 15 US$/MWh, received
by tier 1 suppliers in 1998 and for about half year in 1999. During this period tier 2
providers received a maximum of 10 US$/MWh while tier 3 received a maximum
of 5.3 US$/MWh. Funds for all tiers were exhausted by June 2000.
New Renewable Facilities Program (SB 90, SB 1038, SB 1078)
27http://www.energy.ca.gov/renewables/existing_renewables/index.html

81
In its initial form the New Renewable Facilities Program provided a production
incentive (US$/MWh) on top of the grey electricity price awarded through
competitive auctions. Three auctions were held by the California Energy
Commission in the period between March 1998 and June 2001. Production
incentives were granted for a maximum of 5 years and ranged from 13.9 to 7.4
US$/MWh (see table below).
Table 4-19 New Renewable Fac i l i t ies Program – summary of auct ion
winning fac i l i t ies
Technology Number of
projects
Capacity
(MW)
Average
incentive
(US$/MWh)
Total funds
committeda
(million US$)
Biomass 2 11.30 13.5 3.8
Digester gas 1 2.05 13.9 1.1
Geothermal 4 156.90 12.8 75.6
Landfill gas 17 50.57 11.1 18.0
Small hydro 5 33.24 11.9 4.2
Wind 39 982.67 7.4 79.1
Total 68 1,236.73 8.6 182 a The total funds committed for winning bidders in the second and third auctions reflect both the loss
opf potential bonusses for early on-line dates and 50% penalties for later on-line dates for those
projects not yet on-line. The original conditional funding awards for winning bidders in the second
and third auctions included potential bonuses for early on;line dates and did not reflect potential
penalties for later on-line dates.
Source: Renewable Energy Program, 2006 annual report to the legislature, California Energy
Commission, November 2006
With SB 1038 and SB 1078 the production incentives for new renewable facilities
was combined with California’s Renewable Portfolio Standard and was given the
shape of the Supplemental Energy Payments (SEPs) which cover above-market
costs of meeting the RPS.
S t a t e s u p po r t : I n v e s tme n t s u b s i d y E RP
The Emerging Renewables Program (ERP) provides incentives for grid-connected
small wind (up to 50 kW) and fuel cells (up to 30 kW) using renewable energy
fuels. Rebates (in $/W) for eligible renewable energy systems installed on
affordable housing projects are available at 25% above the standard rebate level up
to 75% of the system’s installed cost.

82
S t a t e s u p p o r t : C a l i f o r n i a S o l a r I n i t i a t i v e ( CS I ) –
P e r f o rman c e B a se d I n c e n t i v e s ( PB I )
Until 2006 the California Solar Incentive (CSI) provided an upfront, capacity-based
payment for new PV and other solar electric systems. Starting January 1, 2007,
incentives for all solar energy systems greater than 100 kW and below 1 MW are
paid an incentive monthly, and for a period of five years, on the basis of the actual
energy produced. This incentive is called Performance Based Incentives (PBI). An
important criterium is that the installed solar capacity should serve on-site electrical
load on an annual basis.
California Solar Initiative incentives will be disbursed based on the rates displayed
below, which highlight a stepwise decrease as total market size increases.
Table 4-20 Large System Per formance-Based Incentive Schedule
( ini t ia l ly for systems 100kW or larger in s i ze)
Incentive (US$/MWh) Step Total installed per step
(MW) Residential Commercial Government /
non-profit
1 50 n/a n/a n/a
2 70 390 390 500
3 100 340 340 460
4 130 260 260 370
5 160 220 220 320
6 190 150 150 260
7 215 90 90 190
8 250 50 50 150
9 285 30 30 120
10 350 30 30 100
As of January 1, 2007, the programme had reached Step 2.
Thanks to the CSI, developers of solar photovoltaic projects can benefit of a secure
income during the first 5 years of operation, currently 390 US$/MWh. Obtaining
the CSI incentive does not preclude the use of the renewable energy produced to
meet the Californian RPS obligation. Although being effective as of January 1,
2007, we will incorporate this measure in the cost assessment. The reference
electricity end-use price is set at 131 US$/MWh28.
28 US EIA (2007)
83
F e de r a l s u p po r t : R e n ewab l e e n e r g y P r odu c t i o n T a x C r e d i t
( P T C )
The PTC was created in the 1992 Energy Policy Act and provides an inflation-
adjusted tax credit of 15 US$/MWh (1993 US$ and indexed for inflation) for
electricity generated from qualifying renewable energy projects. Specifically
production tax credit is applicable to the following technologies: wind, closed-loop
biomass29, open-loop biomass30, geothermal energy, small irrigation power (150
kW – 5 MW), municipal solid waste, landfill gas, refined coal, hydropower, Indian
coal and solar. Currently, the amount of the tax credit is 19 US$/MWh for wind,
geothermal and closed-loop biomass; 10 US$/MWh for other renewable energy
sources. For RE project initiators the duration of the credit is 10 years from the start
of the project31.
In the 11 years subsequent to the introduction of the PTC (1993 was the year before
which qualified wind facilities became eligible for the credit) the annual production
of electricity from wind has quadrupled in the US. The most rapid growth did not
occur in the first five years (1994-1998) after the credit was created, but over the
following six years (1999-2004). The PTC plays a key role in the business case for
new RE power plants, as highlighted by the fact that interruptions of the PTC –
which occurred when congress failed or delayed reauthorizing the act – and/or
uncertainties about its renewal have been coupled with dramatic drops in RE
investment in the US (see Figure 4-1).
For developers of large scale wind, CHP and PV project the financial benefit of the
PTC are clear (see table below) and, as highlighted above, important. As the PTC
credit can only be harvested by tax paying entities and as renewable energy project
companies have often low tax liabilities, the PTC has induced/forced project
developers to join forces with larger established enterprises, which provide the tax
liability against which the PTC can be claimed. This resulted in more complicated
structures for project financing and governance, with additional initial costs for
renewable energy project developers in terms of time needed to find a potential
partner and negotiate an agreement and associated administrative and legal costs.
29 Any organic matter from a plant which is planted for the exclusive purpose of being used to produce energy. This does not include wood or agricultural wastes or standing timber. 30 All other types of biomass which are not planted for the exclusive purpose of being used to produce energy 31 There is an exception for open-loop biomass plants placed into service after 10/22/2004 and before enactment of the Energy Policy Act of 2005 (8/8/2005). Such projects are eligible for the credit for a five-year period, only.

84
575
43
1696
410
1687
389
2431 2454
0
500
1000
1500
2000
2500
3000
1999 2000 2001 2002 2003 2004 2005 2006
Ca
pa
city
(M
W)
6/1999
PTC expires,
not extended until
12/1999
12/2001
PTC expires,
not extended
until 2/2002
12/2003
PTC expires,
not extended until
10/2004
8/2005
PTC extended
prior to expiration
(through 2007)
12/2006
1 year PTC
extension
(through 2008)
Figure 4-1 U.S. Wind energy capaci ty addit ions in the per iod 1999-2006
in the context of budget dec is ions on the PTC (www.awea. org)
Table 4-21 The federal product ion tax credi t for selected technologies
Tax credit (2006) (US$/MWh)
Winda 19
Closed-loop biomass CHP 19
Open-loop biomass CHP 10
PVb 0
a The PTC reduces the cost of wind power by roughly one-third (~ 2 cents/kWh). Scheduled for a
Public Hearing Before the Senate Committee on Finance on March 16,2005. Prepared by the Staff of
the Joint Committee on Taxation.
b Note that solar facilities placed into service before December 31, 2005 were eligible for this
incentive32.
F e d e r a l s u p p o r t : O t h e r t e c hn o l o g y s p e c i f i c su pp o r t
Renewable Energy Production Incentive (REPI)33
The Renewable Energy Production Incentive (REPI) program was created by the
Energy Policy Act of 1992, and amended in 2005 to provide production incentives
for electricity generated and sold by a qualified renewable energy facility owned by
a State or non-profit electric cooperative. Incentive payments of 15 US$/MWh
(1993 US$ and indexed for inflation) for the first ten year period of operation,
subject to the availability of annual appropriations in each federal fiscal year of
operation.
32www.dsireusa.org 33www.dsireusa.org

85
Eligible fuels and technologies
Table 4-22 E l igible fuels and technologies under REPI
Tier 1 Tier 2
• Solar
• Wind
• Geothermal (with certain restrictions as
contained in the rulemaking)
• Closed-loop (dedicated energy crops)
biomass technologies to generate electricity
• Ocean (including tidal, wave, current, and
thermal)
• Fuel cells using hydrogen derived from
eligible biomass
• Open loop biomass such as
o Livestock methane
o Landfill gas
Annual REPI incentive payments are subject to availability of appropriate funds.
The Department of Energy can make no commitment for payment of REPI
incentives beyond the funds obligated in each fiscal year. This uncertainty could
prevent the stimulation of new renewable generation and thus influence the
effectiveness of the scheme.
If there are insufficient appropriations to make full payments for electric production
from all qualified facilities for a fiscal year, 60% of appropriated funds are to be
assigned to facilities that use tier 1 fuels and technologies; while the remaining 40%
is allocated to tier 2 facilities. Historically funds assigned to tier 2 were sufficient to
finance all requests only for the first two years of REPI operations (1994 and 1995),
while funds assigned to tier 1 projects were able to meet the requests of funds in
full until year 2003. Currently, as the growth in requests outstripped appropriations,
available funds are only able to cover a decreasing proportion of requests.
Energy Tax Act (Busines energy tax credit34)
The Business Energy tax Credit is a tax credit available for households and
businesses purchasing alternative energy equipment. For businesses, the tax credit
was 10% for investments in solar, wind and geothermal. This credit was in addition
to the standard 10% investment tax credit, available for all types of equipment. The
tax credit for wind energy expired in 1985. The 10% business energy tax credit for
solar and biomass was eventually made permanent in the Energy Policy Act of
1992. The Energy Policy Act of 2005 (H.R. 6) expanded the business energy tax
credit for solar and geothermal energy property to include fuel cells and
microturbines installed in 2006 and 2007, and to hybrid solar lighting systems
installed on or after January 1, 2006. These provisions of the tax credit were later
34www.dsireusa.org
86
extended through December 31, 2008, by Section 207 of the Tax Relief and Health
Care Act of 2006 (H.R. 6111). For eligible equipment installed from January 1,
2006, through December 31, 2008, the credit is set at 30% of expenditures for solar
technologies, fuel cells and solar hybrid lighting; microturbines are eligible for a
10% credit during this two-year period. For equipment installed on or after January
1, 2009, the tax credit for solar energy property and solar hybrid lighting reverts to
10% and expires for fuel cells and microturbines. The geothermal credit remains
unchanged at 10%.
Table 4-23 The tax credi t under the energy tax act for selected
technologies
Tax credit for eligible
equipment installed from
January 1, 2006
Tax credit for eligible
equipment installed on or
after January 1, 2009
Wind expired expired
Biomass expired expired
PV 30% 10%
Public Utility Regulatory Policies Act (PURPA)
This law created a market for non-utility electric power producers forcing utilities
to buy power from these producers at the “avoided cost” rate which the cost the
electric utility would incur were it to generate or purchase from another source.
Generally, this is considered to be the fuel costs incurred in the operation of a
traditional power plant. PURPA contained also a provision that required local
utilities to purchase excess power from industrial companies that produced
electricity as a by-product of heat production in co-generation units. Although a
federal law, the implementation was left to the States. However, in many states
only a little was done.
Renewable Energy Systems and Energy Efficiency Improvements
Program (USDA)35
The Renewable Energy Systems and Energy Efficiency Improvements Program has
been created with the 2002 Farm Bill (Section 9006) by the U.S. Department of
Agriculture (USDA) to make direct loans, loan guarantees, and grants to
agricultural producers and rural small businesses to purchase renewable energy
systems and make energy-efficiency improvements. Funds were appropriated for
the financial year 2002 until the financial year 2007.
Eligible renewable energy projects include wind, solar, biomass and geothermal;
and hydrogen derived from biomass or water using wind, solar or geothermal
energy sources. The maximum grant award is 25% of eligible project costs up to
35www.dsireusa.org

87
US$ 500,000 for renewable energy projects and up to US$ 250,000 for energy
efficiency improvements. Assistance to one individual or entity is not to exceed
US$ 750,000. The minimum grant request is US$ 2,500 for renewable energy
projects and US$ 1,500 for efficiency projects.
Under the guaranteed loan option, funds up to 50% of eligible project costs (with a
maximum project cost of US$ 10 million) are available. The minimum amount of a
guaranteed loan made to a borrower is US$ 5,000. Under this program it is allowed
to combine a grant and guaranteed loan. However it can not exceed 50% of eligible
project costs, and the applicant or borrower is responsible for having other funding
sources for the remaining funds.
The maximum percentage of guarantee ranges from 70% to 85% depending on the
loan value; the percentage for a given project will be negotiated between the lender
and the Rural Business-Cooperative Service. The interest rate will be negotiated
between the lender and the applicant and the repayment term must not exceed 30
years for real estate, 20 years for machinery and equipment, and seven years for
working capital.
The USDA has implemented this program through a Notice of Funds Availability
(NOFA) for each of the last four years. The latest round of funding was made
available in March 2007 and is available in the form of grants, guaranteed loans,
and combined guaranteed loans and grant applications.
Gr i d a c c e s s a n d b a l a n c i n g c o s t s
One of the most significant obstacles to renewable project development in
California was the expensive cost for connection between new major renewable
resource areas and distant utility high-voltage power grids. An additional
significant cost for renewable energy suppliers were the balancing costs and
penalties charged by grid operators. Historically transmission cost recovery rules,
established by the Federal Energy Regulatory Commission (FERC), required
renewable project developers to pay fully for transmission connections to utility
high-voltage grids, even if their project was the first of several projects that
eventually would use such connections. As a result, many smaller projects
remained on the drawing boards waiting for others to fund the transmission
projects. In 2006 the California Public Utilities Commission (CPUC) adopted a
decision authorizing the utilities to initially pay for the needed transmission
projects, charge renewable generators for transmission service for their share of the
costs under rates approved by FERC, and recover the reasonable remaining costs
from customers36.
36 A part from the grid access costs there is also a more practical obstacle as the significant congestion in the queue determined by the many people in line for grid access.
88
Regarding the balancing costs, the Scheduling Coordinator (SC) of a renewable
energy project can either:
• make its best forecast of energy production and schedule it in the Day-Ahead or
Hour-AheadMarket, or
• participate in the Participating Intermittent Resource Program (PIRP), where
the energy generation forecast is used as the energy schedule in the Hour-
Ahead Market.
In practice the PIRP program is advantageous to renewable energy operators as it
allows them to schedule energy in the forward market without incurring in
imbalance charges when the delivered energy differs from the scheduled amount.
Specifically participants in the PIRP program agree to pay a small forecasting
service fee (US$ 0.10 per delivered MWh) toward forecasting services developed
for the Independent System operator in California (CAISO). The hourly deviations
are calculated versus the forecasted delivery and are used to calculate a monthly
average of energy imbalances. As the forecast of energy production is, on average,
accurate, the cumulative amount of imbalance energy charges at the end of the
month is a relatively small.
Powe r p u r c h a s e a g r eemen t s ( PPA s )
As discussed above, California’s investor-owned electric utilities are required by
law to gradually ramp up their use of renewable energy. This principle drives the
utilities to launch solicitations inviting all interested developers of renewable
energy projects to submit their bids. Solicitations are generally made for 10, 15, or
20 year contracts. In the state of California under the RPS, the Renewable Energy
Certificates (RECs) are bundled to their underlying power. Currently, California
utilities can only comply with state RPS requirements by purchasing renewable
energy directly from eligible renewable generators. Utilities cannot satisfy RPS
requirements by purchasing RECs, which are separate from the underlying
renewable energy production and sold as a separate commodity. However, the
California Public Utilities Commission (CPUC) is considering the possibility of
allowing California utilities to purchase tradable RECs to meet the RPS
requirements.
I n v e s tme n t c r i t e r i a
Rate of returns for renewable energy investments vary according to market
conditions and the risk characteristics of the proposed project. For large scale wind
projects in California required Return on Equity had varied between 12% and 18%.
In the model used by the California Energy Commission to calculate the Market
Price Reference (31/5/2007), and utilized for draft resolution E-4118 (for MPR
2007), the CEC makes the following assumptions:
89
• Debt: 50% (source: D.05-12-042, Findings of Fact 22, adopted)
• Equity: 50%
• Cost of debt: 7.72%
Cost of Debt (industrial firms) = risk free rate (20 year T-Bill)
+ risk premium (mid point between BBB & B+ )
• Cost of equity: 13.28%
Cost of Equity = risk free rate (20-yr Tbill) + risk premium
(equity) + mid-cap risk premium (equity)
• WACC: 8.93%
Weighted average cost of capital = (Cost of Equity x Equity %)
+ (Cost of Debt x (1-tax rate) x Debt %)
F i s c a l i s s u e s
In the US a variety of federal, state and local taxes can be charged. This depends on
the fiscal and legal entity of the company structure. Here we will assume an
average federal corporate tax rate of 35%. For California we will take the 2006 tax
rate of 8.8% (‘C-corporation’). State and local corporate taxes are deductible from
the gross income in the calculation of federal corporate taxes.
Both on the federal and California-state level, the straight-line method is the default
way of depreciation, albeit that other can be used under certain conditions. As part
of the RES support scheme, solar PV and wind energy can be depeciated according
to the 5 year MACRS approach for the federal taxes. For CHP a 15 year Modified
Accelerated Cost Recovery System (MACRS) depreciation as applicable for
industrial steam and electric generation and/or distribution systems will be used for
the federal tax calculations.
California has excluded the depreciation under MACRS for the determination of
state corporate tax levels, with some exceptions. At the state level the 150% decling
balance is assumed. For the depreciation term we will use the economic lifetime,
although specific regulations do apply in some cases.
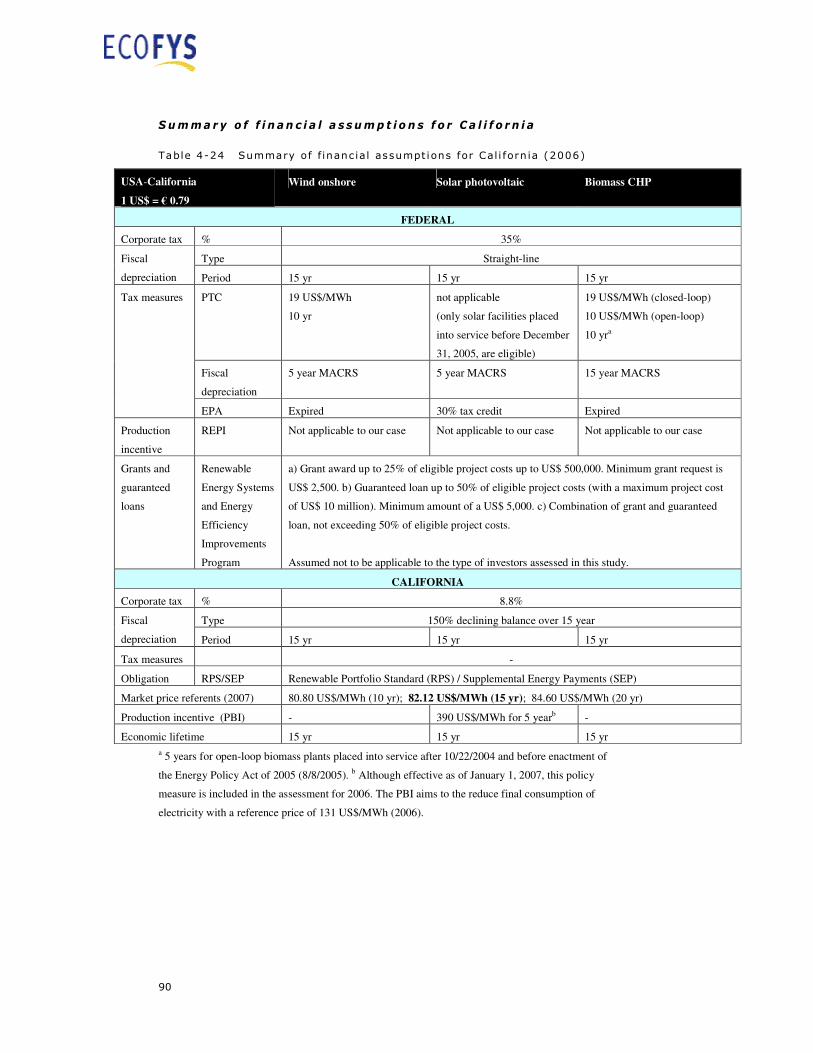
90
S umma r y o f f i n a n c i a l a s s ump t i o n s f o r C a l i f o r n i a
Table 4-24 Summary of f inanc ial assumpt ions for Cal i forn ia (2006)
USA-California
1 US$ = € 0.79
Wind onshore Solar photovoltaic Biomass CHP
FEDERAL
Corporate tax % 35%
Type Straight-line Fiscal
depreciation Period 15 yr 15 yr 15 yr
PTC 19 US$/MWh
10 yr
not applicable
(only solar facilities placed
into service before December
31, 2005, are eligible)
19 US$/MWh (closed-loop)
10 US$/MWh (open-loop)
10 yra
Fiscal
depreciation
5 year MACRS 5 year MACRS 15 year MACRS
Tax measures
EPA Expired 30% tax credit Expired
Production
incentive
REPI Not applicable to our case Not applicable to our case Not applicable to our case
Grants and
guaranteed
loans
Renewable
Energy Systems
and Energy
Efficiency
Improvements
Program
a) Grant award up to 25% of eligible project costs up to US$ 500,000. Minimum grant request is
US$ 2,500. b) Guaranteed loan up to 50% of eligible project costs (with a maximum project cost
of US$ 10 million). Minimum amount of a US$ 5,000. c) Combination of grant and guaranteed
loan, not exceeding 50% of eligible project costs.
Assumed not to be applicable to the type of investors assessed in this study.
CALIFORNIA
Corporate tax % 8.8%
Type 150% declining balance over 15 year Fiscal
depreciation Period 15 yr 15 yr 15 yr
Tax measures -
Obligation RPS/SEP Renewable Portfolio Standard (RPS) / Supplemental Energy Payments (SEP)
Market price referents (2007) 80.80 US$/MWh (10 yr); 82.12 US$/MWh (15 yr); 84.60 US$/MWh (20 yr)
Production incentive (PBI) - 390 US$/MWh for 5 yearb -
Economic lifetime 15 yr 15 yr 15 yr
a 5 years for open-loop biomass plants placed into service after 10/22/2004 and before enactment of
the Energy Policy Act of 2005 (8/8/2005). b Although effective as of January 1, 2007, this policy
measure is included in the assessment for 2006. The PBI aims to the reduce final consumption of
electricity with a reference price of 131 US$/MWh (2006).

91
4.4.6 Québec
The Canadian renewable energy support is characterised by a mix of federal and
provincial support schemes. The most important instrument for wind energy on
federal level is the ecoENERGY direct production incentive. As an example for an
additional support scheme on provincial level, the tendering scheme for wind
energy in Québec will be described.
Th e f e d e r a l e c o ENERGY d i r e c t p r o du c t i o n i n c e n t i v e
The ecoENERGY for Renewable Power entered into force in April 200737. Eligible
RES-E projects are offered a production incentive of 10 CAN$/MWh on the
produced electricity for 10 years. Eligible technologies include wind energy,
certified hydropower, certified bio-energy and solar photovoltaics. Geothermal,
tidal and wave energy are included, but at the start of the programme the eligibility
criteria were not yet defined. The programme aims to stimulate the production of
14.3 TWh of renewable electricity over 4 years (2007-2011). It replaced the Wind
Power Production Incentive (WPPI) that was frozen in 2006. It is also applicable
for wind projects commissioned between April 2006 and March 2007; these plants
receive the incentive on the electricity produced after April 2007 for 10 years.
The maximum funding for a renewable energy plant is fixed before the
commissioning of the project: The contribution agreements are based on expected
power production levels and outline the maximum amount of incentive payable
over the 10 years of the agreement, as well as the estimated annual production.
Once an agreement is entered into force, funding for the following 10 years is set
aside for that particular project. If a project is over-producing in a given year,
unclaimed amounts from previous years of under-production may be paid up to the
actual production. The funding ends when the total maximum eligible production
has been reached or when the 10-year period has been completed. For onshore wind
energy the maximum capacity factor level in the contribution agreement is set at
35%.
The ecoENERGY programme has a provision to avoid over-subsidising of RES
projects. If the cumulative revenues per MWh exceed a standard threshold price
(STP), the payment of the incentive is suspended. If this difference exceeds the
programme incentive (set at 10 CAN$/MWh), the project even has to repay that
part of the received incentive (see NRCan, 2007). For onshore wind energy the
standard threshold value is currently set at 130 CAN$/MWh for projects below or
equal to 10 MW, and 120 CAN$/MWh for projects larger than 10 MW. This
methodology will be reviewed biennially.
37 NRCan (2007)

92
The maximum contribution to an eligible recipient over the lifetime of the
programme is CAN$ 256 million, the maximum contribution per project
CAN$ 80 million. Eligible are businesses, municipalities, institutions and
organisations operating a “low-impact renewable energy plant” (basically all RES-
E excluding hydro).
To qualify for support, the project must have total rated capacity equal or above
of 1 MW (with an exception for wind energy projects that were commissioned
before April 2007 which must have a minimum capacity of 500 kW, consistent
with the final year of the WPPI programme). Production from test wind turbines
installed under the Canadian Renewable and Conservation Expense (CRCE)
provision of the federal Income Tax Act, are not eligible for the incentive.
T he t e n de r i n g s ch eme f o r w i n d e n e r g y i n Qué be c
The province of Québec has supported local wind technology manufacturing
through two large utility tenders for wind power. Québec has excellent wind
resources, a well developed grid, as well as large hydropower resources that can be
used to balance with wind power production. A first tender of 1,000 MW of wind
was released by Hydro-Québec Distribution, Québec’s state-owned utility, in May
2003 and closed in June 2004. For the financial conditions in the reference year
2006, only this first tender is relevant.
The first call for tenders contained the following key requirements38:
• Projects must be installed on the Gaspé peninsula (a particular regional
development area of Québec) between 2006 and 2012;
• Projects coming online in 2006 must utilize a minimum of 40 percent local
content, increasing to 50 percent in 2007 and to 60 percent for 2008-2012;
• Bidders had to develop proposals in conjunction with wind turbine
manufacturers.
Eight winning projects with a total capacity of 990 MW were selected (Table 4-25).
By winning the tender, the project developer is sure of an inflation corrected price
for the produced electricity during an agreed contract period. The average cost of
the electricity for the eight winning projects is 87 CAN$/MWh, with
65 CAN$/MWh as the average electricity price paid to the projects, 13
CAN$/MWh grid connection costs, and 9 CAN$/MWh balancing cost. The
contracts with Hydro-Québec have a term of 20 years.39
38 The following information is taken from Lewis and Wiser (2006) and Hydro-Québec (2006) 39 The second tender of 2000 MW resulted in an average price of 87 CAN$/MWh, plus 13 and 5 CAN$/MWh for grid connection and balancing cost, respectively. In about three years, the cost of wind power in Québec increased by 18 CAN$/MWh. (www.hydroquebec.com)
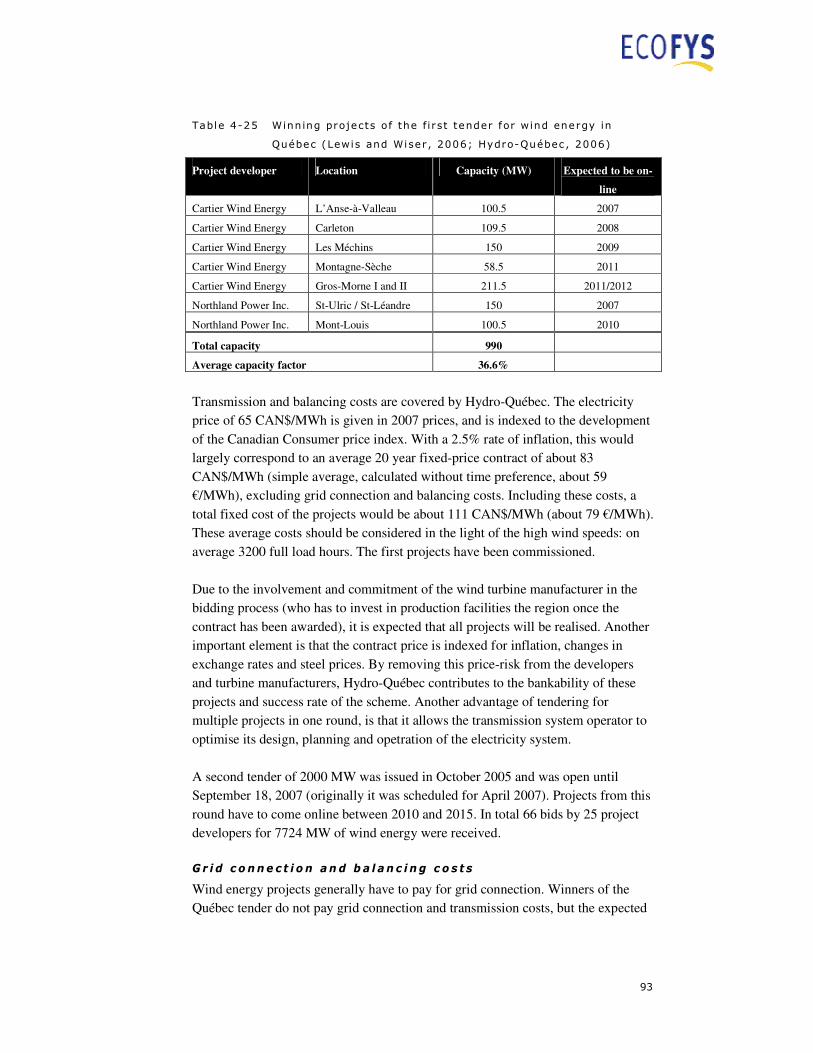
93
Table 4-25 Winning projects of the f i rst tender for wind energy in
Québec (Lewis and Wiser , 2006; Hydro-Québec , 2006)
Project developer Location Capacity (MW) Expected to be on-
line
Cartier Wind Energy L’Anse-à-Valleau 100.5 2007
Cartier Wind Energy Carleton 109.5 2008
Cartier Wind Energy Les Méchins 150 2009
Cartier Wind Energy Montagne-Sèche 58.5 2011
Cartier Wind Energy Gros-Morne I and II 211.5 2011/2012
Northland Power Inc. St-Ulric / St-Léandre 150 2007
Northland Power Inc. Mont-Louis 100.5 2010
Total capacity 990
Average capacity factor 36.6%
Transmission and balancing costs are covered by Hydro-Québec. The electricity
price of 65 CAN$/MWh is given in 2007 prices, and is indexed to the development
of the Canadian Consumer price index. With a 2.5% rate of inflation, this would
largely correspond to an average 20 year fixed-price contract of about 83
CAN$/MWh (simple average, calculated without time preference, about 59
€/MWh), excluding grid connection and balancing costs. Including these costs, a
total fixed cost of the projects would be about 111 CAN$/MWh (about 79 €/MWh).
These average costs should be considered in the light of the high wind speeds: on
average 3200 full load hours. The first projects have been commissioned.
Due to the involvement and commitment of the wind turbine manufacturer in the
bidding process (who has to invest in production facilities the region once the
contract has been awarded), it is expected that all projects will be realised. Another
important element is that the contract price is indexed for inflation, changes in
exchange rates and steel prices. By removing this price-risk from the developers
and turbine manufacturers, Hydro-Québec contributes to the bankability of these
projects and success rate of the scheme. Another advantage of tendering for
multiple projects in one round, is that it allows the transmission system operator to
optimise its design, planning and opetration of the electricity system.
A second tender of 2000 MW was issued in October 2005 and was open until
September 18, 2007 (originally it was scheduled for April 2007). Projects from this
round have to come online between 2010 and 2015. In total 66 bids by 25 project
developers for 7724 MW of wind energy were received.
Gr i d c o nne c t i o n a n d b a l a n c i n g c o s t s
Wind energy projects generally have to pay for grid connection. Winners of the
Québec tender do not pay grid connection and transmission costs, but the expected

94
costs are used for bid evaluation. The tender also includes a balancing and
complementary capacity service. Balancing costs have no effect on the bid
selection.
O th e r s u pp o r t p r o g r amme s
Almost all provinces have launched a number of incentives and measures to
support increased use of renewable energy, including requests for proposals (British
Columbia, Québec, Ontario), legislated renewable portfolio standards (Atlantic
provinces), Standard Offer Programs (Ontario and British Columbia), or
government procurement (Alberta, Ontario).
Other programmes (however, not relevant for the case study in this report) are for
example:
• The Market Incentive Program (MIP) provided investment subsidies of up to
40% to energy distributors who would set up new project to deliver RES-E to
their residential and small business customers. The programme ended March
31, 2006.
• The Renewable Energy Deployment Initiative (REDI) provided investment
subsidies of 25% up to a maximum of CAN$ 80,000 for renewable heating
installations. REDI ended on March 31, 2007.
F i s c a l i s su e s 40
The corporate tax rate in Canada is related to the type of income, the type of
corporation and the province or territory where the income is earned. The general
federal tax rate is 38%. If this income is earned in a Canadian province, 10% will
be rebated. With a surtax of 4% this results in a 29.12% federal tax rate. This tax
rate can be further reduced by 7% in case no other preferential fiscal measures
apply. For some companies reduced tax rates for the first CAN$ 400,000 do apply,
but this type of tax reduction is not assumed to be applicable to the considered wind
energy case. So, for resulting federal tax rate is 22.12%. This is increased by the
provincial tax rate of Québec (9.90%), resulting in an overall tax rate of 32.02%.
Fiscal depreciation is based on a deduction with the Capital Cost Allowance
(CCA), on a declining balance, which is different for different asset classes. The
maximum rate is given in the Income Tax Regulations. For the first year only half
of the maximum rate can be deducted. Conventional electricity production is
covered in several classes: class 2 (6% declining balance41) for electrical generating
equipment, and class 48 (15% declining balance) for electricity generating
combustion turbines (acquired on or after February 23, 2005). The 6% declining
balance will be assumed to be valid as a default reference for the wind energy case.
40 Income Tax Act 1985, c.1. and Income Tax Regulations, C.R.C. c. 945, available at http://laws.justice.gc.ca/ 41 8% after the 2008 budget
95
Class 43.1 and 2 accelerated depreciation The Canadian Income Tax Regulations allow the accelerated depreciation of the
investment cost of wind power plants and certain other RES (small hydro, PV,
wave, tidal, geothermal, co-generation, certain waste categories)42. Class 43.1 in
Schedule II to the Regulations provides in a CCA of 30% (declining balance),
which is extended to 50% in Class 43.2 for investments in the period 2005 (23
February) to 2012 (including certain high-efficiency co-generation plants)43.
Canadian Renewable and Conservation Expenses (CRCE) CRCE covers certain expenditures associated with the start-up of RES projects
eligible under Class 43.1 or 43.2, e.g. feasibility studies, negotiation and site
approval costs. It also covers up to 20% of a projected installed capacity (or up to
1/3 of wind farms with the total installed capacity of up to 6 MW) of the
installation of test wind turbines. Under CRCE, eligible expenditures are 100%
deductible in the year they are incurred or can be carried forward indefinitely for
deduction in later years. These expenditures can also be renounced to shareholders
through a flow-through share agreement, providing the agreement was entered into
before the expense was incurred. This fiscal measure is not assessed in the cost
assessment in this study.
42 CANMET (1998/2007) 43 Federal Budget 2007 extended Class 43.2 eligibility to assets acquired before 2020.

96
S umma r y o f f i n a n c i a l a s s ump t i o n s f o r Qu éb e c
Table 4-26 Summary of f inanc ial assumpt ions for Québec (2006)
CAN-Québec
CAN$ 1 = € 0.71
Wind onshore
FEDERAL
Corporate tax % 22.12%
Fiscal
depreciation
Type
Period
yr
6% declining balance (3% in first year)
20
Debt measures -
Tax measures Type
Period
yr
50% accelerated depreciation (25% in first year)
20
Production
incentive
Tariff $/MWh 10 (ecoENERGY)a,b
Period yr 10
QUÉBEC
Corporate tax % 9.90%
Fiscal depreciation Same as federal
Contract price Tariff $/MWh Electricity price: 65 (+ inflation correction)c
Balancing cost: 9
(Grid connection cost: 13)
Period yr 20b
Economic lifetime yr 20
a Maximum of CAN$ 80 million per project and CAN$ 256 million per eligible recipient.
b Hydro-Québec will take 75% of the ecoENERGY incentive, resulting in an effective incentive for
wind project developers in Québec of 2.5 CAN$/MWh.
b Result of tendering procedure for wind projects with average full load hours of 3200. The
ecoENERGY production incentive is not included. Grid connection and balancing cost are covered by
Hydro-Québec.The specific grid connection cost for these projects in Québec is not included in the
comparative assessment in this study.
97
5 Comparat ive assessment
In this chapter the cost of renewable electricity (RES-E) production will be
assessed for several technology and country combinations. The impact of generic
and RES-E specific policy measures on overall levelised cost of electricity and
cost of capital will be presented and discussed.
5.1 Gener ic f inancia l assumpt ions
The summary tables presented and discussed in the previous chapter will be used as
input to the cost assessment model (see Annex 2 for a short description of the
model). For the comparative assessment the following generic financial parameters
are assumed to be valid for all cases:
• Inflation rate: 2.5%/yr
• Default debt rate: 6%/yr
• Default debt term: 10 year for biomass-CHP and 15 year for the other
technologies (unless specific schemes provide in longer debt terms, such as the
20 year German KfW programmes)
• Economic lifetime: 10 year for biomass-CHP and 15 year for the other
technologies (unless specific schemes provide in longer periods of support, see
summary tables in previous chapters)
Although these factors differ per country and technology, they are believed to be
representative for the 2006 situation for the cases considered in this study. Other
generic assumptions are:
• Debt reserves can be used to cover debt service requirements (the debt reserve
is assumed to be zero at the start of the project)
• 100% tax loss carry forward is allowed (assumed to be indefinite, although
some countries/states have restrictions, i.e. California 10 years)
As both options generally result in lower levelised cost of electricity, they are
included in the analysis1.
Other key parameters that determine the cost of capital are the after-tax return on
equity (RoE) required by the equity-provider, and the debt term, debt rate, and
minimum debt service coverage ratio (DSCR) required by the lender. As indicated
above, we assume fixed values for both debt term and rate, unless specific support
1 We assume project financing cases without any provisions to deduct negative EBT (earnings before taxes) from other taxable income, which favours tax loss carry forward arrangements.

98
schemes affect these parameters. For actual projects these factors may differ per
project and country, but we will assume that the technical risk profile is the same
for all countries and that similar power purchase agreements or feed-in tariffs can
be arranged for a 10 to 15 year economic lifetime.
RoE and DSCR are considered to be technology and country specific. Table 5-1
lists the assumptions for these parameters. The figures are based on the discussion
in section 2.4.3, several interviews with financial experts in the renewable energy
arena, insight in project plans for projects in different countries, the scarce public
literature sources, and an own assessment of the risk situation.
Table 5-1 Assumpt ions on required return on equity (RoE) and
min imum debt service coverage rat io (DSCR) for selected
combinat ions of countr ies/regions and technologies in 2006
Renewable energy technology Country Wind onshore Wind offshore Solar PV Biomass CHP
RoE DSCR RoE DSCR RoE DSCR RoE DSCR
Default country 15% 1.35 18% 1.5 15% 1.35 15% 1.8
Germany 9% 1.3 15% 1.4 9% 1.3 12% 1.7
France 10% 1.3 18% 1.4 10% 1.3 12% 1.7
Netherlands 15% 1.3 18% 1.4 15% 1.7
United Kingdom 15% 1.45 15% 1.6 15% 1.8
USA/California 12% 1.3 12% 1.3 12% 1.7
Canada/Québec 12% 1.3
As a reference we will assume an onshore wind energy project with a RoE of about
12 to 15% and a DSCR of 1.3 to 1.35 (with known wind distribution profiles). For
the default country (see Table 2-1) we will use the high-end value of this range. For
the other countries risk premiums or discounts are assumed. Feed-in tariff systems
with a stable policy context get the highest discount (e.g. Germany), whereas the
inherent uncertainty of both feed-in premium and obligation schemes is reflected in
high-end values for both RoE (Netherlands, UK) and DSCR (UK). The obligation
scheme in the UK results in higher values for the DSCR by 0.1 to 0.2. For the
bidding process in the schemes of California and Québec no additional premiums
or discounts are assumed.
Offshore wind energy and biomass combined heat and power production have
higher risk profiles as compared to onshore wind energy. Developing offshore wind
energy projects is still associated with high risks during construction and operation.
Here we assume that this results in a risk premium of 3 to 6% (as compared to the
12% onshore wind energy case) with the lower value assumed to be valid for
countries with existing (remote) offshore wind energy projects and/or a strong
government commitment towards offshore wind energy (UK, Germany). In the

99
case of biomass CHP the supply of biomass is an important risk factor, resulting in
higher values for the DSCR and in most cases higher values for the RoE.
In the following sections the results of the comparative assessment will be
presented in graphs. The graphs represent for each technology the levelised cost of
electricity for different countries under different conditions (bar A to C), as well as
the effect of various generic or RES-specific support measures (D to H). For each
country the graphs have the following bars (see for example Figure 5-1):
Default country – Levelised cost of electricity
A. The levelised cost of electricity (LCE) for the technology in the default country
(30% corporate tax, linear fiscal depreciation over 10 year, 10 year debt term, 10
year economic lifetime), with default financial conditions as presented in Table 5-1.
B. Ibidem, but with country-specific financial conditions (see Table 5-1) and a debt
term of 15 year. The difference between B and A is an indication for the change in
the cost of capital when using the country-specific values for RoE and DSCR.
Country case - Levelised cost of electricity
C. The levelised cost of electricity for the technology in the specific country, without
implementation of policy support measures for RES. The difference between C and
B shows the effect of changing from the fiscal and economic settings of the default
country to the one of the specific country.
Country case – Effect on levelised cost of electricity
D. The effect of fiscal measures on the levelised cost of electricity on the unsupported
cost (e.g. tax deduction on investment in RES, RES-specific depreciation schemes).
E. The cumulative effect of debt measures on the above (e.g. government loans).
F. The cumulative effect of investment grants on the above.
G. The cumulative effect of production support on the above (e.g. feed-in tariff, feed-
in premium, renewable electricity certificates, production incentive or tax credit).
H. The valuation of electricity sales, if applicable (e.g. not in feed-in tariff schemes).
I. An indication of the potential of additional cost reductions by assuming a RoE of
9% and a DSCR of 1.3, and an optimal debt term and economic lifetime (ranging
from 15 to 20 years).
If bars D-H are omitted, no policy instruments are in place.
LegendDefault country
A Default financial parameters, 10 year debtB Default country, with country-specific financial parameters
Country case
C No supportD Plus effect of fiscal measuresE Plus effect of debt measuresF Plus effect of investment grants
G Plus effect of production supportH Energy salesI Potential of additional cost reductions
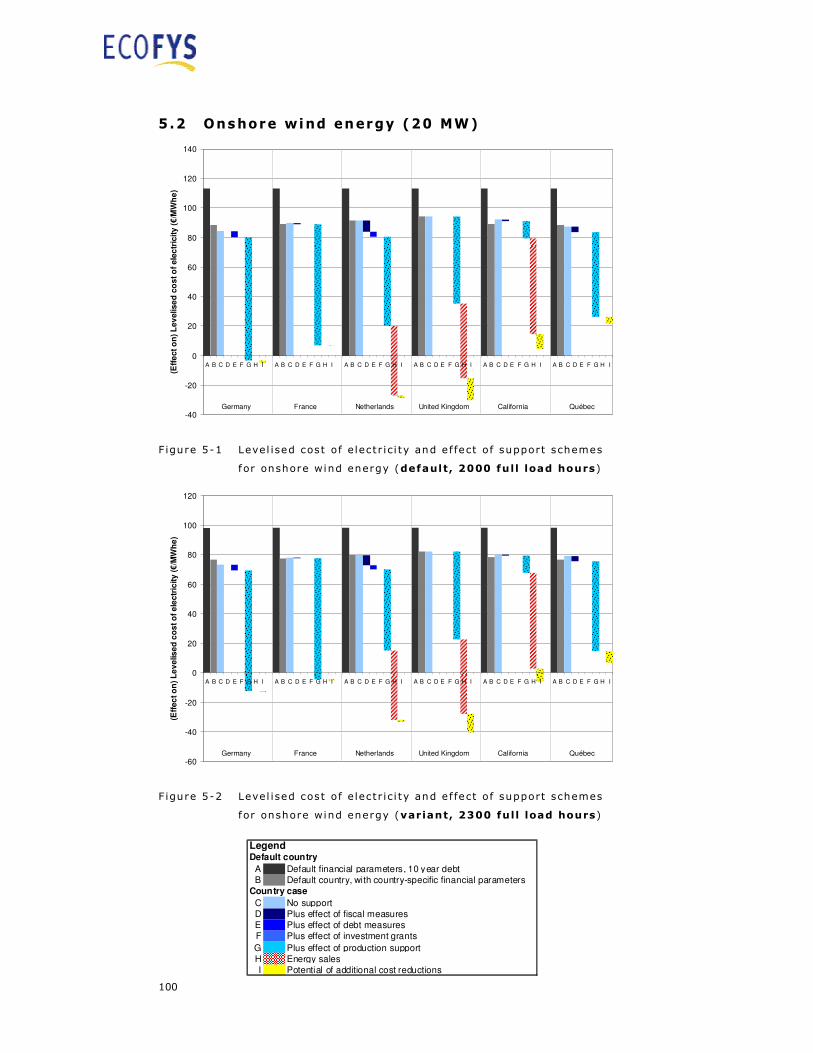
100
5.2 Onshore wind energy (20 MW)
-40
-20
0
20
40
60
80
100
120
140
A B C D E F G H I A B C D E F G H I A B C D E F G H I A B C D E F G H I A B C D E F G H I A B C D E F G H I
(Eff
ect
on
) L
ev
elise
d c
os
t o
f ele
ctr
icit
y (
€/M
Wh
e)
Germany France Netherlands United Kingdom California Québec
Figure 5-1 Level ised cost of e lectr ic i ty and e f fect of support schemes
for onshore wind energy (default, 2000 full load hours)
-60
-40
-20
0
20
40
60
80
100
120
A B C D E F G H I A B C D E F G H I A B C D E F G H I A B C D E F G H I A B C D E F G H I A B C D E F G H I
(Eff
ec
t o
n)
Le
velis
ed
co
st
of
ele
ctr
icity
(€
/MW
he
)
Germany France Netherlands United Kingdom California Québec
Figure 5-2 Level ised cost of e lectr ic i ty and e f fect of support schemes
for onshore wind energy (variant, 2300 full load hours)
LegendDefault country
A Default financial parameters, 10 year debtB Default country, with country-specific financial parameters
Country case
C No supportD Plus effect of fiscal measuresE Plus effect of debt measuresF Plus effect of investment grants
G Plus effect of production supportH Energy salesI Potential of additional cost reductions
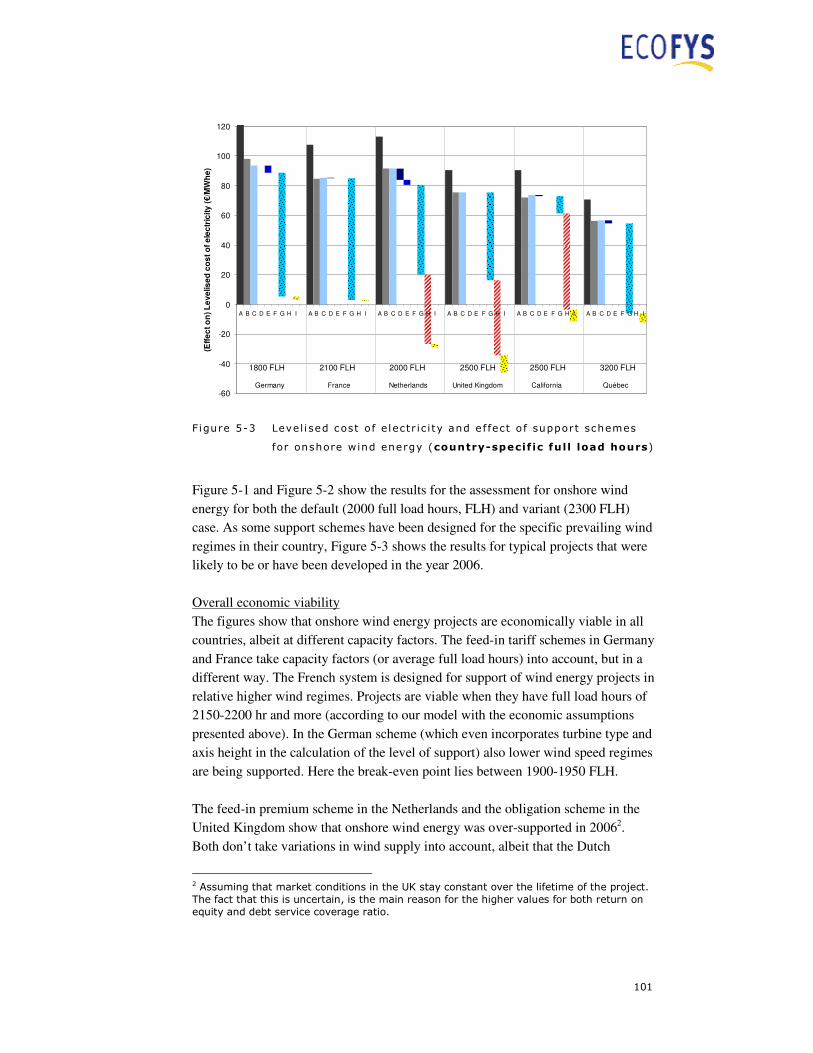
101
-60
-40
-20
0
20
40
60
80
100
120
A B C D E F G H I A B C D E F G H I A B C D E F G H I A B C D E F G H I A B C D E F G H I A B C D E F G H I
(Eff
ec
t o
n) L
eve
lis
ed
co
st
of
ele
ctr
icity
(€/M
Wh
e)
Germany France Netherlands United Kingdom California Québec
1800 FLH 2100 FLH 2000 FLH 2500 FLH 2500 FLH 3200 FLH
Figure 5-3 Level i sed cost of e lectr ic i ty and e f fect o f support schemes
for onshore wind energy (country-specif ic ful l load hours)
Figure 5-1 and Figure 5-2 show the results for the assessment for onshore wind
energy for both the default (2000 full load hours, FLH) and variant (2300 FLH)
case. As some support schemes have been designed for the specific prevailing wind
regimes in their country, Figure 5-3 shows the results for typical projects that were
likely to be or have been developed in the year 2006.
Overall economic viability
The figures show that onshore wind energy projects are economically viable in all
countries, albeit at different capacity factors. The feed-in tariff schemes in Germany
and France take capacity factors (or average full load hours) into account, but in a
different way. The French system is designed for support of wind energy projects in
relative higher wind regimes. Projects are viable when they have full load hours of
2150-2200 hr and more (according to our model with the economic assumptions
presented above). In the German scheme (which even incorporates turbine type and
axis height in the calculation of the level of support) also lower wind speed regimes
are being supported. Here the break-even point lies between 1900-1950 FLH.
The feed-in premium scheme in the Netherlands and the obligation scheme in the
United Kingdom show that onshore wind energy was over-supported in 20062.
Both don’t take variations in wind supply into account, albeit that the Dutch
2 Assuming that market conditions in the UK stay constant over the lifetime of the project. The fact that this is uncertain, is the main reason for the higher values for both return on equity and debt service coverage ratio.

102
premium is only granted for the first 20,000 FLH. The Dutch scheme was modelled
for a 2000 FLH reference wind turbine, assuming electricity market prices of 26
€/MWhe. Our model calculates a levelised cost of 20 €/MWhe, which would result
in a profitable project at that electricity price. However, actual electricity prices in
2006 were in the range of 45-50 €/MWhe, resulting in significant over-support of
this technology, even more for high wind regimes. For this reason, the 77 €/MWhe
premium was reduced to 65 €/MWhe in July 2006. In 2007 it was decided to stop
the support by setting the premium to 0 €/MWhe. The new feed-in premium
scheme (SDE, active as of 2008) aims to correct for the variations in electricity
market prices.
The obligation scheme in the UK has similar built-in effects: both the level of the
ROC-buyout price, the Climate Change Levy and the level of the obligation are
determined by government. The buyout price of the ROC of 32.33 GBP (about 46.5
€/MWhe) is an important element in the price-setting for renewable electricity. Its
value, even when only part of it is forwarded to the project, is already large enough
to make onshore wind energy projects viable. The calculated levelised cost of
electricity range from 16 to 35 €/MWhe in the shown examples, whereas actual
electricity market prices were about 50 €/MWhe in 2006. The obligation scheme
does not differentiate amongst technologies, let alone amongst different wind
regimes. Despite the high returns in 2006, the UK scheme has significant perceived
risks, due to both the large impact of changes in government policies that could
directly affect the value of renewable electricity, and the organisation of and
developments on the RES-E and conventional electricity markets.
The support scheme in California has multiple elements, with the tendering process
under the Renewable Portfolio Standard (RPS) being the most important
contributor. The tariffs in the power purchase agreements that are negotiated
between project developer and utility are not published. The electricity prices
shown in the figures are the Market Price Referents that can be assumed to
represent the upper-boundary of the actual negotiated prices for most cases. Under
the assumptions in this study, onshore wind energy in California is only viable for
higher wind speeds (break-even point at about 2400 FLH).
For Québec, the first tender for 1000 MW onshore wind energy resulted in projects
with 3200 FLH on average; hence only Figure 5-3 is relevant to consider in this
respect. With the assumptions presented above and in Table 4-3, the cost of such a
wind project would be about 57 €/MWhe. The project will receive the electricity
contract price of 74 CAN$/MWhe (for 20 year, excluding grid connection costs),
which is corrected for inflation. This is added with 25% or 2.5 CAN$/MWhe of the
ecoENERGY production incentive for 10 year. The combined effect (contract
price, inflation correction and ecoENERGY) results in a levelised income of 85

103
CAN$/MWhe or 60.5 €/MWhe during 20 years. Fiscal measures add another 2.3
MWhe. This results in a negative levelised cost of electricity of about 6 €/MWhe.
Effect of key financial parameters
All countries show significant reductions in the levelised cost of electricity as
compared to the default case (bar C compared to A in the figures), ranging from 15
to 25%. This is the effect of using lower values for the return on equity and debt
service coverage ratio as applied by investors and lenders (bar B compared to A),
reflecting the reduction in the perceived risks as a consequence of the national
policies and the support measures and market conditions presented in bars D to I.
The effect of changing from the fiscal regime of the default country to the one of
the selected country is minimal in most cases (bar C compared to B). Changing the
level of the corporate tax has limited effects on the levelised cost of electricity for
most countries, as already shown in Figure 2-8, whereas conventional fiscal
depreciation methodologies often involve straight-line (as in the default country), or
declining balance depreciation.
Effect of support instruments: Fiscal measures
Fiscal measures can have a notable effect on the levelised cost of electricity. In the
country cases both investment tax deduction schemes (e.g. NL), and accelerated or
modified fiscal depreciation schemes (US and Canada, at the federal level) occur.
The first year tax deduction in the Netherlands results in a reduction of the LCE by
7 to 8 €/MWhe.
Some fiscal measures have limited impact in our project finance case, as the fiscal
losses of the project are not assumed to be deductable from other taxable income. If
these were to be deductable (e.g. via arrangements that transfer tax losses to other
corporations, or in corporate finance), overall levelised costs of electricity could be
reduced. As an example the Modified Accelerated Cost Recovery System
(MACRS) as applied in the US taxation at the federal level, has limited impact (0.7
€/MWhe) in our 2500 FLH California case with an LCE of 61 €/MWhe (Figure
5-3). If tax losses could be transferred, the LCE would be reduced to 53 €/MWhe,
with a 7 €/MWhe contribution from the MACRS. This is a good illustration of the
fact that different financing models are differently affected by fiscal measures.
The production tax credit (PTC) in the US reduces levelised cost by about 12
€/MWhe. As discussed before, the PTC has no effect on the leverage of the project,
and hence does not reduce cost of capital. Due to the stop-and-go nature of the PTC
in the past, this instrument was not considered by investors and lenders to be
robust. In order to reap the tax benefit, project developers have to join forces with
(large) companies with net taxable income, in order to benefit from the tax credit.

104
This increases the project cost and the cost of capital. The production tax credit is
here positioned under production support (bar G in the figures).
Effect of support instruments: Debt measures
Both the Netherlands and Germany have debt measures with an overall reduction
on levelised costs of about 3 to 5 €/MWhe. The Dutch debt measure is based on a
tax exemption for investments in so-called Green Funds. Because of this tax
benefit, the investors are satisfied with lower returns, and hence the fund can lend
money at lower rates (typically 1% below market rates). In Germany the State
owned KfW Bank offers special loan programmes with lower interest rates (e.g.
1.5% below market rates), long debt terms (up to 20 year), and a redemption free
period (e.g. up to 3 year). The longer debt term has not only a direct effect on the
levelised cost, but also an indirect effect: together with the 20 year feed-in tariff it
increases the economic lifetime as applied by the investors of the project, resulting
in lower levelised cost (this effect is incorporated in bar B in the figures).
Effect of support instruments: Investment grants
None of the schemes has investment grants for onshore wind energy. Several
countries have used this instrument in the past in the early days of wind energy
deployment. The investment tax deduction in the Netherlands implicitly acts as a
kind of conditional investment grant. When the project is a generating income, the
investment can be partially deducted from this income, and is typically used to
repay part of the debt.
Effect of support instruments: Production support measures
It is clear that the production support schemes have the most prominent
contribution in reducing the levelised cost of electricity for onshore wind energy in
the cases considered. By adjusting the level of feed-in tariffs and feed-in premiums
the economic viability of a typical project can be achieved. In tender schemes
(Califiornia, Québec), the levels of the contract prices are determined by the market
actors. In Germany, France and the Netherlands these levels are determined by
government. The level of support under the UK obligation scheme is highly related
to conditions set by government (e.g. ROC buyout price, overall obligation level).
The design of the scheme and the stability of the policy context directly affect the
risk assessment of a project by investors and lenders. An attempt is made to
quantify this effect in Table 5-1. For onshore wind energy the following issues
contribute to the risk profile of a country:
• The 15 to 20 year support provided or negotiable in Germany, France,
California and Québec sets the standard favourably for the applied economic
lifetime of a project, whereas the 10 year premium support in the Netherlands
and the inherent uncertainties in the UK obligation scheme result in lower

105
applied economic lifetimes (e.g. 15 year) and higher levelised cost of
electricity.
• For some types of support, the cost of the support can either be covered by the
government budget, or by end-users via their electricity bill. The former has the
risk of budget overruns and is more likely to be affected by changes in
government (e.g. the investment tax deduction and feed-in premium in the
Netherlands, production tax credit in the US). This adds to the risk profile of a
country (see below).
• The success rate of the project development phase is an indication of the
attitude of a country towards onshore wind energy and the way this is reflected
in laws, regulations and institutional support.
• The flexibility of the support scheme towards changes in investment costs or
market conditions is important for the number of projects that reach financial
closure. The German feed-in tariffs are automatically declining each year,
whereas historic turbine cost actually went up. The Dutch feed-in premium
could in principle be adjusted each year to reflect changes in electricity market
prices and technology cost. Whereas in the past several tender schemes in
Europe have shown low success rates, the realisation of the projects from the
first tender in Québec seems to be on schedule. The tender incorporated
inflation, and changes in steel prices and exchange rates.
Potential of additional cost reductions
The last bar (I) in the figures is an indication of the potential of additional
reductions in the cost of capital, by assuming an overall return on equity of 9%, a
debt service coverage ratio of 1.3 and in some cases a debt term equal to the
economic lifetime. For all countries additional cost reductions could be achieved,
ranging from about 1 to 12 €/MWhe for the case with assumed country-specific full
load hours (Figure 5-3). The cost reductions can mainly be achieved by reducing
regulatory and financial risk. Additional reductions can be achieved by extending
the support periods. For example, the relatively small figure for France could be
increased by extending the support scheme for onshore wind energy from 15 to 20
year, even with lower feed-in tariffs.
The resulting level of the levelised cost shows the extent of under- or over-support
of the schemes under more advanced conditions. In feed-in tariff and -premium
schemes this can be corrected for by changing the tariff/premium levels. For
obligation schemes this requires changes in the design of the scheme, e.g. by
applying lower buyout prices (UK) or by introducing technology bands or
technology premiums that reduce the generic cost of certificates.
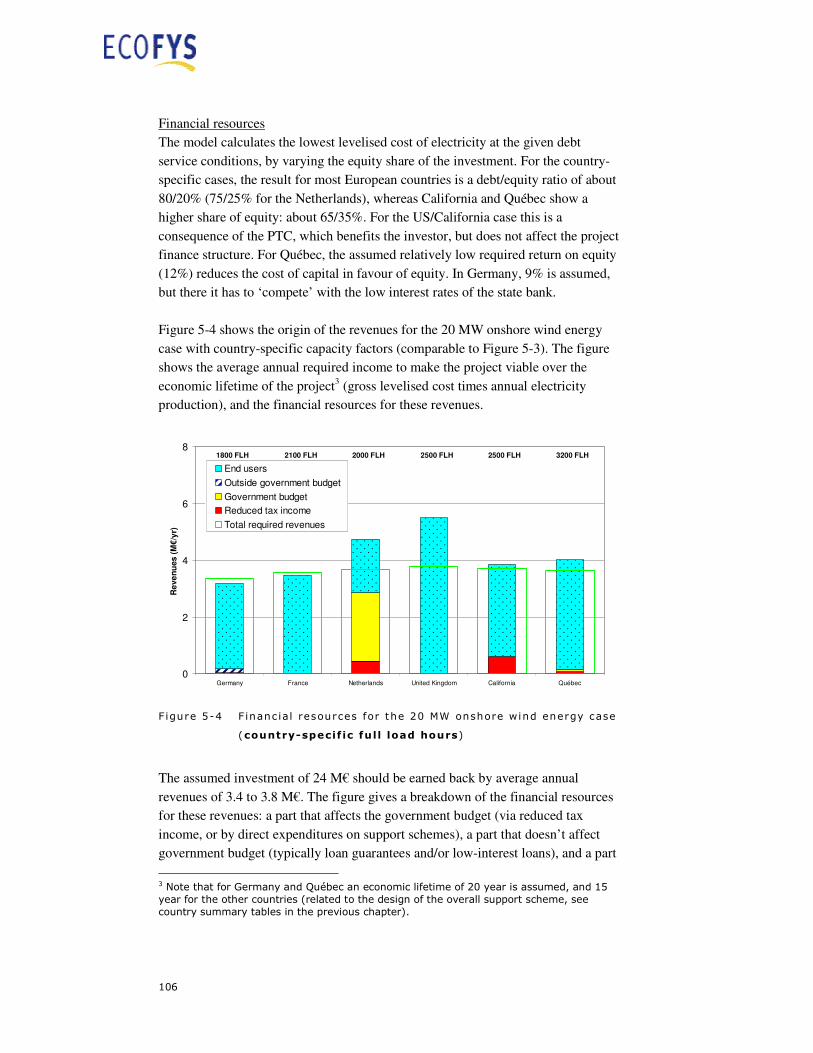
106
Financial resources
The model calculates the lowest levelised cost of electricity at the given debt
service conditions, by varying the equity share of the investment. For the country-
specific cases, the result for most European countries is a debt/equity ratio of about
80/20% (75/25% for the Netherlands), whereas California and Québec show a
higher share of equity: about 65/35%. For the US/California case this is a
consequence of the PTC, which benefits the investor, but does not affect the project
finance structure. For Québec, the assumed relatively low required return on equity
(12%) reduces the cost of capital in favour of equity. In Germany, 9% is assumed,
but there it has to ‘compete’ with the low interest rates of the state bank.
Figure 5-4 shows the origin of the revenues for the 20 MW onshore wind energy
case with country-specific capacity factors (comparable to Figure 5-3). The figure
shows the average annual required income to make the project viable over the
economic lifetime of the project3 (gross levelised cost times annual electricity
production), and the financial resources for these revenues.
0
2
4
6
8
Germany France Netherlands United Kingdom California Québec
Re
ve
nu
es
(M
€/y
r)
End users
Outside government budget
Government budget
Reduced tax income
Total required revenues
1800 FLH 2100 FLH 2000 FLH 2500 FLH 2500 FLH 3200 FLH
Figure 5-4 F inanc ial resources for the 20 MW onshore wind energy case
(country-specif ic ful l load hours)
The assumed investment of 24 M€ should be earned back by average annual
revenues of 3.4 to 3.8 M€. The figure gives a breakdown of the financial resources
for these revenues: a part that affects the government budget (via reduced tax
income, or by direct expenditures on support schemes), a part that doesn’t affect
government budget (typically loan guarantees and/or low-interest loans), and a part
3 Note that for Germany and Québec an economic lifetime of 20 year is assumed, and 15 year for the other countries (related to the design of the overall support scheme, see country summary tables in the previous chapter).
107
that is paid by end-users (via their electricity bill). It should be noted that not all
revenues are equally spread over the economic lifetime of the project. For instance
the investment tax deduction in the Netherlands can typically be claimed one year
after investments have been made (about 2.6 M€ for this particular example).
The figure shows that most schemes are designed to have limited direct impact on
the government budget, except for the Netherlands. Fiscal measures are important
in the Netherlands, and in the US and to a lesser extent in Canada (where they are
implemented at the federal level). The impact on the government budget and the
related risk of budget overruns has resulted in stop-and-go policies in the
Netherlands (both for the feed-in premium and the investment tax deduction) and is
one of the elements contributing to the relative high cost of capital. The total end-
user costs in the UK are in fact higher than depicted here, as part of the value of the
ROC stays at the energy utility with an obligation.

108
5.3 Offshore wind energy (100 MW)
-60
-40
-20
0
20
40
60
80
100
120
140
160
A B C D E F G H I A B C D E F G H I A B C D E F G H I A B C D E F G H I A B C D E F G H I A B C D E F G H I
(Eff
ect
on
) L
ev
elise
d c
os
t o
f ele
ctr
icit
y (
€/M
Wh
e)
Germany France Netherlands United Kingdom California Québec
Figure 5-5 Level ised cost of e lectr ic i ty and e f fect of support schemes
for offshore wind energy (default, 3000 full load hours)
-60
-40
-20
0
20
40
60
80
100
120
140
160
A B C D E F G H I A B C D E F G H I A B C D E F G H I A B C D E F G H I A B C D E F G H I A B C D E F G H I
(Eff
ec
t o
n)
Le
velis
ed
co
st
of
ele
ctr
icity
(€
/MW
he
)
Germany France Netherlands United Kingdom California Québec
Figure 5-6 Level ised cost of e lectr ic i ty and e f fect of support schemes
for offshore wind energy (variant, 3500 full load hours)
LegendDefault country
A Default financial parameters, 10 year debtB Default country, with country-specific financial parameters
Country case
C No supportD Plus effect of fiscal measuresE Plus effect of debt measuresF Plus effect of investment grants
G Plus effect of production supportH Energy salesI Potential of additional cost reductions
109
Figure 5-5 and Figure 5-6 show the results for the assessment for offshore wind
energy for both the default (3000 full load hours, FLH) and variant (3500 FLH)
case (2006 situation).
Overall economic viability
The figures show that offshore wind energy projects are economically viable for the
variant case in all countries but Germany. For the lower default case, only France
and the Netherlands enable viable projects (despite the higher assumed return on
equity of 18%). The over-support in the Netherlands was a consequence of the
higher than expected electricity market prices (see section 5.2). The premium was
set to 0 €/MWhe at May 10, 2005 (so the figure actually shows the early 2005
situation). As the Netherlands didn’t have a clear concession or exclusivity policy
for offshore wind energy, project applications were put on hold for a long time.
When this stopped, a huge number of project applications were received, with the
tariff reduction as an immediate response. The stop-and-go nature of the policy
support, and the fact that the licensing procedure does not show predictable
outcomes, results in high regulatory risks for the project developer. Nevertheless,
by 2008 two offshore wind projects are operational – one corporate financed and
one project financed.
Despite the fact that Germany has no major offshore wind energy projects in
operation, and that the level of policy support is insufficient to make projects
viable, the risks of the German market are perceived to be lower. The German
government is pro-actively trying to remove institutional and market barriers and
market actors expect that feed-in tariffs will be increased to reflect market
conditions. For instance, in 2006 the transmission system operators (TSOs) were
made responsible for grid connection of offshore wind energy projects. This is
expected to result in significant cost savings (see below), due to the different
financing conditions of the TSOs and the fact that grid connection of projects will
be combined.
The situation in the UK is also favourable for offshore wind energy: the
government has ambitious plans for offshore wind energy and consequently has a
similar pro-active approach as in Germany. The current design of the obligation
scheme and the resulting market conditions, are not favourable for project financed
projects in moderate wind regimes (see default case). Most projects are currently
corporate financed. But the proposed introduction of differentiated support will
likely change this.
For France no experience with offshore wind energy exists. Favourable sites with
relative low seawater depths may be scarce.
110
Effect of support instruments
All countries show significant reductions in the levelised cost of electricity as
compared to the default case (bar C compared to A in the figures), by about 20%.
The reason is identical to the case for onshore wind energy, with an important
impact from the longer economic lifetimes used as a consequence of the support
schemes in place. Due to the development stage and higher technological risk of
offshore wind energy, overall values for return on equity and debt service coverage
ratio are assumed to be higher than for onshore wind energy.
The effect of the support schemes is similar to the situation for onshore wind
energy, with some minor differences. For instance, in the Netherlands offshore
wind energy was not eligible for financing from low-interest Green Funds. And in
France, the period of support is extended from 15 years (onshore) to 20 years for
offshore wind energy.
The investment cost for offshore wind energy projects has been increasing
significantly in the past few years. Higher steel prices, and the high demand for
onshore wind turbines in the US has resulted in scarcity and high prices for
offshore wind turbines (project costs well above 3000 €/kW, as compared to the
2200 €/kW used for the assessment for 2006). The feed-in tariff and premium
schemes can adjust their price levels at specific time intervals to accommodate for
these changes in cost levels. The UK system is currently less flexible as changes in
market design parameters can affect the viability of new and existing projects.
Potential of additional cost reductions
For all countries additional cost reductions could be achieved (ranging from 10 to
20 €/MWhe). Due to the development stage of offshore wind energy, risk prevails
at all levels: technological, regulatory and financial. It is expected that overall
investment costs can be significantly reduced by technological improvements on
both turbine, foundation, grid and system integration. The same is true for the risks
and associated cost of capital.
Here the effect of two additional policy support measures is illustrated: (i) making
grid connection the responsibility of transmission system operators, and (ii) making
meteo data available to project developers.
(i) Grid connection by transmission system operator
By making the transmission system operator (TSO) responsible for the grid
connection of the offshore wind energy projects, the cost of capital can be reduced.
The TSO will finance the project on its own balance sheet or will have access to
cheap loans under favourable conditions. With grid connection investments being
in the range of 400 to 500 €/kW (or about 20% of the total project cost, here
111
assumed to be 2200 €/kW (2006)), levelised cost can be reduced by more than 15
€/MWhe (3500 FLH case for the Netherlands), of which roughly 5 €/MWhe as a
direct consequence of the reduced cost of capital. Also investment costs can be
reduced: several wind projects could be jointly connected to one offshore grid, or
wind energy projects could be combined with offshore electricity production from
natural gas. These additional cost savings are estimated to be in the order of 5
€/MWhe or more, due to the higher utilisation rates of the offshore grid4.
(ii) Make meteo data available to project developers
Wind resource data are often not available for offshore situations. For lenders this
adds to the risk of the project. If governments arrange the availability of monitored
meteo data (e.g. by investing in offshore meteo platforms) loan conditions could be
improved, e.g. a reduction of one or more percent points of the interest rate, and a
reduction of about 0.1 in the DSCR (e.g. from 1.4 to 1.3). When we apply these
assumptions to the 3500 FLH Netherlands case, levelised cost of electricity is
reduced by more than 2 €/MWhe.
Financial resources
As compared to onshore wind energy projects, the debt/equity ratio for offshore
projects is shifted slightly towards more equity: ranging from 75/25% to 70/30%.
This is notably a consequence of the higher debt service requirements.
The distribution of the financial resources is is similar as depicted for the onshore
wind energy cases. The 100 MW (3500 FLH) case with an investment of 220 M€
requires annual revenues of about 35 M€.
4 See for example the Supergrid proposal from Airtricity (http://www.airtricity.com/ireland/wind_farms/supergrid/) and the POSEIDON vision of Econcern (www.poseidonenergy.com).

112
5.4 Solar photovo l ta ic energy (0 .5 MW)
-200
-100
0
100
200
300
400
500
600
A B C D E F G H I A B C D E F G H I A B C D E F G H I A B C D E F G H I A B C D E F G H I A B C D E F G H I
(Eff
ect
on
) L
ev
elise
d c
os
t o
f ele
ctr
icit
y (
€/M
Wh
e)
Germany France California Germany France California
950 FLH 950 FLH 950 FLH 1400 FLH 1400 FLH 1400 FLH
Default: 950 full load hours Variant: 1400 full load hours
Figure 5-7 Level ised cost of e lectr ic i ty and e f fect of support schemes
for solar photovoltaic energy (default , 950 full load hours
and variant, 1400 full load hours)
LegendDefault country
A Default financial parameters, 10 year debtB Default country, with country-specific financial parameters
Country case
C No supportD Plus effect of fiscal measuresE Plus effect of debt measures
F Plus effect of investment grants
G Plus effect of production supportH Energy salesI Potential of additional cost reductions
Figure 5-7 shows the results for the assessment for solar photovoltaic open space
installations for both the default (950 full load hours, FLH) and variant (1400 FLH)
case (2006 situation).
Overall economic viability
The figure clearly shows that solar-PV projects in Germany are economically
viable in the 950 FLH default case (which is representative for many sites in
Germany), whereas projects in France and California only become viable in the
higher 1400 FLH variant case (which is more representative for those countries).
Both the German and French feed-in tariffs are independent of solar irradiation, but
as indicated, French projects are only feasible with higher annual solar irradiation.
The break-even point for France lies at about 1350 FLH. The feed-in premium in
California results in overall levelised cost of electricity close to the end-user price
of electricity (about 2 €/MWhe lower).

113
Effect of support instruments
The reductions in the levelised cost of electricity as compared to the default country
are 30% (Germany, France) and about 22% (California). This is a consequence of
the design (feed-in vs. feed-in premium) and period (20 year in Germany and
France, 5 year in California) of the main support scheme.
Again, fiscal and debt measures have an important contribution in reducing the
levelised cost of solar-photovoltaic projects, but the main component is either feed-
in tariff or premium.
Financial resources
The debt/equity ratio resulting in the lowest levelised cost of electricity is for
Germany and France about 80/20%, and for California 70/30%, resulting in a
slightly higher overall leveleised cost of electricity.
The 500 kW project with an investment of 1.75 M€ requires annual revenues of
about 0.2 M€. The financial resources for this project are shown in Figure 5-8.
California has a significant contribution from both state and federal government
budgets. The support scheme is typically designed for relatively small projects,
integrated in the facilities or houses of the end-users, with the intention to reduce
end-use consumption (notably during peak hours). For this a government funded
programme may be a suitable way to introduce this technology in a short period of
time.
0.0
0.1
0.2
0.3
0.4
0.5
Germany France California Germany France California
Re
ve
nu
es
(M
€/y
r)
End users
Outside government budget
Government budget
Reduced tax income
Total required revenues
Default: 950 full load hours Variant: 1400 full load hours
Figure 5-8 Financia l resources for the 0.5 MW solar-photovoltai c energy
case (950 and 1400 full load hours)
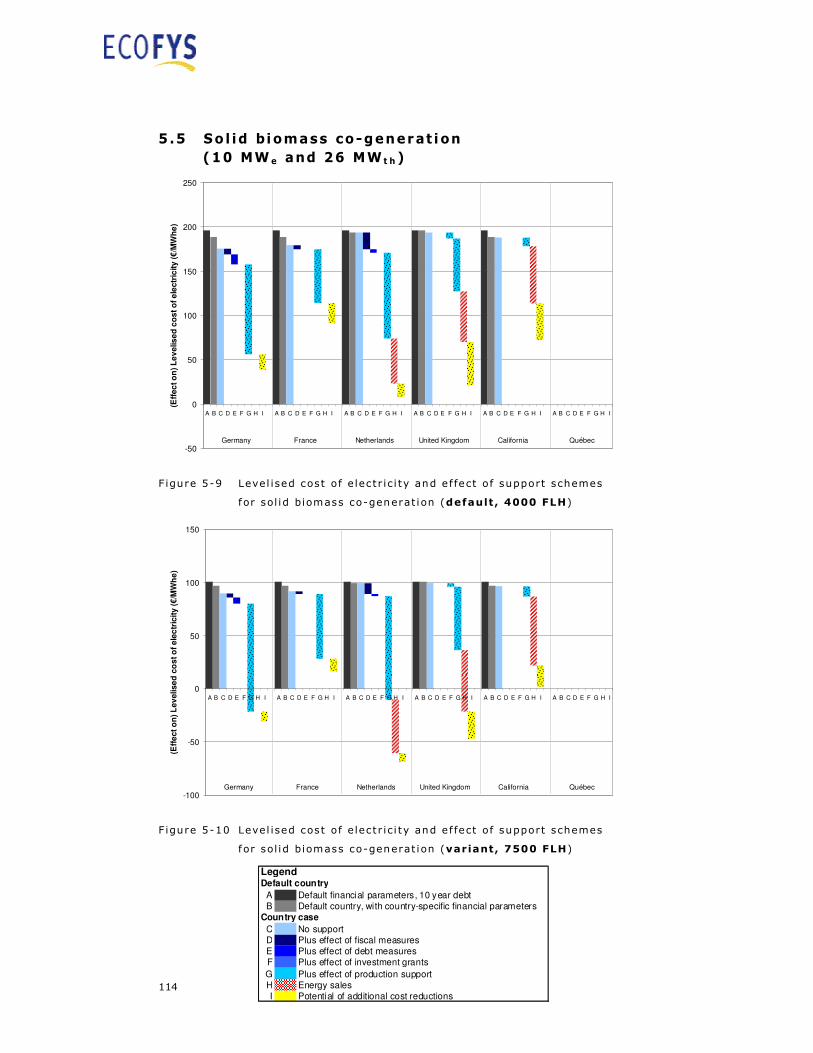
114
5.5 Sol id biomass co-generat ion
(10 MW e and 26 MW t h)
-50
0
50
100
150
200
250
A B C D E F G H I A B C D E F G H I A B C D E F G H I A B C D E F G H I A B C D E F G H I A B C D E F G H I
(Eff
ec
t o
n)
Le
velis
ed
co
st
of
ele
ctr
icity
(€
/MW
he
)
Germany France Netherlands United Kingdom California Québec
Figure 5-9 Level ised cost of e lectr ic i ty and e f fect of support schemes
for sol id biomass co-generat ion (default , 4000 FLH)
-100
-50
0
50
100
150
A B C D E F G H I A B C D E F G H I A B C D E F G H I A B C D E F G H I A B C D E F G H I A B C D E F G H I
(Eff
ect
on
) L
ev
elise
d c
os
t o
f ele
ctr
icit
y (
€/M
Wh
e)
Germany France Netherlands United Kingdom California Québec
Figure 5-10 Level ised cost of e lectr ic i ty and e f fect of support schemes
for sol id biomass co-generat ion (variant, 7500 FLH)
LegendDefault country
A Default financial parameters, 10 year debtB Default country, with country-specific financial parameters
Country case
C No supportD Plus effect of fiscal measuresE Plus effect of debt measuresF Plus effect of investment grants
G Plus effect of production supportH Energy salesI Potential of additional cost reductions

115
Figure 5-9 and Figure 5-10 show the results for the assessment for the solid
biomass co-generation project (10 MWe and 26 MWth) for both the default (4000
FLH) and variant (7500 FLH) case for the year 2006.
Overall economic viability
The figures show that the biomass-CHP cases are only economically viable for
some countries in the high-FLH variant case (with the technical and economic
assumptions presented in Table 4-3 and Table 5-1). The 4000 FLH case (typically
used for heating during autumn and winter), is only viable at negative fuel costs
(e.g. –0.5 €/GJ for the German case, as compared to the 3 €/GJ used in the current
cases), which would imply that the fuel is actually a waste product for which
treatment costs could be charged. Fuel cost can be higher if actual heat prices are
higher than assumed here (5.5 €/GJ).
The 7500 FLH variant case (typically located near an (industrial) unit with a more
or less constant annual heat demand) would be viable in Germany, the Netherlands
and the United Kingdom. The break-even point for the German case would be at
either 6000 full load hours or about 4.5 €/GJ biomass fuel cost. For France the
break-even point would be at about 1 €/GJ fuel cost. Both Germany and France
incorporate co-generation in the determination of the level of the feed-in tariff: 20
€/MWhe for Germany and a maximum of 12 €/MWhe in France. The German feed-
in scheme further makes a distinction between different biomass resource and
conversion technologies and also provides a premium for innovative technologies.
The Dutch premium scheme is based on the assumption that biomass co-generation
will not be applied in the Netherlands. It hence results in an over-support for the
current case. Without heat production and a 30% electrical efficiency, the levelised
cost would increase from about -10 to 35 €/MWhe, which would make the project
still economically viable at electricity contract prices of about 50 €/MWhe (where
32 €/MWhe was the original assumption for the cost calculations).
In the UK the biomass cases are assumed to be eligible for an investment subsidy of
1.4 M€ (total investment 32.5 M€). The overall effect on the levelised cost of
electricity is about 3.5 €/MWhe. The effect of the market price of ROC and LEC in
combination with the market price for ‘grey’ electricity makes the 7500 FLH case a
viable one.
In California the Market Price Referents are not sufficient to support these
particular cases. The 7500 FLH variant case is economically viable at fuel costs
below 1.5 €/GJ. The production tax credit reduces levelised cost by almost 10
€/MWhe.
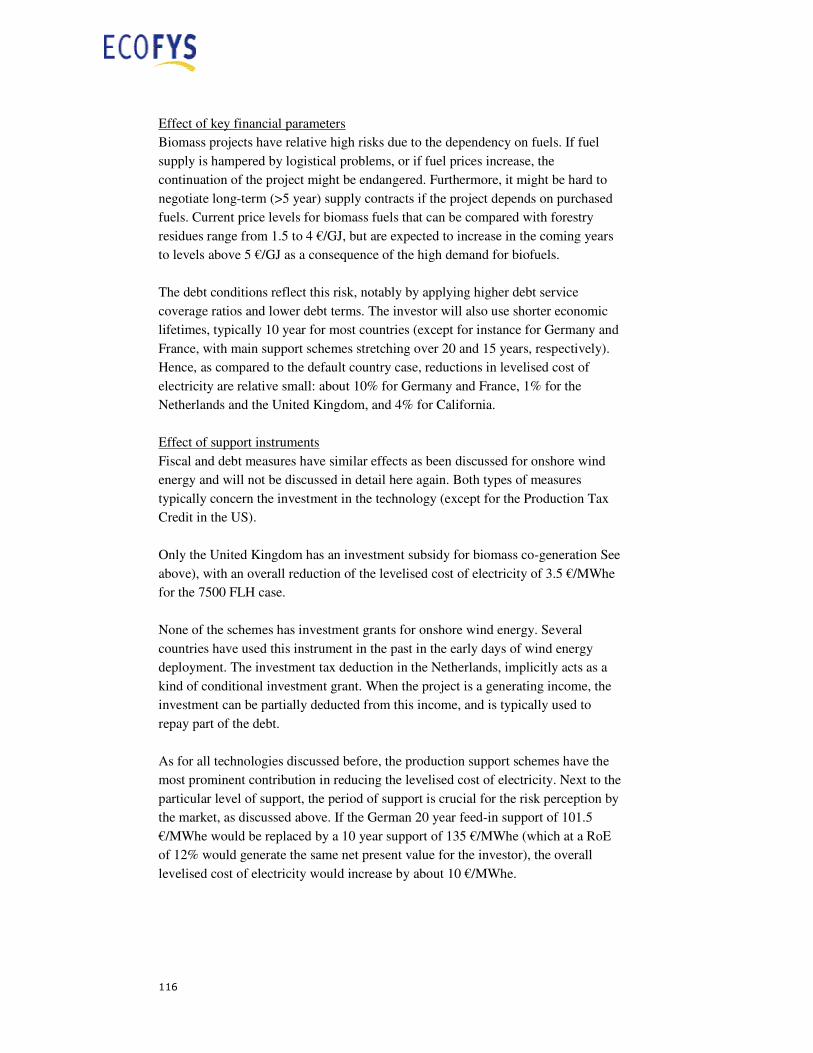
116
Effect of key financial parameters
Biomass projects have relative high risks due to the dependency on fuels. If fuel
supply is hampered by logistical problems, or if fuel prices increase, the
continuation of the project might be endangered. Furthermore, it might be hard to
negotiate long-term (>5 year) supply contracts if the project depends on purchased
fuels. Current price levels for biomass fuels that can be compared with forestry
residues range from 1.5 to 4 €/GJ, but are expected to increase in the coming years
to levels above 5 €/GJ as a consequence of the high demand for biofuels.
The debt conditions reflect this risk, notably by applying higher debt service
coverage ratios and lower debt terms. The investor will also use shorter economic
lifetimes, typically 10 year for most countries (except for instance for Germany and
France, with main support schemes stretching over 20 and 15 years, respectively).
Hence, as compared to the default country case, reductions in levelised cost of
electricity are relative small: about 10% for Germany and France, 1% for the
Netherlands and the United Kingdom, and 4% for California.
Effect of support instruments
Fiscal and debt measures have similar effects as been discussed for onshore wind
energy and will not be discussed in detail here again. Both types of measures
typically concern the investment in the technology (except for the Production Tax
Credit in the US).
Only the United Kingdom has an investment subsidy for biomass co-generation See
above), with an overall reduction of the levelised cost of electricity of 3.5 €/MWhe
for the 7500 FLH case.
None of the schemes has investment grants for onshore wind energy. Several
countries have used this instrument in the past in the early days of wind energy
deployment. The investment tax deduction in the Netherlands, implicitly acts as a
kind of conditional investment grant. When the project is a generating income, the
investment can be partially deducted from this income, and is typically used to
repay part of the debt.
As for all technologies discussed before, the production support schemes have the
most prominent contribution in reducing the levelised cost of electricity. Next to the
particular level of support, the period of support is crucial for the risk perception by
the market, as discussed above. If the German 20 year feed-in support of 101.5
€/MWhe would be replaced by a 10 year support of 135 €/MWhe (which at a RoE
of 12% would generate the same net present value for the investor), the overall
levelised cost of electricity would increase by about 10 €/MWhe.

117
Potential of additional cost reductions
For all countries additional cost reductions could be achieved (ranging from about 7
to 26 €/MWhe for the 7500 FLH case). A stable RES policy and support scheme
periods that are close to the technical lifetime of the project help to reduce costs.
The continuous discussion on the sustainability of various biomass conversion
routes (notably held in Europe for instance on palm oil) has forced several projects
to look for new biomass resources. Clarity in that respect can reduce regulatory risk
significantly and can contribute to the creation of a (large) sustainable market for
biofuels.
But bio-energy has some additional project risks that are more difficult to address
by policies and measure: the fuel supply and fuel price risk. The creation of larger
biomass markets can help to reduce these risks and/or to make future changes in
supply and demand more predictable. Another option could be to combine biomass
storage and logistics of multiple projects. This could reduce the minimum debt
service coverage ratio or the biomass reserve of individual projects, as required by
lenders.
0
2
4
6
8
10
12
14
Germany France Netherlands United Kingdom California Québec
Re
ve
nu
es
(M
€/y
r)
End users
Outside government budget
Government budget
Reduced tax income
Total required revenues
Figure 5-11 Financia l resources for the 10 MWe/26 MWth sol id biomass
co-generat ion (7500 full load hours)
Financial resources
The biomass co-generation project requires an investment of 32.5 M€. The model
calculations result in debt/equity ratios of 70/30% to 60/40% for most countries.
For the Netherlands this is slightly higher (75/25%) as a combined effect of the
investment tax deduction and the low-interest Green Fund. The project would in
118
California result in a 42% equity share (with the Production Tax Credit not
affecting the debt/equity ratio).
Figure 5-11shows the origin of the revenues for the 10 MWe / 26 MWth biomass
co-generation plant. Annual revenues ranging from 6.7 to 7.5 M€ are required.
Again the Netherlands show a large impact on government budgets (note that the
Dutch scheme was not designed fo biomass co-generation and assumed lower
electricity market prices).
From the above some specific conclusions can be drawn for bio-energy support
schemes: For schemes that are based on feed-in tariffs or feed-in premiums, the
correct calculation of levelised cost of electricity is elementary. Most of these
schemes aim to provide enough incentives to invest in these RES-E technologies,
but want to prevent over-support. For this the type of biomass used (as for instance
applied in Germany), the capacity class of the conversion unit (Germany,
Netherlands), and the overall conversion efficiency (France) needs to be
incorporated. As fuel prices are expected to increase with grower demand, frequent
adjustment may be required and the system should allow for these modifications.
119
6 Conclusions and recommendations
6.1 Long-term commitment
� A favourable generic and RES-specific investment climate can result in levelised
cost savings ranging from 10-30% in selected cases. These savings can be
attributed to reductions in the cost of capital.
� Policies and measures and associated support schemes that anticipate on the risk
perception by investors and lenders, have lowest costs of capital. In designing
support schemes, the expertise of the financial sector should be involved.
Reducing actual and perceived risks for market actors results in lower financing
costs for renewable energy technologies. As discussed in chapter 2, these risks are
notably high for the project development phase and operation phase of renewable
energy projects. These risks are or can be susceptible for (changes in) generic and
RES-specific policies and measures. So what is the recipe for a good policy that
effectively reduces cost of capital, and hence levelised cost of electricity and
required additional financial (government) support?
Too often the debate is restricted to a discussion on the benefits and drawbacks of
feed-in tariffs schemes vs. feed-in premium schemes vs. obligation schemes vs.
tendering schemes. We plea for a more comprehensive approach, that incorporates
the full spectrum of support instruments applied in different policy contexts, as
illustrated by the example given in the text box on the next page.
The example shows that before looking at the exact design of the various elements
in the support scheme, a clear political and societal long-term commitment towards
renewable energy is required. Based on this, a stable and reliable support
mechanism can be designed, that effectively meets the policy goal, at acceptable
levels of investor risk, and at acceptable social costs. Commitment, stability,
reliability and predictability are all elements that increase confidence of market
actors, reduce regulatory risks, and hence significantly reduce cost of capital and
overall societal cost. A proper translation of this commitment in the design and
timeframe of the support instruments, is the key challenge in this respect. In the
previous chapter we have shown that the effect can be significant: reductions in
levelised cost of electricity can be achieved ranging from 10 to 30% as compared to
a default country that has no particular RES policies in place.

120
In this report we have used a quantitative cash flow analysis to assess the effect of
various design elements on the levelised cost of electricity of several country /
technology cases, which are project financed (2006 situation). The impact of
different financial parameters on this levelised cost was assessed, based on the
more qualitative information provided in the country characterisations. Here we
will summarise and conclude on several of these design elements.
6.2 Removing r i sk by removing barr iers
� Policies that improve the success rate of the project development phase will
reduce the project investment and hence levelised energy costs of renewable
energy technologies. This refers to amongst others:
� Improving permitting procedures (e.g. pre-planning, streamlining and
simplification of procedures, one-stop agencies, maximum response
periods)
� Improving grid connection procedures (e.g. technical and operational
standards, transparent procedures, non-discriminatory access)
� A stable and predictable long-term policy context will contribute to this improved
success rate and reduce both investment cost and cost of capital.
The overall effect on the cost of capital of removing barriers is hard to quantify.
The direct effect on the levelised cost of electricity can be in the range of 5 to 10%
due to increased project cost. But a poor development climate will also result in a
higher required return on equity, which could result in an increase in levelised cost
of the same order of magnitude.
Offshore wind energy in Germany and the Netherlands
The success of the German support for renewable energy is more than just the feed-in
tariff. Until recently the German feed-in tariff was not sufficient to make offshore wind
energy economically viable. As a consequence no (remote) large offshore wind projects
were commissioned. In the Netherlands two offshore wind projects are in operation,
established with sufficient financial support, but after quite long lead times. So, at first
sight, the Dutch scheme has been more effective. However, a project developer with
exclusive rights for a wind project in the German part of the Continental Shelf can sell
its project at a good price, whereas projects at the Dutch part are currently hard - if
not impossible - to sell. The difference is the commitment of the German government
as perceived by market actors. They see the German government pro-actively
removing barriers and are confident that feed-in tariffs will be adjusted to a viable
level. In the Netherlands, they have seen many changes in the design and levels of
support (with a 0 €/MWhe feed-in premium since 2005), and many institutional and
regulatory barriers that restrict the further deployment of offshore wind energy.
121
With detailed renewable energy resource data (notably relevant for on- and offshore
wind energy), projects can be financed at more favourable loan conditions, e.g.
lower interest rates (several percent points) and debt service coverage ratios (e.g.
from 1.4 to 1.3). Governments can invest or participate in data acquisition (similar
to practices common in oil and natural gas exploration), which will reduce overall
levelised cost of electricity (e.g. several percent for offshore wind energy). In
tendering procedures this will significantly reduce the overall costs of that process,
to be borne by all project developers, while only benefitting a few.
The various actions that can be taken to remove existing barriers were not
addressed in this report in detail, but are summarised in section 3.1. They are often
country and technology specific and are already extensively described in reports for
other IEA Implementing Agreements and for the European Commission1.
6.3 Removing r isk by shar ing r i sk
The deployment of renewable energy technologies still requires policy support,
both in terms of removal of institutional barriers and in providing support to make
these technologies economically viable. This makes renewables susceptible for
changes in policies, especially when the cost of the policy instruments are financed
via the government budget. For some countries market actors consider these
regulatory risks to be high, resulting in relative high cost of capital.
Governments or government-related entities can reduce the cost of capital by
directly removing part of this risk from the project. Here some examples are given,
but risk sharing is also an important element in the subsequent sections:
Loan guarantee programmes
As presented in section 3.5 government loan guarantees can be important in
reducing the cost of capital for renewables. The option is not encountered in the
country cases, but has proven to be successful in other areas. By underwriting all or
part of the debt for a project, lenders have significant lower risk in case of default
or underperformance of the project. This risk reduction is translated in lower
interest rates (e.g. 1-2%, resulting in reductions upto 5-10% in the levelised cost of
electricity), but potentially also in longer debt terms and more favourable debt
service requirements with even higher reductions in the cost of capital. One can
even consider to prescribe these favourable debt conditions (e.g. 20 year debt term)
in order to receive a loan guarantee.
If properly designed and managed, the societal or government cost of a loan
guarantee programme is marginal, or even positive, due to the lower financial
1 E.g. IEA Wind Energy (2006), IEA PVPS (2007), IEA Bioenergy (2007), OPTRES (2007)

122
support needs for renewable energy. The loan guarantee fund can be financed via
government loans (with typically low interest rates) or via insurance premiums to
be paid by the projects2.
Project participation
The government can also act as equity provider by participating in renewable
energy projects, directly or indirectly via government bodies. Doing so, a clear
signal is given to other investors and lenders that the government is committed to
the deployment of renewable energy and that regulatory risk will be addressed and
reduced. In oil and natural gas exploration and exploitation these kind of
government participation models are common, generating income to the
government. Government participation has several benefits:
• it in effect and effectively removes part of the project risk from conventional
investors and lenders;
• as government bodies can loan at lower interest rates (down to 2%, with
significant securities in place), they can be satisfied with a lower return on
equity resulting in a lower cost of capital for the project;
• the participation will generate income to the government;
• participation will provide feedback on the economics and implementation
barriers of large renewable energy projects and enables the government to
adjust its policies with a better understanding of markets; and
• the attitude that can be summarised as ‘practice what you preach’ or ‘put your
money where your mouth is’, results in a lower risk perception by market
actors and hence lower cost of capital.
The effect of this model on the government budget will be positive when properly
designed and managed: With cost of capital being reduced, the cost of renewable
electricity and required level of support will be lower, resulting in lower societal
and/or government cost. At the same time the participation activities will generate
income.
Government participation was not encountered in the country cases of this report,
but in analogy to the experience in the oil and natural gas sector, this model could
be applied to the renewable energy sector. Due to transaction costs, it is envisaged
that notably large-scale projects should be eligible. Notably projects that are
affected by several risk classes (e.g. project level risk, regulatory risk, and market
risk), would benefit from this participation model.
2 Harris and Navarro (1999)

123
Investing in infrastructure
By making the transmission system operator (TSO) responsible for the grid
connection of the offshore wind energy projects, both project cost and cost of
capital can be reduced. The TSO will finance the project on its own balance sheet
or will have access to cheap loans under favourable conditions. Levelised cost of
electricity can be reduced by more than 15%, of which roughly 5% as a direct
consequence of the reduced cost of capital. Also investment costs can be reduced:
several wind projects could be jointly connected to one offshore grid, or wind
energy projects could be combined with offshore electricity production from
natural gas. These additional cost savings are estimated to be in the order of 5% or
more, due to the higher utilisation rates of the offshore grid.
Share or remove market risks
The first tender round for onshore wind energy in Québec incorporated a
mechanism to correct for inflation, and changes in currency exchange rates and
steel prices. Doing so, the risk of price changes was not to be carried by the project
consortium, but by the utility that would purchase the electricity after
commissioning of the project. The effect is twofold: the market risk premium can
be significantly reduced, and the utility has more certainty that projects will
actually be developed.
6.4 Investment subs idies
In the country cases one example of investment subsidies was encountered for
biomass co-generation in the UK. In this particular example, the overall effect on
the levelised cost of electricity is relatively small. An important effect of
investment subsidies is the attention they give to certain technologies. Furthermore,
they remove part of the risk to the equity provider (see previous paragraph) and
reduce the amount of (higher cost) equity. In general, investment subsidies are
believed to be more effective at the demonstration and market introduction phase,
than during the deployment phase with a larger emphasis on stimulating production
of renewable energy. Investment grants could be converted in equity (government
participation) or debt after successful commissioning of a project. Doing so the
effect on the government budget can be kept to a minimum.
124
6.5 Debt measures
Policies that anticipate on risk assessment practices by lenders can reduce costs of
capital significantly:
� Create market conditions and design support schemes that result in debt terms
being close to technical lifetimes (e.g. longer duration of production support and
power purchase agreements (PPAs)).
� Take measures that result in lower interest rates, e.g.:
- offer low (state bank) interest rates
- offer tax deductions for investments in renewable energy funds
- facilitate the collection and disclosure of site-specific resource and other
relevant data, such as meteorological, geological or bathymetric data (e.g.
wind, solar, wave and tidal energy resource)
� Facilitate the demonstration of new technologies that will result in improved
knowledge on the risk profiles of these technologies and hence reduce the debt
service requirements and required return on equity for future projects.
Low-interest loans
In the country cases the following instruments where addressed: low-interest
government loans (e.g. from state banks in Germany) and low-interest loans from
green funds (via tax-free bonds, e.g. in the Netherlands). The latter category is in
effect a tax deduction for investors in capital funds that provide loans to renewable
energy projects. The discount on the interest rate is typically in the range of 1-2%,
depending on the fiscal system. As illustrated for several country and technology
cases the direct overall effect of these kind of debt schemes is upto 5-10% on
levelised cost of electricity. But indirectly they can affect other key financial
parameters used by investors and other lenders, such as the economic lifetime, debt
term and debt service conditions. The KfW Umwelt Program (which is restricted to
10 M€ per project) in Germany has a maturity of 20 years. Together with the 20
year term of the feed-in scheme this results in a longer economic lifetime used by
the investor and hence a lower cost of electricity. By offering a redemption free
period (e.g. of 3 year) a reduction in the cost at the beginning of the operation phase
can be achieved. This effect is missing in the green fund scheme, where the design
of the debt scheme is determined by market actors.
The effect of low-interest government loans on government budgets is limited, as
they can be kept outside these budgets. Administrative costs can be kept at
reasonable levels. For tax-free bonds the government will be faced with a reduction
in the tax income (equalling upto 5-10% of the levelised cost of electricity). This
makes this policy instrument more susceptible to changes in policies.
As discussed in section 6.3, loan guarantee programmes can have similar direct and
indirect effects.

125
6.6 Fiscal measures
� General or RES-specific fiscal policies that allow for flexibility in fiscal depreciation,
can reduce the levelised cost of renewable energy.
� Short fiscal depreciation terms and/or schemes with large initial depreciation of
assets have the highest cost reductions.
� Flexibility in terms of tax loss carry-back or -forward should be offered to RES
projects.
In this report the following fiscal measures were encountered: tax-free bonds
(discussed in the previous section), investment tax deduction (Netherlands),
production tax credit (PTC, in the US), and flexible/accelerated depreciation
schemes (US, Canada). All fiscal measures are directly affecting tax income and
hence are susceptible for changes in policies (albeit that in the political arena a
reduced tax income is not as visible as increased government expenses). For
instance, the stop-and-go situation of the PTC in the US has had a direct impact on
the deployment of wind energy in the US. Fiscal measures require from the project
financing perspective (an often significant) net positive income to fully benefit
from the offered tax deduction potential. This may result in more or less complex
legal and financial structures, that are set up to reap these benefits. This adds to the
transaction cost of the project and could be considered as a cost of capital.
Investment tax deduction
The investment tax deduction can have a significant effect on the levelised cost of
electricity, upto 10% as shown for the cases in the Netherlands. The investment tax
deduction in the Netherlands implicitly acts as a kind of conditional investment
grant. When the project is generating income, the investment can be partially
deducted from this income, and is typically used to repay part of the debt. The
benefit to the project is usually somewhat smaller than the direct tax deduction
effect. For larger projects complex legal/financial structures have been set up in the
past in order to reap the tax benefits. The annual budget for the tax deduction
scheme is determined each year. In the UK a first-year 40% capital allowance is
given for small and medium enterprises, which typically could benefit renewable
energy production special purpose companies. Solar-PV receives a 30% investment
tax credit in the US.
As with investment subsidies, the investment tax deduction does not necessarily
result in a higher or more efficient production of renewable energy. For this reason
it should be supplementary to other production support instruments.
Production tax credit
The production tax credit in the US is an example of tax deductions related to
renewable energy production. The investor can deduct 19 US$ from his taxable
126
income for each produced MWh of electricity and a period of 10 years. As already
addressed, the investor may not always be capable to fully utilise this tax credit.
Another important factor is that the credit only benefits the investor (and not the
project), typically resulting in higher equity shares. The cost of capital would be
lower if the 19 US$/MWhe would be offered as a direct production incentive. For
the 2500 FLH onshore wind energy case in California, the equity share would be
reduced from 34% to 19% in our default model calculations, with a reduction in the
levelised cost of electricity of 61 €/MWhe by about 1%.
Flexible/accelerated depreciation schemes
Both the US and Canada have implemented accelerated depreciation schemes as
support instrument for specific renewable energy technologies. Accelerated
depreciation results in larger tax deductions in the first years of operation, whith the
highest net rpesent value for the investor. In the US onshore wind energy can be
depreciated in 5 years (5 year Modified Accelerated Cost Recovery System
(MACRS) at the federal level, but 150% declining balance for the state tax in
California). Canada has a 20 year, 50% accelerated declining balance scheme as
compared to the conventional 6% (in 2006) declining balance scheme. The effect
on the levelised cost of electricity is 1% (California) to 4% (Canada) for the cases
discussed in this report. However, if we assume that in the Californian case all tax
benefits of the MACRS could be transferred to parties with sufficient opportunities
for tax deduction, the levelised cost would be reduced by upto 10-15%. For
instance, the 2500 FLH onshore wind energy case would see its levelised cost being
reduced from 61 to 53 €/MWhe, with a 7 €/MWhe direct contribution from the
MACRS.
The UK has an enhanced capital allowance for certified co-generation projects. The
tax benefits of the 100% first-year ECA can not be carried forward to subsequent
years, which makes it not interesting for a real project financing case without any
provisions to deduct negative EBT (earnings before taxes) from other taxable
income. This measure is hence more favourable for corporate financing and was not
incorporated in the analysis for this study.
In the past the Netherlands had a flexible depreciation scheme, which offered
investors an elegant tool to minimise their corporate taxes.
Other fiscal measures
Other fiscal measures include tax-free bonds (as discussed in section 6.5) and
various other tax exemptions, such as sales tax or local property tax exemptions.
They can be used to reduce the up-front cost of a project, upto percentages of
several tens (depending on the specific fiscal regimes), implicitly acting as an
investment subsidy.2

127
6.7 Product ion support
Feed-in tariff (FIT) and -premium (FIP) schemes
The most important element of FIP and FIT schemes is that they fully (FIT) or
partially (FIP) remove the market risks of a project during a fixed period of time.
The longer this period of guaranteed prices, the lower the cost of capital. Because
of this, FIT/FIP have in general a relatively large debt schare. For the technologies
considered in this report (on- and offshore wind energy, solar photovoltaic energy
and biomass co-generation) a timeframe of 15 to 20 years is preferred. In feed-in
premium schemes the risk of variations in electricity market prices is reflected by a
premium in the tariff in the purchase power agreement. It may be hard to acquire a
PPA with the same 15 to 20 year tenure at reasonable risk premium levels.
Other production incentives: In some schemes a certain production incentive is
given for each unit of renewable electricity produced over a given period of time
(e.g. 10 CAN$/MWh over 10 year, in the EcoENERGY for Renewable Power in
Canada). This production incentive is not intended to fully bridge the gap between
electricity market prices and the price of renewable electricity, but apart from
generating additional revenues, it contributes to removing part of the market risks
for a project.
If other support instruments are aligned with the design of the production support
(e.g. same period of support as the debt terms in low-interest government loans),
the effect on key financial parameters will be enhanced. Some FIT schemes
(Germany, France) have both a high initial and lower basic feed-in tariff. The high
initial tariff provides in a front loading of the payment stream, resulting in lower
levelised cost of electricity. For instance, if the 3500 FLH offshore wind energy
case for Germany would receive a fixed tariff over 20 year (instead of a higher
initial tariff for the first 12.8 year) with the same net present value to the investor,
levelised cost would increase by more than 1%.
It should be borne in mind that a proper policy design encompasses more than just
reducing risks. In many FIT/FIP and other production incentive schemes, special
attention is given to prevent over-support of renewable energy production (see
section 3.2). The country cases in this report showed examples of the use of
technology and project-specific feed-in tariffs or -premiums, and the possibility to
correct for changes in market price developments. This does not have to affect the
cost of capital, when properly applied and in a stable policy context.

128
Tendering schemes
The tendering schemes discussed in this report (Québec, California) all result in
guaranteed project-specific contract prices for a specific period of time. The
tendering process is used to let the market determine what the required level of
support should be. After winning the tender, a project developer has certainty about
his operating income and can use and negotiate favourable financing terms. The
project development phase has higher risks, as not all bids will be successful. (See
also section 6.3 for the Québec case).
Obligation schemes
The cost of capital will generally be higher for obligation schemes due to both
higher market risks and perceived regulatory risks. The certificate market - by its
design - can not offer a fixed price directly as is the case in FIT/FIP schemes.
Furthermore, the level and timeframe of the obligation as well as other key design
parameters (e.g. penalties, issuing of certificates), are set by government policies
and hence susceptible to policy changes. This results in lower contract periods in
the PPA, lower debt terms and higher debt reserve conditions, or, in other words, in
a higher levelised cost of electricity. The comparative assessment in chapter 5
showed that the levelised cost of electricity in the UK (without support instruments)
are the highest of all countries. However, because of the current design of the UK
scheme, the UK levelised cost of electricity after incorporation of the various policy
instruments shows one of the lowest and/or even negative levelised cost results.
The over-support of the UK obligation scheme provides enough appetite to invest
in RES-E technologies, but societal costs may be considered to be too high.
Reducing the cost of capital in quota obligation schemes can be achieved via
various routes, but is not as easily done as with FIT and FIP schemes. A strong
government commitment towards the scheme is essential in this respect. Changes in
the scheme can seriously affect the continuity of existing projects and have to be
applied with specific care. For FIT/FIP schemes this is not an issue as the FIT/FIP
for existing projects is not (or: should not be) affected by new policies. Increasing
the economic lifetime, the contract period in the PPA, and the debt maturity will
reduce the cost of capital. This could be achieved via the instruments discussed
above: by setting favourable conditions in loan guarantees, (low-interest)
government loans and/or government participation. The government can also oblige
obligated parties to offer long-term contracts. This will be reflected in a risk
premium, but – provided that a competitive market is functioning – this premium
can be minimised. The main advantage is that the financing cost will be reduced
due to the increased security.
The production tax credit is discussed in section 6.6 above.
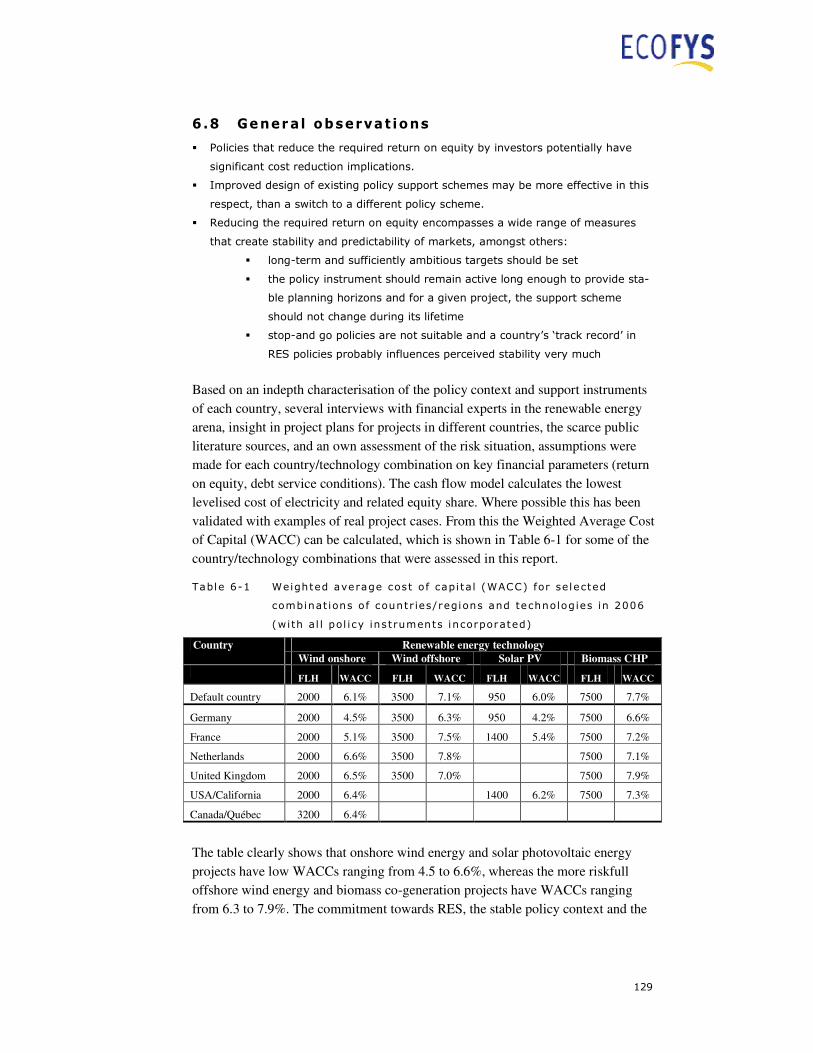
129
6.8 General observat ions
� Policies that reduce the required return on equity by investors potentially have
significant cost reduction implications.
� Improved design of existing policy support schemes may be more effective in this
respect, than a switch to a different policy scheme.
� Reducing the required return on equity encompasses a wide range of measures
that create stability and predictability of markets, amongst others:
� long-term and sufficiently ambitious targets should be set
� the policy instrument should remain active long enough to provide sta-
ble planning horizons and for a given project, the support scheme
should not change during its lifetime
� stop-and go policies are not suitable and a country’s ‘track record’ in
RES policies probably influences perceived stability very much
Based on an indepth characterisation of the policy context and support instruments
of each country, several interviews with financial experts in the renewable energy
arena, insight in project plans for projects in different countries, the scarce public
literature sources, and an own assessment of the risk situation, assumptions were
made for each country/technology combination on key financial parameters (return
on equity, debt service conditions). The cash flow model calculates the lowest
levelised cost of electricity and related equity share. Where possible this has been
validated with examples of real project cases. From this the Weighted Average Cost
of Capital (WACC) can be calculated, which is shown in Table 6-1 for some of the
country/technology combinations that were assessed in this report.
Table 6-1 Weighted average cost of capi tal (WACC) for selected
combinat ions of countr ies/regions and technologies in 2006
(with al l pol icy instruments incorporated)
Renewable energy technology Country Wind onshore Wind offshore Solar PV Biomass CHP
FLH WACC FLH WACC FLH WACC FLH WACC
Default country 2000 6.1% 3500 7.1% 950 6.0% 7500 7.7%
Germany 2000 4.5% 3500 6.3% 950 4.2% 7500 6.6%
France 2000 5.1% 3500 7.5% 1400 5.4% 7500 7.2%
Netherlands 2000 6.6% 3500 7.8% 7500 7.1%
United Kingdom 2000 6.5% 3500 7.0% 7500 7.9%
USA/California 2000 6.4% 1400 6.2% 7500 7.3%
Canada/Québec 3200 6.4%
The table clearly shows that onshore wind energy and solar photovoltaic energy
projects have low WACCs ranging from 4.5 to 6.6%, whereas the more riskfull
offshore wind energy and biomass co-generation projects have WACCs ranging
from 6.3 to 7.9%. The commitment towards RES, the stable policy context and the
130
contribution of the low-interest government loan result in systematic lower WACCs
for Germany. The UK and the Netherlands show higher results because of the
higher uncertainties of either their scheme or their policy context.
To put the given WACCs in perspective: for investments by the energy sector in
conventional energy technologies, typical values for WACCs would be about 7 to
8% for the default country, due to the lower debt/equity ratio (e.g. 60%/40%
debt/equity, 12% required return on equity).
Keep the financing of the support scheme outside the government budget
The history of the stop-and-go implementation of the production tax credit in the
US, and the several changes in the design and levels of the Dutch support scheme,
both illustrate the importance of keeping support instruments outside the
government budget. As illustrated in Figure 5-4, Figure 5-8 and Figure 5-11, the
support scheme in the Netherlands has a particular high dependency on government
budgets. Because of the experiences in the past, this results in higher perceived
risks by market actors and hence higher cost of capital.
Consider the different financing models in the design of policy support schemes
To our knowledge this report is the first to make a comparative assessment of all support instruments for different technologies in different countries from a project
financing perspective. With the renewable energy market developing fast, financing
models can be expected to develop fast as well. This can have significant
consequences for the optimal design of support instruments. As illustrated in
several examples throughout the report, some fiscal facilities can not be fully
utilised by projects, due to lack of taxable income. Corporate financing results in
rather different levelised cost of electricity due to the lack of debt, the different cost
of capital, and fiscal context. Especially for feed-in tariff and feed-in premium
schemes, where the support levels have to be calculated with certain financial
assumptions, a deviation from for instance the default debt/equity ratio can have
significant effects.
In designing support schemes, all market actors should be involved. Especially
investment funds and banks will be able to provide feedback on the risks related to
the design of these instruments. On the one hand, a simple, coherent set of
instruments is preferred to a (quasi-)sophisticated scheme; whereas on the other
hand, detail is needed to avoid windfall profits or high societal costs of the support
scheme. Finding the right balance is the key challenge of this process.
131
References
Agnolucci, P. (in press): The effect of financial constraints, technological progress
and long-term contracts on tradable green certificates. Energy Policy (2007),
article in press.
DENA, 2005 (DENA Grid study): Energiewirtschaftliche Planung für die
Netzintegration von Windenergie in Deutschland an Land und Offshore bis
zum Jahr 2020, Deutschen Energie-Agentur (DENA), Köln, Germany, 24
February 2005, available at www.dena.de
CANMET, 1998/2007: Class 43.1 Technical Guide and Technical Guide to
Canadian Renewable and Conservation Expenses (CRCE), Ottawa, Natural
Resources Canada, 1998/revised 2007
Cleijne, H. and W. Ruijgrok, 2004: Modelling risks of renewable energy
investments. Reportr of the project “Deriving optimal Promotion Strategies for
Increasing the Share of RES-E in a Dynamic European Electricity Market,
Green-X; KEMA, Netherlands, July 2004
De Noord, M. and E.J.W. van Sambeek, 2003: Methodology for financial gap
calculations (in Dutch), ECN, ECN-C—03-077, Petten, Netherlands, 2003
Dunlop, J, 2006: Wind power project returns – What should equity investors
expect?; Journal of Structured Finance, Spring 2006, p. 81-89
Ernst & Young, 2007: Impact of banding the Renewables Obligation – costs of
electricity production. Study for UK Department of Trade and Industry, URN
07/948, London UK, April 2007
Eurelectric, 2007: The role of electricity. A new path to secure, competitive energy
in a carbon-constrained world; Eurelectric, Brussels, June 2007
European Commission, 2005: Communication from the Commission on the support
of RES-E, COM (2005) 627
Eurostat, 2007: Taxation trends in the European Union - Data for the EU Member
States and Norway, 2007 Edition; Office for Official Publications of the
European Communities, Luxembourg, 2007 (ISBN 978-92-79-04865-4)
EWEA, 2005: Support Schemes for Renewable Energy: A Comparative Analysis of
Payment Mechanisms in the EU; European Wind Energy Association
(EWEA), Brussels, May 2005
Harris, F. and P. Navarro, 1999: Policy options for promoting wind energy
development in California: A report to the Governor and State Legislature;
University of California-Irvine, Irvine, CA, November 1999.
Hydro-Québec, 2006: Hydro-Québec and wind Power, ISBN 2-550-46825-2, 2006
132
IEA Bioenergy, 2007: Potential Contribution of Bioenergy to the World’s Future
Energy Demand; IEA Bioenergy ExCo: 2007:02, 2007
IEA PVPS, 2007: Trends in photovoltaic applications. Survey report of selected
IEA countries between 1992 and 2006; IEA Photovoltaic Power Systems
Programme, Report IEA-PVPS T1-16:2007, 2007
IEA Wind Energy, 2006: IEA Wind Energy Annual Report; Executive Committee
for the Implementing Agreement for Co-operation in the Research,
Development, and Deployment of Wind Energy Systems of the International
Energy Agency, July 2006
Kamp, L.M. (2002): Learning in wind turbine development - A comparison
between the Netherlands and Denmark; Thesis, Utrecht University, Utrecht,
ISBN 90-393-3174-X
KPMG International, 2006: KPMG’s Corporate Tax Rate Survey 2006; Publication
number 301-261, April 2006 (www.kpmg.com)
Lewis, J.I. and Wiser, R.H., 2006: Supporting Localisation of Wind Technology
Manufacturing through Large Utility Tenders in Québec: Lessons for China.
Prepared by the Center for Re-source Solutions for the Energy Foundation’s
China Sustainable Energy Program, 2006
NRCan, 2007: ecoENERGY for renewable Power Program. Terms and Conditions,
Natural Resources Canada, April 2007; see
http://www.ecoaction.gc.ca/ecoenergy-ecoenergie/power-
electricite/conditions-eng.pdf
NREL, 2006a: Projected benefits of federal energy efficiency and renewable energy
programs – FY 2007 budget request; National Renewable Energy Laboratory,
NREL/TP-620-39684, , Golden Colorado, USA, March 2006
NREL, 2006b: Power technologies energy data book - Fourth edition; National
Renewable Energy Laboratory, J. Aabakken (ed.), NREL/TP-620-39728,
Golden Colorado, USA, August 2006
OPTRES, 2007: Assessment and optimisation of renewable energy support
schemes in the European electricity market; M. Ragwitz, A. Held (Fraunhofer
ISI), G. Resch, T. Faber, R. Haas, C. Huber (EEG), R. Coenraads, M. Voogt,
G. Reece (Ecofys), P.E. Morthorst, S.Grenaa Jensen (Risø), I.
Konstantinaviciute (LEI), B. Heyder (EnBW), Karlsruhe, Germany, February
2007
Ragwitz, M., C. Huber, G. Resch, and S. White, 2003: Dynamic cost-resource
curves . Work Package 1 of the Green-X project Deriving Optimal Promotion
Strategies for Increasing the Share of RES-E in a Dynamic European
Electricity Market; FhG-ISI, EEG, and IT Power, August 2003
Ragwitz, M., Held, A., Resch, G., Faber, T., Huber, C., Haas, R., 2007: Monitoring
and evaluation of policy instruments to support renewable electricity in EU
Member States, UBA, Germany, 2007
133
Toke, D., 2003: Wind power in the UK: How planning conditions and financial
arrangements affect outcomes; International Journal of Sustainable Energy,
vol. 23, Issue 4, p. 207-216, 2003
UK-DTI, 2007: UK Biomass Strategy 2007. Working Paper 1 – Economic analysis
of biomass energy; UK Department of Trade and Industry, Energy
Technologies Unit, URN 07/950, London, UK, May 2007
UNEP, 2006: Assessment of financial risk management instruments for RE projects
in developing countries - background study; UNEP, Paris, France, April 2006
UNEP, 2007a: Assessment of financial risk management instruments for renewable
energy projects. UNEP Working Group 1 Study Report; report prepared by
Marsh, Paris, France, April 2007
UNEP, 2007b: Renewable power, policy and the cost of capital. Improving capital
market efficiency to support renewable power generation projects,
UNEP/BASE Sustainable Energy Finance Initiative (SEFI, Paris, France, April
2007
US EIA (Energy Information Administration), December 2007: Average Retail
Price of Electricity to Ultimate Customers by End-Use Sector, by State, see
http://www.eia.doe.gov/cneaf/electricity/epm/table5_6_b.html
Van Sambeek, E.J.W., H.J. de Vries, E.A. Pfeiffer, H. Cleijne, 2004: Financial gaps
of renewable electricity production technologies. Advise regarding the
determination of the MEP-subsidies for the period July to December 2006, and
2007 (in Dutch); ECN/KEMA, ECN-C--04-101, Petten, Netherlands, 2004
Van Tilburg, X., E.A. Pfeiffer, J.W. Cleijne, G.J. Stienstra, and S.M. Lensink,
2006: Technical-economic parameters of renewable electricity production
options in 2008. Draft advise financial gap calculations (in Dutch),
ECN/KEMA, ECN-E--06-025, Petten, Netherlands, 2006
Wiser, R. and E. Kahn, 1996: Alternative Windpower Ownership Structures:
Financing Terms and Project Costs; Lawrence Berkeley National Laboratory,
University of California, Berkeley, USA, LBNL-38921, May 1996
Wiser, R. and Pickle, S.: Financing Investments in Renewable Energy: The Role of
Policy Design and Restructuring, Berkeley, 1997

![A Suggestion on Mortgage Financing of Islamic Banks ... is the basic instrument of mortgage financing when the interest-free practices in the world are considered [10]. According to](https://img.pdfslide.us/doc/110x75/5a9f6b247f8b9a84178ccfdf/pdfa-suggestion-on-mortgage-financing-of-islamic-banks-is-the-basic-instrument.jpg)


![Document of The World Bank€¦ · Lending Instrument Fragile and/or Capacity Constraints [ X ] Investment Project Financing - Fragile States Financial Intermediaries [ ] Series of](https://img.pdfslide.us/doc/110x75/5fed961d225377120d5e4e35/document-of-the-world-bank-lending-instrument-fragile-andor-capacity-constraints.jpg)