Embed Size (px)
Citation preview

A&A 567, A31 (2014)DOI: 10.1051/0004-6361/201323267c© ESO 2014
Astronomy&
Astrophysics
Polarisation observations of H2O JK−1 K1 = 532−441 620.701 GHzmaser emission with Herschel/HIFI in Orion KL�,��
(Research Note)
S. C. Jones1, M. Houde1,2, M. Harwit3, M. Kidger4, A. Kraus5, C. McCoey6, A. Marston4, G. Melnick7,K. M. Menten5, P. Morris8, D. Teyssier4, and V. Tolls7
1 University of Western Ontario, Department of Physics and Astronomy, London, Ontario, N6A 3K7, Canadae-mail: [email protected]
2 Division of Physics, Mathematics and Astronomy, California Institute of Technology, Pasadena, CA 91125, USA3 Cornell University, Center for Radiophysics & Space Research, 511 H Street, SW, Washington, DC 20024-2725, USA4 Herschel Science Centre, ESAC, European Space Agency, 28691 Villanueva de la Cañada, Madrid, Spain5 Max-Planck-Institut für Radioastronomie, Auf dem Hügel 69, 53121 Bonn, Germany6 University of Waterloo, Department of Physics and Astronomy, Waterloo, Ontario, N2L 3G1, Canada7 Harvard-Smithsonian Center for Astrophysics, 60 Garden Street, MS 66, Cambridge, MA 02138, USA8 Infrared Processing and Analysis Center, California Institute of Technology, Pasadena, California, USA
Received 17 December 2013 / Accepted 4 June 2014
ABSTRACT
Context. The high intensities and narrow bandwidths exhibited by some astronomical masers make them ideal tools for studyingstar-forming giant molecular clouds. The water maser transition JK−1K1 = 532−441 at 620.701 GHz can only be observed from aboveEarth’s strongly absorbing atmosphere; its emission has recently been detected from space.Aims. We sought to further characterize the star-forming environment of Orion KL by investigating the linear polarisation of a sourceemitting a narrow 620.701 GHz maser feature with the heterodyne spectrometer HIFI on board the Herschel Space Observatory.Methods. High-resolution spectral datasets were collected over a thirteen month period beginning in 2011 March, to establish notonly the linear polarisation but also the temporal variability of the source.Results. Within a 3σ uncertainty, no polarisation was detected to an upper limit of approximately 2%. These results are compared withcoeval linear polarisation measurements of the 22.235 GHz JK−1 K1 = 616−523 maser line from the Effelsberg 100-m radio telescope,typically a much stronger maser transition. Although strongly polarised emission is observed for one component of the 22.235 GHzmaser at 7.2 km s−1, a weaker component at the same velocity as the 620.701 GHz maser at 11.7 km s−1 is much less polarised.
Key words. magnetic fields – masers – polarisation – ISM: magnetic fields
1. Introduction
The Kleinmann-Low nebula in the Orion molecularcloud 1 (OMC-1) is a high-mass star-forming region, thenearest such region in our Galaxy at 418 ± 6 pc (Kim et al.2008). Its line-of-sight velocity relative to the local standardof rest (LSR) is about 8 km s−1 (Garay et al. 1989). Sincethe discovery of the 22.235 GHz water maser transition inthe Orion molecular cloud (Cheung et al. 1969), the regionhas frequently been studied also at higher frequency masertransitions. Recently, Neufeld et al. (2013) mapped the theo-retically predicted JK−1K1 = 532−441 620.701 GHz transitionin the Kleinmann-low nebula (Orion KL) with Herschel/HIFI.Combining their observations with collocated 22.235 GHzEffelsberg data, they were able to verify a maser pumping modelarising from collisional excitation and spontaneous radiative
� Herschel is an ESA space observatory with science instrumentsprovided by European-led Principal Investigator consortia and with sig-nificant participation from NASA.�� Appendices are available in electronic form athttp://www.aanda.org
decay (Neufeld & Melnick 1991). Hereafter, we will mostlyrefer to these frequencies as 22 GHz and 621 GHz.
The first astronomical detection of the 621 GHz maser tran-sition of ortho water vapour (Neufeld & Melnick 1991) wasmade by Harwit et al. (2010). It appeared to exhibit a polari-sation of approximately 2% toward the oxygen-rich supergiantstar VY Canis Majoris, and was a few times less luminous thanthe star’s ortho-H2O 22 GHz maser. The aforementioned studyof Neufeld et al. (2013) presented the first detection of this tran-sition in an interstellar region (i.e. Orion KL). Their maps of thisregion revealed a spatially localized source emitting a strong,spectrally narrow emission feature at 621 GHz. Their discov-ery of this feature gave rise to the present attempt to determinewhether the 621 GHz feature might be linearly polarised. In alater search through the Herschel archives Neufeld et al. (2013)also found similarly narrow 621 GHz emission features emanat-ing from the Orion south condensation and the W49N regionof high-mass star formation. By then, however, the Herschelmission was ending and a search for signs of polarisation inthese features was no longer possible. To date, the HeterodyneInstrument for the Far Infrared (HIFI; de Graauw et al. 2010)onboard the Herschel Space Observatory (Pilbratt et al. 2010)
Article published by EDP Sciences A31, page 1 of 7

A&A 567, A31 (2014)
has been the sole facility capable of linear polarisation studies ofspectral lines at this frequency. Complementary circular polari-sation studies, however, have remained beyond reach.
Between March 2011 and April 2012, we obtained six setsof observations of the 621 GHz line along a sight line towardOrion KL with the Herschel/HIFI instrument. We complementedthese with observations of the 22 GHz line taken contempo-raneously with the Max-Planck-Institut für Radioastronomie(MPIfR) 100-m telescope in Effelsberg, Germany. In Sect. 2 wereport the results of these observations. We next present our po-larisation results in Sect. 3, along with a depiction of the tem-poral behaviour of the maser line over this year-long period.Finally, Sect. 4 presents our conclusions, while the tabular sum-maries of our observations, our maps of the 621 GHz watermaser, and a further discussion on pointing errors can be foundin Appendices A–C.
2. Observations
2.1. HIFI observations
HIFI enables observations in fourteen frequency bands. We ob-served the 621 GHz transition in HIFI Band 1B, which coversthe range from 562.6 to 628.4 GHz. Like all of the other HIFIbands, Band 1B houses two channels sensitive to linearly po-larised radiation, respectively, in the horizontal (H) and verti-cal (V) directions. The two channels exhibit peak sensitivitiesalong directions at angles of 82.5◦ (H) and −7.5◦ (V), relativeto the Herschel spacecraft’s y-axis, kept close to perpendicu-lar to the ecliptic plane at all times. On the sky, the H- andV-beams are offset from each other by 6.′′6, a non-negligiblefraction of the 34.′′4 full-width-half-magnitude (FWHM) beamat 620.701 GHz. Due to potential beam pointing errors, smalloffsets in the H- and V-beam from their intended positions maybe expected, leading to uncertainty in the mean beam pointingdirection. At the time of writing this was constrained to between0.′′8−0.′′9 (1σ).
Observations were conducted beginning on 14 March 2011when a small map was acquired using the HIFI “on-the-fly map-ping” (OTF) mode, as part of the HEXOS guaranteed time keyprogramme (PI: E. Bergin). A total of fifteen Nyquist-sampledpointings were implemented in a rectangular, 5 by 3 configu-ration. Spectral data were obtained with the digital autocorre-lation high-resolution spectrometer (HRS) and the Wide-Bandspectrometer (WBS). The map was centred at (RA[J2000] =05h35m13.s16, Dec[J2000] = −05◦22′00.′′5), and spanned �21.′′3in Right Ascension and �53′′ in Declination. Individual point-ings were separated by �10.′′5 in RA and �13′′ in Declination.The spectral resolution in the HRS mode was 0.125 MHz, or,equivalently, a line-of-sight velocity resolution of 0.06 km s−1.The WBS resolution was ≈1 MHz or ≈0.5 km s−1. All obser-vations used an OFF-source reference position located 14′ fromthe maser location.
Following the mapping of 14 March 2011, two pointed ob-servations were obtained that year, respectively, on 26 Marchand 8 April. Over this period the source rotated by ≈14◦ aboutthe spacecraft line-of-sight. Observations obtained at differenttimes were necessary since a minimum of two sets of measure-ments at separate source rotation angles are required for polari-sation analyses (Harwit et al. 2010). For pointed observations thecentral point on the line separating the H- and V-beam centreswas directed at two successive positions on the sky, in positionswitching mode, in order to place the centre of the H polarisa-tion beam for a given integration to coincide with the centre of
the V polarisation beam for the subsequent integration – thuscompensating for the misalignment between the beams.
After a preliminary analysis, follow-up observations wereexecuted on 25 February and 14 April 2012. The first of these,performed in position switching mode, were centred at the sameposition cited above. Thereafter, on 14 April, the last of thepointed measurements was obtained, followed on the same dayby a small map of the same dimensions as that of 14 March 2011.While the 2011 observations lasted 888 s, integrations in 2012were extended to 1683 s in order to reduce the overall noise. Theentirety of the investigation is summarised in Table A.1.
2.2. Effelsberg observations
Ground-based observations were undertaken with the 100-mEffelsberg radio telescope in tandem with the HIFI observationsof 2011 and 2012. Centred at 22 GHz, the JK−1K1 = 616−523 tran-sition of ortho water vapour, our observations consisted of linearpolarisation signals obtained from two orthogonal channels ofthe K-band (1.3 cm) receiver located at the primary focus of thetelescope. The Effelsberg beam profile can be approximated asa Gaussian with a FWHM of 41.′′0. The frequency resolutionof each dataset was 6.104 kHz, corresponding to a velocity res-olution of 0.082 km s−1, and the spectra were calibrated usingcorrections for gain-elevation and atmospheric attenuation.
Our measurements were composed of pairs of scans obtainedat different source parallactic angles in each of the years 2011and 2012. In 2011, the first scan at 17:45 UT on 21 March,lasting one hour, was followed by a second scan recordedat 20:09 UT the same day, the source having rotated by approxi-mately 23◦ by then. In 2012, pairs of observations were taken on21 March and 18 April with corresponding source parallactic an-gle rotations of ≈67◦ and ≈16◦, respectively. All of these pointedobservations were collocated with the HIFI centre position. Atthe same epochs, maps were also produced that were useful inmore accurately describing the maser environment. A completesummary of the Effelsberg data is provided in Table A.2.
3. Methods/results
3.1. Polarisation analysis
As explained in Harwit et al. (2010), HIFI does not provide reg-ular 45◦ spacings with which the computation of the Stokes Qand U parameters is simplest. Instead, we must rely on the posi-tion angles (PA) listed in Table A.1 for the vertical polarisationdirection, with the horizontal axis at PA+90◦. The Stokes Q andU can then be calculated using the analysis detailed in Harwitet al. (2010), from which the polarisation fraction and angle areevaluated with
p =√
Q2 + U2/I (1)
θ = 0.5 arctan(U/Q), (2)
respectively, with I the total intensity. As explained below, thisanalysis has been applied to our entire set of HIFI 621 GHz data,with the 2011 and 2012 data sets combined to yield a single po-larisation result of sufficient precision. The Effelsberg 22 GHzmeasurements were not affected by the same constraints andwere considered separately for the respective 2011 and 2012 datasets.
A31, page 2 of 7
S. C. Jones et al.: Polarisation observations of a 620.701 GHz water maser transition in Orion KL (RN)
3.2. HIFI data
The entire suite of observations listed in Table A.1 was con-sidered, although only the centre position of each of the maps(ObsIDs 1342215920-1 and 1342244411-2), where the maserintensity was strongest, was selected for analysis. All data wereprocessed with version 8 of the Herschel interactive processingenvironment (HIPE). Following an improvement in the absolutepointing error (APE) of the Herschel pointing products effec-tive 19 Feb. 2012 (observation day 1011) the reported centre ofthe beam is accurate to within 0.′′8−0.′′9 (1σ) for both positionswitching and OTF observations. Throughout our observationswe found all pointings to lie within �0.′′4 in Right Ascensionand �2.′′4 in Declination.
As shown in Table A.1, the position angles of the telescoperanged more widely across the observing epochs in 2012 thanin 2011. When combined with the 2011 data the three addi-tional datasets of 2012 reduced the noise in polarisation intensity(pI) from �85 mK to �17 mK. Both the Stokes U and Q noiseintensities dropped appreciably as well, to �32 and �14 mK,respectively.
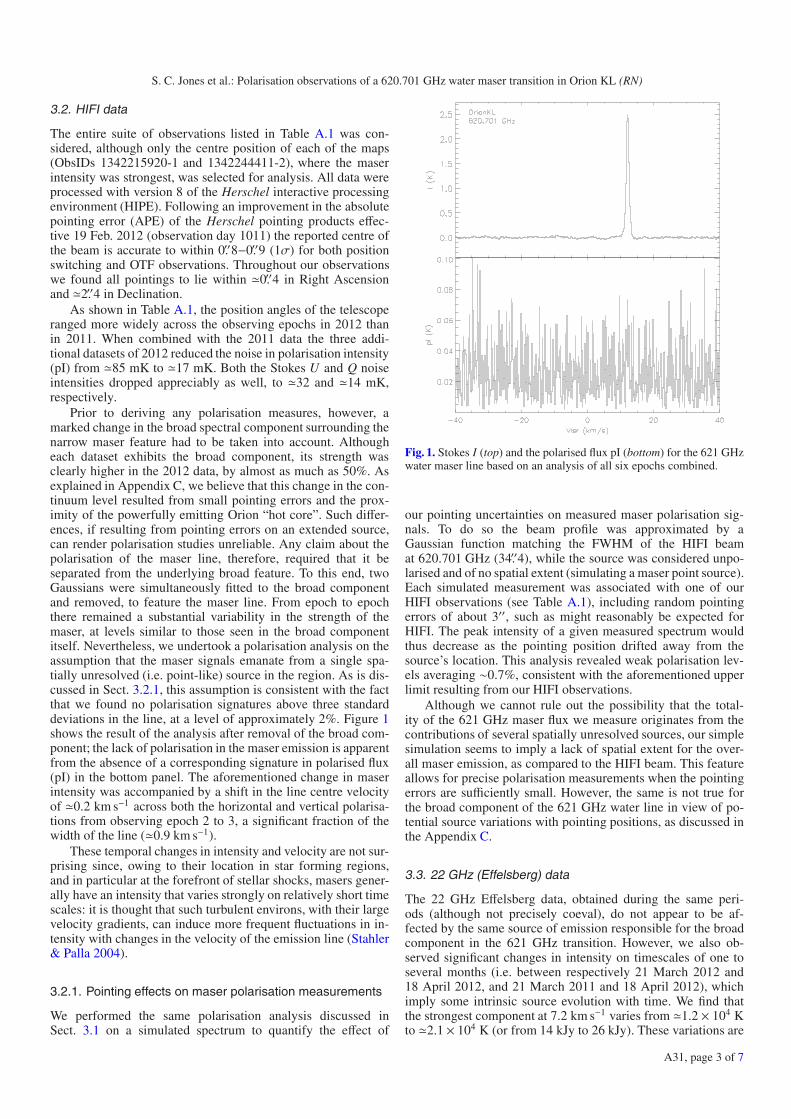
Prior to deriving any polarisation measures, however, amarked change in the broad spectral component surrounding thenarrow maser feature had to be taken into account. Althougheach dataset exhibits the broad component, its strength wasclearly higher in the 2012 data, by almost as much as 50%. Asexplained in Appendix C, we believe that this change in the con-tinuum level resulted from small pointing errors and the prox-imity of the powerfully emitting Orion “hot core”. Such differ-ences, if resulting from pointing errors on an extended source,can render polarisation studies unreliable. Any claim about thepolarisation of the maser line, therefore, required that it beseparated from the underlying broad feature. To this end, twoGaussians were simultaneously fitted to the broad componentand removed, to feature the maser line. From epoch to epochthere remained a substantial variability in the strength of themaser, at levels similar to those seen in the broad componentitself. Nevertheless, we undertook a polarisation analysis on theassumption that the maser signals emanate from a single spa-tially unresolved (i.e. point-like) source in the region. As is dis-cussed in Sect. 3.2.1, this assumption is consistent with the factthat we found no polarisation signatures above three standarddeviations in the line, at a level of approximately 2%. Figure 1shows the result of the analysis after removal of the broad com-ponent; the lack of polarisation in the maser emission is apparentfrom the absence of a corresponding signature in polarised flux(pI) in the bottom panel. The aforementioned change in maserintensity was accompanied by a shift in the line centre velocityof �0.2 km s−1 across both the horizontal and vertical polarisa-tions from observing epoch 2 to 3, a significant fraction of thewidth of the line (�0.9 km s−1).
These temporal changes in intensity and velocity are not sur-prising since, owing to their location in star forming regions,and in particular at the forefront of stellar shocks, masers gener-ally have an intensity that varies strongly on relatively short timescales: it is thought that such turbulent environs, with their largevelocity gradients, can induce more frequent fluctuations in in-tensity with changes in the velocity of the emission line (Stahler& Palla 2004).
3.2.1. Pointing effects on maser polarisation measurements
We performed the same polarisation analysis discussed inSect. 3.1 on a simulated spectrum to quantify the effect of
Fig. 1. Stokes I (top) and the polarised flux pI (bottom) for the 621 GHzwater maser line based on an analysis of all six epochs combined.
our pointing uncertainties on measured maser polarisation sig-nals. To do so the beam profile was approximated by aGaussian function matching the FWHM of the HIFI beamat 620.701 GHz (34.′′4), while the source was considered unpo-larised and of no spatial extent (simulating a maser point source).Each simulated measurement was associated with one of ourHIFI observations (see Table A.1), including random pointingerrors of about 3′′, such as might reasonably be expected forHIFI. The peak intensity of a given measured spectrum wouldthus decrease as the pointing position drifted away from thesource’s location. This analysis revealed weak polarisation lev-els averaging ∼0.7%, consistent with the aforementioned upperlimit resulting from our HIFI observations.
Although we cannot rule out the possibility that the total-ity of the 621 GHz maser flux we measure originates from thecontributions of several spatially unresolved sources, our simplesimulation seems to imply a lack of spatial extent for the over-all maser emission, as compared to the HIFI beam. This featureallows for precise polarisation measurements when the pointingerrors are sufficiently small. However, the same is not true forthe broad component of the 621 GHz water line in view of po-tential source variations with pointing positions, as discussed inthe Appendix C.
3.3. 22 GHz (Effelsberg) data
The 22 GHz Effelsberg data, obtained during the same peri-ods (although not precisely coeval), do not appear to be af-fected by the same source of emission responsible for the broadcomponent in the 621 GHz transition. However, we also ob-served significant changes in intensity on timescales of one toseveral months (i.e. between respectively 21 March 2012 and18 April 2012, and 21 March 2011 and 18 April 2012), whichimply some intrinsic source evolution with time. We find thatthe strongest component at 7.2 km s−1 varies from �1.2 × 10⁴ Kto �2.1 × 10⁴ K (or from 14 kJy to 26 kJy). These variations are
A31, page 3 of 7
A&A 567, A31 (2014)
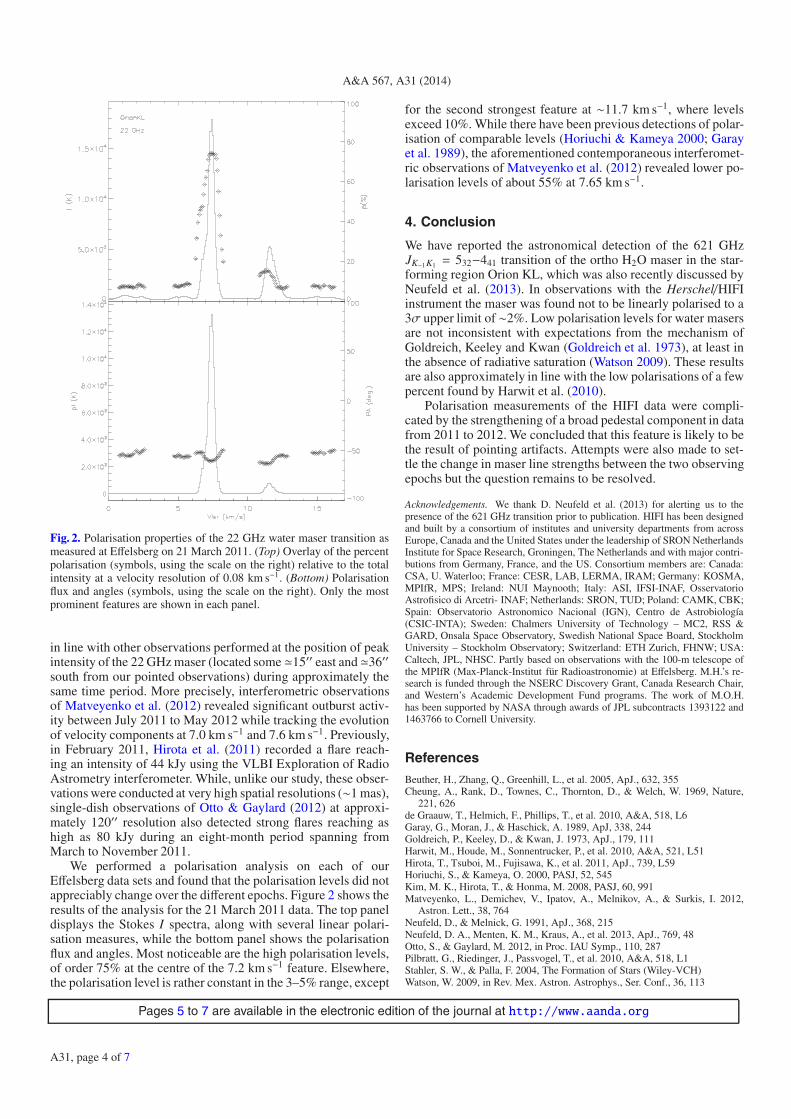
Fig. 2. Polarisation properties of the 22 GHz water maser transition asmeasured at Effelsberg on 21 March 2011. (Top) Overlay of the percentpolarisation (symbols, using the scale on the right) relative to the totalintensity at a velocity resolution of 0.08 km s−1. (Bottom) Polarisationflux and angles (symbols, using the scale on the right). Only the mostprominent features are shown in each panel.
in line with other observations performed at the position of peakintensity of the 22 GHz maser (located some �15′′ east and�36′′south from our pointed observations) during approximately thesame time period. More precisely, interferometric observationsof Matveyenko et al. (2012) revealed significant outburst activ-ity between July 2011 to May 2012 while tracking the evolutionof velocity components at 7.0 km s−1 and 7.6 km s−1. Previously,in February 2011, Hirota et al. (2011) recorded a flare reach-ing an intensity of 44 kJy using the VLBI Exploration of RadioAstrometry interferometer. While, unlike our study, these obser-vations were conducted at very high spatial resolutions (∼1 mas),single-dish observations of Otto & Gaylard (2012) at approxi-mately 120′′ resolution also detected strong flares reaching ashigh as 80 kJy during an eight-month period spanning fromMarch to November 2011.
We performed a polarisation analysis on each of ourEffelsberg data sets and found that the polarisation levels did notappreciably change over the different epochs. Figure 2 shows theresults of the analysis for the 21 March 2011 data. The top paneldisplays the Stokes I spectra, along with several linear polari-sation measures, while the bottom panel shows the polarisationflux and angles. Most noticeable are the high polarisation levels,of order 75% at the centre of the 7.2 km s−1 feature. Elsewhere,the polarisation level is rather constant in the 3–5% range, except
for the second strongest feature at ∼11.7 km s−1, where levelsexceed 10%. While there have been previous detections of polar-isation of comparable levels (Horiuchi & Kameya 2000; Garayet al. 1989), the aforementioned contemporaneous interferomet-ric observations of Matveyenko et al. (2012) revealed lower po-larisation levels of about 55% at 7.65 km s−1.
4. Conclusion
We have reported the astronomical detection of the 621 GHzJK−1K1 = 532−441 transition of the ortho H2O maser in the star-forming region Orion KL, which was also recently discussed byNeufeld et al. (2013). In observations with the Herschel/HIFIinstrument the maser was found not to be linearly polarised to a3σ upper limit of ∼2%. Low polarisation levels for water masersare not inconsistent with expectations from the mechanism ofGoldreich, Keeley and Kwan (Goldreich et al. 1973), at least inthe absence of radiative saturation (Watson 2009). These resultsare also approximately in line with the low polarisations of a fewpercent found by Harwit et al. (2010).
Polarisation measurements of the HIFI data were compli-cated by the strengthening of a broad pedestal component in datafrom 2011 to 2012. We concluded that this feature is likely to bethe result of pointing artifacts. Attempts were also made to set-tle the change in maser line strengths between the two observingepochs but the question remains to be resolved.
Acknowledgements. We thank D. Neufeld et al. (2013) for alerting us to thepresence of the 621 GHz transition prior to publication. HIFI has been designedand built by a consortium of institutes and university departments from acrossEurope, Canada and the United States under the leadership of SRON NetherlandsInstitute for Space Research, Groningen, The Netherlands and with major contri-butions from Germany, France, and the US. Consortium members are: Canada:CSA, U. Waterloo; France: CESR, LAB, LERMA, IRAM; Germany: KOSMA,MPIfR, MPS; Ireland: NUI Maynooth; Italy: ASI, IFSI-INAF, OsservatorioAstrofisico di Arcetri- INAF; Netherlands: SRON, TUD; Poland: CAMK, CBK;Spain: Observatorio Astronomico Nacional (IGN), Centro de Astrobiología(CSIC-INTA); Sweden: Chalmers University of Technology – MC2, RSS &GARD, Onsala Space Observatory, Swedish National Space Board, StockholmUniversity – Stockholm Observatory; Switzerland: ETH Zurich, FHNW; USA:Caltech, JPL, NHSC. Partly based on observations with the 100-m telescope ofthe MPIfR (Max-Planck-Institut für Radioastronomie) at Effelsberg. M.H.’s re-search is funded through the NSERC Discovery Grant, Canada Research Chair,and Western’s Academic Development Fund programs. The work of M.O.H.has been supported by NASA through awards of JPL subcontracts 1393122 and1463766 to Cornell University.
References
Beuther, H., Zhang, Q., Greenhill, L., et al. 2005, ApJ., 632, 355Cheung, A., Rank, D., Townes, C., Thornton, D., & Welch, W. 1969, Nature,
221, 626de Graauw, T., Helmich, F., Phillips, T., et al. 2010, A&A, 518, L6Garay, G., Moran, J., & Haschick, A. 1989, ApJ, 338, 244Goldreich, P., Keeley, D., & Kwan, J. 1973, ApJ., 179, 111Harwit, M., Houde, M., Sonnentrucker, P., et al. 2010, A&A, 521, L51Hirota, T., Tsuboi, M., Fujisawa, K., et al. 2011, ApJ., 739, L59Horiuchi, S., & Kameya, O. 2000, PASJ, 52, 545Kim, M. K., Hirota, T., & Honma, M. 2008, PASJ, 60, 991Matveyenko, L., Demichev, V., Ipatov, A., Melnikov, A., & Surkis, I. 2012,
Astron. Lett., 38, 764Neufeld, D., & Melnick, G. 1991, ApJ., 368, 215Neufeld, D. A., Menten, K. M., Kraus, A., et al. 2013, ApJ., 769, 48Otto, S., & Gaylard, M. 2012, in Proc. IAU Symp., 110, 287Pilbratt, G., Riedinger, J., Passvogel, T., et al. 2010, A&A, 518, L1Stahler, S. W., & Palla, F. 2004, The Formation of Stars (Wiley-VCH)Watson, W. 2009, in Rev. Mex. Astron. Astrophys., Ser. Conf., 36, 113
Pages 5 to 7 are available in the electronic edition of the journal at http://www.aanda.org
A31, page 4 of 7

S. C. Jones et al.: Polarisation observations of a 620.701 GHz water maser transition in Orion KL (RN)
Appendix A: Summary of Herschel/HIFI and Effelsberg observations
Table A.1. Summary of HIFI observations conducted in 2011 and 2012.
Observation Observation Observation Date System temperature Position anglea Modenumber day (OD) ID (ObsID) Tsys (K) (V/H) PA (◦)1V/H 666 1342215918-9 2011 Mar. 3 97/98 266.2 OTF Mapping2V/H 666 1342215920-1 2011 Mar. 3 97/97 266.2 OTF Mapping3V/H 681 1342216838-9 2011 Mar. 26 97/97 273.6 Pointed4V/H 694 1342218904-5 2011 Apr. 8 97/98 280.0 Pointed5V/H 1017 1342239637-8 2012 Feb. 25 68/84 258.9 Pointed6a-V/H 1066 1342244409-10 2012 Apr. 14 68/84 284.1 Pointed6b-V/H 1066 1342244411-2 2012 Apr. 14 68/84 284.1 OTF Mapping
Notes. (a) Position of the HIFI vertical polarisation axis relative to north, increasing eastward.
Table A.2. Summary of Effelsberg observations conducted in 2011 and 2012.
Observation Date System temperature Parallactic angle Modenumber Tsys (K) (V/H) (PA) (◦)1a-V/H 2011 Mar. 21 91/81 6.1 Pointing1b-V/H 2011 Mar. 21 115/103 28.9 Pointing2a-V/H 2012 Mar. 21 108/95 –30.3 Pointing2b-V/H 2012 Mar. 21 134/117 37.0 Pointing3a-V/H 2012 Apr. 18 94/81 19.2 Pointing3b-V/H 2012 Apr. 18 136/118 34.9 Pointing
A31, page 5 of 7
A&A 567, A31 (2014)
Appendix B: Herschel/HIFI Maps of 621 GHz watermaser
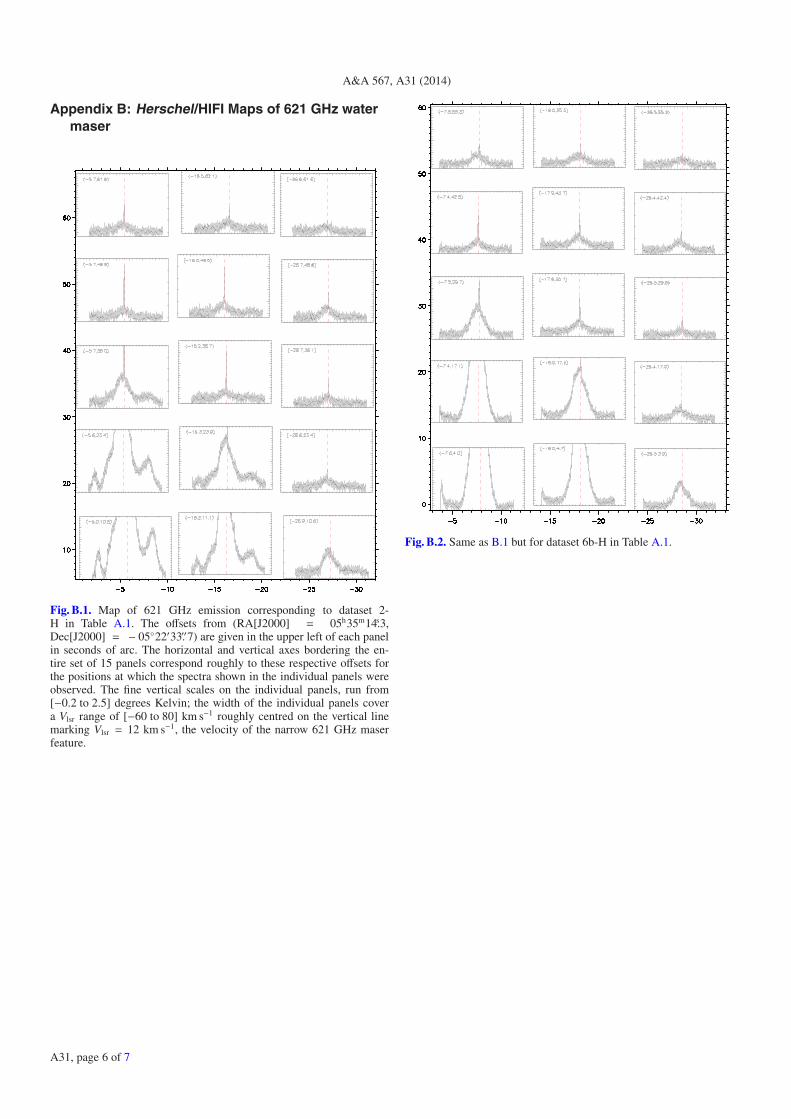
Fig. B.1. Map of 621 GHz emission corresponding to dataset 2-H in Table A.1. The offsets from (RA[J2000] = 05h35m14.s3,Dec[J2000] = − 05◦22′33.′′7) are given in the upper left of each panelin seconds of arc. The horizontal and vertical axes bordering the en-tire set of 15 panels correspond roughly to these respective offsets forthe positions at which the spectra shown in the individual panels wereobserved. The fine vertical scales on the individual panels, run from[−0.2 to 2.5] degrees Kelvin; the width of the individual panels covera Vlsr range of [−60 to 80] km s−1 roughly centred on the vertical linemarking Vlsr = 12 km s−1, the velocity of the narrow 621 GHz maserfeature.
Fig. B.2. Same as B.1 but for dataset 6b-H in Table A.1.
A31, page 6 of 7

S. C. Jones et al.: Polarisation observations of a 620.701 GHz water maser transition in Orion KL (RN)
Appendix C: Discussion on pointing errorsThe source for the variability of the broad pedestal componentin the 621 GHz spectral line requires explanation. More pre-cisely, we need to determine whether some time-varying phys-ical mechanism and/or pointing errors are responsible for thechange that occurs in the pedestal between 2011 to 2012.
As the first and last set of observations involved a smallmap, we examined two possibilities. First, whether the increasein emission from the broad component is common to all areasof the map, and second, if not, whether there is a noticeableoffset in the spatial positioning. Figures B.1 and B.2 illustratethe horizontally polarised versions of the two small mapstaken during the first and last epochs of our observations. InTable A.1, this corresponds to observation numbers 2-H and6b-H, respectively. From 2011 and 2012, the intensity of themaser line itself seems to systematically decrease betweenthe maps of Figs. B.1 and B.2. At the same time, in manypanels toward the map centre, the aforementioned broadcomponent appears to get stronger. This trend differs at pointsfarther from the centre, where there is more of a decrease,especially in the line wings of the bottom left panels. Thislatter point seems to indicate systematic changes in the source.However, one possible explanation for the increase in thebroad component may be due to the proximity of the Orion“hot core” (HC) whose molecular line emissions were studiedextensively by Beuther et al. (2005). The HC is located at(RA[J2000] = 05h35m14.s50, Dec[J2000] = −05◦22′30.′′45) onlyabout 6 arcsec removed from Orion KL. It is displaced from ourpointing direction by only 20′′ in Right Ascension and 30′′ inDeclination, and thus lies at an offset of only 36 s of arc fromour prime pointing direction. This small offset, barely exceeding
the FWHM of our beam at 621 GHz, implies that even a rela-tively small error in pointing could effect a large apparent vari-ability, given that the HC would lie on the flank of our beamprofile.
In Sect. 3.2, we stated that the adjustment in the absolutepointing error (APE) improved the pointing accuracy of HIFIbut retained some of its uncertainty. This is especially true of themapped observations, which have additional pointing uncertain-ties due to relative offsetting and jitter, that may total 1.′′5−2.′′5for OTF maps. Both mapping and pointed modes can be fur-ther misdirected from their intended pointing during telescopeswitching from OFF to ON source. Indeed the APE was verifiedduring Herschel photometric operation and was never proven toexactly match while in spectroscopic observations. In general,HIFI has shown itself able to resolve source structure to betterthan 1′′ at its high-frequency end. Nevertheless pointing errorsof order 3′′ have occasionally been observed on Herschel.
As we are combining data across several observation days,it is easy to conceive of pointing errors of this order. Togetherwith the large source gradient shown in Figs. B.1 and B.2 andthe presence of the HC in the vicinity of our source, the effectof pointing errors must be considered a likely source of vari-ability in the broad spectral component. Quantitatively, if one isto look more closely at, for example, Fig. B.2, there is a drastic,∼1.5 K increase in the broad component as one moves 12.′′5 fromthe centre position to that directly beneath. Following the discus-sion from above, a reasonable pointing error of 3′′, or 23% of themap step size, would thus correspond to an increase of ∼0.35 Kin the broad pedestal. An offset of this magnitude from the cen-tre position would therefore result in the amplitude of the broadcomponent rising to ∼0.85 K, or ∼1.7 times the intensity.
A31, page 7 of 7