Embed Size (px)
Citation preview

icfi.com1 © 2014 ICF International, Inc.
Authors: Briana Adams, ICF InternationalAcknowledgments: This paper could not have been completed without the efforts of Frank Brock, Doug Elliot, David Fritsch, Thu Nguyen, Kevin Petak, Matt Robison, and Harry Vidas.
Polar Vortex Review: Natural Gas Perspectives
WHITEPAPER
Executive SummaryLast winter’s Polar Vortex highlighted ongoing concerns regarding dependence on gas-fired power generation and constraints on natural gas infrastructure, particularly in New England. Although the weather conditions were not record breaking, the region experienced high gas and power price escalation during last winter’s cold snaps. The escalation reflected the region’s growing power sector demand and mounting infrastructure constraints.
Much has been written from the power sector perspective on these gas delivery issues and ramifications for electricity prices and capacity markets, including various independent system operators (ISOs) such as New England Independent System Operator (ISO-NE). To find the optimal solution to alleviate those constraints with new infrastructure capacity, a full appreciation of these complexities must include a thorough understanding of gas deliverability barriers and opportunities from the natural gas industry perspective. A review of gas market dynamics in New England raises critical questions for utilities, pipelines, natural gas shippers, and policymakers. What are the limits on gas deliverability for power generators? What are the lowest-cost delivery options to increase access to gas-fired generators? What is the cost and value of securing reliable gas delivery in the context of new regulatory incentives and changing market conditions? And who bears the cost burden of infrastructure expansions to meet demand?
This paper covers two broad areas relevant to market participants. First, the paper examines what happened in the Polar Vortex, the region’s changing demand and supply access, and the challenges to achieving incremental supply additions in this market. The aim is to provide a broad grounding in the market dynamics from a gas perspective to help inform a more thorough understanding of the region’s infrastructure expansion needs. Second, the benefits and constraints of various options for meeting peak demand are discussed, including an assessment of current infrastructure and the relative costs of infrastructure expansion options.
Overall, absent cohesive infrastructure development addressing the growth in power sector gas use, New England could face increasing price volatility even during milder weather as the region’s gas dependence grows. A multipronged approach is likely the most cost-effective solution to incremental capacity expansion. However, the potential cost and value of each option depends greatly on meticulous estimation and modeling of weather conditions and market responses. Generators and other power sector players must carefully consider the tradeoffs between constraint-driven price volatility and infrastructure expansion costs, particularly in the context of ISO-NE’s new Pay-For-
New England natural gas prices reached historic peaks during the
2013–2014 Polar Vortex, high-lighting the region’s persistent
natural gas pipeline constraints. Strong growth in power sector natural gas demand, coupled
with coal and nuclear retirements and new power plant emissions
standards, could exacerbate con-straints in the future.

icfi.com2 © 2014 ICF International, Inc.
Performance Initiative that penalizes underperformance and rewards overperformance. ICF Incorporated is continuing to examine these issues in detail for clients and closely tracking developments and opportunities in the changing market landscape.1
Source: ICF analysis of National Climatologic Data Center (NCDC) Global Surface Observation Data (GSOD) data set. Note: Heating degree days (HDDs) are defined as the average day’s temperature in terms of number of degrees below 65 degrees Fahrenheit (the temperature below which buildings are heated).
What Happened: Polar Vortex Reveals Gas Generation VulnerabilitiesDuring the past winter, prolonged periods of cold weather during the Polar Vortex led New York Independent System Operator, Inc., Midcontinent Independent System Operator, Inc., and PJM Interconnection, LLC (PJM) to set winter power demand records, with ISO-NE nearing its historic peak. Though New England did not break electricity demand records, the region did achieve historic highs in natural gas spot prices, reaching $78 per million British thermal units (MMBtu).2 These extraordinary price spikes were a symptom of the region’s increased reliance on gas-fired power—now comprising about half of all generation—coupled with persistent gas pipeline deliverability constraints. Not enough natural gas deliverability capacity was available to gas-fired generators during periods of cold weather and high demand from residential, commercial, and industrial natural gas consumers.
The grave nature of gas supply constraints was evident with natural gas spot price premiums over Henry Hub, the main U.S. natural gas index hub. The differential between a market hub and Henry Hub often is referred to as “basis.” Basis differentials between New England and Henry Hub during the Polar Vortex
1. See Rose, “Waiting for the Next Polar Vortex,” Public Utilities Fortnightly, June 2014, and Katsigiannakis et al., “How ISO-NE’s Pay-for-Performance Initiative Will Shake Up New England,” November 2014.2. Algonquin Citygate (Boston) natural gas spot price on January 23, 2014, according to SNL.
4,500
4,000
3,500
3,000
2,500
2,000
1,500
1,000
500
199
3/9
4
199
5/9
6
20
03
/04
20
07/
08
20
07/
08
20
12/1
3
20
11/1
2
20
01/
02
20
13/1
4
0
New England Dec 1 - Feb 28 Total HDDs (1994/5 - 2013/4)
Win
ter
Hea
tin
g D
egre
e D
ays
(Dec
1 -
Feb
28
)

icfi.com3 © 2014 ICF International, Inc.
reached $73/MMBtu in late January 2014. New England paid substantially more for gas than other regions because of limited deliverability capacity. Mid-Atlantic markets such as New York drew gas off of pipelines traveling farther to New England.
Natural gas generation is on the margin in most markets (i.e., plants with the highest accepted bids are gas-fired generators, setting spot power market prices). The combination of high natural gas prices, significant power demand, and power plant outages caused unusually high electricity prices as well, with peaks of between $300 and $700 per megawatt-hour (MWh).
Source: ICF analysis of SNL data. Note: New England natural gas prices based on Algonquin Citygate price. Spot prices available during week days only; thus specific dates per week differ by year.
Supply Access Constraints Drive Prices: Regional Nature of Natural Gas MarketsNatural gas prices can vary significantly between markets in close proximity to one another. The key factor creating price disparities between adjacent gas hubs is the lack of available gas pipeline capacity to move gas from the low-price area to the high-price area. New England markets as well as other northeastern markets such as in PJM experienced capacity constraints that led to significant price escalation. As shown in the map, although ISO-NE markets’ prices reached $78/MMBtu during
New England Basis over Henry Hub Natural Gas Spot Price
(January - February over Selected Years)
Week 1 Week 5Week 3 Week 7Week 2 Week 6Week 4 Week 8
$80
$70
$60
$50
$40
$30
$20
$10
$0
BA
SIS
($/M
MB
TU)
2008 - 2013 Range 2014

icfi.com4 © 2014 ICF International, Inc.
late January 2014, PJM hubs had extreme price disparity. Markets ranged from $5/MMBtu in western Pennsylvania to $123/MMBtu in eastern PJM markets.3,4 This disparity reflects the region’s natural gas transportation constraints.
Source: ICF analysis of SNL data. Map powered by ESRI.
Taking the Edge Off: ISO-NE’s Winter Reliability Program
In anticipation of possible natural gas supply constraints, ISO-NE established the 2013–2014 Winter Reliability Program. This program included demand response measures, oil reserves, and added reliance on dual-fuel generators. As shown in the chart to the right, oil-fired generation occurred during key high-demand periods (indicated by high heating degree days). Without these resources, regional natural gas and power prices could have risen to the high levels seen in some PJM market hubs that did not have a Winter Reliability Program. ISO-NE reported an initial inventory of nearly 3.1 million barrels in fuel reserves, of which 2.7 million barrels were burned (generating 1.6 million MWh of electricity) between December 1, 2013, and February 28, 2014. Despite this inventory, ISO-NE reported that 530,000 barrels and 112,000 barrels could not be accessed during January and February, respectively.5
3. Algonquin Citygate (Boston) natural gas spot price on January 23, 2014, according to SNL. 4. Transco Zone 6 Non-New York natural gas spot price on January 22, 2014, according to SNL.5. Babula, Mark. “Post Winter 2013/14 Review,” p. 3. ISO-NE, March 2014. Available at http://www.iso-ne.com/static-assets/documents/committees/comm_wkgrps/prtcpnts_comm/pac/mtrls/2014/mar172014/a3_2013_2014_winter_review.pdf.

icfi.com5 © 2014 ICF International, Inc.
Sources: ISO-NE. “Daily Generation by Fuel Type 2014.” ISO-NE, November 2014. Available at http://www.iso-ne.com/isoexpress/web/reports/operations/-/tree/daily-gen-fuel-type. ICF analysis of NCDC GSOD data set.
Why was limited gas available for power generation?
Gas distribution companies (LDCs)—the primary customers of firm gas pipeline capacity—develop gas supply plans based upon design day (i.e., peak) conditions that are keyed to the possibility of extreme weather. Natural gas infrastructure is designed to meet the firm load on a selected design day (e.g., coldest day in 30 years). As a result, under “average annual operating” conditions, most pipelines have remaining capacity not in use by firm customers and thus available for non-firm (i.e., interruptible) service.
LDCs that provide gas heating needs for residential and commercial (as well as some industrial) customers can sign long-term pipeline contracts because their rates include recovery of fixed monthly gas pipeline demand charges. By contrast, gas-fired power generators operating in competitive markets such as ISO-NE have loads and revenues that change daily based on the market bidding process and power demands. The bidding in these markets is based only on variable costs and thus generators. The costs of long-term firm contracts are not economic for the average competitive power producer to recover. Pipelines can use facilities with spare capacity to deliver gas up to the physical capacity limits, assuming non-firm delivery requests are made during the nomination cycle timeline. Although power producers are able to call on

icfi.com6 © 2014 ICF International, Inc.
interruptible service or unused firm capacity (called capacity release), such options are typically not available during extremely cold winter days; for example, during the 2013–2014 Polar Vortex when all of the LDC pipeline contract capacity was devoted to serving residential and other firm LDC loads.
Because so many power generators rely on interruptible pipeline capacity, much of the power sector’s gas-fired generating capacity is vulnerable to interruption, particularly in periods of cold weather and high firm gas loads. In New England, less than 8 percent of firm pipeline capacity is held directly by a small number of electric generators in New England.6
Due to the correlation between cold weather and electric load, as interruptible power sector wintertime demand goes up, so does the likelihood of natural gas supply shortfalls in the power sector. Such shortfalls, in turn, could increase loss of load expectation of the power system, as both the probability of individual plant outages and correlations in forced outages throughout the system rise. Thus, several days (though less than a month) passed during the 2013–2014 winter in which extreme weather led to critical supply access issues and severe natural gas and power price volatility.
What Happened: Growing Demand and Infrastructure Constraints
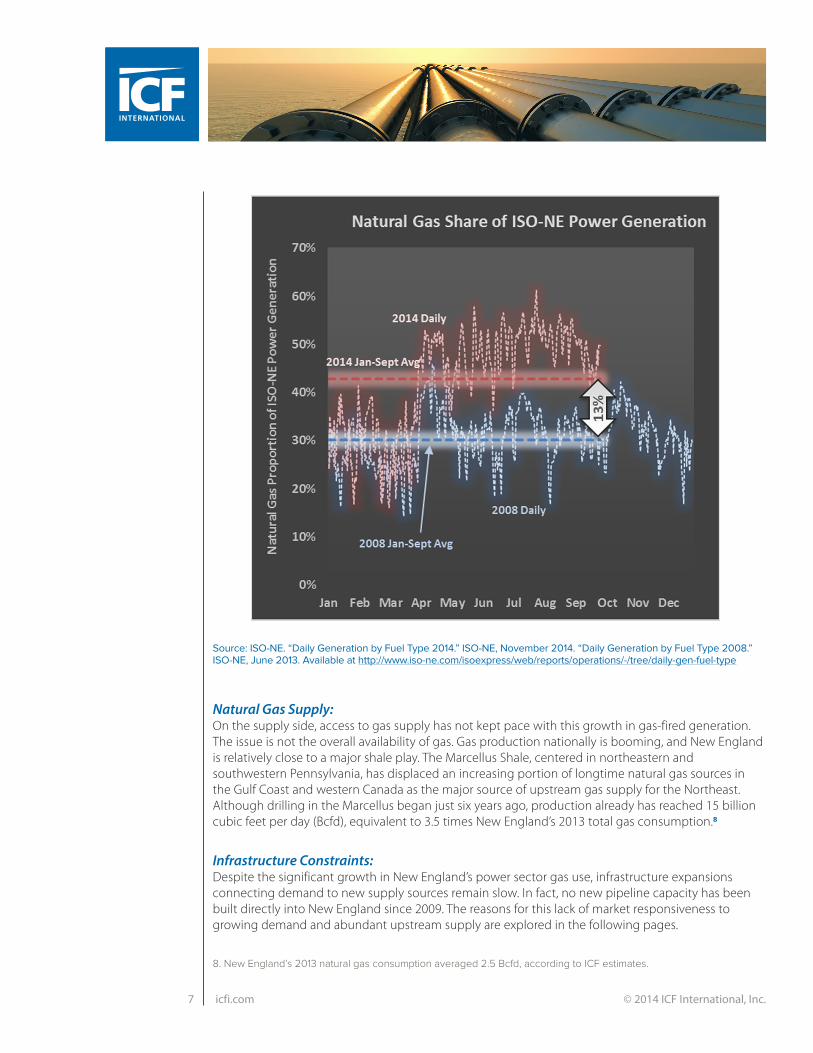
Natural Gas Demand: On the demand side, the story is clear: In 2000–2013, New England’s proportion of gas-fired generation increased from 15 percent to 47 percent. Between 2008 and 2014 alone, daily gas-fired power generation as a proportion of the total mix grew 13 percent to 43 percent between January and September 2014, as shown in the chart on the following page. 7 The high average age of the region’s coal and nuclear facilities combined with more stringent environmental regulations put increasing pressure on non-gas central station generating resources. These resources were, rendered increasingly noneconomic, leading to a wave of retirements, including announcements of Salem Harbor Station, Vermont Yankee, Norwalk Harbor, and Brayton Point in recent years.
6. ICF analysis of the Index of Customers data indicates about 280 MMcfd of firm capacity is directly held by New England electric generators; however, generators may contract for additional firm capacity through marketers. 7. ISO-NE. “Daily Generation by Fuel Type 2014.” ISO-NE, November 2014. “Daily Generation by Fuel Type 2008.” ISO-NE, June 2013. Available at http://www.iso-ne.com/isoexpress/web/reports/operations/-/tree/daily-gen-fuel-type.
Natural Gas Pipeline Contracts 101
Natural gas pipelines are sized to meet “firm” long-term contracts of 10+ years with natural gas customers such as local gas distribution companies, as well as some industrial and other customers. LDCs hold the bulk of New England’s firm pipeline contracts and supply gas to primarily residential and commercial customers. As LDC demands for gas grow, LDCs typically sign up for additional firm gas pipeline capacity. They cover the additional monthly fixed demand charges with the fixed customer charge payments received from their residential and commercial customers. Natural gas pipelines do not normally invest in capacity expansions without firm contracts to guarantee the recovery of their investment. Sometimes pipelines will build capacity in excess of their firm contracted shippers’ volumes, if they anticipate market growth and if the FERC accepts that the pipeline is at risk for the uncontracted capacity. This excess capacity is often committed to long-term contracts after FERC approval. Until then, excess capacity may be marketed as interruptible transportation (IT) or short-term firm transportation.
icfi.com7 © 2014 ICF International, Inc.
Source: ISO-NE. “Daily Generation by Fuel Type 2014.” ISO-NE, November 2014. “Daily Generation by Fuel Type 2008.” ISO-NE, June 2013. Available at http://www.iso-ne.com/isoexpress/web/reports/operations/-/tree/daily-gen-fuel-type
Natural Gas Supply: On the supply side, access to gas supply has not kept pace with this growth in gas-fired generation. The issue is not the overall availability of gas. Gas production nationally is booming, and New England is relatively close to a major shale play. The Marcellus Shale, centered in northeastern and southwestern Pennsylvania, has displaced an increasing portion of longtime natural gas sources in the Gulf Coast and western Canada as the major source of upstream gas supply for the Northeast. Although drilling in the Marcellus began just six years ago, production already has reached 15 billion cubic feet per day (Bcfd), equivalent to 3.5 times New England’s 2013 total gas consumption.8
Infrastructure Constraints: Despite the significant growth in New England’s power sector gas use, infrastructure expansions connecting demand to new supply sources remain slow. In fact, no new pipeline capacity has been built directly into New England since 2009. The reasons for this lack of market responsiveness to growing demand and abundant upstream supply are explored in the following pages.
8. New England’s 2013 natural gas consumption averaged 2.5 Bcfd, according to ICF estimates.

icfi.com8 © 2014 ICF International, Inc.
The Problem: No Cost-Recovery Mechanisms Bridging Power and GasAlthough the Polar Vortex caused some significant cold snaps, it was not an historic weather event for New England. A colder event in the future could lead to significantly more natural gas and electricity price swings, assuming no new infrastructure. What the Polar Vortex highlighted was a baseline mismatch between regional gas demand and access to supply. In the near term, this mismatch is likely to continue.
Overall, ICF projects that New England natural gas demand will grow 1.5 percent annually between 2014 and 2025. 9 Power generation is expected to drive 87 percent of the growth in natural gas demand between 2014 and 2025, according to ICF estimates.10 Some debate exists about the extent of gas demand growth in the foreseeable future. However, impending coal and nuclear retirements and stringent power plant emissions regulations alone signal that gas demand as a proportion of total power demand will increase.
Source: SNL
In competitive markets such as ISO-NE, natural gas is on the margin. Thus, natural gas price spikes seen during the Polar Vortex directly translated to substantial power price increases (see chart). As gas-fired plants comprise an increasing share of regional power generation during the foreseeable future, power prices will continue to reflect natural gas price changes.
New England Natural and Power Price Correlation
01/02/2
014
01/09/2
014
01/16/2
014
01/23/2
014
01/30/2
014
02/06/2
014
02/13/2
014
02/20/2
014
02/27/2
014
$60
$50
$40
$30
$20
$10
$0 $0
$150
$400
$50
$300
$200
$450
$100
$350
$250
$500
NA
TUR
AL
GA
S P
RIC
E ($
/MM
BTU
)
PO
WER
PR
ICE
($/M
WH
)
$90
$80
Algonquin Citygate Spot Gas Price ($/MMBtu)
ISO-NE Day-Ahead Power Price ($/MWh)
$70
9. ICF Gas Market Model® Q4 2014 10. Residential and commercial gas demand growth are expected to remain relatively constant. Any growth will be offset by energy efficiency gains although industrial growth will see a very moderate increase.
With limited incremental supply infrastructure coming in the next few years and rising gas demand, higher energy prices will continue.

icfi.com9 © 2014 ICF International, Inc.
For the reasons discussed above, competitive power generation markets do not provide sufficient economic incentives to support new pipeline capacity through long-term contracting by power generators. Such contracts can prove difficult to rationalize when the added capacity is needed only for a small portion of the year and in different amounts year to year, depending largely on weather. A major challenge for the region, therefore, is how to pay for natural gas infrastructure investments when the market value of the new capacity covers its cost only from time to time. However, costs of alternatives to capacity expansions can be significant as well. To illustrate, New England natural gas spot prices at their peak during the 2013–2014 Polar Vortex were more than three times that of the distillate oil used as an alternative to gas for dual-fuel power plants.11
Source: ICF estimate for 2013; 2017 projection assuming 20-year average temperatures
As shown in the chart, proposed near-term pipeline expansions into New England may ease natural gas deliverability constraints somewhat during peak days (i.e., coldest winter days). The infrastructure expansion is needed for just two months of the year, which can prove difficult to justify.
The Solution: Infrastructure Expansion Opportunities and Constraints
Two options exist to expand power generator access to peak day natural gas supplies in New England: adding pipeline capacity and liquefied natural gas (LNG) imports. In addition to these infrastructure options, oil storage is a potential option for dual-fuel power generators. Although oil is generally costly compared with natural gas pipeline deliveries and LNG imports, this past winter’s gas supply constraints proved economic for oil.
New England Natural and Power Price Correlation (2013, 2017)
110 30
60
90
180
36
5
6
5
4
3
2
1
0
DA
ILY
CO
NSU
MP
TIO
N (B
CFD
)
HIGHEST TO LOWEST COINCIDENTAL DAILY GAS LOAD
Current Capacity Plus Announced Additions
Current Pipeline Capacity
2017
2013
Because of the lack of market incentive to adequately recover the cost of incremental capacity investment, no new pipeline capacity has been built directly into New England since 2009.
11. Based on Algonquin Citygate Spot Natural Gas Price on January 23, 2014, of $77.60/MMBtu, relative to Boston’s heating oil price of $23.04, according to SNL.
icfi.com10 © 2014 ICF International, Inc.
The optimal solution to New England’s natural gas supply infrastructure issues is likely a multipronged approach that includes various types of natural gas and alternative fuel infrastructure. In determining the optimal solution and how it will be paid for, market participants, government entities, and other stakeholders should remain cognizant of the following:
�� Cost allocation: The most efficient outcome will result when energy users can accurately weigh additional energy use against alternatives such as energy conservation and fuel switching. For this reason, infrastructure costs should be allocated to customers creating the demand for energy and related infrastructure.
�� Market price transparency: The regulation of energy markets, rate design, and efforts to “socialize” the costs and risks of new infrastructure should not distort market prices that provide incentives for infrastructure investment and utilization. Policy goals should include enhancing market liquidity, limiting market distortions, and maintaining price transparency. The new ISO-NE Pay-for-Performance Initiative program12 will present a new set of incentives that will alter price signals in the market by rewarding overperformance under scarcity conditions and penalizing underperformance. This mechanism will put a premium on reliability and may help the market to both better value firm supply and to distribute the long-term capital costs among ratepayers.
�� Resource adequacy versus willingness to pay: No practical infrastructure system is 100 percent reliable or adequate under all possible market conditions and contingencies. The optimal solution must balance the cost of marginal capacity additions against customers’ willingness to pay for infrequent disruptions to service.
�� Cost recovery: Cost-recovery mechanisms should be transparent, simple, and consistent to ratepayers.
For the examination of the benefits and constraints of these options, a review of existing infrastructure appears below.
Current Infrastructure Synopsis
Natural Gas Pipelines Five interstate natural gas pipelines reach into New England. New England natural gas pipeline capacity totals 3.7 billion cubic feet per day (Bcfd), more than 90 percent of which is contracted to LDCs under long-term firm contracts. About two-thirds of the capacity contracted by New England shippers is on the Tennessee and Algonquin systems (see map), both of which have announced pipeline expansions: Tennessee’s would provide an additional 72 million cubic feet per day (MMcfd) through upgrades and modifications to its existing system. The Algonquin project would add 372 MMcfd based on firm contracts.13 In addition, Spectra’s NY–NJ expansion of its Texas Eastern Transmission and Algonquin lines in the New York City metropolitan area may indirectly aid the New England market. The expansion may open up additional capacity for New England shippers by displacing flows from New England to Long Island on the Iroquois system.
Iroquois has a total of more than 1.5 Bcfd of firm contracts, but the majority of this capacity is contracted for by shippers further downstream in New York. Little supply is left to continue on to New England. The Portland Natural Gas Transmission System (PNGTS) has proposed an expansion. However, declining
12. See Katsigiannakis et al., “How ISO-NE’s Pay-for-Performance Initiative Will Shake Up New England,” November 2014.13. The project was initially proposed to add as much as 450 MMcfd of capacity by the end of 2016 but has been scaled back based on contracts secured.

icfi.com11 © 2014 ICF International, Inc.
Canadian production and increasing gas demand in Alberta for oil sands and LNG exports from western Canada have reduced flows on systems supplying PNGTS, making further expansion difficult. Expansion of the Maritimes and Northeast (M&N) Pipeline is unlikely due to declining eastern Canadian gas production, reduced LNG imports to Canaport (an LNG import terminal in New Brunswick), and continued gas demand growth in eastern Canada.
New England Interstate Pipelines and LNG Terminals
Source: ICF analysis of Ventyx data.
New England LNG Terminals LNG imports remain important for the New England market, particularly in peak winter months. New England does not have underground storage due to geological constraints.14 Whereas regions with underground storage inject natural gas during the spring, fall, and winter months for the peak winter months, New England relies on LNG imports.
The Distrigas LNG terminal in Everett, MA, (operated by GDF Suez NA) is the main terminal receiving and distributing LNG in the region. In fact, the terminal is the only New England terminal receiving shipments. Two other offshore LNG terminals, Neptune and Northeast Gateway, have not received any since 2010 and lack on-site storage. They are limited to sending out gas only when a tanker is docked. Distrigas has a sustainable vaporization capacity of 715 MMcfd, can distribute another 100 MMcfd via truck, and also contains two storage tanks with a combined capacity of 3.4 Bcf.
Distrigas has a combined sendout to the Tennessee and Algonquin interstate pipelines and the Mystic Generating Station of 215 MMcfd in 2012 on average, with a peak day sendout of about 440 MMcfd. Distrigas also delivers additional volumes directly to the local LDC system (National Grid
14. Three types of underground natural gas storage options are available: depleted reservoirs, salt caverns, and aquifers. New England does not have adequate underground storage options due to the naturally occurring geologic constraints, with no regional gas production (i.e., leading to depleted reservoirs), salt caverns, or aquifers of requisite sizes.

icfi.com12 © 2014 ICF International, Inc.
Boston Gas) and via truck to LNG peak shaving facilities. New England also obtains LNG imports from the Canaport facility in eastern Canada via the M&N Pipeline. Repsol, the owner and operator of Canaport, sold its LNG liquefaction holdings in 2013 and has limited firm gas supply for the terminal.
New England Peak Shaving Facilities In addition to the pipeline and LNG import terminals, LDCs in New England also operate about 45 LNG and propane-air peak shaving facilities. The peak shaving facilities are used to maintain system reliability and help meet firm customer demand during the 10 to 15 winter peak demand days. The peak shaving facilities have a total sendout capability of about 1.45 Bcfd and a total storage capacity of about 16 Bcf. 15 Some of the facilities are “full-cycle” LNG peak shaving (i.e., they can liquefy pipeline gas to refill the storage tanks), but the majority are supplied by truck shipments from the Distrigas facility. Power generators, however, do not have access to these facilities, which are, thus, not a mechanism to meet power generation demands during peak times.
Peak Shaving Facilities
Peak shaving refers to a practice in which these facilities provide natural gas only on the coldest winter days, requiring the largest natural gas supplies to meet demand. Although pipelines and some LNG imports meet the bulk of demand requirements, peak shaving facilities (considered storage options for LDCs) are employed for only a handful of days during the winter when other (less costly) options are not enough to meet demand.
15. NGA 2012 Statistical Guide,” Northeast Gas Association, 2012.

icfi.com13 © 2014 ICF International, Inc.
Potential Cost Impacts of Infrastructure Options
Each option has both fixed (i.e., capital) costs and variable (i.e., fuel) costs. Options involving high fixed costs (such as pipeline expansions) are best for meeting long-term demand increases. Lower fixed-cost alternatives such as fuel-switching and LNG imports are appropriate for shorter periods of time.
Assessing potential natural gas deliverability options requires a thorough understanding of each approach, the impact of relieving infrastructure constraints, and the costs involved. This paper focuses on natural gas perspectives and does not discuss power sector transmission options. A comprehensive approach would likely involve both natural gas and power infrastructure options. To illustrate potential options for New England, the chart on the next page compares various New England prices between January and February 2014 during the Polar Vortex, specifically:
1. Actual natural gas spot prices (Algonquin Citygate) reached record highs, nearing $78/MMBtu on January 23. Because natural gas is on the margin in New England, these price changes directly translated to power price escalation.16
2. Oil prices (Boston) were relatively stable over the Polar Vortex and oil supplied dual-fuel facilities with needed capacity to maintain performance. However, oil (i.e., distillate fuel) is a costly alternative and is typically used for short periods of time rather than as a significant reserve fuel this past winter.17
3. International LNG prices (United Kingdom National Balancing Point [NBP]) were included to illustrate the international LNG competition that New England faced during the extreme weather and the prices New England would have to beat to draw spot LNG cargoes away from European markets. During peak winter months, New England markets may need to pay significant premiums (relative to domestic markets) to meet gas demands through incremental LNG import cargoes. However, European and Asian markets habitually pay significantly higher prices for LNG than do U.S. markets that benefit from strong domestic supply growth. Japanese monthly LNG prices averaged $16.50/MMBtu between January and July 2014. The United Kingdom’s NBP, a key European gas hub, averaged $8.40/MMBtu in daily spot prices during the period.18
4. A theoretical natural gas prices for a new 1,000 MMcfd pipeline assumes varied days of use to illustrate the impact on costs to ratepayers, LDCs, or other customers responsible for cost recovery. The examples below illustrate the cost impacts of pipeline capital costs. A pipeline used all year long will have lower incremental capital costs spread during the entire year. A pipeline needed for just 30 days of the year will be significantly more expensive. A new greenfield pipeline to bring the gas to the New England market would cost about $2 billion and could not be built until it had achieved firm contracts for 90 percent of its capacity under Federal Energy Regulatory Commission rules.
1. 30 days of pipeline use assumes that the pipeline is constructed and expanded exclusively to handle peak winter demand and is the most expensive of the theoretical options, as costs are spread only during 30 days of the year. Under these assumptions, pipeline costs exceed those of distillate oil.
2. 60 days of pipeline use assumes the pipeline handles mainly peak winter demand as well as some off-peak demand, with costs less than that for distillate oil.
3. 365 days of pipeline use assumes the pipeline will be used throughout the year (such as for an LDC), with costs less than all alternatives, given that capital costs are distributed over the entire year.
16. SNL Algonquin Citygate natural gas spot price (Algon Gates Spot Natural Gas Index SNL).17. Bloomberg Boston heating oil price (ticker symbol: NO2IBSTN Index).18. Bloomberg LNG Japan Corp LNG Import Price/Japan USD pricing (ticker symbol: LNGJLNJP Index). Bloomberg Day Ahead Natural Gas Spot Price/UK National Balancing Point (NBP) pricing (ticker symbol: NBPGDAHD OECM Index).

icfi.com14 © 2014 ICF International, Inc.
Sources: Bloomberg, SNL, ICF analysis. Note: Theoretical natural gas prices with a 1,000 MMcfd pipeline assume Dominion South Point (Pittsburgh, PA) spot prices, plus fuel, transport, and pipeline costs over 575 miles from Pittsburgh, PA, to Boston, MA.
Market Price ($/MMBtu)
Actual Prices on January 23, 2014
New England Gas Spot Price* $77.60
Heating Oil $23.05
UK LNG $13.06
Theoretical Gas Price w/1,000 MMcfd Pipe
30 days of use $28.84
60 days of use $17.24
365 days of use $7.55
*Based on Algonquin Citygate price
Key TakeawayThe natural gas spot price swings during the Polar Vortex far exceeded alternatives, including theoretical pipeline expansion projects. The swings highlighted the need for action on expanding New England’s gas deliverability to power generators.
New England Price Comparisons
01/02/2
014
01/09/2
014
01/16/2
014
01/23/2
014
01/30/2
014
02/06/2
014
02/13/2
014
02/20/2
014
02/27/2
014
$60
$50
$40
$30
$20
$10
$0
($/M
MB
TU)
$90
$80
Boston Heating Oil UK NBP
Algonquin CitygateSpot Gas Price
$70
Theoretical Gas Prices w/1,000 MMcfd Pipeline
30 days of use
60 days of use
365 days of use

icfi.com15 © 2014 ICF International, Inc.
Weather-Driven Nature of Natural Gas Infrastructure DevelopmentBecause natural gas is used for heating as well as generation in New England, temperature is a key indicator for winter natural gas demand, expressed as heating degree days. Temperature and HDDs have an inverse relationship—as the temperature drops, gas demand climbs (as shown below). Thus, natural gas demand is driven primarily by weather patterns, requiring that natural gas demand and infrastructure forecasts must involve probabilistic modeling of weather patterns. Whereas power sector reliability focuses on loss of load expectation, natural gas infrastructure development is driven by predicting natural gas demand based on “likely” weather patterns. Determining probable weather patterns also informs decision making on the length of use for capital investments such as gas pipelines. A pipeline primarily used to meet peak winter demand more than 30 days will have a much more substantial cost than one used throughout the entire year.
New England Temperature and HDD Relationship
1985 1990 1995 2000 2005 2010
30 °
25 °
20 °
15 °
10 °
5 °
0 ° 0
1,500
500
3,000
2,000
1,000
2,500
TEM
PER
ATU
RE
(DEG
REE
S FA
REN
HEI
T)
HEA
TIN
G D
EGR
EE D
AY
S
35 °Temperature (F)
HDD
Sources: National Climatologic Data Center (NCDC) Global Surface Observation Data (GSOD) data set. Note: Includes average temperature and HDDs for January and February of each year.
A Critical Point for StakeholdersThe theoretical cost comparison for a new 1,000 MMcfd pipeline demonstrates just how vital accurate estimation and modeling will be for market participants. Projections of days of use, the likelihood of weather events, and the market’s response to weather patterns over time in the context of ISO-NE capacity constructs will fundamentally alter the cost-benefit picture and the value of capacity options. Analysis must also factor in the parties involved, the cost-recovery mechanisms, usage rates for infrastructure and cost impacts, and regulatory challenges and constraints.

©2014 ICF International, Inc.
Any views or opinions expressed in this Whitepaper are solely those of the author(s) and do not necessarily represent those of ICF International. This Whitepaper is provided for informational purposes only and the contents are subject to change without notice. No contractual obligations are formed directly or indirectly by this document. ICF MAKES NO WARRANTIES, EXPRESS, IMPLIED, OR STATUTORY, AS TO THE INFORMATION IN THIS DOCUMENT.
No part of this document may be reproduced or transmitted in any form, or by any means (electronic, mechanical, or otherwise), for any purpose without prior written permission.
ICF and ICF INTERNATIONAL are registered trademarks of ICF International and/or its affiliates. Other names may be trademarks of their respective owners.
About ICF InternationalICF International (NASDAQ:ICFI) provides professional services and technology solutions that deliver beneficial impact in areas critical to the world’s future. ICF is fluent in the language of change, whether driven by markets, technology, or policy. Since 1969, we have combined a passion for our work with deep industry expertise to tackle our clients’ most important challenges. We partner with clients around the globe—advising, executing, innovating—to help them define and achieve success. Our more than 5,000 employees serve government and commercial clients from more than 70 offices worldwide. ICF’s website is www.icfi.com.
icfi.com Conclusion
New England’s natural gas infrastructure remains constrained. The region will need incremental natural gas access alternatives to avert future price volatility. The challenge remains that cost-recovery mechanisms between the natural gas and power sectors are vastly different: The inability to reconcile natural gas and power market compensation led to New England’s pipeline constraints that played out during the Polar Vortex and will continue to be a barrier to further investment. Going forward, market participants must examine the risks of inadequate supply relative to infrastructure development to determine proper cost allocation and appropriate infrastructure development as well as identifying parties that should bear the cost of infrastructure expansions.
Providing accurate projections will be critical to optimizing the most cost-effective approaches and hedging against risk: Fashioning the right set of solutions depends a great deal on estimating the future likelihood and effects of cold winter weather, market reactions, and the value of each avenue to achieve firm natural gas supply. ICF continues to work with clients to leverage our expertise into detailed analyses and sector-leading modeling to support these decisions.
ContactBriana Adams � +1.703.225.2367 � [email protected]
About the Author Briana Adams is a Senior Associate in the Energy, Environment, and Transportation division at ICF International. She analyzes gas-electric coordination issues, fuels economics, and infrastructure development. Her recent work efforts have focused on assessing gas-electric coordination issues in the U.S. Northeast. Other projects include analysis of LNG exports, Canadian gas supply access issues, North American natural gas flows and infrastructure development, and shale gas environmental issues and associated regulation. Ms. Adams also has more than seven years of international work experience in China and the Middle East. She holds a master’s degree in International Affairs, with a concentration in Energy Economics, from Columbia University, and a bachelor’s degree in Economics, International Management, and Spanish from Hamline University.
EET WPR 1114 0374