Embed Size (px)
Citation preview
POL YCHLORIA TED DmENZOFURANS
1. Exposure Data
1.1 Chemical and physical data
1.1.1 Nomenclature and molecular formulae and weights
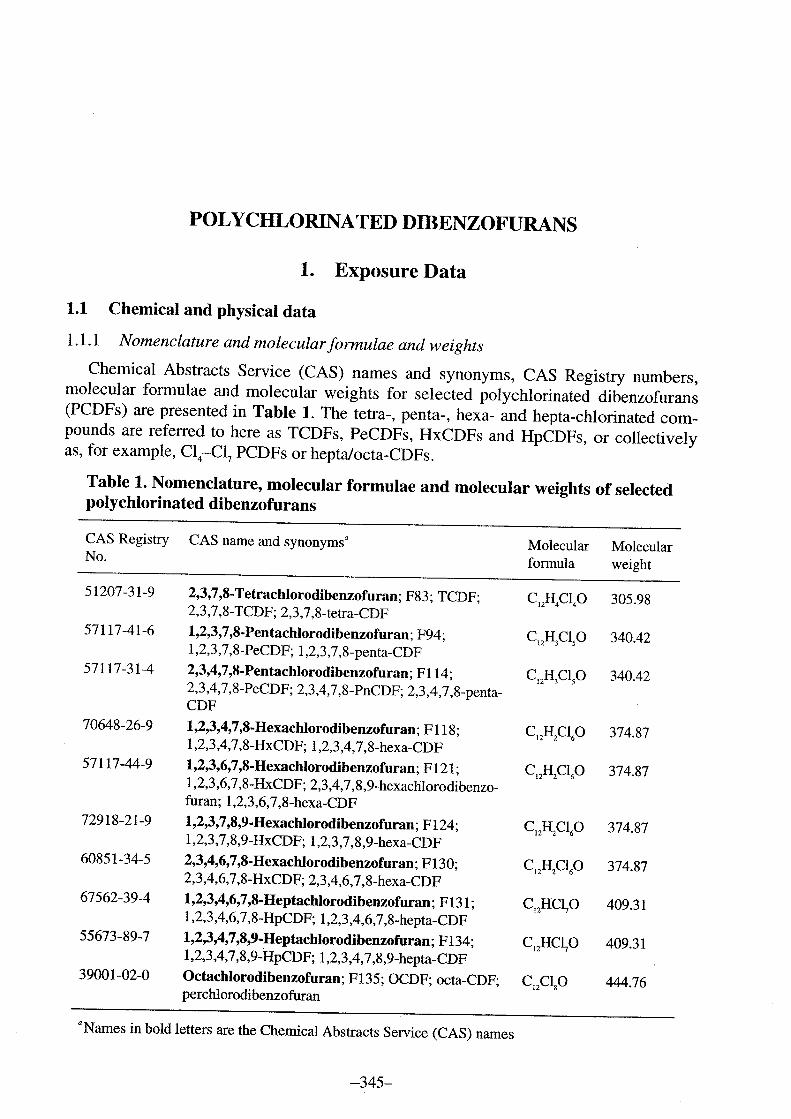
Chemical Abstracts Service (CAS) names and synonyms, CAS Registry numbers,molecular formulae and molecular weights for selected polychlorinated dibenzofurans(PCDFs) are presented in Table 1. The tetra-, penta-, hexa- and hepta-chlorinated com-pounds are referred to here as TCDFs, PeCDFs, HxCDFs and HpCDFs, or collectivelyas, for example, C14-C17 PCDFs or heptaJocta-CDFs.
Table 1. Nomenclature, molecular formulae and molecular weights of selectedpolychlorinated dibenzofurans
CAS Registr CAS name and synonymsa
No.Mo1ecu1ar Mo1ecu1arformula weight
C1iH4C1p 305.98
C12H3C1S0 340.42
C1iH3C1p 340.42
51207-31-9
57117-41-6
57117-31-4
70648-26-9
57117-44-9
72918-21-9
60851-34-5
67562-39-4
55673-89-7
39001-02-0
2,3,7,S-Tetrachlorodibenzofuran; F83; TCDF;2,3,7,8-TCDF; 2,3,7,8-tetra-CDF1,2,3,7 ,S- Pentachlorodibenzofuran; F94;1,2,3,7,8-PeCDF; 1,2,3,7,8-penta-CDF
2,3,4,7,S-Pentachlorodibenzofuran; F114;2,3,4,7,8-PeCDF; 2,3,4,7 ,8-PnCDF; 2,3,4,7 ,8-penta-CDF1,2,3,4,7,S-Hexachlorodibenzofuran; Fl18; C1iHiC1P 374.871,2,3,4,7,8-HxCDF; 1,2,3,4,7 ,8-hexa-CDF1,2,3,6,7,S-Hexachlorodibenzofuran; F121; C1iHiC1P 374.871,2,3,6,7,8- HxCDF; 2,3,4,7 ,8,9-hexach10rodibenzo-furan; 1,2,3,6,7,8-hexa-CDF1,2,3,7 ,S,9- Hexachlorodibenzofuran; F 124;1,2,3,7,8,9-HxCDF; 1,2,3,7,8,9-hexa-CDF
2,3,4,6,7,S-Hexachlorodibenzofuran; F130;2,3,4,6,7,8-HxCDF; 2,3,4,6,7,8-hexa-CDF1,2,3,4,6,7 ,S- Heptachlorodibenzofuran; F 131;1,2,3,4,6,7,8-HpCDF; 1,2,3,4,6,7,8-hepta-CDF1,2,3,4,7 ,S,9- Heptachlorodibenzofuran; F 134;1,2,3,4,7,8,9-HpCDF; 1,2,3,4,7 ,8,9-hepta-CDF
Octachlorodibenzofuran; F135; OCDF; octa-CDF;
perchlorodibenzofuran
C12EC1p 374.87
C1iHiC1P 374.87
C1iHClp 409.31
CI2HC~O 409.31
C1iC1gÛ 44.76
aNames in bo1d 1etters are the Chemical Abstracts Service (CAS) names
-345-
346 IARC MONOGRAPHS VOLUME 69
1.1.2 Structural formulae
The general structure of the PCDFs is shown in Table 2. Any or aU of the eighthydrogen atoms on dibenzofuran can be replaced with chlorine, giving rise to 135possible chlorinated dibenzofuran structures. AlI of the 135 are referred to as congeners(members of a like group) of one another, and congeners having the same number ofchlorines are isomers (Clement, 1991).
Table 2. Dibenzofuran structural formulaand numbers of chlorinated isomers
Formula
9
Clx
No. of cWorines(x + y)
No. of isomers
1
23
45
67
8
416
2838281641
Total 135
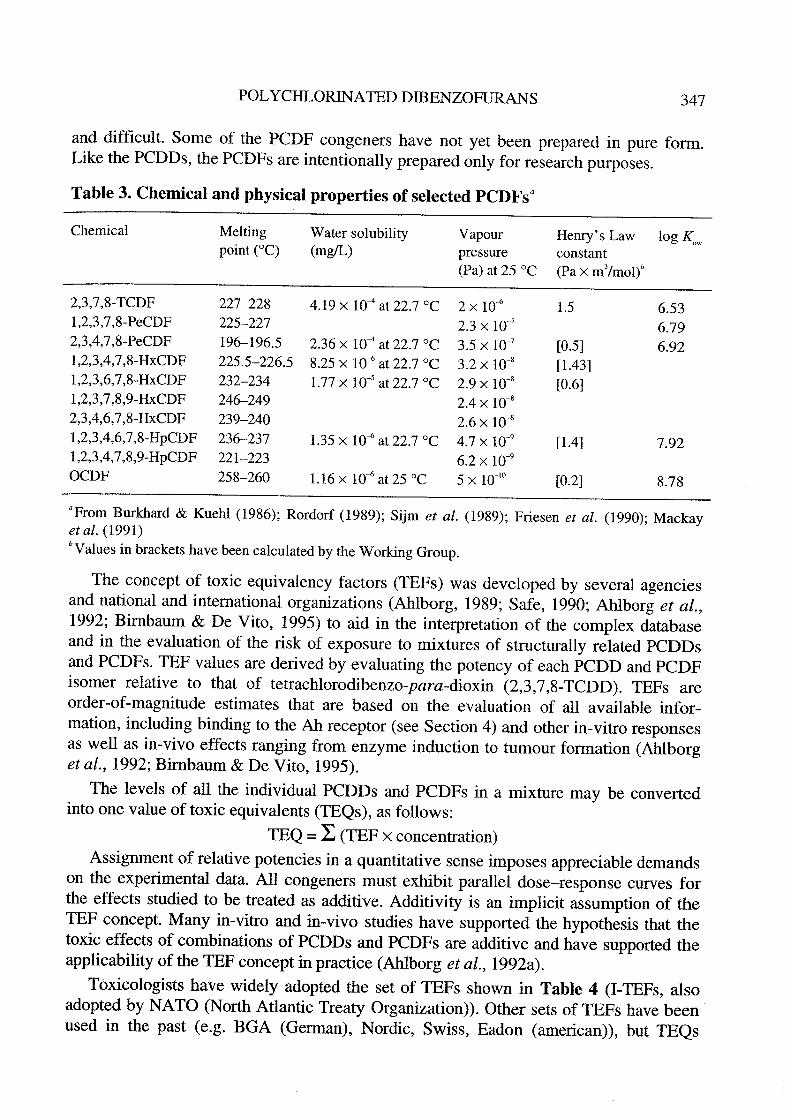
1.1.3 Chemical and physical properties
Knowledge of basic chemical and physical properties is essential to understandingand modellng environmental transport and fate as well as pharacokinetic and toxico-logical behaviour. The most important parameters for the PCDFs appear to be watersolubilty, vapour pressure, and octanoVwater parition coefficient (Ko)' The ratio of
vapour pressure to water solubilty yields the Henr' s Law constant for dilute solutionsof organic compounds, an index of paritioning for a compound between the vapour andaqueous solution phases (Mackay et aL., 1991). Chemical and physical properties ofselected PCDFs are presented in Table 3.
Limited research has been cared out to determne physical and chemical propertiesof PCDFs. As with the polycWoriated dibenzo-para-dioxins (PCDDs), the tetra- to octa-cWoro congeners with 2,3,7 ,8-cWorination have received the most attention. Of the largenumber of possible congeners, only the 2,3,7,8-cWorinated compounds and a few othersare available commercialIy, and preparation and synthesis can be both time-consuming
POL YCHLORIA TED DIBENZOFURAS 347
and difficult. Some of the PCDF congeners have not yet been prepared in pure form.Like the PCDDs, the PCDFs are intentionally prepared only for research purposes.
Table 3. Chemical and physical properties of selected PCDFsa
Chemical Melting Water solubility Yapour Henr's Law log Kow
point (OC) (mg/L) pressure constant(Pa) at 25°C (Pa x m3/moit
2,3,7,8-TCDF 227-228 4.19 x 10⁻⁴ at 22.7 °C 2 x 1O-Ð 1.5 6.531,2,3,7,8-PeCDF 225-227 2.3 x 10⁻⁷ 6.792,3,4,7,8-PeCDF 196-196.5 2.36 x 10⁻⁴ at 22.7 °C 3.5 x 10⁻⁷ (0.5) 6.921,2,3,4,7,8-HxCDF 225.5-226.5 8.25 x 1O-Ð at 22.7 °C 3.2 x 10⁻⁸ (1.43)1,2,3,6,7,8-HxCDF 232-234 1. 77 x 10-5 at 22.7 °C 2.9 X 10⁻⁸ (0.6)1,2,3,7,8,9-HxCDF 246-249 2A x 10-8
2,3,4,6,7,8-HxCDF 239-240 2.6 x 10⁻⁸
1,2,3,4,6,7,8-HpCDF 236-237 1.35 x 1O-Ð at 22.7 °C 4.7 x 10⁻⁹ (lA) 7.921,2,3,4,7,8,9-HpCDF 221-223 6.2 x 10⁻⁹
OCDF 258-260 1.16 x 1O-Ð at 25°C 5 x 10⁻¹⁰ (0.2) 8.78
aFrom Burkhard & Kuehl (1986); Rordorf (1989); Sijm et al. (1989); Friesen et al. (1990); Mackay
et al. (1991)bYalues in brackets have been calculated by the Working Group.
The concept of toxic equivalency factors (TEFs) was developed by several agenciesand national and international organizations (Ahlborg, 1989; Safe, 1990; Ahlborg et aL.,1992; Birnbaum & De Vito, 1995) to aid in the interpretation of the complex databaseand in the evaluation of the risk of exposure to mixtures of structuraUy related PCDDsand PCDFs. TEF values are derived by evaluating the potency of each PCDD and PCDFisomer relative to that of tetrachlorodibenzo-para-dioxin (2,3,7,8-TCDD). TEFs areorder-of-magnitude estimates that are based on the evaluation of all available infor-mation, including binding to the Ah receptor (see Section 4) and other in-vItro responsesas well as in-vivo effects ranging from enzyme induction to tumour formation (Ahlborget al., 1992; Birbaum & De Vito, 1995).
The levels of aU the individual PCDDs and PCDFs in a mixture may be convertedinto one value of toxic equivalents (TEQs), as foUows:
TEQ = L (TEF x concentration)Assignment of relative potencies in a quantitative sense imposes appreciable demands
on the experimental data. AU congeners must exhibit parallel dose-response cures forthe effects studied to be treated as additive. Additivity is an implicit assumption of theTEF concept. Many in-vitro and in-vivo studies have supported the hypothesis that thetoxic effects of combinations of PCDDs and PCDFs are additive and have supported theapplicability of the TEF concept in practice (Ahlborg et aL., 1992a).
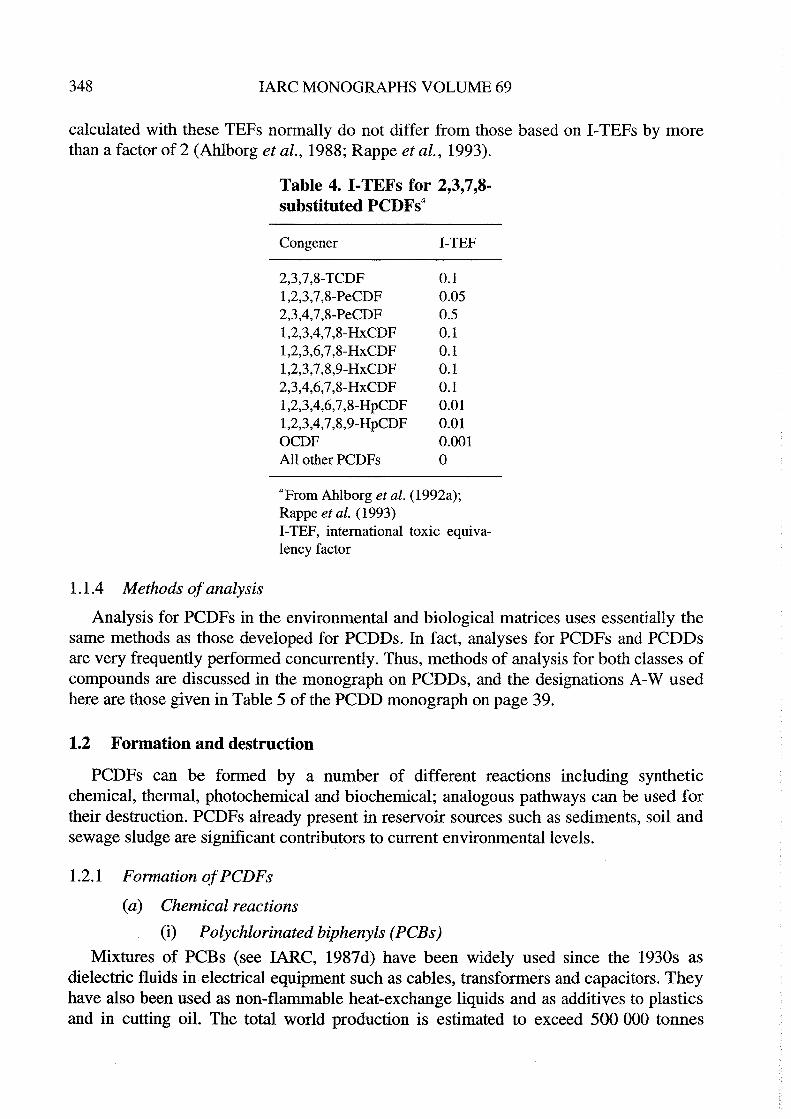
Toxicologists have widely adopted the set of TEFs shown in Table 4 (1- TEFs, alsoadopted by NATO (North Atlantic Treaty Organization)). Other sets of TEFs have beenused in the past (e.g. BGA (German), Nordic, Swiss, Eadon (american)), but TEQs
348 lARe MONOGRAHS VOLUME 69
calculated with these TEFs normally do not differ from those based on 1- TEFs by morethan a factor of 2 (Ahlborg et al., 1988; Rappe et aL., 1993).
Table 4. 1- TEFs for 2,3,7,8-substituted PCDFsa
Congener 1- TEF2,3,7,8-TCDF 0.11,2,3,7,8-PeCDF 0.052,3,4,7,8-PeCDF 0.51,2,3,4,7,8-HxCDF 0.11,2,3,6,7,8-HxCDF 0.11,2,3,7,8,9-HxCDF 0.12,3,4,6,7,8-HxCDF 0.11,2,3,4,6,7,8-HpCDF 0.011,2,3,4,7,8,9-HpCDF 0.01OCDF 0.001AlI other PCDFs 0aFrom Ahlborg et aL. (1992a);
Rappe et aL. (1993)1- TEF, international toxic equiva-lency factor
1.1.4 Methods of analysis
Analysis for PCDFs in the environmental and biological matrices uses essentially thesame methods as those developed for PCDDs. ln fact, analyses for PCDFs and PCDDsare very frequently performed concurrently. Thus, methods of analysis for both classes ofcompounds are discussed in the monograph on PCDDs, and the designations A-W usedhere are those given in Table 5 of the PCDD monograph on page 39.
1.2 Formation and destruction
PCDFs can be formed by a number of different reactions including synthetIcchemical, thermal, photochemical and biochemical; analogous pathways can be used fortheir destrction. PCDFs already present in reservoir sources such as sediments, soil andsewage sludge are significant contributors to current environmental levels.
1.2.1 Formtion of PCDFs
(a) Chemical reactions
(i) Polychlorinated biphenyls (peRs)
Mixtures of PCBs (see IAC, 1987d) have been widely used since the 19308 asdielectrc fluids In electrcal equipment such as cables, transformers and capacitors. Theyhave also been used as non-flamable heat-exchange liquids and as additives to plasticsand in cutting oiL. The total world production is estimated to exceed 500 000 tonnes
POL YCHLORIA TED DIBENZOFURAS 349
(Rappe et aL., 1979a). Primarly due to environmental problems, use of PCBs has nowbeen phased out in most European countries and in many others.
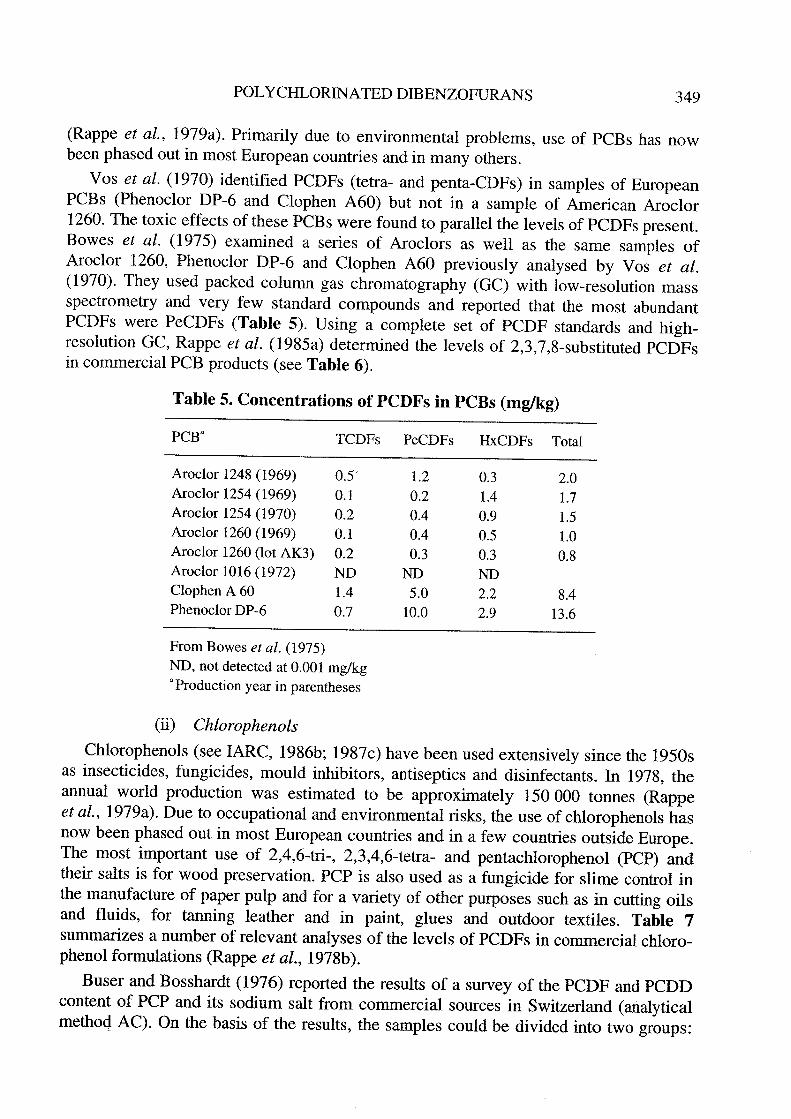
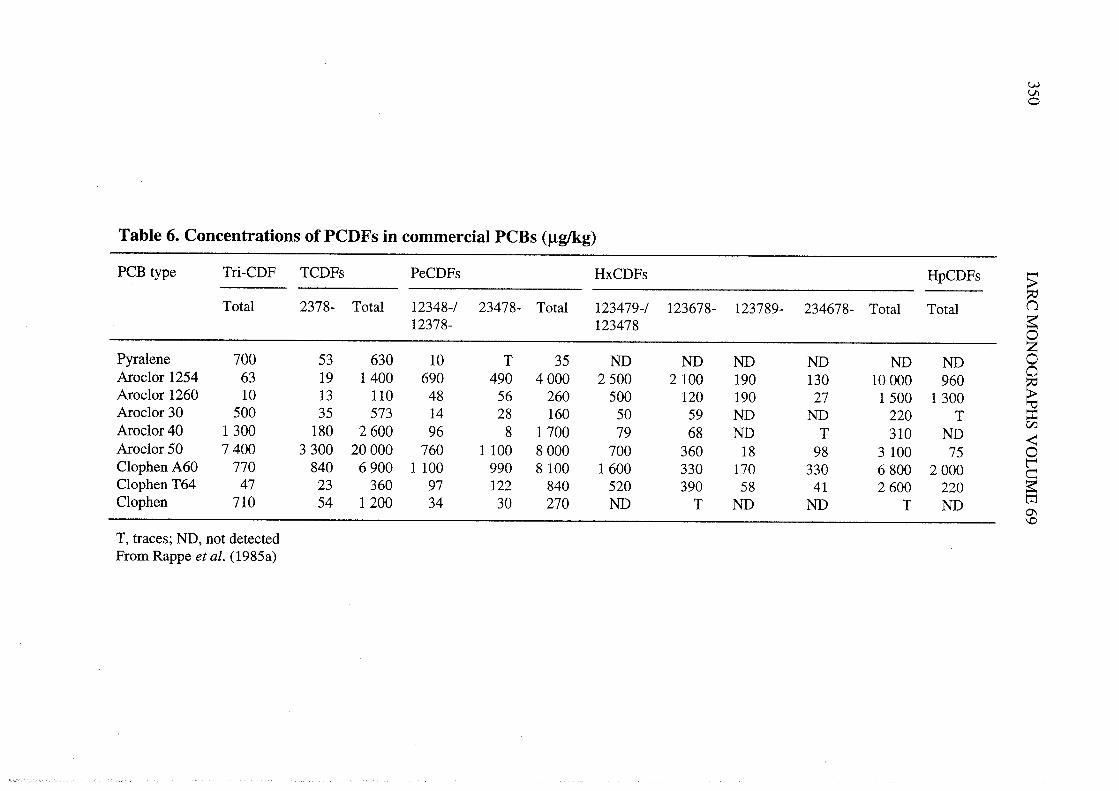
Vos et al. (1970) identified PCDFs (tetra- and penta-CDFs) in samples of EuropeanPCBs (Phenoclor DP-6 and Clophen A60) but not in a sample of American Aroclor1260. The toxic effects of these PCBs were found to parallel the levels of PCDFs present.Bowes et al. (1975) examined a series of Aroclors as well as the same samples ofAroclor 1260, Phenoclor DP-6 and Clophen A60 previously analysed by Vos et aL.(1970). They used packed column gas chromatography (GC) with low-resolution massspectrometry and very few standard compounds and reported that the most abundantPCDFs were PeCDFs (Table 5). Using a complete set of PCDF standards and high-resolution GC, Rappe et aL. (1985a) determned the levels of 2,3,7,8-substituted PCDPsin commercial PCB products (see Table 6).
Table S. Concentrations of PCDFs in PCBs (mglg)
PCBa TCDFs PeCDFs HxCDFs Total
Aroclor 1248 (1969) 0.5 1.2 0.3 2.0Aroclor 1254 (1969) 0.1 0.2 lA 1.7Aroclor 1254 (1970) 0.2 OA 0.9 1.5Aroclor 1260 (1969) 0.1 OA 0.5 1.0Aroclor 1260 (lot AK3) 0.2 0.3 0.3 0.8Aroclor 1016 (1972) ND ND NDClophen A 60 lA 5.0 2.2 8APhenoclor DP-6 0.7 10.0 2.9 13.6
From Bowes et al. (1975)ND, not detected at 0.001 mglkga Production year in parentheses
(ii) Chlorophenols
Chlorophenols (see IARC, 1986b; 1987c) have been used extensively since the 1950sas insecticides, fungicides, mould inhibitors, antiseptics and disinfectants. ln 1978, theannual world production was estimated to be approximately 150 000 tonnes (Rappe
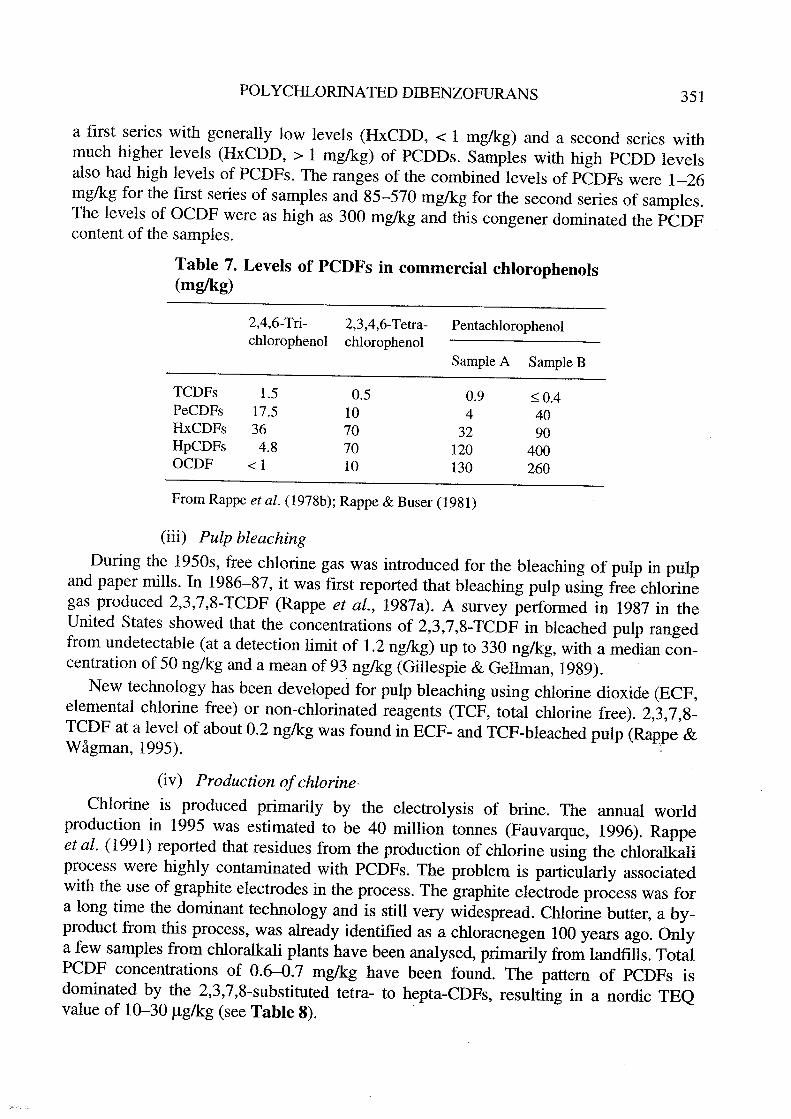
et aL., 1979a). Due to occupational and environmental risks, the use of chlorophenols hasnow been phased out in most European countries and in a few countres outside Europe.The most important use of 2,4,6-tr-, 2,3,4,6-tetra- and pentachlorophenol (PCP) andtheir salts is for wood preservation. PCP is also used as a fungicide for slIme control inthe manufacture of paper pulp and for a varety of other purposes such as in cutting oilsand fluids, for tanning leather and in paint, glues and outdoor textiles. Table 7summarzes a number of relevant analyses of the levels of PCDFs in commercial chloro-phenol formulations (Rappe et aL., 1978b).
Buser and Bosshardt (1976) reported the results of a survey of the PCDF and PCDDcontent of PCP and its sodium salt from commercial sources in Switzerland (analyticalmethQ(l AC). On the basis of the results, the samples could be divided into two groups:
lNVIo
POL YCHLORIA TED DIBENZOFURAS 351
a first series with generally low levels (HxCDD, -o 1 mg/kg) and a second series withmuch higher levels (HxCDD, ~ 1 mg/kg) of PCDDs. Samples with high PCDD levelsalso had high levels of PCDFs. The ranges of the combined levels of PCDFs were 1-26mg/kg for the first series of samples and 85-570 mg/kg for the second series of samples.The levels of OCDF were as high as 300 mg/kg and this congener dominated the PCDFcontent of the samples.
Table 7. Levels of PCDFs in commercial chlorophenols(mg/g)
2,4,6- Tn- 2,3,4,6- Tetra- Pentachlorophenolchlorophenol chlorophenol
Sample A Sample B
TCDFs 1.5 0.5 0.9 S 0.4PeCDFs 17.5 10 4 40HxCDFs 36 70 32 90HpCDFs 4.8 70 120 400OCDF .: 1 10 130 260
From Rappe et al. (1978b); Rappe & Buser (1981)
(iii) Pulp bleachingDuring the 1950s, free chlorine gas was introduced for the bleaching of pulp in pulp
and paper mills. ln 1986-87, it was first reported that bleaching pulp using free chlorinegas produced 2,3,7,8-TCDF (Rappe et aL., 1987a). A survey performed in 1987 in theUnited States showed that the concentrations of 2,3,7,8-TCDF in bleached pulp rangedfrom undetectable (at a detection limit of 1.2 ng/kg) up to 330 ng/kg, with a medIan con-centration of 50 ng/kg and a mean of 93 ng/kg (Gilespie & Gellman, 1989).
New technology has been developed for pulp bleaching using chlorine dioxide (ECF,elemental chlorine free) or non-chlorinated reagents (TCF, total chlorine free). 2,3,7,8-TCDF at a level of about 0.2 ng/kg was found in ECF- and TCF-bleached pulp (Rappe &Wågman, 1995).
(iv) Production of chlorine-
Chlorine is produced primarly by the electrolysis of brine. The annual worldproduction in 1995 was estimated to be 40 millon tonnes (Fauvarque, 1996). Rappe
et al. (1991) reported that residues from the production of chlorine using the chloralaliprocess were highly contamnated with PCDFs. The problem is paricularly associatedwith the use of graphite electrodes in the process. The graphite electrode process was fora long time the dominant technology and is stil very widespread. Chlorine butter, a by-product from this process, was already identified as a chloracnegen 100 years ago. Onlya few samples from chloralal plants have been analysed, primary from landfills. TotaPCDF concentrations of 0.6-0.7 mg/kg have been found. The pattern of PCDFs isdominated by the 2,3,7,8-substituted tetra- to hepta-CDFs, resulting in a nordic TEQvalue of 10-30 l.gJkg (see Table 8). .
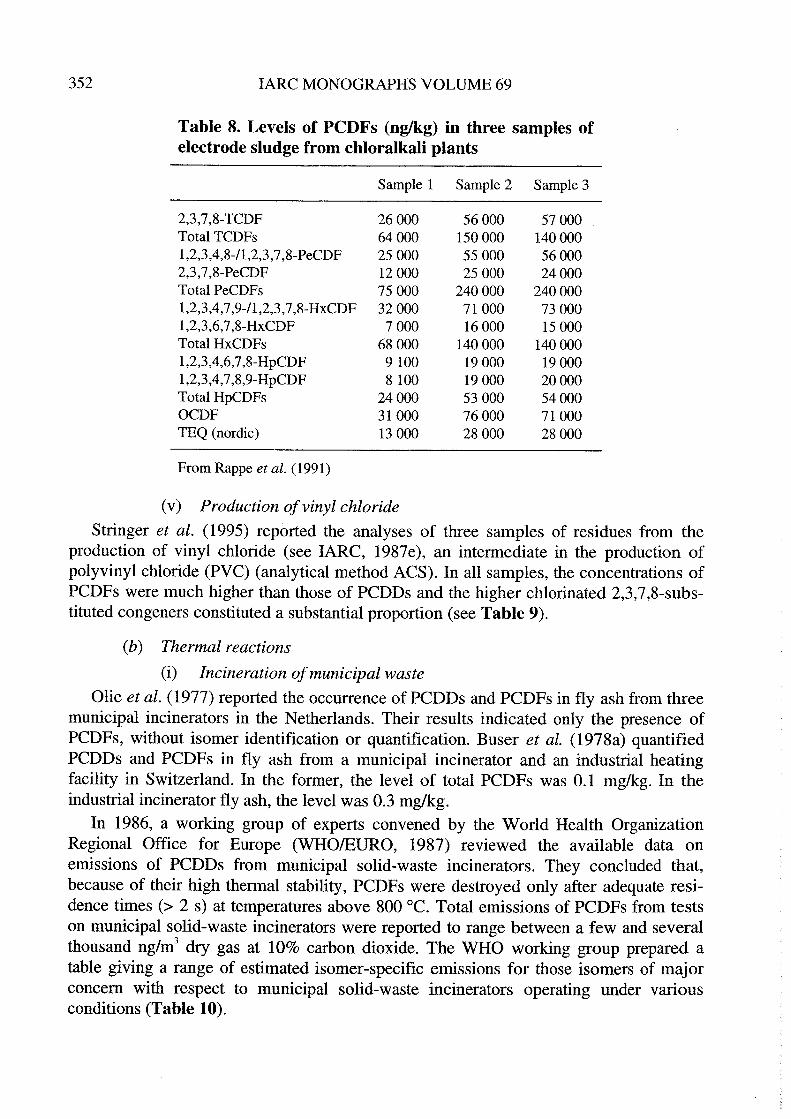
352 IARC MONOGRAHS VOLUME 69
Table 8. Levels of PCDFs (ng/g) in three samples ofelectrode sludge from chloralkali plants
Samp1e 1 Samp1e 2 Samp1e 3
2,3,7,8-TCDF 26 000 56 000 57 000Total TCDFs 64 000 150 000 140 0001,2,3,4,8-/1 ,2,3,7 ,8-PeCDF 25 000 55 000 56 0002,3,7,8-PeCDF 12 000 25 000 24 000Total PeCDFs 75 000 240 000 240 0001,2,3,4,7,9-/1,2,3,7,8-lIxCDF 32 00 71 000 73 0001,2,3,6,7,8-lIxCDF 7 000 16 000 15 000Tota1lIxCDFs 68 000 140 000 140 0001,2,3,4,6,7,8-lIpCDF 9100 19 000 19 0001,2,3,4,7,8,9-lIpCDF 8100 19 000 20 000TotallIpCDFs 24 000 53 000 54 000OCDF 31000 76 000 71000TEQ (nordic) 13 000 28 000 28 000
From Rappe et aL. (1991)
(v) Production ofvinyl chloride
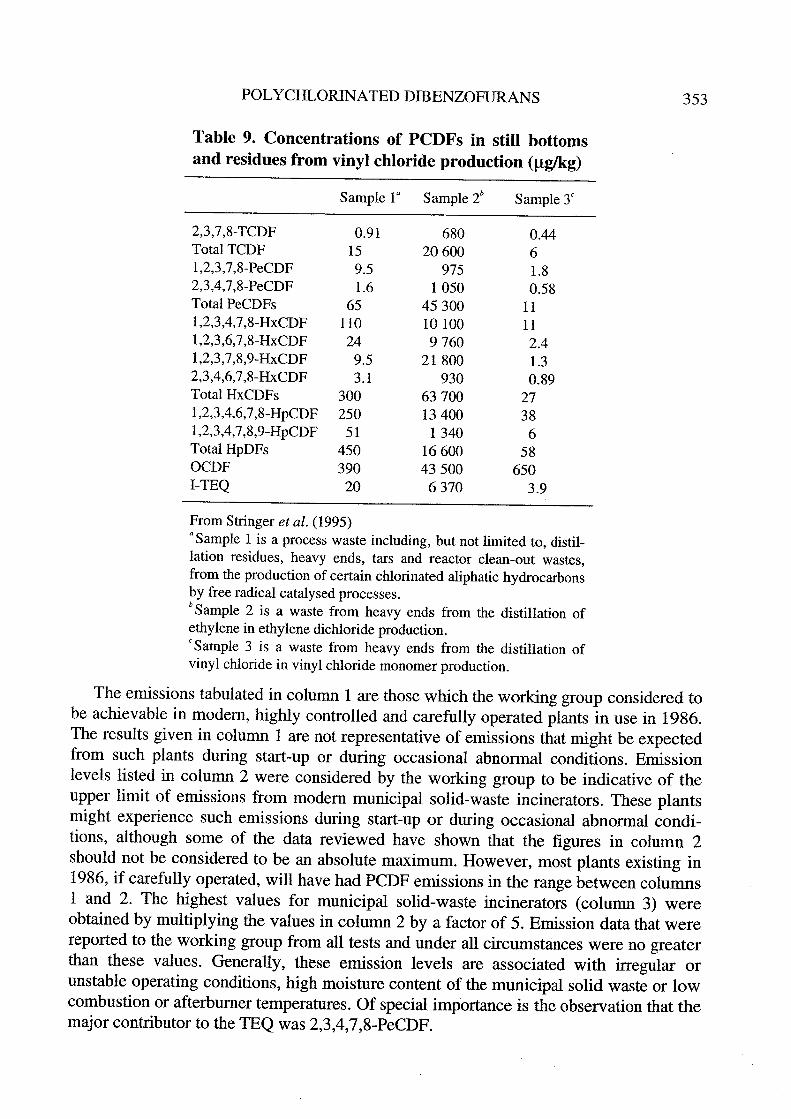
Strnger et al. (1995) reported the analyses of three samples of residues from the
production of vinyl chloride (see IARC, 1987e), an intermediate in the production ofpolyvinyl chloride (PVC) (analytical method ACS). ln aH samples, the concentrations ofPCDFs were much higher than those of PCDDs and the higher chlorinated 2,3,7,8-subs-tituted congeners constituted a substantial proportion (see Table 9).
(b) Thermal reactions
(i) Incineration of municipal waste
Olie et al. (1977) reported the occurrence of PCDDs and PCDFs in fly ash from threemunicipal incinerators in the Netherlands. Their results indicated only the presence ofPCDFs, without isomer identification or quantification. Buser et aL. (1978a) quantifiedPCDDs and PCDFs in fly ash from a municipal incinerator and an industrial heatingfacility in Switzerland. ln the former, the level of total PCDFs was 0.1 mg/kg. ln theindustrial incinerator fly ash, the level was 0.3 mg/kg.
ln 1986, a working group of experts convened by the W orld Health Organzation
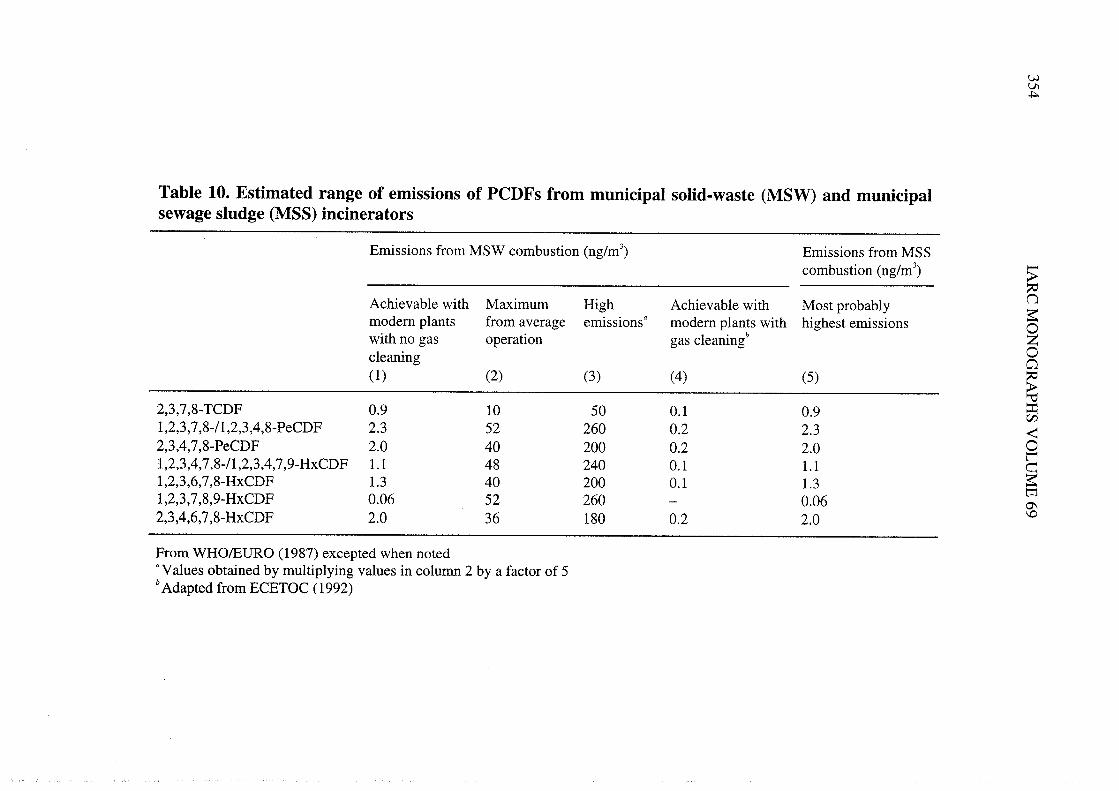
Regional Office for Europe (WHOÆURO, 1987) reviewed the available data onemIssions of PCDDs from municipal solid-waste incinerators. They concluded that,because of their high thermal stabilty, PCDFs were destroyed only after adequate resi-dence times (~ 2 s) at temperatures above 800°C. Total emissions of PCDFs from testson municipal solid-waste incinerators were reported to range between a few and severalthousand ng/m3 dry gas at 10% carbon dioxide. The WHO working group prepared atable giving a range of estimated isomer-specific emissions for those isomers of majorconcern with respect to municipal solid-waste incinerators operating under varousconditions (Table 10).
POL YCHLORIATED DIBENZOFURAS 353
Table 9. Concentrations of PCDFs In still bottomsand residues from vinyl chloride production (llglg)
Sample 1 a Sample 2b Sample 3c
2,3,7,8-TCDF 0.91 680 0.44Total TCDF 15 20 600 61,2,3,7,8-PeCDF 9.5 975 1.82,3,4,7,8-PeCDF 1.6 1050 0.58Total PeCDFs 65 45 300 111,2,3,4,7,8-HxCDF 110 10 100 111,2,3,6,7,8-HxCDF 24 9760 2.41,2,3,7,8,9-HxCDF 9.5 21 800 1.32,3,4,6,7,8-HxCDF 3.1 930 0.89Total HxCDFs 300 63 700 271,2,3,4,6,7,8-HpCDF 250 13 400 381,2,3,4,7,8,9-HpCDF 51 1340 6Total HpDFs 450 16 600 58OCDF 390 43 500 6501- TEQ 20 6370 3.9
From Strnger et aL. (1995)a Samp1e 1 is a process waste induding, but not limited to, distil-
lation residues, heavy ends, tars and reactor dean-out wastes,from the production of certain ch10rinated aliphatic hydrocarbonsby free radical catalysed processes.b Sample 2 is a waste from heavy ends from the distilation of
ethylene in ethy1ene dichloride production.c Samp1e 3 is a waste from heavy ends from the distilation of
vinyl chloride in vinyl ch10ride monomer production.
The emissions tabulated in column 1 are those which the working group considered tobe achievable in modem, higWy controlled and carefully operated plants in use in 1986.The results given in column 1 are not representative of emissions that might be expectedfrom such plants during star-up or during occasional abnormal conditions. Emission
Jevels listed in column 2 were considered by the working group to be indicative of theupper limit of emissions from modern municipal solid-waste incinerators. These plantsmight experience such emissions during star-up or durng occasional abnormal condi-tions, although some of the data reviewed have shown that the figures in column 2should not be considered to be an absolute maximum. However, most plants existing in1986, if carefully operated, wil have had PCDF emissions in the range between columns1 and 2. The highest values for municipal solid-waste incinerators (column 3) wereobtaned by multiplying the values in column 2 by a factor of 5. Emission data that werereported to the workig group from all tests and under all circumstances were no greaterthan these values. Generally, these emission levels are associated with iregular or
unstable operating conditions, high moi sture content of the municipal solid waste or lowcombustion or afterbumer temperatures. Of special importance is the observation that themajor contrbutor to the TEQ was 2,3,4,7,8-PeCDF.
VJVi.t
Table 10. Estimated range of emissions of PCDFs from municipal solid-waste (MSW) and municipalsewage sludge (MSS) incinerators
Emissions from MSW combustion (ng/m3) Emissions from MSScombustion (ng/m3) ;;~
Achievable with Maximum High Achievable with Most probably nmodern plants from average emiSSlOns
a modern plants with highest emissions ~0with no gas operation gas c1eaning
b Zc1eaning 0a(1) (2) (3) (4) (5)
~2,3,7,8-TCDF 0.9 10 50 0.1 0.9 ::
C/1,2,3,7,8-/1,2,3,4,8-PeCDF 2.3 52 260 0.2 2.3 --2,3,4,7,8-PeCDF 2.0 40 200 0.2 2.0 0
l'1,2,3,4,7,8-/1,2,3,4,7,9- HxCDF 1.1 48 240 0.1 1.1~1,2,3,6,7,8-HxCDF 1.3 40 200 0.1 1.3 tr1,2,3,7,8,9-HxCDF 0.06 52 260 - 0.06 0\
2,3,4,6,7,8-HxCDF 2.0 36 180 0.2 2.0 1.
From WHOÆURO (1987) excepted when noteda Values obtained by multiplying values in column 2 by a factor of 5b Adapted from ECETOC (1992)
POL YCHLORIA TED DIBENZOFURAS 355
During the second half of the 1980s and 1990, regulatory agencies in severalcountries, such as Germany, the Netherlands and Sweden, announced strict regulationsfor municipal solid-waste incinerators. The European Union value is 0.1 ng TEQ/m3(European Union, 1994) (see column 4, Table 10). This directive has resulted in theintroduction of modem air pollution control devices and, together with improved bUffingconditions, has led to a decrease in PCDF emissions from municipal solid-waste
incinerators, which had been considered to be major sources.
(ii) Incineration of sewage sludge
Sludge from municipal waste-water treatment plants may be incinerated after beingdehydrated. The WHO working group in 1986 reviewed the available data from muni-cipal sewage sludge incinerators and found that PCDD and PCDF emissions from thistype of plant were generally lower than emissions from municipal solid-waste inci-nerators (see Table 10, column 5) (WHOÆURO, 1987).
(iii) Incineration of hospital waste
Doyle et al. (1985) c1aimed that the incomplete combustion of certain hospital wastescontaining halogenated compounds could produce high emissions of PCDFs. They foundthe mean levels of total PCDFs to be 156 ng/m3, but no isomer-specific data wereavailable. Data cited by the United States Environmental Protection Agency indicate thatflue gas emissions from hospital waste incinerators are in the range of 10-100 ngI-TEQlm3, higher than the levels achievable with modem municipal solid-waste inci-nerators (United States Environmental Protection Agency, 1994; Thomas & Spiro, 1995).(The W orking Group noted that, due to smaller emission volumes, the overall emissionsfrom hospital waste incinerators are generally lower than those from the municipal solid-waste incinerators.)
(iv) Incineration ofpolyvinyl chio ride (PVC)The extent to which PCDFs are formed during the combustion of PVC is a contro-
versial issue. However, the incineration conditions appear to be quite important. On thebasis of laboratory experiments, Chrstmann et al. (1989a) considered PVC to be animportant source of PCDFs. However, experiments performed in incinerators showed theeffect of PVC on the formation of PCDFs to be minimal (Frankenhaeuser et al., 1993;Wikström et aL., 1996).
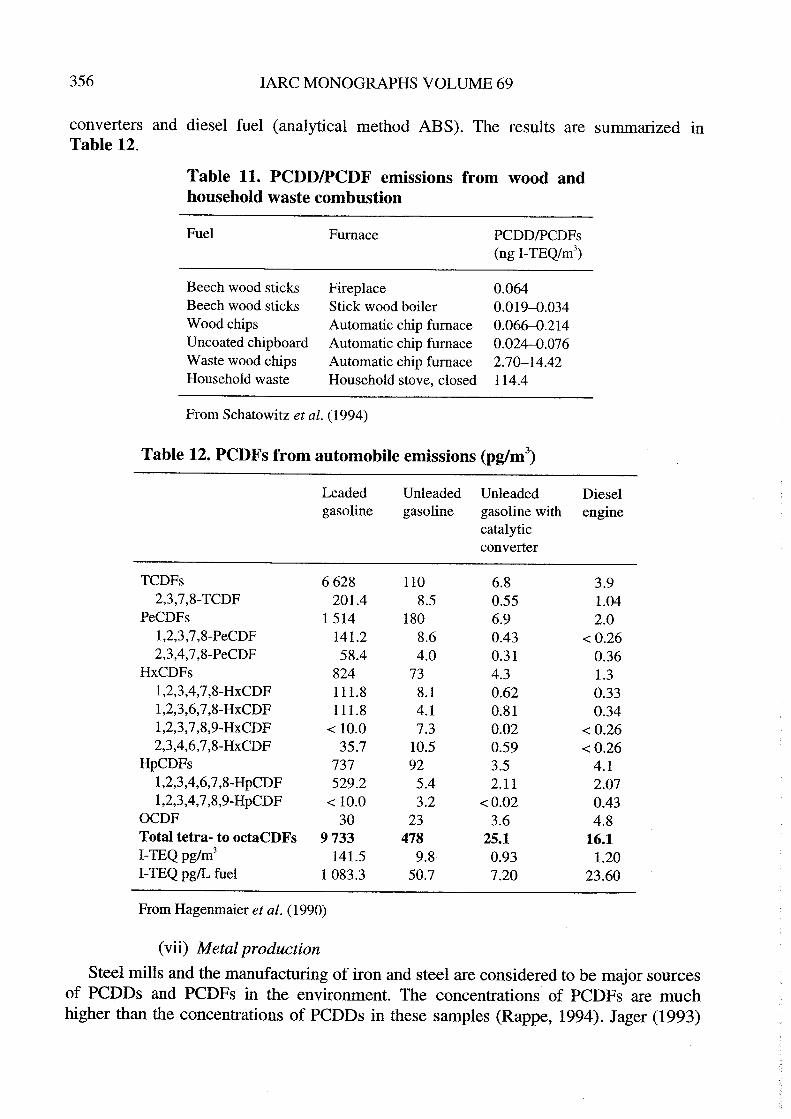
(v) Combustion ofwood
Schatowitz et aL. (1994) studied PCDD/PCDF emissions from small-scale laboratorystudies of combustion of wood and household waste (analytical method ABS). Theresults (in ng I-TEQ/m3) are summarzed in Table 11. Data on PCDDs and PCDFs arenot separated.
(vi) Automobile emissions
Hagenmaier et al. (1990) reported on the emissions of PCDFs and the lower chlori-nated congeners and brominated analogues in automobile emissions from four represen-tative experiments using leaded gasoline, unleaded gasoline with or without catalytic
356 lARe MONOGRAPHS VOLUME 69
converters and diesel fuel (analytical method ABS). The results are summarzed IITable 12.
Table Il. PCDD/PCDF emISSlOns from wood and
household waste combustion
Fuel Fumace PCDDIPCDFs(ng 1- TEQ/m3)
Beech wood sticksBeech wood sticksWood chipsUncoated chipboardWaste wood chipsHouseho1d waste
Firep1aceStick wood boi1erAutomatic chip fumaceAutomatic chip fumaceAutomatic chip fumaceHouseho1d stove, c10sed
0.0640.019-D.0340.066-.2140.024-.0762.70-14.42114.4
From Schatowitz et aL. (1994)
Table 12. PCDFs from automobile emissions (pg!m3)
Leaded Unleaded Un1eaded Dieselgasoline gasoline gasoline with engine
catalyticconverter
TCDFs 6628 110 6.8 3.92,3,7,8-TCDF 201.4 8.5 0.55 1.04
PeCDFs 1514 180 6.9 2.01,2,3,7,8-PeCDF 141.2 8.6 0.43 -c0.262,3,4,7,8-PeCDF 58.4 4.0 0.31 0.36
HxCDFs 824 73 4.3 1.31,2,3,4,7,8-HxCDF 111.8 8.1 0.62 0.331,2,3,6,7,8-HxCDF 111.8 4.1 0.81 0.341,2,3,7,8,9-HxCDF -c 10.0 7.3 0.02 -c0.262,3,4,6,7,8-HxCDF 35.7 10.5 0.59 -c0.26
HpCDFs 737 92 3.5 4.11,2,3,4,6,7,8-HpCDF 529.2 5.4 2.11 2.071,2,3,4,7,8,9-HpCDF -c 10.0 3.2 -c0.02 0.43
OCDF 30 23 3.6 4.8Total tetra- to octaCDFs 9733 478 25.1 16.11- TEQ pg/m3
141.5 9.8 0.93 1.20I-TEQ pg/L fuel 1 083.3 50.7 7.20 23.60
From Hagenmaier et al. (1990)
(vii) Metal productionSteel mils and the manufacturing of iron and steel are considered to be major sources
of PCDDs and PCDFs in the envIronment. The concentrations of PCDFs are muchhigher than the concentrations of PCDDs in these samples (Rappe, 1994). Jager (1993)
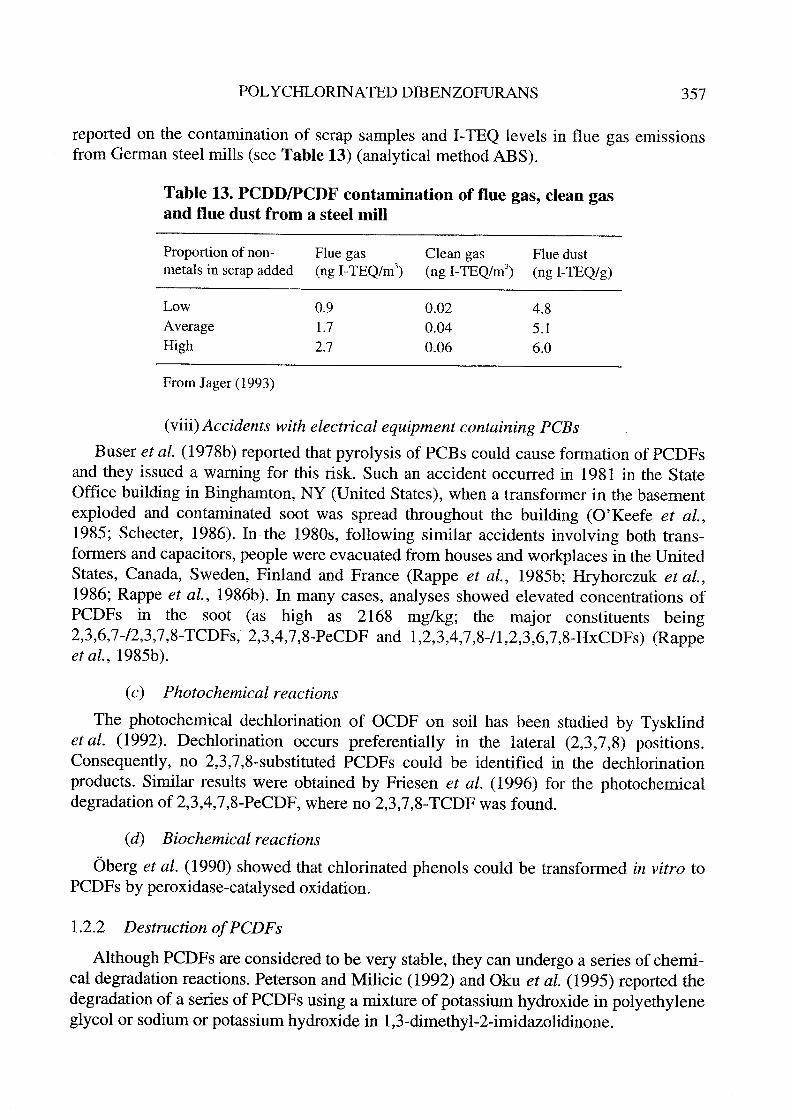
POL YCHLORINATED DIBENZOFURAS 357
reported on the contamination of scrap samples and I-TEQ levels in flue gas emissionsfrom German steel mills (see Table 13) (analytical method ABS).
Table 13. PCDD/PCDF contamination of flue gas, c1ean gasand flue dust from a steel mil
Proportion of non-meta1s in scrap added
Flue gas(ng 1- TEQ/m3)
C1ean gas
(ng I-TEQ/m3)Flue dust
(ng I-TEQ/g)
LowAverageHigh
0.91.7
2.7
0.020.040.06
4.85.1
6.0
From Jager (1993)
(viii) Accidents with electrical equipment containing PCBs
Buser et al. (1978b) reported that pyrolysis of PCBs could cause formation of PCDFsand they issued a waring for this risk. Such an accident occurred in 1981 in the StateOffice building in Binghamton, NY (United States), when a transformer in the basementexploded and contaminated soot was spread throughout the building (O'Keefe et aL.,1985; Schecter, 1986). ln the 1980s, following similar accidents involving both trans-formers and capacitors, people were evacuated from houses and workplaces in the UnitedStates, Canada, Sweden, Finland and France (Rappe et al., 1985b; Hrhorczuk et aL.,1986; Rappe et aL., 1986b). ln many cases, analyses showed elevated concentrations ofPCDFs in the soot (as high as 2168 mg/kg; the major constituents being2,3,6,7-/2,3,7,8-TCDFs, 2,3,4,7,8-PeCDF and 1,2,3,4,7,8-/1,2,3,6,7,8-HxCDFs) (Rappeet aL., 1985b).
(c) Photochemical reactions
The photochemical dechlorination of OCDF on soil has been studied by Tysklindet al. (1992). Dechlorination occurs preferentially in the lateral (2,3,7,8) positions.Consequently, no 2,3,7,8-substituted PCDFs could be identified in the dechlorinationproducts. Similar results were obtained by Friesen et al. (1996) for the photochemicaldegradation of2,3,4,7,8-PeCDF, where no 2,3,7,8-TCDF was found.
(d) Biochemical reactions
Öberg et al. (1990) showed that chlorinated phenols could be transformed in vitro toPCDFs by peroxidase-catalysed oxidation.
1.2.2 Destruction of PCDFs
Although PCDFs are considered to be very stable, they can undergo a series of chemi-cal degradation reactions. Peterson and Milcic (1992) and Oku et aL. (1995) reported thedegradation of a series of PCDFs using a mixture of potassium hydroxide in polyethyleneglycol or sodium or potassium hydroxide in 1,3-dimethyl-2-imidazolidinone.
358 IARC MONOGRAHS VOLUME 69
v ollmuth and Niessner (1995) reported no significant degradation of PCDFs by ultra-violet radiation, ozone or a combination of the two.
Thermal degradation of PCDFs occurs at temperatures above 800°C and at residencetimes of longer than 2 s (WHOÆURO, 1987), but the conditions required for thermaldegradation are matrix-dependent.
Adriaens et al. (1995) reported on the biologically mediated reductive dechlorinationof 2,3,4,7,8-PeCDF in sediments using inocula derived from contamInated environments.
1.3 Occurrence
AlI tissue concentrations reported in this section are lipid-based (as nglkg fat), unlessotherwise stated.
1.3.1 Occupational and accidental exposures to PCDFs
(a) Occupational exposures
(i) Exposure du ring production of PCBsAlthough several cohorts of PCB workers have been studied, no study has taken
PCDFs into account.
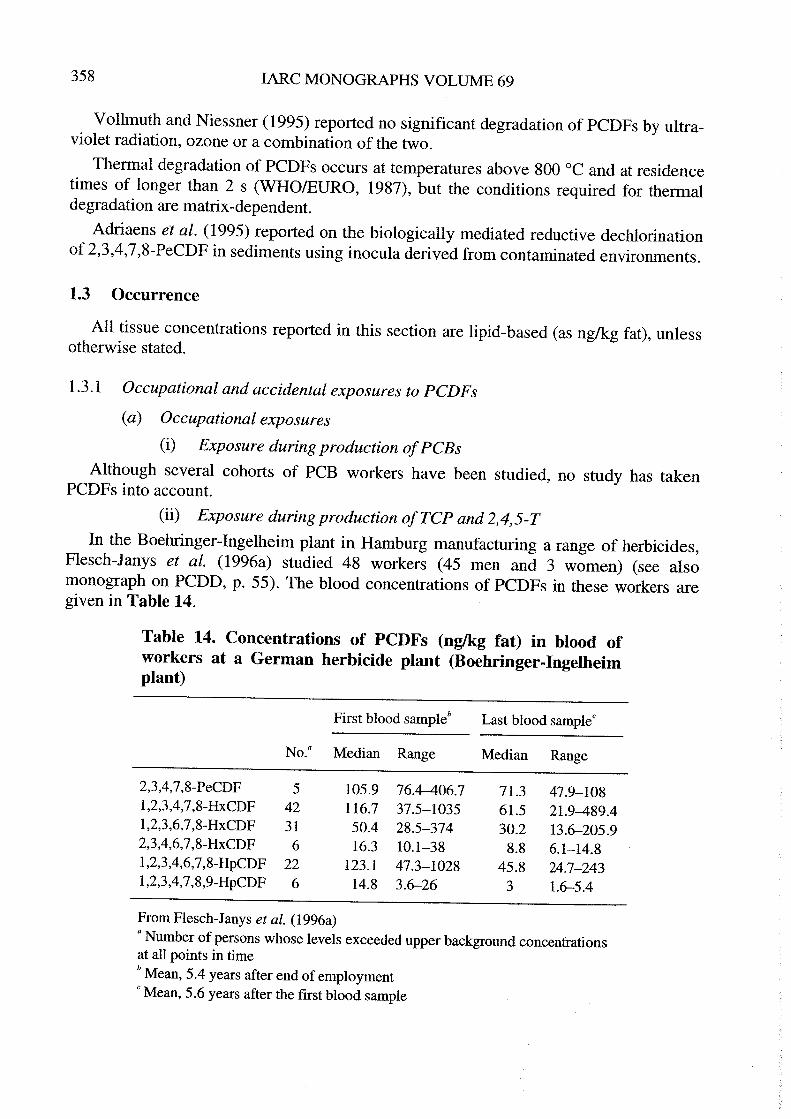
(ii) Exposure du ring production ofTCP and 2,4,5-Tln the Boehrnger-Ingelheim plant in Hamburg manufacturing a range of herbicides,
Flesch-Janys et aL. (1996a) studied 48 workers (45 men and 3 women) (see alsomonograph on PCDD, p. 55). The blood concentrations of PCDFs in these workers aregiven in Table 14.
Table 14. Concentrations of PCDFs (nglg fat) in blood ofworkers at a German herbicide plant (Boehringer-Ingelheimplant)
First blood sampleb Last blood samplec
No.a Median Range Median Range
2,3,4,7,8-PeCDF 5 105.9 76.4-06.7 71.3 47.9-1081,2,3,4,7,8-HxCDF 42 116.7 37.5-1035 61.5 21.9-489.41,2,3,6,7,8-HxCDF 31 50.4 28.5-374 30.2 13.6-205.92,3,4,6,7,8-HxCDF 6 16.3 10.1-38 8.8 6.1-14.81,2,3,4,6,7,8-HpCDF 22 123.1 47.3-1028 45.8 24.7-2431,2,3,4,7,8,9-HpCDF 6 14.8 3.6-26 3 1.6-5.4
From Flesch-Janys et aL. (1996a)a Number of persons whose levels exceeded upper background concentrations
at aIl points in timeb Mean, 5.4 years after end of employmentC Mean, 5.6 years after the first blood sample

POL YCHLORIA TED DIBENZOFURAS 359
(iii) Exposure during handling and spraying of2,4,5-TProfessional pesticide applicators involved in ground-level spraying of 2,4,5- T in
New Zealand are claimed to be the group most heavily exposed to agricultural use of2,4,5-T in the world (Smith et al., 1992a). Many of the applicators sprayed for more thansix months per year and sorne were spraying for more than 20 years. Measurements ofPCDFs in blood serum of nine of these workers are given in Table 15 (see also mono-graph on PCDDs, p. 57).
Table 15. Levels of PCDFs in serum of nine 2,4,5-Tapplicators and nine matched control subjects in NewZealand
Congener Average level (nglkg fat:! SE)" Ratiob
Applicator Matched control
2,3,7,8-TCDF 1.6 :! 0.3 1.7:! 0.3 0.91,2,3,7,8-PeCDF 0( 2.1 :! 0.2 0( 2.0 :! 0.2 1.2,3,4,7,8-PeCDF 8.0:!0.9 7.4:! 0.8 1.11,2,3,4,7,8-HxCDF 5.4 :! 0.3 5.1 :!0.5 1.11,2,3,6,7,8-HxCDF 5.5 :! 0.4 5.6:!0.6 1.01,2,3,7,8,9-HxCDF 0( 0.8:! 0.1 0( 0.8:! 0.1 1.02,3,4,6, 7 ,8-HxCD~ 0( 1.1 :! 0.4 0( 1.7 :! 0.2 1.11,2,3,4,6,7,8-HpCDF 14.2:! 0.7 16.0:! 2.3 0.91,2,3,4,7,8,9-HpCDFc 0( 1.6:! 0.1 0( 1.9 :! 0.3 0.8
From Smith et aL. (1992a)a Values are adjusted for totallipids in serum.b Ratio, average for applicators/average for matched control subjectscA number of positive signaIs were below the limit of quantification.
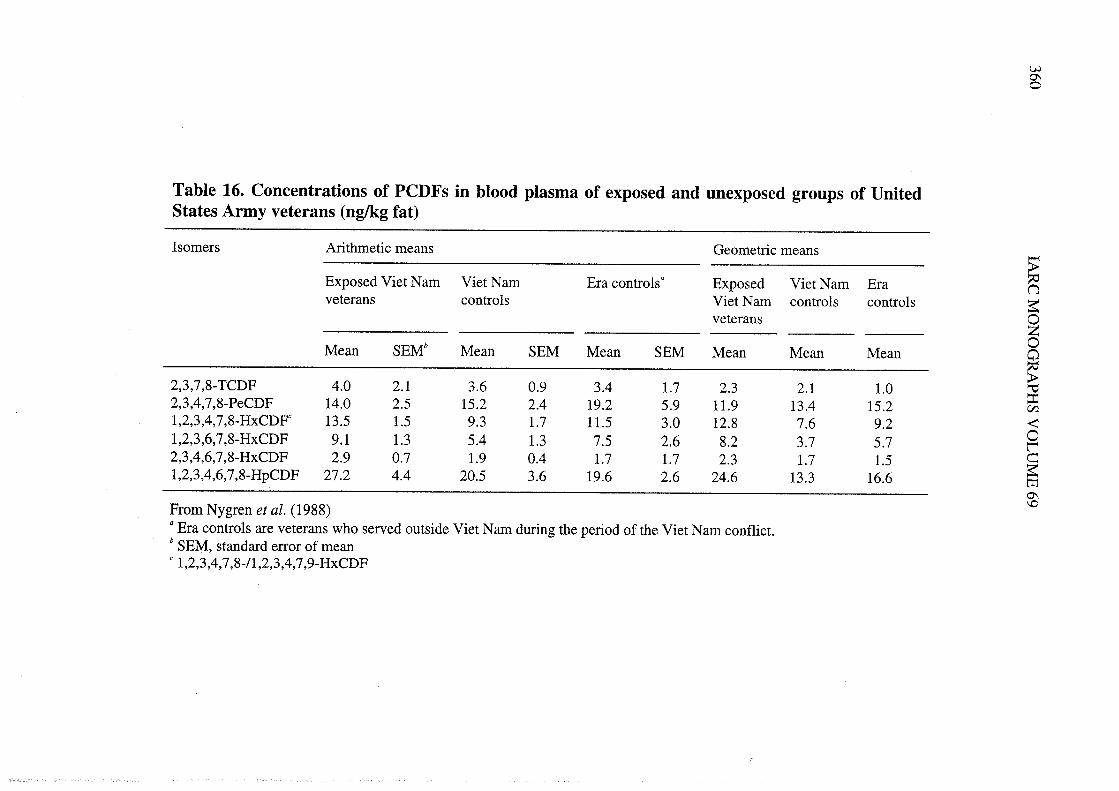
Miltary personnel in Viet Nam: Nygren et aL. (1988) analysed adipose tissue andblood samples collected 15-20 years after militar service from 27 men, 10 of whomwere heavily exposed during their service in Viet Nam, 10 of whom had marginalexposure during service and served as Viet Nam controls and seven veterans who did notserve in Viet Nam and were used as 'era' controls. The results for PCDFs levels aresummarzed in Table 16 (see also Section 1.3. 1 (a)(ii) of the monograph on PCDDs).
(iv) Exposure at incinerators
Studies of workers at incinerators have not found elevated tissue levels of PCDFs.Rappe et al. (1992), Päpke et aL. (1993a) and Böske et al. (1995) found only elevatedtissue levels of PCDDs.
(v) Metal production and recycling
Triebig et al. (1996) analysed the concentrations of PCDFs in the blood of 76 workersin a non-iron recycling plant in the south-western par of Germany. The results werecompared with those from a group of 102 controls. Elevated concentrations of PCDPs
360
"'~...-el;:~o"-i:=oi-bl"'~"-oi:~~el="'el~"'~"-oi:~~~o~e"-~-i:"'oo-.c=.-"-~QU
Z'
~~~ bl
~~= =o '-.-..
"-
~ =
i- ~
-= t
~ ..~ ~
= ~
o ~
U e
.. i-1"~~
"-- ~
,. ..~ ~
~~
IAR
C M
ON
OG
RA
PHS V
OL
UM
E 69
cr-ob
~ i:
i- 0
~ u
cri:~vSu.EvSovc.
s~ cr
Z Õ
.. bv i:~ 8s
~ ~
crcr Z
~o .. i-~.~ 2
~ ~ ~
ocr-obi:ou~i-~~
crZ
Õi-.. ..
v i:~ 8
cri:~vSu.....vs..~
s~z..v~"d cr
V i:
cs ~0. v~ ..~ ~
cri-vSocrI-
i:~v::a t" N i. v- \0
.. tn 0\ tn .. \Ó
.. ..~v::
.. oa ~ i. r- ("
N (" r- (" .. (".. ..
i:~v::C
' 0\ 00 N C
' \0N
""NO
ON
'¿.... N
~CZ
i. 0; a \0 i. \0
..ir("N..N
i:~v::oa N tn in t; ~
("o\..r-..O\
.. .. ..::~C
Z0\ -. r- (" -. \0
ON
--O("
i:~v::\0 N
(" "' 0\ tn("tnO
\in""o- N
~~CZ
.. ir v- n) r- "'
NN
....O.¿
i:~v::O
Otn-o\N
'¿'¿~O\N
i:-- N
" i:i: i: i: °
i:0ClC
lY1" u U
u ..i:ü~~~:i° v:i ~ :i 00
u 0. 00 00 00 i:
E- 00 i: i: i: \Ô
1 ~ .. .. .. ..00 r- -. \0 \0 -.
i: ., Cf M ., Cf
Cf Cf t' t' Cf t'
t't'''''t'''
..uiEi:ouS~Z..v~v.£4-o"do'Cv0.v....öJi:.c;:"d~Z..v~v"d...cr..;:o"dve;vcr i:o i: °.. ~ U
~ v ~
~§!:~O
\i-oo;..V
i-r-'- â) O
"¡-. ;; t: ~
t:vvn-t) ~ '" N~
i: cr ~::v-"d 1
Sb 8 ~ oo~
Z;;~ tî~o ~ ~
U ;:.("
§ ~ ~ ci~~C
Z..
i: 0 '" "
POL YCHLORIA TED DIBENZOFURAS 361
were found in the exposed group (up to 1138 ng/kg), around six times above the maximalblood concentrations in controls. Elevated levels were found paricularly for 2,3,4,7,8-PeCDF and for HxCDFs (analytical method ACS). ln another study, Bergschicker et al.(1994) found elevated concentrations of the same PCDFs in a group of 34 workersemployed in a primar and secondar copper smelter (analytical method ACS).
Menzel et al. (1996) reported elevated blood concentrations of PCDDs/PCDFs in agroup of 14 workers employed in welding and cutting of metals (welders: median, 29.9;bumers: median, 46.7; referents, 28.3 ng I-TEQ/kg).
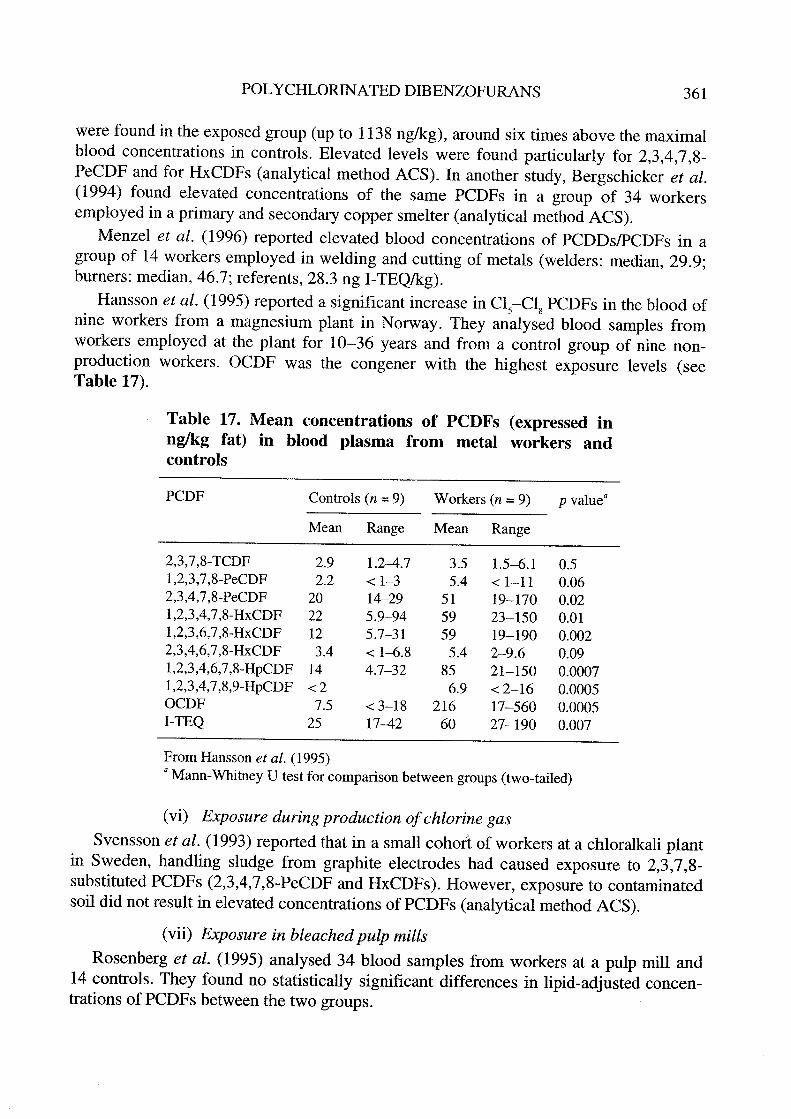
Hansson et al. (1995) reported a significant increase in CIS-Clg PCDFs in the blood ofni ne workers from a magnesium plant in Norway. They analysed blood samples fromworkers employed at the plant for 10-36 years and from a control group of nine non-production workers. OCDF was the congener with the highest exposure levels (seeTable 17).
Table 17. Mean concentrations of PCDFs (expressed inng!g fat) in blood plasma from metal workers and
con trois
PCDF Controls (n = 9)
Mean Range
Workers (n = 9) p valuea
Mean Range
2,3,7,8-TCDF 2.91,2,3,7,8-PeCDF 2.22,3,4,7,8-PeCDF 201,2,3,4,7,8-HxCDF 22
1,2,3,6,7,8-HxCDF 12
2,3,4,6,7,8-fICDF 3.4
1,2,3,4,6,7,8-HpCDF 14
1,2,3,4,7,8,9-HpCDF 0: 2OCDF 7.51- TEQ 25
1.2-4.70: 1-314-295.9-945.7-310: 1-6.84.7-32
0: 3-1817-42
3.55.4
515959
5.485
6.9216
60
1.5-6.10: 1-1119-17023-15019-1902-9.621-1500:2-1617-56027-190
0.50.060.020.010.0020.090.00070.00050.00050.007
From Hansson et al. (1995)a Mann-Whitney U test for comparson between groups (two-tailed)
(vi) Exposure du ring production of chlorine gasSvensson et al. (1993) reported that in a small cohort of workers at a chloralkali plant
in Sweden, handling sludge from graphite electrodes had caused exposure to 2,3,7,8-substituted PCDFs (2,3,4,7,8-PeCDF and HxCDFs). However, exposure to contaminatedsoil did not result in elevated concentrations of PCDFs (analytical method ACS).
(vii) Exposure in bleached pulp milsRosenberg et aL. (1995) analysed 34 blood samples from workers at a pulp mill and
14 controls. They found no statistically significant differences in lipid-adjusted concen-trations of PCDFs between the two groups.
362 IARC MONOGRAHS VOLUME 69
(viii) Exposure during production of pvc
Hansson et al. (1997) reported a weak correlation between length of employment inproduction of PVC (or vinyl chloride mono mer) and concentrations of PCDFs in theblood, especially 1,2,3,4,7,8- and 1,2,3,6,7,8-HxCDFs and 1,2,3,4,6,7,8-HpCDF.
(b) Accidental exposure
Repeated heating of PCBs in the presence of oxygen can result in formation ofPCDFs, polychlorinated quaterphenyls (PCQs) and other compounds. ln Japan andTaiwan, the use of PCBs as heat exchangers during the deodorizing of cooking oilresulted in contamination of cooking oil, presumably when the processing machinesleaked. These incidents caused thousands of cases of PCB/PCDF poisoning when thecontaminated oil was distributed and consumed.
(i) Yusho incident, Japan, 1968
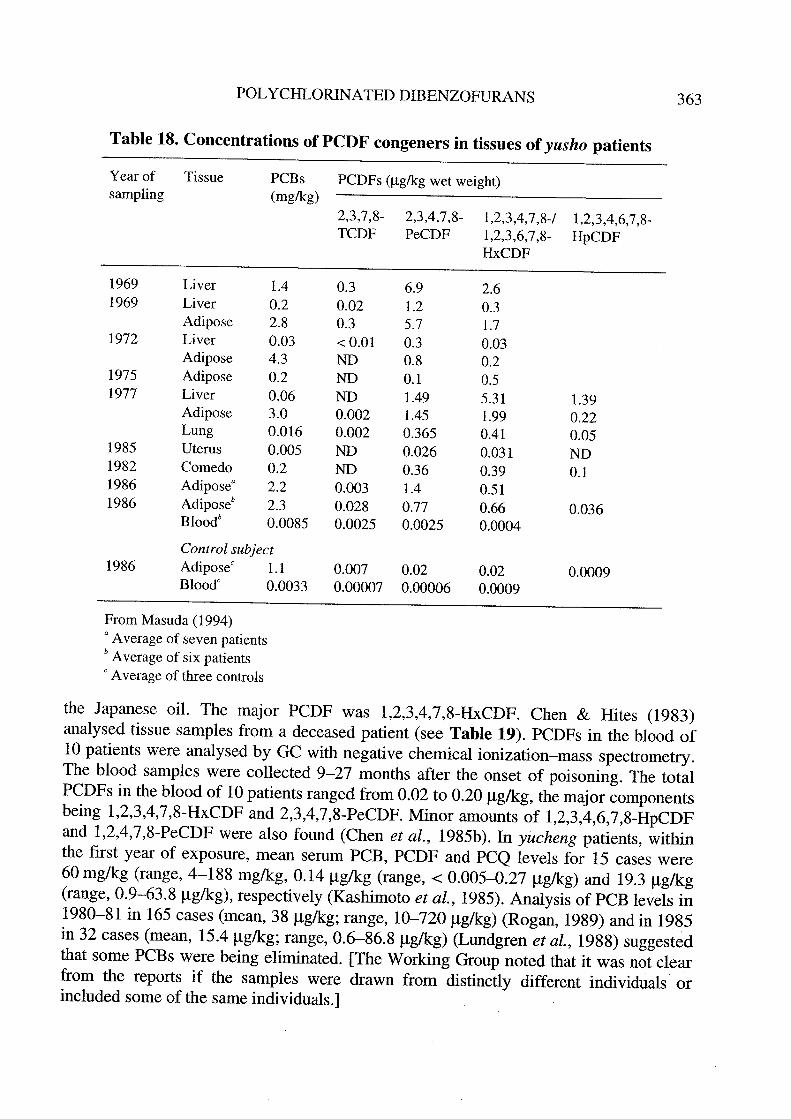
A mass poisoning, called the yusho ('oil disease') incident, occurred in western Japanin 1968. The disease was caused by ingestion of a specifie brand of rice oil that wascontaminated not only with PCBs but also with PCDFs, PCQs and other substances.About 2000 affected individuals (Chen et al., 1985a) were identified (1870 had beenregistered by 31 May 1990), primarly in the Fukuoka and Nagasak prefectures on theisland of Kyushu (Ikeda & Y oshimura, 1996). Although yusho patients had ingestedmore than 40 different PCDF congeners, Rappe et aL. (l979b) found that only a fewcongeners had been retained by the patients. Most of the retained congeners were foundto have the 2,3, 7 and 8 positions chlorinated. The missing congeners, apparently meta-bolized and excreted, were those with two vicinal hydrogenated c;;bon atoms in at leastone of the rings. Masuda (1994) determned concentrations of the major PCDF congenersidentified in tissues and blood at different sampling times (see Table 18). The highestconcentrations were found for 2,3,4,7,8-PeCDF and 1,2,3,4,7,8-/1,2,3,6,7,8-HxCDFs.Five years after exposure ended, the mean concentrations of PCBs in the adipose tissue,liver and blood of yusho cases were 1.9 mg/kg (ppm), 0.08 mglg and 6.7 llg/kg, respec-tively (Masuda et aL., 1985), which were about twice the levels in the control group.Levels of PCDFs in adipose tissue ranged from 6 to 13 Ilglg (Masuda et aL., 1985).Sixteen years after exposure, the mean level of PCQs in adipose tissue of yusho caseswas 207 Ilg/kg, approximately 100 times the level in Japanese controls (Kashimoto et aL.,1985).
(ii) Yucheng incident, Taiwan, 1979
ln 1979, 11 years after the Japanese yusho incident, a similar incident occurred incentral Taiwan. About 2000 pers ons were identified as yucheng patients, primarly fromTaichung and Changhwa counties (Chen & Rites, 1983; Chen et aL., 1985a). Oil sampleswere found to be contaminated with PCBs, PCDFs and PCQs, like the yusho oiL.However, the average chlorination level seemed to be higher in the Taiwanese oil than in
POL YCHLORINATED DIBENZOFURANS 363
Table 18. Concentrations of PCDF congeners in tissues of yusho patients
Year of Tissue
samplingPCBs PCDFs (¡.g/kg wet weight)( mg/kg)
2,3,7,8- 2,3,4,7,8- 1,2,3,4,7,8-/ 1,2,3,4,6,7,8-
TCDF PeCDF 1,2,3,6,7,8- HpCDFHxCDF
19691969
1972
19751977
1985198219861986
1986
Li ver 1.4 0.3 6.9 2.6Liver 0.2 0.02 1.2 0.3Adipose 2.8 0.3 5.7 1.7Liver 0.03 -0 0.01 0.3 0.03Adipose 4.3 ND 0.8 0.2Adipose 0.2 ND 0.1 0.5Liver 0.06 ND 1.49 5.31Adipose 3.0 0.002 1.45 1.99Lung 0.016 0.002 0.365 0.41Uterus 0.005 ND 0.026 0.031Comedo 0.2 ND 0.36 0.39Adiposea
2.2 0.003 1.4 0.51Adiposeb
2.3 0.028 0.77 0.66Bloodb 0.0085 0.0025 0.0025 0.0004
Control subjectAdiposeC
1.1 0.007 0.02 0.02Bloodc 0.0033 0.00007 0.00006 0.0009
1.390.220.05ND0.1
0.036
0.0009
From Masuda (1994)a Average of seven patientsb Average of six patientsC Average of three controls
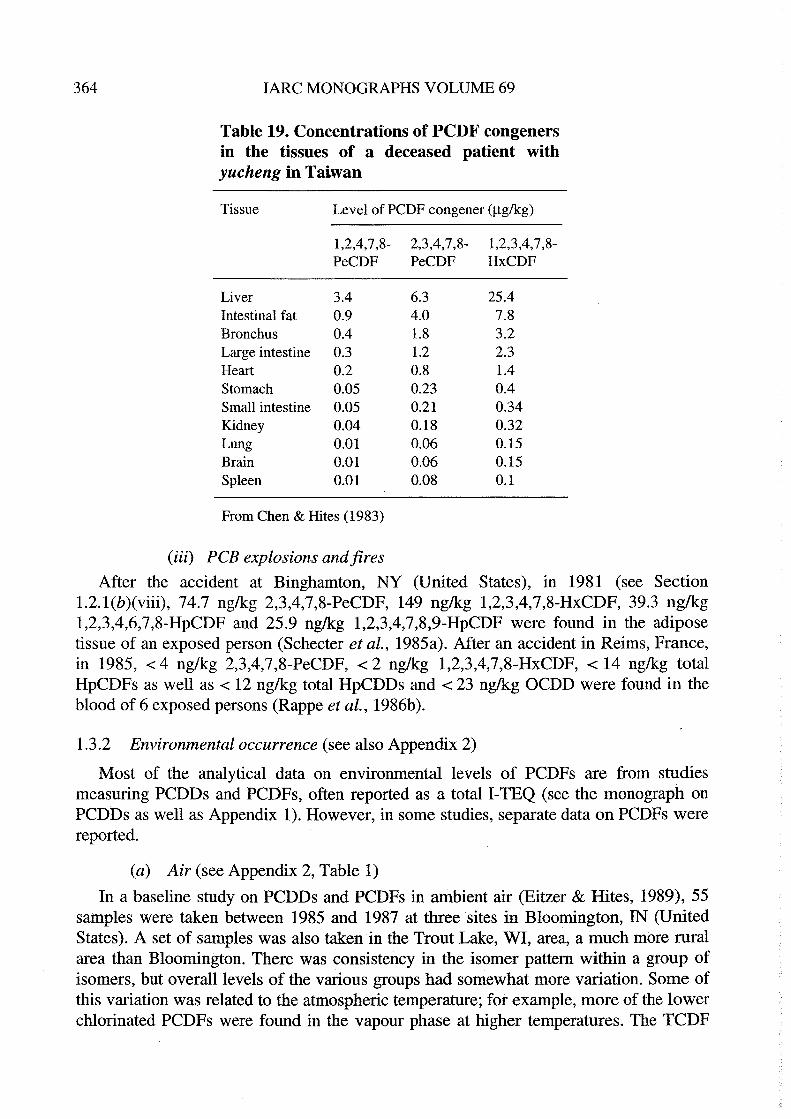
the Japanese oiL. The major PCDF was 1,2,3,4,7,8-HxCDF. Chen & Hites (1983)analysed tissue samples from a deceased patient (see Table 19). PCDFs in the blood of10 patients were analysed by GC with negative chemical ionization-mass spectrometr.The blood samples were collected 9-27 months after the onset of poisoning. The totalPCDFs in the blood of 10 patients ranged from 0.02 to 0.20 Jlg/kg, the major componentsbeing 1,2,3,4,7,8-HxCDF and 2,3,4,7,8-PeCDF. Minor amounts of 1,2,3,4,6,7,8-HpCDFand 1,2,4,7,8-PeCDF were also found (Chen et al., 1985b). ln yucheng patients, withinthe first year of exposure, mean serum PCB, PCDF and PCQ levels for 15 cases were60 mg/kg (range, 4-188 mg/kg, 0.14 Jlg/kg (range, -0 0.005-0.27 Jlg/kg) and 19.3 Jlg/kg(range, 0.9-63.8 Jlg/kg), respectively (Kashioto et aL., 1985). Analysis of PCB levels in1980-81 in 165 cases (mean, 38 Jlg/kg; range, 10-720 Jlg/kg) (Rogan, 1989) and in 1985in 32 cases (mean, 15.4 Jlg/kg; range, 0.6-86.8 Jlg/kg) (Lundgren et aL., 1988) suggestedthat some PCBs were being eliminated. (The W orking Group noted that it was not clearfrom the reports if the samples were drawn from distinctly different individuals orinc1uded sorne of the same individuals.)
364 IARC MONOGRAPHS VOLUME 69
Table 19. Concentrations of PCDF congenersin the tissues of a deceased patient with
yucheng in Taiwan
Tissue Level of PCDF congener (¡.glkg)
1,2,4,7,8- 2,3,4,7,8- 1,2,3,4,7,8-
PeCDF PeCDF HxCDF
Liver 3.4Intestinal fat 0.9Bronchus 0.4Large intestine 0.3Hear 0.2Stomach 0.05Small intestine 0.05
Kidney 0.04Lung 0.01Brain 0.01Spleen 0.01
6.34.01.8
1.20.80.230.210.180.060.060.08
25.47.83.22.31.40.40.340.320.150.150.1
From Chen & Hites (1983)
(iii) PCB explosions andfiresAfter the accident at Binghamton, NY (United States), in 1981 (see Section
1.2.1(b)(viii), 74.7 ng/kg 2,3,4,7,8-PeCDF, 149 ng/kg 1,2,3,4,7,8-HxCDF, 39.3 ng/kg1,2,3,4,6,7,8-HpCDF and 25.9 ng/kg 1,2,3,4,7,8,9-HpCDF were found in the adiposetissue of an exposed pers on (Schecter et aL., 1985a). After an accident in Reims, France,in 1985, .: 4 ng/kg 2,3,4,7,8-PeCDF, -c 2 ng/kg 1,2,3,4,7,8-HxCDF, -c 14 ng/kg total
HpCDFs as well as .: 12 ng/kg total HpCDDs and -c 23 ng/kg OCDD were found iIi theblood of 6 exposed persons (Rappe et aL., 1986b).
1.3.2 Environmentaloccurrence (see also Appendix 2)
Most of the analytical data on environmental levels of PCDFs are from studiesmeasuring PCDDs and PCDFs, often reported as a total I-TEQ (see the monograph onPCDDs as well as Appendix 1). However, in sorne studies, separate data on PCDFs werereported.
(a) Air (see Appendix 2, Table 1)
ln a baselIne study on PCDDs and PCDFs in ambient ai (Eitzer & Hites, 1989), 55samples were taken between 1985 and 1987 at thee sites in Bloomington, IN (UnitedStates). A set of samples was also taken in the Trout Lake, WI, area, a much more ruralarea than Bloomington. There was consistency in the isomer pattern within a group ofisomers, but overall levels of the varous groups had somewhat more varation. Some ofthis varation was related to the atmospheric temperature; for example, more of the lowercWorinated PCDFs were found in the vapour phase at higher temperatures. The TCDF
POL YCHLORIA TED DIBENZOFURANS 365
distribution between vapour and pariculate phases at various temperatures (with a detec-tion limit of 1 fg/m3 (femtogram = 10-15 g)) was as follows: at 3°C, 50% vapour phaseand 50% pariculate phase; at 12°C, 80% vapour phase and 20% pariculate phase; andat 26 cC, ~ 95% vapour phase and -: 5% pariculate phase.
Airbome concentrations of PCDDs and PCDFs in office buildings and in ambientoutdoor air in Boston, MA (United States), were measured by Kominsky and Kwoka(1989). Twelve of the 16 samples were collected inside the buildings and four sampleswere collected at the ambient air intake plenums of the buildings. PCDFs were generallynot detected, except for three samples that showed detectable concentrations of TCDFsand PeCDFs. Two of these samples (one inside and one ambient air) contained 2,3,7,8-TCDF. The I-TEQs for the two samples containing 2,3,7,8-TCDF were 0.34 and0.20 pg/m3, respectively.
(b) Water (see Appendix 2, Table 2)
Muir et al. (1995) analysed water and other matrces downstream from a bleachedkraft pulp mill on the Athabasca River (Alberta, Canada) in 1992. The 'dissolved phase'and the suspended pariculates from centrfuged samples were analysed for 41 PCDDs/-PCDFs ranging from mono- to octa-chlorinated congeners. Most PCDD congeners(including 2,3,7,8-TCDD) were undetectable (-: 0.1 pg/L) in the centrifugate; however,concentrations of 2,3,7,8-TCDF were above the detection limits at the 1 km site
(Weldwood; 0.1 pg/L) and at 48 km (Emerson Lake; 0.09 pg/L). ln 1993, 2,3,7,8-TCDFwas not detected in the dissolved phase (-: 0.1 pg/L) either 1 or 19 km downstream.
ln a survey conducted in 1986 for PCDDs/PCDFs and other pollutants in fini shedwater systems throughout New York State (United States), two TCDFs were found atconcentrations of 1 pg/L in one fini shed drinkng-water (Meyer et al., 1989). Except for atrace of OCDF detected in one location, no other PCDD or PCDF was detected in any ofthe 19 other community water systems surveyed.
(c) Soif (see Appendix 2, Table 3; also Appendix 1, Tables 4,5 and 8)
Topsoil samples were collected at six typical locations in Flanders, Belgium,including potential PCDD/PCDF source areas, and analysed (but not reportedJ isomer-specifically for PCDDs and PCDFs (Van Cleuvenbergen et al., 1993). Concentrations inthe 0-3-cm soil fraction, averaged per location, ranged between 2.1 nglkg at a rurallocation and 8.9 ng/kg (both as 1- TEQ) in an industralized area. GeneralIy, PCDFsniadeup 70 :t 6% of the 1- TEQ, whereas they accounted for 34 :t 6% of the sum of the coilcen-trations of the seventeen 2,3,7,8-substituted congeners.
At the end of 1990, high levels of PCDFs and PCDDs (10-100 llg I-TEQ/kg) weredetected in the surace gravel of playgrounds and sports fields in Germany durng routinemonitoring. The source of ths contamnation was identified as a fine-grained copper slagwhich originated from a former copper smelter at Marsberg, Germany. Ths material hadbeen used as a cover layer due to its red colour (Kieselrot), its reduced dust formationcompared to other gravels and its quick dring after rai. The PCDDs/PCDFs in thecopper slag were formed as by-products of a chlorinatig roasting process when up to8% sodium chloride and coal were added to a copper slag from an old mining process.
366 IARC MONOGRAHS VOLUME 69
About 800 000 tonnes of red copper slag was produced by this process, and a largequantity was used. Kieselrot contains a large number of highly chlorinated aromaticcompounds as its main organic components. It shows an unusual congener profile forPCDDs and PCDFs. The total amount of PCDFs was about one order of magnitudehigher than that of PCDDs. Furthermore, the concentrations increased from TCDFs toOCDF by at least one order of magnitude. The levels of OCDF exceeded those of OCDDby more than a factor of 10. These concentration ratios are typical for metallurgicalprocesses and have been found in the emissions from magnesium production. TypicalOCDF and 1- TEQ values in Kieselrot were 6311 and 64.5 l1g/kg, respectively (Döringet al., 1992; Theisen et al., 1993).
ln connection with analyses of highly contamnated samples related to the productionand use of chlorine (e.g., chloralkali electrolysis sludge and chromate sludge) in Sweden,Rappe et al. (1991 b) also found high PCDF levels in surface soil samples in the vicinityof the production plant. A typical PCDF congener pattern, called the 'chloralkali pattern',was identified in these soil samples.
(d) Food (see Appendix 2, Table 4)
All of the relevant data on PCDFs in foods derive from studies of both PCDPs andPCDDs. The monograph on PCDDs in this volume should be consulted for generalremarks. The data included have been selected to meet a number of criteria, including:relevance to dietar intake rather than environmental monitoring, appropriate detection
limits and appropriate analytical methodology. Some exceptions have, however, beenmade and sorne data that are available only as summed TEQs have been included wherethey seem to be of value. Additionally, the results included either were available on alipid basis or could be so converted using either reported fat contents or reasonableassumptions. Sorne further results omitted from the tables are discussed in the text below.Certain entries in the Appendix 1 tables (for PCDDs) do not appear in Appendix 2, sincePCDFs were either not determned, or not reported separately from the summed TEQ.
Summed TEQ concentrations are included in Tables 9-18 in Appendix 1 and thesehave, in most cases, been reca1culated using I-TEF values and assuming that congenersthat were not detected were present at the full value of the detection limit, unless limits ofdetection were not reported (indicated as 'ND').
Ryan et al. (1990) found an average concentration of 73.3 ng/kg 2,3,7,8-TCDF incow's milk, much higher than in other reports (see Appendix 2, Table 4), and in a sub-sequent study showed this to be due to migration into milk from bleached paperboardcontainers (Ryan et al., 1991). ln Germany, Beek et al. (1990a) also found elevatedlevels of 2,3,7,8- TCDF in milk from cardboard contaners, in the range 1.6-28 ng/kg(mean, 9.6 ng/kg), contrasting with a range of -c 0.1-1.4 ng/kg (mean, 0.7 ng/kg) in othermilk. The non-toxic 1,2,7,8-TCDF isomer also migrates. This congener is not normallypresent in milk but was found at a mean concentration of 4.9 ng/kg in mi from card-board packages (Beek et al., 1990a) and by Ryan et aL. (1991) at a mean concentration of80 ng/kg. Similar increases in 2,3,7,8-TCDF levels were found in studies in New Zealand(Buckland et aL., 1990b), the United KIngdom (Starin et al., 1990) and the United States(Glidden et aL., 1990) and elsewhere. However, in Sweden, Rappe et al. (1990b) found
POL YCHLORIA TED DIBENZOFURAS 367
little or no such migration in cardboard-packaged milk from four out of five towns(5 ng/kg in one). Since 1990, the concentrations of PCDFs in pulp products have beensubstantially reduced. Thus, in samples from the United KIngdom Total Diet Study(Wright & Startin, 1995), a relatively high 2,3,7,8-TCDF level of 6.6 ng/kg was found inmilk collected in 1982, together with 1,2,7,8- TCDF clearly indicating chlorine bleachingas the source, while neither congener was detected in milk collected in 1992.
If Ryan's atypical data are excluded, the samples of milk and dairy products fromvarous locations, which are dominated by European samples from the late 1980s andearly 1990s, have mean concentrations of individu al PCDFs between about 0.2 and2.8 ng/kg (Appendix 2, Table 4). The ratios between the lowest and highest measure-ments for different PCDF congeners var from around 30 to several hundred. (TheWorking Group noted that data for OCDF should be treated with particular caution; atthe se concentrations, this congener is especially difficult to determne accurately and therange of reported concentrations is wide.) Apar from OCDF, 2,3,4,7,8-PeCDF tends tohave the highest concentration in most European samples, but not in the single analysispresented of milk from the United States (Eitzer, 1995).
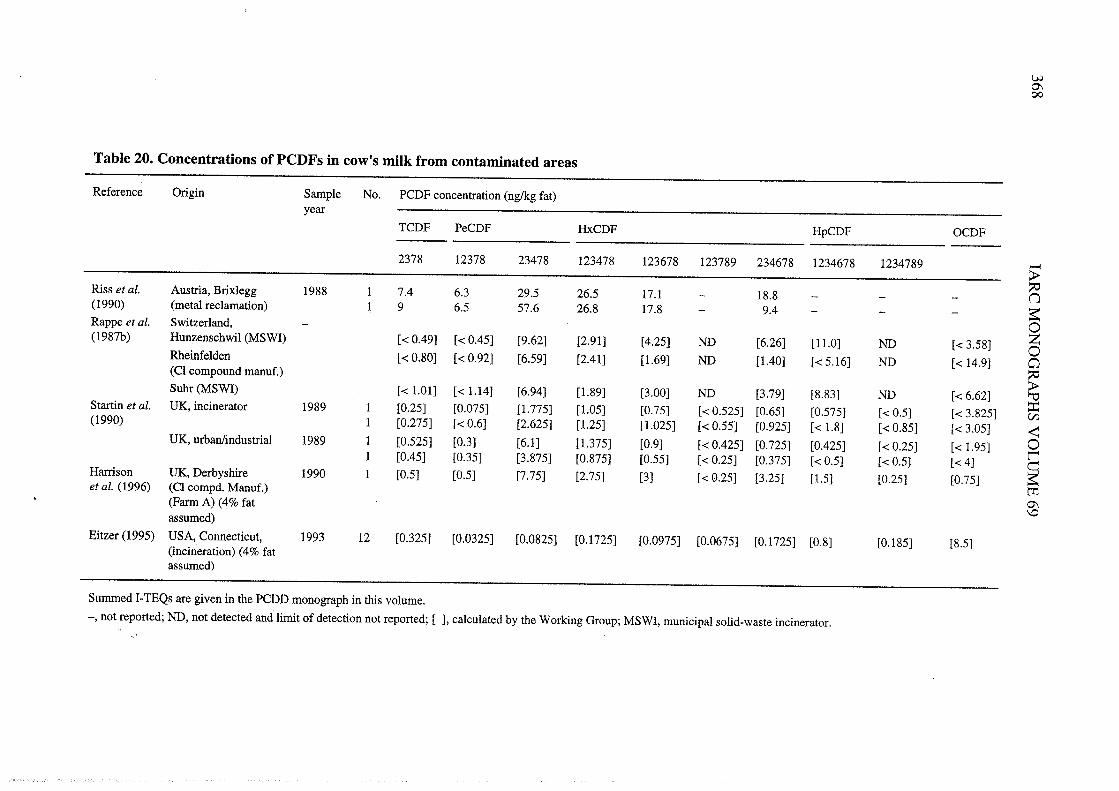
Milk produced close to sites associated with contamination from incineration andsimilar processes can contain relatively high concentrations of PCDFs (Table 20).
Analyses of meats and meat products indicate mean concentrations for most 2,3,7,8-chlorinated congeners of between 1 and 4 ng/kg, with 1,2,3,7,8,9-HxCDF and
1,2,3,4,7,8,9-HpCDFgeneralIy at lower concentrations. As with PCDDs, samples ofanimal liver show considerably higher concentrations.
The rather limited data on poultry meat and eggs suggest that concentrations areusually of the same order of magnitude as those seen in other animal products.
ln fish, the pattern of concentrations of different congeners tends to be more extremeand more varable. It is unusual for 1,2,3,7,8,9-HxCDF to be detectable, while most ofthe tetra- and pentachlorinated congeners are present at higher concentrations than interrestrial animal products. The predominant congener in fatty fish from the Baltic Sea is2,3,4,7,8-PeCDF (Svensson et aL., 1991). 2,3,7,8-TCDF has been reported in retailsamples of marne fish species at concentrations around 100 ng/kg (Beek et al., 1989a;Liem et al., 1991a).
1.4 Human tissue measurements (see Table 21)
Most of the analytical data on biologie al monitoring of PCDFs have been reported instudies in which both PCDDs and PCDFs were measured (see the monograph on PCDDsin this volume; Section 1.4 and Tables 24, 25 and 27).
ln sorne studies, individual data on PCDFs are reported. AH concentrations reportedin this section are lipid-based (as ng/kg fat), unless otherwise stated.
W0'00
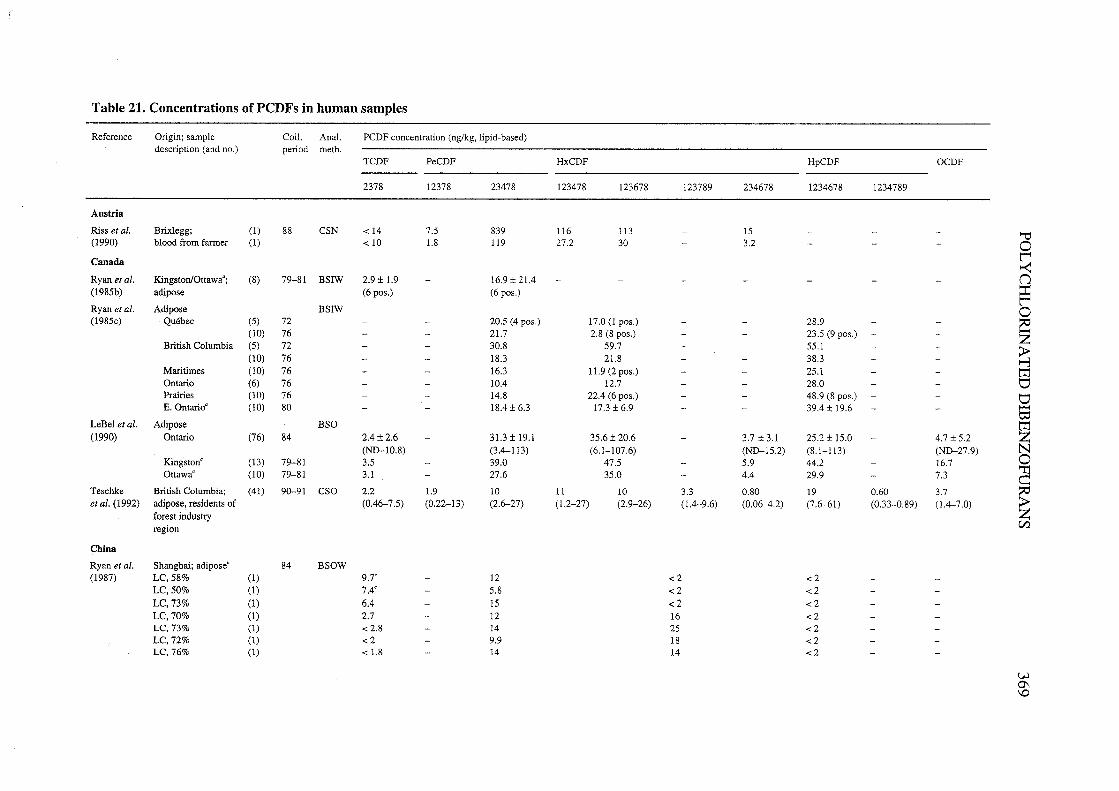
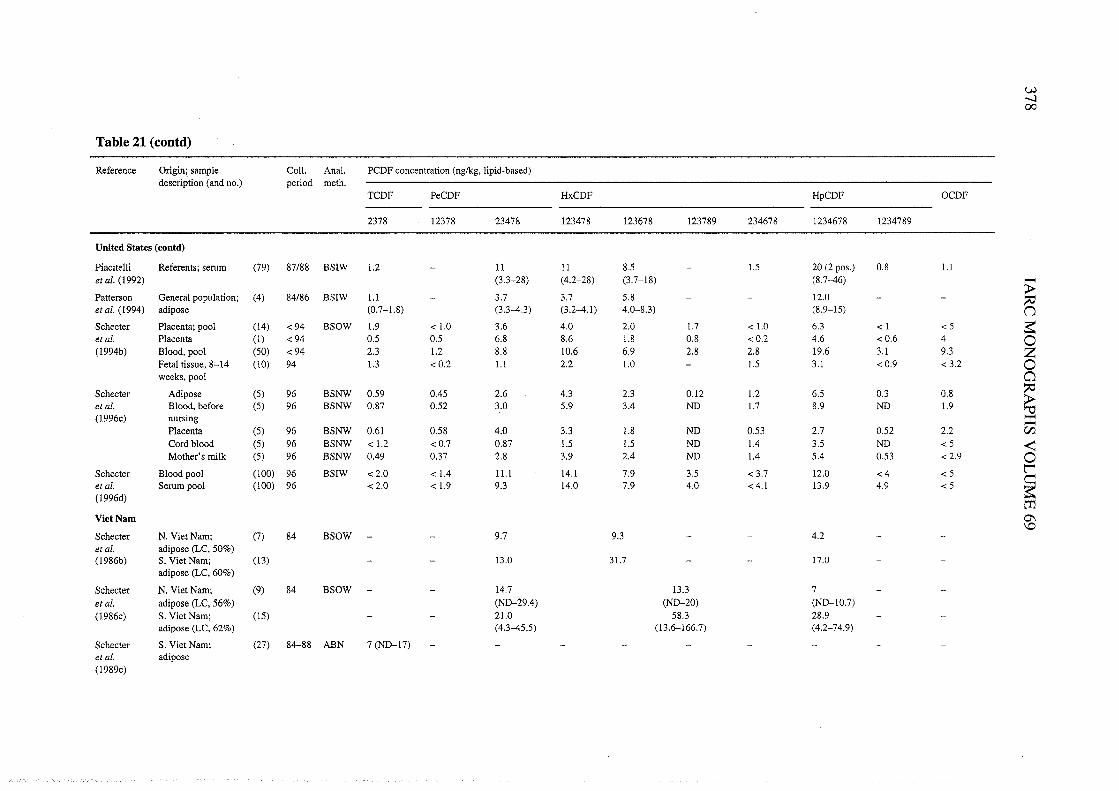
Table 21. Concentrations of PCDFs in human samples
Reference Origin; sample Coll, Anal, PCDP concentration (nglkg, 1ipid-based)description (and no,) period meth,
TCDP PeCDP HxCDP HpCDP OCDP-2378 12378 23478 123478 123678 123789 234678 1234678 1234789
Austria
Riss et al. Brix1egg; (1) 88 CSN .: 14 7,5 839 116 113 15 - - "i(1990) b100d from faner (1) .: 10 1.8 119 27,2 30 - 3,2 - - 0Canada ~
~Ryan et aL. Kingston/Ottawa'; (8) 79-81 BSIW 2.9:t 1.9 - 16,9:t 21.4 - - - - - - - n(1985b) adipose (6 pos,) (6 pos,) ~~Ryan et al, Adipose BSIW 0(1985c) Québec (5) 72 - - 20.5 (4 pos,) 17,0 (1 pos,) - - 28,9 - -
ël(10) 76 - - 21. 2,8 (8 pos,) - 23,5 (9 pos,) - - ZBritish Columbia (5) 72 - - 30,8 59,7 - 55.1 - - ~(10) 76 - - 18.3 21.8 - - 38,3 - - --
Martimes (10) 76 - - 16.3 11.9 (2 pos,) - - 25,1 - - trOntao (6) 76 - - 10.4 12,7 - - 28,0 UPrairies (10) 76 - 14,8 22.4 (6 pos.) - - 48,9 (8 pos,) - UE. Ontaro' (10) 80 - - 18.4 :t 6.3 17.3:t6,9 - - 39.4:t 19,6 - - ""t:
LeBel et aL. Adipose BSO tr(1990) Ontao (76) 84 2.4 :t 2,6 - 31.:t 19.1 35.6 :t 20,6 - 3,7 :t 3.1 25,2:t 15,0 - 4.7:t 5,2 Z
(ND10.8) (3.-113) (6.1-107,6) (ND15,2) (8,1-113) (ND-27,9) NKingston' (13) 79-81 3,5 - 39,0 47,5 - 5,9 44.2 16,7 0
"lOttawa' (10) 79-81 3,1 - 27,6 35,0 - 4.4 29,9 - 7,3 c:Teschke British Columbia; (41) 90-91 CSO 2.2 1.9 10 11 10 3.3 0.80 19 0,60 3,7
~et al. (1992) adipose, residents of (0.46-7,5) (0,22-13) (2,6-27) ( 1.2-27) (2.9-26) (1.4-9,6) (0,06-.2) (7,6-61) (0,33-0,89) (1.4-7,0)
forest industrregion u:
China
Ryan et al. Shanghai; adipose' 84 BSOW
(1987) LC, 58% (1) 9.7' 12 .:2 .:2LC, 50% (1) 7.4' - 5.8 .: 2 .:2LC, 73% (1) 6.4 - 15 .:2 .:2LC, 70% (1) 2.7 - 12 16 .: 2LC. 73% (1) .: 2,8 - 14 25 .: 2LC, 72% (1) .:2 - 9.9 18 .:2LC, 76% (1) .: 1.8 - 14 14 .:2
t.0\\0

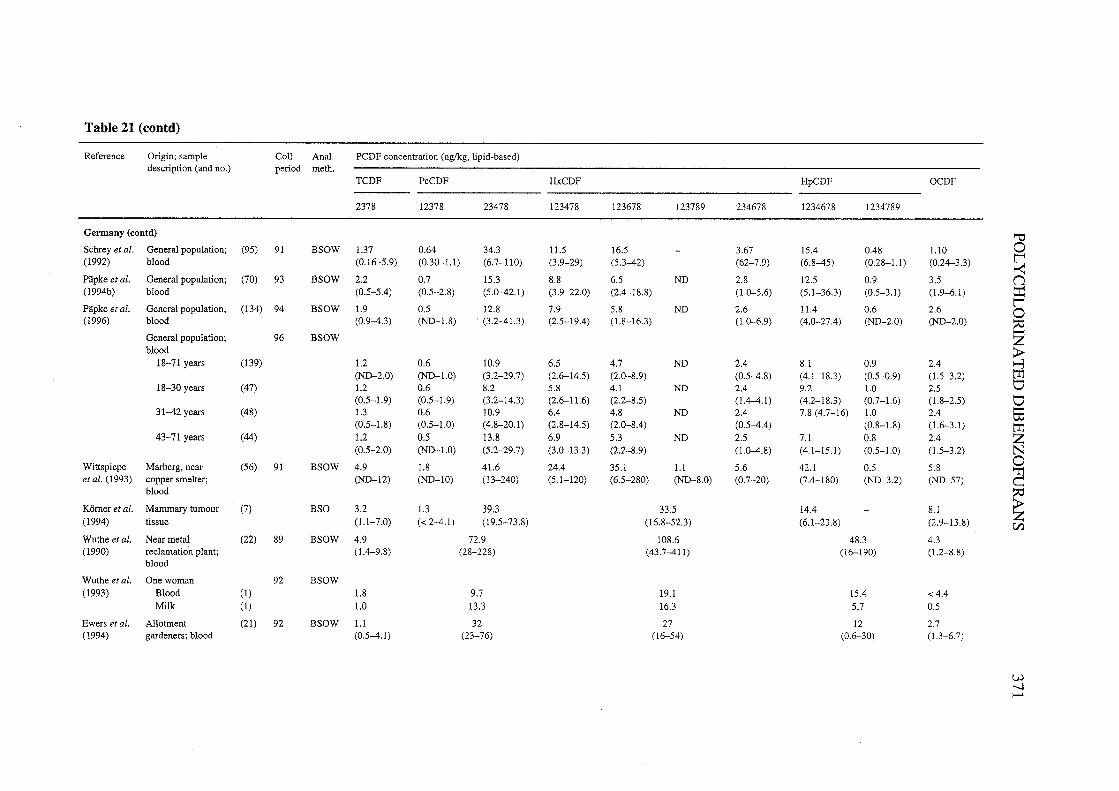
Table 21 (contd)
Reference Origin; sample ColL. Anal, PCDF concentration (nglkg, lipid-based)description (and no,) period meth.
TCDF PeCDF HxCDF HpCDF OCDF-2378 12378 23478 123478 123678 123789 234678 1234678 1234789
Gennany (contd) "'Schrey et aL. General population; (95) 91 BSOW 1.7 0,64 34.3 11. 16,5 - 3,67 15.4 0.48 1.0 0(1992) blood (0.16-5,9) (0.30-1. ) (6,7-110) (3,9-29) (5.3-42) (62-7,9) (6.8-45) (0,28- i.) (0,24-3.3) t"
~Päpke et aL. General population; (70) 93 BSOW 2,2 0,7 15,3 8,8 6,5 ND 2,8 12,5 0,9 3,5 n(1994b) blood (0.5-5.4) (0,5-2,8) (5,0-2,1) (3.9-22,0) (2,4-18,8) (1.0-5,6) (5,1-36,3) (0,5-3.1) (1.9-6,1) FPäpke et al, General population; (134) 94 BSOW 1.9 0.5 12,8 7,9 5,8 ND 2,6 Il.4 0,6 2,6 0(1996) blood (0,9-4,3) (ND1.8) . (3,2-41.) (2.5-19.4) (1.8-16,3) (1,0-,9) (4,0-27.4) (ND-2,0) (ND-2,0) ~
General population; 96 BSOW Zblood ~
18-71 years (139) 1.2 0,6 10,9 6,5 4,7 ND 2.4 8.1 0,9 2.4 io(ND-2,O) (ND1.0) (3.2-29.7) (2,6-14,5) (2,0-8,9) (0,5-4.8) (4,1-18.3) (0,5..,9) (1.5-3,2) ti
18-30 years (47) 1.2 0,6 8,2 5.8 4,1 ND 2.4 9,2 1.0 2,5 t:(0.5-1.9) (0,5-1.9) (3,2-14.3) (2,6-11.6) (2,2-8.5) (1.4-,1) (4,2-18.3) (0,7-1.6) (1.8-2.5) t:
31-42 years (48) 1. 0,6 10.9 6.4 4,8 ND 2.4 7,8 (4,7-16) 1.0 2.4 63(0.5-1.8) (0,5-1.0) (4,8-20.1) (2.8-14,5) (2,0-8.4) (0,5-4.4) (0,8-1.8) (1.6-3,1) ti
43-71 years (44) 1.2 0.5 13,8 6.9 5.3 ND 2.5 7,1 0,8 2.4 Z(0.5-2,0) (ND1.0) (5,2-29,7) (3,0-13.3) (2,2-8,9) (1.0-,8) (4,1-15.1) (0,5-1.0) (1.5-3,2) N
Wittspiepe Marberg. near (56) 91 BSOW 4.9 1.8 41.6 24.4 35,1 1. 5,6 42,1 0,5 5,8 0et aL. (1993) copper smelter; (ND12) (ND1O) (13-240) (5,1-120) (6,5-280) (ND8,O) (0,7-20) (7.4-180) (ND-3,2) (ND-57) ã
blood
~Körner et al. Mamar tumour (7) BSO 3,2 1.3 39,3 33.5 14.4 - 8,1
(1994) tissue (I.-7.0) (.: 2-4.1) (19.5-73,8) (16,8-52,3) (6,1-23,8) (2,9-13,8) ZC/
Wuthe et al, Near metal (22) 89 BSOW 4,9 729 108,6 48,3 4,3(1990) reclamation plant; (1.4-9,8) (28-228) (43,7-411) (16-190) (1.-8,8)
blood
Wuthe et al. One woman 92 BSOW
(1993) Blood (1) 1.8 9.7 19.1 15.4 .: 4.4Milk (1) 1.0 13.3 16,3 5,7 0,5
Ewers et al, Allotment (21) 92 BSOW 1. 32 27 12 2,7
(1994) gardeners; blood (0,5-4,1) (23-76) (16-54) (0,6-30) (1.-6,7)
W..-
VJ-i01
Table 21 (contd)
Reference Origin; sample ColL. AnaL. PCDP concentration (nglkg, Iipid-based)description (and no,) period meth.
TCDP PeCDP HxCDP HpCDP OCDP-2378 12378 23478 123478 123678 123789 234678 1234678 1234789
United K1ngdom
Duare- Wales, 5 pools; (5) 90/91 CSO -0 10 13 24 26 15 - - 34 - 46 '"Davidson adipose (20-27) (18-42) (9-27) (24-9) (36-62) ~et aL. (1993) ~
elUnited States s:Ryan et al. NY State; adipose (6) 83/84 CSOW - - 14,7:1 2,5 28,7:1 7,2 - - 16.4 :1 4,0 - - 0(1985c) (10,9-17,0) (15,1-52.8) (12,5:1 23.8) ZRyan et aL. NY State -0 83 BSIW 0
c:(1986) Adipose (3) - - 13,9 32.4 - - 12,1 - -
~(mean LC, 67%) (6,5-17) (ND52) (ND24)Liver (3) - - 4,1 9,9 - - 3.3 - -(mean LC. 24%) (ND-6,9) (4,2-17) (ND-7,7) ::Adrenal (2) - - 4,9-5,5 8,5-11 - - 3,5-4,5 - íZ
(LC, 28 and 25%) ~Bone marow (1) - - 4.4 9.4 - - 2,7 - - 0(LC, 26%)
~Muscle (3) - - 1. 2.4 - - ND - -(mean LC, IL %) (ND2,3) (1.-3.)Kidney (2) - - ND ND ND-1. - - tr(LC, 3.0 and 014.0%)
\0
Ryan (1986) NY State, one man, 85 BSIW22 years old
Adipose (1) - 4,2
(LC, 83%)
Liver (LC, 4.4%) (1) - - 2.6
Schecter Binghamton; (1) 83-84 CRO -02 - 12.5 11.4 5,6 - - 16,3 ND -0 20
et aL. adipose' (1) 4,1 10,9 9,3 5,8 - - 13,7 ND -020
(1 986a) (1) -0 2 - 17,0 13 8,8 - - 12,5 19.6 1.2
(1) -02 - 16,5 22,9 15.4 - - 23,8 20,6 1.5
w-i00
Table 21 (contd)
Reference Origin; sample Coll. AnaL. PCDF concentration (ng/kg, lipid-based)description (and no.) period meth.
TCDF PeCDF HxCDF HpCDF OCDF
2378 12378 23478 123478 123678 123789 234678 1234678 1234789
United States (contd)
Piacilell Referents; serum (79) 87/88 BSrw 1.2 - IL II 8.5 - 1.5 20 (2 pos,) 0,8 i.et aL. (1992) (3.3-28) (4,2-28) (3,7-18) (8,7-46)
~Patterson General population; (4) 84/86 BSrw 1. - 3,7 3,7 5,8 - 12,0 - -et al. (1994) adipose (0,7-1.8) (3,3-4,3) (3,2-4,1) 4,0-8,3) (8,9-15) nSchecter Placenta; pool (14) -e 94 BSOW 1.9 -e 1.0 3.6 4,0 2.0 1. -e 1.0 6,3 -e 1 -e 5 ~et al, Placenta (1) -e 94 0,5 0,5 6,8 8,6 1.8 0,8 -eO,2 4,6 -e 0,6 4 0(1994b) Blood, pool (50) -e 94 2.3 1.2 8.8 10.6 6,9 2.8 2,8 19,6 3,1 9.3 Z
Felal tissue, 8-14 (10) 94 1. -eO,2 i. 2,2 1.0 - 1.5 3,1 -e 0,9 -e 3,2 0weeks, pool ci
Schecter Adipose (5) 96 BSNW 0,59 0.45 2,6 4.3 2.3 0,12 1.2 6,5 0,3 0,8
~et al, Blood, before (5) 96 BSNW 0,87 0,52 3,0 5,9 3.4 ND 1. 8,9 ND 1.9
(1996c) nursing =Placenla (5) 96 BSNW 0,61 0.58 4.0 3.3 1.8 ND 0,53 2,7 0.52 2,2 CICord blood (5) 96 BSNW -e 1.2 -eO,7 0,87 1.5 1.5 ND 1.4 3,5 ND -e 5 ~Mother' s milk (5) 96 BSNW 0.49 0,37 2,8 3,9 2.4 ND 1.4 5.4 0,53 -e 2,9 0
Schecter Blood pool (100) 96 BSrw -e 2,0 -e 1.4 1 i. 14,1 7,9 3,5 -e 3,7 12,0 -e4 -e 5 L"
et aL. Serum pool (100) 96 -e 2,0 -e 1.9 9.3 14,0 7,9 4.0 -e4,1 13,9 4,9 -e 5
~(1996d)
Viet Nam 0\\0
Schecter N. Viel Nam; (7) 84 BSOW - - 9,7 9.3 - - 4,2et al, adipose (LC. 50%)(1986b) S. Viet Nam; (13) - - 13,0 31. - - 17,0
adipose (LC. 60%)
Schecter N. Viet Nam; (9) 84 BSOW - - 14,7 13,3 7
et aL. adipose (Le, 56%) (ND29.4) (ND-20) (ND-IO,7)(1986c) S. Viel Nam; (15) - - 21.0 58,3 28,9
adipose (LC. 62%) (4.3-45,5) (13,6-166,7) (4,2-74,9)
Schecter S. Viel Nam; (27) 84-88 ABN 7 (ND-17)et aL. adipose
(l989c)
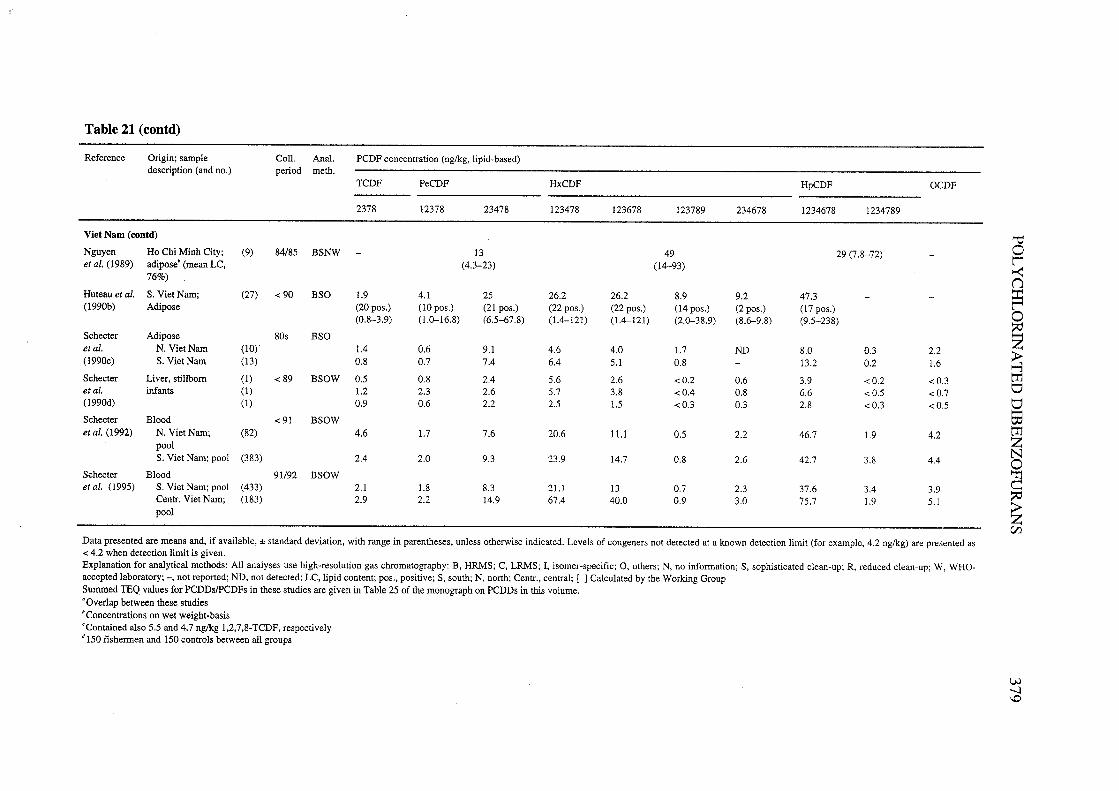
Data presented are means and, if available, :l standard deviation, with range in parentheses, unless otherwise indicated, Levels of congeners not detected at a known detection limit (for example, 4,2 ng/kg) are presented as0: 4,2 when detection limit is given.Explanation for analytical methods: Ali analyses use high-resolution gas chromatography: B, HRMS; C, LRMS; 1. isomer-specific; 0, others; N, no information; S, sophisticated c1ean-up; R, reduced c1ean-up; W, WHO-accepted laboratory; -, not reported; ND, not detected; LC, lipid content; pos., positive; S, south; N, nort; Centr., central; ( J Calculated by the Working GroupSummed lEQ values for PCDDs/PCDFs in these siudies are given in Table 25 of the monograph on PCDDs in ths volume,'Overlap between these siudies'Concentrations on wei weight-basis
'Contaned also 5.5 and 4,7 ng/kg 1.2,7,8-TCDF, respectivelyd 150 fishermen and 150 controls between ail groups
w-i\0
380 lARe MONOGRAHS VOLUME 69
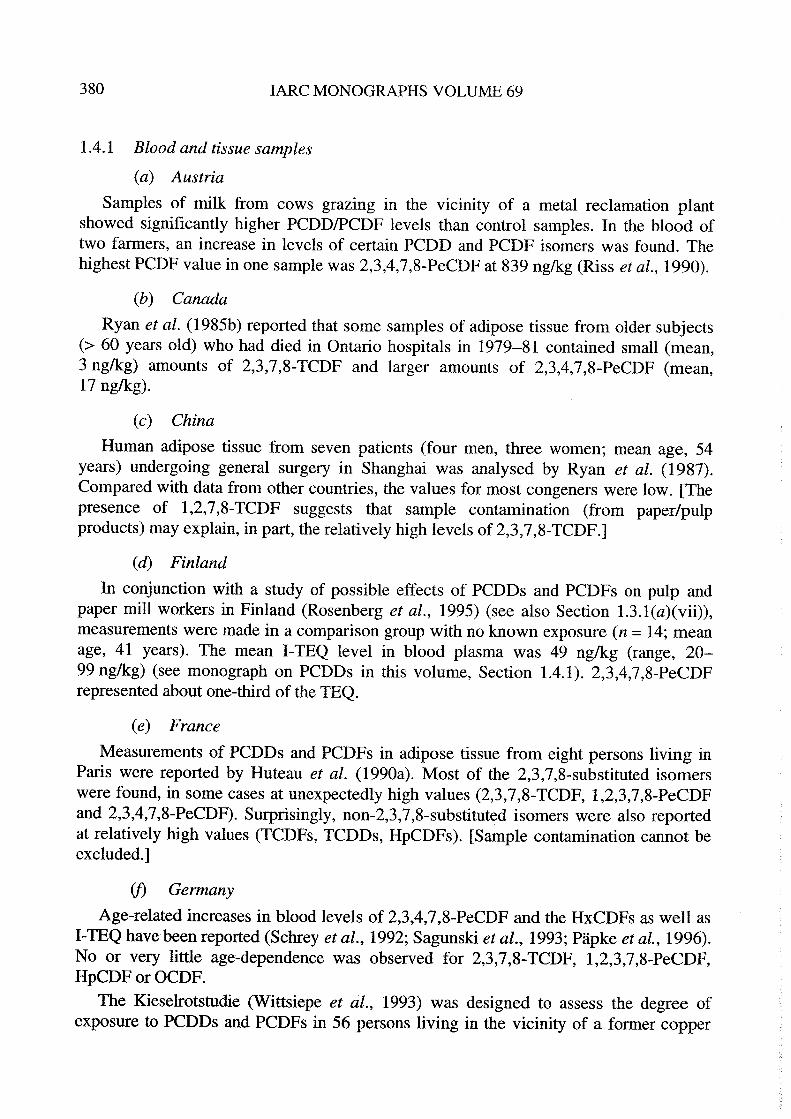
1.4.1 Blood and tissue samples
(a) Austria
Samples of milk from cows grazing in the vicinity of a metal reclamation plantshowed significantly higher PCDD/PCDF levels than control samples. ln the blood oftwo farers, an increase in levels of certain PCDD and PCDF isomers was found. Thehighest PCDF value in one sample was 2,3,4,7,8-PeCDF at 839 ng/kg (Riss et al., 1990).
(b) Canada
Ryan et al. (1985b) reported that sorne samples of adipose tissue from older subjects(:: 60 years old) who had died in Ontario hospitals in 1979-81 contained small (mean,3 ng/kg) amounts of 2,3,7,8-TCDF and larger amounts of 2,3,4,7,8-PeCDF (mean,
17 ng/kg).
(c) China
Human adipose tissue from seven patients (four men, thee women; mean age, 54years) undergoing general surgery in Shanghai was analysed by Ryan et al. (1987).Compared with data from other countres, the values for most congeners were low. (Thepresence of 1,2,7,8-TCDF suggests that sample contamination (from paper/pulp
products) may explain, in par, the relatively high levels of2,3,7,8-TCDF.)
(d) Finland
ln conjunction with a study of possible effects of PCDDs and PCDFs on pulp andpaper mill workers in Finland (Rosenberg et aL., 1995) (see also Section 1.3. 1 (a)(vii)),measurements were made in a comparson group with no known exposure (n = 14; meanage, 41 years). The mean I-TEQ level in blood plasma was 49 ng/kg (range, 20-99 ng/kg) (see monograph on PCDDs in this volume, Section 1.4.1). 2,3,4,7,8-PeCDFrepresented about one-third of the TEQ.
(e) France
Measurements of PCDDs and PCDFs in adipose tissue from eight persons living inPars were reported by Huteau et al. (1990a). Most of the 2,3,7,8-substituted isomerswere found, in sorne cases at unexpectedly high values (2,3,7,8-TCDF, 1,2,3,7,8-PeCDFand 2,3,4,7,8-PeCDF). Surprisingly, non-2,3,7,8-substituted isomers were also reportedat relatively high values (TCDFs, TCDDs, HpCDFs). (Sample contamination cannot beexcluded.)
(j GermanyAge-related increases in blood levels of 2,3,4,7,8-PeCDF and the HxCDFs as well as
I-TEQ have been reported (Schrey et al., 1992; Sagunski et al., 1993; Päpke et aL., 1996).No or very little age-dependence was observed for 2,3,7,8-TCDF, 1,2,3,7,8-PeCDF,
HpCDF or OCDF.The KIeseIrotstudie (Wittsiepe et aL., 1993) was designed to assess the degree of
exposure to PCDDs and PCDFs in 56 persons living in the vicinity of a former copper
POL YCHLORIATED DIBENZOFURAS 381
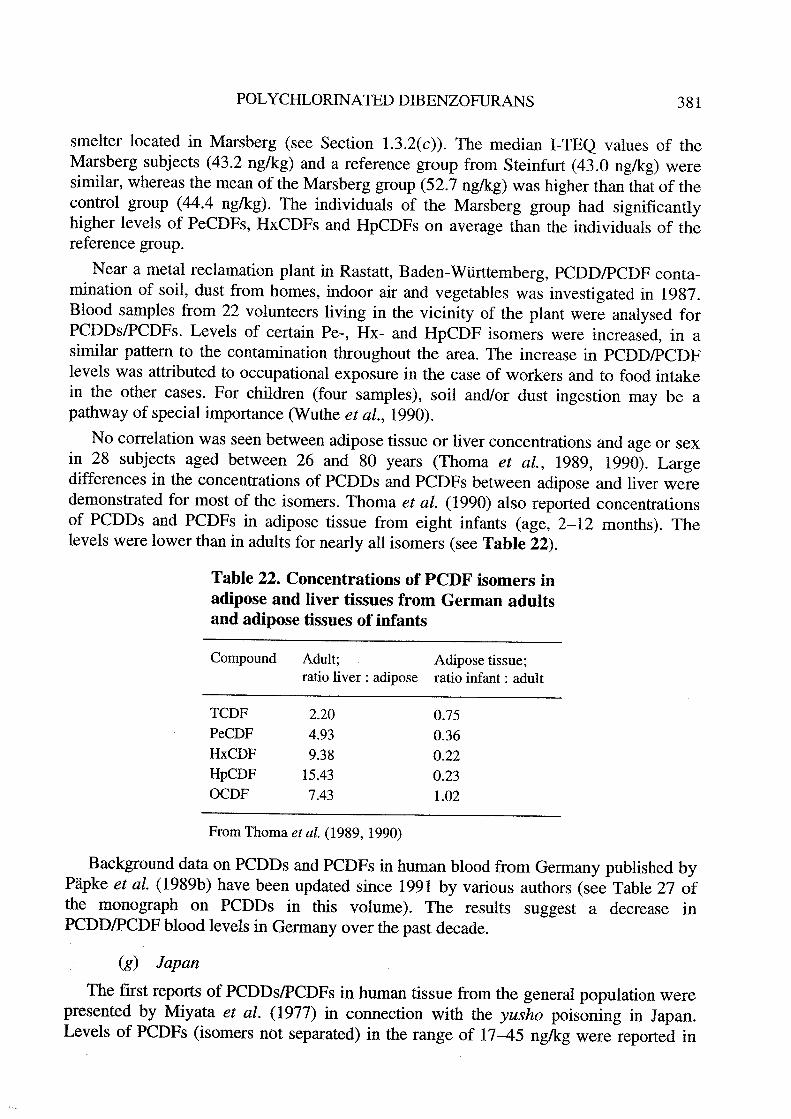
smelter located in Marsberg (see Section 1.3.2(c)). The median I-TEQ values of theMarsberg subjects (43.2 ng/kg) and a reference group from Steinfurt (43.0 ng/kg) weresimilar, whereas the mean of the Marsberg group (52.7 ng/kg) was higher than that of thecontrol group (44.4 ng/kg). The individuals of the Marsberg group had significantlyhigher levels of PeCDFs, HxCDFs and HpCDFs on average than the individuals of thereference group.
Near a metal reclamation plant in Rastatt, Baden- Württemberg, PCDD/PCDF conta-mination of soil, dust from homes, indoor air and vegetables was investigated in 1987.Blood samples from 22 volunteers living in the vicinity of the plant were analysed forPCDDs/PCDFs. Levels of certain Pe-, Hx- and HpCDF isomers were increased, in asimilar pattern to the contamination throughout the area. The increase in PCDD/PCDFlevels was attributed to occupational exposure in the case of workers and to food intakein the other cases. For children (four samples), soil and/or dust ingestion may be apathway of special importance (Wuthe et aL., 1990).
No correlation was seen between adipose tissue or Ii ver concentrations and age or sexin 28 subjects aged between 26 and 80 years (Thoma et aL., 1989, 1990). Largedifferences in the concentrations of PCDDs and PCDFs between adipose and liver weredemonstrated for most of the isomers. Thoma et aL. (1990) also reported concentrationsof PCDDs and PCDFs in adipose tissue from eight infants (age, 2-12 months). Thelevels were lower than in adults for nearly aU isomers (see Table 22).
Table 22. Concentrations of PCDF isomers inadipose and liver tissues from German adultsand adipose tissues of infants
Compound Adu1t; Adipose tissue;ratio 1iver : adipose ratio infant: adult
TCDFPeCDF
HxCDFHpCDFOCDF
2.20 0.754.93 0.369.38 0.2215.43 0.237.43 1.02
From Thoma et aL. (1989, 1990)
Background data on PCDDs and PCDFs in human blood from Germany published byPäpke et aL. (l989b) have been updated since 1991 by varous authors (see Table 27 ofthe monograph on PCDDs in this volume). The results suggest a decrease inPCDD/PCDF blood levels in Germany over the past decade.
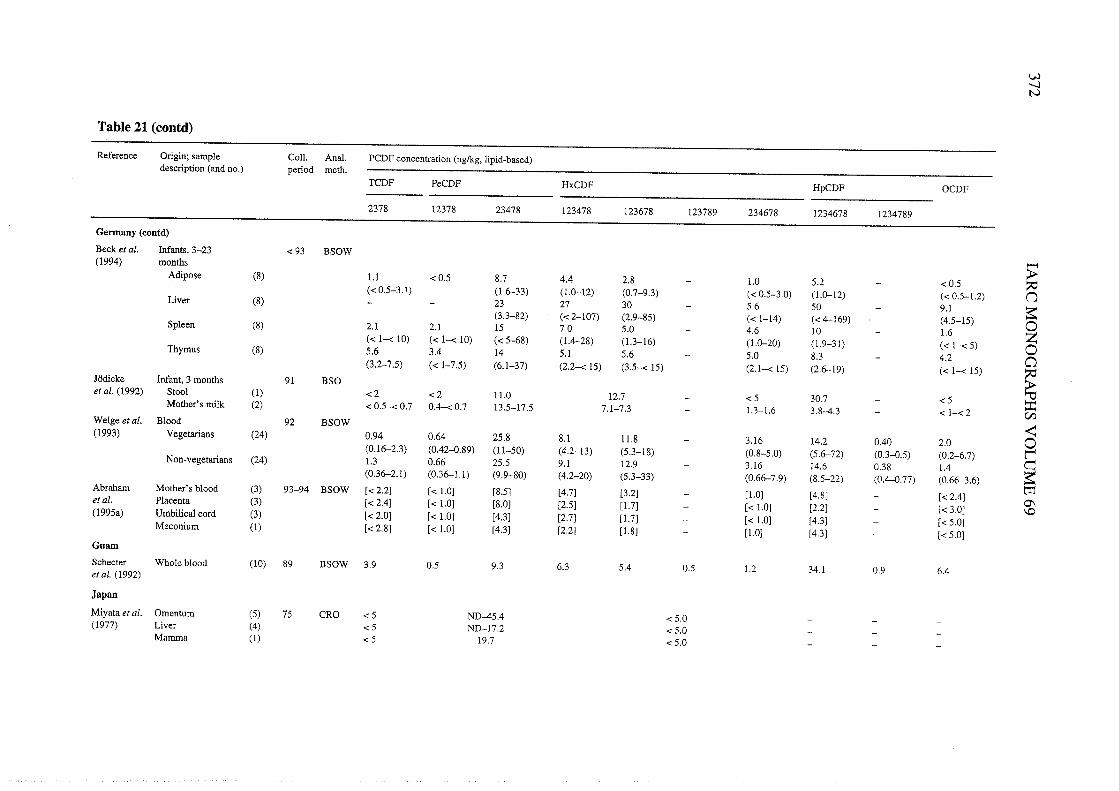
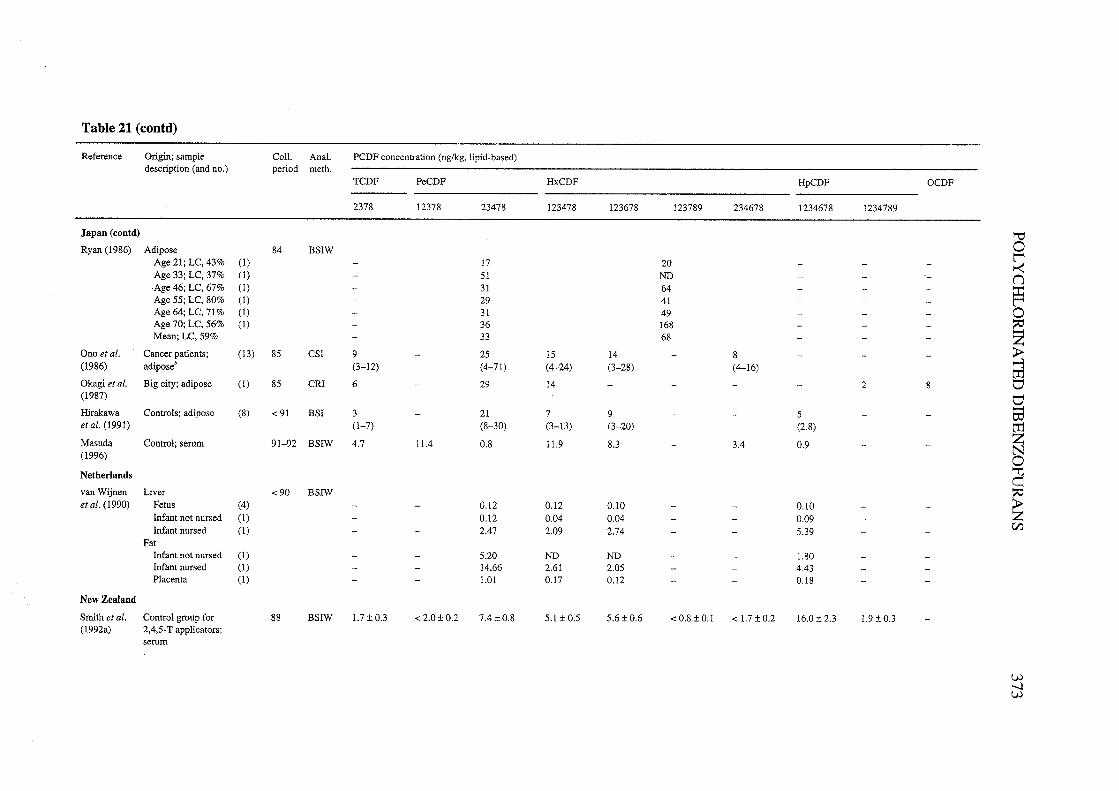
(g) Japan
The first reports of PCDDs/PCDFs in human tissue from the general population werepresented by Miyata et al. (1977) in connection with the yusho poisoning in Japan.Levels of PCDFs (isomers nöt separated) in the range of 17-45 ng/kg were reported in
382 lARe MONOGRAHS VOLUME 69
four of six fat and in one of four liver biopsy/autopsy samples taken from the generalJapanese population. At that time, no TCDFs or HxCDFs were detected.
Kashimoto et al. (1985) detected PCBs and PCQs in blood of yusho and yuchengpatients. PCDFs were found only in yu cheng patients. ln 60 unexposed individuals,PCDPs were not detected at a detection limit of 10 ng/kg (in whole blood).
Thirteen samples of human adipose tissue from cancer patients were analysed fortetra- to octa-CDDs and -CDFs (Ono et al., 1986). These compounds were identified inall of the analysed samples. Total PCDF concentrations were in the range of 7-120 ng/kgon a wet weight basis, and 2,3,4,7,8-PeCDF levels ranged from 4 to 71 ng/kg.
(h) Taiwan
ln connection with the determnation of blood serum levels of PCDFs (and PCBs) inyucheng children perinatally exposed to contaminated rice oil, Ryan et al. (1994)
analysed a matched control population. The total PCDD/PCDF profile for the two pooledcontrol sera from the matched children were very similar. The mean of two measure-ments was given, with an 1- TEQ of 12.6 ng/kg for PCDFs. The characteristic 'yuchengisomers', 2,3,4,7,8-PeCDF and 1,2,3,4,7,8-HxCDF, showed levels 10-15 times and 15-25 times, respectively, higher in the exposed children than in the matched controls.
(i) United Kingdom
PCDD/PCDF background data were measured in pooled human adipose tissuesamples from five areas in Wales (Duare-Davidson et al., 1993). With the exception ofOCDF, which was found at unexpectedly high values in aU pooled samples (36-62ng/kg), the concentrations were similar to those in other industrialized countres. 2,3,7,8-TCDD and 2,3,7,8-TCDF were not detected at detection limits of 10 nglg.
(j) United States
Six samples from both biopsy and autopsy fat taken in 1983-84 from New York Stateresidents were analysed (Ryan et al., 1985c). PCDDs and PCDFs were found in aHsamples with total (CI4-Clg) PCDD levels about an order of magnitude higher than total(Cls-C17) PCDFs. Only the penta-, hexa- and hepta-PCDF congeners were detected, atlevels that were of the same order of magnitude (15-29 ng/kg). TCDF and OCDF wereabsent.
The tissue distribution of PCDDs and PCDFs was studied in three autopsy subjectsfrom the general population of New York State (Ryan, 1986; Ryan et aL., 1986). Thesewere the first reports to show that severa12,3,7,8-chlorine substituted PCDDs/PCDFs arepresent not only in adipose tissues from the general population, but also in all othertissues assayed. The ratios of the PCDD/PCDF congeners to each other were similar ineach tissue, with overall levels on a wet weight basis decreasing in the order fat, adrenal,bone marow, liver, muscle, spleen, kidney and lung. If the levels are expressed on alipid basis rather than on a wet weight basis, liver had the highest value and the varationbetween tissues showed only a two- to four-fold difference.
Analysis for Cl4-Clg PCDDs/PCDFs was pedormed for 46 adipose tissue samplesprepared from the United States Environmental Protection Agency National Human
POL YCHLORINA TED DIBENZOFURANS 383
Adipose Tissue Survey (NHA TS) as composites from over 900 specimens to representthe nine United States census divisions and three age groups (0-14, 15-44 and2: 45 years) (Stanley et al., 1986). The results demonstrate that PCDDs/PCDFs are pre-valent in the general United States population and that differences exist with age. Onlymeans and ranges of aH data were reported.
A comparson of PCDD/PCDF levels in who le blood, plasma and adipose tissue wasperformed by Schecter et al. (1994b). There were few differences in PCDD/PCDF levelsbetween blood, plasma and adipose tissue and also between whole blood and adiposetissue when reported on lipid basis. Total PCDDs/PCDFs appeared higher in plasma thanin adipose tissue, if reported by actual measurement. Comparng whole blood withadipose tissue, values were more similar.
PCDDs and PCDFs in adipose tissue of United States Viet Nam veterans and controlswere determned by Kang et al. (1991). The samples were collected in 1978. The geo-metrc mean (:t SD) 2,3,7,8-TCDF levels in adipose tissue for Vi et Nam veterans, non-Viet Nam veterans and civilan controls were 2.9, 2.4 and 3.3 ng/kg, respectively. Themean levels for all isomers for these groups were not significantly different from eachother.
ln a study by Schecter et al. (1994b), levels of PCDDs and PCDFs in placenta, bloodand fetal tissue were measured. The highest I-TEQ values (lipid-based) were found inblood, followed by placenta. The fetal tissue contained approximately one third of the1- TEQ of the adult values.
ln a further study of paritioning of PCDDs/PCDFs in human maternaI tissues, inclu-ding blood, milk, adipose tissue and placenta, Schecter et aL. (1996c) collected samplesfrom five American women (mean age, 21.6 years; range, 21-34 years) residing inupstate New York and undergoing caesarean section deliveries between September 1995and Januar 1996. Blood, placenta and fat were collected at the time of delivery. Themilk and second blood were coHected about four to eight weeks later. The lowest con-centrations were found in the cord blood, at about one half of the maternaI adipose andblood levels. A reduction in PCDD/PCDF levels was observed in the 'second' bloodsamples after a breast-feeding period of between four and eight weeks.
PCDD/PCDF levels in two pools of whole blood and serum (n = 100) coHected in1996 were compared with older blood data; a decrease was not clearly shown. Mean ageof the blood donors was not specified (Schecter et al., 1996d).
(k) Viet Nam
Adipose tissue samples from south Viet Nam were compared with those from nortViet Nam (where there was no exposure to Agent Orange) (Schecter et al., 1986b).2,3,7,8-TCDF was not detectable. Most of the other chlorinated PCDFs were found athigher values in samples from south Viet Nam. A further 27 individual and 10 pooledhuman adipose tissue specimens, collected from persons in south and north Viet Nam,respectively, were analysed for 2,3,7,8-TCDD and 2,3,7,8-TCDF (Schecter et al.,1989c). The mean values were 19 ng/kg 2,3,7,8-TCDD and 7 ng/kg 2,3,7,8-TCDF in the
384 IAC MONOGRAPHS VOLUME 69
samples from persons in the south; no 2,3,7,8-TCDD or 2,3,7,8-TCDF was detected insamples from persons in the north.
PCDD/PCDF levels in 27 adipose tissue samples from south Viet Nam were reportedby Huteau et al. (1990b). Besides the usual 2,3,7,8-substituted isomers, they found non-2,3,7,8-substituted isomers in many samples. (Sample contamnation cannot beexc1uded.)
ln connection with analysis of blood samples from varous geographical locations forPCDDs/PCDFs, Schecter et al. (1992) reported results for pooled samples from northViet Nam (two analyses with a total of 82 persons) and south Viet Nam (nine analysestotallng 383 persons). The 1- TEQ values for samples from north and south Viet Namwere 15 and 36 ng/kg, respectively.
1.4.2 Human milk
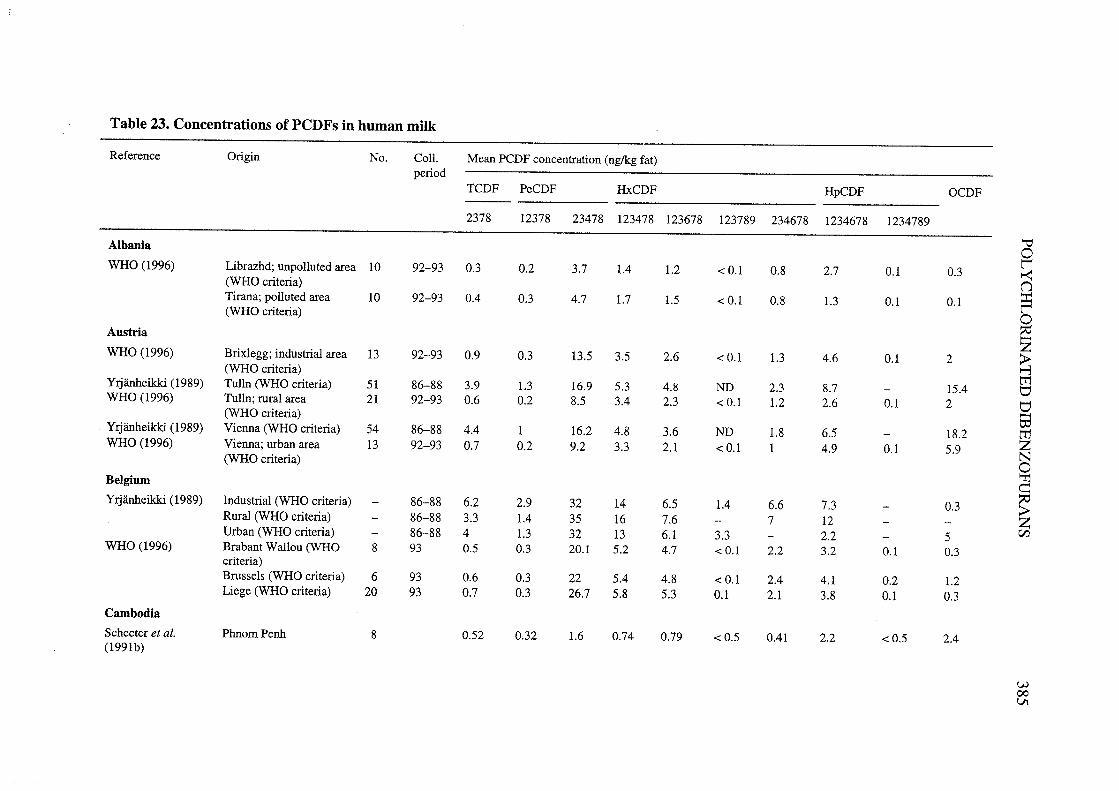
There have been a large number of studies of PCDD/PCDF concentrations in humanmilk. Many of the available results are shown in Table 23 and summarzed in Table 24.ln terms of the 1- TEQ concentrations, PCDFs account for between 17 and 78% of thetotal in human milk. The discussion in Section 1.4.2 of the monograph on PCDDs in thIsvolume is equally applicable to PCDFs.
1.5 Regulations and guideUnes
ln Germany, an occupational technical exposure limit value of 50 pg I-TEQ/m3 in airhas been established for PCDDs and PCDFs (Deutsche Forschungsgemeinschaft, 1996).
At present, the regulatory requirements for incinerator emissions var widely amongthe countres of the European Union. The European Union (1994) published a 'CouncilDirective on the incineration of hazardous waste' which would require that "the emissionof PCDDs and PCDFs shall be minimized by the most progressive techniques" andwhIch defines 0.1 ng/m3 as a guide value which should not be exceeded by aH averagevalues measured over the sample period of 6-16 h.
Germany and the Netherlands have set daily average limit values of 0.1 ng I-TEQ/m3of exhaust gases for PCDDs/PCDFs from industrial waste incinerators, Sweden 0.1-0.5 ng TEQ/m3, and the United Kingdom 1 ng I-TEQ/m3 with a goal to reduce PCDD/-PCDF emIssions from industrial and municipal waste incinerators to 0.1 ng/m3(ECETOC, 1992; Liem & van Zorge, 1995).
ln Germany, sewage sludge used as a fertilzer for farand is not allowed to contain
more than 100 ng I-TEQ/kg dry matter (Ordinance on Sewage Sludge, 1992; Liem & vanZorge, 1995).
The Canadian Government has proposed a tolerable daily intake (TDI) value of 10 pgI-TEQ/kg bw per day for PCDDs and PCDFs (Government of Canada, 1993).
ln Japan, a limit of 0.5 ng I-TEQ/m3 2,3,7,8-PCDD/PCDF is recommended for
muni~ipal waste incinerators (Liem & van Zorge, 1995).
For milk and milk products, a maximal tolerable concentration for PCDDs/PCDFs of17.5 ng I-TEQ/kg fat has been set in the United Kingdom. ln Germany, PCDDs/PCDFs
386
---e..=oCo
'-('N~-,QeuE
-
,-....bJ~bJi:'-i:,8'itii:cuui:oui:C
IUi:§C
I
::
"0.. .g
õ cu
U i:
ciZi:'bh'~oC
I
gCI
..~CI
i:
IAR
C M
ON
OG
RA
HS
VO
LUM
E 69
r.CI
Uor.CI
Ui:::r.CI
U~r.CI
Ucui:r.C
I
~
0\00r--.MN..00r-I.-.MN..00r-I.-.MN0\00r-MN..00r-I.MN..00r--.MN..00r--.MN00r-MN..00r-MN
NVvln..M..vr-..M-vN..-00ooN
NVN
NN
NN
NV
VV
VV
V
vN0\I. I. ex N
lnr- ln M ln I. ~ ..
MNN
i. i. ~ ~N v N
vV
VV
VV
V
M N
r- 00 N V
) M..N
NN
..MN
oó
t"": ~ooNM
ln M M
M .. .. M
N~MS0;:;;:;~~
vr-
vvvvv
""~oo~ex:;-.~
N0\
00 00 00 00 00 00 00
00 00 00 00 00 00 00
J: J: J: J: J: J: J:
00 00 00 00 00 00 00
8..~ ;i~~
- -. I.M
M"""2
.~ d)
CI~~~8 ui ~
82g2.2 d(~ "§
.S '¡: ,~ '~ 0 ~ Z v: ..
;:u6uuSooCluu
8 0 15 0 tJ :P 'H
'H ,~
.. ..~
p: ;: p: :€ lâ i: i: '§ 1l 1l-:~-:~i:::00i:cici
I.0\tl 0\
-e -
tl 0d ~
0\000\-~CI
;§'Q~
M C
'0000
N~r-~
t"~oor;o00v v
0\ ":M
N N
C'
I. t" V)
NM
N'1
:r-O\~
..o\l-~
0\0\
0 N
I.o V
00
MN
'10\
V V
00
00 00
00 00
1 1
\0 I. M C'
00 00 0\ 0\
-.-oC'
.. "" ....
~ '2
'~ ,¡:'2£'2~'~
'~'~
'¡:B U B 0
'~O'~ 0
Ö ~ Ö
~~
:ë e: :;,-O
~l1~ 5b~ 6h
~ ~ ~~
~..'";.~:3cuC
I
,-II.~..'"otl~
~ ~
__ .;g ~ C~ ~ :~ ~O
0\ e 'Q 0\ p:
:: u ~:: ¡;
N N
0000"" 0\
M c'
~ ~
00v v
00 r-"' ..
r- "'V
) ~
"' ":
~ v-
- N
-. '1
ci 0
0\ -
ci -
(' M
0\ 0\
- -.. -
__ 0
'5 ~.. '-.~u
2CI
o :.~ ~
'- cu
o ~ CI
.§ ~ '5
CI cu ..
g;3 '8
Co
:=.c:iQ.
~~.e 0~ ~ C
O0\0\..'-
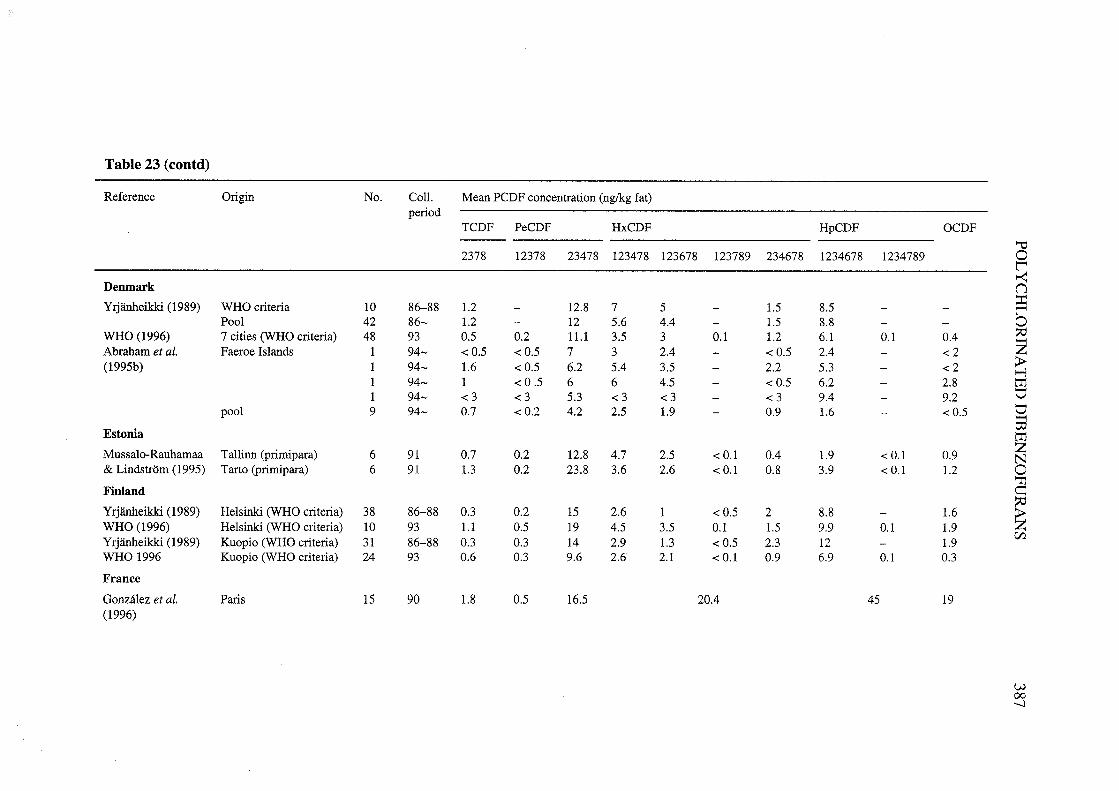
Table 23 (contd)
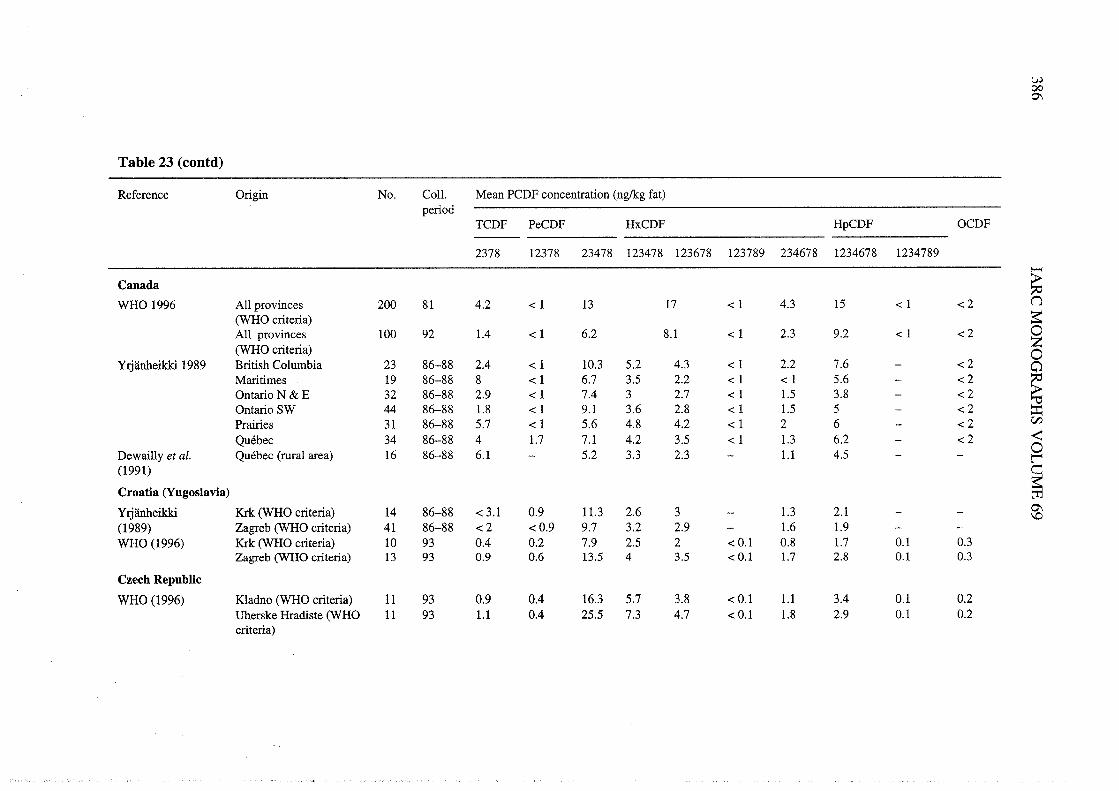
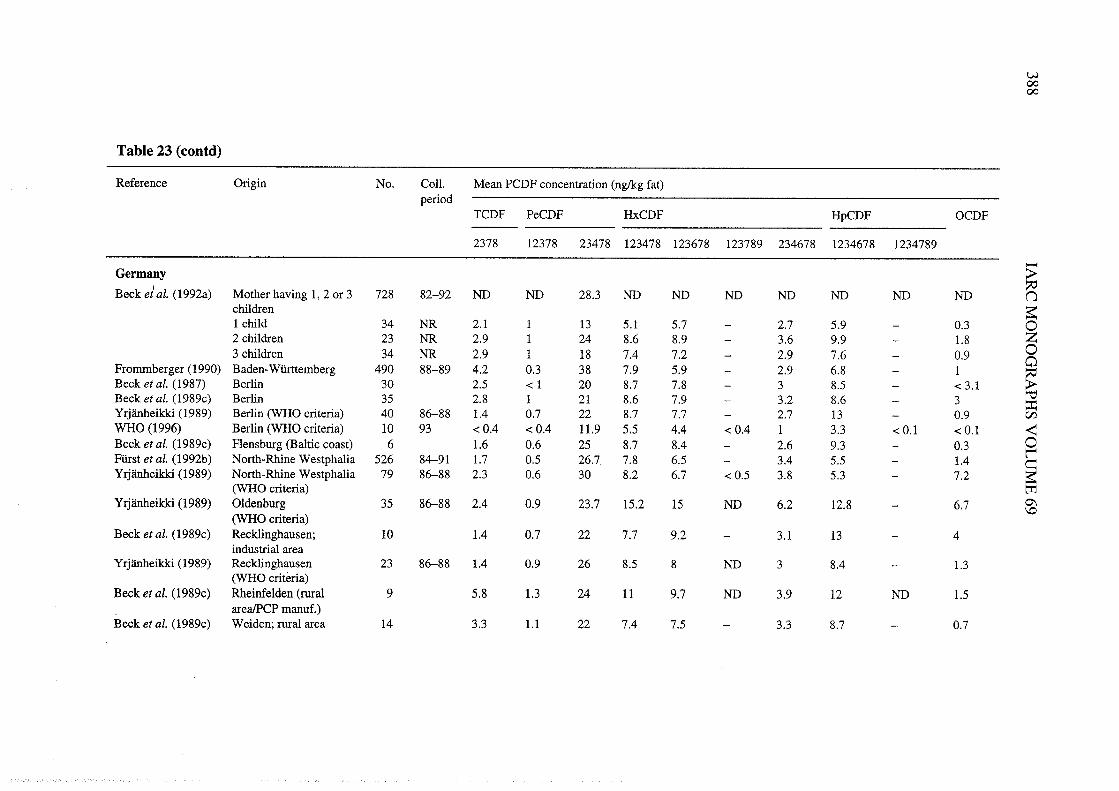
Reference Origin No. ColL. Mean PCDF concentration (nglg fat)period
TCDF PeCDF HxCDF HpCDF OCDF
'i2378 12378 23478 123478 123678 123789 234678 1234678 1234789 0~
Denmark~('
Yrjäneik (1989) WHO criteria 10 86-88 1.2 12,8 7 5 1.5 8,5 ::- - - - ~Pool 42 86- 1.2 - 12 5.6 4.4 - 1. 8.8 - - 0
WHO (1996) 7 cIties (WHO criteria) 48 93 0.5 0.2 11. 3.5 3 0.1 1.2 6,1 0.1 0.4~Abraham et aL. Faeroe Islands 1 94- .. 0.5 .. 0.5 7 3 2.4 - ..0.5 2.4 - .. 2
(1995b) 1 94- 1.6 .. 0.5 6.2 5.4 3.5 - 2.2 5.3 - .. 2 ;:1 94- 1 .. 0.5 6 6 4,5 - .. 0.5 6.2 - 2,8 ti1 94- .. 3 .. 3 5.3 .. 3 .. 3 - .. 3 9.4 - 9.2 V
pool 9 94- 0.7 ..0.2 4.2 2.5 1.9 - 0,9 1.6 - .. 0.5 V-EstonIa
t:ri
Mussalo- Rauhamaa Tallinn (primipara) 6 91 0,7 0,2 12.8 4.7 2.5 .. 0.1 0.4 1.9 .. 0.1 0.9 ZN
& Lindström (1995) Tano (primipara) 6 91 1.3 0.2 23.8 3.6 2.6 .. 0.1 0.8 3.9 .. 0,1 1.2 0Fin1and ~Yrjäneikk (1989) Helsink (WHO criteria) 38 86-88 0.3 0.2 15 2.6 1 .. 0.5 2 8.8 - 1.6
~WHO (1996) Helsink (WHO criteria) 10 93 1. 0.5 19 4.5 3.5 0.1 1.5 9.9 0.1 1.9Yrjäneik (1989) Kuopio (WHO criteria) 31 86-88 0.3 0.3 14 2.9 1.3 .. 0.5 2.3 12 1.9
vi-WHO 1996 Kuopio (WHO criteria) 24 93 0.6 0.3 9.6 2.6 2.1 .. 0.1 0.9 6.9 0.1 0.3
France
González et aL. Pars 15 90 1.8 0.5 16.5 20.4 45 19
(1996)
w00-.
VJ0000
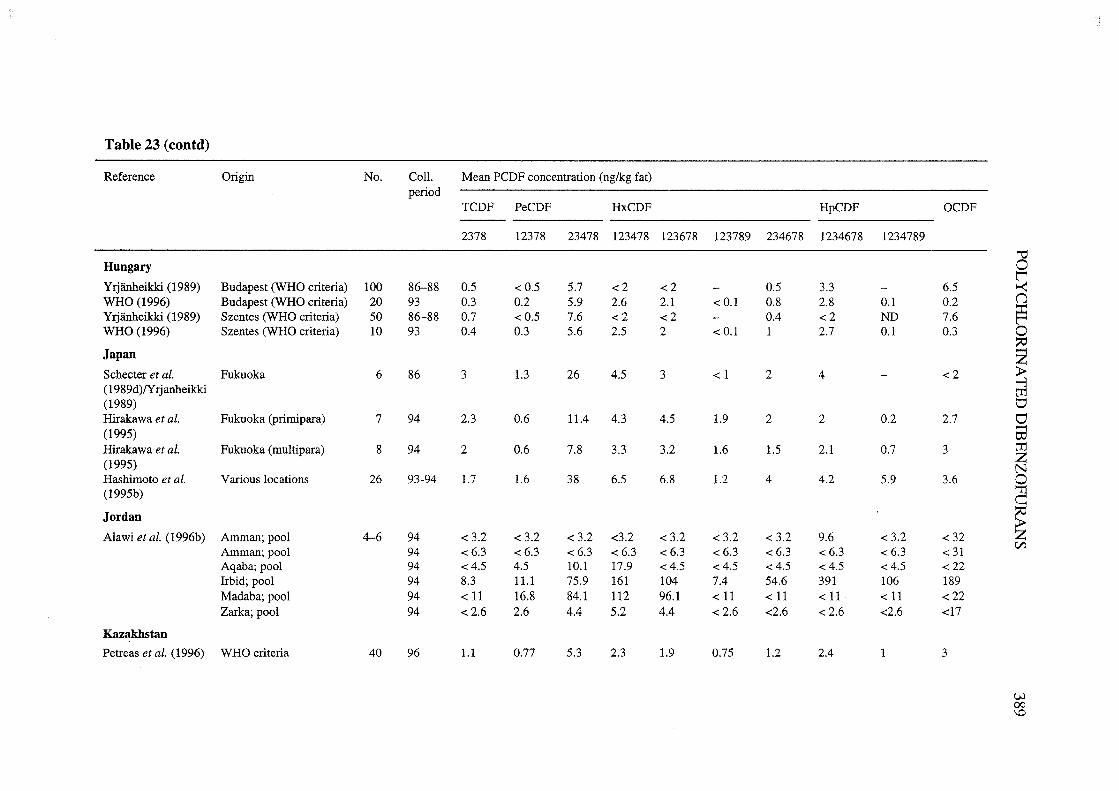
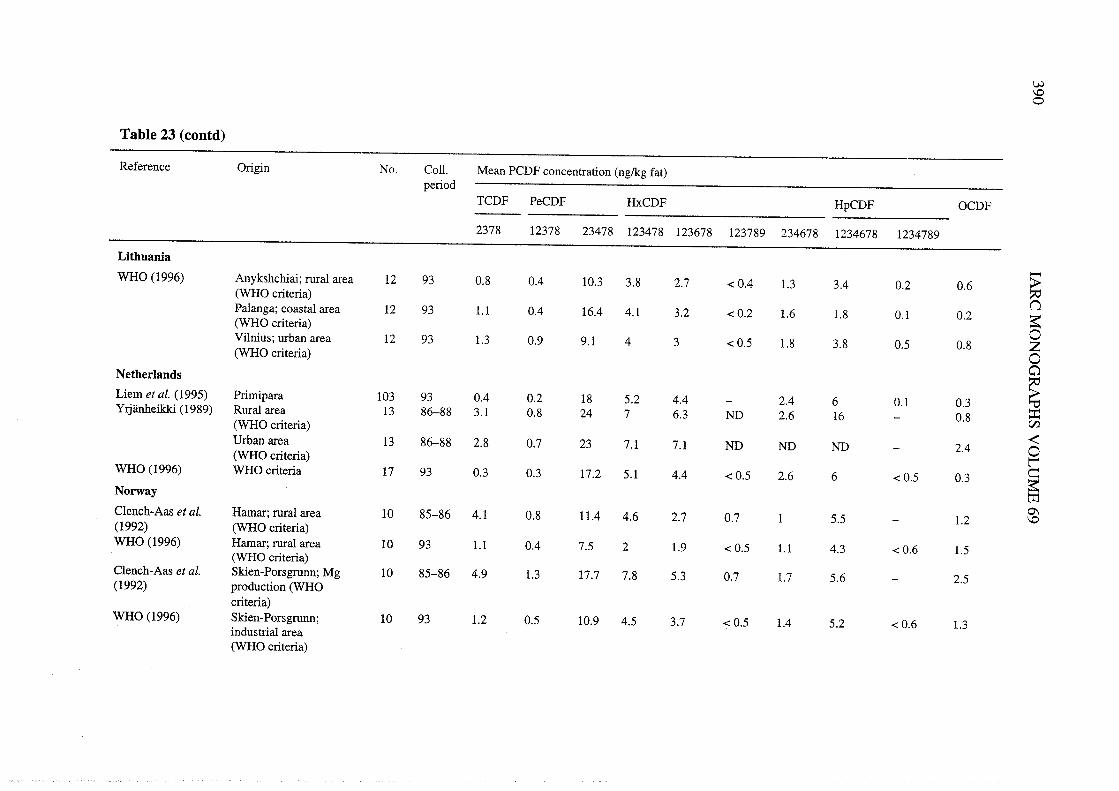
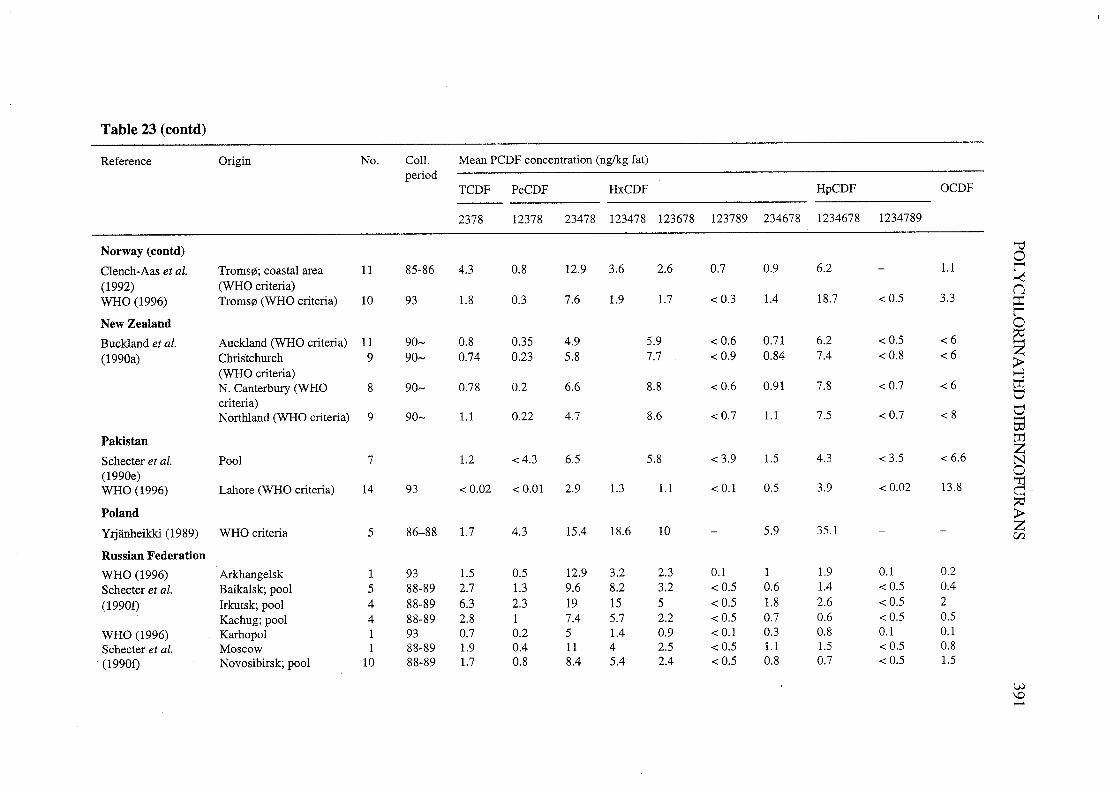
Table 23 (contd)
Reference Origin No. ColL. Mean PCDF concentration (ng/kg fat)period
TCDF PeCDF HxCDF HpCDF OCDF
2378 12378 23478 123478 123678 123789 234678 1234678 1234789
Norway (contd) "i0Clench-Aas et al. Tromsø; coastal area 11 85-86 4.3 0.8 12.9 3.6 2.6 0.7 0.9 6.2 - 1. r(1992) (WHO criteria)
~nWHO (1996) Tromsø (WHO criteria) 10 93 1.8 0,3 7.6 1.9 1. 0( 0,3 1.4 18.7 0( 0.5 3.3 ::New Zealand
r0Buckland et aL. Auckland (WHO criteria) 11 90- 0.8 0.35 4.9 5.9 0( 0.6 0.71 6.2 0( 0.5 0( 6 ~(1990a) Chrstchurch 9 90- 0.74 0.23 5.8 7.7 0( 0.9 0.84 7.4 0( 0.8 0( 6 Z
;:(WHO criteria) ""N. Canterbury (WHO 8 90- 0.78 0,2 6.6 8.8 0( 0.6 0.91 7,8 0( 0,7 0( 6 trcriteria)
U
Northland (WHO criteria) 9 90- 1. 0,22 4.7 8.6 0( 0,7 1. 7,5 0( 0.7 0( 8 U-t:Pakistan trSchecter et aL. Pool 7 1. 0( 4.3 6,5 5.8 0( 3,9 1. 4.3 0( 3,5 0( 6.6
ZN
(1990e) 0WHO (1996) Lahore (WHO criteria) 14 93 0( 0.02 0( 0.01 2.9 1. 1. 0( 0,1 0.5 3.9 0( 0,02 13,8 ''
CPoland ~Yrjäneik (1989) WHO criteria 5 86-88 1. 4.3 15.4 18.6 10 - 5.9 35,1 - - Z
C/
Russian Federation
WHO (1996) Arkhangelsk 1 93 1. 0.5 12.9 3.2 2.3 0.1 1 1.9 0,1 0,2
Schecter et al. Baialsk; pool 5 88-89 2.7 1. 9.6 8.2 3.2 0( 0.5 0.6 1.4 0( 0.5 0.4
(1990f) Irkutsk; pool 4 88-89 6.3 2.3 19 15 5 0( 0.5 1.8 2.6 0( 0,5 2
Kachug; pool 4 88-89 2.8 1 7.4 5.7 2.2 0( 0,5 0.7 0.6 0( 0,5 0.5
WHO (1996) Karhopo1 1 93 0.7 0.2 5 1.4 0,9 0( 0,1 0.3 0.8 0.1 0.1
Schecter et aL. Moscow 1 88-89 1.9 0.4 11 4 2.5 0( 0.5 1. 1. 0( 0.5 0.8
(1990f) Novosibirsk; pool 10 88-89 1. 0.8 8.4 5.4 2.4 0( 0.5 0.8 0.7 0( 0.5 1.5
VJ\0-
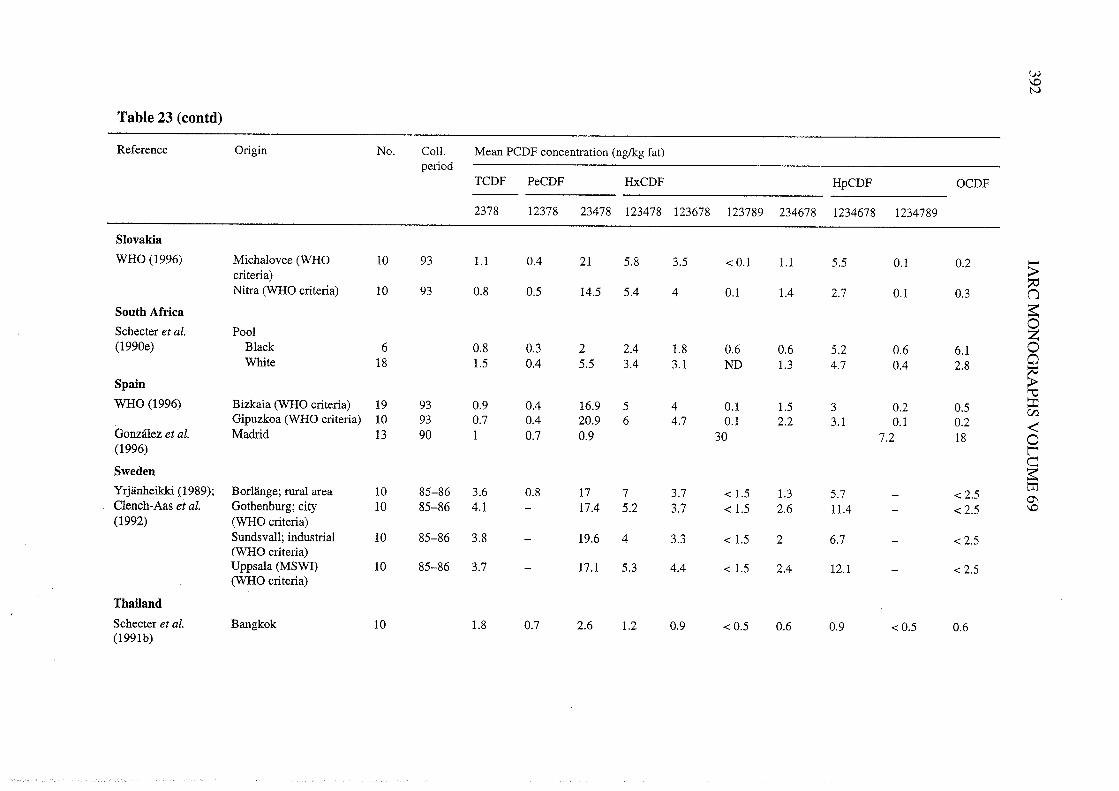
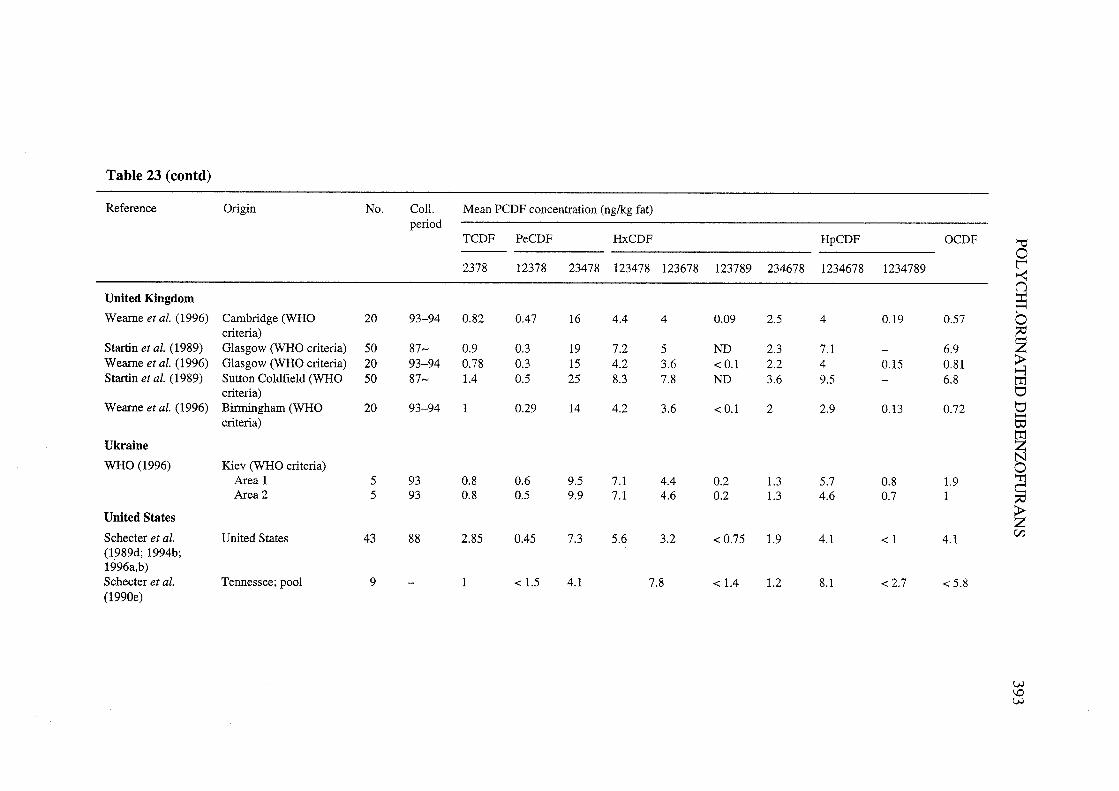
Table 23 (contd)
Reference Origin No. Coll, Mean PCDF concentration (ng/kg fat)period
TCDF PeCDF HxCDF HpCDF OCDF ""02378 12378 23478 123478 123678 123789 234678 1234678 1234789 r
~nUnited Kingdom :irWeame et aL. (1996) Cambridge (WHO 20 93-94 0,82 0047 16 404 4 0.09 2,5 4 0,19 0.57 0
criteria) ~Starn et aL. (1989) Glasgow (WO criteria) 50 87- 0.9 0.3 19 7.2 5 ND 2,3 7. - 6.9 ZWeame et aL. (1996) Glasgow (WHO criteria) 20 93-94 0.78 0.3 15 4.2 3,6 -: 0.1 2.2 4 0.15 0.81 ~~Star et al. (1989) Sutton Co1dfield (WHO 50 87- lA 0.5 25 8.3 7.8 ND 3,6 9.5 - 6.8 tr
criteria) e:Weame et aL. (1996) Bingham (WHO 20 93-94 1 0.29 14 4.2 3.6 -: 0.1 2 2.9 0,13 0.72 e:-
criteria) t:tr
Ukraine ZN
WHO (1996) Kiev (WHO criteria) 0Area 1 5 93 0.8 0.6 9,5 7.1 404 0.2 1. 5.7 0.8 1.9 ~Area 2 5 93 0.8 0.5 9.9 7.1 4.6 0.2 1.3 4.6 0.7 1
~United States
Schecter et al. United States 43 88 2.85 0045 7.3 5.6 3.2 -: 0.75 1.9 4.1 -: 1 4.1CI
(1989d; 1994b;
1996a,b)Schecter et al. Tennessee; pool 9 - 1 -: 1. 4.1 7.8 -: lA 1.2 8.1 -: 2.7 -: 5,8(1990e)
VJ\0VJ
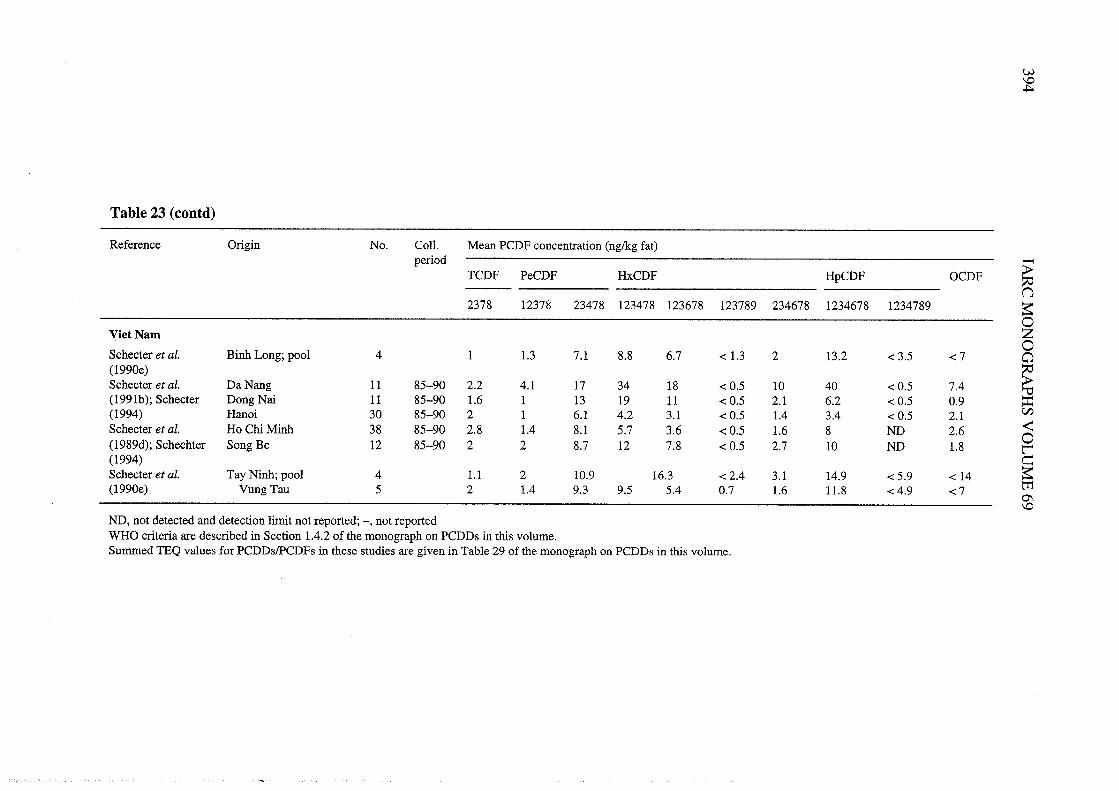
VJ\0.t
Table 23 (contd)
Reference Origin No. Coll. Mean PCDF concentration (ng/kg fat)period -
TCDF PeCDF HxCDF HpCDF OCDF ~::n2378 12378 23478 123478 123678 123789 234678 1234678 1234789 a:0
Viet Nam Z0Schecter et aL. Bin Long; pool 4 1 1. 7.1 8.8 6.7 0: 1. 2 13.2 0: 3.5 0: 7 0(1990e) ~Schecter et aL. Da Nang 11 85-90 2.2 4.1 17 34 18 0:0.5 10 40 0: 0,5 7.4 iï(1991b); Schecter Dong Nai 11 85-90 1.6 1 13 19 11 0:0.5 2.1 6.2 0: 0.5 0.9 ::(1994) Hanoi 30 85-90 2 1 6.1 4.2 3.1 0:0.5 1.4 3.4 0: 0.5 2.1 CI
Schecter et al. Ho Chi Minh 38 85-90 2.8 1.4 8.1 5.7 3.6 0: 0.5 1.6 8 ND 2.6 ~0(1989d); Schechter Song Be 12 85-90 2 2 8.7 12 7.8 0: 0.5 2.7 10 ND 1.8 t"(1994)
~Schecter et al. Tay Ninh; pool 4 1. 2 10.9 16.3 0: 2.4 3,1 14.9 0: 5.9 0: 14(1990e) Vung Tau 5 2 1.4 9.3 9.5 5.4 0.7 1.6 11.8 0:4.9 0:7 tr
0\\0
ND, not detected and detection limt not reported; -, not reportedWHO criteria are described in Section 1.4.2 of the monograph on PCDDs in ths volume.Summed TEQ values for PCDDslPCDFs in these studies are given in Table 29 of the monograph on PCDDs in ths volume.
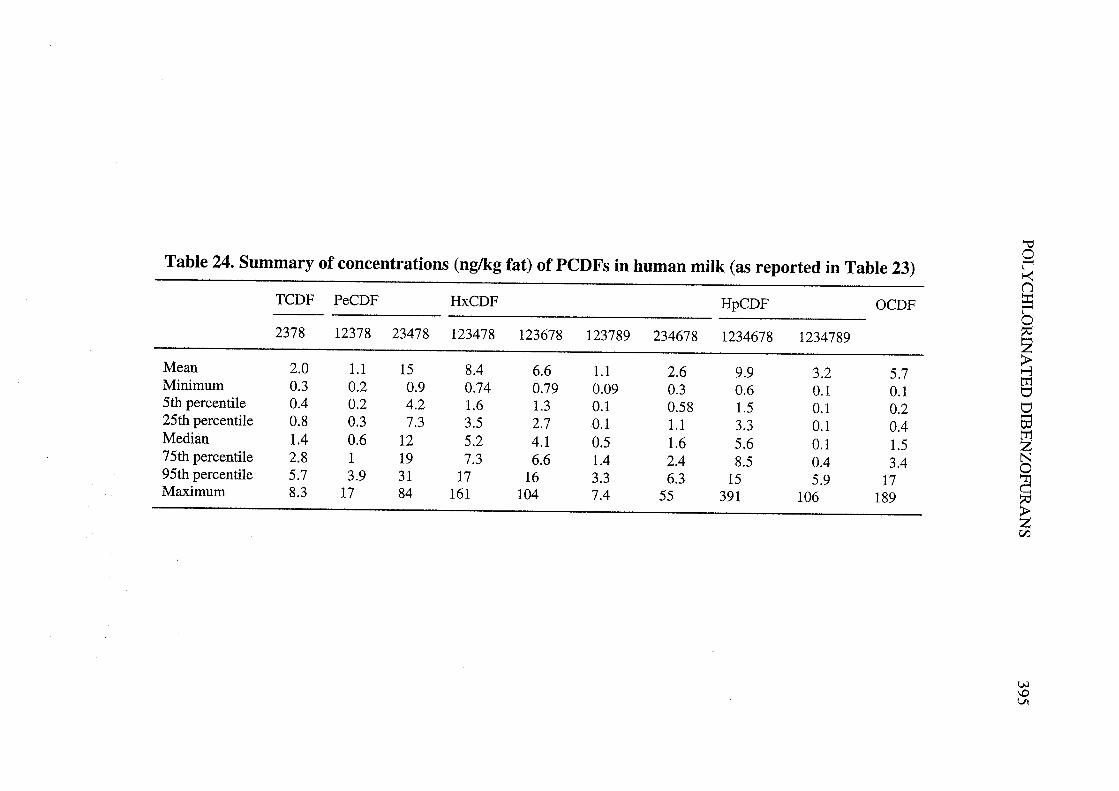
'"0Table 24. Summary of concentrations (ngJg fat) of PCDFs in human milk (as reported in Table 23) l'~("
TCDF PeCDF HxCDF HpCDF OCDF P02378 12378 23478 123478 123678 123789 234678 1234678 1234789 2
;iMean 2.0 1.1 15 8.4 6.6 1.1 2.6 9.9 3.2 5.7 gMinimum 0.3 0.2 0.9 0.74 0.79 0.09 0.3 0.6 0.1 0.1 v5th percenti1e 0.4 0.2 4.2 1.6 1.3 0.1 0.58 1.5 0.1 0.2 v25th percentile 0.8 0.3 7.3 3.5 2.7 0.1 1.1 3.3 0.1 0.4 53
tIMedian 1.4 0.6 12 5.2 4.1 0.5 1.6 5.6 0.1 1.5 Z75th percentile 2.8 1 19 7.3 6.6 1.4 2.4 8.5 0.4 3.4 N095th percentile 5.7 3.9 31 17 16 3.3 6.3 15 5.9 17 ~Maximum 8.3 17 84 161 104 7.4 55 391 106 189
~Z~
u.\0VI
396 LARC MONOGRAPHS VOLUME 69
must not exceed 5 ng I-TEQkg milk fat and, in the Netherlands, they must not exceed 6 ng I-TEQ/kg milk and milk product fat (Liem & van Zorge, 1995).
2. Studies of' Cancer in Humans
Human beings have not been documented to have been exposed to toxicologically significant amounts of PCDFs done. There have been two food poisonings in Asia h which PCBs contaminated by PCDFs were the etiological agent. The blood levels of PCBs of the victims in these incidents were higher than those of the general population but lower than are seen in highly exposed workers. [The Working Group noted that several cohorts with occupational exposure to PCBs have been followed; there is some evidence of increased incidence of liver and biliary cancer combined but not increased primary liver cancer (Brown, 1987).] The morbidity experienced by the poisoning victims was greater than is usually seen in PCB workers, and this difference in toxicity is usualIy attributed to the admixed PCDFs. Strictly, though, inferences about the toxicity of PCDEs, PCBs, or any component of the oil are not justified, since all the victims were exposed to all components. There has also been exposure to PCDFs in accidents, such as the Binghamton, NY, fire (see Section 1.2.1(b)(viii)), but they have been in situations in which there was also documented exposure to 2,3,7,8-TCDD, other PCDDs, PCBs, and other compounds.
The most toxic PCDFs are. estimated to have a potency within one or two orders of, magnitude of that of 2,3,7,8-TCDD, Thus, for some groups wish environmentaI exposures, such as consumers of Baltic Sea fish, PCDFs may make up the rnaj~r part of their potentially toxic exposures as estimated by total TEQs.
2.1 Rice oil contamination incidents
The poisoning incidents in Japan and Taiwan involving consumption of contaminated rice oil are described in Section I .3.1(b)(i).
In 1968, in Fukuoka and Nagasaki, Japan, there was an outbreak of an illness consis- ting of severe cystic acne, hyperpigmentation and conjunctivitis. Clinical and epidemio- logical investigation showed a strong association with the consumption of specific lots of rice bran cooking oil (Kuratsune et al., 1972). The illness was termed 'yusho', Japanese for 'oil disease'. Initially, chemical analysis could show only that there was a large amount of chlorine in the oil; the contarninant was later shown to be PCBs and related compounds.
Eventually about 2000 cases were registered with Japanese health authorities. The reasons for registration included not only epidemiological surveillance but also clinical care and in some cases eligibility for compensation. [The Working Group noted that some people who were genuine cases may have avoided registration, and some with
POL YCHLORIATED DIBENZOFURANS 397
minimal exposure may be inc1uded, but the combination of general publicity and thelinkng of registration to care probably means that most of those eligible were
registered.)
The Japanese oil contained of the order of 1000 mg/kg PCBs and 5 mg/kg PCDFs.Estimates of intake are based on a study of 141 cases (Masuda, 1994). These patientsconsumed about 500 mL oil before becoming symptomatic, and about another 200 mLbefore the cause of the ilness was determned and oil consumption ceased. Thus, theyingested about 500 mg PCBs and 2.5 mg PCDFs before becoming symptomatic, andabout 600 mg PCBs and 3.5 mg PCDFs in total. This occurred over a period of weeks.
Ikeda and Y oshimura (1996) followed 1815 yusho patients identified from theregistry from the Japanese Ministry of Health and Welfare to the end of March 1990.They then contacted the local health deparments and obtained a copy of the death certi-ficate for each of those who had died. The causes of death, standardized mortality ratios(SMRs) and confidence intervals (Cls) are presented in Table 25. The overall analysisused Japanese national data for its comparson group, but regional data were used forspecifie cancer sites in order to see whether regional varations explained observedexcesses in mortality. The SMR for total mortality was 1.1 (95% CI, 0.9-1.2); for totalcancer in men, it was 1.6 (95% CI, 1.2-2.1); and, for liver cancer in men, it was 3.4(95% CI, 1.8-6.0). Women had decreased total cancer mortality but a nonsignificantincrease in liver cancer mortality (SMR, 2.3; (95% CI, 0.5-6.7)) based on three deaths.There was no excess mortality from cancer in women. Both sexes showed a non-significant excess mortality from non-malignant liver disease.
2.1.2 Taiwan
Although the rice oil processing machines were banned in J apan, at least one found itsway to Taiwan. ln 1979, an extraordinar replication of the Japanese incidtntoccurredthere (Hsu et aL., 1985), called 'yucheng', meaning 'oil disease' in Chinese, againinvolving about 2000 persons.
The Taiwanese oil contained about 100 mg/kg PCBs and 0.4 mg/kg PCDFs. Esti-mates are based on a study of 99 cases. Patients consumed about 300 mg PCBs and1.3 mg PCDFs during latency and about 1 g PCBs and 3.8 mg PCDFs in total (Hsu et aL.,1994). Sorne persons consumed the oil for six months before becoming symptomatic.The ratio of PCBs to PCDFs was similar in the yusho and yucheng episodes, and the doseof PCBs and PCDFs causing symptoms was roughly similar, although the Taiwaneseconsumed more oil that was less contamnated.
Yu et al. (1996) reported that a total of 2061 subjects were inc1uded in the yuchengregistry by 1983; no cases were added nor active follow-up cared out after that year.They acquired the registr and traced cohort members though 31 December 1991. Forthe deceased cases, they acquired a copy of the death certificate from the local householdregistration offices and abstracted information on date, place and cause of death. Theoverall and cause-specifie mortalty of the exposed group was compared with that of theTaiwan general population using 1 Januar 1979 as the date of the incident and, as theend of follow-up, 31 December 1991, the date of death or the last date a subjectwas
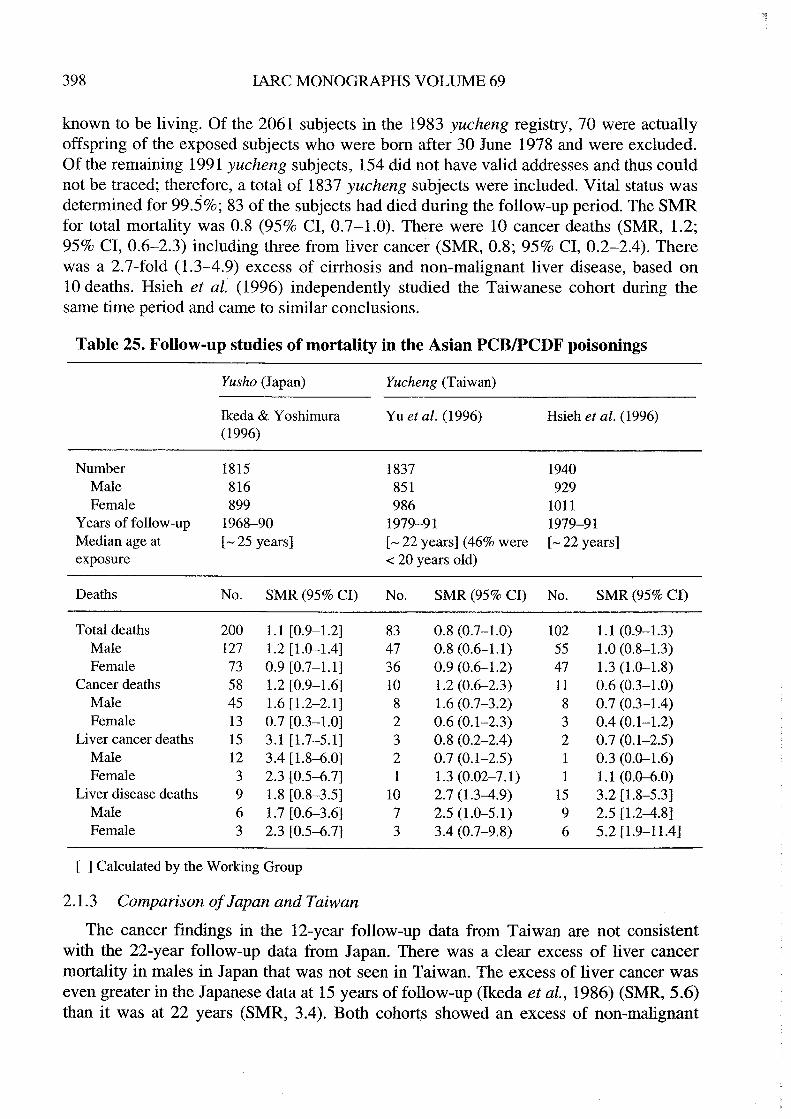
398 lARe MONOGRAHS VOLUME 69
known to be living. Of the 2061 subjects in the 1983 yucheng registry, 70 were actuallyoffspring of the exposed subjects who were bom after 30 June 1978 and were excluded.Of the remaining 1991 yucheng subjects, 154 did not have valid addresses and thus couldnot be traced; thererore, a total of 1837 yucheng subjects were included. Vital status wasdetermned for 99.5%; 83 of the subjects had died during the follow-up penod. The SMRfor total mortality was 0.8 (95% CI, 0.7-1.0). There were 10 cancer deaths (SMR, 1.2;95% CI, 0.6-2.3) including three from liver cancer (SMR, 0.8; 95% CI, 0.2-2.4). Therewas a 2.7-fold (1.3-4.9) excess of cirrhosis and non-malignant liver disease, based on10 deaths. Hsieh et al. (1996) independently studied the Taiwanese cohort during thesame time period and came to similar conclusions.
Table 25. Follow-up studies of mortality in the Asian PCB/PCDF poisonings
Yusho (Japan) Yucheng (Taiwan)
Ikeda & Y oshimura Yu et al. (1996) Hsieh et aL. (1996)
( 1996)
Number 1815 1837 1940Male 816 851 929Female 899 986 1011
Years of follow-up 1968-90 1979-91 1979-91Median age at (- 25 years) (- 22 years) (46% were (~22 years)exposure 0( 20 years old)
Deaths No. SMR (95% CI) No. SMR (95% CI) No. SMR (95% CI)
Total deaths 200 1.1 (0.9-1.2) 83 0.8 (0.7-1.0) 102 1.1 (0.9-1.3)Male 127 1.2 (1.0-1.4) 47 0.8 (0.6-1.1) 55 1.0 (0.8-1.3)Female 73 0.9 (0.7-1.1) 36 0.9 (0.6-1.2) 47 1.3 (1.0-1.8)
Cancer deaths 58 1.2 (0.9-1.6) 10 1.2 (0.6-2.3) 11 0.6 (0.3-1.0)Male 45 1.6 (1.2-2.1) 8 1.6 (0.7-3.2) 8 0.7 (0.3-1.4)
Female 13 0.7 (0.3-1.0) 2 0.6 (0.1-2.3) 3 0.4 (0.1-1.2)
Liver cancer deaths 15 3.1 (1.7-5.1) 3 0.8 (0.2-2.4) 2 0.7 (0.1-2.5)
Male 12 3.4 (1.8-6.0) 2 0.7 (0.1-2.5) 1 0.3 (0.0-1.6)
Female 3 2.3 (0.5-6.7) 1 1.3 (0.02-7.1) 1 1.1 (0.0-.0)
Liver disease deaths 9 1.8 (0.8-3.5) 10 2.7 (1.3-4.9) 15 3.2 (1.8-5.3)
Male 6 1.7 (0.6-3.6) 7 2.5 (1.0-5.1) 9 2.5 (1.2-4.8)
Female 3 2.3 (0.5-6.7) 3 3.4 (0.7-9.8) 6 5.2 (1.9-11.4)
( ) Ca1cu1ated by the W orking Group
2.1.3 Comparison of Japan and Taiwan
The cancer findings in the 12-year folIow-up data from Taiwan are Dot consistentwith the 22-year follow-up data from Japan. There was a clear excess of liver cancermortality in males in Japan that was not seen in Taiwan. The excess of liver cancer waseven greater in the Japanese data at 15 years of folIow-up (Ikeda et aL., 1986) (SMR, 5.6)than it was at 22 years (SMR, 3.4). Both cohorts showed an excess of non-malignant
POL YCHLORIA TED DIBENZOFURAS 399
liver disease. The exposures to the heat-degraded PCBs appear to have been similar.Masuda (1994) showed that the differences in blood levels of PCBs and PCDFs reportedbetween yusho and yucheng were a function of the time after the incident that thesamples were drawn, rather than due to differences in exposure. The methods of cohortselection and follow-up do not appear to favour ascertainment of those with cancer inJapan compared with those in Taiwan. The belief among physicians that the status ofbeing a yusho (or yucheng) case increases cancer risk, leading to a more frequentdiagnosis, cannot be ruled out. However, such a diagnostic bias would have to be specifieto Japan and to liver cancer to produce the observed effect. Liver disease and liver cancerare common in both countries, and the recognition and management of them is a regularpar of clinical training. It is unlikely that liver cancer is being under-diagnosed amongthe Taiwanese.
Chronic hepatitis B infection confers a relative risk of as high as 100 for liver cancer.ln the 1970s and 1980s, Japan as a whole probably had about a 2% seroprevalence forantibody to hepatitis B surface antigen, while Taiwan had about 15% (IARC, 1994a). Itis therefore unlikely to be a confounder.
Hepatitis C virus is probably more prevalent in Japan than in Taiwan (IARC, 1994b).Ho et al. (1991), in a community-based survey of Japanese over the age of 40 years,showed a prevalence of 2.3% using a (relatively non-specifie) first-generation ELISAassay. ln Taiwan, Lin et al. (1991) showed a prevalence of 0.6% in pregnant womenusing a second-generation recombinant immunoblot assay. Thus, Japan has a four-foldhigher rate, but the prevalences are low. Hepatitis C appears to be as carcinogenic ashepatitis B but, unless there is a different chemIcal interaction with the two viruses (forwhich there is no evidence), the difference in prevalence cannot account for the livercancer excess in yusho patients in Japan.
Hepatitis B and possibly C infection increases dramatically at lower latitudes, and theprefectures of Japan involved, Nagasak and Fukuoka, are southem ones. RelativelymInor differences in the prevalence of hepatitis virus infection could readily produce arelative risk of 3 for liver cancer, since the national rates are dominated by the populationcentres further nort. Ikeda and Y oshimura (1996), however, considered this possibilityand found that, when the liver cancer rates among yusho patients were compared with theNagasak and Fukuoka rates, the relative risk declined from 3.4 to 2.3 in men butremained statistically significant. This may be too conservative, since only about half ofthe cases actually lived in Nagasak and Fukuoka.
2.2 Fish consumption
Swedish investigators have studied mortality and cancer incidence in Swedishfishermen and their wives (Rylander & Hagmar, 1995) from the Baltic coast, who prefersalmon, herrng and other fatt fish, and compared them both with the rates in theSwedish'population (Hagmar et aL., 1992) and those offishing familles from the Atlanticcoast, who prefer less fatt cod and flat fish (Svensson et aL., 1995a). Swedish fishermenwere believed to eat about twice as much fish as the general population, and this wasconfrmed by dietar interviews in a sample of the wives. Baltic fish are contamInated by

400 IARC MONOGRAHS VOLUME 69
organochlorine compounds, and the concentration of these substances in human body fatrelates to the amount of fish consumed. The predominant exposure in terms of PCDDsand PCDFs from fatty fish from the Baltic Sea is to 2,3,4,7,8-PeCDF (Svensson et aL.,1991) (although even heavy fish consumers probably have body fat concentrations aboutthree orders of magnitude lower than those of the victims of the Asian poisonings J. Thesefish also contain PCBs and other persistent chlorinated compounds.
The fishermen (;: 99% of the cohort members were men) cohorts were formed fromthe records of the local fishermen's organizations. For the Atlantic coast, 8493 persons(16 women) had ever been members of the organization and, for the Baltic coast, 2907persons (24 women). The cohorts consisted of 8477 Atlantic coast and 2896 Baltic coastfishermen observed from 1965 for the Atlantic and from 1968 for the Baltic. After thefishermen were identified, the wives were sought through linkage to the national Swedishpopulation registry and also records in local parshes. For the Atlantic coast, 7166women were identified who either were or had been mared to one of the fishermen. Forthe Baltic coast, there were 2175 women. Information was updated for everyone to 31December 1988, including a subset of the Baltic coast men who had been reported onpreviously (Hagmar et al., 1992). Data on death came from Statistics Sweden and thoseon cancer occurrence from the Swedish Cancer Registry (Svensson et aL., 1995b).
Stomach cancer occurred more frequently in the Baltic coast fishermen. Comparedwith the regional population, the standardized incidence ratio (SIR) was 1.6 (95% CI,1.0-2.4) and, compared with Atlantic coast fishermen, the incidence rate ratio (IRR) was2.2 (1.3-3.5). Squamous-cell cancer of the skin was diagnosed more frequently in theBaltic coast fishermen (SIR, 2.3; 1.5-3.5) compared with the regional population and(IRR, 1.9; 1.2-3.1) compared with the Atlantic coast fishermen. Both cohorts offishermen had higher mortality from multiple myeloma compared with the generalpopulation, with SMRs of 3.1 on the Baltic coast and 1.3 on the Atlantic coast. IschaemIchear disease was decreased among the Baltic coast fishermen but not among those froIDthe Atlantic coast, consistent with their reported differences in diet and the possibleprotective role of n-3 polyunsaturated fatty acids found in the fatty fish preferred by theformer population (Svensson et aL., 1995b). Compared to the Swedish rates, the Balticcoast wives had a slightly higher and the Atlantic coast wives a slightly lower incidenceof breast cancer, but comparsons with neither the population nor the other group weresignificant (Rylander & Hagmar, 1995).
2.3 Industrial cohorts
(The Working Group noted that exposure to PCDFs may have occurred amongworkers in the phenoxy herbicides/chlorophenols industrial production cohorts whichhave been reviewed in the monograph on PCDDs. Exposure to PCDFs, however, isinadequately characterized in these cohorts. Furermore, the W orking Group consideredthat confounding by concomitant exposure to PCDDs seriously complicates any inter-pretation of these data regarding cancer risk in relation to PCDF exposure.)
POL YCHLORIATED DIBENZOFURANS 401
3. Studies of Cancer in Experimental Animais
3.1 Administration with known carcinogens
Studies on PCDFs in combination with known carcIlogens are summarzed IITable 26.
3.1. i Mouse skin
2,3,7,8- Tetrachlorodibenzofuran
Groups of 20 female HRS/J hairless (hr/hr) mIce, eight weeks of age, were given skinapplications of 0 or 5 flmol/animal N-methyl-N' -nitro-N-nitrosoguanidine (MNNG) in50 flL acetone followed by 1 flg/animal 2,3,7,8- TCDF in 50 llL acetone twIce weekly for20 weeks. Skin papilomas developed in 19/19 mIce (4.9 tumours/mouse) in mIce treatedwith MNNG plus 2,3,7,8-TCDF compared with 1/20 (0.05 tumours/mouse) in micetreated with 2,3,7,8-TCDF alone and 0/23 with MNNG alone (Poland et al., 1982).
2,3,4,7,8- Pentachlorodibenzofuran
Three groups of 20 female HRS/J hairless (hrlhr) mIce, five to eight weeks of age,were treated with single skin applications of 5 flmol/animal MNG in 50 flL acetone.Staring seven days later, the mice were treated with 25, 50 or 100 ng/animal 2,3,4,7,8-PeCDF in 25 flL acetone twice weekly for 20 weeks. A control group of 20 micereceived acetone followed by 100 ng/anmal 2,3,4,7,8-PeCDF. The numbers of survivingmIce with papilomas of the skin were 9/19, 11/18 and 8/18 in mice treated with MNNGand 25, 50 or 100 ng/animal 2,3,4,7,8-PeCDF compared with 0/20 in mice treated with2,3,4,7,8-PeCDF alone and 1/19 in mice treated with MNNG alone. Skin carcinomaswere found in 1/19 mice treated with MNNG + 25 ng 2,3,4,7,8-PeCDF, 1/19 mIce treatedwith MNG + 100 ng 2,3,4,7,8-PeCDF and in 1/19 mice treated with MNNG alone(Hébert et al., 1990a).
1,2,3,4,7,8- Hexachlorodibenzofuran
Thee groups of 20 female HRS/J hairless (hrlhr) mice, five to eight weeks of age,were treated with single skin applications of 5 flmol/anmal MNNG in 50 flL acetone.Staring seven days later, the mice were treated with 250, 500 or 1000 ng/animal1,2,3,4,7,8-HxCDF in 25 flL acetone twice weekly for 20 weeks. A control group of 20
mIce received acetone followed by 1000 ng/anmal 1,2,3,4,7,8-HxCDF. The numbers ofsurviving mice with papilomas of the skin were 15/19, 7/14 and 3/17 in mice treatedwith MNG and 250, 500 or 1000 ng/anma11,2,3,4,7,8-HxCDF compared with 1/17 inmIce treated with 1,2,3,4,7,8-HxCDF alone. Skin carcinomas occurred in 1/19 micetreated with MNG + 250 ng 1,2,3,4,7,8-HxCDF, 2/17 mice treated with MNNG + 1000ng 1,2,3,4,7,8-HxCDF and 1/19 mice treated with MNNG alone (Hébert et al., 1990a).
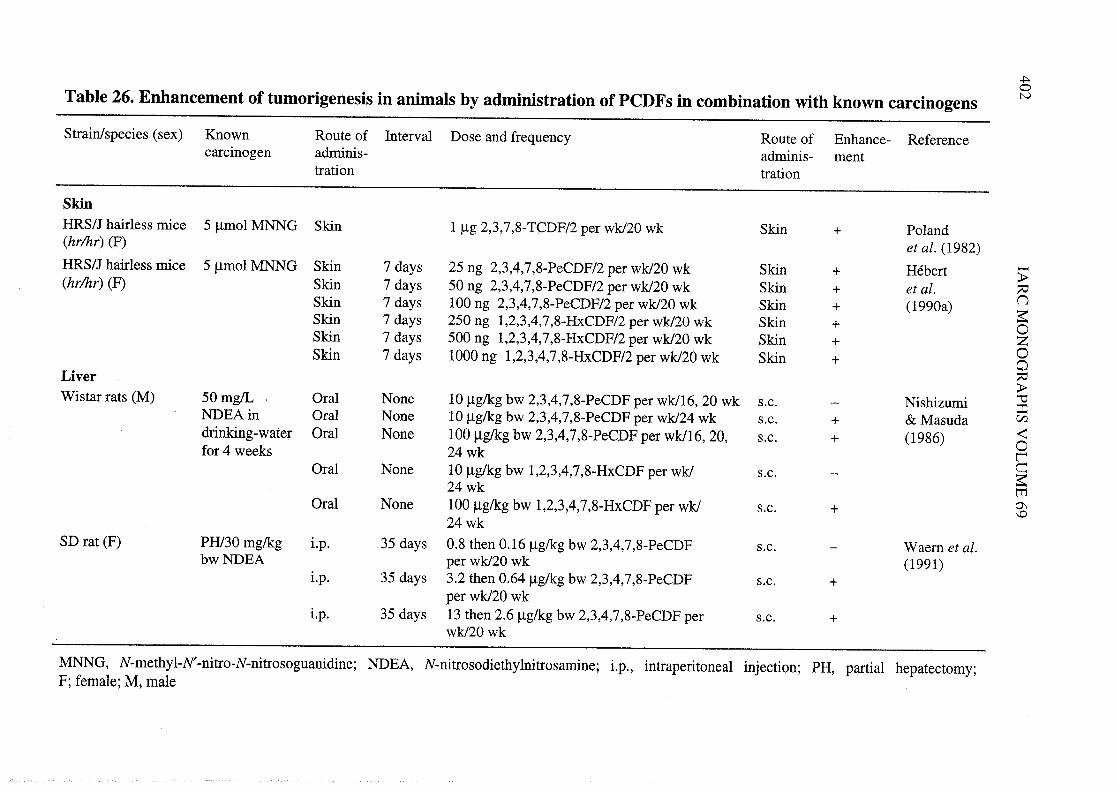
402~M~-,.ciE
- C'
=~tlo=...~i.ci~=~o=~..-...~=o...-ci=...,.eo~=...
(1()i:~~(10:1(1()§ .... i:i: (1
~ S
'" 1
o V)
(1 ï5 i:.."~ 0
:: t:"¡j
o "1 ro
0: ro ti
C'
~~U~l:o=o...-cii.-C'
ï3...e"0ci~,.C'
-cieï3ci=...
;:()i:(1g.(14'"0§(1V
)oCl
.-ro¡:(1..i:..C
'...C
'~=~tl...i.oe=
'-l:o-=~e~~=ci
"â~
'" 1
o V)
(1'El i:
...~ 0
:: l:"~
o "1 ro
0: ro ti
i:(1oni: 0
~ .S
o ()~ ~
,.~(1V)
'-V)
(1...()(1o.V
)
ì:...rotiv.
V)
V)
(1
13 ,.
ro p:.. '-
~ Î'
~ ~
~rJ :iS
lAR
e MO
NO
GR
AP
HS
VO
LUM
E 69
,.N000\"1~i: .ro ..
- (jo ..0. ~
,.t: ro
(1 -. ~~
(j 0\:: t) ~
++
++
++
+
i::.u:
i: i: i: i: i: i::. :. :. :. :. :.v. u: u: u: v. v.
~~oN:;~i.(10.NiLC
lUE
-1
oqt;r:Non::
~~ ~ ~
~ ~ ~ 0
~~ ~oo~~ ~O
NN
..00 N:;:; ~
~ N:; ~ ~ i.
.. :; :, i. i. (1
:,:,..(1(1o..... i. o.o.N
i. i. ~ N N
;:(1 (1 _ -. -. _
o. o.N p: p: C
lN
NiL
ClC
luiL iL C
l U U
~C
lClU
~~~U
U ",(1 1 100
æ æ '" oq oo~ r-
1 1 oor-r-~oo~oqr-~~ ~
r-r- ~ ~ ~~
~ ~ oo (' (' c-oo~ oo~ ~ N
~ N ~
(' (' ~ ~ ~-~ ~N
--N
N 0/
on on 0/ i:O
/O/i:i:i:o
i: i:ooooiroollooN
ir-Nir_
-cr CI CI CI cr cz
;: ;: ;; ;; ;; ;:ro ro ro ro ro ro
"0 "o"o"1"1"o
r- r- r- r- r- r-
i::.v.i: i: i: i: i: i::. :. :. :. :. :.v. v. v. u: v. v.
c~~
c~~-oS::il
.-o§.ir
(1()
's
(1()
'sV)
V)
(1
13 ,.
ro i:
.. '-
~ Î'
~~
"s ~:: ::N V) ,.
... ro \0
.. ~ 00
.~ 0\
Zd60
1 + +
ú ~ ~
V) V) V)
()V)
~~ Ó
O~N
N~ ~ \Ó :;
\Ooo- :; ::
-N:; :, ..
:;:; ~ .. i.
~~i. iu g,
iu iu g, o. i:
o. 0. i: p: Cl
~~Clu Ô ~
U U Q) ~ ::
(1(1p. :: ob
~~
ob ob r-0000 ~ r- ~
~ ~ t- ~ 'I~
t;t;~ ~ ~
~ oo~ M ~ c-
~~
c- C' _
N N ~ _ ~
~~.. ~ ...... 0/ .. 0/
on on ~ 0/ ~
~~ O/~ ~~ O/~
:: :: :: ~ :: ~ :: ~o 0
OO
O'IO
ooO'I
---N-N
-N(1 (1 Q)
i: i: i:o 0 0
ZZ
Z(1i:oZ
Q)
i:oZ
i- i- 1" ,.ro ro ro ro
i. i. i. i.000 0
.-roi.oi..Q
)
~~ ~i: 1 (1
t: . .. 0/ (1
on~:Ê ~
~~:g~ir Z "Ö t8
,.~'-V)
..roi.i. ~
~ ..~ V)
:s ~
-.(j..~8 ;:
(1 0\ro 0\~~
++ +
(JlZ~V
)()V
)~V
)
i.(1p: p: 0.
Cl C
l p:U
U C
l(1 (1 U
~ ~ (1
00 oo~ ~
r- r- oo~
~ ~
t;(' ~ ~
c- N ('
~ ~
c-.. .. ~
on on ..~
~ 0/
~ ~ ~
\0 ~ oo ~ ::
"-~~~\O°fio~~~ß:;ß:;i:~.£~.£ ~.sfi00 iu 0! iu (' :;
Ó o.r: o.- ~
V) V)
~ ~
"0 "1
ir ir(' ('
V)
;;ro"0ir('
ci ~
.~ ..-
ci...
0/
~~s ~gê¡: ~
p. ..
G:
'-~i.Cl
v.
;:El
o..(JQ)
..roo.Q)
...-ro.~o.
:rp.i:o.....(JQ)
'2'.--roQ
)i:o..'i:Q
)
ê"i.-i:.-~...Q)
i:'sroV)
oti'E-;:....Q)
.-"0olZoti...i:~~ê(úi:..."0'Elro::0/oV)
oti'El
~1oti'El1
~1- Q)
;:-.£ ro
(1 El
S ~
~~Q
)
ó~~~~ p;
POL YCHLORINA TED DIBENZOFURANS 403
3.1.2 Rat liver
2,3,4,7,8-Pentachlorodibenzofuran
Groups of 12 male Wistar rats, five weeks of age, were given 50 mglL (ppm) N-nitrosodiethylamine (NDEA) in the drinkng-water for four weeks. The rats were then
given weekly subcutaneous injections of olive oil or 10 or 100 ¡.g/kg bw 2,3,4,7,8-PeCDF for 16, 20 or 24 weeks. At the end of treatment, the animaIs were killed (four pertreatment per time point) and the number and size of liver tumours (hepatocellularcarcinomas and hyperplastic nodules) were assessed. The numbers of liver tumours perrat were significantly greater in the 2,3,4,7,8-PeCDF-NDEA animaIs (at 24 weeks, 10 Jlg2,3,4,7,8-PeCDF + NDEA, 17/rat; 100 Jlg 2,3,4,7,8-PeCDF + NDEA, 24.3/rat) than inthe rats treated with NDEA alone (at 24 weeks, 3/rat). The number of hepatocellular neo-plasms was increased at the 16-week observation period in the 100 ¡.g/kg 2,3,4,7,8-PeCDF/NEA rats (3.3/rat) compared with those treated with NDEA alone (0.3/rat). Thelesions were also larger in anmaIs receiving the 2,3,4,7,8-PeCDF/NEA combinationtreatment than in those treated with NDEA aIone (Nishizumi & Masuda, 1986). (TheWorking Group noted that the number of animaIs with tumours was not given.)
Groups of 10 female Sprague-Dawley rats (age unspecified) were subjected to a 70%parial hepatectomy followed by administration of 30 mg/kg bw NDEA by intra-peritoneal injection and treatment with corn oil vehicle or 2,3,4,7,8-PeCDF by subcuta-neous injection staring five weeks later for 14 or 20 weeks. The 2,3,4,7,8-PeCDF wasgiven as an initial loading dose (5 x maintenance dose) followed by weekly maintenancedoses of 0.16, 0.64 and 2.6 ¡.g/kg bw 2,3,4,7,8-PeCDF for 19 weeks. The rats were killedafter 20 weeks of treatment with vehicle or 2,3,4,7,8-PeCDF and analysed for thepresence of y-glutamyltransferase-positive focal hepatic lesions. A significant increase inthe percentage of liver occupied by these les ions was observed for all doses (approxi-mately: ,low-dose, 0.25%; mid-dose, 0.5%; high-dose, 0.5%) compared with NDEAaIone (0.15%). A significant increase in the number of foci per liver was also seen at thetwo highest doses (approximately: low-dose, 2500; mid-dose, 3500; high-dose, 4500) ascompared to NDEA alone (2000) (Waern et al., 1991).
1,2,3,4,7,8- Hexachlorodibenzofuran
Groups of 12 male Wistar rats, five weeks of age, were given 50 mglL (ppm) NDEAin the drinkng-water for four weeks. The rats were then given weekly subcutaeousinjections of olive oil or 10 or 100 ¡.g/kg bw 1,2,3,4,7,8-HxCDF for 16, 20 or 24 weeks.At the end of treatment, the anmals were killed (four per treatment per time point) andthe number and size of hepatocellular carcinomas and hyperplastic nodules were
assessed. At 24 weeks, the highest dose of 1,2,3,4,7,8-HxCDF increased the number oflIver tumours per rat (12/rat) as compared to NDEA alone (3/rat). No effect was seen atthe low dose (2.3 tumours/rat) (Nishizur & Masuda, 1986). (The Working Group notedthat the number of animaIs with tumours was not given.J
404 IARC MONOGRAHS VOLUME 69
4. Other Data Relevant to an Evaluation of Carcinogenicity
and its Mechanisms
4.1 Absorption, distribution, metabolism and excretion
4.1.1 Humans
KInetic data on PCDFs have been reviewed (OIson, 1994).
ln an individual exposed accidentally to PCDFs during a fire in Binghamton, NY,United States (see page 364), elimination half-lives of 2,3,4,7,8-PeCDF, 1,2,3,4,7,8-HxCDF, 1,2,3,6,7,8-HxCDF and 1,2,3,4,6,7,8-HpCDF were found to be 4-7 years(Schecter et al., 1990a). Flesch-Janys et aL. (1996a) investigated 48 workers who hadbeen exposed to PCDDs and PCDFs in a herbicide-producing plant and calculatedmedian half-lives that ranged from 3.0 years for 1,2,3,4,5,6,7,8-HpCDF to 19.6 years for2,3,4,7,8-PCDF. ln yucheng patients who had ingested PCB-contaminated rice oil in1979 (see pages 362-363), half-lives of 2-3 years were found for 2,3,4,7,8-PeCDF,
1,2,3,4,7,8-HxCDF and 1,2,3,4,6,7,8-HpCDF during the period 1-12 years after the
incident. Yusho patients were contaminated in 1968 and were examned 15-25 years afterthe incident showed considerably longer half-lives of 8-13 years (Ryan et al., 1993;
Masuda, 1996). These data suggest an increase in half-lives at lower dose levels. Thisbehaviour is reflected in the kinetic model of Carer et al. (1995b).
Half-lives of 1.3 years for 2,3,7,8-TCDF and 6.3 years for 2,3,4,7,8-PeCDF werecalculated (Schlatter, 1991) using a method that compares daily intakes and bodyburdens ofPCDFs of the normal population with those of2,3,7,8-TCDD.
Concentrations of 2,3,4,7,8-PeCDF and 1,2,3,4,7,8- and 1,2,3,6,7,8-HxCDFs were3-5-fold higher in adipose tissue than in liver (wet weight basis) in deceased yushopatients but considerably lower in adipose tissue than in liver in yucheng patients
(Olafsson et al., 1988). ln the normal population, the concentration ratios of liver : fat (ona wet weight basis) were 0.2 for 2,3,4,7,8-PeCDF, 0.5 for OCDF and 1.1 for1,2,3,4,6,7,8-HpCDF (Thoma et aL., 1990; Wacker et al., 1990).
During one year ofbreast-feeding, PCDD and PCDF levels in human milk fell by 50-70% and those in the milk of mothers .nursing theIr second child were 20-30% lowerthan those in the milk of mothers nursing their first child (Fürst et aL., 1989). Theseresults are concordant with predictions of kinetic models (Carer et aL., 1995b; Van derMolen et aL., 1996).
4.1.2 Experimental systems
(a) Absorption
The efficiency of absorption of 2,3,7,8-TCDF and 2,3,4,7,8-PeCDF has been studIedin rats, hamters and guinea-pigs after oral uptake using oily vehic1es. For both COff-pounds, 70-90% absorption from the gastrointestinal tract was observed (Birbaumet aL., 1980; Y oshimura et aL., 1986; Brewster & Bimbaum, 1987; Kamimura et aL.,
POL YCHLORINA TED DIBENZOFURANS 405
1988). ln the guinea-pig, gastrointestinal uptake of 2,3,7,8-TCDF was more efficient thanthat of 2,3,7,8- TCDD and this was attrbuted to higher solubility of the former compound(Nolan et al., 1979; Decad et aL., 1981a). As with PCDDs, gastrointestinal absorption ofPCDFs depends on the vehicle, molecular size and solubility of the congener. The lattertwo properties appear to be the more significant in decreasing absorption of the hepta-and octa-CDFs (McLachlan et aL., 1990). As for 2,3,7,8-TCDD, it was shown thatenterohepatic circulation was not significant for 1,2,3,7,8-PeCDF or its metabolites inrats (Brewster & Birnbaum, 1988).
Percutaneous absorption of 2,3,4,7,8-PeCDF in rats was age-dependent, with muchmore effective uptake in younger animaIs (Banks et aL., 1990). The dermal absorption of2,3,7,8-TCDF and 1,2,3,7,8- and 2,3,4,7,8-PeCDFs in rats was also found to be dose- andstructure-dependent, with 2,3,7,8-TCDF absorbed most efficiently (Brewster et aL.,1989). Compared with oral uptake, skin permeation is much slower. After dermal appli-cation of 1,2,3,7,8-PeCDF to the skin of a rhesus monkey, 99% of the dose was stilpresent at the application site after 6 h (Brewster et aL., 1988). The uptake of sevencompounds from a dermal application site showed a good inverse correlation with theoctanol-water parition coefficients (Jackson et aL., 1993).
As with PCDDs, the adsorption of PCDFs on environmental matrces such as soil andcombustion paricles can strongly reduce the bioavailability of these compounds. Theoral bioavailability factor which has been suggested for PCDDs (25-50% for C14- andC16-congeners) can also be considered applicable to PCDFs (Van den Berg et al., 1994).
(b) Distribution
The PCDFs have a similar tissue distribution to that of the PCDDs in both rodents andnon-human primates, the liver, adipose tissue and skin being the major storage sites. The2,,3,7,8-substituted PCDFs are the major congeners retained in most mammalian tissuesand fluids. ln this respect, the guinea-pig forms a distinct exception, as it also retains inthe liver PCDFs with a 2,3,(4),6,7-chlorine substitution pattern, which apparently cannotbe effectively metabolized by the cytochrome P450 system of the guinea-pig (Van denBerg et al., 1986c; Ahlborg et al., 1990). ln other rodent species, the retention of these'pseudolateral PCDFs (for example, 2,3,4,6,7-PeCDF) is rarely observed (Van den Berget al., 1994). Sorne tissue retention of non-2,3,7,8-substituted PCDFs has been found inrats and marosets (Abraham et al., 1989; Neubert et al., 1990a), but the concentrationsobserved are not considered to be toxicologically relevant when compared with thepredominance of 2,3,7,8-substituted congeners. An increasing binding affinity to plasmaproteins is found for the higher-chlorinated PCDFs and binding to plasma pro teins andlipoproteins appears to be the major mode of transport in the blood (Patterson et aL.,1989; Schecter et al., 1990e).
Studies with 2,3,7,8-TCDF and -TCDD have shown these compounds to have similartissue distrbution in the rat (Birbaum et al., 1980). A number of higher-chlorinatedPCDFs, especially 2,3,4,7,8-PeCDF, have a much higher liver affinity in rodents than2,3,7,8-TCDD. For these PCDFs, liver retention of 75-90% of the administered dose hasbeen reported (Van den Berg et al., 1994). Studies with mixtures of both PCDDs andPCDFs showed that tissue distribution in rats and hamsters was not significantly different
406 IAC MONOGRAPHS VOLUME 69
between the hepta- and octa-CDFs and -CDDs (Van den Berg et al., 1986c, 1987). lnrhesus monkeys, the liver retention of 2,3,4,7,8-PeCDF, which is unusually Ì1igh inrodents, is lower and not much different from that of 2,3,7,8-TCDD in rhesus monkeys(Kuroki et al., 1980; Brewster et al., 1988). ln contrast, marosets more closelyresemble rats in tissue distrbution of PCDFs as well as PCDDs (Abraham et al., 1989).As with 2,3,7,8-TCDD, dose-dependent hepatic retention of PCDFs has been observed ina number of rodent studies, but sorne other studies have not found this dose-dependence(Van den Berg et al., 1994). With respect to the occurrence of inducible hepatic bindingsites in rodent liver (Poland et al., 1989a), it should be noted that 2,3,4,7,8-PeCDF is astrongly binding substrate as well as an inducer of CYPIA2 (Y oshImura et al., 1984;Kuroki et al., 1986; Y oshimura et al., 1987).
(c) Metabolism
As with the PCDDs, the oxidation of PCDFs occurs preferentially on the 2, 3, 7 or 8positions, yielding a higher number of hydroxylated metabolites than with the PCDDs 'due to the asymmetric structure of the dibenzofuran molecule (Veerkamp et aL., 1981;Poiger et aL., 1989). Based on studies with rats and 2,3,7,8-TCDF, it appears that thepreferred site of metabolism of 2,3,7,8- TCDF is near the furan oxygen, with oxygenationat C4 predominating over oxygenation at C3 (Burka et aL., 1990). ln rats, the CYPIAIprotein is directly involved in phase 1 metabolism of 2,3,7,8- TCDF (OIson et aL., 1994)and not the CYPIA2 protein (Tai et al., 1993). Sulfur-containing metabolites have alsobeen observed as mInor metabolites, with S substitution preferentially at the 4 position(Kuroki et aL., 1989, 1990). ln contrast to the PCDDs, the 4-4a positions in the dibenzo-furan molecule are more susceptible to metabolic mixed function oxidase attack (Plüsset aL., 1987; Burka et aL., 1990). As a result, the biotransformation of 2,3,7,8-TCDF and1,2,3,7,8-PeCDF is much more rapid than that of their dioxin analogues. If chlorineatoms on the 4 or 6 position are present in a 2,3,7,8-substituted PCDF, metabolism isstrongly decreased, leading to an extremely low rate of elimination from the body(Brewster & Bimbaum, 1987, 1988; Van den Berg et al., 1989a,b). Further chlorinationof 2,3,7,8-substituted PCDFs results in a decrease in the number of metabolites andelimination rate (Veerkamp et aL., 1981; Poiger et aL., 1989). Virtually no information isavailable on differences between species in PCDF metabolism. ln Figure 1, a gene-ralized scheme for metabolic pathways of PCDFs is given, which is based on mammalianstudies in vivo (Van den Berg et aL., 1994).
(d) Excretion
The elimination of PCDFs, like that of the PCDDs, depends strongly on the positionof the chlorine atoms. Those congeners with a 2,3,7,8-chlorine substitution patternexhibit the slowest elimiation rates in all laboratory species studied. As PCDFs arestored primarly in the liver and adipose tissue, the whole-body half-life of thesecompounds is governed mainly by the elimination from these two body comparments.Although kinetIc information for PCDFs is more limited, elimInation rates and half-lives
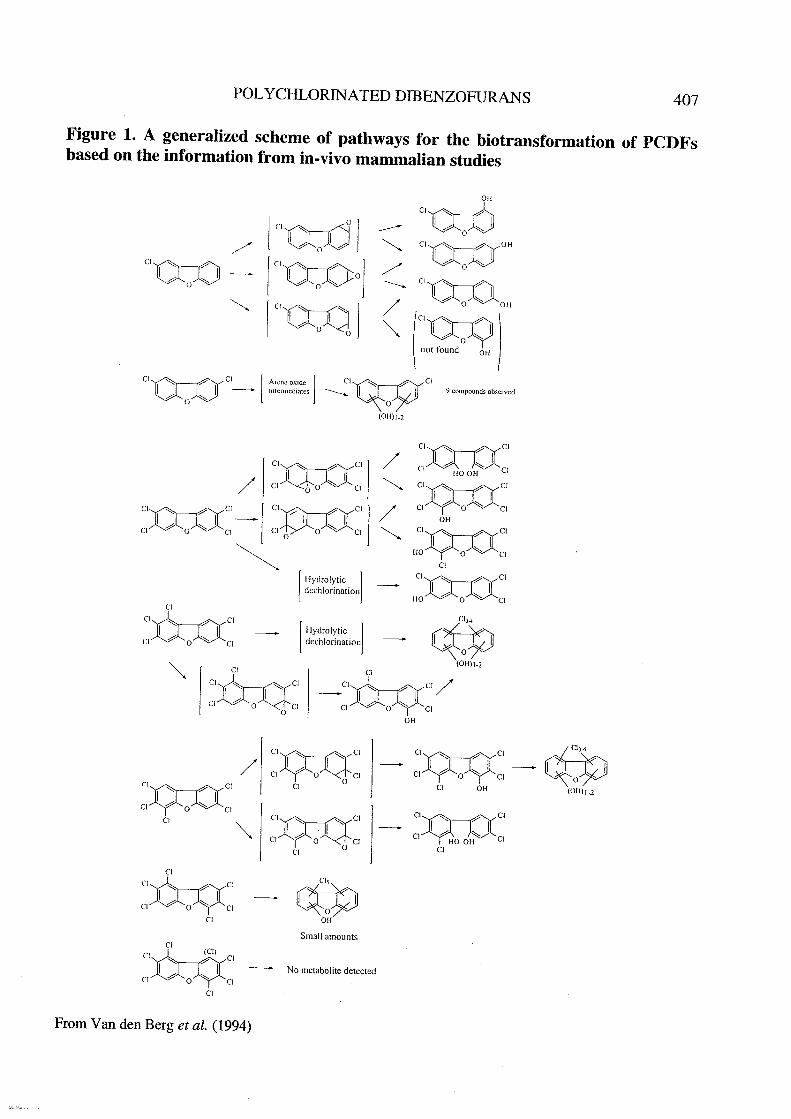
POL YCHLORINA TED DIBENZOFURAS 407
Figure 1. A generalized scheme of pathways for the biotransformation of PCDFsbased on the information from in-vivo mammalian studies
OHCICc¡CICo) -- 1 g "" 10/ ~ CIÜ:0H
1 g "" 1CI'C1 C'ú:'j
/ 01 g "" 1 -- Clù:0 1 g 1~ ¡CICçJ / o "" OH
"'CI9;
1 g "" 10
not tound OH
CI~CI r Areiieoxide ¡~o~ -- iiifeniiediales
CI:C"" Ci1 I-Ci g 0 "" Ci
Ci
ciU="" Ci1 1Ci g 0 "" Ci
"'
CI~"" Ci-- 1 1o
(OH)I_2
ICI~CII// CI~O~CI ~/~ei
Lç
Ci/'1 1Ci 0 "" ei
o~¡ Hydrolytíc J
dechlorination
¡ Hydrolytic Jdechlorination
CiCI~CICI~O~CI
o
CI~CICI~O~CI
Ci
Ci
CIU:"" Ci1 g 1Ci 0 "" CiCi
Ci
Ci
Ci
Ci
Ci
Ci
From Van den Berg et aL. (1994)
9 coiipoiinds obscrvcd
CI~CI~~Ci HO OH Cicin:"" ei1 1Ci g 0 "" CI
OHCInM"" Ci1 1HO g 0 "" Ci
Ci
ci:c"" ei1 1HO g 0 "" Ci
~(OH)I_2
CiCIU:"" Ci /- 1 1Ci g 0 "" Ci
OH
/ CIn:"" Ci1 1
Ci g 0 Cio
Ci
"'CIn:"" Ci
1 . 1Ci g 0 eio
Ci
Ci,~OH
Sinall ainounts
No inetabolite detected
CIn:"" ei1 1ei g 0 "" Ci
Ci OH~~o~
(011)1-1
Ci Ci
eiCi
Ci
408 lARe MONOGRAPHS VOLUME 69
appear to be similar to those of the PCDDs (Van den Berg et al., 1994). Exceptions areseen with 2,3,7,8-TCDF and 1,2,3,7,8-PeCDF, for which elimination in rodents is muchfaster than for the other 2,3,7,8-substituted PCDFs. This rapid elimination can be directlyattributed to the higher susceptibility of the C-4 position to metabolic attack in thedibenzofuran molecule. The presence of a chlorine atom on the C-4 position dramaticallydecreases the rate of elimination (Birnbaum et aL., 1981; Brewster & Birnbaum, 1988;Brewster et aL., 1988; Van den Berg et aL., 1989a,b; Ahlborg et aL., 1990). As a result, thehalf-life in the liver of the rat increases from several days for 1,2,3,7,8-PeCDF to morethan 100 days for 2,3,4,7,8-PeCDF (Brewster & Birnbaum, 1988; Van den Berg et aL.,1989b). This importance of chlorine substitution on the 4/6 position is also seen in theshort half-life of 1,2,3,7,8,9-HxCDF of less than 10 days in rats, compared with those of2,3,4,6,7,8-HxCDF, 1,2,3,6,7,8-HxCDF and 1,2,3,4,7,8-HxCDF (Ahlborg et aL., 1990).Guinea-pigs eliminate 2,3,7,8-TCDF less efficiently than mice, the half-life in guinea-pigs being 20 days, compared with 4 days in DBN2J mice and just 2 days in C57BL/6Jmice (Decad et aL., 1981a,b; loannou et aL., 1983). The fact that the acute toxicities of2,3,7,8- TCDD and - TCDF in the guinea-pig are in the same range has been attributed tothe limited ability of this species to metabolize and eliminate the latter congener (Vanden Berg et aL., 1994).
As in rodents, the elimination rates of 2,3,7,8-TCDF and 1,2,3,7,8-PeCDF in primatesare faster than those of the other 2,3,7,8-substituted congeners. The half-lives for bothcompounds in rhesus monkeys and marosets have been estimated to be approximatelyone week or less (Birbaum et aL., 1981; Neubert et aL., 1990a,b). As for PCDDs, theelimination of PCDFs from most body comparments can be described as a one-comparment open model, but models with two- or three-phase eliminations for 2,3,7,8-TCDF in rodents and monkeys have been reported. ln view of the non-linear distrbutionof PCDDs in many experimental systems, the use of physiologically based pharaco-kinetic models has been successfully applied (Carer et aL., 1995a,b).
4.2 Toxic effects
4.2.1 Humans
The results in this section are not lipid-based.
(The W orking Group noted that in the yusho and yucheng incidents, exposures wereto PCDFs and planar and non-planar PCBs and that one cannot unequivocally attributethe effects to one class of chemicals or the other.)
(a) Non-cancer effects ofingestion ofrice oi! contaminated with polychlori-nated dibenzofurans, quaterphenyls and biphenyls in Japan (yusho) andTaiwan (yucheng)
ln both groups, the most notable acute effects were dermatological and neurologie alsigns and symptoms of fatigue, headaches and gastrointestinal distress (nausea, vomiting,abdominal pain) (Kuratsune, 1989; Rogan, 1989).
POL YCHLORIA TED DIBENZOFURANS 409
Yusho
The initial recognition of yusho occurred in 1968. About 2000 individuals were iden-tified as par of the yusho population (Masuda et aL., 1985). Tissue concentrations of
PCDFs in these people are given in Table 18.Effects observed shortly after exposure included elevated triglyceride levels and
effects on female reproductive hormones manifest as changes in menstrual and basalbody temperature patterns and lowered excretion of oestrogens and pregnanediol inexposed women (Kuratsune, 1989). However, fertility and other measures of repro-ductive function were not evaluated. Evidence of chronic bronchitis and respiratoryinfections stil remained 14 years after eXPOSUre ended (Nakanishi et al., 1985).
However, more than 10 years after exposure, PCB levels were not related to serum levelsof triiodothyronine, thyroxine and thyroxine-binding globulin (Murai et al., 1987).Although the liver is the suspected target organ for halogenated hydrocarbons andmarked proliferation of the endoplasmic reticulum was observed in that organ, clinicalevidence of liver damage, such as alterations in liver enzymes or liver disease, was notobserved (Kuratsune, 1989).
Dermatological effects were the most evident signs, characterized by hyperpigmen-tation of the nails, gingivae and face and by nail deformties, horny plugs, comedones,acneform eruptions, cysts and other abnormal keratotic changes. Acneform eruptionswere observed on the face, cheeks, auricles, retroauricular areas, inguinal regions andextemal genitalia (Urabe & Asahi, 1985). More than 80% of yusho cases experiencedone or more dermatological effects (Kuratsune, 1989), which diminished in severity overtime (Urabe & Asahi, 1985).
Ophthalmological effects were characterized by swellng and hypersecretion of.the
meibomian glands and pigmentar changes of the conjunctiva (Kuratsune et al., 1972).More than 80% of yusho cases exhibited ocular changes, which, in sorne cases, appearedto persist 15 years after exposure ended (Kuratsune, 1989).
Thi per cent of the cases reported having at least one symptom consistent withneurological involvement, such as limb paraesthesia and spasms, weakess, headachesand fatigue (Kuratsune, 1972). As summarzed by Kuratsune (1989), Kuriowa et aL.(1969) found mostly sensory deficits, identified through slowed nerve conduction velo-cities in 23 cases. FolIow-up of these cases indicated that the neurological symptomsdisappeared over time; however, conduction velocity measurements were not repeated.
A number of studies examned the immune status of yusho cases (Kuratsune, 1989).Significant decreases in mean IgA and IgM and increases in IgG were noted in 28 casestested in 1970 (p.( 0.05). Within two years, means levels of all three immunoglobulinsreturned to normal. Small increases in the percentage of CD4 + cells, small decreases inthe percentage of CD8+ cells and enhanced lymphocyte stimulation were also noted inyusho cases (Nakanshi et aL., 1985).
Mortity in the yusho population was assessed among 1761 patients registered by theend of 1983. Among 887 men and 874 women, there were 79 and 41 deaths, respectively(Masuda, 1994). Mortality from chronic liver disease and cirhosis was elevated in menonly (6 deaths; SMR, 2.7).
410 IARC MONOGRAPHS VOLUME 69
Studies of offspring of yusho cases have been limited to descriptions of effects onnewborns exposed in utero. An early description of 13 children bom to exposed mothersnoted two stilbom infants, one of whom was diffusely and deeply hyperpigmented
(Rogan, 1982). Neonates described in other reports were darkly pigmented and hadmarked secretions of the conjunctival palpebra, gingival hyperplasia, hyperkeratosis,calcification of the skull, low birh weight and natal teeth (Yamashita & Hayashi, 1985).The abnormal pigmentation disappeared after 2-5 months. No other physical abnorma-lities (neurological, cardiovascular or malformations) were identified.
Yucheng
The initial recognition of yu cheng occurred'in 1979. As of 1983, approximately 2000individuals were found to have been exposed to the contaminated rice oil. Serumconcentrations of PCDFs in these people are given in Table 19.
The ophthalmological and dermatological changes observed in yucheng cases werevery similar in character and anatomie al distrbution to those noted in yusho cases (Lü &Wu, 1985). ln 89 cases followed for up to 17 months, dermatological conditions of 38%of the cases improved, 54% remained the same and 7% showed deterioration of theircondition (Lü & Wong, 1984).
Like yusho cases, yucheng cases examined within two years of exposure for nervefunction exhibited slowing of sensory nerve conduction. They also exhbited motor nerveslowing and mixed deficits (Chen et al., 1981, 1983; Chia & Chu, 1984; Chen et al.,1985a~f a population of 27 individuals, 20% also had abnormal electroencephalo-grams (EEGs) (Chia & Chu, 1984). However, the authors suggested that any correlationbetween PCB exposure and the abnormal EEGs might be spurious due to low PCB levelsin the cerebrospinal fluid (0.5-2.3 ¡.g/kg, measured in four subjects), despite muchhigher blood PCB levels of 48-6 ¡.g/kg. A sample of 28 individuals with peripheralneuropathy in 1980 was re-examined in 1982 and was found to have normal EEGs andsorne reCovery of sensory and motor nerve conduction velocity (Chia & Chu, 1985).
ln 1981, immunological function was assessed on several subsets of yucheng casesand summarized by Lü and Wong (1984). ln 30 cases compared with unexposedcontrols, both IgA and IgM were significantly decreased, while IgG did not differ fromcontrols. ln this same group, percentages of active T cells and T cells (E-rosette lym-phocytes) were significantly decreased (p -c 0.05), while total lymphocyte count andpercentage of B cells were unchanged. Significant decreases in helper T cells (T4) butnot suppressor T cells (T8) were also observed. ln another group of cases, response tolymphocyte-stimulating mitogens was mixed and the findings were unclear. ln 143 cases,reaction to streptococci antigen appeared to be significantly (p .: 0.05) depressed relativeto controls.
Alterations inporphyrin levels and liver enzymes have been identified as acutereactions to exposure to halogenated polycyclic hydrocarbons, including PCBs.
Porphyrin levels were measured in two exposed groups (Chang et al., 1980; Gladenet aL., 1988). ln 1980, statistically significant elevations in 24-h urinar excretion of uro-porphyrin (exposed, 41.23 J.g :! 24.56; unexposed, 13.57 J.g :! 11.76; p -c 0.01) and
POL YCHLORIA TED DIBENZOFURANS 411
a-aminolaevulinic acid (exposed, 1.002 mg :i 0.600; unexposed, 0.715 mg :1 0.337;,p.: 0.05) were noted among 69 poisoned and 20 normal subjects (Chang et al., 1980).Coproporphyrin and porphobilnogen levels were increased (but not significantly) in theexposed group. The second study group was composed of 75 children born between June1978 and March 1985 to mothers who ingested contaminated rice oil (Gladen et al.,1988). Spot urines were collected in 1985. Mean total porphyrin (exposed, 95.2 Ilg/L;unexposed, 80.7 Ilg/L) and coproporphyrin (exposed, 72.4 Ilg/L; unexposed, 59.8 Ilg/L)excretion was elevated in the exposed, possibly due to extremely high levels()- 200 Ilg/L) in eight exposed children and two controls (Rogan et al., 1988). However,no porphyria cutanea tarda, a severe form of porphyria, was observed in either group ofchildren. Moderate, but statistically significant, increases were observed in aspartatetransaminase and alanine transaminase levels in 23 cases tested one year after exposure(Lü & Wong, 1984). Lactate dehydrogenase and bilirubin levels were not significantlyelevated. As in yusho cases, triglyceride levels were significantly increased to approxi-mately twice the level in unexposed controls.
Effects observed in offspring of yucheng cases are described in Section 4.4.1.
4.2.2 Experimental studies
(a) Species comparisons oftoxic effects
(i) General effects
Thireen-week dietar studies of Sprague-Dawley rats given 1,2,3,4,8-PeCDF,
1,2,3,7,8-PeCDF, 2,3,4,7,8-PeCDF or 1,2,3,6,7,8-HxCDF revealed that both toxicity,including body weight loss and thymic atrophy, and depletion of hepatic vitamIn Afollowed the ran order of the compounds to bind to the Ah receptor and to induceCYPIA activity (Plüss et aL., 1988a,b; Håkansson et aL., 1990). When these PCDFs wereadministered as a mixture, it was observed that the individual PCDF toxicity was addi-tive (Plüss et aL., 1988b). Toxicity of 1,2,3,7,8-PeCDF was significantly lower than thatof 2,3,4,7,8-PeCDF and this was attrbuted to rapid detoxification by biotransformation(see Section 4.1.2(c)) (Brewster & Bimbaum, 1988; Plüss et aL., 1988a).
ln male Sprague-Dawley rats fed 10 mg 2,3,7,8-TCDF per kg of diet, thymus, ventralprostate and seminal vesicle weights were significantly decreased (Oishi et aL., 1978),and haemoglobin and haematocrit values were reduced.
Guinea-pigs given a single oral dose of 1-15 Ilg/kg 2,3,7,8-TCDF or 2,3,4,7,8-PeCDFshowed a reduction in body weight gain. All animaIs that received 10 Ilglg or 15 Ilg/kg2,3,7,8-TCDF or 2,3,4,7,8-PeCDF died 9-20 days afer dosing. ln mIce, 22 daily oraldoses of 30-300 Ilg/kg bw/day 2,3,7,8-TCDF did not induce clinical signs of toxicity(Moore et aL., 1979). ln contrast with other rodents, 2,3,7,8-TCDF was highly toxic toguinea-pigs, the acute toxicity being similar to that of 2,3,7,8-TCDD in this species(Ioanou et aL., 1983; Moore et aL., 1979). The high sensitivity of the guinea-pig wasattbuted to the low biotransformation rate in this species (see Section 4.1.2(b))
(Van den Berg et al., 1994).A single dose of 1500 Ilg/kg 2,3,7,8-TCDF was lethal to 2/2 rhesus monkeys (Moore
et aL., 1979). Those animals which sUlived a dose of 1000 Ilg/kg (2/4) developed facial
412 IARC MONOGRAHS VOLUME 69
oedema and loss of eyelashes, fingernails and toenails. Most animaIs accumulated awhite, wax-like exudate in the ear canal and showed a dr, leathery texture of the skin.Blood analysis 28 days after dosing revealed mild anaemia, relative lymphopenia andmarked relative and absolute neutrophilia. Serum cholesterol was decreased by 33-50%.Major microscopie les ions were hyperkeratosis of the epiderms, squamous metaplasia ofthe meibomian and ceruminous glands (eyelid and ear canal, respectively) and a dila-tation of hair follicles filIed with keratinaceous debris in the facial area. The thymusshowed extensive reduction of the cortex and necrotic debris in the medulla. Further-more, the bile duct mucosa was found to be extremely hyperplastic with cystic dilatationand inflammation. Mild skin lesions were also found in the two rhesus monkeys that hadreceived 500 llg/kg.
Packed blood cell volume and serum triglyceride and bile acid concentrations weresignificantly increased in rhesus monkeys after a single intravenous dose of 34 llg/kg2,3,4,7,8-PeCDF (Brewster et al., 1988). Serum cholesterol, protein, albumin, triiodo-thyronine and thyroxine concentrations were decreased. After 28-58 days, the animaIsexhibited alopecia, hyperkeratinization of the toe- and finger-nails, facial chloracne-likelesions and loss of body weight. Two out of three animaIs subsequently died. Patho-
logical findings indicated hyperplastic and metaplastic changes in the gastric mucosa, the 'meibomian glands of the eyelid and the ceruminous glands of the ear.
ln cynomolgus monkeys (Macaca fascícularis), PCB mixtures similar to thoseingested by yusho patients but without PCDFs caused immunosuppression and enlarge-ment and histopathological changes of the liver (interstitial inflammation, proliferation ofbile-duct epithelial celIs). Treatment with a PCDF-containing PCB mixture, however, ledto more pronounced decreases in body weight, immunosuppression, fatty liver and histo-pathological changes. ln addition, the PCDF-containing mixture caused hair loss,acneform skin eruptions, oedema of the eyelid, congestions and abscesses of the meibo-mian gland and cornification of the skin (Hori et aL., 1982).
(ii) Skin
ln haired and hairless newborn and adult mice, dermal application of 2,3,4,7,8-PeCDFor 1,2,3,4,7,8-HxCDF caused involution of sebaceous glands (Puhve1 & Sakamoto,1988). Epidermal hyperplasia and hyperkeratinization, however, were induced in thehairless mice only. The density of inflammatory cell infltrates in the derms was notreduced by topical treatment with anti-inflammatory agents. The distinct pattern ofchloracne observable in hairless mice (Puhvel et al., 1982) did not include hyper-
keratinization of the sebaceous follcles typical of human chloracne. Histopathologicalchanges observed with all acnegenic compounds were epidermal hyperkeratosis andhyperplasia, loss of sebaceous glands, keratinization of intradermal pilar cysts anddiffuse lymphohistiocytic infltration of the derms. Atrophy or complete absence of thehair follicles were evident in severe lesions (Hébert et aL., 1990a). ln these cases, the epi-derms was hypoplastic with increased keratin on the sudace. The data for dermal toxi-city and changes in body weight and organ weights indicated that 2,3,4,7,8-PeCDF was0.2-0.4 times, and 1,2,3,4,7,8- HxCDF 0.08-0.16 times, as toxic as 2,3,7,8-TCDDfollowing repeated dermal exposure.
POL YCHLORINATED DIBENZOFURAS 413
The abilty of several PCDFs to induce a flat, cobblestone-like morphology in cellcultures was studied in a nonkeratinizing derivative (XBF) of the keratinizing XB mouseepithelial cell line cocultured with irradiated 3T3 feeder cells. The minimum concen-trations required to produce these changes from the normal spindle-shape cells, over a14-day exposure period, were ~ 2.38 llglkg for 2,6-DCDF, 0.032 ¡.glkg for 2,3,7,8-TCDF, 0.378 llglkg for 2,3,4,6,7,8-HxCDF and 4.48 ¡.glkg for OCDP (Gierthy & Crane,1985).
Osborne and Greenlee (1985) reported that 2,3,7,8-TCDF decreased DNA synthesis,proliferation and epidermal growth factor (EGF) binding, and induced differentiation inseverallines of human keratinocytes.
(iii) Liver
While no histopathological signs of liver damage were observed in guinea-pigstreated with 15 llglkg 2,3,7,8- TCDF or 20 llglkg 2,3,4,7,8-PeCDF, Sprague-Dawley ratsshowed liver cell vacuolization, necrosis of single hepatocytes and Kupffer cell hypo-plasia after treatment with 1,2,3,6,7,8-HxCDF (200 llglkg in the diet). These alterationswere less pronounced with 1,2,3,7,8-PeCDF (200 llglkg in the diet) and 1,2,3,6,7,8-HxCDF (20 ¡.glkg in the diet). No liver lesions were observed after administration of1,2,3,4,8-PeCDF (6000 ¡.glkg in diet) (Plüss et aL., 1988a).
C57BL/6fh(J67) mice receiving 22 daily oral doses of 300 ¡.glkg 2,3,7,8-TCDF
showed a 17% increase in liver weight and a 25% increase in liver/body weight ratio;fluorescence indicative of porphyria was not observed. Guindi-pigs receiving single oraldoses of up to 15 ¡.g/kg 2,3,7,8-TCDF did not deve10p liver pathology. ln rhesusmonkeys, single oral doses of 2,3,7,8-TCDF up to 1500 llg/kg resulted in inconsistentlyincreased liver weight but no histopathological liver lesion (Moore et aL., 1979).
Brewster et aL. (1988) did not report histopathological liver changes except for depositsof haemosiderin in Kupffer cells after administration of a single intravenous dose of 34llglkg 2,3,4,7,8-PeCDF to rhesus monkeys.
(b) Immunological responses
Only five out of 135 PCDF congeners have been studied for their effects on themammalian immune system (Holsapple, 1995).
Kerkvliet et al. (1985) studied the humoral immunosuppressive effect of a single oraldose of 1,2,3,4,6,7,8-HpCDF in C57BL/6 mice, two days before sheep red blood cell(SRBC) challenge. Splenic IgM antibody response was measured five days later ('HAIR-assay'). The 50% immunosuppressive dose (IDso) was ca1culated as 208 ¡.glkg, while theIDso for 1,2,3,4,5,6,7,8-HpCDD was 85 llg/kg. (For comparson, the IDso for 2,3,7,8-TCDD was 0.74 llglkg (Kerkvliet & Brauner, 1990)).
Davis and Safe (1991) compared the effects of a series of congeners with respect totheir suppression of the In-vitro plaque-formng anti-SRBC response using cells froIDeither C57BL/6 or DBN2 mice. The immunosuppressive potencies of 2,3,4,7,8-PeCDF,2,3,7,8-TCDF, 1,2,3,7,9-PeCDF and 1,3,6,8-TCDF in this in-vitro assay were similar toeach other and to that of 2,3,7,8-TCDD, using spleen cell cultures from both mouse
414 IARC MONOGRAHS VOLUME 69
strains, although in vivo their immunotoxic potentials differ by up to 14900-fold inC57BL/6 mice (Davis & Safe, 1988).
Harer et al. (1993) studied the effects of a single intraperitoneal injection of 2,3,7,8-TCDD, 2,3,4,7,8-PeCDF, 1,2,3,7,9-PeCDF or 1,3,6,8-TCDF on the splenic plaque-formng cell (PFC) response to the T-cell-independent antigen TNP-LPS in C57BL/6 andDBA/2 mice. The effective doses (l1g/kg) required to decrease by 50% (EDso) the end-point 'PFCs/l06 viable cells' were:
Congener C57BL/6 DBN2Ilce Ilce
2,3,7,8-1lCDD 1.5 9.72,3,4,7,8-PeCDF 2.0 2.61,2,3,7,9-PeCDF 391 46901,3,6,8-1lCDF 1484 17 167
Similarly designed experiments were performed with B6C3Fl mice. The effectsinduced by the same four congeners after intraperitoneal injection were compared withthose observed after in-vitro exposure of mouse splenocytes. The EDso of the PFCresponse to 2,3,7,8- TCDD, 2,3,4,7,8-PeCDF and 1,2,3,7,8-PeCDF and 1,3,6,8-TCDFwas 14.1, 5.5, 1695 and 34800 nmol/g, respectively. Corresponding values derivedfrom in-vitro studies were 7.0, 10.6, 149 and 2325 nM, respectively (Harer et al., 1995).
Vecchi et aL. (1983) studied the suppressive effects of a single intraperitoneal injec-tion of 180 l1g/kg bw 2,3,7,8-TCDF on antibody production in C57BL/6 mice and inDBA/2 mice. A pronounced decrease in the number of PFC as a response to the injectionof SRBCs was observed in C57BL/6 mice only.
A single dose of 20 ng/kg 2,3,4,7,8-PeCDF had no effect on the proportions of sub-populations of lymphocytes in peripheral blood of marosets, studied by flow cyto-
metry. ln contrast, 10 l1g/kg bw 2,3,7,8-TCDD induced a decrease in the number ofCD20+ cells and the number of CD4+ CDW29+ cells (Neubert et aL., 1993b).
(c) Biochemical responses
There appear to have been few studies of the biochemIcal responses attributable toPCDF exposure, other than those on induction of CYPIAI and CYPIA2 expression (seeSection 4.3).
EGF receptor autophosphorylation was decreased in placenta after in-utero exposureto PCBs and PCDFs ingested from contamInated rice oil in the yucheng incident(Sunahara et aL., 1987). ln contras t, EGF receptor expression was increased in mouseembryonic palatal medial epithelial cells (Abbott & Birbaum, 1989b). Support for therole of the Ah receptor in mediating downregulation of the EGF receptor was supportedby structue-activity studies in mice (Ryan et aL., 1989b) and the differential responsive-ness of congenic mice differing only at the Ah locus (Lin et aL., 1991a).
POL YCHLORIA TED DIBENZOFUNS 415
4.3 Interaction with Ah receptor and its early molecular consequences and other
biochemical responses
Laterally substituted PCDF congeners bind to the Ah receptor and produce the samebiological and toxic effects as the PCDDs. Among these PCDFs, the congeners with the2,3,7,8-chlorine substitution pattern are the most potent ones (Poland & Knutson, 1982;Safe, 1990). The binding affinities of 2,3,7,8-TCDF, 1,2,3,7,8- and 2,3,4,7,8-PeCDFs tothe Ah receptor are of the same order of magnitude as that of 2,3,7,8-TCDD (see Section4.3 in the monograph on PCCDs in this volume). The Ah receptor binding affinity for thec1ass of congeners is dependent upon the extent and pattern of chlorination (Whitlock,1986; Okey, 1990; Safe, 1990).
ln general, induction of CYP 1A1 gene expression by PCDFs tends to follow the sameran order of potency as receptor binding in vitro. Like many planar aromatic substances,inc1uding 2,3,7,8-TCDD, the 2,3,7,8-substituted PCDFs also induce CYPIA2 and bindstrongly to this protein (Yoshimura et aL., 1984; Kuroki et al., 1986; Poland et al.,1989b). Ah receptor-regulated genes encoding phase-two metabolizing enzymes (e.g.,UDP-glucuronosyl transferase and DT diaphorase) are also induced following PCDFexposure, but information is limited (Safe, 1990; Van den Berg et al., 1994).
Although the binding of some 2,3,7,8-substituted PCDFs to the Ah receptor and asso-ciated CYP 1A1 induction in vitro is similar to that of 2,3,7,8- TCDD, the general toxicityof sorne of these congeners is significantly lower due to faster biotransformation inseveral rodent species. Ths is especially the case for 2,3,7,8-TCDF and 1,2,3,7,8-PeCDF(Van den Berg et aL., 1994).
Enzyme induction has been observed in both pre- and postnatally exposed rats; theendocrine implications ofthese effects are unclear (Waalkens-Berendsen et aL., 1996).
Numerous PCDF congeners have been shown to produce Ah receptor-mediatedresponses such as thymic atrophy, immunotoxicity and teratogenicity in many mamma-lian species (reviewed by Safe, 1990).
Like the 2,3,7,8-substituted PCDDs (see Section 4.3 in the monograph on PCDDs),PCDFs negatively modulate some 17ß-oestradiol-induced biological responses in certaintarget tissues. The above effects can be of the same order of magnitude as those producedby 2,3,7,8-TCDD (Safe et aL., 1991).
The binding of these compounds to the Ah receptor and associated biologie alresponses depend on the cell type, species, sex, age and assay used (Poland & Knutson,1982; Safe, 1986; Whtlock, 1986; Okey, 1990; Safe, 1990).
Four PCDFs have been shown to increase levels of both hepatic and urinar por-phyrins following subchronic exposure in mice, as observed with 2,3,7,8-TCDD and1,2,3,7,8-PeCDD (van Birgelen et al., 1996b).

416 IAICC MONOGRAPHS VOLUME 69
4.4 Reproductive and developmental effects
Fetal PCB syndrome, as described among babies in Japan born to mothers who consumed contaminated oil, is characterized at birth by brown pigmentation ('cola- coloured babies7) on the skin and the mucous membrane, gingival hyperplasia, very early postnatal eruption of the teeth or natal teeth, calcification of the skull and low birth weight (Yamashita & Nayashi, 1985). In addition, among yucheng babies born between 1979 and 1983, a high perinatal mortality rate was observed (eight of 39) (Hsu et al., 1985). Retrospective ascertainment of neonatal dermatological findings among 128 children exposed transplacentally and born in Taiwan between 1979 and 1985, indicated increased rates of hyperpigmentation, eyelid swelling and discharge, deformed nails, acne, natal teeth and swollen gums, compared with 115 control children (Rogan et al., 1988; Gladen et al., 1990). In neither Japan nor Taiwan was there a clear relationship between symptoms or fetopathy and PCB dose (Yu et al., 1991).
Many follow-up studies were initiated among yucheng children to assess metabolic impairment or anomalies in physical or cognitive development. In 1985, a cohort was constructed to incIude all children born between June 1978 and March 1985 who had been exposed prenatally. The exposed cohort consisted of 132 children, living in 1985, from 159 pregnancies occurring among 74 women (Rogan et al., 1988). In April 1985, 1 17 exposed children aged one month to six years (average, 32 months) and 108 control children (average age, 31 months) were examined. Exposed children were smaller (93% of control weight and 97% of control height) than controls of the same age and sex. Medical histories since birth indicated a higher rate of bronchitis among exposed children. Clinical examination showed a higher frequency of hyperpigmentation and nail deformities, differences in eyebrow flare, hypertelorisrn and clinodac tyly , and an increased prevalence of clinically detectable developmental delay (10% exposed versus 3% controls).
One hundred and fifteen exposed children from the original cohort and 135 highly matched controls were tested for cognitive development annually from 1985 through 1990. The exposed children scored approximately five points lower on age-appropriate tests of intelligence from the age of two to the age of seven. Children born later were as affected as children born shortly after the outbreak (Yu et a!., 1991; Chen et al., 1992; Lai et al., 1994).
A behavioural suntey was performed on the same groups (Chen ed al,, 1994). At each year of follow-up and at each age, exposed children scored higher on tests for hyperactivity and conduct disorders.
At school-age, there was evidence of higher prevalence of congenital lack of permanent teeth among some exposed yucheng children (five of 18) compared with controls (one of 44) matched for sex, age, father" occupation, family economic status and area of residence (Lan et al., 1989). [Selection of exposed children is not clearly described, and control children had a low participation rate of 61 %.]
POL YCHLORIATED DIBENZOFURANS 417
ln a series of 55 yu cheng children (out of 132 identified during the same period of1978-85) and 55 controls matched for age and sex, there was evidence in 1991 ofdecreased height and decreased muscular development (as indicated by total lean mass)among exposed children (Guo et al., 1994).
Seven to nine years after the poisoning, there was no difference in any immunologie alor haematological parameters investigated between 19 exposed children and 32 matchedcontrols (Lan et al., 1990).
ln an examnation conducted in 1993 of 104 exposed children, yucheng girls weresignificantly shorter (2.5 cm) than controls, and the penile length of yucheng boys, aged11-14 years, was shorter than that of controls. Neither effect was related to sexualdevelopment by the Tanner scale (Guo et al., 1993). ln a separate examination, 22% oftympanic membranes in 110 yucheng children were ab
normal vers us 17% of controls(p -c 0.01) (Chao & Hsu, 1994).
Analysis of physical and cognitive development began in October 1991 of 104children whose mothers were exposed and 109 children whose fathers but not motherswere exposed and of three matched controls bom after 1985 (Guo et al., 1993; Chen etaL., 1992). Like children born before 1985, the later-bom children were shorter in statureand lower in weight than controls, although the differences were no longer statisticallysignificant. Yucheng children were reported to have higher activity levels but no physicaltemperament, habit or other behavioural problems. Overall, scores on all tests amongpatemally exposed children were similar to those of the controls. However, maternallyexposed children scored lower on the Stanford-Binet IQ test Wechsler and on allsubscales of the Wechsler Intellgence Scale for Children. ln a follow-up study based ona random sample of the above children, the exposed children had significantly lowerverbal and full-scale IQs and auditory event related potentiaL. No neurophysiologicalchanges were observed, including pattern visual evoked potentials and short-latencysomatosensory evoked potentials.
ln summar, there is evidence that babies born after the yusho incident or after theyucheng incident (for which more data are available) present signs of intra-uterinegrowth retardation and congenital anomalies at birth. Sorne authors have proposed thatthese findings were consistent with a generalized disorder of ectodermal tissue (Roganet aL., 1988). Sunahara et aL. (1987) showed that yucheng babies with low birth-weighthad depressed autophosphorylation capacity of the EGF receptor in the placenta, inducedby exposure to PCBs and PCDFs during gestation. There is evidence of deficits on cogni-tive development scores among yucheng children up to seven years of age.
4.4.2 Experimental systems
PCDFs are teratogenic in mice, causing the same spectrum of birth defects anddevelopmental toxicity as 2,3,7,8-TCDD (Birbaum, 1991). Whether administered orallyto the dam as a single dose during the middle of organogenesis or in divided doses ongestation days 10-13, 2,3,7,8-TCDF, 1,2,3,7,8-PeCDF, 2,3,4,7,8-PeCDF and 1,2,3,4,7,8-HxCDF cause cleft palate and hydronephrosis at doses which are not matemally orfetally toxic (Weber & Bimbaum, 1985; Birbaum et aL., 1987a,b). The dose-response
418 IARC MONOGRAPHS VOLUME 69
curves for these four PCDFs are parallel to each other and to that of 2,3,7,8-TCDD. The ED, values and the rerative potency values for induction of cleft palate are as follows: 2,3,7,8-TCDD 3.4 pgkg, 1.0; 2,3,7,8-TCDF 70.1 pglkg, 0.05; 1,2,3,7,8-PeCDF 132.9 figkg, 0.025; 2,3,4,7,8-PeCDF 35.9 pglkg, 0.1; and 1,2,3,4,7,8-HxCDF 344.8 figkg, 0.01. The ED, for hydronephrosis was about five times lower than that fur cleft palate. Mixtures of these chemicals demonstrate strict additivity for induction of cleft palate.
Prenatal exposure of mice to 2,3,4,7,8-PeCDF results in haemorrhage of embryonic blood into the maternal circulation because of rupture of the embryo-maternal vascular barrier (Khera, 1992). Exposure of pregnant rats on gestation day 1 to 43 ~ V k g (15 pg/kg) 2,3,4,7,8-PeCDF resulted in a decrease in sperm count in the male offspring and a delay or lack of vaginal opening in the femdes (Waalkens-Berensen et a!., 1996).
Oral treatment of adult mice with 100 pg/kg 2,3,4,7,8-PeCDF five times over a 16- week period led to an increase in the growth of surgically induced endometriosis (Johnson ef aim, 1996).
4.5 Genetic and related effects (see also Appendix 3 and Table 27)
Peripheral lymphocytes from 35 Taiwanese women exposed in the yucheng incident (Lundgren et ak., 1988) that occurred in 1979 and those from 24 matched controls were assessed for the Ievels of sister chromatid exchange in the presence or absence of a- naphthoflavone and for chromosomal aberrations in 1985. Serum levels of PCBs were measured for 32 individuals and those of PCDFs were measused for only 12 exposed women. Blood concentrations of total PCBs in the exposed population and in controls averaged approximately 15 and 0.34 pg/kg, respectively. PCDFs detected were primarily 1,2,3,4,7,8-HxCDF .(10.8 ngkg) and 2,3,4,7,8-PeCDE (2.7 ngkg). Sister chromatid exchange frequencies in the absence of a-naphthoflavone and chromosomal aberrations were similar in control and exposed populations. Differences in the level of a-naphtho- flavone-induced sister chromatid exchange between the two groups were highly signi- ficant. These findings indicate that exposure to PCBs or PCDFs in vivo resdts in an enhanced sensitivity of lymphocytes to the sister chromatid exchange-inducing effects of a-naphthoflavone.
Placentas from nonsmoking Taiwanese women (38-35 years of age) from the yucheng cohort were obtained in 1983 and 1984. The formation of DNA adducts in pla- cental DNA was investigated using 32~-postlabelling, but none was detected (Gallagher ef al., 1994).
4.5.2 Experimental systems (see TabIe 27)
3-Chlorodibenmfuran induced reverse mutation in Salplaonella typhimurium. Elevated frequencies of sister chromatid exchange and micronucleus formation were induced by 2,3,4,7,8-PeCDF in human lymphocytes in vitro in the presence or absence of a-naphtho fl avone .
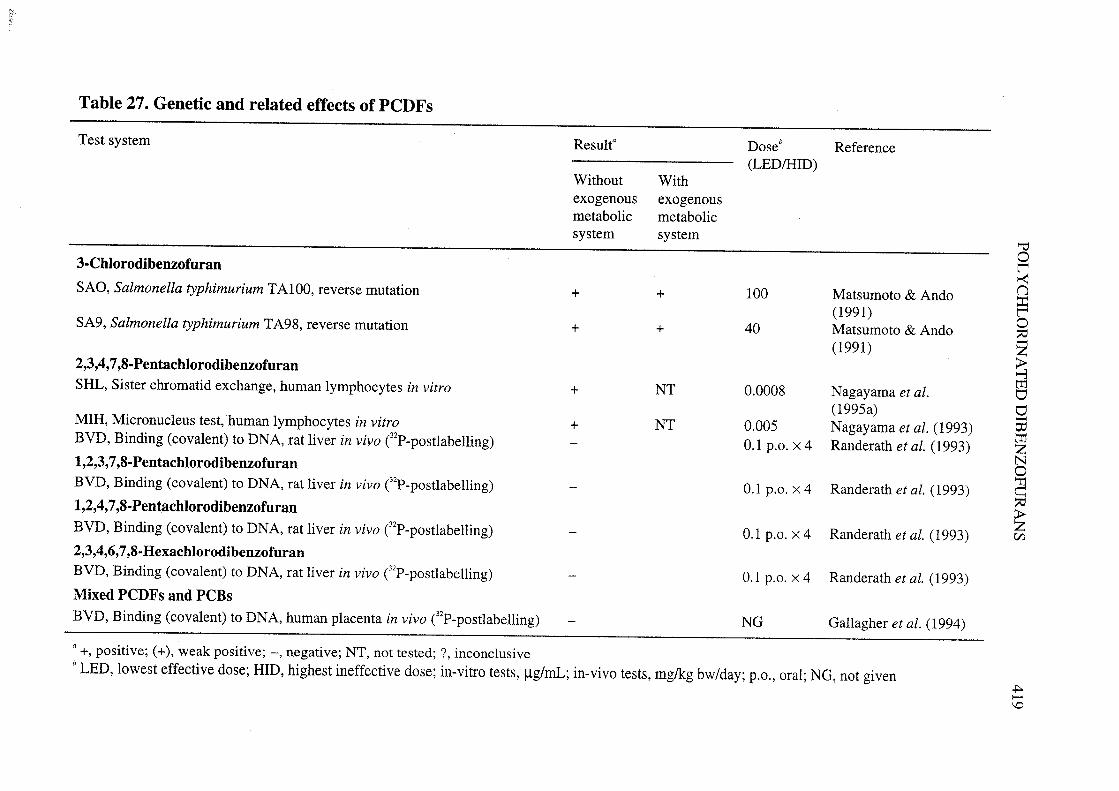
Table 27. Genetic and related effects of PCDFs
Test system Resulta Doseb Reference(LED/HID)
Without Withexogenous exogenousmetabolic metabolicsystem system
""03-Chlorodibenzofuran l'~SAü, Salmonella typhimurium TA100, reverse mutation + + 100 Matsumoto & Ando np( 1 99 1 ) 0SA9, Salmonella typhimurium TA98, reverse mutation + + 40 Matsumoto & Ando
2(1991)2,3,4,7,8- Pentachlorodibenzofuran ~
;1SHL, Sister chromatid exchange, human lymphocytes in vitro + NT 0.0008 Nagayama et al. ti(1995a) ti"'MIH, Micronucleus test, human lymphocytes in vitro + NT 0.005 Nagayama et al. (1993) ti
BVD, Binding (covalent) to DNA, rat liver in vivo C2P-postlabellng) 0.1 p.o. x 4 Randerath et aL. (1993) tr-Z
1,2,3,7,8- Pentachlorodibenzofuran N0BVD, Binding (covalent) to DNA, rat Hver in vivo C2P-postlabellng) - 0.1 p.o. x 4 Randerath et al. (1993) ~1,2,4,7,8- Pentachlorodibenzofuran
~BVD, Binding (covalent) to DNA, rat liver in vivo C2p-postlabelling) - 0.1 p.o. x 4 Randerath et aL. (1993) C/2,3,4,6,7,8- HexachlorodibenzofuranBVD, Binding (covalent) to DNA, rat Ii ver in vivo C2p-postlabellng) - 0.1 p.o. x 4 Randerath et aL. (1993)Mixed PCDFs and PCBsBVD, Binding (covalent) to DNA, human placenta in vivo C2p-postlabellng) - NG Gallagher et al. (1994)
a +, positive; (+), weak positive; -, negative; NT, not tested; ?, inconc1usivebLED, lowest effective dose; HID, highest ineffective dose; in-vitro tests, llg/mL; in-vivo tests, mg/kg bw/day; p.o., oral; NO, not given
.t..\0
420 IARC MONOGRAPHS VOLUME 69
Changes in DNA I (indigenous)-compound formation were studied in female Sprague-DawZey rats treated by gastric instillation with 2,2,3,7,8-PeCDF, 1,2,4,7,8- PeCDF, 2,3,4,7,8-PeCDF or 2,3,4,6,7,8-&CDF (100 p g k g bw in corn oil per week for four weeks). No test compound-DNA adducts were detected, but there were significant, structure-dependent reductions in hepatic I-compound formation. Potencies increased in the order: control (100%, 122 modifications in 10' DNA nucleotides) = 1,2,4,7,8-MDF (104%) < 1,2,3,7,8-PeCDF (80%) < 2,3,4,7,8-PeCDF (61%) = 2,3,4,6,7,8-HxCDE These activities parallel the reported Ah receptor-binding activities (Randmath et al., 1993).
5. Summary of Data Reported and Evaluation
5.2 Exposure data
Polychlorinated dibenzofurans (PCDFs) are formed as inadvertent by-products in the production and use of polychlorinated biphenyls (PCBs) and, in combination with poly- chlorinated dibenzo-para-dioxins (PCDDs), in the production of chlorophenals and have been detected as contaminants in these products. PCDFs and PCDDs also may be produced in them1 processes such as incineration and metal processing and in the bleaching of paper pulp with free chlorine. PCDFs are also found in residual waste from the production of vinyl chloride and the chluralkali process for chlorine production. The relative amounts of PCDF and PCDD congeners produced depend on the production or incineration process and vary widely.
Like PCDDs, PCBFs ace ubiquitous in soil, sediments and air. Excluding occupa- tional or accidental exposures, most background human exposure to PCDFs occurs as a result of eating meat, milk, eggs, fish and related products, as PCDFs are persistent in the environment and accumulate in animal fat. High exposures have occurred in relation to incidents in Japan (yusho) and Taiwan (yucheng) involving contamination of rice oil and in accidents involving electrical equipment containing PCBs. Occupational exposures also may occur in metal production and recycling, and in the production and use of chlorophenols and PCBs.
Based on limited data, the sum of the mean background Ievels of the penta- and hexa- chlorinated PCDF congeners c o m n l y found in human tissues is generally in the range of 10-100 ngkg fat, and the PCDF contribution to tissue international toxic equivalent (I-TEQ) vdues is typically of the same order of magnitude as that of the PCDDs. Since the mid-1980s, mean tissue Ievels of total PCDFs and PCDDs (measured as I-TEQ) in the general population have decreased by two- to We-fold. Five-fold higher tissue levels have been found in subpopulations consuming large amounts of PCDF-contami- nated fish. Accidental exposures to PCDFs have led to tissue levels one or more orders of magnitude higher than background levels.
POL YCHLORINA TED DIBENZOFURANS 421
5.2 Human carcinogenicity data
ln the yusho and yucheng incidents, each involving about 2000 cases, people wereexposed to sufficient PCBs and PCDFs to produce symptoms. Fatal
Ii ver disease is 2-3times more frequent than national rates in both cohorts. ln Japan, at 22 years of follow-up, there is a three-fold excess of liver cancer mortality in men, which was alreadydetectable and even higher at 15 years of follow-up. ln Taiwan, at 12 years of follow-up,'there is no excess of lIver cancer mortality. This difference does not appear to be theresult of study design, differences in diagnostic habits, exposure or age at exposure, butmay be related to differences in the time of follow-up.
5.3 Animal carcinogenicity data
There are no long-term carcinogenicity studies on PCDFs.2,3,7,8-Tetrachlorodibenzofuran (2,3,7,8-TCDF) treatment following a single dose of
N-methyl-N' -nitro-N-nitrosoguanidine (MNNG) resulted in an increased incidence ofmouse skin papilomas.
2,3,4,7,8-Pentachlorodibenzofuran (2,3,4,7,8-PeCDF) treatment following a single
dose of MNNG resulted in an increased incidence of mouse skin papilomas. 2,3,4,7,8-PeCDF treatment following four weeks' treatment with N-nitrosodiethylamine (NDEA)resulted in an increased incidence of hepatocellular carcinomas and hyperplastic nodulesin male rats. Treatment with the same compound after a single dose of NDEA increasedthe incidence of focal hepatic lesions in female rats.
1,2,3,4,7,8-Hexachlorodibenzofuran (1,2,3,4,7,8- HxCDF) treatment following asingle dose of MNNG resulted in an increased incidence of mouse skin papilomas.1,2,3,4,7,8-HxCDF treatment following four weeks' treatment with NDEA resulted in anincreased incidence of hepatocellular carcinomas and hyperplastic nodules in male rats.Treatment with the same compound after a single dose of NDEA increased the incidenceof focal hepatic lesions in female rats.
5.4 Other relevant data
Kinetics
The half-lives of PCDFs in humans are much longer than those in experimentalanmaIs.
ln most vertebrate species, the 2,3,7,8-substituted PCDPs are the congeners which arepreferentially retained in tissues. Oxidation by cytochrome P450 primarly occurs at the 4and 6 positions in the molecule and the presence of chlorine atoms at these positionsreduces metabolism more than substitution at the 1 and 9 positions. Consequently,chlorine substitution on these positions strongly hinders elimination. ln rodents, somePCDFs, e.g. 2,3,4,7,8-PeCDF, show an extremely high affinity for liver tissue, which hasbeen attributed to binding to the CYPIA2 protein. As Ah-receptor-mediated effects areprimarly caused by the parent compound, biotransformation should be considered as adetoxification process.
422 IARC MONOGRAPHS VOLUME 69
Toxic e8ects
In animal experiments, 2,3,7,8-substituted PCDfis exhibit the same pattern of toxicity as those documented for PCDBs.
Studies of adults in Japan (yusho) and Taiwan (yucheng) who ingested rice oil conta- minated with PCBs, PCDFs and other by-products of PCB thermal degradation have observed effects in multiple systems. h both situations the poisonings were characterized by chloracne, elevated Esiglyceride levels, abnormal neurological symptoms, ophthalmic changes and alterations in immune parameters. In yucheng, porphyrin levels were also elevated.
Biochemical respomes and mechanism of action
2,3,7,S-Substiuted PCDFs bind to the Ah receptor and, as documented for PCDDs, induce CYPIAI and CYPlA2 gene expression. Ah-receptor-binding affinities of 2,3,7,8- TCDF, 1,2,3,7,8- and 2,3,4,7,8-PeCDP are of the same order of magnitude as that obsewed for 2,3,7,8-TCDD, With increasing chlorination, receptor binding affinity decreases. The enzyme induction follows the same structure-activity relationship.
Reproductive and developmental effects
h the yucheng population, eight of 39 children exposed in latero died before birth. Surviving children showed signs of intra-uterine growth retardation and congenital ano- malies at birth, a deficit of cognitive development up to seven years of age, and defects in musculoskeIetal development and pigmentation.
Several PCDFs have been shown to be teratogenic in mice, causing cleft palate and h ydronephrosis. 2,3,4,7,8-PeCDF leads to persistent reproductive effects (reduced sperm count, structural alterations of the female genital tract) following prenatal exposure. It also promotes the growth of surgicdly induced endometriosis in mice. All .of these effects are also observed with 2,3,7,8-TCDD.
Genetic and related eflects
2,3,4,7,8-PeCDP increased the frequencies of sister chromatid exchange and micro- nucleus formation in human lymphocytes in vitro.
5.5 Evaluation'
There is inadequate evidence in humans for the carcinogenicity of polychlorinated dibenzofurans .
There is inadequate evidence in experimental animals for the carcinogenic it^ of 2,3,7,8-te~acMorodibemfiran.
There is limited evidence in experimental animals for the carcinogenicity of 2,3,4,7,8- pentachIorodibemfuran.
1 For definition of the italicized terms, see heamble, pp. 26-27.
POL YCHLORIA TED DIBENZOFURAS 423
There is limited evidence in experimental animaIs for the carcinogenicity of1,2,3,4,7,8-hexachlorodibenzofuran.
Overall evaluation
Polychlorinated dibenzofurans are not classifable as to their carcinogenicity to
humans (Group 3).