Embed Size (px)
Citation preview
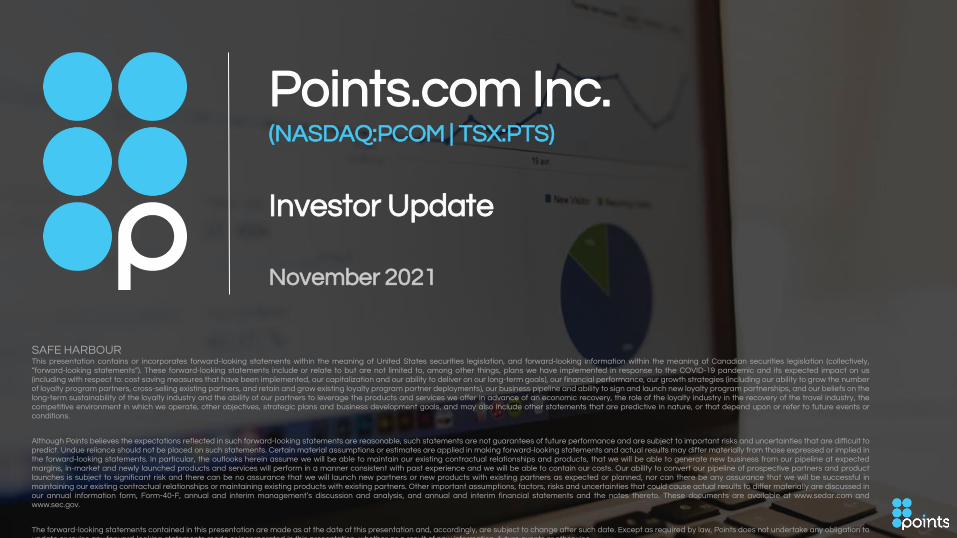
Points.com Inc.(NASDAQ:PCOM | TSX:PTS)
Investor Update
November 2021
SAFE HARBOURThis presentation contains or incorporates forward-looking statements within the meaning of United States securities legislation, and forward-looking information within the meaning of Canadian securities legislation (collectively,“forward-looking statements”). These forward-looking statements include or relate to but are not limited to, among other things, plans we have implemented in response to the COVID-19 pandemic and its expected impact on us(including with respect to: cost saving measures that have been implemented, our capitalization and our ability to deliver on our long-term goals), our financial performance, our growth strategies (including our ability to grow the numberof loyalty program partners, cross-selling existing partners, and retain and grow existing loyalty program partner deployments), our business pipeline and ability to sign and launch new loyalty program partnerships, and our beliefs on thelong-term sustainability of the loyalty industry and the ability of our partners to leverage the products and services we offer in advance of an economic recovery, the role of the loyalty industry in the recovery of the travel industry, thecompetitive environment in which we operate, other objectives, strategic plans and business development goals, and may also include other statements that are predictive in nature, or that depend upon or refer to future events orconditions.
Although Points believes the expectations reflected in such forward-looking statements are reasonable, such statements are not guarantees of future performance and are subject to important risks and uncertainties that are difficult topredict. Undue reliance should not be placed on such statements. Certain material assumptions or estimates are applied in making forward-looking statements and actual results may differ materially from those expressed or implied inthe forward-looking statements. In particular, the outlooks herein assume we will be able to maintain our existing contractual relationships and products, that we will be able to generate new business from our pipeline at expectedmargins, in-market and newly launched products and services will perform in a manner consistent with past experience and we will be able to contain our costs. Our ability to convert our pipeline of prospective partners and productlaunches is subject to significant risk and there can be no assurance that we will launch new partners or new products with existing partners as expected or planned, nor can there be any assurance that we will be successful inmaintaining our existing contractual relationships or maintaining existing products with existing partners. Other important assumptions, factors, risks and uncertainties that could cause actual results to differ materially are discussed inour annual information form, Form-40-F, annual and interim management’s discussion and analysis, and annual and interim financial statements and the notes thereto. These documents are available at www.sedar.com andwww.sec.gov.
The forward-looking statements contained in this presentation are made as at the date of this presentation and, accordingly, are subject to change after such date. Except as required by law, Points does not undertake any obligation toupdate or revise any forward-looking statements made or incorporated in this presentation, whether as a result of new information, future events or otherwise.
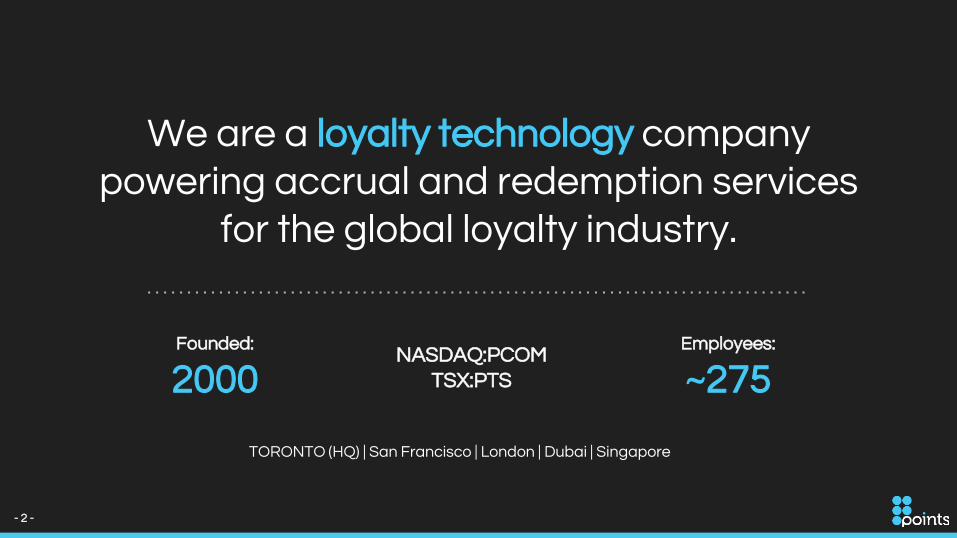
We are a loyalty technology company powering accrual and redemption services
for the global loyalty industry.
Employees:
~275NASDAQ:PCOM
TSX:PTS
- 2 -
Founded:
2000
TORONTO (HQ) | San Francisco | London | Dubai | Singapore
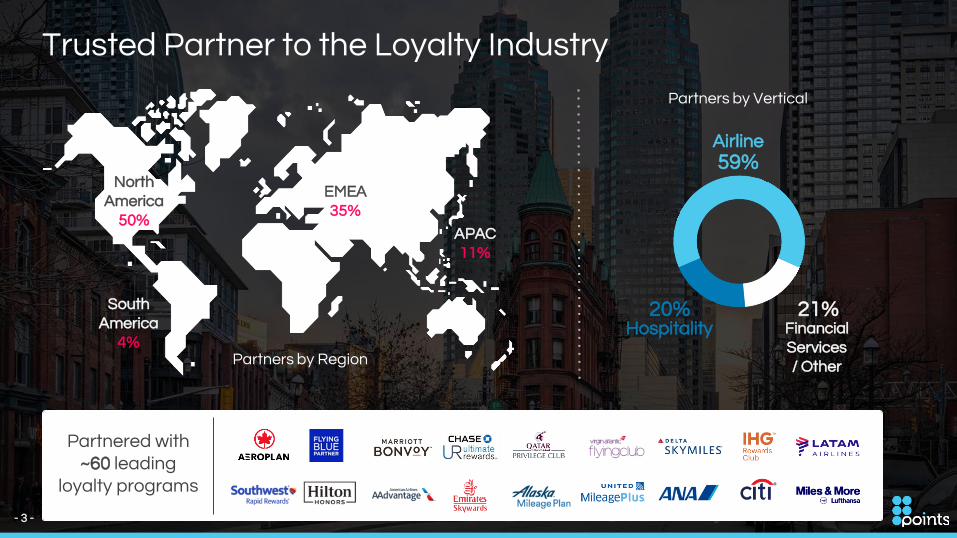
Trusted Partner to the Loyalty Industry
EMEA35%
APAC11%
North America
50%
South America
4%Partners by Region
Partners by Vertical
Partnered with ~60 leading
loyalty programs
Airline
Hospitality Financial Services / Other
59%
20% 21%
- 3 -
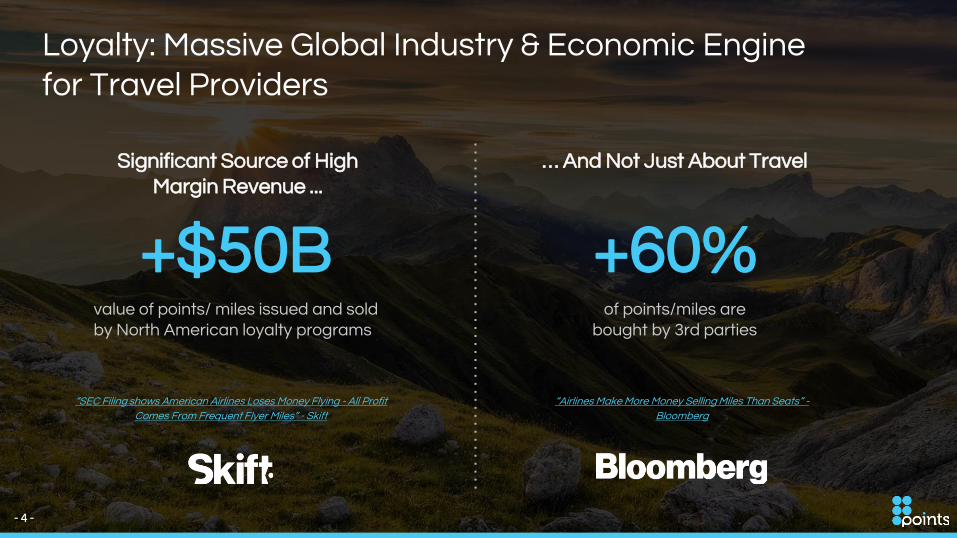
Loyalty: Massive Global Industry & Economic Engine for Travel Providers
value of points/ miles issued and sold by North American loyalty programs
+$50B
… And Not Just About Travel
“SEC Filing shows American Airlines Loses Money Flying - All Profit
Comes From Frequent Flyer Miles” - Skift
of points/miles are bought by 3rd parties
+60%
Significant Source of High Margin Revenue ...
“Airlines Make More Money Selling Miles Than Seats” -
Bloomberg
- 4 -
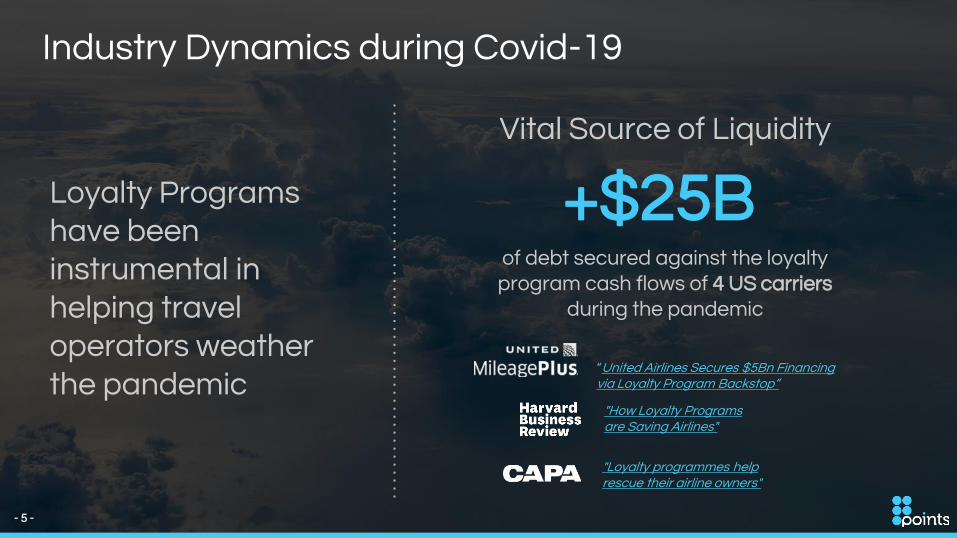
Industry Dynamics during Covid-19
of debt secured against the loyalty program cash flows of 4 US carriers
during the pandemic
+$25B
"Loyalty programmes help rescue their airline owners"
"How Loyalty Programs are Saving Airlines"
Loyalty Programs have been instrumental in helping travel operators weather the pandemic
Vital Source of Liquidity
“United Airlines Secures $5Bn Financing via Loyalty Program Backstop”
- 5 -
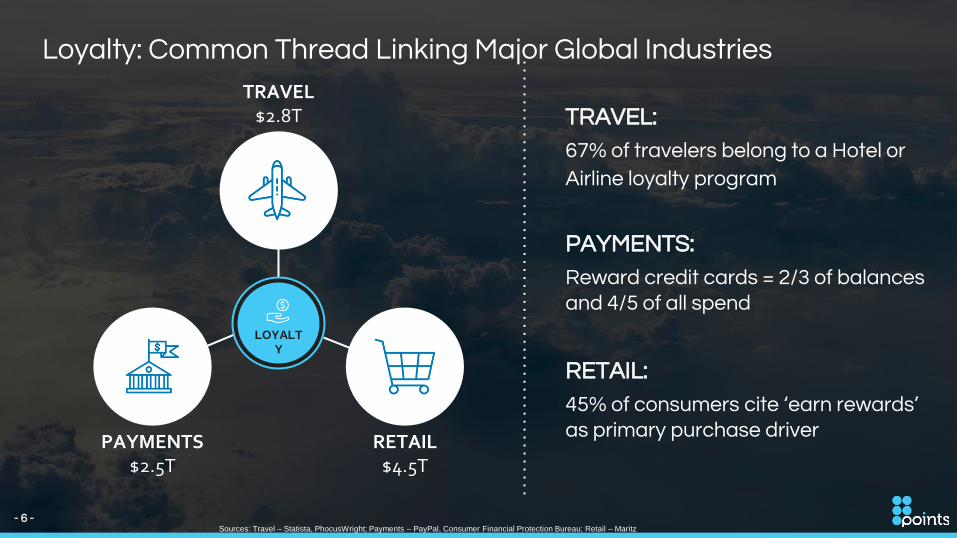
Loyalty: Common Thread Linking Major Global Industries
PAYMENTS$2.5T
TRAVEL$2.8T
RETAIL$4.5T
TRAVEL:
67% of travelers belong to a Hotel or
Airline loyalty program
PAYMENTS:
Reward credit cards = 2/3 of balances and 4/5 of all spend
RETAIL:
45% of consumers cite ‘earn rewards’ as primary purchase driver
LOYALT
Y
- 6 -Sources: Travel – Statista, PhocusWright; Payments – PayPal, Consumer Financial Protection Bureau; Retail – Maritz
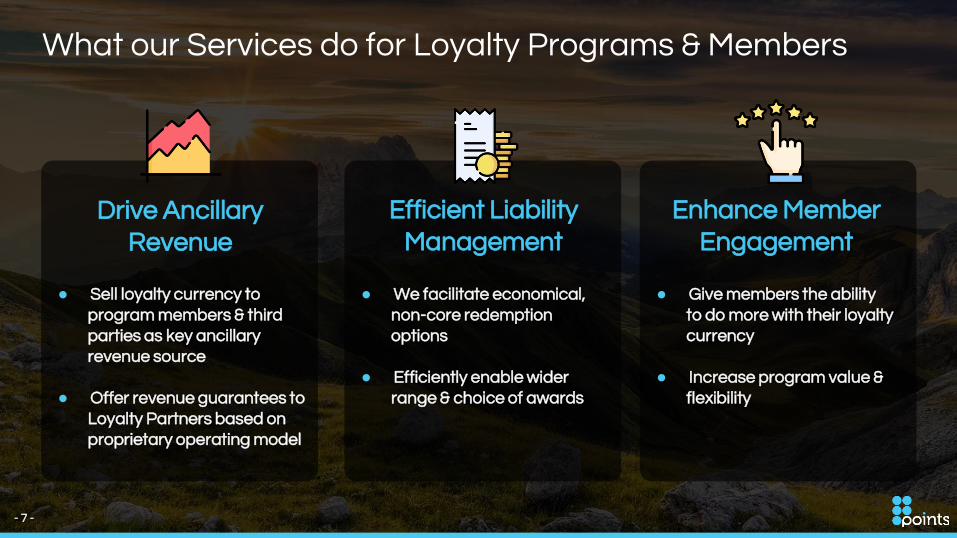
Drive Ancillary Revenue
● Sell loyalty currency to program members & third parties as key ancillary revenue source
● Offer revenue guarantees to Loyalty Partners based on proprietary operating model
What our Services do for Loyalty Programs & Members
Efficient Liability Management
● We facilitate economical, non-core redemption options
● Efficiently enable wider range & choice of awards
Enhance Member Engagement
● Give members the ability to do more with their loyalty currency
● Increase program value & flexibility
- 7 -
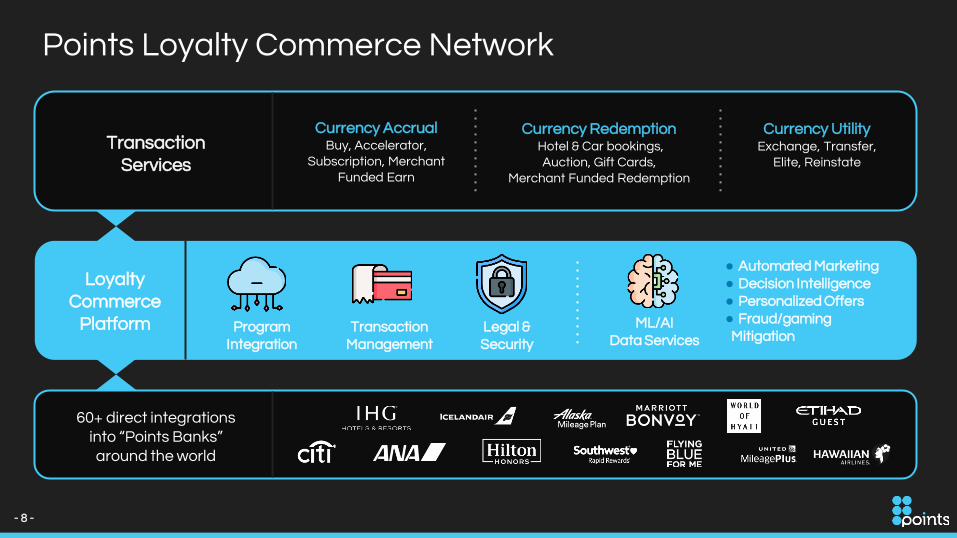
Points Loyalty Commerce Network
TransactionServices
60+ direct integrations into “Points Banks” around the world
Loyalty Commerce
Platform
Currency AccrualBuy, Accelerator,
Subscription, Merchant Funded Earn
Currency RedemptionHotel & Car bookings, Auction, Gift Cards,
Merchant Funded Redemption
Currency UtilityExchange, Transfer,
Elite, Reinstate
Program Integration
Transaction Management
● Automated Marketing● Decision Intelligence● Personalized Offers● Fraud/gaming Mitigation
Legal & Security
ML/AIData Services
- 8 -
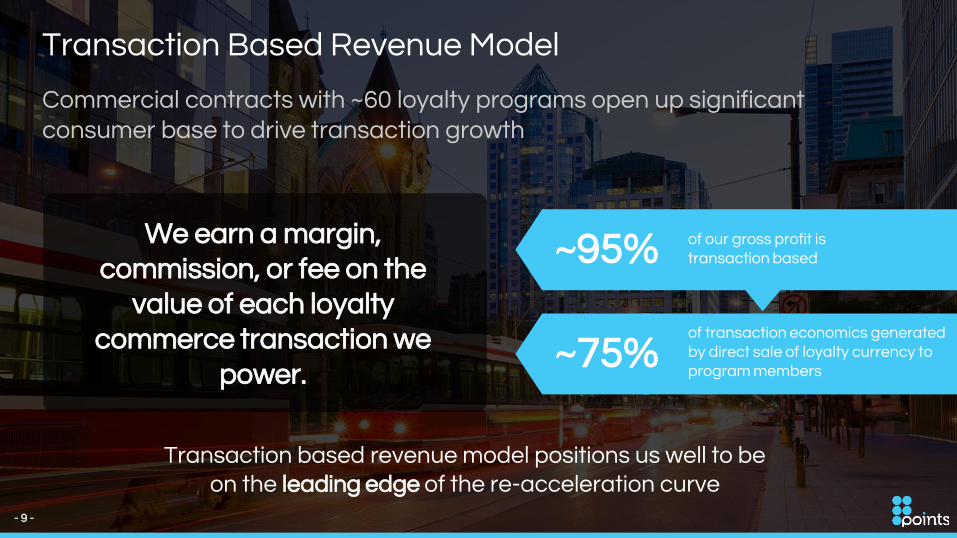
We earn a margin, commission, or fee on the
value of each loyalty commerce transaction we
power.
Transaction Based Revenue Model
of our gross profit is transaction based~95%
~75%of transaction economics generated by direct sale of loyalty currency to program members
Commercial contracts with ~60 loyalty programs open up significant consumer base to drive transaction growth
- 9 -
Transaction based revenue model positions us well to beon the leading edge of the re-acceleration curve
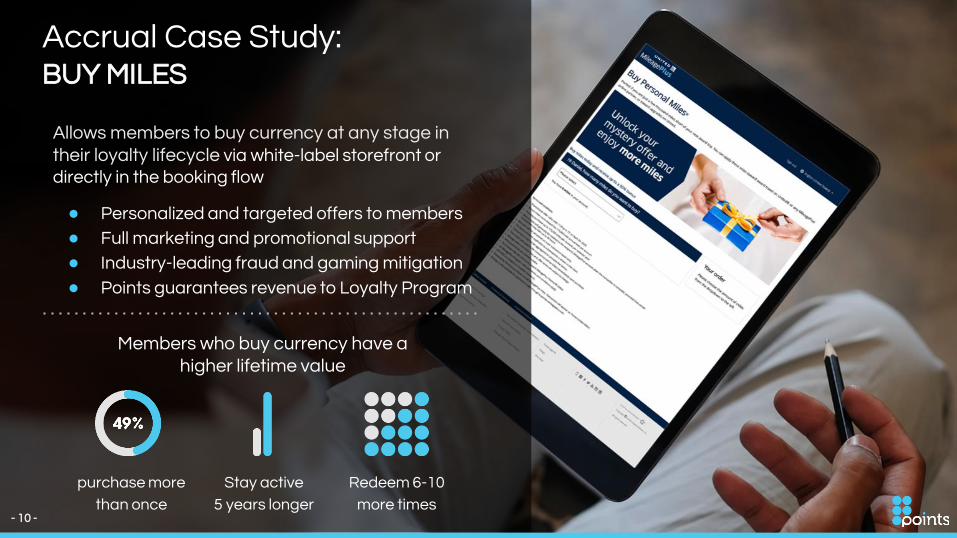
Accrual Case Study: BUY MILES
purchase more
than once
Stay active
5 years longer
Redeem 6-10
more times
Members who buy currency have a higher lifetime value
Allows members to buy currency at any stage in their loyalty lifecycle via white-label storefront or directly in the booking flow
● Personalized and targeted offers to members
● Full marketing and promotional support
● Industry-leading fraud and gaming mitigation
● Points guarantees revenue to Loyalty Program
- 10 -
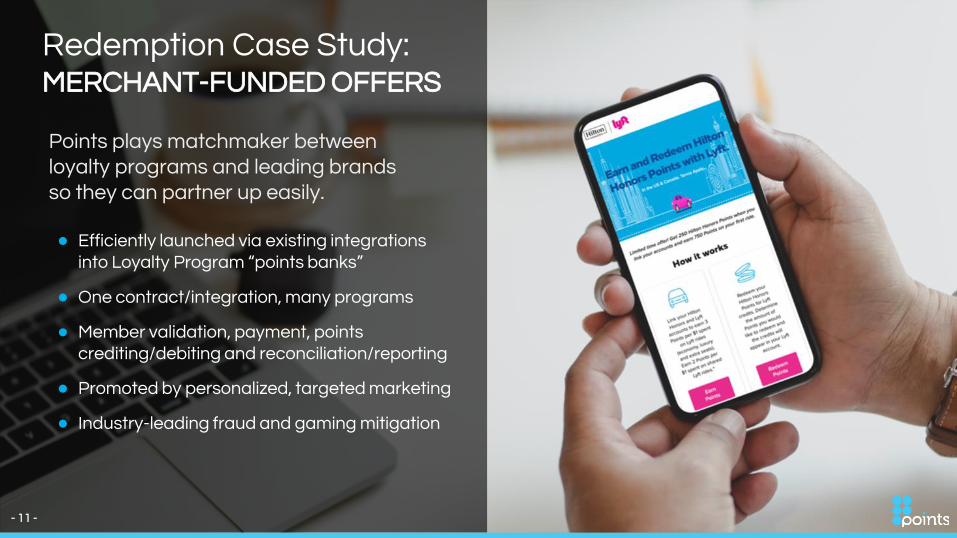
Redemption Case Study:MERCHANT-FUNDED OFFERS
● Efficiently launched via existing integrations into Loyalty Program “points banks”
● One contract/integration, many programs
● Member validation, payment, points crediting/debiting and reconciliation/reporting
● Promoted by personalized, targeted marketing
● Industry-leading fraud and gaming mitigation
Points plays matchmaker between loyalty programs and leading brands so they can partner up easily.
- 11 -
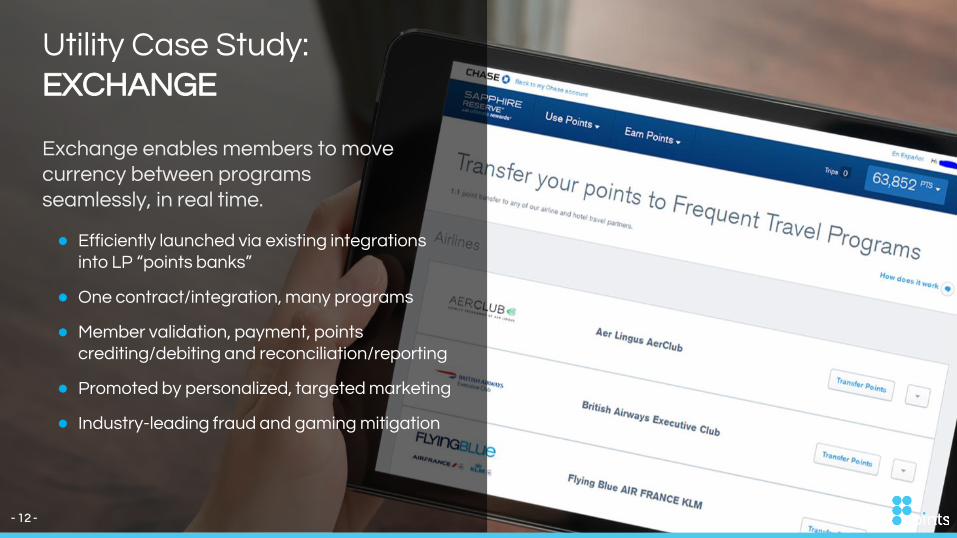
Utility Case Study: EXCHANGE
Exchange enables members to move currency between programs seamlessly, in real time.
● Efficiently launched via existing integrations into LP “points banks”
● One contract/integration, many programs
● Member validation, payment, points crediting/debiting and reconciliation/reporting
● Promoted by personalized, targeted marketing
● Industry-leading fraud and gaming mitigation
- 12 -
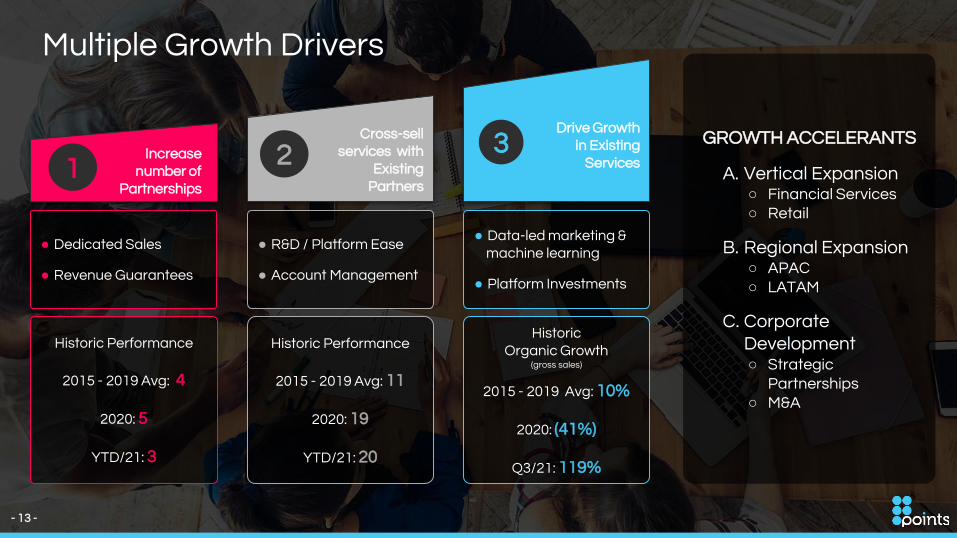
Multiple Growth Drivers
GROWTH ACCELERANTS
A. Vertical Expansion○ Financial Services ○ Retail
B. Regional Expansion○ APAC ○ LATAM
C. Corporate Development○ Strategic
Partnerships○ M&A
Increase number of
Partnerships
Historic Performance
2015 - 2019 Avg: 4
2020: 5
YTD/21: 3
1
● Dedicated Sales
● Revenue Guarantees
Historic Performance
2015 - 2019 Avg: 11
2020: 19
YTD/21: 20
Cross-sell services with
Existing Partners
2
● R&D / Platform Ease
● Account Management
Drive Growth in Existing
Services
Historic Organic Growth
(gross sales)
2015 - 2019 Avg: 10%
2020: (41%)
Q3/21: 119%
3
● Data-led marketing & machine learning
● Platform Investments
- 13 -
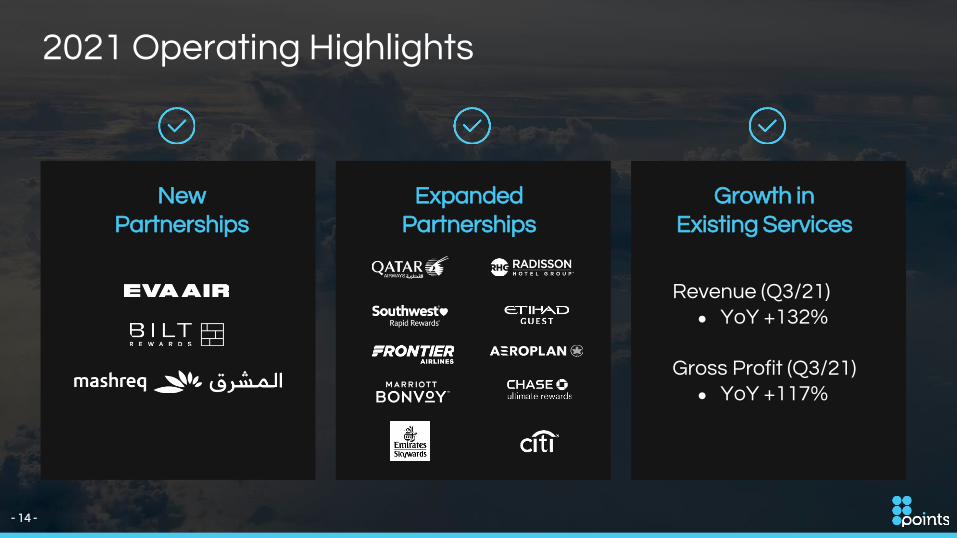
2021 Operating Highlights
New Partnerships
Revenue (Q3/21)● YoY +132%
Gross Profit (Q3/21)● YoY +117%
Expanded Partnerships
Growth in Existing Services
- 14 -
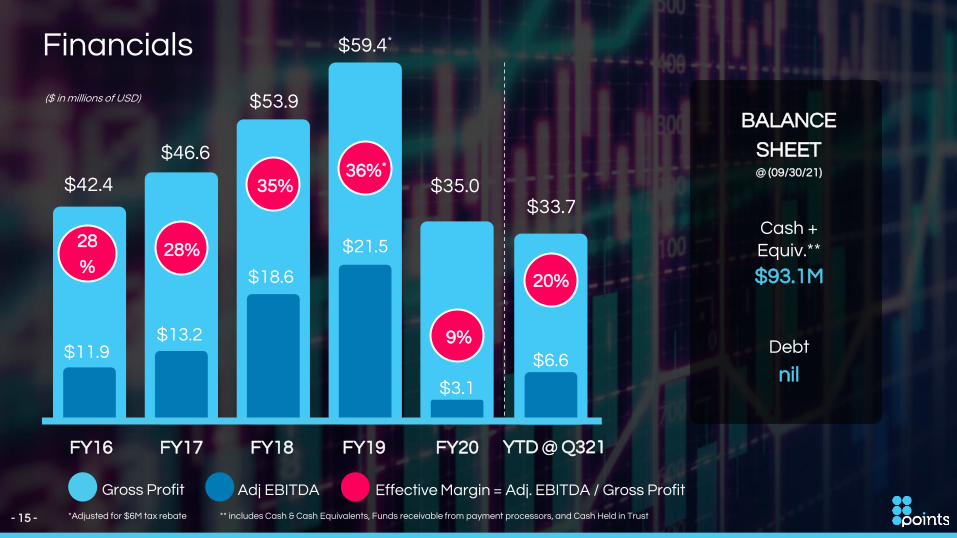
Financials
FY17 FY18 FY19 FY20
$3.1
$13.2
$18.6
$21.5
$35.0
$46.6
$53.9
$59.4*
9%
28%
35%36%*
Effective Margin = Adj. EBITDA / Gross Profit
*Adjusted for $6M tax rebate
Gross Profit Adj EBITDA
$11.9
28
%
FY16
$42.4
($ in millions of USD)
Cash + Equiv.**
$93.1M
Debt
nil
BALANCE
SHEET@ (09/30/21)
$6.6
$33.7
YTD @ Q321
** includes Cash & Cash Equivalents, Funds receivable from payment processors, and Cash Held in Trust
20%
- 15 -
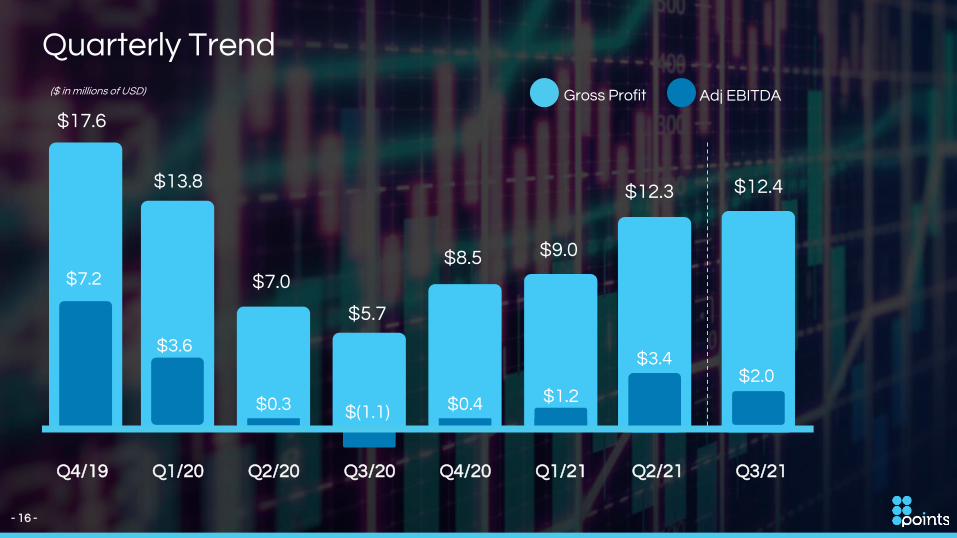
Quarterly Trend
$1.2
$7.2
$3.6
$9.0
$17.6
$13.8
Gross Profit Adj EBITDA ($ in millions of USD)
$3.4
$12.3
Q2/21Q1/21
$0.4
$8.5
$(1.1)
$5.7
Q4/20Q3/20
$0.3
$7.0
Q2/20Q1/20Q4/19
- 16 -
$2.0
$12.4
Q3/21
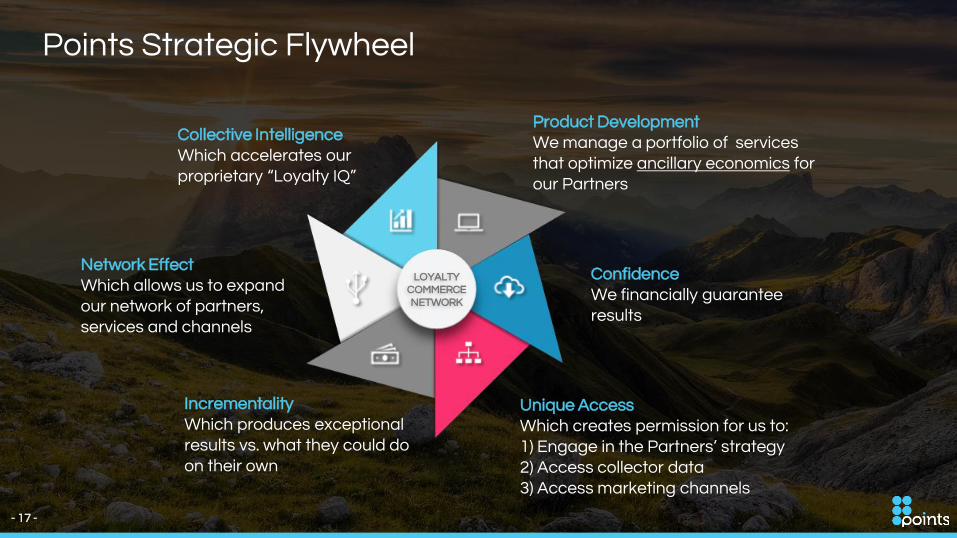
Points Strategic Flywheel
LOYALTY COMMERCE NETWORK
Product DevelopmentWe manage a portfolio of services that optimize ancillary economics for our Partners
ConfidenceWe financially guarantee results
Unique AccessWhich creates permission for us to: 1) Engage in the Partners’ strategy 2) Access collector data 3) Access marketing channels
Collective IntelligenceWhich accelerates our proprietary “Loyalty IQ”
Network EffectWhich allows us to expand our network of partners, services and channels
IncrementalityWhich produces exceptional results vs. what they could do on their own
- 17 -
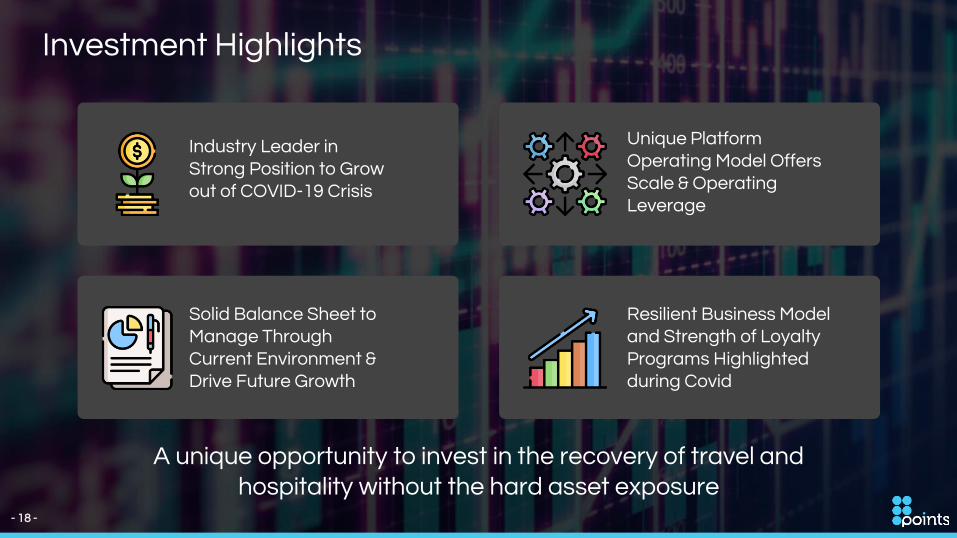
Investment Highlights
Resilient Business Model and Strength of Loyalty Programs Highlighted during Covid
Unique Platform Operating Model Offers Scale & Operating Leverage
Solid Balance Sheet to Manage Through Current Environment & Drive Future Growth
Industry Leader in Strong Position to Grow out of COVID-19 Crisis
A unique opportunity to invest in the recovery of travel and hospitality without the hard asset exposure
- 18 -

Appendix
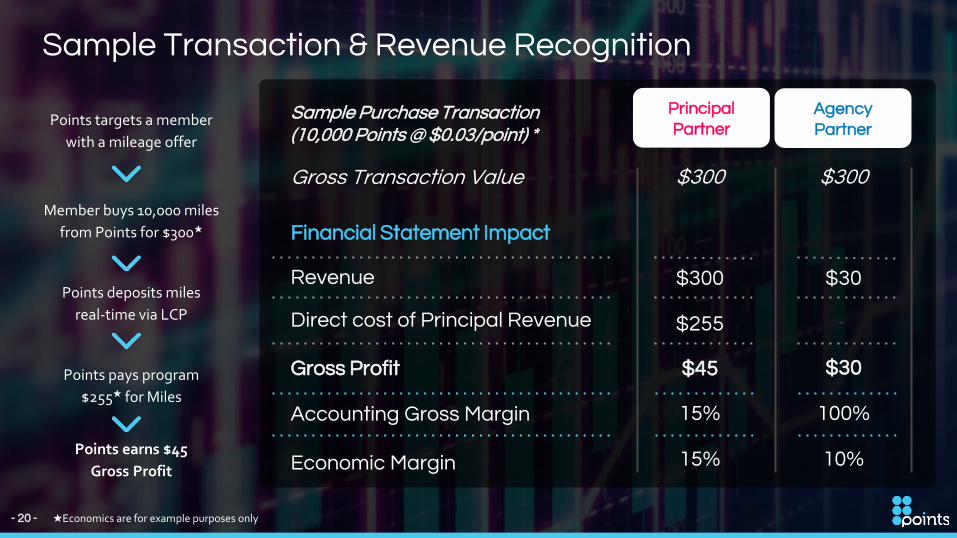
Sample Transaction & Revenue Recognition
Agency Partner
Principal Partner
Gross Transaction Value
Financial Statement Impact
Revenue
Direct cost of Principal Revenue
Gross Profit
Accounting Gross Margin
Economic Margin
$30
-
$30
100%
10%
$300
Sample Purchase Transaction (10,000 Points @ $0.03/point) *
$300
$45
15%
15%
$300
$255
Points targets a member
with a mileage offer
Member buys 10,000 miles
from Points for $300★
Points deposits miles
real-time via LCP
Points pays program
$255★ for Miles
Points earns $45
Gross Profit
★Economics are for example purposes only- 20 -
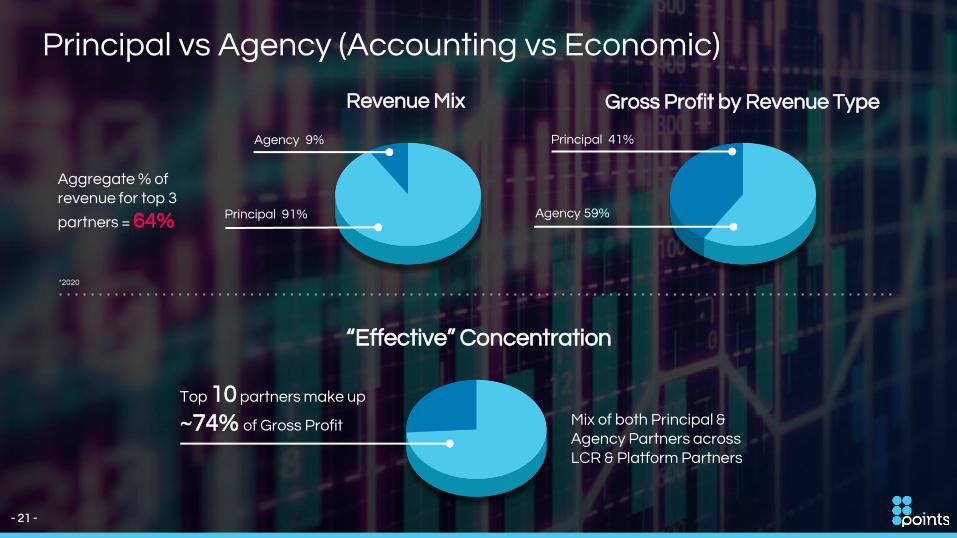
Principal vs Agency (Accounting vs Economic)
Revenue Mix
Principal 91%
Agency 9%
Gross Profit by Revenue Type
Principal 41%
Agency 59%
Aggregate % of revenue for top 3
partners = 64%
Top 10 partners make up
~74% of Gross Profit Mix of both Principal & Agency Partners across LCR & Platform Partners
“Effective” Concentration
*2020
- 21 -
Investor Relations
Cody Slach and Jackie KeshnerGateway Investor Relations [email protected]
Thank you