Embed Size (px)
Citation preview
JOURNAL OF GEOPHYSICAL RESEARCH, VOL. 104, NO. D22, PAGES 27,841-27,857, NOVEMBER 27, 1999
Point simulation of seasonal snow cover dynamics beneath boreal forest canopies
Timothy E. Link Environmental Sciences Graduate Program, Oregon State University, Corvallis, Oregon
Danny Marks USDA Agricultural Research Service, NW Watershed Research Center, Boise, Idaho
Abstract. The accurate simulation of snowpack deposition and ablation beneath forested areas is complicated by the fact that the vegetation canopy strongly affects the snow surface energy balance. Data collected as part of the Boreal Ecosystem-Atmosphere Study are used to derive a series of simple canopy adjustments and drive a two-layer coupled energy- and mass-balance snowmelt model to simulate the deposition and ablation of the seasonal snowpack at six sites within the boreal forest for the 1994-1995 snow season. Snow cover energy gain in the spring is strongly controlled by canopy cover and is dominated by net radiation fluxes which contribute from 66% to 92% of the snow cover energy balance. Turbulent fluxes comprise 11% of the net energy balance on average, with minor contributions from soil and advected energy fluxes. Simulated depths at the forested sites generally show good agreement with measured snow depths, indicated by model efficiencies ranging from 0.90 to 0.94, with root-mean-square differences less than 5 cm. Seasonal snow covers in the boreal environment may be more sensitive to land use transitions, rather than climate shifts, due to the strong control exerted by vegetation canopies on radiation transfer processes.
1. Introduction
The boreal forest is the largest terrestrial biome, covering approximately 15% of the surface of the Earth [Pomeroy and Dion, 1996]. Recent studies indicate that climate changes occurring as a result of increased atmospheric CO2 will be most pronounced at higher latitudes (45 ø - 65øN), leading to warming and drying of the boreal regions [Schlesinger and Mitchell, 1987; Bonan et al., 1992]. There is evidence that these regions currently function as a sink for carbon released by fossil fuel combustion and land use changes [Tans et al., 1990], but climate change may substantially alter carbon dy- namics in the boreal regions [Sellers et al., 1995a]. The sea- sonal onset of carbon assimilation and soil respiration in the boreal forest is strongly controlled by the timing of snowpack ablation and subsequent soil warming [Sellers et al., 1995a]. An understanding of the geophysical processes controlling snow cover deposition and ablation is therefore critical to the quantification of water and carbon dynamics within the boreal ecosystem.
Th0 Boreal Ecosystem-Atmosphere Study (BOREAS) was undertaken in 1993, as a multidisciplinary, international field investigation to improve the scientific understanding of mass and energy transfer processes between boreal forests and the lower atmosphere [Sellers et al., 1995a]. Two associated objectives of the project are to improve process models describing these dynamics, and to develop techniques for
Copyright 1999 by the American Geophysical Union.
Paper number 1998ID200121. 0148-0227/99/1998JD200121 $09.00
applying the models over large spatial scales. These de- velopments will ultimately lead to improved land surface parameterizations (LSPs), which will be used to drive at- mospheric general circulation models (GCMs), in order to improve global climate change analyses [Sellers et al., 1997a].
Seasonal snow cover dynamics respond to climate condi- tions at the snow surface, which are controlled locally by topographic and vegetation variations. Topographic relief is relatively subtle in many boreal regions, therefore climate conditions at the snow surface are primarily controlled by variations in the overlying veg •taticm c. ancmv l•cw•et c. anc•- pies may intercept a portion of incoming snow, which may later fall to the ground, melt, or sublimate depending on cli- mate conditions [Golding and Swanson, 1986; Lundberg and Halldin, 1994]. Canopies strongly influence the radiation balance of the snow cover by absorbing and reflecting in- coming solar radiation (0.28- 2.8 gm), altering the emission of thermal radiation (2.8 - 100 gm) [Male and Granger, 1981; Lafieur and Adams, 1986] and reducing the snow cover albedo by the deposition of organic debris [Pomeroy and Dion, 1996]. A forest cover shelters the snow cover from wind and alters temperature and humidity gradients, greatly reducing the efficiency of turbulent energy transfer [Berris and Harr, 1987; Ohta et al., 1993; Marks et al., 1998b]. The accurate adjustment of climate data collected at open sites for the presence of various vegetation canopies is therefore critical for the numerical modeling of snow cover processes in the boreal environment.
The objective of this study is to accurately simulate the energy- and mass-balance of the seasonal snow cover over an entire snow season at several locations beneath a range of
27,841
27,842 LINK AND MARKS: SIMULATION OF SNOW COVER DYNAMICS
land cover types. A series of simple algorithms are devel- oped to adjust time series meteorological data collected above forest canopies, or at open sites, to conditions at the snow surface for snow process simulation. The algorithms are designed to require commonly available spatial data products, such as species type and canopy height, so that the techniques may be readily applied in areas where detailed canopy structure measurements are not available. The algo- rithms are tested in conjunction with a two-layer mass- and energy-balance snowmelt model (SNOBAL) [Marks, 1988] to simulate the development and ablation of seasonal snow covers beneath a range of land covers. This manuscript de- scribes point climate and snow cover simulations that were incorporated into spatially distributed snow cover simulations beneath boreal forests [Link and Marks, 1999]. This approach develops a tool to assess the potential effects of al- tered land use patterns and climate conditions on hydrologic processes and ecosystem dynamics.
2. Methods
In this section, selected study locations and data used to derive the canopy adjustment algorithms and to drive and validate SNOBAL are described. The development, valida- tion, and application of the canopy algorithrm to the model forcing data are discussed. A basic overview of the structure and equations solved by SNOBAL to compute snow cover mass and energy fluxes is provided.
2.1. Site Descriptions
The BOREAS study region comprises most of Saskatche- wan and Manitoba, containing northern and southern study areas (NSA and SSA), within which process study sites are located [Sellers et al., 1997b].
Two sites in the NSA and four sites in the SSA were se-
lected for snow cover mass- and energy- balance simulations. The locations were chosen to cover the range of canopy characteristics (i.e., open through dense conifer) found in the boreal regions and upon the completeness and availability of meteorological data for model forcing and validation. In the NSA, sites beneath a mature jack pine (NSA-OJP) and a mixed spruce/poplar (NSA-YTH) canopy were selected. In the SSA, sites located at an open area (SSA-open), and be- neath mature aspen (SSA-OA), mature jack pine (SSA-OJP), and mature black spruce (SSA-OBS) canopies were selected. Each site is flat, with a laterally continuous (up to ~ 1 km) and homogeneous canopy with respect to species composition, stand age, and stem density. Detailed descriptions of site locations and characteristics are provided by Sellers et al. [1995b].
2.2. Data
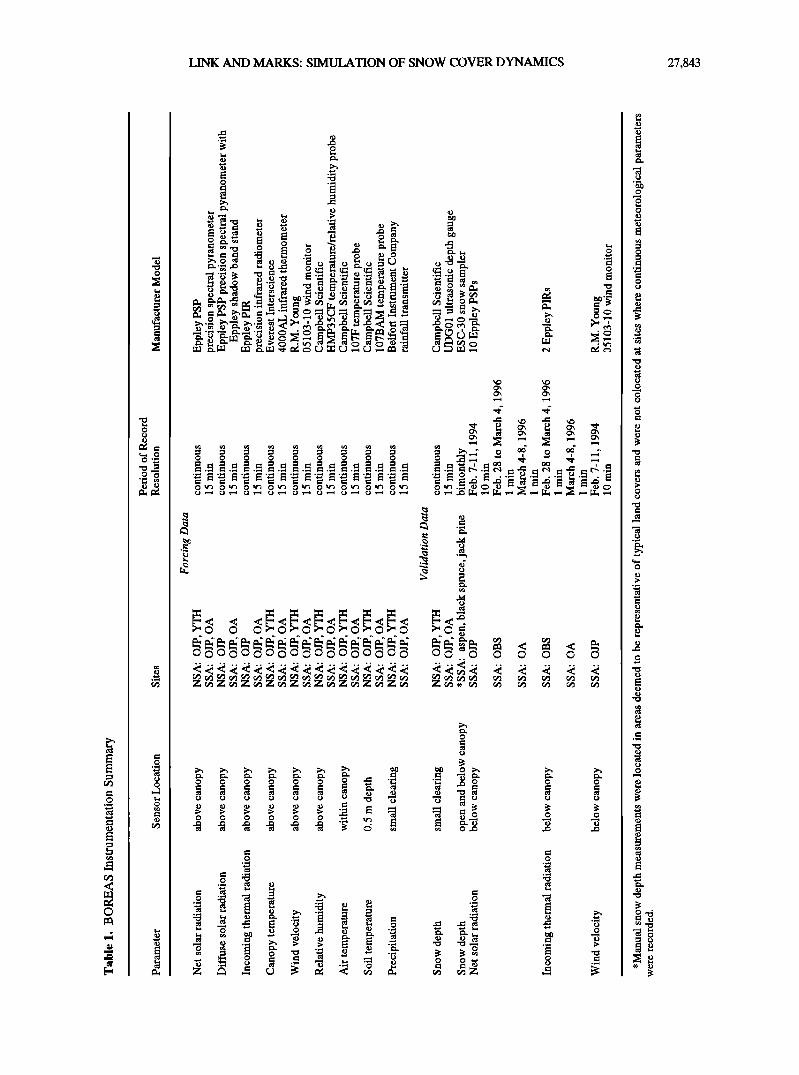
Continuous above- and below-canopy meteorological data for the NSA-YTH, NSA-OJP, SSA-OJP, and SSA-OA sites were obtained from automated meteorological stations (AMS) maintained by the Saskatchewan Research Council (SRC) [Shewchuk, 1997]. At each site, the parameters listed in Table 1 were recorded as 15 minute averages of sensor scans completed every 5 s. Above-canopy sensor suites are located from 3 to 6 m above the top of the canopy, and be- low-canopy instrumentation is located at 2 m above ground
level. Although no continuously monitored sensors were in- stalled at the SSA-OBS stand or at the open site, these loca- tions were included in the analyses to investigate snow cover dynamics within a full range of boreal land cover classes. Meteorological data for SSA-OBS and SSA-open were sub- stituted from the nearest AMS, located at the SSA-OJP site,
approximately 30 km to the east and 19 km to the north, re- spectively, for all calculations and model runs.
Subcanopy solar radiation measurements were made during winter intensive field campaigns (IFCs) completed in 1994 and 1996, according to procedures described by Hardy et al. [1997]. Ten Eppley pyranometers were randomly lo- cated beneath the forest canopies, so some radiometers were adjacent to stems and others were located in canopy gaps, to achieve a spatially integrated measure of global solar radia- tion at the snow surface. Measurements were made over
periods of three to four clear days, with radiometers ran- domly relocated once a day.
Measurements of subcanopy thermal radiation were com- pleted using two Eppley pyrgeometers, during the 1996 IFC at the SSA-OA and SSA-OBS sites. At the SSA-OJP site,
subcanopy wind speed measurements were completed with an R.M. Young wind monitor located 2 m above the snow surface.
Manual snow course depth, density, and snow water equivalent (SWE) measurements were also completed within four land cover types (open, aspen, black spruce, and jack pine) in the SSA. Each snow course consisted of five sta- tions approximately 100 m apart, where snow measurements were repeated near the 1st and 15th of the winter and spring months. All measurements were completed using a large diameter ESC-30 snow sampler with a 30 cm 2 cutter area and a spring balance. The snow depths at each site were recorded to the nearest 0.5 cm, and the five sites averaged to obtain a mean snow depth for each land cover type.
2.3. Development of Canopy Adjustment Algorithms
SNOBAL requires meteorological measuremeres taken at or near the snow surface. The presence of a forest canopy necessitates the modification of the meteorological data re- quired to drive SNOBAL, if the forcing data are collected above canopies or at open sites. The above-canopy solar radiation data must be adjusted to account for shading of the snow surface by the vegetation canopy, and for snow cover albedo, to obtain the net solar radiation absorbed by the snowpack. The above-canopy thermal radiation data must also be adjusted to account for the modification of incoming thermal radiation by the forest canopy. Wind speeds meas- ured above the forest canopy must be modified to account for the sheltered conditions present at the forest floor in order to accurately calculate the turbulent energy fluxes.
2.3.1. Net solar radiation. The transmission of solar
radiation through a vegetation canopy is dependent on the relative proportions of the beam and diffuse components, spectral characteristics of incoming radiation, and the physi- cal structure and reflectance of the vegetation [Monteith and Unsworth, 1990]. The adjustment algorithrm for solar radia- tion use commonly measured canopy characteristics to calcu- late the contribution of the different radiation components. Transmission through individual canopy elements (e.g., gaps, crowns, stems) and spectral properties of transmitted solar
LINK AND MARKS: SIM•ATION OF SNOW COVER DYNAMICS 27,843
o o o
o o o o o o ..c: .•
o o o o o o .m • 1•
0 0 0 0 •
27,844 LINK AND MARKS: SIMULATION OF SNOW COVER DYNAMICS
radiation are not explicitly considered, in order to limit both the driving and the validation data required for the algo- rithms.
2.3.1.1. Theory: Global solar radiation (Sg) is composed of a diffuse (St), or nondirectional component, and a colli- mated, or beam (St±) component, expressed as
Sg = sa + Assuming that all diffuse radiation at the snow surface origi- nates as diffuse radiation at the top of the canopy, the diffuse radiation at the snow surface is expressed
=axSa, o (2)
where St, f is the diffuse radiation at the snow surface (W m'2), -2
S,•o is the diffuse radiation at the top of the canopy (W m ), and 'c a is the optical transmissivity of the canopy to diffuse radiation (dimensionless), or hemispherical sky view factor.
If it is assumed that the forest canopy at a given site is homogeneous and continuous, the transmission of beam radiation can be approximated using the Beer-Bouger- Lambert law, which describes the exponential decay of radia- tion through an isotropic, homogeneous medium [Peixoto and Oort, 1992]. By applying this law, the beam radiation at a subcanopy location (S¾) can be written as
St,,f = St,,o x e -gasec(ø) (3) where St± o is the direct radiation at the top of the canopy (W m ), IX is the extinction coefficient (m), which is inversely proportional to the optical transmissivity of the canopy to beam radiation, h is the canopy height (m), and 0 is the solar zenith angle (o).
Multiple scattering is not explicitly considered in these formulations but is inherently accounted for in the empirical derivations of x a and
In the above equations, Ss, o and S•o can be measured di- rectly and St,,o obtained by computing the difference. The global solar radiation below the canopy (Sg, z) is more difficult to measure continuously at a site, due to the high spatial variability of radiation beneath forest canopies and the high cost and effort associated with maintaining a large array of radiometers. Ss, • can be calculated by summing (2) and (3), given sufficient information regarding the physical character- istics of the canopy. The height of the canopy is easily measured, and 0 can be calculated based on solar geometry, leaving x a and IX to either be estimated or determined empiri- cally. At the SSA-OJP, SSA-OA, and SSA-OBS sites, the availability of high quality, high temporal resolution above- and below-canopy radiation measurements permitted the ac- curate estimation of these two parameters.
2.3.1.2. Calculation of 'c a and Ix: Although St, f measure- ments were not completed at any of the sites, individual ra- diometers within the subcanopy array are occasionally shaded by canopy elements over the course of a day, yielding sporadic measurements S• When all radiation data from the subcanopy array are plotted synchronously, an approximate diffuse radiation curve is produced by the inverted peaks on the individual curves. The value 'ca is determined graphically, by iteratively multiplying Sa:o by estimated values for 'ca, until the resulting curve matches the Sa, f curve to within 5%.
The St,,f value for each time interval is computed by sub- tracting Sa• calculated using (2), from the mean Ss, • measured by the subcanopy radiometer array. The total direct subcan- opy solar radiation at the snow surface during the subcanopy measurement period is calculated by numerically integrating the St,,• over the measurement period. An iterative solution for IX is obtained for each canopy type by estimating values for IX and numerically integrating the calculated St,,z using (3), until the resulting net incident energy converges to within 1% of the measured value.
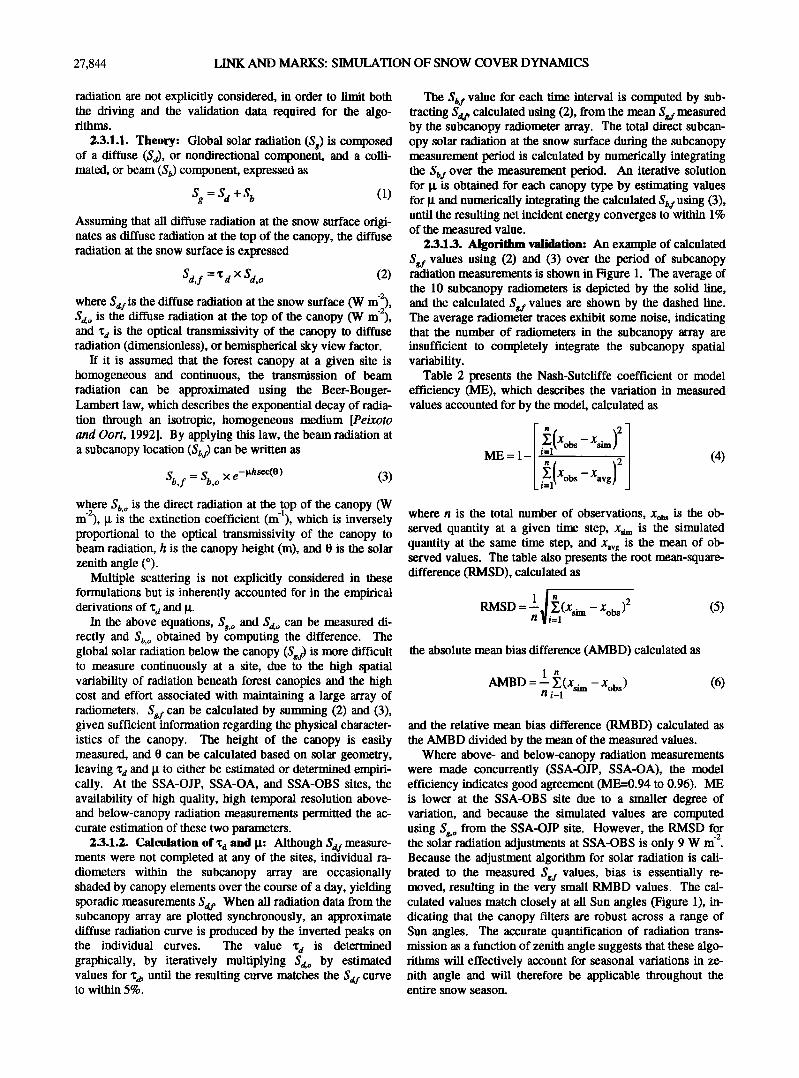
2.3.1.3. Algorithm validation: An example of calculated Sg, f values using (2) and (3) over the period of subcanopy radiation measurements is shown in Figure 1. The average of the 10 subcanopy radiometers is depicted by the solid line, and the calculated S,,• values are shown by the dashed line. The average radiometer traces exhibit some noise, indicating that the number of radiometers in the subcanopy array are insufficient to completely integrate the subcanopy spatial variability.
Table 2 presents the Nash-Sutcliffe coefficient or model efficiency (ME), which describes the variation in measured values accounted for by the model, calculated as
n )2 •l(XObs -- Xsi m ME=l- .• 2' (4)
where n is the total number of observations, Xob s is the ob- served quantity at a given time step, X•m is the simulated quantity at the same time step, and Xavg is the mean of ob- served values. The table also presents the root mean-square- difference (RMSD), calculated as
1 n RMSD =--al Y'(Xsim -- Xobs )2 nVi=l
(5)
the absolute mean bias difference (AMBD) calculated as
AMBD 1 n =- Z(xsi m -- Xobs) g/i-1
(6)
and the relative mean bias difference (RMBD) calculated as the AMBD divided by the mean of the measured values.
Where above- and below-canopy radiation measurements were made concurrently (SSA-OJP, SSA-OA), the model efficiency indicates good agreement 0VIE=0.94 to 0.96). ME is lower at the SSA-OBS site due to a smaller degree of variation, and because the simulated values are computed using Sgo from the SSA-OJP site. However, the RMSD for ß -2
the solar radiation adjustments at SSA-OBS is only 9 W m . Because the adjustment algorithm for solar radiation is cali- brated to the measured Sgj values, bias is essentially re- moved, resulting in the very small RMBD values. The cal- culated values match closely at all Sun angles (Figure 1), in- dicating that the canopy filters are robust across a range of Sun angles. The accurate quantification of radiation trans- mission as a function of zenith angle suggests that these algo- rithms will effectively account for seasonal variations in ze- nith angle and will therefore be applicable throughout the entire snow season.
LINK AND MARKS: SIMULATION OF SNOW COVER DYNAMICS 27,845
140
120
'"E 100
c: 80 o
m 60
rr 40
20
- ............. Mean measured S½,• (n= 10) _: - Calculated Sg,• -
_ _
-- _
-, I , , , , , , , , ! , , • .• • • • I , • , , • • , • ........ •fl , , , , , , , , I,,, , ,-
0 1000 2000 3000 4000 5000
minutes
Figure 1. Measured and modeled subcanopy solar radiation at the SSA-OJP site, February 7-11, 1994.
2.3.1.4. Albedo adjustments: The net diffuse and beam radiation absorbed by the snow cover is a function of the re- spective spectrally integrated albedos for diffuse and beam radiation and is written
S.,f = (1- (Zd)Sd, f + (1-(Zb)Sb, f (7) where ot d is the snow cover albedo for diffuse radiation (0.98, dimensionless), and otb is the snow cover albedo for beam radiation (dependent on solar elevation angle).
A constant ot d of 0.98 is applied to all calculated S• values to obtain the net diffuse radiation absorbed by the snow cover. The visible (0.28 - 0.7 gm) and near-infrared (0.7 - 2.8 gin) beam albedos ({Zvi s and (/nit, respectively) at each measurement interval for an open site are calculated as a function of grain growth and Sun angle using the empirical relationships described by Warren and Wiscombe [1980], Wiscombe and Warren [1980], and Marshall and Warren [1987]. The at b was estimated from the average of oq, is and oq•. At the forested sites, an additional albedo reduction function was applied to simulate the effects of organic debris accumulation within the snowpack. This function linearly decreases the albedos from the time of maximum snowpack accumulation to the time of complete ablation. The function is defined so that the subcanopy snow cover albedo reaches a value of 0.55 just prior to complete ablation, consistent with observations from boreal forests [Pomeroy and Dion, 1996].
2.3.2. Thermal radiation. The transmission and emis-
sion of thermal radiation within a vegetation canopy is de- pendent on the amount of incoming radiation at the top of the canopy and the physical structure and thermal characteristics of the vegetation.
2.3.2.1. Theory: The thermal radiation beneath forest canopies (Lf) is altered relative to the thermal flux at open sites (Lo) due to blockage of sky thermal radiation and emis- sion of thermal radiation from the canopy elements. L l is written
• = • • x L ø + (• - • • )• cOTc 4 (8) where x,. is the transmissivity of the canopy to thermal radia- tion (dimensionless), L o is the thermal radiation measured
-2
above the forest canopy (W m ), e c is the emissivity of the canopy (0.96 dimensionless), c• is the Stefan-Boltzman con- stant (5.6697 -8 -2 4 x 10 W m K ), and Tc is the mean surface temperature of the canopy (K).
Diffuse solar and thermal radiation are both nondi-
rectional; therefore it is assumed that x,. is equal to x d, calcu- lated from the subcanopy radiation measurements. Forest canopies behave as almost perfect black bodies having emissivity values of approximately 0.96 [Price and PetzoM, 1984]. Using the scalar values for 'c,. and e•, (8) can be used to calculate Lf given values for L o and T•, assuming that the measured T• values are representative of all canopy elements.
Table 2. Canopy Adjustment Fitting Statistics
Solar Radiation
Parameter SSA-OJP SSA-OA SSA-OBS
Thermal Radiation
SSA-OA SSA-OBS
ME 0.96 0.94 0.70
RMSD, W m -2 5 22 9 AMBD, W m -2 0 1 0 RMBD, % 0 1 1
__
17
7
3
27,846 LINK AND MARKS: SIMULATION OF SNOW COVER DYNAMICS
300
•: 250
=.,,.,,,
• 200
ß 150
100 , Mar 4
..... Measured above canopy Measured below canopy Modeled below canopy
I '-- ' ...... ,
Mar 5 Mar 6 Mar 7 Mar 8
1996
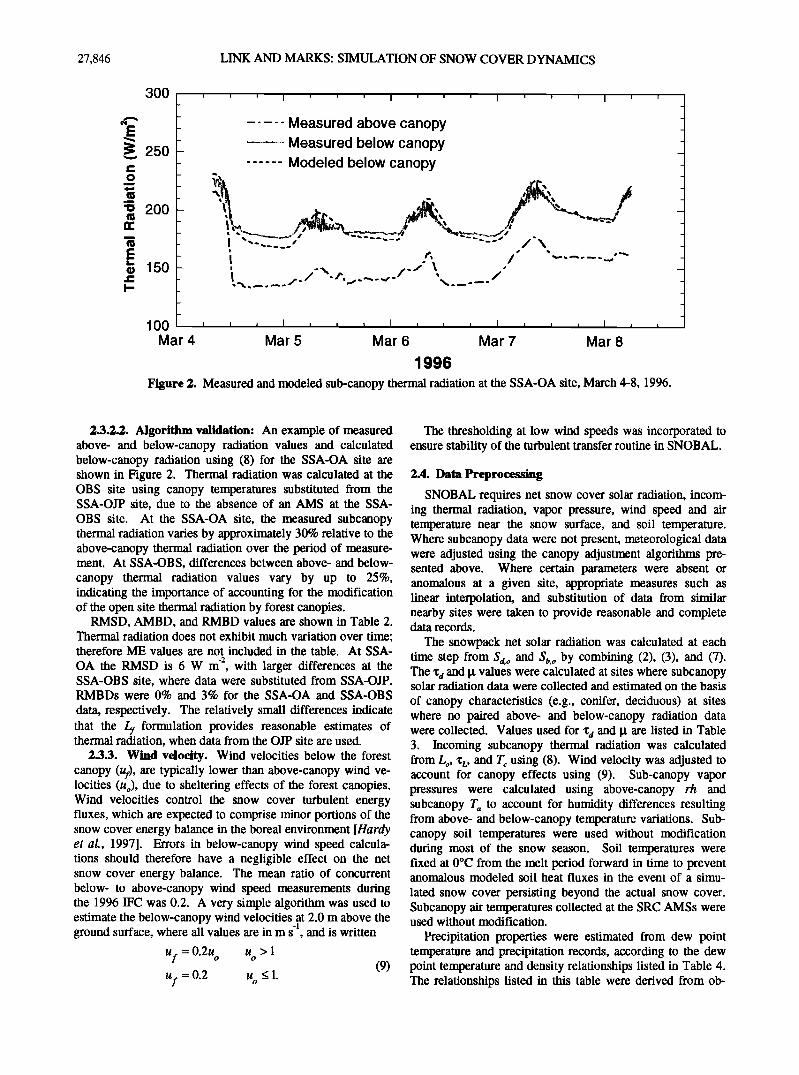
Figure 2. Measured and modeled sub-canopy thermal radiation at the SSA-OA site, March 4-8, 1996.
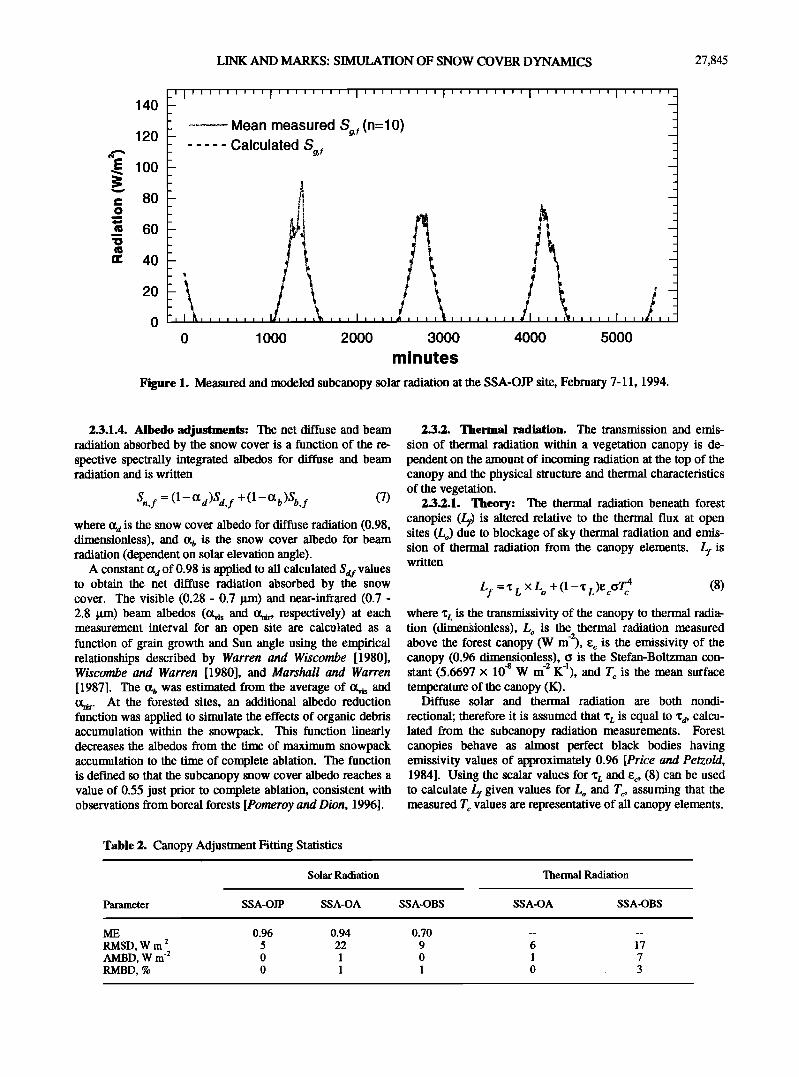
2.3.2.2. Algorithm validation: An example of measured above- and below-canopy radiation values and calculated below-canopy radiation using (8) for the SSA-OA site are shown in Figure 2. Thermal radiation was calculated at the OBS site using canopy temperatures substituted from the SSA-OJP site, due to the absence of an AMS at the SSA-
OBS site. At the SSA-OA site, the measured subcanopy thermal radiation varies by approximately 30% relative to the above-canopy thermal radiation over the period of measure- ment. At SSA-OBS, differences between above- and below-
canopy thermal radiation values vary by up to 25%, indicating the importance of accounting for the modification of the open site thermal radiation by forest canopies.
RMSD, AMBD, and RMBD values are shown in Table 2. Thermal radiation does not exhibit much variation over time; therefore ME values are not included in the table. At SSA-
OA the RMSD is 6 W m '2, with larger differences at the SSA-OBS site, where data were substituted from SSA-OJP. RMBDs were 0% and 3% for the SSA-OA and SSA-OBS
data, respectively. The relatively small differences indicate that the L s formulation provides reasonable estimates of thermal radiation, when data from the OJP site are used.
2.3.3. Wind vdocity. Wind velocities below the forest canopy (us), are typically lower than above-canopy wind ve- locities (Uo), due to sheltering effects of the forest canopies. Wind velocities control the snow cover turbulent energy fluxes, which are expected to comprise minor portions of the snow cover energy balance in the boreal environment [Hardy etaL, 1997]. Errors in below-canopy wind speed calcula- tions should therefore have a negligible effect on the net snow cover energy balance. The mean ratio of concurrent below- to above-canopy wind speed measurements during the 1996 IFC was 0.2. A very simple algorithm was used to estimate the below-canopy wind velocities at 2.0 m above the
-1
ground surface, where all values are in m s , and is written
lt f = 0.2u ø u ø > 1 Uj ---- 0.2 u ø _< 1. (9)
The thresholding at low wind speeds was incorporated to ensure stability of the turbulent transfer routine in SNOBAL.
2.4. Data Preprocessing
SNOBAL requires net snow cover solar radiation, incom- ing thermal radiation, vapor pressure, wind speed and air temperature near the snow surface, and soil temperature. Where subcanopy data were not present, meteorological data were adjusted using the canopy adjustment algorithms pre- sented above. Where certain parameters were absent or anomalous at a given site, appropriate measures such as linear interpolation, and substitution of data from similar nearby sites were taken to provide reasonable and complete data records.
The snowpack net solar radiation was calculated at each time step from Sa, o and Sb, o by combining (2), (3), and (7). The x a and gt values were calculated at sites where subcanopy solar radiation data were collected and estimated on the basis
of canopy characteristics (e.g., conifer, deciduous) at sites where no paired above- and below-canopy radiation data were collected. Values used for x a and gt are listed in Table 3. Incoming subcanopy thermal radiation was calculated from L o, x L, and T c using (8). Wind velocity was adjusted to account for canopy effects using (9). Sub-canopy vapor pressures were calculated using above-canopy rh and subcanopy T a to account for humidity differences resulting from above- and below-canopy temperature variations. Sub- canopy soil temperatures were used without modification during most of the snow season. Soil temperatures were fixed at 0øC from the melt period forward in time to prevent anomalous modeled soil heat fluxes in the event of a simu-
lated snow cover persisting beyond the actual snow cover. Subcanopy air temperatures collected at the SRC AMSs were used without modification.
Precipitation properties were estimated from dew point temperature and precipitation records, according to the dew point temperature and density relationships listed in Table 4. The relationships listed in this table were derived from ob-
LINK AND MARKS: SIMULATION OF SNOW COVER DYNAMICS 27,847
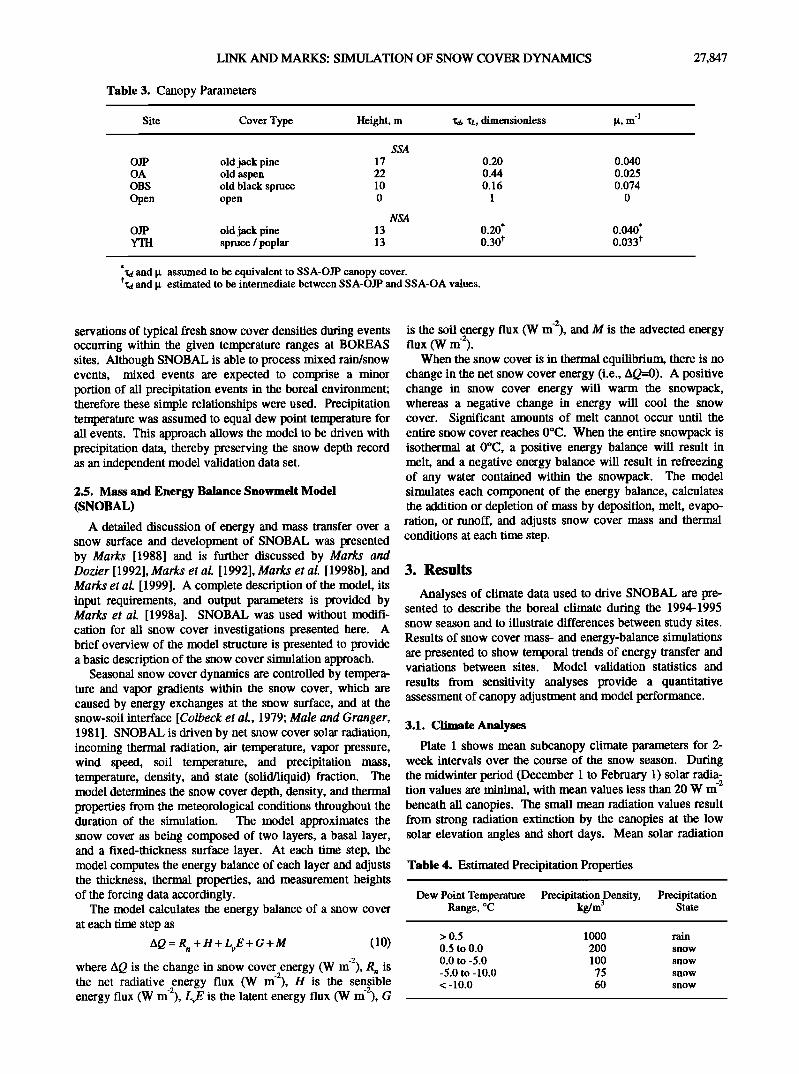
Table 3. Canopy Parameters
Site Cover Type Height, rn 'ca• 'cz,, dimensionless -1
OJP old jack pine 17 OA old aspen 22 OBS old black spruce 10 Open open 0
OJP old jack pine 13 YTH spruce / poplar 13
SSA
NSA
0.20
0.44 0.16
1
0.20' 0.30*
0.040
0.025 0.074
0
0.040' 0.033*
*'ca and gt assumed to be equivalent to SSA-OJP canopy cover. *'ca and gt estimated to be intermediate between SSA-OJP and SSA-OA values.
servations of typical fresh snow cover densities during events occurring within the given temperature ranges at BOREAS sites. Although SNOBAL is able to process mixed rain/snow events, mixed events are expected to comprise a minor portion of all precipitation events in the boreal environment; therefore these simple relationships were used. Precipitation temperature was assumed to equal dew point temperature for all events. This approach allows the model to be driven with precipitation data, thereby preserving the snow depth record as an independent model validation data set.
2.5. Mass and Energy Balance Snowmalt Model (SNOBAL)
A detailed discussion of energy and mass transfer over a snow surface and development of SNOBAL was presented by Marks [1988] and is further discussed by Marks and Dozier [1992],Marks etal. [1992],Marks etal. [1998b], and Marks et al. [1999]. A complete description of the model, its input requirements, and output parameters is provided by Marks et al. [1998a]. SNOBAL was used without modifi- cation for all snow cover investigations presented here. A brief overview of the model structure is presented to provide a basic description of the snow cover simulation approach.
Seasonal snow cover dynamics are controlled by tempera- ture and vapor gradients within the snow cover, which are caused by energy exchanges at the snow surface, and at the snow-soil interface [Colbeck et al., 1979; Male and Granger, 1981]. SNOBAL is driven by net snow cover solar radiation, incoming thermal radiation, air temperature, vapor pressure, wind speed, soil temperature, and precipitation mass, temperature, density, and state (solid/liquid) fraction. The model determines the snow cover depth, density, and thermal properties from the meteorological conditions throughout the duration of the simulation. The model approximates the snow cover as being composed of two layers, a basal layer, and a fixed-thickness surface layer. At each time step, the model computes the energy balance of each layer and adjusts the thickness, thermal properties, and measurement heights of the forcing data accordingly.
The model calculates the energy balance of a snow cover at each time step as
AQ=R n +H+LvE+G+M (10) -2
where AQ is the change in snow cover energy (W m ), R n is -2
the net radiative energy flux (W m ), H is the sensible -2 -2
energy flux (W m ), L•E is the latent energy flux (W m ), G
-2
is the soil energy flux (W m ), and M is the advected energy -2
flux (W m ). When the snow cover is in thermal equilibrium, there is no
change in the net snow cover energy (i.e., AQ=0). A positive change in snow cover energy will warm the snowpack, whereas a negative change in energy will cool the snow cover. Significant amounts of melt cannot occur until the entire snow cover reaches 0øC. When the entire snowpack is isothermal at 0øC, a positive energy balance will result in melt, and a negative energy balance will result in refreezing of any water contained within the snowpack. The model simulates each component of the energy balance, calculates the addition or depletion of mass by deposition, melt, evapo- ration, or runoff, and adjusts snow cover mass and thermal conditions at each time step.
3. Results
Analyses of climate data used to drive SNOBAL are pre- sented to describe the boreal climate during the 1994-1995 snow season and to illustrate differences between study sites. Results of snow cover mass- and energy-balance simulations are presented to show temporal trends of energy transfer and variations between sites. Model validation statistics and
results from sensitivity analyses provide a quantitative assessment of canopy adjustment and model performance.
3.1. Climate Analyses
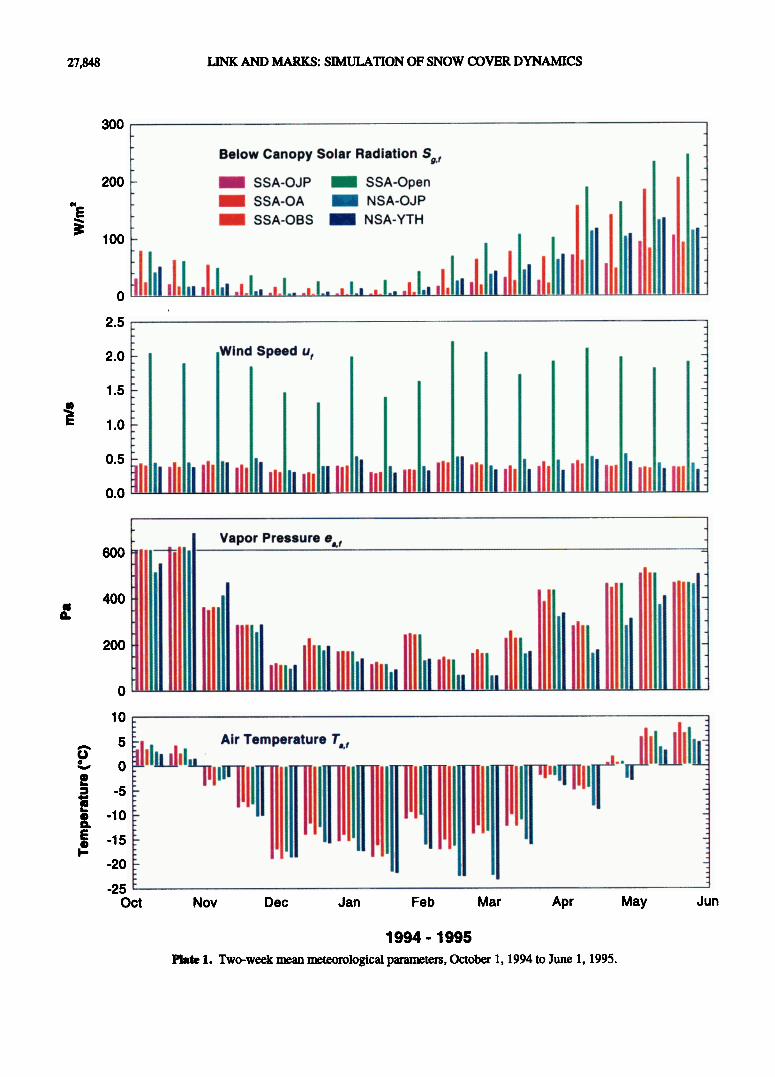
Plate 1 shows mean subcanopy climate parameters for 2- week intervals over the course of the snow season. During the midwinter period (December 1 to February 1) solar radia-
-2
tion values are minimal, with mean values less than 20 W m beneath all canopies. The small mean radiation values result from strong radiation extinction by the canopies at the low solar elevation angles and short days. Mean solar radiation
Table 4. Estimated Precipitation Properties
Dew Point Temperature Precipitation Density, Precipitation Range, øC kg/m 3 State
> 0.5 1000 rain
0.5 to 0.0 200 snow 0.0 to -5.0 100 snow -5.0 to -10.0 75 snow < -10.0 60 snow
27,848 LINK AND MARKS: SIMULATION OF SNOW COVER DYNAMICS
3OO .
.
.
-
200 - .
.
.
.
100 -
2.5 r.
Below Canopy Solar Radiation S;,•
2.0
1.5
1.0
0.5
0.0
600 400
I I
200 I I
0 I
10
Wind Speed u•
il
Vapor Pressure
I I,I
Air Temperature T,,•
!11
ii
!il
II 11'
-5 -
-10 -
-15 -
-20 - .
.
-25 '
II II
Oct Nov Dec Jan Feb Mar Apr May Jun
1994 - 1995
Plate 1. Two-week mean meteorological parameters, October 1, 1994 to June 1, 1995.
LINK AND MARKS: SIMULATION OF SNOW COVER DYNAMICS 27,849
beneath all canopies increases during the late winter and early spring, as a combined result of increased intensity, transmittance through the canopy at higher Sun angles, and long days. During the period of maximum ablation rates (May), 2-week mean solar radiation values vary from ap-
-2
proximately 90 to 200 W m , between the SSA-OBS and SSA-OA canopies, which represent the most optically dense (OBS) and most optically transparent (OA) cover classes in- vestigated. On average, SSA-OA values are 73% of the SSA-open values, indicating minimal shading by the leafless deciduous canopy.
Above-canopy thermal radiation shows little seasonal -2
variation but varies diurnally by about 50 W m , depending on local meteorological conditions, such as air temperature and degree of cloud cover. During the snow season, below- canopy thermal radiation is enhanced for all canopies by 13.5% on average, relative to above-canopy thermal radia- tion. The mean thermal radiation enhancement does not vary greatly between canopy types, ranging from 11% for the relatively sparse SSA-OA canopy to 16% for the relatively dense SSA-OBS canopy.
Mean differences between canopy and subcanopy air temperatures range from +I.0øC at the SSA-OJP site to -1.1øC at the SSA-OA site. During the spring months, the temperature differences increase in magnitude and can exceed 5øC during the daytime, as a result of increased inci- dent solar radiation. The mean difference between canopy and air temperature at the NSA-OJP site is +0.2 øC.
Mean 2-week subcanopy air temperatures are shown in Plate 1. Mean air temperatures at the SSA-OA and SSA- open sites are 1.8 øC warmer than the mean Ta• at the SSA- OJP site. Mean T•i values at the NSA-OJP and NSA-YTH sites are similar, with a mean difference of +0.3øC, and are on average 2.7øC cooler than the SSA sites.
Mean vapor pressures during the ablation period are below 611 Pa (saturation vapor pressure at 0øC), indicating that vapor gradients will tend to be directed away from the snow surface when the snow cover is actively melting. In such an environment, the snow cover is expected to lose mass and energy by evaporation, thereby cooling the snow cover. Mean vapor pressure differences between sites appear to be
due to air temperature differences between the sites (P!•ate 1). The mean below-canopy wind velocity is 0.4 m s , with
-1
higher mean velocities, ranging up to 2.2 m s occurring at the open site, as a result of greater exposure (Plate 1). Mean wind velocities are relatively stable, exhibiting minor fluc- tuation throughout the snow season.
3.2. Snow Cover Energy and Mass Balance Simulations
SNOBAL was run at a 15 min timestep from October 1, 1994 to June 1, 1995, using canopy-adjusted meteorological data at the OJP, OA, and OBS sites in the SSA and at the OJP and YTH sites in the NSA. SNOBAL was run using above-canopy meteorological data from the SSA-OJP site to approximate conditions at the SSA-open location. Model results were validated using automatic and manual snow depth measurements from the various canopy covers. Results from the seasonal snow cover simulations serve to
quantitatively describe the processes of snow cover mass and energy transfer beneath various canopies in the boreal envi- ronment for an entire snow season and to provide a means to
evaluate the performance of the canopy adjustment algo- rithms.
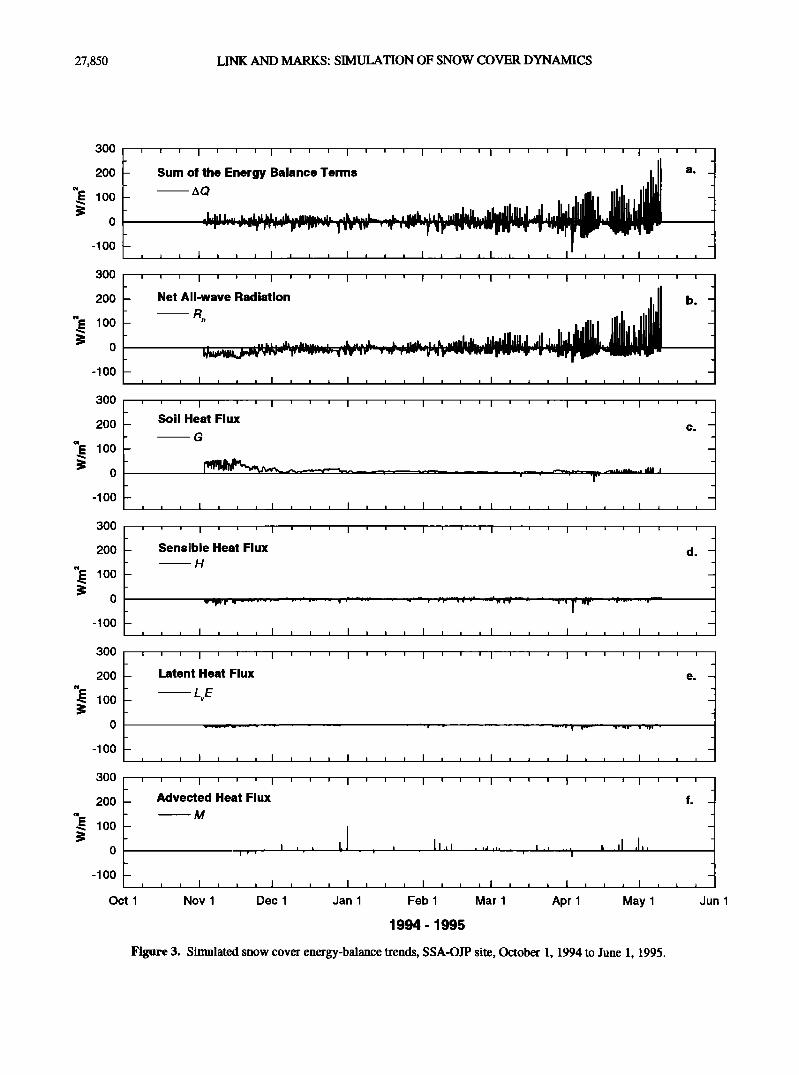
3.2.1. Snow cover energy balance. Figures 3a-3f present the 15 min average values for AQ, R n, G, H, LyE, and M at the SSA-OJP site to illustrate snow cover energy flux trends be- neath a moderately transmissive canopy. Plate 2 presents the relative contribution of the net all-wave radiation (Rn), soil heat (G), and sum of the sensible and latent heat fluxes (H + • to the total snow cover energy flux (AQ) at all subcan- opy sites.
From the deposition of a permanent snow cover in No- vember, through February, the 2-week mean monthly net snow cover energy remains at or near zero for all sites. From late March through complete snow cover ablation in May, the mean net energy is consistently positive and increases steeply at all sites in the SSA. The mean net energy is posi- tive from late April through ablation in the NSA.
The AQ mirrors the net snow cover radiation (Rn), indi- cating the strong radiative control on snow cover energy fluxes (Figures 3a and 3b). The large contribution of radia- tive fluxes, ranging from 66% to 92% of the net snow cover energy balance is indicated in Plate 2. The primary differ- ence between sites is in the timing and variation of R n contri- bution, which occurs earlier, and is larger in the open and within transmissive canopies, relative to the optically dense canopies.
Soil heat flux (G) comprises from 46% to 50% of the energy balance early in the snow season, while the soil re- leases energy as it cools and freezes (Figure 3c). Although the relative contribution of G to the total energy flux is large early in the season, R n, H, and L• balance the energy gain, resulting in a very small mean AQ, as indicated in Plate 2.
The net turbulent energy transfer (H + • on average comprises 11% of the energy balance at all forested sites (Plate 2). Sensible heat fluxes (H) oscillate in direction during the snow season, whereas latent heat fluxes (• tend to be negative throughout the season, indicating evaporative cooling of the snow cover (Figures 3d and 3e). The mean contribution of turbulent fluxes to the net energy fluxes at the SSA-open site is 25%, largely as a result of higher wind ve- locities.
Advective energy transfer tends to be sporadic and posi- tive during the winter months, as warmer snow is deposited on top of a cold snowpack during occasional precipitation events (Figure 3f). During spring meltout, small positive ad- vective fluxes occur during several rain events. Advected energy fluxes are less than 2% of the net energy balance when averaged over 2-week periods and are therefore not evident in Plate 2.
3.2.2. Snow cover mass balance. When snow is present, SNOBAL calculates runoff as the sum of melt and rain, less
the available liquid-holding capacity of the snow cover. Early in the spring, several minor melt events that do not ex- ceed the water-holding capacity of the snow cover occur at all sites. The production of runoff at all sites follows a dis- tinctly diurnal trend driven by net radiation variability, with irregular runoff spikes resulting from isolated cold (~0øC) rain events.
At the forested SSA sites, melt with associated runoff pro- duction starts on April 11 and continues over a period of 3 weeks, with all sites exhibiting complete ablation by May 7.
27,850 LINK AND MARKS: SIM•ATION OF SNOW COVER DYNAMICS
300
2OO
100 0
-100
300
2OO
100 0
-lOO
300
2OO
100
0
-lOO
300
2OO
lOO
o
-lOO
300
2OO
100
0
-IO0
300
2OO
100 0
-lOO
0cl
' ' ' I I I I ! ' ' ' I ' ' ' I ' ' ' I ' ' ' I ' ' ' I ' ' ' _ _
- Sum of the Energy Balance Terms a. _ _ _
- lll,,l..,,lJ_,,,,,IJ, J. - _ '•-"...,.T r•,--- 1,...,,...- • •r •,' ,-.•. ,• -r • •,.•.,•,, Ir•r.• .-r ,•]• ?-,i _ -- _
, , i I , , , I i i , I i ] , I , i , I i , , I , i , I [ ,
' ' ' I ' ' ' I ' ' ' I ' ' ' I ' ' ' I ' ' ' I ' ' ' I ' ' ' _ _
- Net All-wave Radiation • b. - - . _,., ..... ,.... .......... ..... .... - •k•,•N'•'•••n•'•'•'"•••••r-••• I l• •' _
, , , I , , , I , , i I , • i I , i , i , , , I , i , I , , ,
' ' ' I ' ' ' I ' ' ' I ' ' ' I ' ' ' I ' ' ' I ' ' ' I ' ' ' _
Soil Heat Flux C. --
G -
i [ I I , • , I • i ] I I I I I i , I I [ • i I [ [ , I i ,
' ' ' I ' ' ' I ' ' ' I ' ' ' I ' ' ' I ' ' ' I ' ' ' I '
Sensible Heat Flux d. -
• , i I , , , I , I I I I [ , I I [ , I , [ [ I , [ [ I [
' ' ' I ' ' ' I ' ' ' I ' ' ' I ' ' ' I ' ' ' I ' ' ' I '
Latent Heat Flux
i [ I I , ] i I i i , I , i , I , i i I , i i I I I , I
' ' ' I ' ' ' I ' ' ' I ' ' ' I ' ' ' I ' ' ' I ' ' ' I '
Advected Heat Flux
•M
i r , - ; .- , . ]
, i , I i i , I • I • I , I ] I , , , I • i , I , [ i I ,
Nov 1 Dec 1 Jan 1 Feb 1 Mar 1 Apr 1 May 1
i i
_
e. - _
_
_
_
_
I I
i I
_
f. -- _
_
_
I I
Jun 1
1994 - 1995
Figure 3. Simulated snow cover energy-balance trends, SSA-OJP site, October 1, 1994 to June 1, 1995.

LINK AND MARKS: SIMULATION OF SNOW COVER DYNAMICS 27,851
an
•: 20
o
• 20
Cn
40
•-•-' • 20
0
o• d I,=,, =
1,1.1 40 e E
• •: 20
en
•: 20
I ' I ' I ' i ' I • I
SSA - OJP R
H+LE
G
' I ' I
, I , I i I ,• I , I , ! , I , I
' I ' I ' I ' I ' ! ' I ' I [ I
SSA - OA
SSA - OBS
SSA - Open
NSA - OJP
fm
40 -
o
Oct I
' I ' I ' I ' I ' I ' I ' I '
NSA- YTH
I , I , I , I , I , 1 , I
Nov I Dec 1 Jan I Feb I Mar 1 Apr 1 May I Jun I
1994 - 1995
Plate 2. Two-week mean snow cover net energy fluxes, indicating the relative contribution of the dominant flux components.
27,852 LINK AND MARKS: SIMULATION OF SNOW COVER DYNAMICS
Ablation is advanced at the open site by approximately two weeks, relative to the forested locations. Maximum sus- tained melt rates beneath the aspen canopy exceeded 1 mm h 'l, whereas maximum sustained melt rates beneath the OJP
h -1 and OBS canopies approached 0.7 mm . The variation in melt rates, coupled with a larger snowpack beneath the OA canopy, resulted in synchronous complete ablation observed both with the model results and with empirical measure- ments.
The onset of seasonal ablation at the NSA sites also
occurs on April 11. Snowpack masses are very similar at both the NSA-OJP and the SSA-OJP sites; however, slower melt rates in the NSA-OJP result in complete ablation 2-3 days later than at the SSA-OJP site. Melt rates at the NSA- YTH site are comparable to the NSA-OJP site; however, a substantially larger snowpack results in an extended ablation period, with complete ablation occurring almost 1 week after the NSA-OJP.
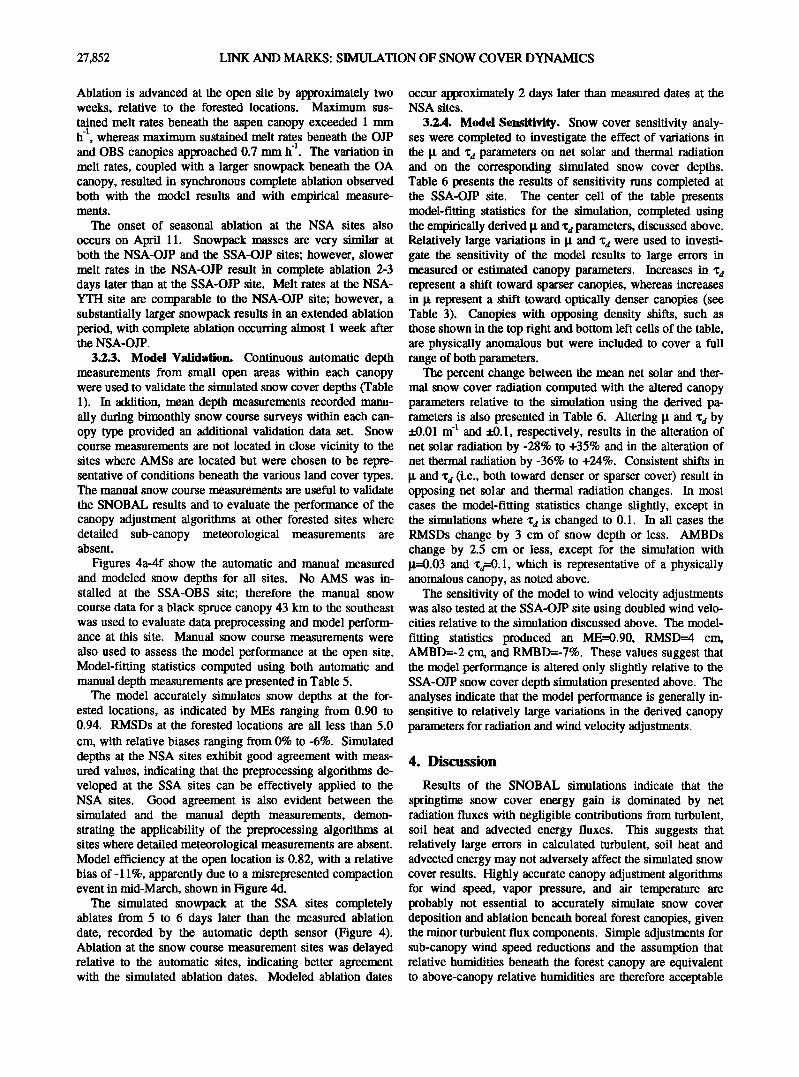
3.2.3. Modal Validation. Continuous automatic depth measurements from small open areas within each canopy were used'to validate the simulated snow cover depths (Table 1). In addition, mean depth measurements recorded manu- ally during bimonthly snow course surveys within each can- opy type provided an additional validation data set. Snow course measurements are not located in close vicinity to the sites where AMSs are located but were chosen to be repre- sentative of conditions beneath the various land cover types. The manual snow course measurements are useful to validate
the SNOBAL results and to evaluate the t•erformance of the
canopy adjustment algorithms at other forested sites where detailed sub-canopy meteorological measurements are absent.
Figures 4a-4f show the automatic and manual measured and modeled snow depths for all sites. No AMS was in- stalled at the SSA-OBS site; therefore the manual snow course data for a black spruce canopy 43 km to the southeast was used to evaluate data preprocessing and model perform- ance at this site. Manual snow course measurements were
also used to assess the model performance at the open site. Model-fitting statistics computed using both automatic and manual depth measurements are presented in Table 5.
The model accurately simulates snow depths at the for- ested locations, as indicated by MEs ranging from 0.90 to 0.94. RMSDs at the forested locations are all less than 5.0
cm, with relative biases ranging from 0% to -6%. Simulated depths at the NSA sites exhibit good agreement with meas- ured values, indicating that the preprocessing algorithms de- veloped at the SSA sites can be effectively applied to the NSA sites. Good agreement is also evident between the simulated and the manual depth measurements, demon- strating the applicability of the preprocessing algorithms at sites where detailed meteorological measurements are absent. Model efficiency at the open location is 0.82, with a relative bias of- 11%, apparently due to a misrepresented compaction event in mid-March, shown in Figure 4d.
The simulated snowpack at the SSA sites completely ablates from 5 to 6 days later than the measured ablation date, recorded by the automatic depth sensor (Figure 4). Ablation at the snow course measurement sites was delayed relative to the automatic sites, indicating better agreement with the simulated ablation dates. Modeled ablation dates
occur approximately 2 days later than measured dates at the NSA sites.
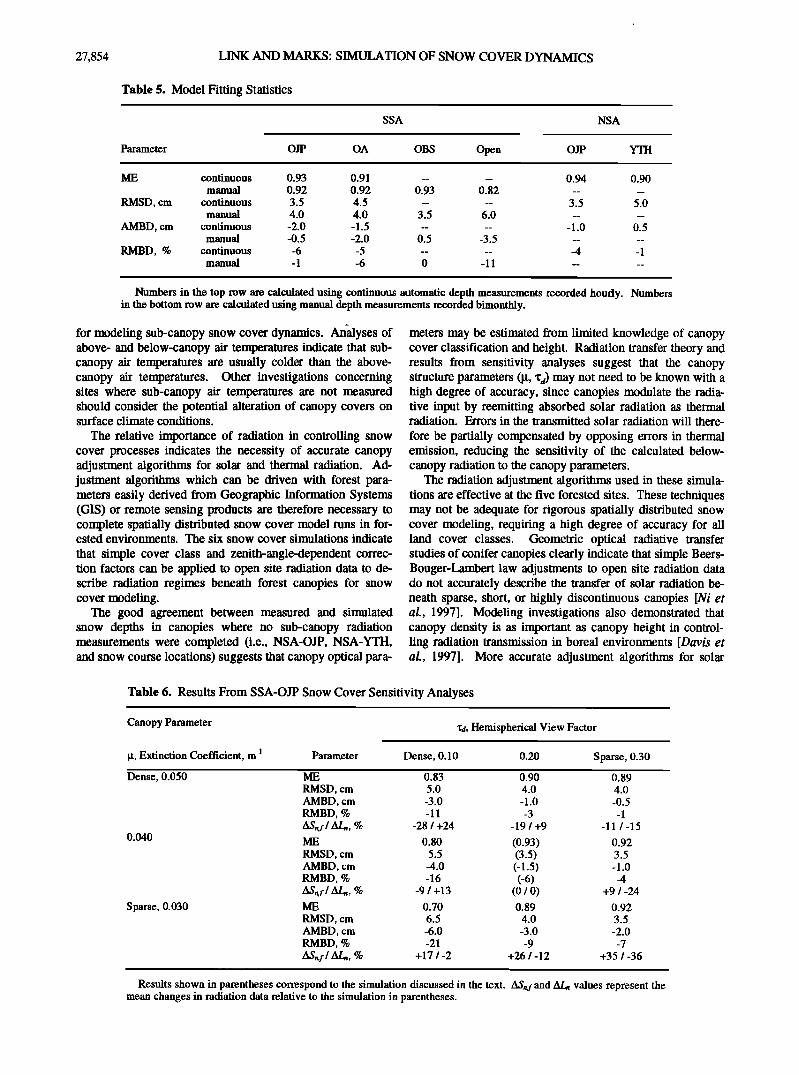
3.2.4. Modal Sensitivity. Snow cover sensitivity analy- ses were completed to investigate the effect of variations in the !,t and 'ca parameters on net solar and thermal radiation and on the corresponding simulated snow cover depths. Table 6 presents the results of sensitivity runs completed at the SSA-OJP site. The center cell of the table presents model-fitting statistics for the simulation, completed using the empirically derived !,t and 'c a parameters, discussed above. Relatively large variations in !,t and 'c a were used to investi- gate the sensitivity of the model results to large errors in measured or estimated canopy parameters. Increases in 'c a represent a shift toward sparser canopies, whereas increases in !,t represent a shift toward optically denser canopies (see Table 3). Canopies with opposing density shifts, such as those shown in the top right and bottom left cells of the table, are physically anomalous but were included to cover a full range of both parameters.
The percent change between the mean net solar and ther- mal snow cover radiation computed with the altered canopy parameters relative to the simulation using the derived pa- rameters is also presented in Table 6. Altering gt and 'ca by _+0.01 m 4 and _+0.1, respectively, results in the alteration of net solar radiation by -28% to +35% and in the alteration of net thermal radiation by -36% to +24%. Consistent shifts in !,t and 'ca (i.e., both toward denser or sparser cover) result in opposing net solar and thermal radiation changes. In most cases the model-fitting statistics change slightly, except in the simulations where 'ca is changed to 0.1. In all cases the RMSDs change by 3 cm of snow depth or less. AMBDs change by 2.5 cm or less, except for the simulation with !.t=0.03 and 'ca=0.1, which is representative of a physically anomalous canopy, as noted above.
The sensitivity of the model to wind velocity adjustments was also tested at the SSA-OJP site using doubled wind velo- cities relative to the simulation discussed above. The model-
fitting statistics produced an ME=0.90, RMSD=4 cm, AMBD=-2 cm, and RMBD=-7%. These values suggest that the model performance is altered only slightly relative to the SSA-OJP snow cover depth simulation presented above. The analyses indicate that the model performance is generally in- sensitive to relatively large variations in the derived canopy parameters for radiation and wind velocity adjustments.
4. Discussion
Results of the SNOBAL simulations indicate that the
springtime snow cover energy gain is dominated by net radiation fluxes with negligible contributions from turbulent, soil heat and advected energy fluxes. This suggests that relatively large errors in calculated turbulent, soil heat and advected energy may not adversely affect the simulated snow cover results. Highly accurate canopy adjustment algorithms for wind speed, vapor pressure, and air temperature are probably not essential to accurately simulate snow cover deposition and ablation beneath boreal forest canopies, given the minor turbulent flux components. Simple adjustments for sub-canopy wind speed reductions and the assumption that relative humidities beneath the forest canopy are equivalent to above-canopy relative humidities are therefore acceptable
LINK AND MARKS: SIMULATION OF SNOW COVER DYNAMICS 27,853
60
o 20
' ' I ' ' ' I ' ' ' I ' ' ' I ' ' ' I ' ' ' I ' ' ' I ' ' '
Modeled z. • Measured z, (automatic) SSA - OJP
ß Measured z,
i i t. i i
60
E o 40
a. 20
' ' ' I ' ' ' I ' ' ' I ' ' ' I ' ' ' i ' ' ' I ' ' ' I ' ' '
SSA-OA
60
o 40
• 2O
' ' ' I ' ' ' I ' ' ' I ' ' ' I ' ' ' I ' ' ' I ' ' ' I ' ' '
60
ß 20
' ' ' ! ' ' ' I ' ' ' I ' ' ' I ' ' ' I ' ' ' I ' ' ' I ' ' ' _
SSA - open
ß • '-.:-.. .. ß . ß ß
_ :. •... .... .'k..... .... '..". -- ..'•...' '-.. ....... ; --. . .- .... ',
- :'--• :" "-"' d _ : -- ..
ß
0 , , • I: , , , I , , , I • , , I , , , I . , , , I , , ß ,._ I , ,
A 60 E
.c: 40
r• 20
cl 20
0
Oct 1
' ' ' i ' ' ' I ' ' ' I ' ' ' I ' ' ' I ' ' ' I ' ' ' I ' ' '
........... . NSA- YTH
! '-. fl Nov I Dec 1 Jan 1 Feb 1 Mar 1 Apr 1 May 1 Jun 1
1994 - 1995
Figure 4. Measured and simulated snow depths at the SSA-OJP, SSA-OA, SSA-OBS, SSA-open, NSA- OJP, and NSA-YTH sites, October 1, 1994 to June 1, 1995.
27,854 LINK AND MARKS: SIMULATION OF SNOW COVER DYNAMICS
Table 5. Model Fitting Statistics
SSA NSA
Parameter OJP OA OBS Open OJP YTI-I
ME continuous 0.93 0.91 .... 0.94 0.90 manual 0.92 0.92 0.93 0.82 ....
RMSD, cm continuous 3.5 4.5 .... 3.5 5.0 manual 4.0 4.0 3.5 6.0 ....
AMBD, cm continuous -2.0 -1.5 ..... 1.0 0.5 manual -0.5 -2.0 0.5 -3.5 ....
RMBD, % continuous -6 -5 ..... 4 -1 manual - 1 -6 0 - 11 ....
Numbers in the top row are calculated using continuous automatic depth measurements recorded hourly. Numbers in the bottom row are calculated using manual depth measurements recorded bimonthly.
for modeling sub-canopy snow cover dynamics. Analyses of above- and below-canopy air temperatures indicate that sub- canopy air temperatures are usually colder than the above- canopy air temperatures. Other investigations concerning sites where sub-canopy air temperatures are not measured should consider the potential alteration of canopy covers on surface climate conditions.
The relative importance of radiation in controlling snow cover processes indicates the necessity of accurate canopy adjustment algorithms for solar and therural radiation. Ad- justment algorithms which can be driven with forest para- meters easily derived from Geographic Information Systems (GIS) or remote sensing products are therefore necessary to complete spatially distributed snow cover model runs in for- ested environments. The six snow cover simulations indicate
that simple cover class and zenith-angle-dependent correc- tion factors can be applied to open site radiation data to de- scribe radiation regimes beneath forest canopies for snow cover modeling.
The good agreement between measured and simulated snow depths in canopies where no sub-canopy radiation measurements were completed (i.e., NSA-OJP, NSA-YTH, and snow course locations) suggests that canopy optical para-
meters may be estimated from limited knowledge of canopy cover classification and height. Radiation transfer theory and results from sensitivity analyses suggest that the canopy structure parameters (It, 'c a) may not need to be known with a high degree of accuracy, since canopies modulate the radia- tive input by reemitting absorbed solar radiation as therural radiation. Errors in the transmitted solar radiation will there-
fore be partially compensated by opposing errors in thermal emission, reducing the sensitivity of the calculated below- canopy radiation to the canopy parameters.
The radiation adjustment algorithms used in these simula- tions are effective at the five forested sites. These techniques may not be adequate for rigorous spatially distributed snow cover modeling, requiring a high degree of accuracy for all land cover classes. Geometric optical radiative transfer studies of conifer canopies clearly indicate that simple Beers- Bouger-Lambert law adjustments to open site radiation data do not accurately describe the transfer of solar radiation be- neath sparse, short, or highly discontinuous canopies [Ni et al., 1997]. Modeling investigations also demonstrated that canopy density is as important as canopy height in control- ling radiation transmission in boreal environments [Davis et al., 1997]. More accurate adjustment algorithms for solar
Table 6. Results From SSA-OJP Snow Cover Sensitivity Analyses
Canopy Parameter
Extinction Coefficient, m -1
xa, Hemispherical View Factor
Parameter Dense, 0.10 0.20 Sparse, 0.30
Dense, 0.050 ME 0.83 0.90 0.89 RMSD, cm 5.0 4.0 4.0 AMBD, cm -3.0 -1.0 -0.5 RMBD, % -11 -3 -1 AS,•r/ALn, % -28 / +24 -19 / +9 -11 /-15
0.040 ME 0.80 (0.93) 0.92 RMSD, cm 5.5 (3.5) 3.5 AMBD, cm -4.0 (- 1.5) - 1.0 RMBD, % - 16 (-6) -4 AS,•rl ALn, % -9 / +13 (0 / 0) +9 /-24
Sparse, 0.030 ME 0.70 0.89 0.92 RMSD, cm 6.5 4.0 3.5 AMBD, cm -6.0 -3.0 -2.0 RMBD, % -21 -9 -7 AS, if/AL•, % +17/-2 +26/-12 +35/-36
Results shown in parentheses correspond to the simulation discussed in the text. AS, ff and ALn values represent the mean changes in radiation data relative to the simulation in parentheses.
LINK AND MARKS: SIMULATION OF SNOW COVER DYNAMICS 27,855
racUation should therefore be ctriven by a minimum of species type, height, and stem density to accurately describe radia- tion beneath highly variable canopy types. Application of the general techniques developed for radiation adjustments in forests by Price [1997] will provide more accurate dis- tributed radiation fields beneath a wide range of canopy structures.
The adjustments for solar radiation include a series of simplifying assumptions that may be corrected or improved. The adjustments used in these investigations assumed the canopy to be an isotropic absorber, with gt constant at all Sun angles. Empirical and modeling studies indicate that a greater proportion of radiation is transmitted at relatively low Sun angles than would be predicted if the canopy were to act as an isotropic absorber, due to the horizontal orientation of the branch elements [Ni et al., 1997; Pomeroy and Dion, 1996]. The adjustments used in these simulations are there- fore expected to underestimate sub-canopy solar radiation at low solar elevation angles. Validation data suggest that this underestimation may not significantly affect the simulated snow cover dynamics at the five forested sites. This is be- cause low energy intensity and high snow albedos at low Sun angles render canopy transmission errors insignificant. Con- versely, the canopy transmittance parameters were derived from midwinter measurements and may inherently account for increased transmittance at low Sun angles.
Snow cover radiative energy transfer in forested systems is also affected by the spectral properties of the incoming radiation and canopy elements. Conifer canopies strongly absorb radiation in the visible portion of the electromagnetic spectrum, while preferentially reflecting and transmitting near-infrared (NIR) radiation. NIR radiation may also be en- hanced at low solar elevation angles typical of the high- latitude boreal environment. The near-infrared snow cover albedo is less than the visible snow cover albedo. The ad-
justment algorithms do not account for the spectral alteration and increased absorption of radiant energy in the near- infrared portion of the electromagnetic spectrum. The omission of canopy spectral properties in the adjustment algorithms may therefore result in the underestimation of snow cover net solar radiation.
The simulated snow cover at the four continuously monitored sites completely ablates from 1 to 6 days later than the observed ablation dates, consistent with other snow cover simulations at the SSA-OJP site [Hardy et al., 1997]. The discrepancies in the results presented here may be due to in- accuracies in the canopy adjustment algorithms or estimated debris deposition functions. The snow cover albedo calcula- tions also neglect the albedo decrease resulting from the solar radiation penetration of very shallow snow covers, which may delay simulated melt. The calculation of turbulent energy exchange assumes a continuous snow cover, which may not be present prior to complete ablation at a given point. Violation of this assumption is likely to slow the simulated snowmelt, due to the inability of the turbulent transfer routines to simulate small scale-advection of warm,
relatively humid air masses from patches of bare ground [Shook and Gray, 1997].
Ablation dates for the three forested SSA sites were very similar despite differing canopy structures. The differences between sites are reduced due to a greater quantity of SWE and taller canopy at the OA site, and a relatively short OBS
canopy, which partially offsets the lower optical transmis- sivity of the denser canopy. The northern and southern OJP sites also ablate at approximately the same time, apparently due to shorter canopy heights in the NSA, which permit greater transmittance of solar radiation relative to the taller SSA-OJP canopy. Complete ablation is delayed at the NSA- YTH site, despite larger canopy transmissivity values due to greater amounts of SWE deposited at this site. Comparisons between the various sites and canopy covers illustrate how both depositional patterns and variations in canopy structures interact to control the rate and volume of meltwater delivery to a given site.
The dominance of the radiative energy components of the snow cover energy balance beneath forest canopies illustrates the importance of high-quality above- and below-canopy radiation measurements, both to develop quantitative descrip- tions of forest canopies and to drive energy balance snow cover models for hydrological analyses. To fully characterize the radiative transfer processes within forest canopies, detailed above-canopy global solar, diffuse solar, and thermal measurements should be taken over a minimum
of one annual cycle. These measurements should be coupled with below-canopy global and thermal radiation measurements at several ames during the year to analyze transfer processes at a full range of Sun angles and canopy conditions. The addition of forest element (e.g., canopy, branch, trunk) surface temperatures can provide valuable in- formation regarding the thermal radiative characteristics of canopies. Detailed radiation measurements within and above a variety of canopy types, as in the BOREAS investigation, yield valuable information, which improves the understand- ing of energy transfer processes for hydrologic investigations and assists in the analysis of the potential effects of changing land cover patterns.
5. Conclusions
The modeling results indicate that where high-quality below-canopy radiation data exist, simple canopy adjustment algorithms can be developed and applied to open site or above-canopy meteorological data to drive snow cover energy balance models. These results also demonstrate the effectiveness of the algorithms within a wide variety of can- opy types, ranging from the highly transmissive OA canopy to the optically dense OBS canopy, by accurately repre- senting snowpack development and both the timing and the rate of seasonal melt. The relative simplicity of the algo- rithms permits these techniques to be applied for spatially distributed snow cover modeling, as demonstrated by Link and Marks [1999]. The canopy adjustments do not explicitly consider individual canopy elements and may not be so effective for other land covers with significantly different structures. Canopy adjustment algorithms for rigorous spa- tially distributed snow cover simulations would therefore benefit from the inclusion of explicit parameterizations for tree species type, height, dimension, and stem density rela- tionships while operating within a framework of commonly available spatial data products.
The results suggest that snow cover ablation in the boreal forest may be more sensitive to shifts in land cover patterns, which strongly affect snow cover radiative fluxes. In gen- eral, land cover changes toward more open and deciduous
27,856 LINK AND MARKS: SIMULATION OF SNOW COVER DYNAMICS
canopies will increase de rate of snowmelt delivery and cause earlier complete ablation. Predicted climate shifts toward drier conditions may similarly cause earlier complete ablation, due to reduced total snow cover and sunnier condi- tions. Earlier snow cover ablation dates will consequently advance and extend de seasonal warming and drying of de boreal regions. Hydrologic and energy-balance studies of de boreal regions must •erefore consider expected changes in bo• land use and snow cover depositional patterns, due to de strong role each exerts in controlling seasonal changes in de surface energy balance of a region.
Notation
G
AMBD
AMS
BOREAS
IFC
ME
NIR
NSA
heat transfer by conduction and diffusion between snow cover and soil, W m -2. sensible heat flux, W m '2. subcanopy •ermal radiation, W m -2. above-canopy •ermal radiation, W m -2. latent heat flux, W m '2. heat transfer by advection, W m -2. change in snow cover energy, W m '2. net all-wave radiation, W m -•. direct solar radiation, W m -2. subcanopy direct solar radiation, W m -•'. above-canopy direct solar radiation, W m '2. diffuse solar radiation, W m '2. subcanopy diffuse solar radiation, W m '•. above-canopy diffuse solar radiation, W m -•. global solar radiation, W m -•. subcanopy global solar radiation, W m '2. above-canopy global solar radiation, W m '•. snow cover net solar radiation, W m -•. subcanopy snow cover net solar radiation, W m -•. air temperature, K or øC. subcanopy air temperature, K or øC. canopy temperature, K or øC. soil temperature, K or øC. vapor pressure of de air, Pa. vegetation canopy height, m. relative humidity, dimensionless. subcanopy wind speed, m s 't. above-canopy wind speed, m s 4. direct albedo, dimensionless. diffuse albedo, dimensionless.
near-infrared (0.7-2.8 Bin) albedo, dimensionless. visible (0.28-0.7 gm) albedo, dimensionless. canopy surface emissivity, dimensionless. canopy optical extinction coefficient, m -•. solar zeni• angle, degrees. Stefan-Boltzman constant, 5.6697x 10 -s W m -2 K 4. canopy optical transmissivity for diffuse radiation, dimensionless.
canopy optical transmissivity for •ermal radiation, dimensionless. absolute mean bias error.
automated meteorological station. Boreal Ecosystem-Atmosphere Study. intensive field campaign. model efficiency. near infrared.
northem study area.
OA old aspen. OBS old black spruce. OJP old jack pine.
RMBD relative mean bias error.
RMSD root mean square difference. SRC Saskatchewan Research Council.
SSA southern study area. SWE snow water equivalent. YTH mixed spruce/poplar.
Acknowledgments. Meteorological data were provided by the diligent work of many people within the Saskatchewan Research Council. Special thanks go to the observers for their assistance with this project. Subcanopy radiation, wind, and temperature measurements were collected by Janet P. Hardy and Robert E. Davis of the Cold Regions Research and Engineering Laboratory (CRREL). The snow course data in the SSA were collected by the study area manager Mary Dalman, assisted by Vivian Heap. The NSA snow courses were carried out by AF_3 weather specialist Bill Palmer, assisted by Martha Evaluardjuk. The authors also would like to thank Mike Unsworth, Julia Jones, Gordon Grant, Peter Clark, James Domingo, and two anonymous reviewers for their comments and suggestions in the preparation of this manuscript. Funding for this research was provided by NASA, (grant NAG5-2301, reference 2207-BOREAS-U107). Office and computing facilities were provided by the U.S. Environmental Protection Agency, Western Ecology Division.
References
Berris, S. N., and R. D. Hart, Comparative snow accumulation and melt during rainfall in forested and clear-cut plots in the western Cascades of Oregon, Water Resour. Res., 23, 135-142, 1987.
Bonan, G. B., D. Pollard, and S. L. Thompson, Effects of boreal forest vegetation on global climate, Nature, 359, 716-718, 1992.
Colbeck, S.C., E. A. Anderson, V. C. Bissel, A. G. Crook, D. H. Male, C. W. Slaughter, and D. R. Wiesnet, Snow accumulation, distribution, melt, and runoff, Eos Trans. AGU, 60, 465-474, 1979.
Davis, R. E., J.P. Hardy, W. Ni, C. Woodcock, J. C. McKenzie, R. Jordan, and X. Li, Variation of snow cover ablation in the boreal forest: A sensitivity study on the effects of conifer canopy, J. Geophys. Res., 102, 29,389-29,395, 1997.
Golding, D. L., and R. H. Swanson, Snow distribution patterns in clearings and adjacent forest, Water Resour. Res., 22, 1931-1942, 1986.
Hardy, J.P., R. E. Davis, R. Jordan, X. Li, C. Woodcock, W. Ni, and J. C. McKenzie, Snow ablation modeling at the stand scale in a boreal jack pine forest, J. Geophys. Res., 102, 29,397-29,405, 1997.
Lafleur, P.M., and P. Adams, The effect of subarctic woodland vegetation on the radiation balance of a melting snow cover, Arch. Meteorol. Geophys. Bioclimatol., $er. A, 34, 297-310, 1986.
Link, T. E., and D. Marks, Distributed simulation of snowcover mass- and energy-balance in the boreal forest, Hydrol. Proc., in press, 1999.
Lundberg, A., and S. Halldin, Evaporation of intercepted snow: Analysis of governing factors, Water Resour. Res., 30, 2587- 2598, 1994.
Male, D. H., and R. J. Granger, Snow surface energy exchange, Water Resour. Res., 17, 609-627, 1981.
Marks, D., Climate, energy exchange, and snowmelt in Emerald Lake Watershed, Sierra Nevada, 158 pp., Ph.D. dissertation, Univ. of Calif., Santa Barbara, 1988.
Marks, D., and J. Dozier, Climate and energy exchange at the snow surface in the alpine region of the Sierra Nevada, 2, Snow cover energy balance, Water Resour. Res., 28, 3043-3054, 1992.
Marks, D., J. Dozier, and R. E. Davis, Climate and energy exchange at the snow surface in the alpine region of the Sierra Nevada, 1, Meteorological measurements and monitoring, Water Resour. Res., 28, 3029-3042, 1992.
LINK AND MARKS: SIMULATION OF SNOW COVER DYNAMICS 27,857
Marks, D., J. Domingo, and J. Frew, Software tools for hydro- climatic modeling and analysis: Image Processing Workbench, ARS - USGS Version 2.0, Electron. Doc. http://quercus.ars.pn.- usbr. gov/ipw/www/intro.html, ARS Tech. Rep., USDA Agric. Res. Serv., Boise, Idaho, 1998a.
Marks, D., J. Kimball, D. Tingey, and T. Link, The sensitivity of snowmelt processes to climate conditions and forest cover during rain-on-snow: A case study of the 1996 Pacific Northwest flood, Hydrol. Proc., 12, 1569-1588, 1998b.
Marks, D., J. Domingo, D. Susong, T. Link, and D. Garen, A spatially distributed energy balance snowmelt model for application in mountain basins, Hydrol. Proc., in press, 1999.
Marshall, S. E., and S. G. Warren, Parameterization of snow albedo for climate models, in Large Scale Effects of Seasonal Snow Cover, edited by B. E. Goodison, R. G. Barry, and J. Dozier, IAHS-AIHS Pub. 166, pp. 44-50, Int. Assoc. of Hydrol. Sci., Wallingford, England, 1987.
Monteith, J. L., and M. H. Unsworth, Principles of Environmental Physics, 2nd ed., 291 pp., Edward Arnold, London, 1990.
Ni, W., X. Li, C. E. Woodcock, J. L. Roujean, and R. E. Davis, Transmission of solar radiation in boreal conifer forests:
Measurement and models, J. Geophys. Res., 102, 29,555-29,566, 1997.
Ohta, T., T. Hashimoto, and H. Ishibashi, Energy budget comparison of snowmelt rates in a deciduous forest and an open site, Ann. Glaciol., 18, 53-59, 1993.
Peixoto, J.P., and A. H. Oort, Physics of Climate, 520 pp., Am. Inst. of Phys., New York. 1992.
Pomeroy, J. W., and K. Dion, Winter radiation extinction and reflection in a boreal pine canopy: Measurements and modelling, Hydrol. Proc., 10, 1591-1608, 1996.
Price, A. G., and D. E. Petzold, Surface emissivities in a boreal forest during snowmelt, Arct. Alp. Res., 16, 45-51, 1984.
Price, M. A., A simplified scalable shading model for radiation at the forest floor, M.S. thesis, Oregon State Univ., Corvallis, 1997.
Schlesinger, M. E., and J. F. B. Mitchell, Climate model calculations of the equilibrium climatic response to increased carbon dioxide, Rev. Geophys., 25, 760-798, 1987.
Sellers, P. J., et al., The Boreal Ecosystem-Atmosphere Study (BOREAS): An overview and early results from the 1994 field year, Bull. Am. Meteorol. Soc., 76, 1549-1577, 1995a.
Sellers, P. J., et al. (F_xls.), BOREAS Experiment Plan, in Boreal Ecosystem-Atmosphere Study Experiment Plan, version 3.1, NASA, 1995b.
Sellers, P. J., et al., Modeling the exchanges of energy, water, and carbon between continents and the atmosphere, Science, 275, 502-509, 1997a.
Sellers, P. J., et al., BOREAS in 1997: Experiment overview, scientific results, and future directions, J. Geophys. Res., 102, 28,731-28,769, 1997b.
Shewchuk, S. R., Surface mesonet for BOREAS, J. Geophys. Res., 102, 29,077-29,082, 1997.
Shook, K., and D. M. Gray, Snowmelt resulting from advection, Hydrol. Proc., 11, 1725-1736, 1997.
Tans, P. P., I. Y. Fung, and T. Takahashi, Observational constraints on the global atmospheric CO2 budget, Science, 247, 1431-1438, 1990.
Warren, S. G., and W. J. Wiscombe, A model for the spectral albedo of snow, II, Snow containing atmosperic aerosols, J. Atmos. Sci., 37, 2734-2745, 1980.
Wiscombe, W. J., and S. G. Warren, A model for the spectral albedo of snow, I, Pure snow, J. Atmos. Sci., 37, 2712-2733, 1980.
T. E. Link, Oregon State University, Environmental Sciences Graduate Program, USEPA-NHEERL, 200 SW 35th Street, Corvallis, OR 97333. ([email protected])
D. Marks, USDA Agricultural Research Service, NW Watershed Research Center, 800 Park Blvd., Suite 105, Boise, ID 83712. ([email protected]. gov)
(Received August 9, 1998; revised November 23, 1998; accepted December 15, 1998.)