Embed Size (px)
Citation preview
Point processes in space and time
Data: (s,t) = location (probably in 2D), time of an event
Examples:
Ecology: nest establishment, predation, death of treePlant pathology: infection of individual, deathEconomics: farm consolidation, farm bankrupcyEpidemiology: location, time of diseased individualsAgronomy / soils: when a field planted in corn following cornIn general: where and when events occur
Cressie calls these ’space-time shock point process’ (p 720)
events at specific times and locations
c© Philip M. Dixon (Iowa State Univ.) Spatial Data Analysis - Part 6c Spring 2020 1 / 24
Point processes in space and time
Not same as space-time survival point process
event at a location for an interval of timee.g. presence of tree, infected plantWe’ll focus on shock processes
events at specific locations and times
Multiple ways to think about this
as point process in 3 dimensions (x,y,t)as marked spatial point process (x,y), continuous mark (time)
Many examples from spatial epidemiology, focus on clustering
Is event (disease) near other events?near defined as near in space and near in time
c© Philip M. Dixon (Iowa State Univ.) Spatial Data Analysis - Part 6c Spring 2020 2 / 24
Example: Burkitt’s lymphoma in Uganda
●
●
●
●
●
●
●
●●
●●
●
●
●●
●
●
●
●
●
●
●
●
●●
●
●●
●
●
●●●
●
●
● ●
●● ●
●
●
●
●
●
●
●
●
●
●
●
●
●●
●
●
●●
●
●
●●
●
●
●
●
●
●
●
●
●
● ●
●
●
●
●
●
●
●
●●●
●
●
●
●
● ●
●●
●
●
●
●
●
●
●
●
●
●
●
●
●
●
●
●
●
●
●
●●
●
●
●●
●
●
●
●
●
●
●●
●●
●
●
●
●
●
●
●
●
●
●
●●
●
●●
●
●
●
●
●
●●
●●●
●
●
●
●
●
●
●
●●
●
● ●
●
●
●
●
●●
●
●
●
●
●
●
●
●
●
●
●
●
●
●
●
●
●
●
●
●
●
●
●
●
[413,1485](1485,2558](2558,3630](3630,4703](4703,5775]
c© Philip M. Dixon (Iowa State Univ.) Spatial Data Analysis - Part 6c Spring 2020 3 / 24
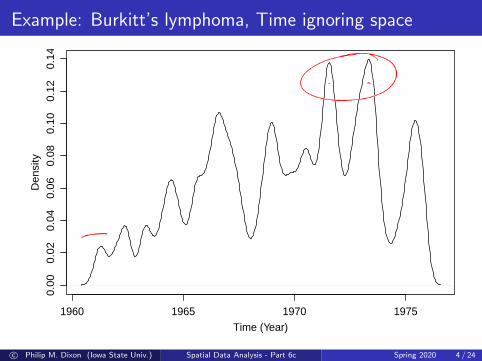
Example: Burkitt’s lymphoma, Time ignoring space
1960 1965 1970 1975
0.00
0.02
0.04
0.06
0.08
0.10
0.12
0.14
Time (Year)
Den
sity
c© Philip M. Dixon (Iowa State Univ.) Spatial Data Analysis - Part 6c Spring 2020 4 / 24

Example: Burkitt’s lymphoma, Space ignoring time
●
●
●
●
●
●
●
●●
●●
●
●
●●
●
●
●
●
●
●
●
●
●●
●
●●
●
●
●●●
●
●
● ●
●● ●
●
●
●
●
●
●
●
●
●
●
●
●
●●
●
●
●●
●
●
●●
●
●
●
●
●
●
●
●
●
● ●
●
●
●
●
●
●
●
●●●
●
●
●
●
● ●
●●
●
●
●
●
●
●
●
●
●
●
●
●
●
●
●
●
●
●
●
●●
●
●
●●
●
●
●
●
●
●
●●
●●
●
●
●
●
●
●
●
●
●
●
●●
●
●●
●
●
●
●
●
●●
●●●
●
●
●
●
●
●
●
●●
●
● ●
●
●
●
●
●●
●
●
●
●
●
●
●
●
●
●
●
●
●
●
●
●
●
●
●
c© Philip M. Dixon (Iowa State Univ.) Spatial Data Analysis - Part 6c Spring 2020 5 / 24
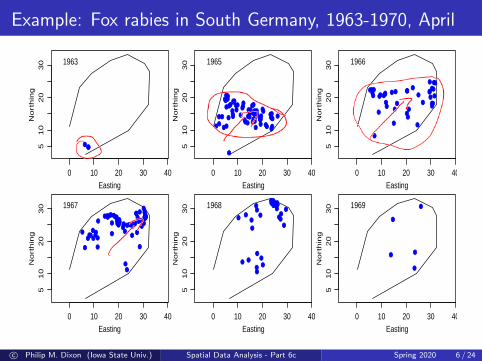
Example: Fox rabies in South Germany, 1963-1970, April
0 10 20 30 40
51
02
03
0
Easting
No
rth
ing
●●●
1963
0 10 20 30 405
10
20
30
EastingN
ort
hin
g
●●
●●
●
●●
●
●
●●●●
●
●
●●
●●●
●●●
●●●
●
●
●
●●
●●●●●
●●●●
●●●●●●●
●
●●●●
●●●●●●●●
●● ●●
●●●●● ●
1965
0 10 20 30 40
51
02
03
0
Easting
No
rth
ing ●●
●●●
●
●
●●●
●
●●
●
●
●
●
●
●
●●
●●
●
●
●
●
●●●●
●
●●●
●
●
●●●
1966
0 10 20 30 40
51
02
03
0
Easting
No
rth
ing ●
●
●●●
●
●●●
●
●
●●●●●●
●
●●●
●●●●●●
●●●●●●
●
●
●
●
●●●
●
●●●●
●
●●●
●
●●
●
●●●
●●●●●●●●●●●1967
0 10 20 30 40
51
02
03
0
Easting
No
rth
ing
●
●
●
●
●
●
●●
●
●●
●
●
●
●●●●●●
●●●●●●●
●
●
●●
●
●1968
0 10 20 30 405
10
20
30
EastingN
ort
hin
g
●
●
●
●
●1969
c© Philip M. Dixon (Iowa State Univ.) Spatial Data Analysis - Part 6c Spring 2020 6 / 24
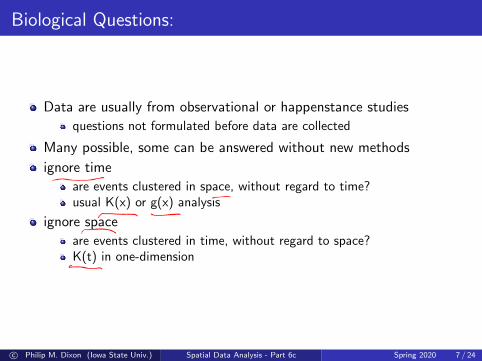
Biological Questions:
Data are usually from observational or happenstance studies
questions not formulated before data are collected
Many possible, some can be answered without new methods
ignore time
are events clustered in space, without regard to time?usual K(x) or g(x) analysis
ignore space
are events clustered in time, without regard to space?K(t) in one-dimension
c© Philip M. Dixon (Iowa State Univ.) Spatial Data Analysis - Part 6c Spring 2020 7 / 24
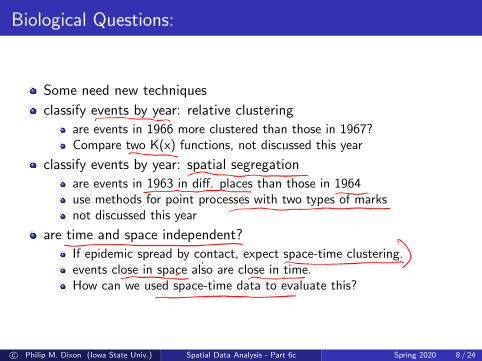
Biological Questions:
Some need new techniques
classify events by year: relative clustering
are events in 1966 more clustered than those in 1967?Compare two K(x) functions, not discussed this year
classify events by year: spatial segregation
are events in 1963 in diff. places than those in 1964use methods for point processes with two types of marksnot discussed this year
are time and space independent?
If epidemic spread by contact, expect space-time clustering.events close in space also are close in time.How can we used space-time data to evaluate this?
c© Philip M. Dixon (Iowa State Univ.) Spatial Data Analysis - Part 6c Spring 2020 8 / 24

Approaches / what I’ll talk about:
models (mostly simple) for space-time point processes
mapping intensity in space x time (3D kernel)
space-time K function
Not discussing classical approaches for space-time clustering
Knox testMantel test = correlation between two distancesscan statistics for disease surveillance
c© Philip M. Dixon (Iowa State Univ.) Spatial Data Analysis - Part 6c Spring 2020 9 / 24

Models:
Space-time Poisson process:
notation: s spatial coordinates, t timeP[event in (s, s + ds)(t, t + dt)] = λ(s, t) ds dtevents are independent
When interested in space-time patterns,
don’t really care about marginal distributions in space or time
focus on interaction, so model: λ(s, t) = f (s)g(t)h(s, t)
f (s): marginal spatial intensityg(t): marginal temporal intensityh(s, t): interaction between space and time
Space-time independence: above with h(s, t) = 1.
λ(s, t) = f (s)g(t)
c© Philip M. Dixon (Iowa State Univ.) Spatial Data Analysis - Part 6c Spring 2020 10 / 24
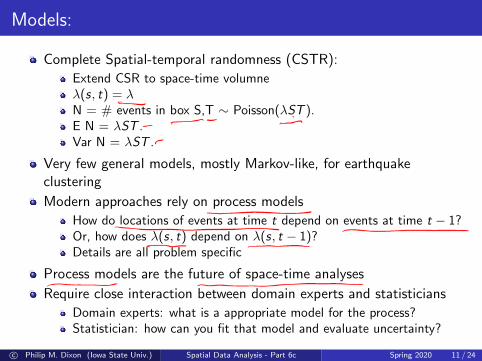
Models:
Complete Spatial-temporal randomness (CSTR):
Extend CSR to space-time volumneλ(s, t) = λN = # events in box S,T ∼ Poisson(λST ).E N = λST .Var N = λST .
Very few general models, mostly Markov-like, for earthquakeclustering
Modern approaches rely on process models
How do locations of events at time t depend on events at time t − 1?Or, how does λ(s, t) depend on λ(s, t − 1)?Details are all problem specific
Process models are the future of space-time analyses
Require close interaction between domain experts and statisticians
Domain experts: what is a appropriate model for the process?Statistician: how can you fit that model and evaluate uncertainty?
c© Philip M. Dixon (Iowa State Univ.) Spatial Data Analysis - Part 6c Spring 2020 11 / 24
Estimating intensity
Data: Locations (space,time) of events
want to estimate λ̂(s, t).
Key question: How smooth is the intensity surface?data are very ‘rough’
shift from 0 (no event) to 1 (event) over short dist.Intensity surface is (probably) not that rough
Very very smooth ⇒ constant intensity
λ̂ = #points/(area*time)if want to produce a map, constant intensity makes a dull map
c© Philip M. Dixon (Iowa State Univ.) Spatial Data Analysis - Part 6c Spring 2020 12 / 24
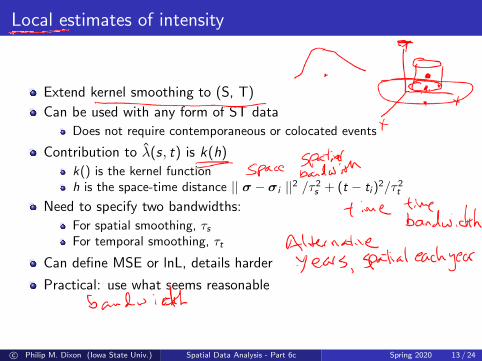
Local estimates of intensity
Extend kernel smoothing to (S, T)
Can be used with any form of ST data
Does not require contemporaneous or colocated events
Contribution to λ̂(s, t) is k(h)
k() is the kernel functionh is the space-time distance || σ − σi ||2 /τ 2s + (t − ti )
2/τ 2t
Need to specify two bandwidths:
For spatial smoothing, τsFor temporal smoothing, τt
Can define MSE or lnL, details harder
Practical: use what seems reasonable
c© Philip M. Dixon (Iowa State Univ.) Spatial Data Analysis - Part 6c Spring 2020 13 / 24
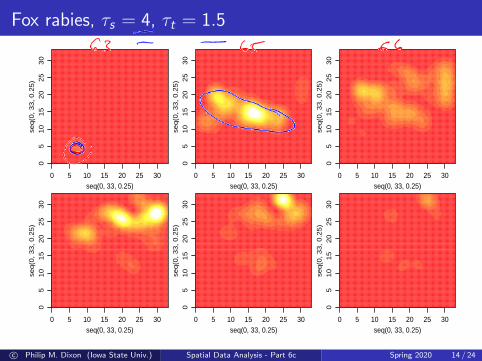
Fox rabies, τs = 4, τt = 1.5
0 5 10 15 20 25 30
05
10
15
20
25
30
seq(0, 33, 0.25)
seq
(0,
33
, 0
.25
)
0 5 10 15 20 25 300
51
01
52
02
53
0seq(0, 33, 0.25)
seq
(0,
33
, 0
.25
)0 5 10 15 20 25 30
05
10
15
20
25
30
seq(0, 33, 0.25)
seq
(0,
33
, 0
.25
)0 5 10 15 20 25 30
05
10
15
20
25
30
seq(0, 33, 0.25)
seq
(0,
33
, 0
.25
)
0 5 10 15 20 25 30
05
10
15
20
25
30
seq(0, 33, 0.25)
seq
(0,
33
, 0
.25
)
0 5 10 15 20 25 300
51
01
52
02
53
0seq(0, 33, 0.25)
seq
(0,
33
, 0
.25
)
c© Philip M. Dixon (Iowa State Univ.) Spatial Data Analysis - Part 6c Spring 2020 14 / 24
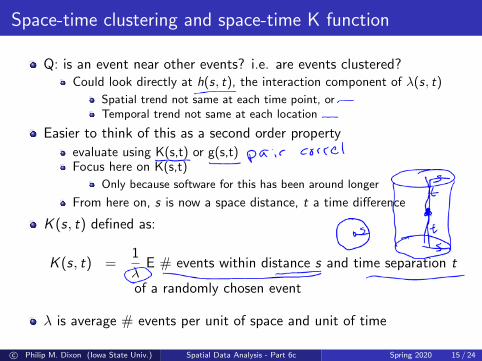
Space-time clustering and space-time K function
Q: is an event near other events? i.e. are events clustered?Could look directly at h(s, t), the interaction component of λ(s, t)
Spatial trend not same at each time point, orTemporal trend not same at each location
Easier to think of this as a second order property
evaluate using K(s,t) or g(s,t)Focus here on K(s,t)
Only because software for this has been around longer
From here on, s is now a space distance, t a time difference
K (s, t) defined as:
K (s, t) =1
λE # events within distance s and time separation t
of a randomly chosen event
λ is average # events per unit of space and unit of time
c© Philip M. Dixon (Iowa State Univ.) Spatial Data Analysis - Part 6c Spring 2020 15 / 24

K(s,t) under CSTR
K (s, t) = (πs2)(2t)
Why 2t? Time is linear, look back and look ahead t units
Estimator:
K̂ (s, t) =| A | TN2
∑i 6=j
wijvij I (dij < s)I (tij < t)
| A | is area of the regionT is the total study timeI() are indicator functions, 1 if true, 0 if notwij and vij are space and time edge corrections
Properties:
K̂ (s, t) approx. unbiased, esp. small s, tVar K̂ (s, t) not constant, increases with s, t
Testing CSTR:
Compare K̂ (s, t) to envelope for data simulated from CSTR.
c© Philip M. Dixon (Iowa State Univ.) Spatial Data Analysis - Part 6c Spring 2020 16 / 24
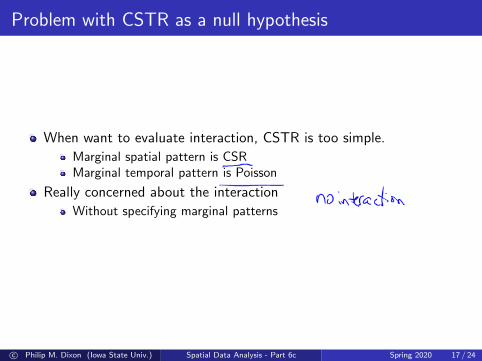
Problem with CSTR as a null hypothesis
When want to evaluate interaction, CSTR is too simple.
Marginal spatial pattern is CSRMarginal temporal pattern is Poisson
Really concerned about the interaction
Without specifying marginal patterns
c© Philip M. Dixon (Iowa State Univ.) Spatial Data Analysis - Part 6c Spring 2020 17 / 24
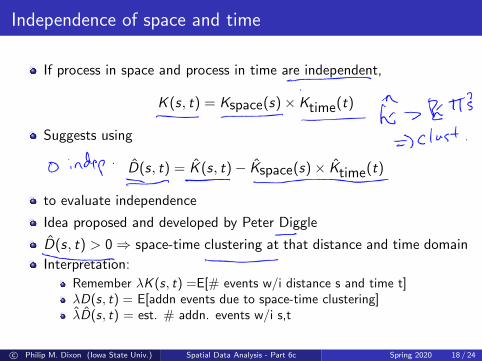
Independence of space and time
If process in space and process in time are independent,
K (s, t) = Kspace(s)× Ktime(t)
Suggests using
D̂(s, t) = K̂ (s, t)− K̂space(s)× K̂time(t)
to evaluate independence
Idea proposed and developed by Peter Diggle
D̂(s, t) > 0⇒ space-time clustering at that distance and time domain
Interpretation:
Remember λK (s, t) =E[# events w/i distance s and time t]λD(s, t) = E[addn events due to space-time clustering]λ̂D̂(s, t) = est. # addn. events w/i s,t
c© Philip M. Dixon (Iowa State Univ.) Spatial Data Analysis - Part 6c Spring 2020 18 / 24
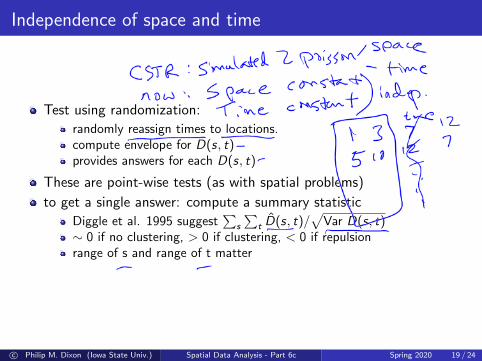
Independence of space and time
Test using randomization:
randomly reassign times to locations.compute envelope for D(s, t)provides answers for each D(s, t)
These are point-wise tests (as with spatial problems)
to get a single answer: compute a summary statistic
Diggle et al. 1995 suggest∑
s
∑t D̂(s, t)/
√Var D(s, t)
∼ 0 if no clustering, > 0 if clustering, < 0 if repulsionrange of s and range of t matter
c© Philip M. Dixon (Iowa State Univ.) Spatial Data Analysis - Part 6c Spring 2020 19 / 24
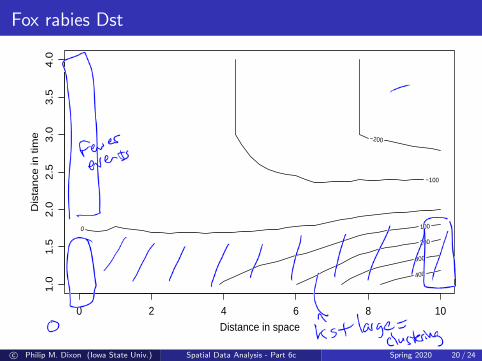
Fox rabies Dst
Distance in space
Dis
tan
ce in
tim
e −200
−100
0 100
200
300
400
0 2 4 6 8 10
1.0
1.5
2.0
2.5
3.0
3.5
4.0
c© Philip M. Dixon (Iowa State Univ.) Spatial Data Analysis - Part 6c Spring 2020 20 / 24
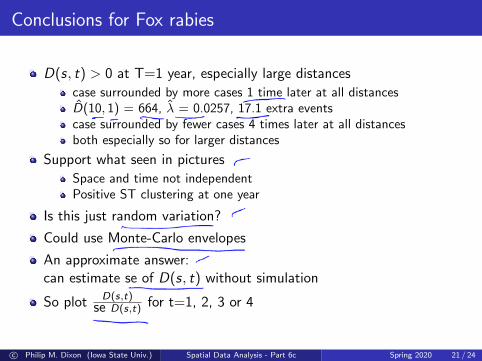
Conclusions for Fox rabies
D(s, t) > 0 at T=1 year, especially large distances
case surrounded by more cases 1 time later at all distancesD̂(10, 1) = 664, λ̂ = 0.0257, 17.1 extra eventscase surrounded by fewer cases 4 times later at all distancesboth especially so for larger distances
Support what seen in pictures
Space and time not independentPositive ST clustering at one year
Is this just random variation?
Could use Monte-Carlo envelopes
An approximate answer:can estimate se of D(s, t) without simulation
So plot D(s,t)se D(s,t) for t=1, 2, 3 or 4
c© Philip M. Dixon (Iowa State Univ.) Spatial Data Analysis - Part 6c Spring 2020 21 / 24

Fox rabies Dst/se Dst
0 2 4 6 8 10
−2
0−
10
01
02
03
04
0
Distance
Dst
/ s
e
Time diff 1Time diff 2Time diff 3Time diff 4
c© Philip M. Dixon (Iowa State Univ.) Spatial Data Analysis - Part 6c Spring 2020 22 / 24
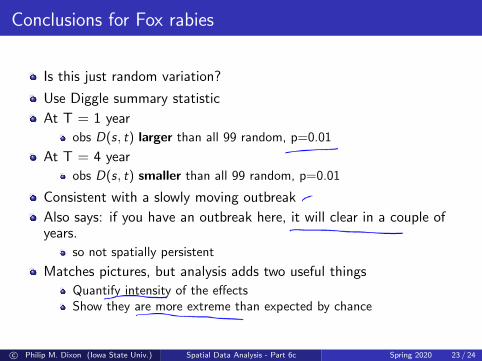
Conclusions for Fox rabies
Is this just random variation?
Use Diggle summary statistic
At T = 1 year
obs D(s, t) larger than all 99 random, p=0.01
At T = 4 year
obs D(s, t) smaller than all 99 random, p=0.01
Consistent with a slowly moving outbreak
Also says: if you have an outbreak here, it will clear in a couple ofyears.
so not spatially persistent
Matches pictures, but analysis adds two useful things
Quantify intensity of the effectsShow they are more extreme than expected by chance
c© Philip M. Dixon (Iowa State Univ.) Spatial Data Analysis - Part 6c Spring 2020 23 / 24
Summary of space-time analyses
Lots of practically important questions
many require new methods
not just many spatial analyses
can combine information across times
Kernel smoothing of space-time point patternsSpace-time geostatistics
And look at space-time independence
Pictures/graphs are really really helpful
Provide reality check and help with interpretation
My view of the future:
fitting subject-matter based models to dynamic data
c© Philip M. Dixon (Iowa State Univ.) Spatial Data Analysis - Part 6c Spring 2020 24 / 24