Embed Size (px)
Citation preview
Irish National Hydrology Conference 2008
43
PLUVIAL EXTREME EVENT RISK APPRAISAL TECHNIQUES
WITH RECENT APPLICATIONS IN IRELAND AND THE UK
Ronnie Falconer, Peter Smyth and Lewis Maani, (Jacobs Engineering)
Abstract Pluvial’ flooding is defined as flooding from rainfall generated overland flow before the runoff enters
any watercourse or sewer. It is usually associated with high intensity events but can also occur with
lower intensity rainfall where ground is saturated, developed or otherwise has low permeability
resulting in overland flow and ponding in topographical depressions. Drainage systems and surface
watercourses may be completely overwhelmed. Recent examples include the Summer 2007 floods in
Ireland and England where pluvial flooding has been a major contributing factor.
Identifying areas potentially at risk from pluvial flooding is a requirement of the Floods Directive,
particularly in relation to the Preliminary Flood Risk Assessments which, as a first stage involves,
high level screening of a catchment to determine all sources of potential flood risk.
Jacobs have delivered Defra’s MSfW RF5 project which has assessed the technical feasibility of
‘Flood Warning for Other Forms of Flooding’. As part of this, Jacobs has developed a Pluvial Extreme
Event Planning (PEEPs) technique which identifies areas likely to have greater susceptibility to
pluvial flooding through an initial rapid screening process using GIS to identify depressions in the
topography and critical flowpaths. Site inspection of highlighted areas verifies risk and identifies local
issues and potential solutions. This can be followed by more detailed assessment where justified.
The technique has been used to produce ‘pluvial flood risk maps’ in Belfast, Hull, Sheffield, Carlisle
and Kingston-upon-Thames, and results demonstrate a close correlation with observations of pluvial
flooding where available. This paper will summarise the approach adopted along with example results
for some of the PEEPs assessments undertaken with a particular focus on Ireland.
Introduction The UK Environment Agency’s flood warning service mainly focuses on flooding from the coast and
rivers. However, in line with the holistic approach to flood risk management outlined in the Making
Space for Water (MSfW) programme, the RF5 Feasibility study into Expanding Flood Warning to
Cover Other Flood Risks (Jacobs, 2007) has investigated the technical feasibility of providing warning
services for sources of flooding other than from rivers and the sea. During the project, the impact of
some of these ‘other’ sources of flooding was dramatically seen in the UK in the summer of 2007,
where surface water, drainage capacity exceedance and groundwater flooding all contributed to the
overall damage. Although the RF5 study was under way well before the Summer 2007 flooding, the
outcomes are directly relevant to a number of the key recommendations made in the Pitt Review, Pitt
(2007, 2008).
This paper summarises an appraisal of the technical feasibility of providing warning services for
sources of flooding other than from rivers and the sea and focuses on potential forms of surface water
flood warning service. Surface water flooding is often termed pluvial flooding and can be defined as
flooding which results from rainfall generated overland flow before the runoff enters any watercourse,
drainage system or sewer.Surface water flooding is often termed pluvial flooding and can be defined
as flooding which results from rainfall generated overland flow before the runoff enters any
watercourse, drainage system or sewer. The RF5 study involved a number of case study applications.
The paper also describes, as a further example, the subsequent application of the screening process in
East Belfast to identify areas susceptible to surface water pluvial flooding following widespread
flooding in June 2007.
Irish National Hydrology Conference 2008
44
It is envisaged that high level screening of the
potential for pluvial flooding could provide
sufficient information to enable a preliminary
assessment of the level of pluvial flood hazard to
be made over a wide area. As such, this could
help to inform Preliminary Flood Risk
Assessments under the Floods Directive and the
development of a resource efficient strategy for
subsequent mapping possibly using more
detailed techniques.
Review of ‘Other Sources of Flooding’
Following a review of all non-fluvial and non-coastal sources of flooding perceived as significant by
the MSfW Flooding from Other Sources project (HA4a; JBA, 2006), Jacobs (2007) recommended that
provision of a warning service should be prioritised as follows:
Priority A: warning system urgently required − surface water (pluvial) flooding.
− urban sewer capacity and surface water drain capacity exceedance.
− groundwater response to prolonged extreme rainfall, high in-bank river levels and rebound in major
conurbations.
Priority B: warning system less urgent − urban infrastructure blockage or failure.
− dambreak.
− tsunami.
− canal breach.
Priority C: warning not urgent but to be kept under review − small and ‘lost’ watercourses and culverts.
− old watercourse routes.
− mud/debris flow.
− water supply infrastructure failure.
− land drainage system infrastructure failure.
This assessment was based on criteria which included the frequency of occurrence, potential
impact, likely practicality of warning and opportunity to provide better warning information.
Following this initial assessment, the technical feasibility of providing forecasts and, hence, a
warning service for each of the Priority A and B sources is summarised in Table 1. Each
source of flooding has been ranked on a capability scale against criteria including forecasting,
lead time and dissemination. Current feasibility is expressed as currently feasible (I), feasible
in the near future (II) or unlikely to be feasible for some time (III).
Table 1 shows that of the priority A and B sources, it is currently technically feasible to consider
providing some form of warning service for pluvial flooding and the following three groundwater
sources: extreme rainfall in Chalk catchments; high but in-bank river levels in Superficial aquifers;
and rebound due to the cessation of industrial abstractions in major conurbations.
Providing a forecast and warning service for pluvial flooding is considered technically feasible,
because:
− rainfall radar coverage is good, but could still be further improved through funding of existing
plans;
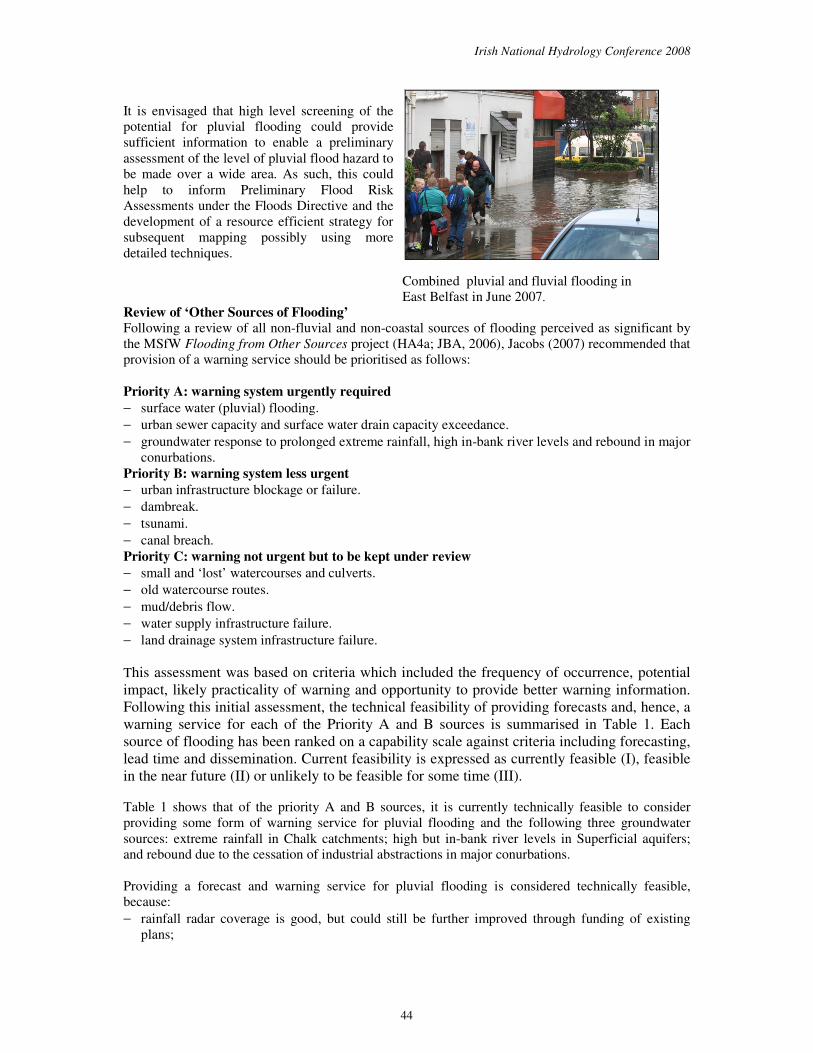
Combined pluvial and fluvial flooding in
East Belfast in June 2007.

Irish National Hydrology Conference 2008
45
− high resolution forecast models have been proven in development but are still to be implemented
operationally;
− identification of areas ‘at risk’ is beginning; and
− apart from isolated initiatives, there is currently no widely-accepted example of operational ‘best
practice’ to follow.
Table 1. Feasibility of a forecast and warning system for the priority A and B forms of flooding
Type of Flooding Sub-category
Current
Feasibility
Pluvial Pluvial I
Urban Sewer Capacity Exceedance II
Urban Surface Water Drain Capacity Exceedance II
Sewerage and Drainage
System
Derived Urban Infrastructure Blockage or Failure III
Response to Extreme rainfall I
Response to High In-bank River Levels I
Groundwater
Rebound in major conurbations I
Dambreak II
Tsunami II
Catastrophic
Canal Breach III
Providing a forecast and warning service for the three forms of groundwater flooding is discussed
fully in the RF5 report, Jacobs (2007a) and in a recent paper which summarises this work Jacobs
(2008a).
Context for Pluvial Flood Warning Service Providing a warning service recognises that at some point a rainfall event will occur that will exceed
any surface water management arrangements and provides an option to limit the resulting damage.
The impacts of pluvial flooding may be most severe in urban areas where rainfall exceeds the capacity
of the drainage system, such as in the June 2007 flooding in Hull. In the UK, Defra (2005) recognised
the complexity of flood risk in urban areas and identified the need for an improved and integrated
approach to managing the risk. Through the fifteen Integrated Urban Drainage pilot studies, new
approaches to reducing the future impact of urban flooding (including pluvial) have been tested. These
new approaches include modelling, surface water management plans and Sustainable Urban Drainage
Systems. Therefore, while not strictly a management option, a warning service for pluvial flooding
should be considered in the context of these, and other ongoing investigations.
Through initial demonstrations of technical feasibility, the RF5 project has proposed a potential
forecast and warning system which could provide organisations preparing for and responding to
pluvial flooding with more warning than is currently available. It was suggested that a form of service
could comprise the following two main elements which are explored in more detail below:
• Extreme Rainfall Alerts providing targeted forecasts of severe storms; and
• The preparation of Pluvial Extreme Event Plans (PEEPs) such that actions prioritised in the PEEPs
could be initiated on receipt of an alert to maximise effective use of the available lead time.
From a technical feasibility perspective it is suggested that, due to the limited lead time likely to be
available, alerts of severe rainfall which may cause pluvial flooding are issued directly by the UK Met
Office to all responding organisations. This should provide adequate lead time to make preparations,
e.g. checking that culverts/screens at key locations are clear, ensuring adequate emergency staff are
available and deployed at strategic locations etc.
Irish National Hydrology Conference 2008
46
Further information on techniques which are evolving to provide targeted Extreme Rainfall Alerts is
provided in a recent paper, Jacobs (2008a) which summarises work undertaken for this element of the
RF5 project. Pluvial flooding is often caused by short duration intense rainfall, although it can be
caused by more prolonged ‘moderate’ rainfall (e.g. June 2007 flooding in Hull) sometimes with
embedded high intensity rainfall cells. The high resolution 1.5km Nation Weather Prediction model
will enable the UK Met Office to provide an early warning of 6 – 9 hours lead time, updated every 3
hours, based on an accurate forecast for scales of around 1000km2 with update warnings at 1 – 2 hours
lead time, updated every hour, based on an accurate forecast for scales of around 100km2. Spectacular
improvements in forecasting definition (intensity and location) are obtained with the 1.5km model
when compared with the 12km and 4km models currently in use.
Pluvial Extreme Event Plans (PEEPs) As well as examining the feasibility of processes whereby the UK Met Office could provide an
Extreme Rainfall Alert service, the RF5 study also reviewed rapid GIS screening techniques to enable
areas which might be susceptible to pluvial flooding to be identified. Such mapping could be used in
conjunction with Extreme Rainfall Alerts to maximise the available lead time for emergency
preparedness and response and help to target resources more effectively. The rapid screening forms a
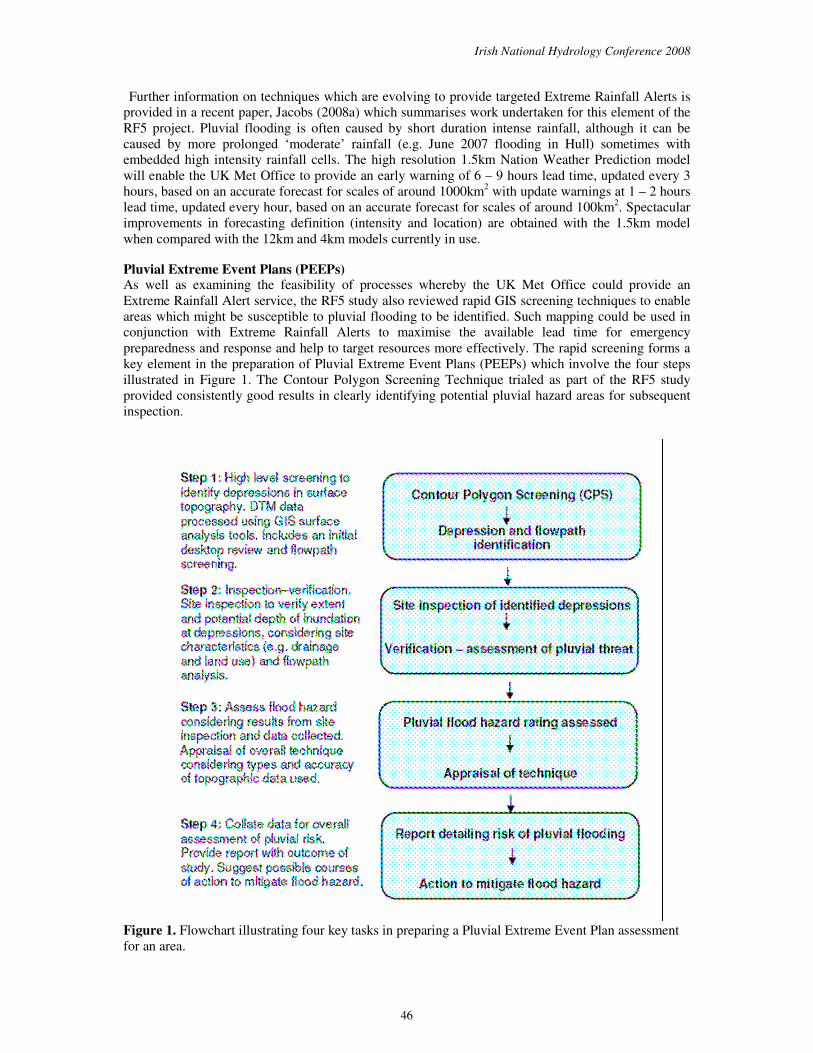
key element in the preparation of Pluvial Extreme Event Plans (PEEPs) which involve the four steps
illustrated in Figure 1. The Contour Polygon Screening Technique trialed as part of the RF5 study
provided consistently good results in clearly identifying potential pluvial hazard areas for subsequent
inspection.
Figure 1. Flowchart illustrating four key tasks in preparing a Pluvial Extreme Event Plan assessment
for an area.
Irish National Hydrology Conference 2008
47
It is envisaged that PEEPs would form part of a tiered approach to pluvial mapping whereby a
Refinement and Review stage would enable subsequent more detailed assessment of hydraulics to be
undertaken in areas where this is justified. Plans would be kept under continuous review to incorporate
refinements, new techniques or observations from real events.
It is also anticipated that PEEPs maps of areas most susceptible to pluvial flooding could be developed
and used in conjunction with similar existing maps and plans (e.g. Surface Water Management Plans),
including those for other sources of flooding.
The feasibility of undertaking the first two elements in the PEEPs process was initially demonstrated
during 2007 in four case study locations: Kingston-upon-Thames, Carlisle, Hull and Sheffield using
both LIDAR and IfSAR (Interferometric Synthetic Aperture Radar) digital terrain datasets and a
range of contour intervals from 1m down to 0.25m. IfSAR has a reported vertical accuracy of approximately +/- 1.0m and LIDAR approximately +/- 0.15m.
Following a review of available techniques to identify significant topographic depressions and
significant flowpaths for surface runoff, two techniques were trialed in the four locations. The clearest
identification of risk areas as verified by site inspection was obtained through the Contour Polygon
Screening technique (CPS). Techniques to calculate the depths of depressions as an indicator of
possible flood hazard as well as the presence of surface flowpaths were evaluated.
Considering only topography to identify areas susceptible to pluvial flooding ignores any role that
subsurface (or surface) drainage may play in alleviating (or not) possible flooding. However, as
demonstrated by the June 2007 flooding in Hull, drainage systems are almost always overwhelmed
during pluvial flooding such that their consideration is of secondary importance. Thus, it could be
assumed during pluvial flooding that the drainage systems have inadequate capacity, are blocked or
otherwise fail (e.g. pumping stations) and, therefore, only warrant consideration (for any positive
impact they may have) at the more detailed Inspection and Refinement and Review stages in the
PEEPs methodology.
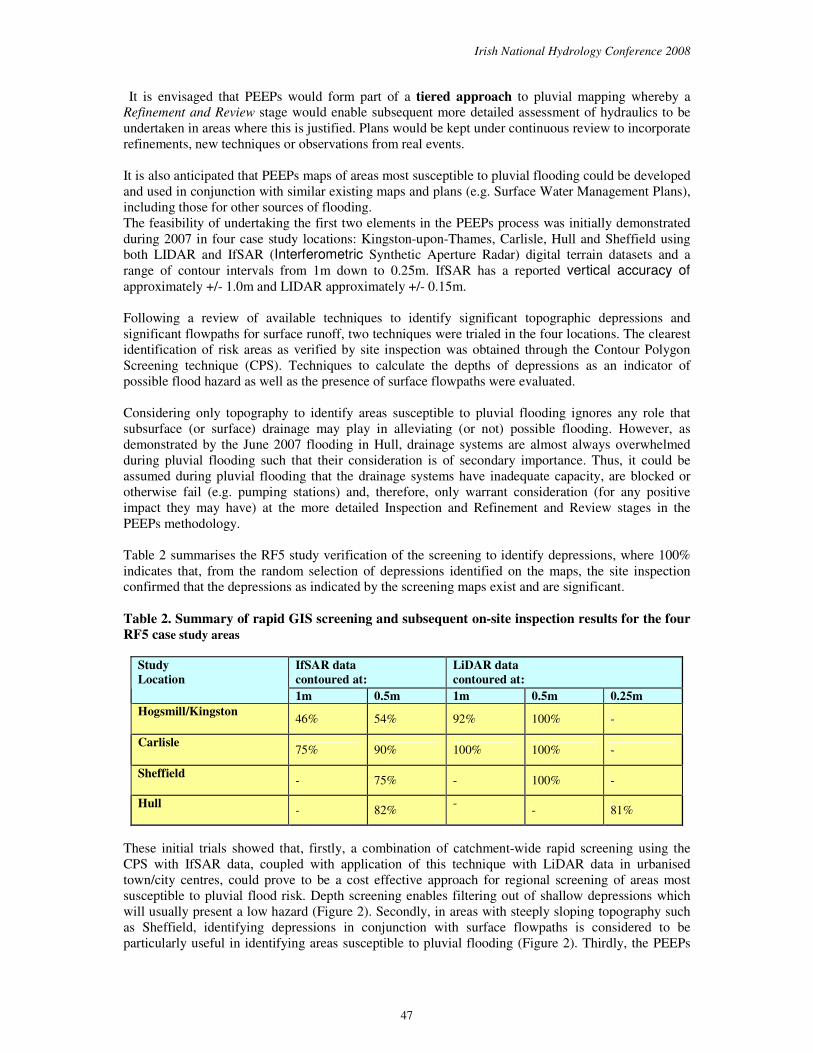
Table 2 summarises the RF5 study verification of the screening to identify depressions, where 100%
indicates that, from the random selection of depressions identified on the maps, the site inspection
confirmed that the depressions as indicated by the screening maps exist and are significant.
Table 2. Summary of rapid GIS screening and subsequent on-site inspection results for the four
RF5 case study areas
IfSAR data
contoured at:
LiDAR data
contoured at:
Study
Location
1m 0.5m 1m 0.5m 0.25m
Hogsmill/Kingston 46% 54% 92% 100% -
Carlisle 75% 90% 100% 100% -
Sheffield - 75% - 100% -
Hull
- 82%
- - 81%
These initial trials showed that, firstly, a combination of catchment-wide rapid screening using the
CPS with IfSAR data, coupled with application of this technique with LiDAR data in urbanised
town/city centres, could prove to be a cost effective approach for regional screening of areas most
susceptible to pluvial flood risk. Depth screening enables filtering out of shallow depressions which
will usually present a low hazard (Figure 2). Secondly, in areas with steeply sloping topography such
as Sheffield, identifying depressions in conjunction with surface flowpaths is considered to be
particularly useful in identifying areas susceptible to pluvial flooding (Figure 2). Thirdly, the PEEPs
Irish National Hydrology Conference 2008
48
approach involving follow-up site inspection of identified significant depressions and consideration
of potential hazards and mitigation measures has been demonstrated as practical and feasible to
undertake.
At Carlisle records were also available of pluvial flooding which had occurred in conjunction with the
major fluvial flooding in January 2005. As was found at Hull, good correlation was obtained between
pluvial mapping using the CPS technique and these observations.
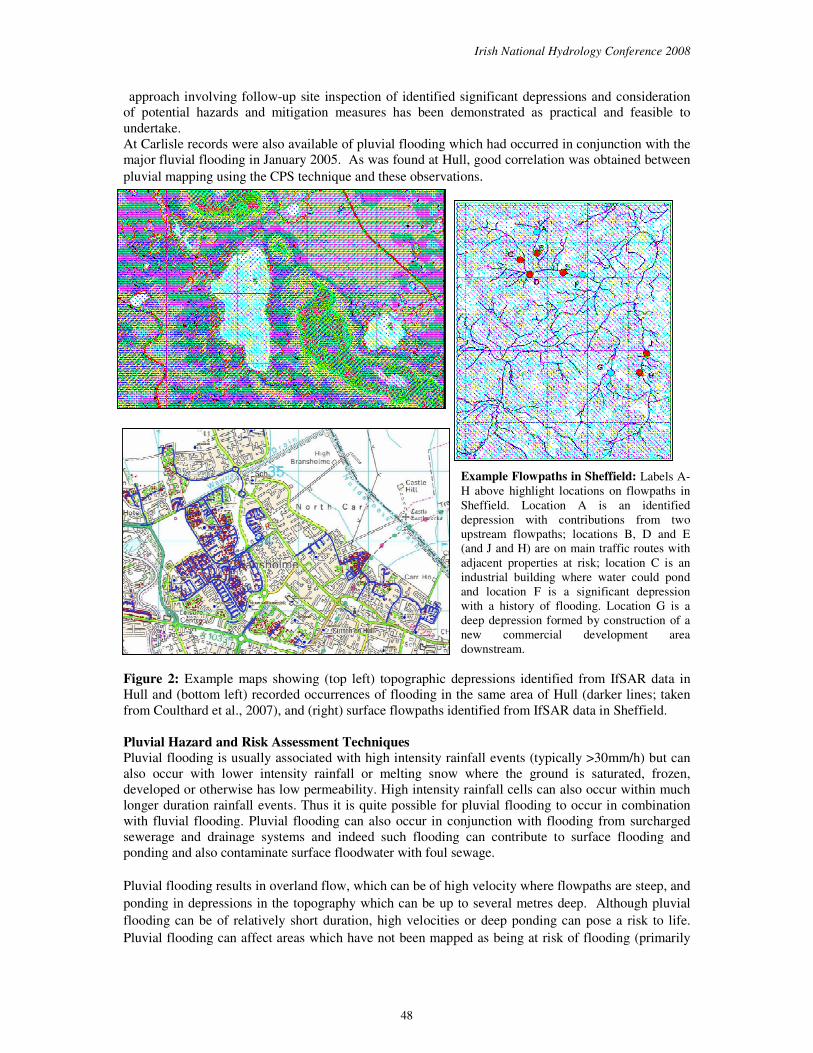
Example Flowpaths in Sheffield: Labels A-
H above highlight locations on flowpaths in
Sheffield. Location A is an identified
depression with contributions from two
upstream flowpaths; locations B, D and E
(and J and H) are on main traffic routes with
adjacent properties at risk; location C is an
industrial building where water could pond
and location F is a significant depression
with a history of flooding. Location G is a
deep depression formed by construction of a
new commercial development area
downstream.
Figure 2: Example maps showing (top left) topographic depressions identified from IfSAR data in
Hull and (bottom left) recorded occurrences of flooding in the same area of Hull (darker lines; taken
from Coulthard et al., 2007), and (right) surface flowpaths identified from IfSAR data in Sheffield.
Pluvial Hazard and Risk Assessment Techniques
Pluvial flooding is usually associated with high intensity rainfall events (typically >30mm/h) but can
also occur with lower intensity rainfall or melting snow where the ground is saturated, frozen,
developed or otherwise has low permeability. High intensity rainfall cells can also occur within much
longer duration rainfall events. Thus it is quite possible for pluvial flooding to occur in combination
with fluvial flooding. Pluvial flooding can also occur in conjunction with flooding from surcharged
sewerage and drainage systems and indeed such flooding can contribute to surface flooding and
ponding and also contaminate surface floodwater with foul sewage.
Pluvial flooding results in overland flow, which can be of high velocity where flowpaths are steep, and
ponding in depressions in the topography which can be up to several metres deep. Although pluvial
flooding can be of relatively short duration, high velocities or deep ponding can pose a risk to life.
Pluvial flooding can affect areas which have not been mapped as being at risk of flooding (primarily

Irish National Hydrology Conference 2008
49
fluvial flood risk areas) and hence those impacted may be completely unprepared and unaware of a
potential flood risk.
During pluvial flooding, urban underground sewerage/drainage systems and surface watercourses may
be completely overwhelmed. Nevertheless the rate at which ponding and surface water dissipates will
usually depend on the capacity of local watercourses and subsurface drainage and sewerage systems to
drain down areas affected.
The interaction between pluvial, fluvial and sewer flooding is complex. Nevertheless, for a high level
review, simplifying assumptions can be made which enable a preliminary assessment of pluvial flood
hazard to be undertaken which can then be used to target more detailed assessment where appropriate.
The GIS-based PEEPs approach assumes that areas impacted by pluvial flooding are either
depressions in the topography where surface water ponds or surface water flowpaths. The depth of
ponding, which can vary from <0.5m up to several metres, together with the location of flowpaths,
provides a broad indication of hazard.
The hazard associated with the flowpath alone can be associated with the velocity, where gradients are
moderate to steep, or simply the volume of flow. A flowpath which intersects a depression is assumed
to increase the level of hazard associated with the depression. A situation which can arise in heavily
urbanised areas is where a flowpath flows adjacent to or in to an entrance to an underground car park,
a goods entrance to a commercial premises or an underground station. The CPS technique with
LIDAR data can often identify such entrances where there is a clear, albeit small, depression. Even if
there is no depression, an adjacent flowpath could still result in flooding of an underground
installation. Such situations may be identified during the site inspection of significant depressions and
flowpaths (the second stage in the PEEPs approach).
For a preliminary high level review, the identification of areas of ‘High’ pluvial hazard can initially be
based on the assumption that average depression depth gives an initial broad indication of the likely
severity of pluvial flood hazard. Depths of the depression scan be categorised into four depth ranges:
(i) 0.2m - 0.5m indicating low pluvial hazard
(ii) 0.5m - 1.0m indicating moderate pluvial hazard
(iii) 1.0m - 2.0m indicating high pluvial hazard
(iv) >2.0 m indicating severe pluvial hazard
Depths less than 0.2m would not normally be considered significant in terms of pluvial flood hazard.
However the following aspects are also relevant:
• Presence of a flowpath that transects the depression that may drain an upstream catchment area.
• Land-use and sensitivity of the area to flooding: whether there is significant infrastructure, or
other buildings that would be particularly vulnerable to pluvial flooding in the vicinity.
• Drainage outlet: how the depression would drain in the event of a significant rainfall event. Is
there potential for blockage of this outlet that could exacerbate the pluvial flooding.
These elements can be assessed during the site inspection phase (Step 2) and from subsequent more
detailed review of mapping and other available information (Step 3).
For an initial high level overview of a particular district, a preliminary assessment of overall pluvial
hazard can be based on the total volume of depressions for all depth ranges divided by the total unit
area of the district being evaluated. This is defined as the ‘Hazard Index’ (HI). This can be assessed
for both urban and rural areas. A high Hazard Index is considered to be of lesser significance in terms
of potential damage to infrastructure within predominantly rural areas although it may still be
significant in terms of impact on environmentally sensitive areas. For example, in an urban area a
district might be regarded as having a ‘High’ hazard rating in relative terms, if the HI is >0.25;
‘Moderate’ if the HI is 0.1-0.25 and ‘Low’ if the HI is <0.1.
For more detailed evaluation of pluvial hazard which takes into account possible impact and hence
might be considerate as an initial assessment of pluvial flood risk, a matrix-based technique can be
Irish National Hydrology Conference 2008
50
applied which firstly takes into account the presence or otherwise of a flowpath in determining a
‘severity of flooding’ rating and then sensitivity of the land use assessed as:
• Low : parkland, farmland etc
• Medium : commercial, industrial etc
• High : residential, significant infrastructure, emergency services, power sub-stations, underground
transportation, water supply, hospitals etc
A hazard rating for flowpaths can also be assessed taking into account the steepness of the flowpath
and the upstream contributing area..
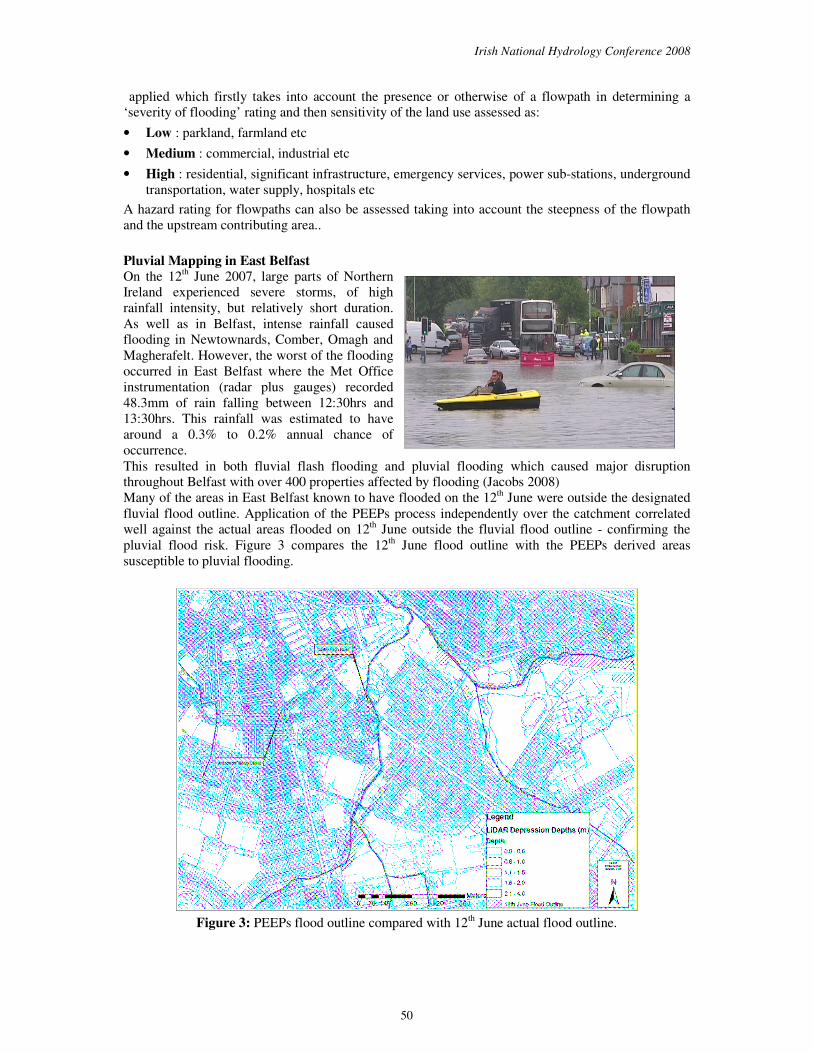
Pluvial Mapping in East Belfast
On the 12th June 2007, large parts of Northern
Ireland experienced severe storms, of high
rainfall intensity, but relatively short duration.
As well as in Belfast, intense rainfall caused
flooding in Newtownards, Comber, Omagh and
Magherafelt. However, the worst of the flooding
occurred in East Belfast where the Met Office
instrumentation (radar plus gauges) recorded
48.3mm of rain falling between 12:30hrs and
13:30hrs. This rainfall was estimated to have
around a 0.3% to 0.2% annual chance of
occurrence.
This resulted in both fluvial flash flooding and pluvial flooding which caused major disruption
throughout Belfast with over 400 properties affected by flooding (Jacobs 2008)
Many of the areas in East Belfast known to have flooded on the 12th June were outside the designated
fluvial flood outline. Application of the PEEPs process independently over the catchment correlated
well against the actual areas flooded on 12th June outside the fluvial flood outline - confirming the
pluvial flood risk. Figure 3 compares the 12th June flood outline with the PEEPs derived areas
susceptible to pluvial flooding.
Figure 3: PEEPs flood outline compared with 12th June actual flood outline.

Irish National Hydrology Conference 2008
51
Figure 4: Pluvial flood risk areas in East Belfast inspected as part of the PEEPs process.
Similar to the results summarised in Table 2, a site inspection of 17 locations identified as depressions
from the LiDAR data of East Belfast (Figure 4), confirmed that all 17 existed posed a moderate to
severe hazard. In addition, in 89% of locations, the depth of the depression was correctly calculated by
the GIS analysis. Furthermore, there was close correlation between locations identified using the CPS
technique and areas which flooded from surface water on 12 June 2007. An analysis of identified
flowpaths highlighted a number which passed through or in close proximity to identified depressions
which could exacerbate the risk in these locations.
Site inspection confirmed the severity of the level of hazard and enabled a preliminary assessment to
be made of possible solutions. Some depressions were found to have a combined fluvial and pluvial
hazard i.e. a watercourse may be present with an associated fluvial hazard but the drainage outlet
(often a culvert) was such that a localised high intensity rainfall even could potentially increase the
hazard beyond that associated with the watercourse alone. In a number of cases it was found that man-
made features had created the depression and pluvial hazard – Figure 5 illustrates one example where
a disused railway embankment and blocked or partially blocked culverts had created the pluvial
hazard. Clearance/improvement of the culverts would alleviate the risk.
Figure 5: Example of major depressions in East Belfast associated with disused railway embankment.
Irish National Hydrology Conference 2008
52
Conclusions The PEEPs process coupled with the CPS rapid screening technique has been demonstrated to be an
effective high level approach which can provide a preliminary indication of the level of pluvial flood
hazard over a wide area. As such, this can help to inform Preliminary Flood Risk Assessments under
the Floods Directive and the development of a resource efficient strategy for subsequent mapping.
It is recognised that computing power is rapidly evolving such that it will become feasible in the near
future to run more sophisticated modeling techniques to identify areas at risk of pluvial flooding
within run times that are sufficiently fast to be of practical use. These techniques which represent the
routing of rainfall across the topography, and so can be termed ‘wet’ techniques, may provide
improved definition of flow direction, velocity and depth within susceptible areas. Demonstration here
of technical feasibility of the use of simpler ‘high level’ approaches considering only topography (so-
termed ‘dry’ techniques) could be viewed as setting a baseline from which results could be
progressively refined.
High level ‘dry’ screening enables a risk based tiered approach to be adopted such that resources can
be effectively targeted on areas that merit subsequent more detailed assessment possibly using surface
flow modeling or integrated urban flood modeling. It also provides a preliminary overview of potential
pluvial hazard and has the advantage of gaining an early understanding of locally significant issues
through the site inspections which provide valuable verification of the mapping. Other factors,
including land use and potential flood impacts, can then be taken into account to make an initial
assessment of potential pluvial flood risk.
Acknowledgements Much of the work reported in this paper has been undertaken during projects funded by Defra
and the Environment Agency in the UK as part of the Making Space for Water programme and by the
Rivers Agency in Northern Ireland.
References
Coulthard, T., Frostick, L., Hardcastle, H., Jones, K., Rogers, D. and Scott, M. 2007 The June 2007
floods in Hull. Interim Report by the Independent Review Body. August 2007.
Jacobs 2007a, Feasibility Study into Expanding Flood Warning to Cover Other Flood Risks (reference
RF5) Technical Feasibility Report. November 2007.
Jacobs 2007b Groundwater Flooding Records Collation, Monitoring and Risk Assessment (reference
HA5) Consolidated Report. December 2007.
Jacobs 2008a Potential Warning Services for Groundwater and Pluvial Flooding, July 2008.
Jacobs 2008b East Belfast Pluvial Extreme Event Planning. May 2008.
JBA 2006 Flooding from Other Sources (reference HA4a). Final Report, October 2006.
Pitt (2007) Learning lessons from the 2007 floods: an independent review by Sir Michael Pitt. Interim
Report. Cabinet Office. December 2007.
Pitt (2008) Learning lessons from the 2007 floods. Cabinet Office. June 2008.