Embed Size (px)
Citation preview
Am. J. Hum. Genet. 74:283–297, 2004
283
Pleiotropic Effects of a Chromosome 3 Locus on Speech-Sound Disorderand ReadingCatherine M. Stein,1 James H. Schick,1 H. Gerry Taylor,2 Lawrence D. Shriberg,3Christopher Millard,1 Amy Kundtz-Kluge,1 Karlie Russo,1 Nori Minich,2 Amy Hansen,2Lisa A. Freebairn,2 Robert C. Elston,1 Barbara A. Lewis,2 and Sudha K. Iyengar1
1Department of Epidemiology and Biostatistics, Rammelkamp Center for Research, and 2Department of Pediatrics, Rainbow Babies &Children’s Hospital, Case Western Reserve University, Cleveland; and 3Waisman Center on Mental Retardation & Human Development,University of Wisconsin, Madison
Speech-sound disorder (SSD) is a complex behavioral disorder characterized by speech-sound production errorsassociated with deficits in articulation, phonological processes, and cognitive linguistic processes. SSD is prevalentin childhood and is comorbid with disorders of language, spelling, and reading disability, or dyslexia. Previousresearch suggests that developmental problems in domains associated with speech and language acquisition placea child at risk for dyslexia. Recent genetic studies have identified several candidate regions for dyslexia, includingone on chromosome 3 segregating in a large Finnish pedigree. To explore common genetic influences on SSD andreading, we examined linkage for several quantitative traits to markers in the pericentrometric region of chromosome3 in 77 families ascertained through a child with SSD. The quantitative scores measured several processes underlyingspeech-sound production, including phonological memory, phonological representation, articulation, receptive andexpressive vocabulary, and reading decoding and comprehension skills. Model-free linkage analysis was followedby identification of sib pairs with linkage and construction of core shared haplotypes. In our multipoint analyses,measures of phonological memory demonstrated the strongest linkage (marker D3S2465, , and55P p 5.6 # 10marker D3S3716, ). Tests for single-word decoding also demonstrated linkage (real word reading:54P p 6.8 # 10marker D3S2465, ; nonsense word reading: marker D3S1595, ). The minimum shared haplotypeP p .004 P p .005in sib pairs with similar trait values spans 4.9 cM and is bounded by markers D3S3049 and D3S3045. Our resultssuggest that domains common to SSD and dyslexia are pleiotropically influenced by a putative quantitative traitlocus on chromosome 3.
Introduction
Speech-sound disorder (SSD) is a complex behavioral dis-order characterized by deficits in motor control of thearticulatory mechanism and/or deficits in the general pro-cessing, organization, and cognitive representation oflinguistic information. Thus, children’s speech-sound pro-ductions may reflect deficits in underlying phonologi-cal processes, such as phonological memory and speech-sound coding. SSD has a high prevalence in preschoolchildren, estimated at ∼16% at age 3 years (Shriberg2002), with 3.8% of children continuing to present withspeech delay at age 6 years (Shriberg et al. 1999). Morethan half of these children encounter later academic dif-ficulties in language, reading, and spelling (Shriberg and
Received July 16, 2003; accepted for publication November 11,2003; electronically published January 20, 2004.
Address for correspondence and reprints: Dr. Sudha K. Iyengar,R215 Rammelkamp Building, Department of Epidemiology and Bio-statistics, Case Western Reserve University, 2500 MetroHealth Drive,Cleveland, OH 44109. E-mail: [email protected]
� 2004 by The American Society of Human Genetics. All rights reserved.0002-9297/2004/7402-0010$15.00
Kwiatkowski 1988; Aram and Hall 1989; Bishop andAdams 1990; Menyuk et al. 1991; Felsenfeld et al. 1995;Shriberg and Austin 1998; Lewis et al. 2000). The residualeffects of preschool SSD may be lifelong, and yet, for themajority of individuals, the etiological basis of this dis-order is unknown.
There is a growing body of literature suggesting thatsusceptibility to SSD is genetic, including twin studies(Lewis and Thompson 1992; Bishop et al. 1996; Tom-blin and Buckwalter 1998), familial aggregation studies(Lewis et al. 1989; Lewis 1992; Felsenfeld et al. 1995)and segregation and linkage analyses (Lewis et al. 1993;Schick et al. 2002). Recently, studies of specific languageimpairment (SLI), defined as a failure to acquire lan-guage within normal limits in the absence of a gener-alized developmental delay, have reported linkage tochromosome 16q for nonword repetition (SLI Consor-tium 2002) and to chromosome 19q for expressive lan-guage (SLI Consortium 2002). There has also been areport of linkage to chromosome 7q31 for verbal dys-praxia in a large family (Fisher et al. 1998; Vargha-Khadem et al. 1998). Multiple genetic influences couldalso be at work, with different genetic factors contrib-
284 Am. J. Hum. Genet. 74:283–297, 2004
uting to different types of domains in language andspeech-sound acquisition.
Pennington and colleagues (Pennington and Lefly2001; Tunick and Pennington 2002; Raitano et al., inpress) proposed that early developmental problems inspoken language predict the later emergence of dyslexiain children from high-risk families. The cognitive lin-guistic deficits associated with dyslexia include impair-ments in phonological awareness (explicit knowledge ofthe sound system of a language), phonological memory(as measured by the repetition of nonsense words), andthe ability to decode unfamiliar words (reading decod-ing), each of which underlie spoken and written lan-guage. Although SSD and dyslexia are assessed throughdifferent test batteries, possibly at different ages, thesimilar cognitive linguistic bases of these disorders sug-gest that they share some common genetic etiology (seefig. 1).
Whereas there have been few molecular genetic datareported for SSD, there is an extensive genetic literatureon dyslexia. The genetic mechanisms proposed to un-derlie the behavioral manifestation of dyslexia are com-plex (see Fisher and DeFries 2002). Various componentsof dyslexia have been analyzed, and linkages have beenfound to chromosome 1 (Rabin et al. 1993; Grigorenkoet al. 2001); word recognition and reading decodinglinkage has been found on chromosome 2 (Fagerheimet al. 1999; Francks et al. 2002; Petryshen et al. 2002;Kaminen et al. 2003); phonological awareness, rapidnaming, and verbal short term memory linkage has beenfound on chromosome 3 (Nopola-Hemmi et al. 2001,2002); phonemic awareness, reading decoding, single-word reading, orthographic coding, vocabulary, rapidnaming, and spelling linkage has been found on chro-mosome 6 (Cardon et al. 1994, 1995; Grigorenko et al.1997; Gayan et al. 1999; Fisher et al. 1999, 2002a;Nothen et al.1999; Petryshen et al. 2001; Kaplan et al.2002); word recognition and spelling linkage has beenfound on chromosome 15 (Grigorenko et al. 1997;Schulte-Korne et al. 1998; Nothen et al. 1999); andsingle-word reading and phonological and orthographicprocessing linkage has been found on chromosome 18(Fisher et al. 2002a). However, recent evidence suggeststhat some of these chromosomal regions harbor geneswith pleiotropic effects (Marlow et al. 2003).
A recent study by Nopola-Hemmi et al. (2001) an-alyzed a large Finnish pedigree segregating for devel-opmental dyslexia in an autosomal dominant fashionand found linkage to the pericentromeric region of chro-mosome 3. On the basis of the hypothesis that SSDand dyslexia share genetic determinants, we genotypedmarkers in the dyslexia candidate region on chromo-some 3 to determine whether linkage would be observedin families ascertained through a proband with SSD.This is the first study, to our knowledge, to examine the
common genetic basis of SSD and dyslexia on chro-mosome 3.
Subjects and Methods
Collection of Family Data
The sample consisted of 77 families, ascertainedthrough a preschool child with SSD of unknown etiol-ogy, who donated samples for DNA analysis. The pro-tocol for collection of buccal smears or blood samplesand for participant testing was approved by the insti-tutional review board of University Hospitals, Cleve-land, OH. Probands were enrolled in speech/languagetherapy for a moderate to severe SSD of unknown originand were recruited from case loads of speech-languagepathologists in the greater Cleveland area. Siblings ofthe probands were recruited and assessed at the sametime as the probands. Although historical informationon affection was collected from parents, the focus of thisstudy was on quantitative traits; hence, we did not utilizeparental data in the analyses.
Measures
Measures of articulation.—The Goldman-Fristoe Testof Articulation (GFTA) (Goldman and Fristoe 1986) wasused to assess production of consonant sounds in single-ton and cluster contexts in the beginning, middle, andfinal positions of words and blends. Participants wereasked to name pictures, and their responses were audio-tape recorded and phonetically transcribed by speech-lan-guage pathologists. A percentile score was used as thequantitative trait for data analysis. The GFTA is stan-dardized for ages 2–16� years and was administeredto 188 probands and siblings; when it was used inconjunction with the Khan-Lewis Phonological Analysis(KLPA) (Khan and Lewis 1986), 15 common error pat-terns found in children’s speech were categorized. Theseerror patterns, or “phonological processes,” contribute toa composite percentile rank for age, a speech simplifica-tion rating, and an age equivalent score. The KLPA isbased on responses to the GFTA and was used in thepresent study only to identify probands and siblings withmoderate to severe affection status; it was not employedin linkage analysis.
The Percentage of Consonants Correct (PCC) (Shriberget al. 1997) score is the percentage of intended consonantsounds that were articulated correctly in a sample of con-versational speech. Conversational speech samples wereobtained by examiners using linguistic sampling and au-diorecording techniques (Shriberg 1993). The sampleswere transcribed using computer-assisted narrow pho-netic transcription (Shriberg 2002; Shriberg and Kent2003). PCC data were obtained only for children aged4–12 years, which yielded a total of 177 observations.
Stein et al.: Locus for Speech and Reading on 3p12-q13 285
Measures of phonological memory.—The Multisylla-bic Word Test (MSW) (Catts 1986) and Nonsense WordRepetition Test (NSW) (Kamhi and Catts 1986) wereused to assess phonological short-term memory skills.Participants aged 4–18 years were asked to repeat 20multisyllabic real and 15 nonsense words in response toaudiotaped presentations of the words. Responses wereaudiotaped and transcribed, indicating the percentage ofwords correctly repeated. In prior studies, MSW andNSW have discriminated individuals with histories ofspeech and language disorders who no longer demon-strate overt speech production errors in conversationalspeech from individuals without such histories (Lewisand Freebairn 1998). Data were available for 196 chil-dren for MSW and 191 children for NSW. We refer toeither “speech-sound coding” or “phonological mem-ory” when discussing results associated with MSW orNSW.
Measure of rapid naming.—The Rapid Auditory Nam-ing test (RAN) (Denckla and Rudel 1976) is a timed taskin which participants are asked to name letters, objects,numbers, or colors as rapidly as possible. The colorssubtest (RAN-C) was used to assess speeded naming.The RAN-C assesses phonological retrieval and pro-cessing speed (Denckla and Cutting 1999). The RAN-Ctest is appropriate for children aged 5–10 years. Datawere available for 151 children in the sample.
Measure of verbal short-term memory.—Measures ofverbal short-term memory included the Sentence Imi-tation subtest of the Test of Language Development–Primary, Second Edition (TOLD-P2) (Newcomer andHammill 1988), for participants aged 5–7 years, or thecorresponding Recalling Sentences subtest from theClinical Evaluation of Language Fundamentals–Revised(CELF-R) (Semel et al. 1987), for older participants.Both subtests assess verbatim recall of sentences of vary-ing syntactic complexity. Scores were combined into asingle measure, referred to as SI, which was availablefor 193 children.
Measures of vocabulary and language comprehen-sion.—Measures of receptive and expressive vocabularyand language comprehension included the Peabody Pic-ture Vocabulary–Third Edition (PPVT-III) (Dunn andDunn 1997), the Expressive One Word Picture Vo-cabulary Test–Revised (EOWPVT-R) (Gardner 1990),and the Wechsler Individual Achievement Test (WIAT)(Wechsler 1992) Listening Comprehension subtest(WIAT-LC). These measures were given to children aged5–18 years. PPVT-III scores were available for 157 chil-dren, EOWPVT-R scores for 142 children, and WIAT-LC scores for 137 children.
Reading measures.—We administered the WoodcockReading Mastery Tests–Revised (Woodcock 1987) WordIdentification (WRMT-ID) and Word Attack (WRMT-AT) subtests to assess reading decoding, as well as the
WIAT Reading Comprehension (WIAT-RC) subtest toassess reading comprehension. These reading tests areappropriate for children aged 7–18 years, and age-stan-dardized scores were used in analysis. WRMT-ID scoreswere available for 137 children, WRMT-AT scores for135 children, and WIAT-RC scores for 136 children.
Screening Measures for Probands
Probands were ascertained for moderate to severe SSDif they scored at the 10th percentile or lower on theGFTA (Goldman and Fristoe 1986) prior to enrollmentin speech-language therapy and if they displayed at leastthree common phonological error types on the KLPA(Khan and Lewis 1986). These children were also re-quired to have a normal peripheral speech mechanism,as documented by z scores within 1 SD of the normativereference point on both the Total Function and TotalStructure subscales of the Oral and Speech Motor Con-trol Protocol (Robbins and Klee 1987). Other inclu-sionary criteria included at least low average intelligence,as defined by a Performance IQ of at least 80 on theWechsler Intelligence Scale for Children–Third Edition(WISC-III) (Wechsler 1991) or the Wechsler Preschooland Primary Scale of Intelligence Test–Revised (WPPSI-R) (Wechsler 1989), as well as normal hearing, fewerthan six episodes of otitis media prior to age 3 years,and absence of neurological disorders or developmentaldelays, as reported by the parents. Stuttering and otherdysfluencies were not included in defining affectionstatus. Siblings of probands were required to meet thesame criteria to be classified as affected. This qualitativecategorization was used only for generating descriptivestatistics in the present study. The remainder of the anal-yses were conducted on the age-appropriate quantitativetraits through use of the previously described test battery.Comorbid language disorder was diagnosed for scores1 SD below the mean on two or more subtests of astandardized language measure (TOLD-P2, CELF-P, orthe CELF-R), and comorbid reading disorder was di-agnosed for scores 1 SD below the mean on either theWRMT or the WIAT-RC. All other comorbidities werebased on historical report.
Genotyping
High-molecular-weight DNA was isolated from an al-iquot of blood through use of the Puregene Kit (GentraSystems) or from buccal swabs through use of theBioRad InstaGene Matrix protocol (BioRad Laborato-ries). DNA was arrayed in a 96-well format, and PCRwas performed in a MJ Tetrad thermocycler. To examinethe candidate region on chromosome 3, we used stan-dard methods to genotype 15 markers spanning a 56-cM region (table 1). Of these 15 markers, 12 were se-lected from the markers studied in the developmental
286 Am. J. Hum. Genet. 74:283–297, 2004
Table 1
Markers Analyzed, withGenetic Map Locations
Marker Namea
Location(cM)
D3S1766 78.6D3S1285 91.1D3S2454* 97.7D3S2406* 102.6D3S3681 109.2D3S3049* 109.2D3S2465* 111.9D3S1595* 112.4D3S1752* 114.0D3S2462* 115.1D3S3716* 115.7D3S3655* 117.7D3S2459* 119.1D3S3045* 124.1D3S2460* 134.6
a Markers indicated withan asterisk (*) were ana-lyzed by Nopola-Hemmi etal. (2001).
dyslexia research reported by Nopola-Hemmi et al.(2001).
The multiplexed markers were run on an ABI 3700capillary machine (Applied Biosystems). Five-percentblind replicates and two CEPH controls were includedon each gel to serve as internal controls. The ABI ROX500 standard (present in every lane) was used to estimatesize of alleles. Inconsistencies in the segregation of thegenotypes within families were examined using MAR-KERINFO (S.A.G.E. [2003], version 4.4). Individualsdemonstrating Mendelian inconsistencies at multiplemarkers that could not be resolved by retyping weretreated as missing for the purpose of this analysis. Intotal, 6% of the data were treated as missing. We alsochecked the marker data for any significant departuresfrom Hardy-Weinberg proportions. We then establishedthe allele frequencies for each genetic marker by simplegene counting (disregarding relationships).
Statistical Analysis
Measures.—For most probands and siblings, testscores on several variables were available at multipletime points during childhood. For all such data, we an-alyzed the first available observation, hypothesizing thatinformation at the earliest time point would be mostsensitive to SSD and associated verbal traits and leastinfluenced by uncontrolled developmental processesand experiences. We examined the effects of age, agesquared, sex, socioeconomic status (SES) based on theHollingshead Four Factor Index of Social Class (Holl-ingshead 1975), and first-order interaction terms on
these quantitative scores. Covariates and interactionterms significant at the level were adjusted fora p 0.05in a linear regression model, and standardized residualswere obtained for further statistical analyses. To adjustthe distributions of scores for severity differences, pre-school test scores were age-adjusted to 4 years (i.e., themean value at age 4 years was added to each residual),whereas school-age test scores for single-word decodingand for reading and listening comprehension were ad-justed to age 18 years (i.e., the mean value at age 18years was added to each residual). We compared themean values of affected sibs (not including the proband)and unaffected sibs through use of a t test. We alsoestimated correlations for the quantitative traits throughuse of FCOR (S.A.G.E. [2003], version 4.4).
Factor analysis.—To reduce the battery of speech/lan-guage measures to a smaller set of test constructs, prin-cipal axis factor analysis with varimax rotation wasconducted on the adjusted values for tests that wereadministered to both younger and older participants(i.e., age �4 years). To identify distinct factors, scoreswith the high cross loadings were excluded after initialanalyses, and factor analysis was repeated. The finalanalysis yielded three factors, accounting for 64% of thevariance in scores: an articulation factor (ARTF) withloadings on GFTA and PCC, a phonological short-termmemory factor (PHONF) with loadings on MSW andNSW, and a vocabulary factor (VOCF) with loadingson the PPVT-III and EOWPVT-R. The primary loadingsof the tests on their respective factors were uniformlyhigh (all 1.65), with low cross loadings (all !.26). Sep-arate analyses of data from the younger and older par-ticipants yielded similar results. For purposes of analysis,the two z scores that loaded on each factor were aver-aged to create three factor score composites.
Linkage analysis.—We conducted model-free multi-point linkage analyses of six reading and language scores(WRMT-ID, WRMT-AT, WIAT-RC, WIAT-LC, SI, andRAN-C) and three factor scores (ARTF, PHONF, andVOCF) to determine whether component traits of SSDwere influenced by QTLs in the chromosome 3 regionidentified by Nopola-Hemmi et al. (2001). The quan-titative traits comprising the three factors were examinedindividually when the factors demonstrated evidence forlinkage in the significant range (Lander and Kruglyak1995).
Genotypes from parents and offspring were used tocalculate identity by descent (IBD) allele sharing distri-butions through use of the GENIBD program of S.A.G.E.version 4.4 (S.A.G.E. 2003). Evidence for linkage wasevaluated by a Haseman-Elston regression (Haseman andElston 1972; Elston et al. 2000), as implemented in SIB-PAL (S.A.G.E., version 4.4), using either the original Has-eman-Elston regression (Haseman and Elston 1972) orthe newest adaptation of the method, which parameterizes
Stein et al.: Locus for Speech and Reading on 3p12-q13 287
the sib pair’s trait value as a weighted combination of thesquared trait difference and squared mean corrected traitsum adjusted for the nonindependence of sib pairs (W4option [Shete et al. 2003]). Although the latter is morepowerful asymptotically, in a finite sample the weightsmay not be optimally estimated, with the result that theformer method outperforms it. Therefore, the smaller Pvalues are reported. In all cases, the alternate method alsogave evidence for linkage, albeit with a slightly larger Pvalue. Asymptotic P values achieving nominal statisticalsignificance were confirmed by empirically deriving a nullpermutation distribution through use of a sample of50,000 replicate permutations of the data, as implementedin SIBPAL. These empirical P values were uncorrected formultiple testing.
Identification of sib pairs with linkage.—We sought toidentify the sib pairs that were contributing to the linkageresults for both MSW and NSW, since separate linkageanalyses of these traits suggested they were influencedindependently by the putative QTL. For each sibling pair,we computed a score based on the squared sib-pair dif-ference and the estimated sib-pair marker allele sharing,on which to rank the sib pairs for linkage informativity:
2 ˆ¯[y � (y � y ) ](p � 0.5) , (1)1 2 12
where y1 and y2 are the trait values for sibs 1 and 2, yis the average of over the whole sample, and2(y � y )1 2
is the estimated mean allele sharing for the two sibs.p12
This score is large (positive) either when the squared sibpair difference is small and is large or when thep12
squared sib-pair difference is large and is small—thatp12
is, when the sibs are similarly alike, in terms of deviationfrom the mean, for both their traits and allele-sharing;otherwise the score will tend to be small (negative). Sibpairs with values in the upper 30th percentile of thedistribution for both NSW and MSW were consideredto be linked to the locus. To verify that these sib pairsindeed contributed most to the linkage effect, the ped-igrees containing these sib pairs were removed from thedata, and linkage analysis of both NSW and MSW wasconducted again. The resulting linkage results weremuch less significant (fig. 3B).
Construction of core haplotypes in affected sibpairs.—To characterize the smallest region of allele shar-ing, we constructed haplotypes in the concordantly af-fected sib pairs with linkage, defined as being in theupper 30th percentile of the score distribution and bothsibs having low scores for NSW and MSW. The mostlikely haplotypes for each individual were constructedusing Merlin (Abecasis et al. 2002). The procedure usedthe genotype data from the 15 markers in the parentsand sibs of the linked sib pairs (which were identifiedas described above). Merlin uses sparse gene flow trees
to estimate the most likely haplotypes according to aMarkov process, under the assumption that no recom-bination occurs between consecutive markers.
Results
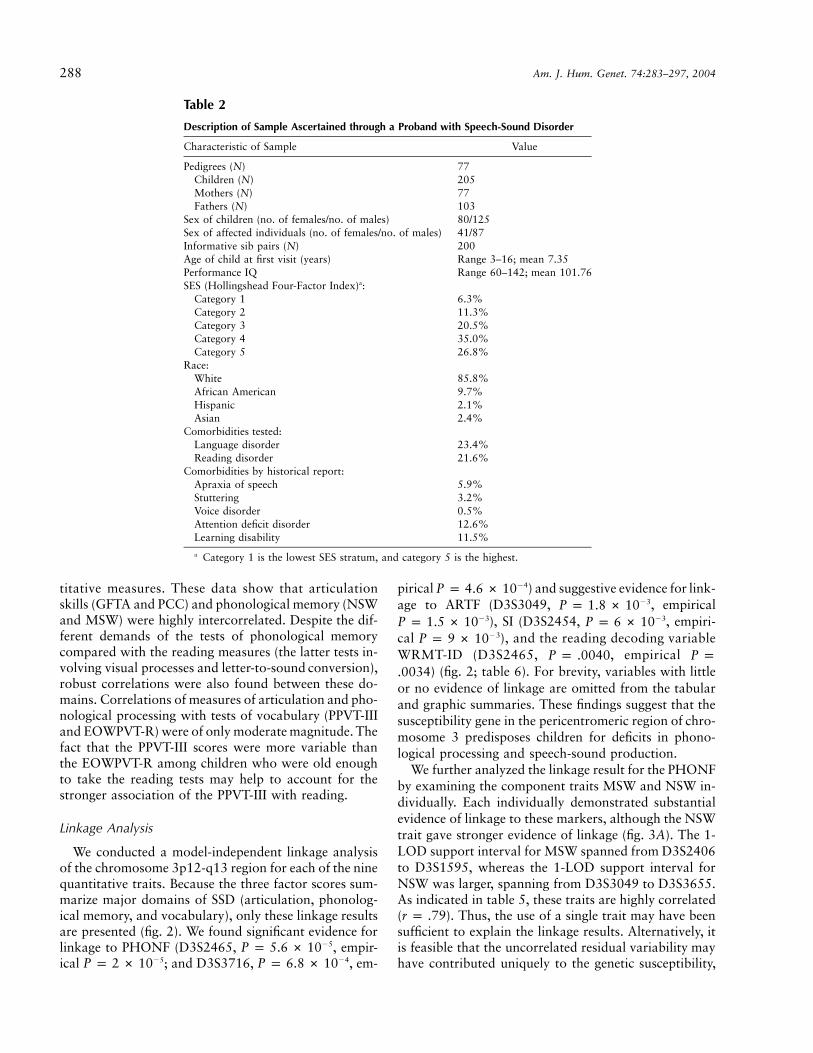
We examined speech-sound phenotypes in 77 pedigreesascertained through a proband with SSD (table 2). Pre-vious research has shown that SSD is more prevalent inmales than in females (Shriberg et al. 1999), and thiswas indeed the case in our sample, since there were morethan twice the number of affected males than females( ). Language disorder was present in 23.4% ofP p .019the children, and reading disorder was present in 21.6%(table 2). Other comorbidities were reported by the par-ents, but each represented !15% of the sample (table2). The majority of the sample was white, and most ofthe sample was from the middle- to upper-class SESstrata.
Conceptualization and Analysis of Quantitative Traits
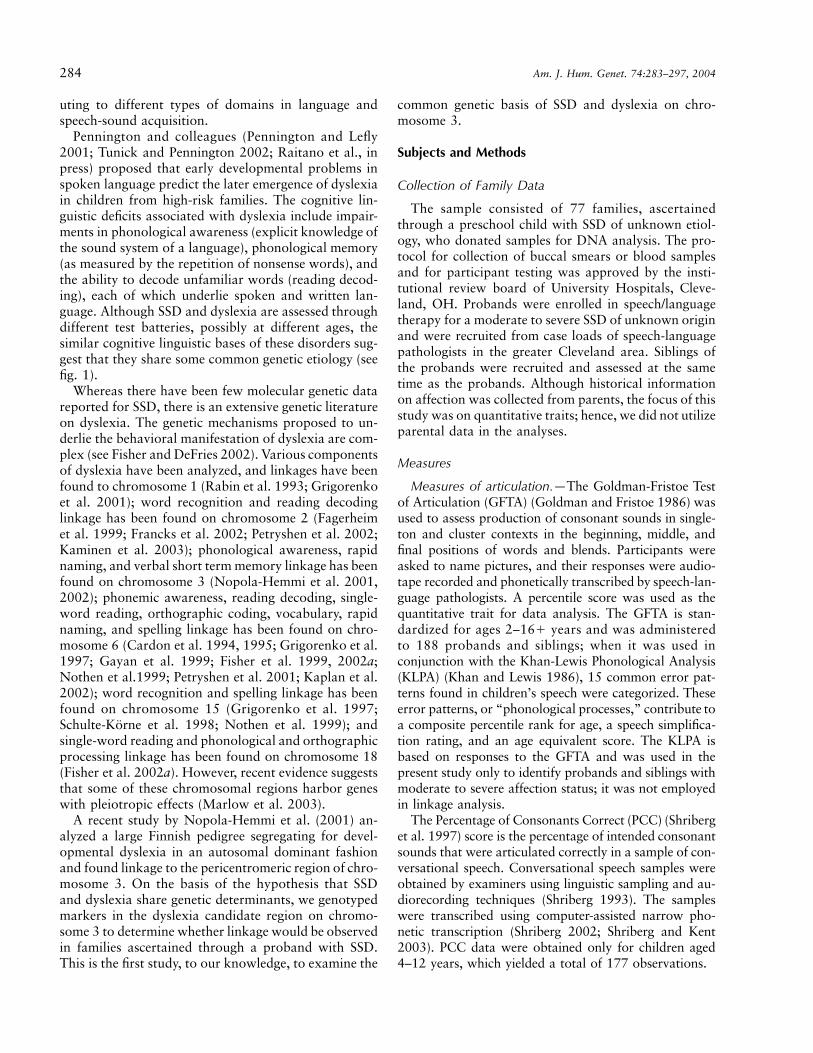
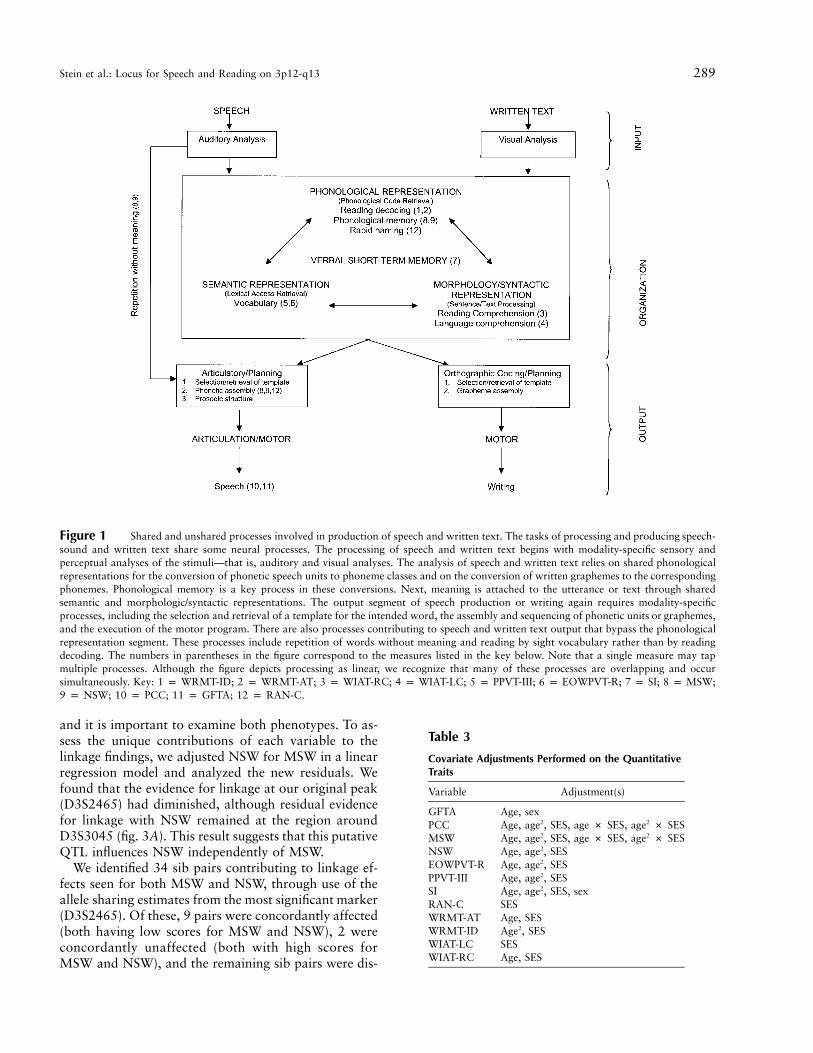
Figure 1 provides a schema conceptualizing hypothet-ical associations among the multiple speech-sound anddyslexia/reading phenotypes considered in this study. Asillustrated in the figure, the specific role of each quanti-tative trait is embedded within a far more complex cog-nitive-linguistic network, including the subdomains ofauditory and visual perception of words and letters un-derlying the production of spoken and written language.Thus, a deficit in phonological representation may un-derlie both SSD and dyslexia. Measures such as MSWand NSW assess the integrity of these representations.MSW and NSW test batteries can be presented eitherauditorily for preschoolers or as printed words for school-age children who can read; the latter invokes the use ofvisual processes, whereas the former relies on auditorymechanisms. Because we have used both types of mea-sures, we refer to the auditorily presented measure as“phonological memory” or “speech-sound coding”; testsinvoking visual processes are referred to as “readingdecoding.”
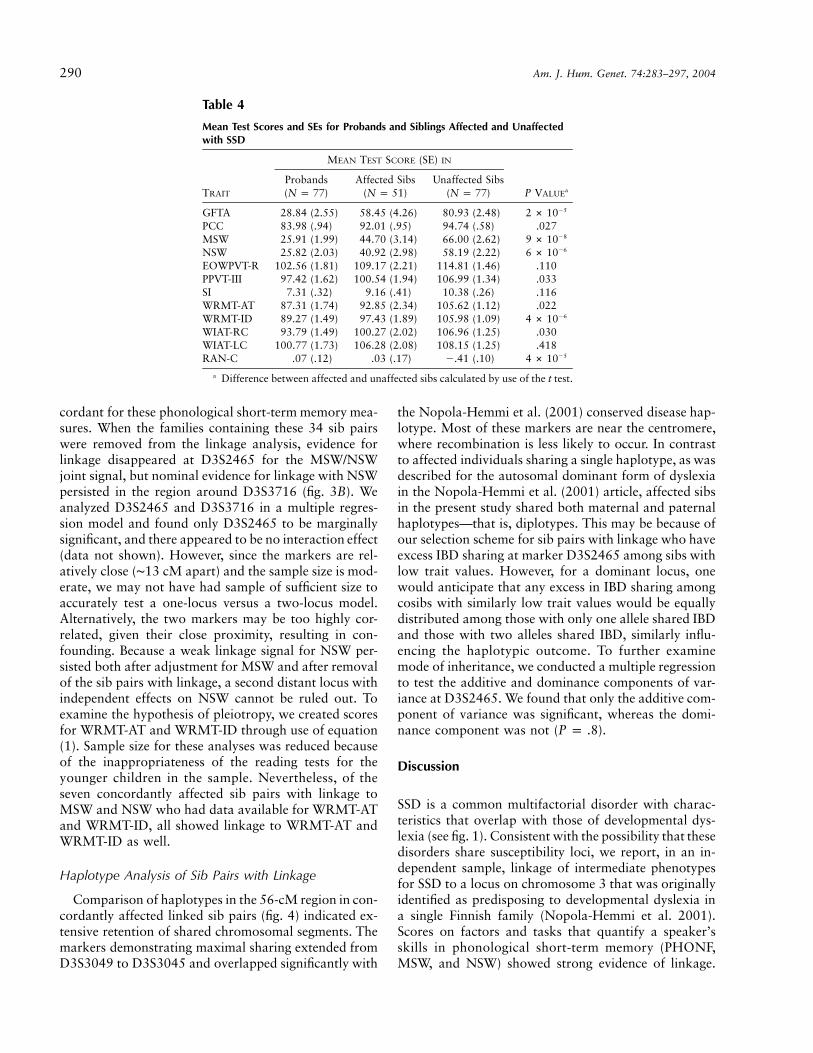
Prior to conducting linkage analysis, adjustments weremade for covariates and first-order interaction terms thataccounted for significant ( ) variance in scores.a p 0.05As shown in table 3, SES was significantly associated withmost of the traits. After covariate adjustment, significantdifferences between affected and unaffected sibs remainedon multiple measures. To characterize associations be-tween affection status and the quantitative traits, table 4presents mean scores for probands, affected siblings, andunaffected siblings. Statistically significant differences be-tween the groups were most marked for GFTA, MSW,NSW, WRMT-ID, and RAN-C.
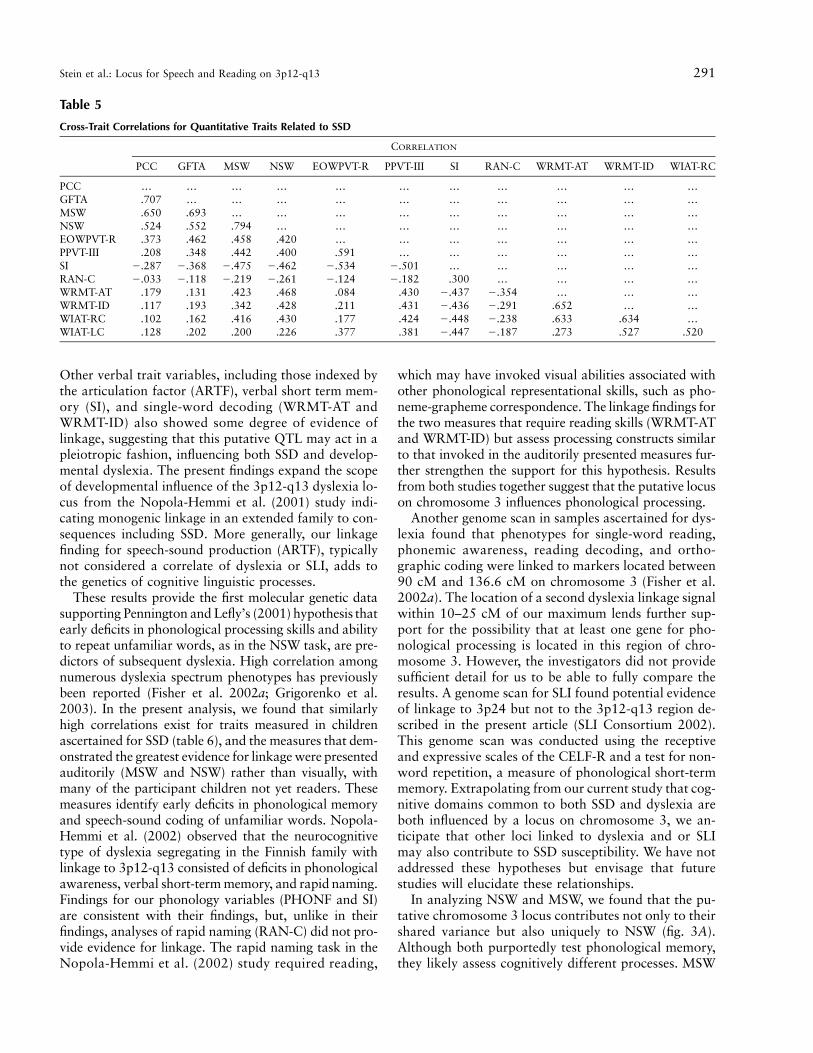
Table 5 summarizes associations between the quan-
288 Am. J. Hum. Genet. 74:283–297, 2004
Table 2
Description of Sample Ascertained through a Proband with Speech-Sound Disorder
Characteristic of Sample Value
Pedigrees (N) 77Children (N) 205Mothers (N) 77Fathers (N) 103
Sex of children (no. of females/no. of males) 80/125Sex of affected individuals (no. of females/no. of males) 41/87Informative sib pairs (N) 200Age of child at first visit (years) Range 3–16; mean 7.35Performance IQ Range 60–142; mean 101.76SES (Hollingshead Four-Factor Index)a:
Category 1 6.3%Category 2 11.3%Category 3 20.5%Category 4 35.0%Category 5 26.8%
Race:White 85.8%African American 9.7%Hispanic 2.1%Asian 2.4%
Comorbidities tested:Language disorder 23.4%Reading disorder 21.6%
Comorbidities by historical report:Apraxia of speech 5.9%Stuttering 3.2%Voice disorder 0.5%Attention deficit disorder 12.6%Learning disability 11.5%
a Category 1 is the lowest SES stratum, and category 5 is the highest.
titative measures. These data show that articulationskills (GFTA and PCC) and phonological memory (NSWand MSW) were highly intercorrelated. Despite the dif-ferent demands of the tests of phonological memorycompared with the reading measures (the latter tests in-volving visual processes and letter-to-sound conversion),robust correlations were also found between these do-mains. Correlations of measures of articulation and pho-nological processing with tests of vocabulary (PPVT-IIIand EOWPVT-R) were of only moderate magnitude. Thefact that the PPVT-III scores were more variable thanthe EOWPVT-R among children who were old enoughto take the reading tests may help to account for thestronger association of the PPVT-III with reading.
Linkage Analysis
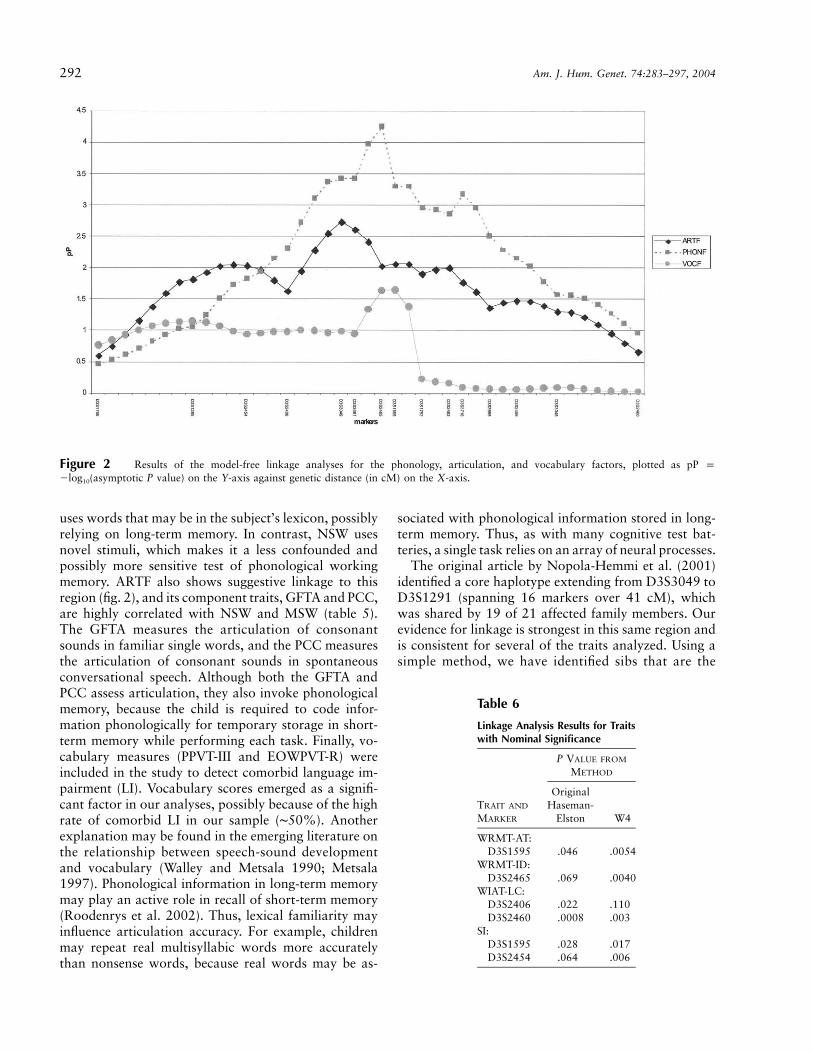
We conducted a model-independent linkage analysisof the chromosome 3p12-q13 region for each of the ninequantitative traits. Because the three factor scores sum-marize major domains of SSD (articulation, phonolog-ical memory, and vocabulary), only these linkage resultsare presented (fig. 2). We found significant evidence forlinkage to PHONF (D3S2465, , empir-�5P p 5.6 # 10ical ; and D3S3716, , em-�5 �4P p 2 # 10 P p 6.8 # 10
pirical ) and suggestive evidence for link-�4P p 4.6 # 10age to ARTF (D3S3049, , empirical�3P p 1.8 # 10
), SI (D3S2454, , empiri-�3 �3P p 1.5 # 10 P p 6 # 10cal ), and the reading decoding variable�3P p 9 # 10WRMT-ID (D3S2465, , empiricalP p .0040 P p
) (fig. 2; table 6). For brevity, variables with little.0034or no evidence of linkage are omitted from the tabularand graphic summaries. These findings suggest that thesusceptibility gene in the pericentromeric region of chro-mosome 3 predisposes children for deficits in phono-logical processing and speech-sound production.
We further analyzed the linkage result for the PHONFby examining the component traits MSW and NSW in-dividually. Each individually demonstrated substantialevidence of linkage to these markers, although the NSWtrait gave stronger evidence of linkage (fig. 3A). The 1-LOD support interval for MSW spanned from D3S2406to D3S1595, whereas the 1-LOD support interval forNSW was larger, spanning from D3S3049 to D3S3655.As indicated in table 5, these traits are highly correlated( ). Thus, the use of a single trait may have beenr p .79sufficient to explain the linkage results. Alternatively, itis feasible that the uncorrelated residual variability mayhave contributed uniquely to the genetic susceptibility,
Stein et al.: Locus for Speech and Reading on 3p12-q13 289
Figure 1 Shared and unshared processes involved in production of speech and written text. The tasks of processing and producing speech-sound and written text share some neural processes. The processing of speech and written text begins with modality-specific sensory andperceptual analyses of the stimuli—that is, auditory and visual analyses. The analysis of speech and written text relies on shared phonologicalrepresentations for the conversion of phonetic speech units to phoneme classes and on the conversion of written graphemes to the correspondingphonemes. Phonological memory is a key process in these conversions. Next, meaning is attached to the utterance or text through sharedsemantic and morphologic/syntactic representations. The output segment of speech production or writing again requires modality-specificprocesses, including the selection and retrieval of a template for the intended word, the assembly and sequencing of phonetic units or graphemes,and the execution of the motor program. There are also processes contributing to speech and written text output that bypass the phonologicalrepresentation segment. These processes include repetition of words without meaning and reading by sight vocabulary rather than by readingdecoding. The numbers in parentheses in the figure correspond to the measures listed in the key below. Note that a single measure may tapmultiple processes. Although the figure depicts processing as linear, we recognize that many of these processes are overlapping and occursimultaneously. Key: 1 p WRMT-ID; 2 p WRMT-AT; 3 p WIAT-RC; 4 p WIAT-LC; 5 p PPVT-III; 6 p EOWPVT-R; 7 p SI; 8 p MSW;9 p NSW; 10 p PCC; 11 p GFTA; 12 p RAN-C.
Table 3
Covariate Adjustments Performed on the QuantitativeTraits
Variable Adjustment(s)
GFTA Age, sexPCC Age, age2, SES, age # SES, age2 # SESMSW Age, age2, SES, age # SES, age2 # SESNSW Age, age2, SESEOWPVT-R Age, age2, SESPPVT-III Age, age2, SESSI Age, age2, SES, sexRAN-C SESWRMT-AT Age, SESWRMT-ID Age2, SESWIAT-LC SESWIAT-RC Age, SES
and it is important to examine both phenotypes. To as-sess the unique contributions of each variable to thelinkage findings, we adjusted NSW for MSW in a linearregression model and analyzed the new residuals. Wefound that the evidence for linkage at our original peak(D3S2465) had diminished, although residual evidencefor linkage with NSW remained at the region aroundD3S3045 (fig. 3A). This result suggests that this putativeQTL influences NSW independently of MSW.
We identified 34 sib pairs contributing to linkage ef-fects seen for both MSW and NSW, through use of theallele sharing estimates from the most significant marker(D3S2465). Of these, 9 pairs were concordantly affected(both having low scores for MSW and NSW), 2 wereconcordantly unaffected (both with high scores forMSW and NSW), and the remaining sib pairs were dis-
290 Am. J. Hum. Genet. 74:283–297, 2004
Table 4
Mean Test Scores and SEs for Probands and Siblings Affected and Unaffectedwith SSD
TRAIT
MEAN TEST SCORE (SE) IN
P VALUEa
Probands( )N p 77
Affected Sibs( )N p 51
Unaffected Sibs( )N p 77
GFTA 28.84 (2.55) 58.45 (4.26) 80.93 (2.48) �52 # 10PCC 83.98 (.94) 92.01 (.95) 94.74 (.58) .027MSW 25.91 (1.99) 44.70 (3.14) 66.00 (2.62) �89 # 10NSW 25.82 (2.03) 40.92 (2.98) 58.19 (2.22) �66 # 10EOWPVT-R 102.56 (1.81) 109.17 (2.21) 114.81 (1.46) .110PPVT-III 97.42 (1.62) 100.54 (1.94) 106.99 (1.34) .033SI 7.31 (.32) 9.16 (.41) 10.38 (.26) .116WRMT-AT 87.31 (1.74) 92.85 (2.34) 105.62 (1.12) .022WRMT-ID 89.27 (1.49) 97.43 (1.89) 105.98 (1.09) �64 # 10WIAT-RC 93.79 (1.49) 100.27 (2.02) 106.96 (1.25) .030WIAT-LC 100.77 (1.73) 106.28 (2.08) 108.15 (1.25) .418RAN-C .07 (.12) .03 (.17) �.41 (.10) �54 # 10
a Difference between affected and unaffected sibs calculated by use of the t test.
cordant for these phonological short-term memory mea-sures. When the families containing these 34 sib pairswere removed from the linkage analysis, evidence forlinkage disappeared at D3S2465 for the MSW/NSWjoint signal, but nominal evidence for linkage with NSWpersisted in the region around D3S3716 (fig. 3B). Weanalyzed D3S2465 and D3S3716 in a multiple regres-sion model and found only D3S2465 to be marginallysignificant, and there appeared to be no interaction effect(data not shown). However, since the markers are rel-atively close (∼13 cM apart) and the sample size is mod-erate, we may not have had sample of sufficient size toaccurately test a one-locus versus a two-locus model.Alternatively, the two markers may be too highly cor-related, given their close proximity, resulting in con-founding. Because a weak linkage signal for NSW per-sisted both after adjustment for MSW and after removalof the sib pairs with linkage, a second distant locus withindependent effects on NSW cannot be ruled out. Toexamine the hypothesis of pleiotropy, we created scoresfor WRMT-AT and WRMT-ID through use of equation(1). Sample size for these analyses was reduced becauseof the inappropriateness of the reading tests for theyounger children in the sample. Nevertheless, of theseven concordantly affected sib pairs with linkage toMSW and NSW who had data available for WRMT-ATand WRMT-ID, all showed linkage to WRMT-AT andWRMT-ID as well.
Haplotype Analysis of Sib Pairs with Linkage
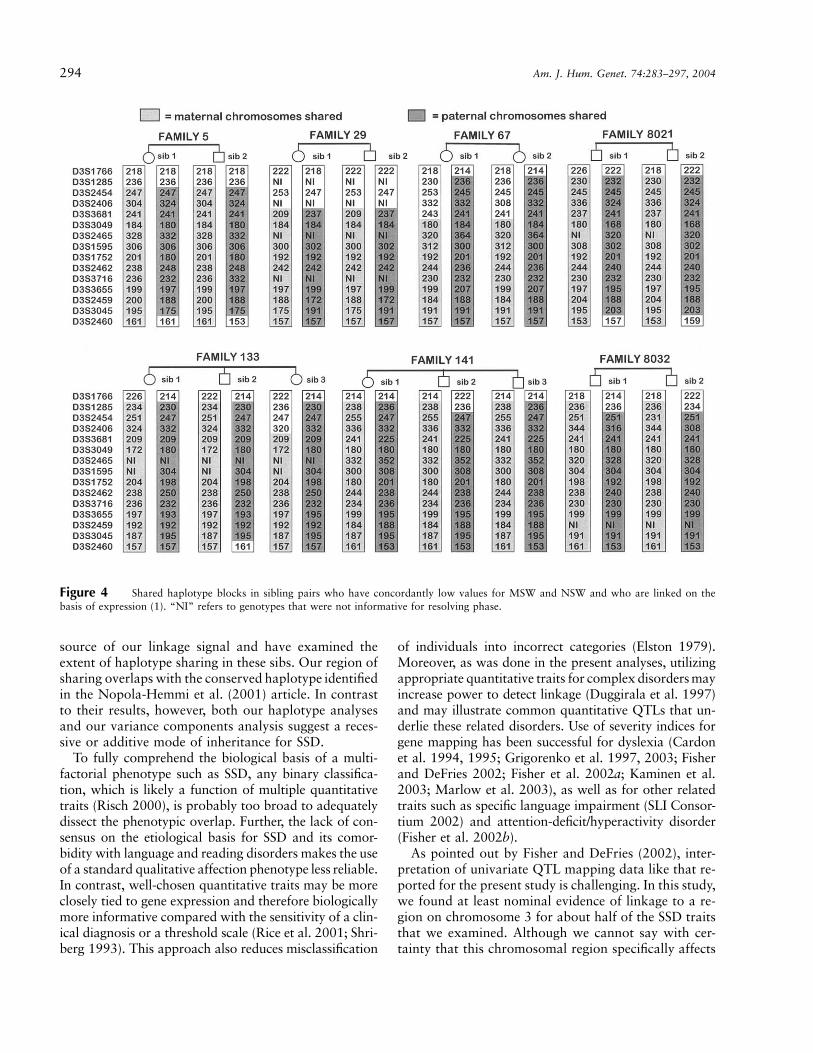
Comparison of haplotypes in the 56-cM region in con-cordantly affected linked sib pairs (fig. 4) indicated ex-tensive retention of shared chromosomal segments. Themarkers demonstrating maximal sharing extended fromD3S3049 to D3S3045 and overlapped significantly with
the Nopola-Hemmi et al. (2001) conserved disease hap-lotype. Most of these markers are near the centromere,where recombination is less likely to occur. In contrastto affected individuals sharing a single haplotype, as wasdescribed for the autosomal dominant form of dyslexiain the Nopola-Hemmi et al. (2001) article, affected sibsin the present study shared both maternal and paternalhaplotypes—that is, diplotypes. This may be because ofour selection scheme for sib pairs with linkage who haveexcess IBD sharing at marker D3S2465 among sibs withlow trait values. However, for a dominant locus, onewould anticipate that any excess in IBD sharing amongcosibs with similarly low trait values would be equallydistributed among those with only one allele shared IBDand those with two alleles shared IBD, similarly influ-encing the haplotypic outcome. To further examinemode of inheritance, we conducted a multiple regressionto test the additive and dominance components of var-iance at D3S2465. We found that only the additive com-ponent of variance was significant, whereas the domi-nance component was not ( ).P p .8
Discussion
SSD is a common multifactorial disorder with charac-teristics that overlap with those of developmental dys-lexia (see fig. 1). Consistent with the possibility that thesedisorders share susceptibility loci, we report, in an in-dependent sample, linkage of intermediate phenotypesfor SSD to a locus on chromosome 3 that was originallyidentified as predisposing to developmental dyslexia ina single Finnish family (Nopola-Hemmi et al. 2001).Scores on factors and tasks that quantify a speaker’sskills in phonological short-term memory (PHONF,MSW, and NSW) showed strong evidence of linkage.
Stein et al.: Locus for Speech and Reading on 3p12-q13 291
Table 5
Cross-Trait Correlations for Quantitative Traits Related to SSD
CORRELATION
PCC GFTA MSW NSW EOWPVT-R PPVT-III SI RAN-C WRMT-AT WRMT-ID WIAT-RC
PCC … … … … … … … … … … …GFTA .707 … … … … … … … … … …MSW .650 .693 … … … … … … … … …NSW .524 .552 .794 … … … … … … … …EOWPVT-R .373 .462 .458 .420 … … … … … … …PPVT-III .208 .348 .442 .400 .591 … … … … … …SI �.287 �.368 �.475 �.462 �.534 �.501 … … … … …RAN-C �.033 �.118 �.219 �.261 �.124 �.182 .300 … … … …WRMT-AT .179 .131 .423 .468 .084 .430 �.437 �.354 … … …WRMT-ID .117 .193 .342 .428 .211 .431 �.436 �.291 .652 … …WIAT-RC .102 .162 .416 .430 .177 .424 �.448 �.238 .633 .634 …WIAT-LC .128 .202 .200 .226 .377 .381 �.447 �.187 .273 .527 .520
Other verbal trait variables, including those indexed bythe articulation factor (ARTF), verbal short term mem-ory (SI), and single-word decoding (WRMT-AT andWRMT-ID) also showed some degree of evidence oflinkage, suggesting that this putative QTL may act in apleiotropic fashion, influencing both SSD and develop-mental dyslexia. The present findings expand the scopeof developmental influence of the 3p12-q13 dyslexia lo-cus from the Nopola-Hemmi et al. (2001) study indi-cating monogenic linkage in an extended family to con-sequences including SSD. More generally, our linkagefinding for speech-sound production (ARTF), typicallynot considered a correlate of dyslexia or SLI, adds tothe genetics of cognitive linguistic processes.
These results provide the first molecular genetic datasupporting Pennington and Lefly’s (2001) hypothesis thatearly deficits in phonological processing skills and abilityto repeat unfamiliar words, as in the NSW task, are pre-dictors of subsequent dyslexia. High correlation amongnumerous dyslexia spectrum phenotypes has previouslybeen reported (Fisher et al. 2002a; Grigorenko et al.2003). In the present analysis, we found that similarlyhigh correlations exist for traits measured in childrenascertained for SSD (table 6), and the measures that dem-onstrated the greatest evidence for linkage were presentedauditorily (MSW and NSW) rather than visually, withmany of the participant children not yet readers. Thesemeasures identify early deficits in phonological memoryand speech-sound coding of unfamiliar words. Nopola-Hemmi et al. (2002) observed that the neurocognitivetype of dyslexia segregating in the Finnish family withlinkage to 3p12-q13 consisted of deficits in phonologicalawareness, verbal short-term memory, and rapid naming.Findings for our phonology variables (PHONF and SI)are consistent with their findings, but, unlike in theirfindings, analyses of rapid naming (RAN-C) did not pro-vide evidence for linkage. The rapid naming task in theNopola-Hemmi et al. (2002) study required reading,
which may have invoked visual abilities associated withother phonological representational skills, such as pho-neme-grapheme correspondence. The linkage findings forthe two measures that require reading skills (WRMT-ATand WRMT-ID) but assess processing constructs similarto that invoked in the auditorily presented measures fur-ther strengthen the support for this hypothesis. Resultsfrom both studies together suggest that the putative locuson chromosome 3 influences phonological processing.
Another genome scan in samples ascertained for dys-lexia found that phenotypes for single-word reading,phonemic awareness, reading decoding, and ortho-graphic coding were linked to markers located between90 cM and 136.6 cM on chromosome 3 (Fisher et al.2002a). The location of a second dyslexia linkage signalwithin 10–25 cM of our maximum lends further sup-port for the possibility that at least one gene for pho-nological processing is located in this region of chro-mosome 3. However, the investigators did not providesufficient detail for us to be able to fully compare theresults. A genome scan for SLI found potential evidenceof linkage to 3p24 but not to the 3p12-q13 region de-scribed in the present article (SLI Consortium 2002).This genome scan was conducted using the receptiveand expressive scales of the CELF-R and a test for non-word repetition, a measure of phonological short-termmemory. Extrapolating from our current study that cog-nitive domains common to both SSD and dyslexia areboth influenced by a locus on chromosome 3, we an-ticipate that other loci linked to dyslexia and or SLImay also contribute to SSD susceptibility. We have notaddressed these hypotheses but envisage that futurestudies will elucidate these relationships.
In analyzing NSW and MSW, we found that the pu-tative chromosome 3 locus contributes not only to theirshared variance but also uniquely to NSW (fig. 3A).Although both purportedly test phonological memory,they likely assess cognitively different processes. MSW
292 Am. J. Hum. Genet. 74:283–297, 2004
Figure 2 Results of the model-free linkage analyses for the phonology, articulation, and vocabulary factors, plotted as pP p�log10(asymptotic P value) on the Y-axis against genetic distance (in cM) on the X-axis.
Table 6
Linkage Analysis Results for Traitswith Nominal Significance
TRAIT AND
MARKER
P VALUE FROM
METHOD
OriginalHaseman-
Elston W4
WRMT-AT:D3S1595 .046 .0054
WRMT-ID:D3S2465 .069 .0040
WIAT-LC:D3S2406 .022 .110D3S2460 .0008 .003
SI:D3S1595 .028 .017D3S2454 .064 .006
uses words that may be in the subject’s lexicon, possiblyrelying on long-term memory. In contrast, NSW usesnovel stimuli, which makes it a less confounded andpossibly more sensitive test of phonological workingmemory. ARTF also shows suggestive linkage to thisregion (fig. 2), and its component traits, GFTA and PCC,are highly correlated with NSW and MSW (table 5).The GFTA measures the articulation of consonantsounds in familiar single words, and the PCC measuresthe articulation of consonant sounds in spontaneousconversational speech. Although both the GFTA andPCC assess articulation, they also invoke phonologicalmemory, because the child is required to code infor-mation phonologically for temporary storage in short-term memory while performing each task. Finally, vo-cabulary measures (PPVT-III and EOWPVT-R) wereincluded in the study to detect comorbid language im-pairment (LI). Vocabulary scores emerged as a signifi-cant factor in our analyses, possibly because of the highrate of comorbid LI in our sample (∼50%). Anotherexplanation may be found in the emerging literature onthe relationship between speech-sound developmentand vocabulary (Walley and Metsala 1990; Metsala1997). Phonological information in long-term memorymay play an active role in recall of short-term memory(Roodenrys et al. 2002). Thus, lexical familiarity mayinfluence articulation accuracy. For example, childrenmay repeat real multisyllabic words more accuratelythan nonsense words, because real words may be as-
sociated with phonological information stored in long-term memory. Thus, as with many cognitive test bat-teries, a single task relies on an array of neural processes.
The original article by Nopola-Hemmi et al. (2001)identified a core haplotype extending from D3S3049 toD3S1291 (spanning 16 markers over 41 cM), whichwas shared by 19 of 21 affected family members. Ourevidence for linkage is strongest in this same region andis consistent for several of the traits analyzed. Using asimple method, we have identified sibs that are the
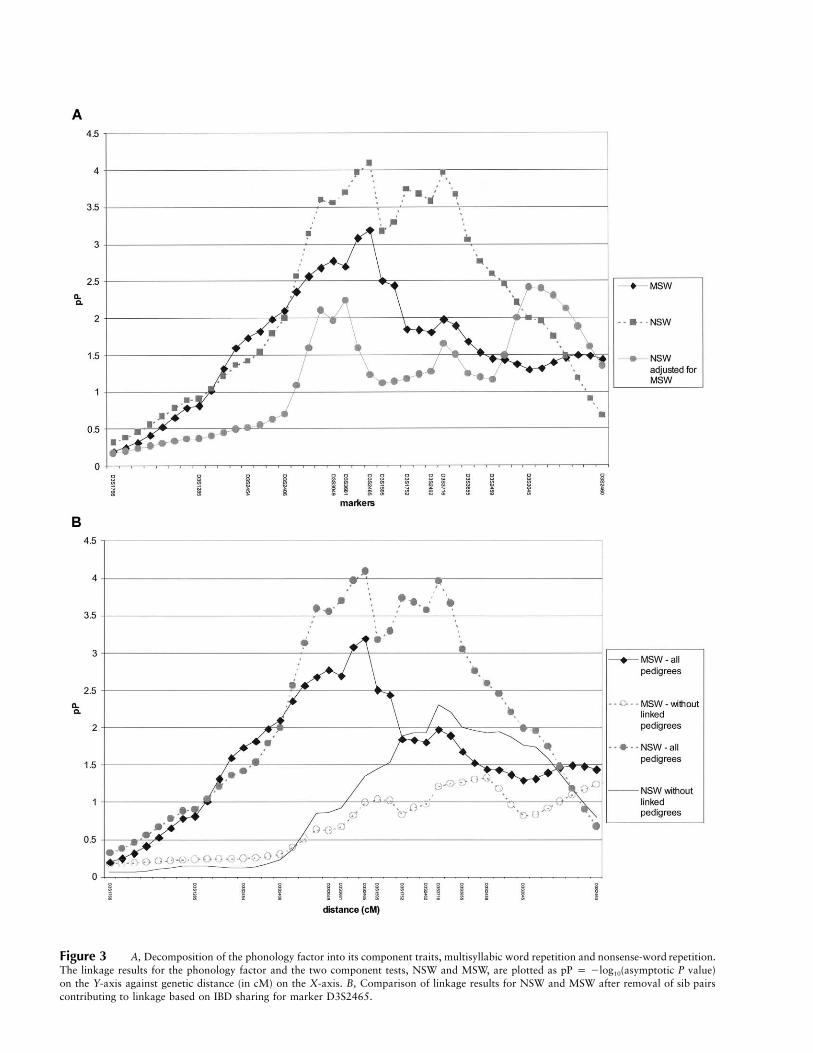
Figure 3 A, Decomposition of the phonology factor into its component traits, multisyllabic word repetition and nonsense-word repetition.The linkage results for the phonology factor and the two component tests, NSW and MSW, are plotted as pP p �log10(asymptotic P value)on the Y-axis against genetic distance (in cM) on the X-axis. B, Comparison of linkage results for NSW and MSW after removal of sib pairscontributing to linkage based on IBD sharing for marker D3S2465.
294 Am. J. Hum. Genet. 74:283–297, 2004
Figure 4 Shared haplotype blocks in sibling pairs who have concordantly low values for MSW and NSW and who are linked on thebasis of expression (1). “NI” refers to genotypes that were not informative for resolving phase.
source of our linkage signal and have examined theextent of haplotype sharing in these sibs. Our region ofsharing overlaps with the conserved haplotype identifiedin the Nopola-Hemmi et al. (2001) article. In contrastto their results, however, both our haplotype analysesand our variance components analysis suggest a reces-sive or additive mode of inheritance for SSD.
To fully comprehend the biological basis of a multi-factorial phenotype such as SSD, any binary classifica-tion, which is likely a function of multiple quantitativetraits (Risch 2000), is probably too broad to adequatelydissect the phenotypic overlap. Further, the lack of con-sensus on the etiological basis for SSD and its comor-bidity with language and reading disorders makes the useof a standard qualitative affection phenotype less reliable.In contrast, well-chosen quantitative traits may be moreclosely tied to gene expression and therefore biologicallymore informative compared with the sensitivity of a clin-ical diagnosis or a threshold scale (Rice et al. 2001; Shri-berg 1993). This approach also reduces misclassification
of individuals into incorrect categories (Elston 1979).Moreover, as was done in the present analyses, utilizingappropriate quantitative traits for complex disorders mayincrease power to detect linkage (Duggirala et al. 1997)and may illustrate common quantitative QTLs that un-derlie these related disorders. Use of severity indices forgene mapping has been successful for dyslexia (Cardonet al. 1994, 1995; Grigorenko et al. 1997, 2003; Fisherand DeFries 2002; Fisher et al. 2002a; Kaminen et al.2003; Marlow et al. 2003), as well as for other relatedtraits such as specific language impairment (SLI Consor-tium 2002) and attention-deficit/hyperactivity disorder(Fisher et al. 2002b).
As pointed out by Fisher and DeFries (2002), inter-pretation of univariate QTL mapping data like that re-ported for the present study is challenging. In this study,we found at least nominal evidence of linkage to a re-gion on chromosome 3 for about half of the SSD traitsthat we examined. Although we cannot say with cer-tainty that this chromosomal region specifically affects
Stein et al.: Locus for Speech and Reading on 3p12-q13 295
deficits common to both SSD and developmental dys-lexia, the reports reviewed and findings from the presentresults support that conclusion. Further, our linkageanalysis suggests that this locus on chromosome 3 af-fects a core domain of SSD, articulation, which, to ourknowledge, we are the first to examine. Since our var-iables for phonological memory (NSW/MSW) are cor-related with the articulation measures (see table 5), weare unable to specify whether the linkage with the ARTFfactor is due to articulation alone. We are in the processof testing a larger sample and plan to use multivariatelinkage analysis (cf. Marlow et al. 2003; Stein et al.2003) to address this issue. Our data also cannot beused to distinguish between the presence of one or twogenes in this region. A similar pattern was seen in an-other quantitative trait analysis of dyslexia (Grigorenkoet al. 2003). Because we have a moderately sized sample,we may not have the statistical power to resolve ac-curately a single versus multiple QTL model (Cordell2001). Such information awaits a multivariate analysisof an independent sample.
Lastly, we acknowledge that additional loci withlarger effect sizes associated with the domains depictedin figure 1 can be identified through genomewide scan-ning of this cohort. We are in the process of assemblinga larger cohort, so that we can undertake this task.Because our focus is on speech-sound production, weare especially interested in identifying loci that wouldnot ordinarily be identified through scans for dyslexiaand SLI.
Acknowledgments
This study was supported by U. S. Public Health NationalInstitute on Deafness and Other Communication Disordersresearch grants NIDCD DC00528 and DC-004005, NationalInstitute of General Medical Sciences grant GM 28656, andNational Heart, Lung, and Blood Institute training grant HL07567. The results of this study were obtained by using theprogram package S.A.G.E., release 4.4, which is supported byU. S. Public Health Resource Grant RR03655 from the Na-tional Center for Research Resources. We are grateful to thefamilies who participated in this research. We would also liketo thank Mrs. Paula Wedig, who rendered technical assistanceon the manuscript. Finally, we would like to thank the anon-ymous reviewers for suggestions they made on the content ofthis article.
References
Abecasis G, Cherny S, Cookson W, Cardon L (2002) Merlin—rapid analysis of dense genetic maps using sparse gene flowtrees. Nat Genet 30:97–101
Aram DM, Hall NC (1989) Longitudinal follow-up of childrenwith preschool communication disorders: treatment impli-cations. School Psych Rev 18:487–501
Bishop D, Adams C (1990) A prospective study of the rela-tionship between specific language impairment, phonolog-ical disorders, and reading retardation. J Child Psychol Psy-chiatry 31:1027–1050
Bishop D, North T, Donlan C (1996) Nonword repetition asa behavioural marker for inherited language impairment:evidence from a twin study. J Child Psychol Psychiatry 37:391–403
Cardon L, Smith S, Fulker D, Kimberling W, Pennington B,DeFries J (1994) Quantitative trait locus for reading disa-bility on chromosome 6. Science 266:276–279
——— (1995) Quantitative trait locus for reading disability:correction. Science 268:1553
Catts H (1986) Speech production/phonological deficits inreading disordered children. J Learn Disabil 19:504–508
Cordell H (2001) Sample size requirements to control for sto-chastic variation in magnitude and location of allele-sharinglinkage statistics in affected sibling pairs. Ann Hum Genet65:491–502
Denckla M, Cutting L (1999) History and significance of rapidauditory naming. Ann Dyslexia 49:29–42
Denckla M, Rudel R (1976) Rapid “automatized” naming(R.A.N.): dyslexia differentiated from other learning disa-bilities. Neuropsychologia 14:471–479
Duggirala R, Williams J, Williams-Blangero S, Blangero J(1997) A variance components approach to dichotomoustrait linkage analysis using a threshold model. Genet Epi-demiol 14:987–992
Dunn L, Dunn L (1997) Peabody picture vocabulary test–thirdedition. American Guidance Service, Circle Pines, MN
Elston R (1979) Major locus analysis for quantitative traits.Am J Hum Genet 31:655–661
Elston R, Buxbaum S, Jacobs K, Olson J (2000) Haseman andElston revisited. Genet Epidemiol 19:1–17
Fagerheim T, Raeymaekers P, Tonnessen FE, Pedersen M, Tra-nebjaerg L, Lubs HA (1999) A new gene (DYX3) for dys-lexia is located on chromosome 2. J Med Genet 36: 664–669
Felsenfeld S, McGue M, Broen P (1995) Familial aggregationof phonological disorders: results from a 28 year follow-up.J Speech Hear Res 38:1091–1107
Fisher S, DeFries J (2002) Developmental dyslexia: genetic dis-section of a complex cognitive trait. Nat Rev Neurosci 3:767–780
Fisher S, Francks C, Marlow A, MacPhie I, Newbury D, Car-don L, Ishikawa-Brush Y, Richardson AJ, Talcott JB, GayanJ, Olson RK, Pennington BF, Smith SD, Stein JF, MonacoAP (2002a) Independent genome-wide scans identify a chro-mosome 18 quantitative-trait locus influencing dyslexia. NatGenet 30:86–91
Fisher S, Francks C, McCracken J, McGough J, Marlow A,MacPhie I, Newbury D, Crawford LR, Palmer CGS, Wood-ward JA, Del’Homme M, Cantwell DP, Nelson DP, MonacoAP, Smalley SL (2002b) A genomewide scan for loci involvedin attention-deficit/hyperactivity disorder. Am J Hum Genet70:1183–1196
Fisher SE, Marlow AJ, Lamb J, Maestrini E, Williams DF,Richardson AJ, Weeks DE, Stein JF, Monaco AP (1999) Aquantitative-trait locus on chromosome 6p influences dif-
296 Am. J. Hum. Genet. 74:283–297, 2004
ferent aspects of developmental dyslexia. Am J Hum Genet64:146–156
Fisher SE, Vargha-Khadem F, Watkins KE, Monaco AP, Pem-brey ME (1998) Localisation of a gene implicated in a severespeech and language disorder. Nat Genet 18:168–170
Francks C, Fisher SE, Olson RK, Pennington BF, Smith SD,DeFries JC, Monaco A (2002) Fine mapping of the chro-mosome 2p12-16 dyslexia susceptibility locus: quantitativeassociation analysis and positional candidate genes SEMA4Fand OTX1. Psychiatr Genet 12:35–41
Gardner M (1990) Expressive one word picture vocabularytest–revised. Academic Therapy Publications, Novato, CA
Gayan J, Smith S, Cherny S, Cardon L, Fulker D, Brower A,Olson R, Pennington BF, DeFries JC (1999) Quantitative-trait locus for specific language and reading deficits on chro-mosome 6p. Am J Hum Genet 64:157–164
Goldman R, Fristoe M (1986) The Goldman-Fristoe test ofarticulation. American Guidance Service, Circle Pines, MN
Grigorenko E, Wood F, Golovyan L, Meyer M, Romano C,Pauls D (2003) Continuing the search for dyslexia genes on6p. Am J Med Genet 118B:89–98
Grigorenko E, Wood F, Meyer M, Hart L, Speed W, ShusterA, Pauls D (1997) Susceptibility loci for distinct componentsof developmental dyslexia on chromosome 6 and 15. Am JHum Genet 60:27–39
Grigorenko EL, Wood FB, Meyer MS, Pauls JE, Hart LA, PaulsDL (2001) Linkage studies suggest a possible locus for de-velopmental dyslexia on chromosome 1p. Am J Med Genet105: 120–129
Haseman J, Elston R (1972) The investigation of linkage be-tween a quantitative trait and a marker locus. Behav Genet2:3–19
Hollingshead A (1975) Four factor index of social class. Report#06520, Department of Sociology, Yale University, New Ha-ven, CT
Kamhi A, Catts H (1986) Toward an understanding of de-velopmental language disorders and reading disorders. JSpeech Hear Disord 51:337–347
Kaminen N, Hannula-Jouppi K, Kestila M, Lahermo P, MullerK, Kaaranen M, Myllyluoma B, Voutilainen A, Lyytinen H,Nopola-Hemmi J, Kere J (2003) A genome scan for devel-opmental dyslexia confirms linkage to chromosome 2p11and suggests a new locus on 7q32. J Med Genet 40:340–345
Kaplan DE, Gayan J, Ahn J, Won TW, Pauls D, Olson RK,DeFries JC, Wood F, Pennington BF, Page GP, Smith SD,Gruen JR (2002) Evidence for linkage and association withreading ability on 6p21.3-22. Am J Hum Genet 70: 1287–1298
Khan L, Lewis N (1986) Khan-Lewis phonological analysis.American Guidance Service, Circle Pines, MN
Lander E, Kruglyak L (1995) Genetic dissection of complextraits: guidelines for interpreting and reporting linkage re-sults. Nat Genet 11:241–247
Lewis B (1992) Pedigree analysis of children with phonologydisorders. J Learn Disabil 25:586–597
Lewis B, Cox N, Byard P (1993) Segregation analysis of speechand language disorders. Behav Genet 23:291–297
Lewis B, Ekelman B, Aram D (1989) A familial study of severephonological disorders. J Speech Hear Res 32:713–724
Lewis B, Freebairn L (1998) Speech production skills of nuclearfamily members of children with phonology disorders. LangSpeech 41:45–61
Lewis B, Freebairn L, Taylor H (2000) Follow-up of childrenwith early expressive phonology disorders. J Learn Disabil33:433–444
Lewis B, Thompson L (1992) A study of developmental speechand language disorders in twins. J Speech Hear Res 35:1086–1094
Marlow A, Fisher S, Francks C, MacPhie I, Cherny S, Rich-ardson A, Talcott J, Stein JF, Monaco AP, Cardon LR (2003)Use of multivariate linkage analysis for dissection of a com-plex trait. Am J Hum Genet 72:561–570
Menyuk P, Chesnick M, Liebergott J, Korngold B, D’AgostinoR, Belanger A (1991) Predicting reading problems in at-riskchildren. J Speech Hear Res 34:893–903
Metsala JL (1997) An examination of word frequency andneighborhood density on development of spoken-word rec-ognition. Mem Cognit 25:47–56
Newcomer P, Hammill D (1988) Test of language develop-ment–primary, second edition. Pro-Ed, Austin, TX
Nopola-Hemmi J, Myllyluoma B, Haltia T, Taipale M, Olli-kainen V, Ahonen T, Voutilainen A, Kere J, Widen E (2001)A dominant gene for developmental dyslexia on chromo-some 3. J Med Genet 38:658–664
Nopola-Hemmi J, Myllyluoma B, Voutilainen A, Leinonen S,Kere J, Ahonen T (2002) Familial dyslexia: neurocognitiveand genetic correlation in a large Finnish family. Dev MedChild Neurol 44:580–586
Nothen MM, Schulte-Korne G, Grimm T, Chichon S, Vogt IR,Muller-Myhsok B, Propping P, Remschmidt H (1999) Ge-netic linkage analysis with dyslexia: evidence for linkage ofspelling disability to chromosome 15. Eur Child AdolescPsychiatry 8:56–59
Pennington B, Lefly D (2001) Early reading development inchildren at family risk for dyslexia. Child Dev 72:816–833
Petryshen TL, Kaplan BJ, Fu Liu M, de French NS, Tobias R,Hughes ML, Field LL (2001) Evidence for a susceptibilitylocus on chromosome 6q influencing phonological codingdyslexia. Am J Med Genet 105:507–517
Petryshen TL, Kaplan BJ, Hughes ML, Tzenova J, Field LL(2002) Supportive evidence for the DYX3 dyslexia suscep-tibility gene in Canadian families. J Med Genet 39:125–126
Rabin M, Wen XL, Hepburn M, Lubs HA, Feldman E, DuaraR (1993) Suggestive linkage of developmental dyslexia tochromosome 1p34-p36. Lancet 342:178
Raitano NA, Pennington BF, Tunick RA, Boada R, ShribergLD. Pre-literacy skills of subgroups of children with speechsound disorders. J Child Psychol Psychiatr (in press)
Rice J, Saccone N, Rasmussen E (2001) Definition of the phe-notype. Adv Genet 42:69–76
Risch N (2000) Searching for genetic determinants in the newmillennium. Nature 405:847–856
Robbins J, Klee T (1987) Clinical assessment of oropharyngealmotor development in young children. J Speech Hear Disord52:271–277
Roodenrys S, Hulme C, Lethbridge A, Hinton M, Nimmo LM(2002) Word-frequency and phonological-neighborhood ef-fects on verbal short-term memory. J Exp Psychol LearnMem Cogn 28:1019–1034
Stein et al.: Locus for Speech and Reading on 3p12-q13 297
S.A.G.E. (2003) Statistical analysis for genetic epidemiology.Statistical Solutions, Cork, Ireland
Schick J, Kundtz A, Tiwari H, Taylor H, Freebairn L, HansenA, Shriberg L, Lewis BA, Iyengar SK (2002) Broad pheno-type of speech disorders shows strong evidence of linkageat candidate region 7q31. Paper presented at the EuropeanHuman Genetics Conference. Strasbourg, France, May 25–28
Schulte-Korne G, Grimm T, Nothen MM, Muller-Myhsok B,Cichon S, Vogt IR, Propping P, Remschmidt H (1998) Ev-idence for linkage of spelling disability to chromosome 15.Am J Hum Genet 63:279–282
Semel E, Wiig E, Secord W (1987) Clinical evaluation of lan-guage fundamentals–revised. The Psychological Corpora-tion, San Antonio, TX
Shete S, Jacobs K, Elston R (2003) Adding further power tothe Haseman and Elston method for detecting linkage inlarger sibships: weighting sums and differences. Hum Hered55:79–85
Shriberg L (1993) Four new speech and prosody voice mea-sures for genetics research and other studies in develop-mental phonological disorders. J Speech Hear Res 36:105–140
——— (2002) Classification and misclassification of childspeech sound disorders. Paper presented at the Annual Con-vention of the American Speech-Language-Hearing Associ-ation. Atlanta, November 20–24
Shriberg L, Austin D (1998) Comorbidity of speech-languagedisorder: implications for a phenotype marker for speechdelay. In: Paul R (ed) Exploring the speech/language con-nection. Brookes, Baltimore, pp 73–118
Shriberg L, Austin D, Lewis B, McSweeny J, Wilson D (1997)The percentage of consonants correct (PCC) metric: Exten-sions and reliability data. J Speech Lang Hear Res 40:708–722
Shriberg L, Kent R (2003) Clinical phonetics. 3rd ed. Allynand Bacon, Boston
Shriberg L, Kwiatkowski J (1988) A follow-up of children ofphonological disorders of unknown origin. J Speech HearRes 53:144–155
Shriberg L, Tomblin J, McSweeny J (1999) Prevalence ofspeech delay in 6-year-old children and comorbidity withlanguage impairment. J Speech Lang Hear Res 42:1461–1481
Specific Language Impairment Consortium (2002) A genome-wide scan identifies two novel loci involved in specific lan-guage impairment. Am J Hum Genet 70:384–398
Stein CM, Song Y, Elston RC, Jun G, Tiwari HK, Iyengar SK(2003) Structural equation model-based genome scan formetabolic syndrome. BMC Genetics 4 Suppl 1:S99
Tomblin J, Buckwalter P (1998) The heritability of poor lan-guage achievement among twins. J Speech Lang Hear Res41:188–199
Tunick R, Pennington B (2002) The etiological relationshipbetween reading disability and phonological disorder. AnnDyslexia 52:75–95
Vargha-Khadem F, Watkins KE, Price CJ, Ashburner J, AlcockKJ, Connelly A, Frackowiak RS, Friston KJ, Pembrey ME,Mishkin M, Gadian DG, Passingham RE (1998) Neural ba-sis of an inherited speech and language disorder. Proc NatlAcad Sci USA 95:12695–12700
Walley AC, Metsala JL (1990) The growth of lexical contraintson spoken word recognition. Perceptual Psychophysiology47:267–280
Wechsler D (1989) Wechsler preschool and primary scale ofintelligence–revised (WPPSI-R). The Psychological Corpo-ration, San Antonio, TX
——— (1991) Wechsler intelligence scale for children–thirdedition. The Psychological Coporation, San Antonio, TX
——— (1992) Wechsler individual achievement test. The Psy-chological Corporation, San Antonio, TX
Woodcock R (1987) Woodcock reading mastery tests–revised.American Guidance Service, Circle Pines, MN