Embed Size (px)
Citation preview
RESEARCH ARTICLE
A major pleiotropic QTL identified for yield
components and nitrogen content in rice
(Oryza sativa L.) under differential nitrogen
field conditions
T. Vishnukiran, C. N. NeerajaID*, V. JaldhaniID, P. Vijayalakshmi, P. Raghuveer Rao,
D. Subrahmanyam, S. R. Voleti
ICAR-Indian Institute of Rice Research, Rajendranagar, Hyderabad, India
Abstract
To identify the genomic regions for yield and NUE of rice genotypes and lines with promising
yield under low N, a recombinant inbred population (RIL) developed between BPT5204 (a
mega variety known for its quality) and PTB1 (variety with high NUE) was evaluated for con-
secutive wet and dry seasons under low nitrogen (LN) and recommended nitrogen (RN)
field conditions. A set of 291 RILs were characterized for 24 traits related to leaf, agro-mor-
phological, yield, N content and nitrogen use efficiency indices. More than 50 RILs were
found promising with grain yield >10 g under LN. Parental polymorphism survey with 297
SSRs and selective genotyping revealed five genomic regions associated with yield under
LN, which were further saturated with polymorphic SSRs. Thirteen promising SSRs were
identified out of 144 marker trait associations under LN using single marker analysis. Com-
posite interval mapping showed 37 QTL under LN with five pleiotropic QTL. A major stable
pleiotropic (RM13201—RM13209) from PTB1 spanning 825.4 kb region associated with
straw N % (SNP) in both treatments across seasons and yield and yield related traits in WS
appears to be promising for the MAS. Another major QTL (RM13181-RM13201) was found
to be associated with only relative trait parameters of biomass, grain and grain nitrogen.
These two major pleiotropic QTL (RM13201-RM13209 and RM13181-RM13201) on chro-
mosome 2 were characterized for their positive allele effect and could be deployed for the
development of rice varieties with NUE.
Introduction
Rice is one of the main cereal crops and staple food for more than half of the world population.
Despite the increase in world rice production since the past half century, rice yield improve-
ment is still required to support the growing needs of the increasing world population. Nitro-
gen (N) is the key nutrient required in large quantities for rice production [1]. Nearly 60% of
the applied N is lost to the environment through combinations of different processes causing
negative effects to the climate [2, 3]. Therefore, selection of rice genotypes with efficiency in N
PLOS ONE
PLOS ONE | https://doi.org/10.1371/journal.pone.0240854 October 20, 2020 1 / 22
a1111111111
a1111111111
a1111111111
a1111111111
a1111111111
OPEN ACCESS
Citation: Vishnukiran T, Neeraja CN, Jaldhani V,
Vijayalakshmi P, Raghuveer Rao P,
Subrahmanyam D, et al. (2020) A major pleiotropic
QTL identified for yield components and nitrogen
content in rice (Oryza sativa L.) under differential
nitrogen field conditions. PLoS ONE 15(10):
e0240854. https://doi.org/10.1371/journal.
pone.0240854
Editor: Ahmad Naeem Shahzad, Bahauddin
Zakariya University, PAKISTAN
Received: May 3, 2020
Accepted: October 4, 2020
Published: October 20, 2020
Copyright: © 2020 Vishnukiran et al. This is an
open access article distributed under the terms of
the Creative Commons Attribution License, which
permits unrestricted use, distribution, and
reproduction in any medium, provided the original
author and source are credited.
Data Availability Statement: All relevant data are
within the paper and its Supporting Information
files.
Funding: National Initiative on Climate Resilient
Agriculture (NICRA), Indian Council of Agricultural
Research (ICAR), Ministry of Agriculture, Govt. of
India [F. No. Phy/ NICRA/2011-2012].
Competing interests: The authors have declared
that no competing interests exist.
usage / low nitrogen (LN) tolerance is important in achieving better N utilization with mini-
mum negative impact on environment and reducing the cost of cultivation [4]. Genetic varia-
tion in grain yield in relation to nitrogen is well reported in rice [5–8]. Grain yield of rice is a
complex agronomic trait which is dependent on number of panicles, number of grains and
grain weight [9]. Number of panicles per plant is in turn dependent on tillering ability of the
genotype based on the dosage of N fertilization. Path coefficient analysis identifies contribu-
tion of each character to the trait of interest based on portioning of the correlation coefficients
into direct and indirect effects and it was used in identifying the contribution of various com-
ponents to yield in rice by Chandra et al. [10]; Cyprien and Kumar [11]; Seyoum et al. [12].
Mapping of the genomic regions associated with nitrogen use efficiency (NUE) would be
useful for marker assisted selection and introgression into popular rice varieties. Several QTL
have been reported in rice for various agro- morphological and yield characters under low N
[13]. Genomic regions for plant height were identified under two N levels in doubled haploid
(DH) lines by Fang and Wu et al. [14]. Tong et al. [15] detected 15 QTL in chromosomal seg-
ment substitution lines (CSSLs) under low N conditions. Seventeen QTL for agronomic, yield
traits and N concentration characters in recombinant inbred lines (RILs) were identified
under low and normal N [16]. Twenty three QTL for different morphological, agronomic,
NUE and yield traits were identified in DH lines under native, optimum and high N [17]. Sim-
ilarly, Tong et al. [18] identified seven QTL for yield traits in RILs under low, medium and
high N. Eighteen QTL for yield components were identified in RILs under low and normal N
[19]. Five QTL for plant height, tillers and NUE were identified in RILs under low N by
Nguyen et al. [20]. Ogawa et al. [21] identified eight QTL in CSSLs under two N levels (native
N, farmers practice N). Using Single Nucleotide Polymorphic (SNP) markers, several QTL
have been identified for nutrient use efficiency traits by Jewel et al. [22] and Mahender et al.
[23].
With an objective of identifying QTL for yield, nitrogen and their related traits and promis-
ing lines under low N, a RIL population was developed from two rice varieties with significant
differences for yield under low N viz., BPT5204 and PTB1. The two parents and their RILs
were evaluated under low N as well as recommended N for leaf, agro-morphological, yield and
yield related traits, N content and N use efficiency indices,. Genomic regions/QTL for target
traits and parameters of the study were identified through single marker analysis, selective gen-
otyping and Composite Interval Mapping (CIM) method.
Material and methods
Field evaluation of mapping population
Based on preliminary screening of 107 rice genotypes under low and recommended N field
conditions, two parents viz., BPT5204 and PTB1 were selected (S1 Table) [24]. BPT5204 is a
mega rice variety known for its quality was released by Acharya NG Ranga Agricultural Uni-
versity, Bapatla, Andhra Pradesh, India) and PTB1 was a released rice variety from Regional
Agricultural Research Station, Pattambi, Kerala, India. Mapping population of 291 RILs was
developed from the parents BPT5204 and PTB1 by single seed descent method. During 2014
(WS) and 2015 (DS), RILs along with parental lines were grown at ICAR-Indian Institute of
Rice Research farm (IIRR), Rajendranagar, Hyderabad. Two separate plots were maintained
with zero nitrogen application (LN) and recommended nitrogen (RN) since 2011 at IIRR as
described by Vijayalakshmi et al. [7]. Soil properties of the two plots (S2A Table) and weather
parameters (S2B Table) during the experiment were recorded. Recommended package of rice
crop production and protection practices were followed (www.rkmp.co.in). A set of 54 geno-
types was also grown under LN and RN during 2014 (WS) and 2015 (DS) (S3 Table).
PLOS ONE Major pleiotropic QTL for yield components and nitrogen content in rice
PLOS ONE | https://doi.org/10.1371/journal.pone.0240854 October 20, 2020 2 / 22
Phenotyping. Leaf length (cm) (LL), leaf width (cm) (LW) and leaf area (cm) (LA) were
measured according to Yoshida et al. [25]. In situ leaf chlorophyll content (SPAD) was
recorded with Minolta Corporation’s Chlorophyll SPAD-502 plus, USA. Three observations
from each leaf at three positions were taken in three replications and average was reported.
Days to 50% flowering (DFF) of each RIL was noted. At physiological maturity, plant height
(cm) (PH), number of tillers (TNO), panicles per plant (PNO), grain yield (g/plant) (GY), hun-
dred seed weight (g) (HSW), grain number per plant (GRNO) and total dry matter (g/plant)
(TDM) were recorded from five plants of parents and RILs. Nitrogen percentage in grain
(GNP), straw (SNP), total grain nitrogen per plant (GNPP) and straw nitrogen per plant
(SNPP) were estimated following Kjeldahl method and nitrogen harvest index (NHI) was cal-
culated. Physiological nitrogen use efficiency (PNUE), agronomic nitrogen use efficiency
(ANUE) and agro-physiological efficiency (APE) were determined according to Fageria et al.
[26]. Nitrogen deficiency tolerance traits viz., relative grain yield (RGY), relative biomass yield
(RBM), relative grain nitrogen (RGN) and relative biomass nitrogen (RBN) were calculated
according to Wei et al. [27]. Data for grain yield (g/plant) (GY) was noted for 54 genotypes in
2014 (WS) and 2015 (DS) (S3 Table).
Genotyping
DNA from the fresh leaf tissues of parents and RILs was isolated according to modified proto-
col of Zheng et al. [28]. Parental polymorphism was surveyed with 254 rice microsatellite
(RM) or simple sequence repeats (SSR) markers from Gramene database (http://www.
gramene.org). The details of SSRs and their status of polymorphism were given in S4 Table.
The schematic outline of mapping is presented in Fig 1.
For amplification of the SSRs, PCR was carried out following the procedure described by
Rao et al. [29] with 15μl reaction using Veriti thermal cycler (Applied Biosystems). The ampli-
fied products were resolved with 3% agarose gel (Lonza, USA) and gels were stained with 0.5
mg/ml ethidium bromide and bands were visualized using Alpha Imager 1220 (Alpha Inno-
tech, USA). Selective genotyping was performed with 32 polymorphic SSRs in two groups of
RILs comprising 12 RILs with highest grain yield> 10 g and 10 RILs <1 g with the lowest
yield under LN. The phenotypic and genotypic data of 22 RILs and parents was analyzed and
local linkage maps were constructed using MapDisto v. 1.7 [30]. Five SSRs associated with
grain yield from the selective genotyping analyses viz., RM1, RM7075, RM9, RM13021 and
RM13197 were considered as anchor SSRs. Eight to 10 SSRs spanning each associated anchor
SSR were selected from Gramene database for parental polymorphism and the nine polymor-
phic SSRs were screened in RILs.
Data analysis
Two way Analysis of variance (ANOVA) was performed for the phenotypic data using open
software R language [31] with agricolae package [32] and statistical significance was deter-
mined for parents and RILs. Path coefficient analysis was performed using correlation values
according to Dewey and Lu [33] and direct and indirect effects were calculated [34].
Single marker analysis (SMA)
The phenotypic data of 291 RILs and genotypic data of 41 (32+9) polymorphic SSRs was sub-
jected to SMA using ANOVA of open software R [32].
PLOS ONE Major pleiotropic QTL for yield components and nitrogen content in rice
PLOS ONE | https://doi.org/10.1371/journal.pone.0240854 October 20, 2020 3 / 22
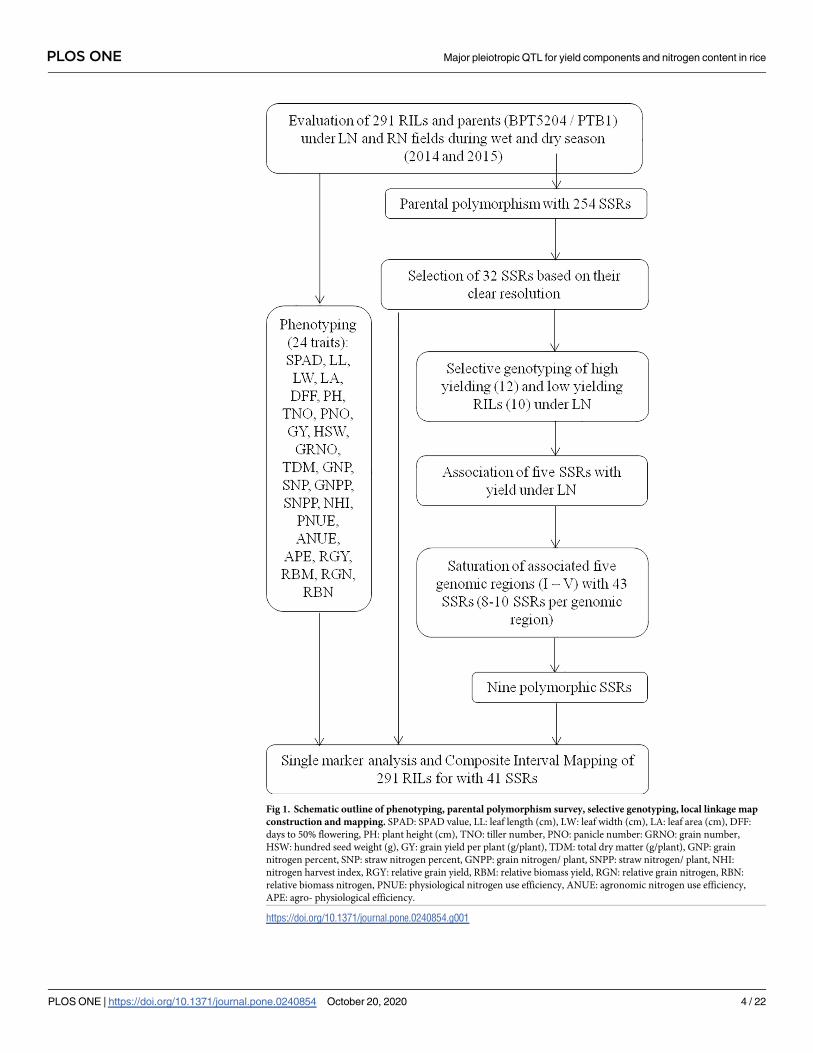
Fig 1. Schematic outline of phenotyping, parental polymorphism survey, selective genotyping, local linkage map
construction and mapping. SPAD: SPAD value, LL: leaf length (cm), LW: leaf width (cm), LA: leaf area (cm), DFF:
days to 50% flowering, PH: plant height (cm), TNO: tiller number, PNO: panicle number: GRNO: grain number,
HSW: hundred seed weight (g), GY: grain yield per plant (g/plant), TDM: total dry matter (g/plant), GNP: grain
nitrogen percent, SNP: straw nitrogen percent, GNPP: grain nitrogen/ plant, SNPP: straw nitrogen/ plant, NHI:
nitrogen harvest index, RGY: relative grain yield, RBM: relative biomass yield, RGN: relative grain nitrogen, RBN:
relative biomass nitrogen, PNUE: physiological nitrogen use efficiency, ANUE: agronomic nitrogen use efficiency,
APE: agro- physiological efficiency.
https://doi.org/10.1371/journal.pone.0240854.g001
PLOS ONE Major pleiotropic QTL for yield components and nitrogen content in rice
PLOS ONE | https://doi.org/10.1371/journal.pone.0240854 October 20, 2020 4 / 22
Composite interval mapping (CIM)
The linkage maps for chromosomes 1 and 2 spanning polymorphic SSRs in five anchor regions
were constructed using Mapmaker and were imported into QTL Cartographer (Win QTL
Cart 2.5). Composite interval mapping (CIM) was performed with kosambi function for 25
SSRs (chromosome 1: 15; chromosome 2: 10) and QTL were identified with minimum LOD
score of 2.5 with 1000 permutations.
Allelic effect of associated SSRs
The average allelic effect (AAE) of two SSRs (RM13209 and RM13181) from two major QTL
viz., RM13201-RM13209 and RM13181-RM13201 was estimated by comparing the mean phe-
notypic data for that trait with respect to each allele to the phenotypic data of the null allele (ai
= phenotypic effect of the allele i = ∑xij/ni—∑Nk/nk; xij = phenotypic measurement values of j
genotype carrying the allele i; ni = the number of genotypes carrying the allele of i, Nk = pheno-
typic value of the genotype of k carrying null allele, nk = the number of genotypes for the null
allele [35].
Co-localization
Positions of the associated SSRs identified through SMA and CIM of the present study were
compared to the genomic positions of SSRs from the reported QTL to study co-localization.
The associated SSRs and QTL under LN were also compared with the reported QTL of normal
N (recommended N). The positions of flanking SSRs of genomic regions associated with two
or more than two QTL under LN were retrieved from https://blast.ncbi.nlm.nih.gov/Blast.cgi
and analyzed for the putative candidate genes in the genomic region of QTL.
Results
Phenotyping
Significant variation was observed between the parents (BPT5204 and PTB1) for 24 phenotype
traits/parameters studied under LN (S5 Table). Substantial variability was also noted for 24
traits/parameters between treatments and among the RILs under LN and RN across seasons
(Tables 1 and 2). There was overall reduction for the 24 traits/parameters of the study under
LN in comparison to RN for both parents, however the reduction of relatively less in PTB1
(better NUE) than BPT5204 (S6 Table). The magnitude of reduction between the parents and
RILs was observed to be varying across seasons. The mean relative grain yield, biomass yield
and relative grain and biomass nitrogen was higher in PTB1, whereas physiological, agronomi-
cal and agro-physiological nitrogen use efficiencies were higher in BPT5204. Transgressive
variants for yield in RILs were observed under LN (Tables 1 and 2). Thirty nine RILs in WS
and 14 RILs in DS were found promising with >10 g under LN.
Correlation and path analysis
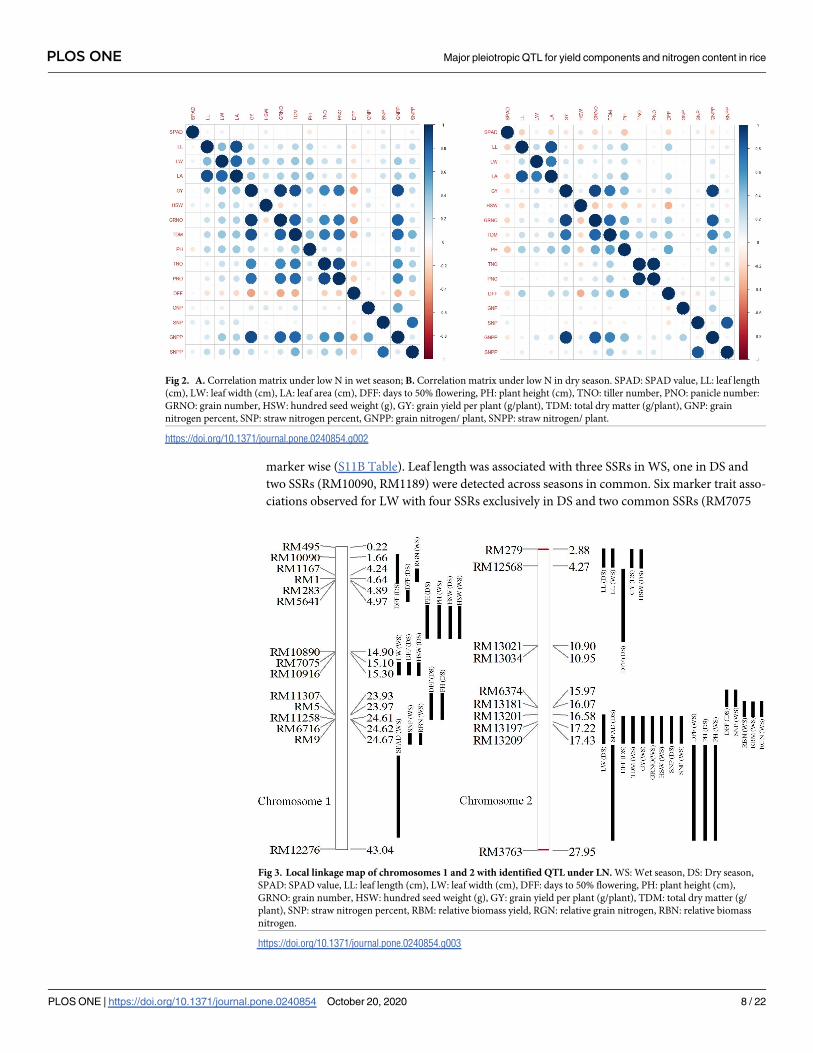
Under LN, GY was found to be positively correlated with PH, TNO, PNO, GRNO, TDM and
GNPP across seasons as expected. Association of GY with PH was observed exclusively under
LN across seasons (Fig 2A and 2B). Significant positive correlations were observed between
PNUE, ANUE and APE with GY only under RN (S1A–S1D Fig). Path coefficient analysis
revealed 20 significant positive direct effects on GY under LN. Among them, 12 direct positive
effects with LL, TNO, PNO, GNP, SNPP in WS, eight with SPAD in DS and seven traits (LW,
LA, GRNO, TDM, PH, PNO, GNPP) across seasons were identified (S7A and S7B Table).
Only PH has shown exclusive positive direct effect under LN. Under RN, seven traits (LW,
PLOS ONE Major pleiotropic QTL for yield components and nitrogen content in rice
PLOS ONE | https://doi.org/10.1371/journal.pone.0240854 October 20, 2020 5 / 22
GRNO, TDM, TNO, PNO, GNPP, and SNPP) were common across seasons (S7C and S7D
Table). Five traits were common across RN and LN in WS (DFF, GRNO, TDM, PNO, and
GNPP) and three traits were common in DS (GRNO, TDM, GNPP).
Parental polymorphism and selective genotyping
Between the two parents, 42 SSRs showed polymorphism (16.5%) out of 254 SSRs and 32 SSRs
were selected for further analyses based on their resolution. Yield being identified as the
important selection criterion under LN, selective genotyping of 22 RILs (12 RILs with highest
grain yield and 10 RILs with the lowest yield under LN) was performed. Five SSRs have shown
association with grain yield under LN using MapDisto (S8 Table). Among the five SSRs identi-
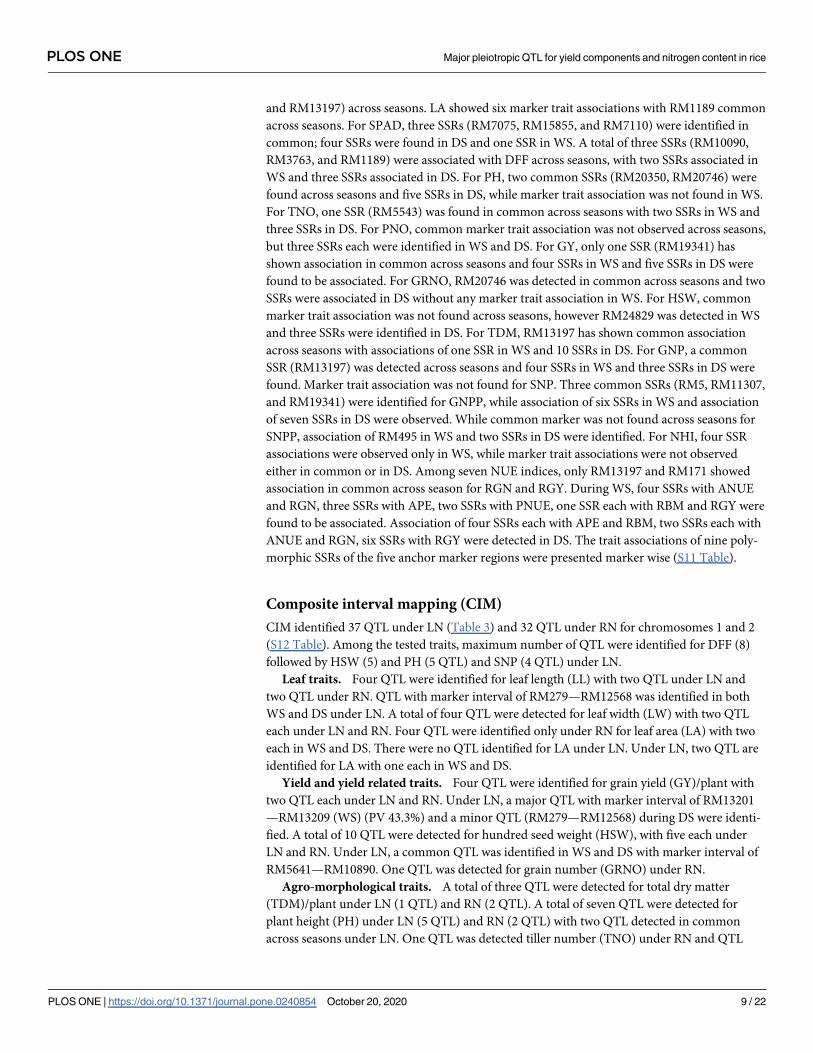
fied as anchor markers, three SSRs were on chromosome 1 viz., genomic region I—RM1,
genomic region II—RM7075, genomic region III—RM9 and two SSRs on chromosome 2
(genomic region IV—RM13021 and genomic region V—RM13197) (Fig 3).
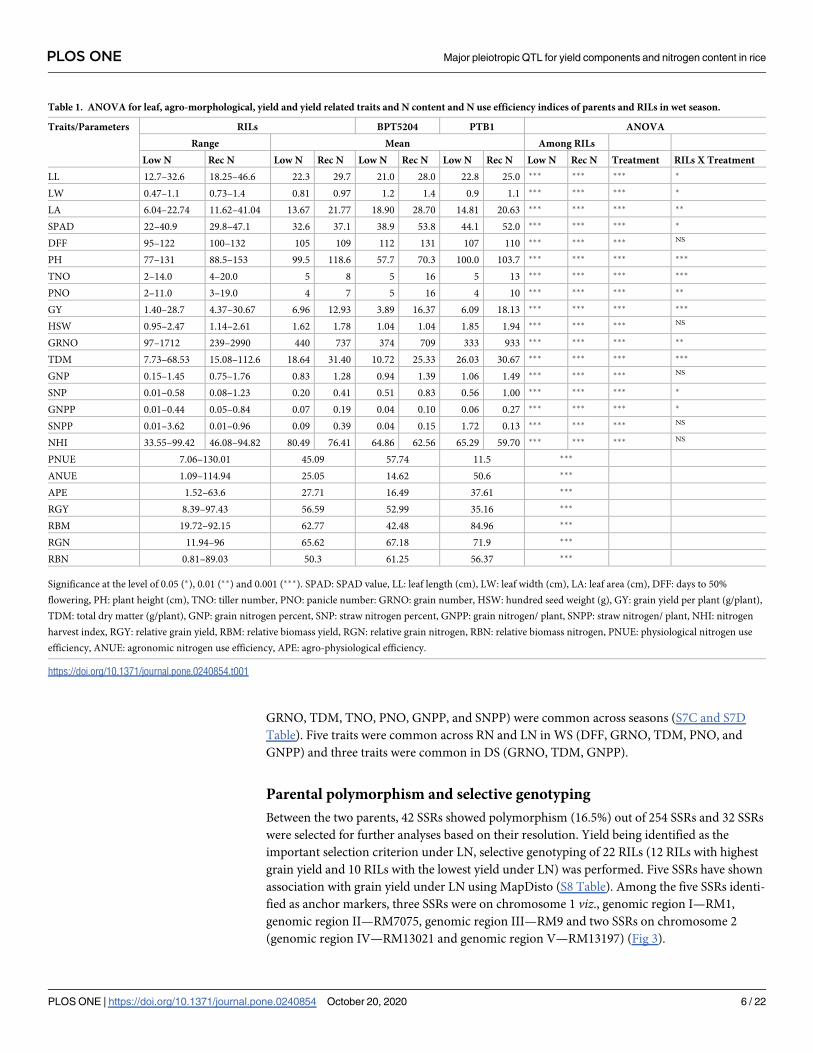
Table 1. ANOVA for leaf, agro-morphological, yield and yield related traits and N content and N use efficiency indices of parents and RILs in wet season.
Traits/Parameters RILs BPT5204 PTB1 ANOVA
Range Mean Among RILs
Low N Rec N Low N Rec N Low N Rec N Low N Rec N Low N Rec N Treatment RILs X Treatment
LL 12.7–32.6 18.25–46.6 22.3 29.7 21.0 28.0 22.8 25.0 ��� ��� ��� �
LW 0.47–1.1 0.73–1.4 0.81 0.97 1.2 1.4 0.9 1.1 ��� ��� ��� �
LA 6.04–22.74 11.62–41.04 13.67 21.77 18.90 28.70 14.81 20.63 ��� ��� ��� ��
SPAD 22–40.9 29.8–47.1 32.6 37.1 38.9 53.8 44.1 52.0 ��� ��� ��� �
DFF 95–122 100–132 105 109 112 131 107 110 ��� ��� ��� NS
PH 77–131 88.5–153 99.5 118.6 57.7 70.3 100.0 103.7 ��� ��� ��� ���
TNO 2–14.0 4–20.0 5 8 5 16 5 13 ��� ��� ��� ���
PNO 2–11.0 3–19.0 4 7 5 16 4 10 ��� ��� ��� ��
GY 1.40–28.7 4.37–30.67 6.96 12.93 3.89 16.37 6.09 18.13 ��� ��� ��� ���
HSW 0.95–2.47 1.14–2.61 1.62 1.78 1.04 1.04 1.85 1.94 ��� ��� ��� NS
GRNO 97–1712 239–2990 440 737 374 709 333 933 ��� ��� ��� ��
TDM 7.73–68.53 15.08–112.6 18.64 31.40 10.72 25.33 26.03 30.67 ��� ��� ��� ���
GNP 0.15–1.45 0.75–1.76 0.83 1.28 0.94 1.39 1.06 1.49 ��� ��� ��� NS
SNP 0.01–0.58 0.08–1.23 0.20 0.41 0.51 0.83 0.56 1.00 ��� ��� ��� �
GNPP 0.01–0.44 0.05–0.84 0.07 0.19 0.04 0.10 0.06 0.27 ��� ��� ��� �
SNPP 0.01–3.62 0.01–0.96 0.09 0.39 0.04 0.15 1.72 0.13 ��� ��� ��� NS
NHI 33.55–99.42 46.08–94.82 80.49 76.41 64.86 62.56 65.29 59.70 ��� ��� ��� NS
PNUE 7.06–130.01 45.09 57.74 11.5 ���
ANUE 1.09–114.94 25.05 14.62 50.6 ���
APE 1.52–63.6 27.71 16.49 37.61 ���
RGY 8.39–97.43 56.59 52.99 35.16 ���
RBM 19.72–92.15 62.77 42.48 84.96 ���
RGN 11.94–96 65.62 67.18 71.9 ���
RBN 0.81–89.03 50.3 61.25 56.37 ���
Significance at the level of 0.05 (�), 0.01 (��) and 0.001 (���). SPAD: SPAD value, LL: leaf length (cm), LW: leaf width (cm), LA: leaf area (cm), DFF: days to 50%
flowering, PH: plant height (cm), TNO: tiller number, PNO: panicle number: GRNO: grain number, HSW: hundred seed weight (g), GY: grain yield per plant (g/plant),
TDM: total dry matter (g/plant), GNP: grain nitrogen percent, SNP: straw nitrogen percent, GNPP: grain nitrogen/ plant, SNPP: straw nitrogen/ plant, NHI: nitrogen
harvest index, RGY: relative grain yield, RBM: relative biomass yield, RGN: relative grain nitrogen, RBN: relative biomass nitrogen, PNUE: physiological nitrogen use
efficiency, ANUE: agronomic nitrogen use efficiency, APE: agro-physiological efficiency.
https://doi.org/10.1371/journal.pone.0240854.t001
PLOS ONE Major pleiotropic QTL for yield components and nitrogen content in rice
PLOS ONE | https://doi.org/10.1371/journal.pone.0240854 October 20, 2020 6 / 22
Saturation of identified grain yield associated genomic regions with SSRs. Screening of
the five associated genomic regions with markers flanking the anchor SSR has shown a total of
nine polymorphic SSRs viz., one at genomic region I, two at genomic region II, two at genomic
region III, one at genomic region IV and three at genomic region V (S9 Table).
Single marker analysis (SMA)
SMA showed 144 marker trait associations with 31 SSRs (trait associations were not found
with RM283) across seasons under LN for 22 traits (marker associations were not found for
SNP and RBN) (S10A and S10B Table). More number of marker trait associations was
observed during DS. Only seven trait marker associations were detected in common across
seasons exclusively under LN (S2 Fig). Maximum number of marker associations (16) was
noted for GNPP. RM5455 (chromosome 7) was found to be associated with maximum num-
ber of traits (14). SMA for nine polymorphic SSRs associated with yield through selective geno-
typing also revealed 45 associations with 24 traits are presented trait wise (S11A Table) and
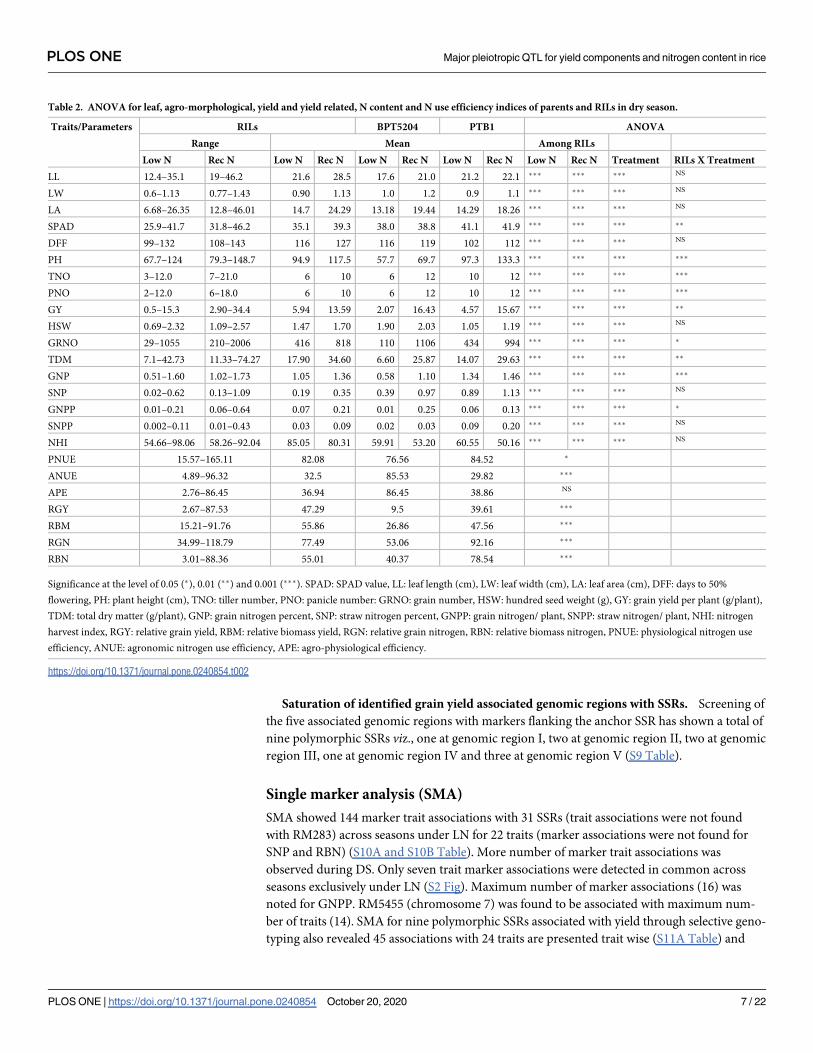
Table 2. ANOVA for leaf, agro-morphological, yield and yield related, N content and N use efficiency indices of parents and RILs in dry season.
Traits/Parameters RILs BPT5204 PTB1 ANOVA
Range Mean Among RILs
Low N Rec N Low N Rec N Low N Rec N Low N Rec N Low N Rec N Treatment RILs X Treatment
LL 12.4–35.1 19–46.2 21.6 28.5 17.6 21.0 21.2 22.1 ��� ��� ��� NS
LW 0.6–1.13 0.77–1.43 0.90 1.13 1.0 1.2 0.9 1.1 ��� ��� ��� NS
LA 6.68–26.35 12.8–46.01 14.7 24.29 13.18 19.44 14.29 18.26 ��� ��� ��� NS
SPAD 25.9–41.7 31.8–46.2 35.1 39.3 38.0 38.8 41.1 41.9 ��� ��� ��� ��
DFF 99–132 108–143 116 127 116 119 102 112 ��� ��� ��� NS
PH 67.7–124 79.3–148.7 94.9 117.5 57.7 69.7 97.3 133.3 ��� ��� ��� ���
TNO 3–12.0 7–21.0 6 10 6 12 10 12 ��� ��� ��� ���
PNO 2–12.0 6–18.0 6 10 6 12 10 12 ��� ��� ��� ���
GY 0.5–15.3 2.90–34.4 5.94 13.59 2.07 16.43 4.57 15.67 ��� ��� ��� ��
HSW 0.69–2.32 1.09–2.57 1.47 1.70 1.90 2.03 1.05 1.19 ��� ��� ��� NS
GRNO 29–1055 210–2006 416 818 110 1106 434 994 ��� ��� ��� �
TDM 7.1–42.73 11.33–74.27 17.90 34.60 6.60 25.87 14.07 29.63 ��� ��� ��� ��
GNP 0.51–1.60 1.02–1.73 1.05 1.36 0.58 1.10 1.34 1.46 ��� ��� ��� ���
SNP 0.02–0.62 0.13–1.09 0.19 0.35 0.39 0.97 0.89 1.13 ��� ��� ��� NS
GNPP 0.01–0.21 0.06–0.64 0.07 0.21 0.01 0.25 0.06 0.13 ��� ��� ��� �
SNPP 0.002–0.11 0.01–0.43 0.03 0.09 0.02 0.03 0.09 0.20 ��� ��� ��� NS
NHI 54.66–98.06 58.26–92.04 85.05 80.31 59.91 53.20 60.55 50.16 ��� ��� ��� NS
PNUE 15.57–165.11 82.08 76.56 84.52 �
ANUE 4.89–96.32 32.5 85.53 29.82 ���
APE 2.76–86.45 36.94 86.45 38.86 NS
RGY 2.67–87.53 47.29 9.5 39.61 ���
RBM 15.21–91.76 55.86 26.86 47.56 ���
RGN 34.99–118.79 77.49 53.06 92.16 ���
RBN 3.01–88.36 55.01 40.37 78.54 ���
Significance at the level of 0.05 (�), 0.01 (��) and 0.001 (���). SPAD: SPAD value, LL: leaf length (cm), LW: leaf width (cm), LA: leaf area (cm), DFF: days to 50%
flowering, PH: plant height (cm), TNO: tiller number, PNO: panicle number: GRNO: grain number, HSW: hundred seed weight (g), GY: grain yield per plant (g/plant),
TDM: total dry matter (g/plant), GNP: grain nitrogen percent, SNP: straw nitrogen percent, GNPP: grain nitrogen/ plant, SNPP: straw nitrogen/ plant, NHI: nitrogen
harvest index, RGY: relative grain yield, RBM: relative biomass yield, RGN: relative grain nitrogen, RBN: relative biomass nitrogen, PNUE: physiological nitrogen use
efficiency, ANUE: agronomic nitrogen use efficiency, APE: agro-physiological efficiency.
https://doi.org/10.1371/journal.pone.0240854.t002
PLOS ONE Major pleiotropic QTL for yield components and nitrogen content in rice
PLOS ONE | https://doi.org/10.1371/journal.pone.0240854 October 20, 2020 7 / 22
marker wise (S11B Table). Leaf length was associated with three SSRs in WS, one in DS and
two SSRs (RM10090, RM1189) were detected across seasons in common. Six marker trait asso-
ciations observed for LW with four SSRs exclusively in DS and two common SSRs (RM7075
Fig 2. A. Correlation matrix under low N in wet season; B. Correlation matrix under low N in dry season. SPAD: SPAD value, LL: leaf length
(cm), LW: leaf width (cm), LA: leaf area (cm), DFF: days to 50% flowering, PH: plant height (cm), TNO: tiller number, PNO: panicle number:
GRNO: grain number, HSW: hundred seed weight (g), GY: grain yield per plant (g/plant), TDM: total dry matter (g/plant), GNP: grain
nitrogen percent, SNP: straw nitrogen percent, GNPP: grain nitrogen/ plant, SNPP: straw nitrogen/ plant.
https://doi.org/10.1371/journal.pone.0240854.g002
Fig 3. Local linkage map of chromosomes 1 and 2 with identified QTL under LN. WS: Wet season, DS: Dry season,
SPAD: SPAD value, LL: leaf length (cm), LW: leaf width (cm), DFF: days to 50% flowering, PH: plant height (cm),
GRNO: grain number, HSW: hundred seed weight (g), GY: grain yield per plant (g/plant), TDM: total dry matter (g/
plant), SNP: straw nitrogen percent, RBM: relative biomass yield, RGN: relative grain nitrogen, RBN: relative biomass
nitrogen.
https://doi.org/10.1371/journal.pone.0240854.g003
PLOS ONE Major pleiotropic QTL for yield components and nitrogen content in rice
PLOS ONE | https://doi.org/10.1371/journal.pone.0240854 October 20, 2020 8 / 22
and RM13197) across seasons. LA showed six marker trait associations with RM1189 common
across seasons. For SPAD, three SSRs (RM7075, RM15855, and RM7110) were identified in
common; four SSRs were found in DS and one SSR in WS. A total of three SSRs (RM10090,
RM3763, and RM1189) were associated with DFF across seasons, with two SSRs associated in
WS and three SSRs associated in DS. For PH, two common SSRs (RM20350, RM20746) were
found across seasons and five SSRs in DS, while marker trait association was not found in WS.
For TNO, one SSR (RM5543) was found in common across seasons with two SSRs in WS and
three SSRs in DS. For PNO, common marker trait association was not observed across seasons,
but three SSRs each were identified in WS and DS. For GY, only one SSR (RM19341) has
shown association in common across seasons and four SSRs in WS and five SSRs in DS were
found to be associated. For GRNO, RM20746 was detected in common across seasons and two
SSRs were associated in DS without any marker trait association in WS. For HSW, common
marker trait association was not found across seasons, however RM24829 was detected in WS
and three SSRs were identified in DS. For TDM, RM13197 has shown common association
across seasons with associations of one SSR in WS and 10 SSRs in DS. For GNP, a common
SSR (RM13197) was detected across seasons and four SSRs in WS and three SSRs in DS were
found. Marker trait association was not found for SNP. Three common SSRs (RM5, RM11307,
and RM19341) were identified for GNPP, while association of six SSRs in WS and association
of seven SSRs in DS were observed. While common marker was not found across seasons for
SNPP, association of RM495 in WS and two SSRs in DS were identified. For NHI, four SSR
associations were observed only in WS, while marker trait associations were not observed
either in common or in DS. Among seven NUE indices, only RM13197 and RM171 showed
association in common across season for RGN and RGY. During WS, four SSRs with ANUE
and RGN, three SSRs with APE, two SSRs with PNUE, one SSR each with RBM and RGY were
found to be associated. Association of four SSRs each with APE and RBM, two SSRs each with
ANUE and RGN, six SSRs with RGY were detected in DS. The trait associations of nine poly-
morphic SSRs of the five anchor marker regions were presented marker wise (S11 Table).
Composite interval mapping (CIM)
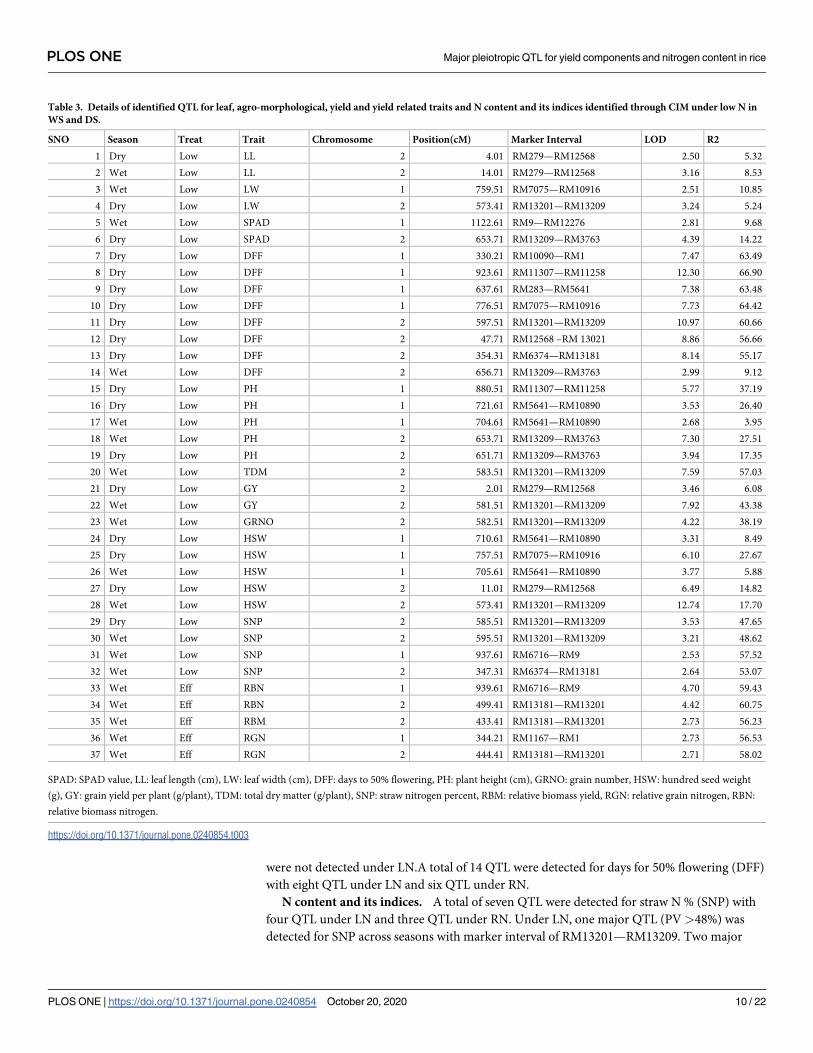
CIM identified 37 QTL under LN (Table 3) and 32 QTL under RN for chromosomes 1 and 2
(S12 Table). Among the tested traits, maximum number of QTL were identified for DFF (8)
followed by HSW (5) and PH (5 QTL) and SNP (4 QTL) under LN.
Leaf traits. Four QTL were identified for leaf length (LL) with two QTL under LN and
two QTL under RN. QTL with marker interval of RM279—RM12568 was identified in both
WS and DS under LN. A total of four QTL were detected for leaf width (LW) with two QTL
each under LN and RN. Four QTL were identified only under RN for leaf area (LA) with two
each in WS and DS. There were no QTL identified for LA under LN. Under LN, two QTL are
identified for LA with one each in WS and DS.
Yield and yield related traits. Four QTL were identified for grain yield (GY)/plant with
two QTL each under LN and RN. Under LN, a major QTL with marker interval of RM13201
—RM13209 (WS) (PV 43.3%) and a minor QTL (RM279—RM12568) during DS were identi-
fied. A total of 10 QTL were detected for hundred seed weight (HSW), with five each under
LN and RN. Under LN, a common QTL was identified in WS and DS with marker interval of
RM5641—RM10890. One QTL was detected for grain number (GRNO) under RN.
Agro-morphological traits. A total of three QTL were detected for total dry matter
(TDM)/plant under LN (1 QTL) and RN (2 QTL). A total of seven QTL were detected for
plant height (PH) under LN (5 QTL) and RN (2 QTL) with two QTL detected in common
across seasons under LN. One QTL was detected tiller number (TNO) under RN and QTL
PLOS ONE Major pleiotropic QTL for yield components and nitrogen content in rice
PLOS ONE | https://doi.org/10.1371/journal.pone.0240854 October 20, 2020 9 / 22
were not detected under LN.A total of 14 QTL were detected for days for 50% flowering (DFF)
with eight QTL under LN and six QTL under RN.
N content and its indices. A total of seven QTL were detected for straw N % (SNP) with
four QTL under LN and three QTL under RN. Under LN, one major QTL (PV >48%) was
detected for SNP across seasons with marker interval of RM13201—RM13209. Two major
Table 3. Details of identified QTL for leaf, agro-morphological, yield and yield related traits and N content and its indices identified through CIM under low N in
WS and DS.
SNO Season Treat Trait Chromosome Position(cM) Marker Interval LOD R2
1 Dry Low LL 2 4.01 RM279—RM12568 2.50 5.32
2 Wet Low LL 2 14.01 RM279—RM12568 3.16 8.53
3 Wet Low LW 1 759.51 RM7075—RM10916 2.51 10.85
4 Dry Low LW 2 573.41 RM13201—RM13209 3.24 5.24
5 Wet Low SPAD 1 1122.61 RM9—RM12276 2.81 9.68
6 Dry Low SPAD 2 653.71 RM13209—RM3763 4.39 14.22
7 Dry Low DFF 1 330.21 RM10090—RM1 7.47 63.49
8 Dry Low DFF 1 923.61 RM11307—RM11258 12.30 66.90
9 Dry Low DFF 1 637.61 RM283—RM5641 7.38 63.48
10 Dry Low DFF 1 776.51 RM7075—RM10916 7.73 64.42
11 Dry Low DFF 2 597.51 RM13201—RM13209 10.97 60.66
12 Dry Low DFF 2 47.71 RM12568 –RM 13021 8.86 56.66
13 Dry Low DFF 2 354.31 RM6374—RM13181 8.14 55.17
14 Wet Low DFF 2 656.71 RM13209—RM3763 2.99 9.12
15 Dry Low PH 1 880.51 RM11307—RM11258 5.77 37.19
16 Dry Low PH 1 721.61 RM5641—RM10890 3.53 26.40
17 Wet Low PH 1 704.61 RM5641—RM10890 2.68 3.95
18 Wet Low PH 2 653.71 RM13209—RM3763 7.30 27.51
19 Dry Low PH 2 651.71 RM13209—RM3763 3.94 17.35
20 Wet Low TDM 2 583.51 RM13201—RM13209 7.59 57.03
21 Dry Low GY 2 2.01 RM279—RM12568 3.46 6.08
22 Wet Low GY 2 581.51 RM13201—RM13209 7.92 43.38
23 Wet Low GRNO 2 582.51 RM13201—RM13209 4.22 38.19
24 Dry Low HSW 1 710.61 RM5641—RM10890 3.31 8.49
25 Dry Low HSW 1 757.51 RM7075—RM10916 6.10 27.67
26 Wet Low HSW 1 705.61 RM5641—RM10890 3.77 5.88
27 Dry Low HSW 2 11.01 RM279—RM12568 6.49 14.82
28 Wet Low HSW 2 573.41 RM13201—RM13209 12.74 17.70
29 Dry Low SNP 2 585.51 RM13201—RM13209 3.53 47.65
30 Wet Low SNP 2 595.51 RM13201—RM13209 3.21 48.62
31 Wet Low SNP 1 937.61 RM6716—RM9 2.53 57.52
32 Wet Low SNP 2 347.31 RM6374—RM13181 2.64 53.07
33 Wet Eff RBN 1 939.61 RM6716—RM9 4.70 59.43
34 Wet Eff RBN 2 499.41 RM13181—RM13201 4.42 60.75
35 Wet Eff RBM 2 433.41 RM13181—RM13201 2.73 56.23
36 Wet Eff RGN 1 344.21 RM1167—RM1 2.73 56.53
37 Wet Eff RGN 2 444.41 RM13181—RM13201 2.71 58.02
SPAD: SPAD value, LL: leaf length (cm), LW: leaf width (cm), DFF: days to 50% flowering, PH: plant height (cm), GRNO: grain number, HSW: hundred seed weight
(g), GY: grain yield per plant (g/plant), TDM: total dry matter (g/plant), SNP: straw nitrogen percent, RBM: relative biomass yield, RGN: relative grain nitrogen, RBN:
relative biomass nitrogen.
https://doi.org/10.1371/journal.pone.0240854.t003
PLOS ONE Major pleiotropic QTL for yield components and nitrogen content in rice
PLOS ONE | https://doi.org/10.1371/journal.pone.0240854 October 20, 2020 10 / 22
QTL for relative grain N (RGN) and another two major QTL for relative biomass N (RBN) on
chromosomes 1 and 2 were detected. One major QTL for relative biomass yield (RBM) shared
its location with QTL for RGN and RBN.
Co-localization of associated genomic regions and markers of the present
study with the reported QTL
The identified QTL for the chromosomes 1 and 2 co-localized with positions of reported for
similar trait QTL were presented trait wise in detail. The co-localization of associated SSRs
with the reported QTL regions was also presented.
Yield and yield related traits. With reference to chromosome 1, RM10090, RM1167 and
RM5641 associated with HSW under LN, co-localized with genomic region for thousand grain
weight under LN [36] and RN [37]. Interestingly, the identified genomic region for HSW
under LN and RN in DS (RM10890-RM10916) also shared its location with reported grain
weight QTL viz., gw-1 and qTGW 1–1 [38, 39]. Another QTL in the marker interval of
RM11307-RM11258 matched with reported QTL for yield and yield related traits viz., grain
weight, grain number per plant, spikelet number per plant and spikelets per panicle [39–41] in
this region under drought stress conditions. RM12276 was associated with GY, GRNO and
TDM under LN concurred with the reported genomic regions for spikelet fertility [42, 43].
For chromosome 2, genomic region for HSW (RM13021-RM13034) in the present study
corresponded with reported QTL for number of grains per panicle (qGN 2), hundred grain
weight (qHW 2) and grain density (qGD 2) [44]. GRNO markers (RM13021-RM13029)
matched with the QTL for number of filled grains [45], number of spikelets per plant [46–48].
RM279 associated with GY under LN and RN in DS shared its location with genomic regions
for yield under LN and RN [36]. RM3763 associated with HSW, PH and SPAD under both
treatments and seasons co-localized with the reported genomic region for thousand grain
weight [39, 49]. The SSRs associated with GY and GRNO (RM1167 and RM1) coincided with
the previously reported genomic regions for yield and yield components such as spikelet num-
ber and panicle weight [50], yield per plant [51], spikelets for panicle [47, 52, 53], grain yield
[54], spikelet density [55] under RN and grain number per panicle, spikelets per panicle under
LN [20, 36]. Two associated SSRs on chromosome 3 have also shown concurrence with
reported yield QTL. RM14250 (chromosome 3) associated with HSW under LN and RN
shared its genomic region with the loci of thousand grain weight reported by Zhuang et al.
[52], Zhang et al. [54], Fu et al. [56], Liu et al. [57]. RM15855 associated with GY under LN,
corresponded with the QTL for grain weight and spikelet number per panicle [51, 57].
RM20746 of chromosome 5 was associated with HSW, GRNO, GY, GNPP, PH and TDM
under LN overlapped with the reported genomic regions for yield/ plant [15], grain density/
panicle [19], grain yield/plant [52] and grain weight [58]. Across chromosome 7, RM7110
associated with HSW, GRNO, TDM under LN corresponded with QTL for grain yield, spikelet
number per panicle [36] and spikelet number per panicle and number of grains per panicle
[56] under LN. Another SSR, RM5455 associated with HSW under both treatments and
GRNO under LN has shared its locus with reported QTL for spikelets per panicle [18, 59, 60],
thousand grain weight [59] and grain dimensions [61, 62]. RM20967 associated with GY and
DFF in DS under low N corresponding with the QTL for 2o rachis/panicle and biomass/plant
[63]. The two SSR markers on chromosome 9 viz., RM1189 associated with HSW under LN,
coincided with genomic region for thousand grain weight [60], grain thickness and width [61]
and grain breadth [64]. RM24829 associated with HSW under LN, corresponded with the
reported QTL for thousand grain weight [57]. RM287 on chromosome 11 was associated with
HSW across the treatments and seasons and GY under LN matched with QTL regions
PLOS ONE Major pleiotropic QTL for yield components and nitrogen content in rice
PLOS ONE | https://doi.org/10.1371/journal.pone.0240854 October 20, 2020 11 / 22
reported for thousand grain weight [54], grain length, width and grain weight [58]. RM1159
on chromosome 12 associated with HSW under both LN and RN, concurred with QTL
reported by Tong et al. [15] for grain weight. RM1159 (chromosome 12) associated with HSW
under both treatments was matched with the reported region of grain weight QTL [15].
N content and N indices. The locations of RM11307, RM6716, RM11258 (chromosome
1) associated with RGY in DS corroborated with genomic regions for relative grain weight
reported by Ogawa et al. [21]. Association of RM15855 (chromosome 3) with GNP, SPAD and
PH under LN coincided with genomic region for photosynthetic ability, chlorophyll a/b ratio
and plant height [65]. RM17201 (chromosome 4) was associated with GNPP and TDM under
LN in WS and DS, concurred with genomic region for grain yield under LN [19]. Under LN,
GNPP, GY, LL and LA were associated with RM19341 (chromosome 6) across seasons and
this region corresponded with QTL location for flag leaf length, spikelet and grain number per
panicle and grain weight [66].
Leaf length, width, area and SPAD. The SSR markers on chromosomes 1 and 2
(RM5641 and RM13021) associated with LL, LA and LW coincided with reported QTL for leaf
traits [44, 47, 67–69]. In the present study, SPAD was associated with RM13034 (chromosome
2) under LN across seasons. This region was also identified for SPAD [46] and chlorophyll
content under LN [15]. RM20350 (chromosome 6) associated with LL and SPAD under both
treatments and across seasons, also corresponded to the reported genomic regions for flag leaf
width, second leaf width and area [67] and region associated with stromal processing peptidase
(spp) responsible for chloroplast biogenesis at early growth stage and root development [70].
RM22524 (chromosome 8) was associated with LL and LA under both treatments and seasons
found to be coinciding with the QTL for flag leaf length, flag leaf width identified by Marathi
et al. [47]. RM1189 (chromosome 9) associated with LL and LA under LN also found to be in
the QTL region reported for flag leaf length [71].
Days for 50% flowering, plant height and number of tillers. Markers for DFF
(RM10090, RM1) on chromosome 1 were also found to be coinciding with QTL location for
days to heading [40, 48]. In the present study, DFF was associated under both LN (RM20746)
and RN (RM19341) on chromosome 6 in DS also matched with region of QTL for heading
date (qhd-6) identified by Bai et al. [60] and 50% flowering by Marathi et al. [47]. In the present
study, genomic region for PH on chromosome 2 was detected by SMA (RM13197, RM13201,
and RM13209) under LN and RN shared its location with genomic region for plant height
(qPHT 2–1) as reported by Marathi et al. [47]. The SSRs identified for TNO (RM1, RM10090,
RM11307, RM12276) of chromosome 1 under LN and RN in DS were found to be co-localiz-
ing with QTL locations for tiller number by Zang et al. [72] (QTn1) and Kaladhar et al. [40] (nt1.2). RM7110 (chromosome 7) associated with PH and DFF under LN in DS has also co-local-
ized with genomic regions for plant height and heading dates by Kotla et al. [73] and Liu et al.
[74]. Similarly, PH and DFF in DS associated with RM1189 (chromosome 9) under LN shared
its location with QTL identified for plant height [46, 71] and days to 50% flowering [75].
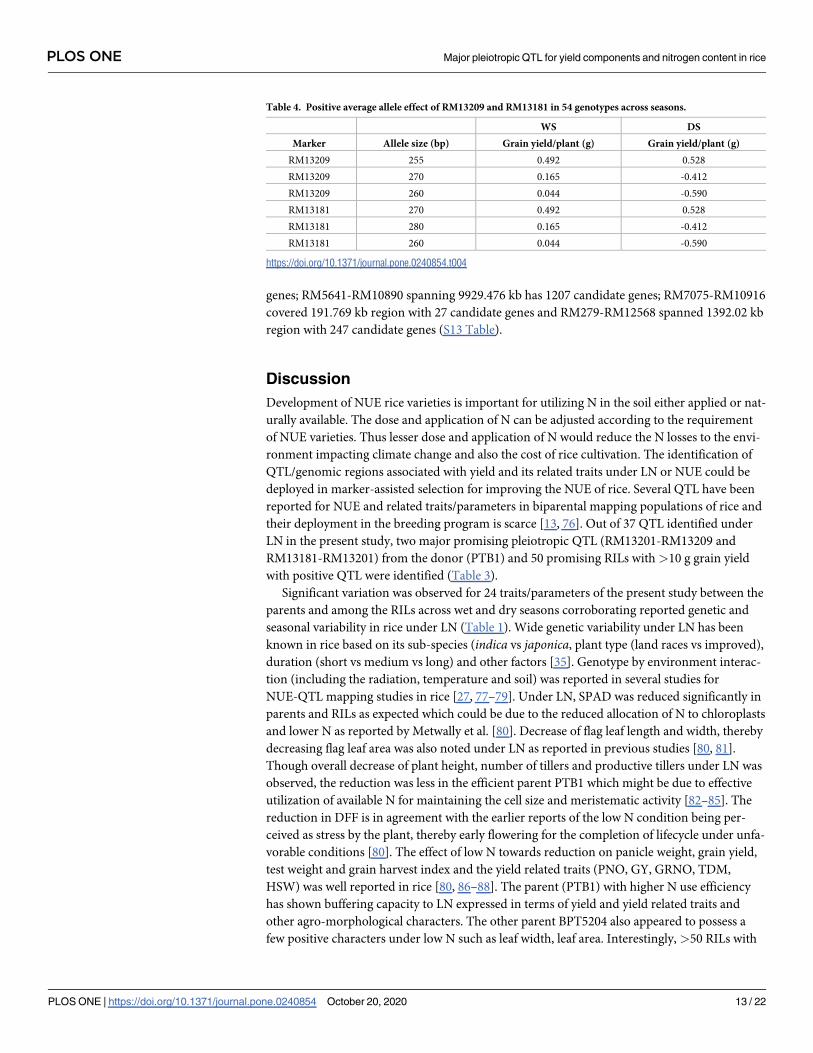
Positive average allele effect. On amplification of two SSRs (RM13201 and RM13181)
from two major pleiotropic QTL (RM13201-RM13209 and RM13181-RM13201) in 54 geno-
types, three alleles each were obtained per SSR. Two alleles (RM13029-255 bp and RM13181-
270bp) same size as PTB1 have shown positive effect with grain yield (g) (Table 4).
In silico analysis for candidate gene identification
Out of the 37 QTL identified, five pleiotropic QTL affecting two or more than two traits were
analyzed for the candidate genes viz., RM13201-RM13209 region spanning 825.4 kb region
has 54 putative candidate genes; RM13181-RM13201 covering 467.706 kb has 42 candidate
PLOS ONE Major pleiotropic QTL for yield components and nitrogen content in rice
PLOS ONE | https://doi.org/10.1371/journal.pone.0240854 October 20, 2020 12 / 22
genes; RM5641-RM10890 spanning 9929.476 kb has 1207 candidate genes; RM7075-RM10916
covered 191.769 kb region with 27 candidate genes and RM279-RM12568 spanned 1392.02 kb
region with 247 candidate genes (S13 Table).
Discussion
Development of NUE rice varieties is important for utilizing N in the soil either applied or nat-
urally available. The dose and application of N can be adjusted according to the requirement
of NUE varieties. Thus lesser dose and application of N would reduce the N losses to the envi-
ronment impacting climate change and also the cost of rice cultivation. The identification of
QTL/genomic regions associated with yield and its related traits under LN or NUE could be
deployed in marker-assisted selection for improving the NUE of rice. Several QTL have been
reported for NUE and related traits/parameters in biparental mapping populations of rice and
their deployment in the breeding program is scarce [13, 76]. Out of 37 QTL identified under
LN in the present study, two major promising pleiotropic QTL (RM13201-RM13209 and
RM13181-RM13201) from the donor (PTB1) and 50 promising RILs with >10 g grain yield
with positive QTL were identified (Table 3).
Significant variation was observed for 24 traits/parameters of the present study between the
parents and among the RILs across wet and dry seasons corroborating reported genetic and
seasonal variability in rice under LN (Table 1). Wide genetic variability under LN has been
known in rice based on its sub-species (indica vs japonica, plant type (land races vs improved),
duration (short vs medium vs long) and other factors [35]. Genotype by environment interac-
tion (including the radiation, temperature and soil) was reported in several studies for
NUE-QTL mapping studies in rice [27, 77–79]. Under LN, SPAD was reduced significantly in
parents and RILs as expected which could be due to the reduced allocation of N to chloroplasts
and lower N as reported by Metwally et al. [80]. Decrease of flag leaf length and width, thereby
decreasing flag leaf area was also noted under LN as reported in previous studies [80, 81].
Though overall decrease of plant height, number of tillers and productive tillers under LN was
observed, the reduction was less in the efficient parent PTB1 which might be due to effective
utilization of available N for maintaining the cell size and meristematic activity [82–85]. The
reduction in DFF is in agreement with the earlier reports of the low N condition being per-
ceived as stress by the plant, thereby early flowering for the completion of lifecycle under unfa-
vorable conditions [80]. The effect of low N towards reduction on panicle weight, grain yield,
test weight and grain harvest index and the yield related traits (PNO, GY, GRNO, TDM,
HSW) was well reported in rice [80, 86–88]. The parent (PTB1) with higher N use efficiency
has shown buffering capacity to LN expressed in terms of yield and yield related traits and
other agro-morphological characters. The other parent BPT5204 also appeared to possess a
few positive characters under low N such as leaf width, leaf area. Interestingly, >50 RILs with
Table 4. Positive average allele effect of RM13209 and RM13181 in 54 genotypes across seasons.
WS DS
Marker Allele size (bp) Grain yield/plant (g) Grain yield/plant (g)
RM13209 255 0.492 0.528
RM13209 270 0.165 -0.412
RM13209 260 0.044 -0.590
RM13181 270 0.492 0.528
RM13181 280 0.165 -0.412
RM13181 260 0.044 -0.590
https://doi.org/10.1371/journal.pone.0240854.t004
PLOS ONE Major pleiotropic QTL for yield components and nitrogen content in rice
PLOS ONE | https://doi.org/10.1371/journal.pone.0240854 October 20, 2020 13 / 22
promising yield (> 10g) under LN were obtained indicating transgressive variants with the
positive recombination of characters from both parents (Table 1). The promising lines
obtained in present study confirm the feasibility of combining favorable characters resulting in
higher yield under LN. As reported, significant genotypic differences were also detected for
NDT traits in our study [27]. The use of NUE indices was indicated for identification of high
and low NUE aromatic rice genotypes [7], similarly we could identify RILs with promising
NUE based on NUE indices for wet and dry seasons. Correlation and path analyses suggested
important traits for the purpose of selection under LN for grain yield (Fig 2). In accordance
with previous reports, PNUE was found to be correlated negatively with GY under low N sug-
gesting the importance of remobilization in addition to the trait of N uptake [27]. The negative
correlation of relative traits viz., RGY, RBM, RGN and RBN with NUE parameters suggests
that the relative traits could be contradictory for selection.
Identification of markers/QTL associated with traits of interest under LN would be useful
in MAS for the development of rice varieties with NUE. Trait wise marker association exclu-
sively under LN through SMA has identified more markers during the dry season over wet sea-
son. GNPP (grain nitrogen per plant), TDM (total dry matter) and GY (grain yield) found to
be associated with>10 markers which is expected owing to the complexity of the traits (S10
Table). Around 50% of the identified markers in the present study have shown associations
with more than five traits/parameters and co-localized with the reported genomic regions.
SMA has identified 13 SSRs associated with 10 or more than 10 traits (RM10090, RM1167,
RM7075, RM12276, RM13021, RM13197, RM13181, RM3763, RM15855, RM19341, RM7110,
RM5455 and RM287). As these 13 SSRs were also co-localized with reported QTL regions for
related traits under LN or RN, the regions of these markers are being proposed for their utiliza-
tion in MAS and also for further characterization.
Selective genotyping approach showed five genomic regions associated with yield under LN
reiterating the utility of this approach in saving of time and resources for identification of
marker associated genomic regions as reported in earlier studies [89]. Since yield is the key
component for NUE, the focus was on identification of genomic regions with yield and yield
related traits under LN and their corroboration with the earlier reported genomic regions with
yield in rice either under RN or LN. In the present study, 19 QTL on chromosomes 1 and 2
have been identified in common across seasons and treatments out of 37 QTL under LN and
32 QTL under RN. The phenotypic variation of these QTL ranged from 4% to 67% and the
contribution of QTL was observed to be from both parents of the RIL. From our study and
reported studies, two kinds of QTL were observed viz., QTL common for both treatments and
QTL found to be exclusive for either LN or RN. The basic mechanism for N metabolism in
rice is similar, thus common QTL are expected for LN and RN as reported [19, 90]. However,
under LN condition, the plant needs to adapt with additional mechanisms; therefore, different
QTL/markers can also be expected as observed in the present study and earlier studies [19].
Pyramiding of these two kinds of QTL would be ideal for development of NUE varieties. Simi-
larly, a few QTL were observed in common across seasons, whereas some exclusive QTL were
found either in WS or DS. Thus, the consistent QTL could be deployed or the season specific
QTL could be used for need based specific adaptability.
In the present study, we found five genomic regions harboring two or more than 2 QTL.
The major stable pleiotropic QTL identified in our study (RM13201—RM13209) from PTB1
spanning 825.4 kb region associated with straw N % (SNP) in both treatments across seasons
and yield and yield related traits in WS appears to be promising for the MAS. Out of eight
QTL identified in this region, five QTL (DFF, TDM, GY, GRNO and SNP) have shown PV
>38%. The second major QTL (RM13181-RM13201) was found to be associated with only rel-
ative trait parameters viz., RBN, RBM and RGN with more than 58% PV. Wei et al [27]
PLOS ONE Major pleiotropic QTL for yield components and nitrogen content in rice
PLOS ONE | https://doi.org/10.1371/journal.pone.0240854 October 20, 2020 14 / 22
indicated the relationship of NDT and NUE and utility of identified NDT QTL as targets for
the development rice cultivars with NUE. Further characterization of two markers (RM13181
and RM13209) from the two major QTL has shown the positive average allele effect (same
allele as PTB1) with grain yield in 54 genotypes under LN strengthening the confidence of
identified QTL in the present study.
After the first QTL study under LN in rice [14], more than 200 QTL have been reported for
differential N in rice [13, 76], however their use in the development of NUE cultivars is less
reported owing to the need of validation of reported QTL, major QTL with higher values of
PV and the availability of donor parent in which QTL were identified. More than half of the
QTL identified in the present study are major QTL with PV >30% and five of the identified
QTL were pleiotropic The QTL with multiple effects or QTL hotspots/QTL clusters under LN
have also been reported earlier [23, 22, 91]. Several proteins and transporter genes identified
within the QTL are being further studied.
Conclusion
Grain yield and nitrogen use efficiency are complex traits and depend on interaction of various
primary traits. Correlation and path coefficient analysis of the present study suggests that PH,
TNO, PNO, GRNO, TDM, and GNPP need to be considered for the rice yield improvement
under LN. More than 50 promising RIL>10 g yield under LN were identified. Using single
marker analysis, 144 marker trait associations were noted under LN, out of which 13 markers
could be deployed either for MAS or for fine mapping. A major stable pleiotropic (RM13201
—RM13209) from PTB1 region associated with straw N % (SNP) in both treatments across
seasons and yield and yield related traits in WS and another major QTL (RM13181-RM13201)
associated with only relative trait parameters of biomass, grain and grain nitrogen were identi-
fied for utilization in marker assisted breeding programs and further characterization.
Supporting information
S1 Table. Screening of 107 rice genotypes under low and recommended N field conditions.
WS: Wet season, DS: Dry season, Low N: Low nitrogen, Rec N: Recommended nitrogen.
(XLSX)
S2 Table. A. Details of soil properties of the experimental plot. B. Details of weather parame-
ters during the experiement.
(XLSX)
S3 Table. Details of 54 genotypes and parents screend under LN and RN during 2014 (WS)
and 2015 (DS). WS: Wet season, DS: Dry season, P: Parent.
(XLSX)
S4 Table. Details of SSRs used for parental polymorphism survey, polymorphic between
the parents, for selective genotyping, for local linkage map and total polymorphic.
(XLSX)
S5 Table. Details of analysis of variance for parents (BPT5204 and PTB1). WS: Wet season,
DS: Dry season.
(XLSX)
S6 Table. Percentage reduction in morpho-physiological, agronomic and yield traits of
parents and RILs in wet and dry seasons. SPAD: SPAD value, LL: leaf length (cm), LW: leaf
width (cm), LA: leaf area (cm), DFF: days to 50% flowering, PH: plant height (cm), TNO: tiller
number, PNO: panicle number: GRNO: grain number, HSW: hundred seed weight (g), GY:
PLOS ONE Major pleiotropic QTL for yield components and nitrogen content in rice
PLOS ONE | https://doi.org/10.1371/journal.pone.0240854 October 20, 2020 15 / 22
grain yield per plant (g/plant), TDM: total dry matter (g/plant), GNP: grain nitrogen percent,
SNP: straw nitrogen percent, GNPP: grain nitrogen/ plant, SNPP: straw nitrogen/ plant.
(XLSX)
S7 Table. A. Path coefficient analysis of morpho physiological, agronomic and yield traits
under low nitrogen in wet season. SPAD: SPAD value, LL: Leaf length (cm), LW: Leaf width
(cm), LA: Leaf area (cm), DFF: Days to 50% flowering, PH: Plant height (cm), TNO: Tiller
number, PNO: Panicle number: GRNO: Grain number, HSW: Hundred seed weight (g), GY:
Grain yield per plant (g/plant), TDM: Total dry matter (g/plant), GNP: Grain nitrogen per-
cent, SNP: Straw nitrogen percent, GNPP: Grain nitrogen/ plant, SNPP: Straw nitrogen/ plant,
NHI: Nitrogen harvest index. B. Path coefficient analysis of morpho physiological, agronomic
and yield traits under low nitrogen in dry season. SPAD: SPAD value, LL: Leaf length (cm),
LW: Leaf width (cm), LA: Leaf area (cm), DFF: Days to 50% flowering, PH: Plant height (cm),
TNO: Tiller number, PNO: Panicle number: GRNO: Grain number, HSW: Hundred seed
weight (g), GY: Grain yield per plant (g/plant), TDM: Total dry matter (g/plant), GNP: Grain
nitrogen percent, SNP: Straw nitrogen percent, GNPP: Grain nitrogen/ plant, SNPP: Straw
nitrogen/ plant, NHI: Nitrogen harvest index. C. Path coefficient analysis of morpho physio-
logical, agronomic and yield traits under recommended nitrogen in wet season. SPAD: SPAD
value, LL: Leaf length (cm), LW: Leaf width (cm), LA: Leaf area (cm), DFF: Days to 50% flow-
ering, PH: Plant height (cm), TNO: Tiller number, PNO: Panicle number: GRNO: Grain num-
ber, HSW: Hundred seed weight (g), GY: Grain yield per plant (g/plant), TDM: Total dry
matter (g/plant), GNP: Grain nitrogen percent, SNP: Straw nitrogen percent, GNPP: Grain
nitrogen/ plant, SNPP: Straw nitrogen/ plant, NHI: Nitrogen harvest index. D. Path coefficient
analysis of morpho physiological, agronomic and yield traits under recommended nitrogen in
dry season. SPAD: SPAD value, LL: Leaf length (cm), LW: Leaf width (cm), LA: Leaf area
(cm), DFF: Days to 50% flowering, PH: Plant height (cm), TNO: Tiller number, PNO: Panicle
number: GRNO: Grain number, HSW: Hundred seed weight (g), GY: Grain yield per plant (g/
plant), TDM: Total dry matter (g/plant), GNP: Grain nitrogen percent, SNP: Straw nitrogen
percent, GNPP: Grain nitrogen/ plant, SNPP: Straw nitrogen/ plant, NHI: Nitrogen harvest
index.
(XLSX)
S8 Table. Segregation table of associated SSRs with grain yield under LN by selective geno-
typing (MapDisto v. 1.7 software (Lorieux 2007)).
(XLSX)
S9 Table. List of polymorphic SSRs between parents BPT5204 and PTB1identified from
the saturation of yield associated genomic regions.
(XLSX)
S10 Table. A. Trait wise marker association under low nitrogen identified through single
marker analysis. SPAD: SPAD value, LL: leaf length (cm), LW: leaf width (cm), LA: leaf area
(cm), DFF: days to 50% flowering, PH: plant height (cm), TNO: tiller number, PNO: panicle
number: GRNO: grain number, HSW: hundred seed weight (g), GY: grain yield per plant (g/
plant), TDM: total dry matter (g/plant), GNP: grain nitrogen percent, SNP: straw nitrogen per-
cent, GNPP: grain nitrogen/ plant, SNPP: straw nitrogen/ plant, NHI: nitrogen harvest index,
RGY: relative grain yield, RBM: relative biomass yield, RGN: relative grain nitrogen, RBN: rel-
ative biomass nitrogen, PNUE: physiological nitrogen use efficiency, ANUE: agronomic nitro-
gen use efficiency, APE: agro- physiological efficiency. B. Chromosome wise marker trait
association under low nitrogen identified through single marker analysis. SPAD: SPAD value,
LL: leaf length (cm), LW: leaf width (cm), LA: leaf area (cm), DFF: days to 50% flowering, PH:
PLOS ONE Major pleiotropic QTL for yield components and nitrogen content in rice
PLOS ONE | https://doi.org/10.1371/journal.pone.0240854 October 20, 2020 16 / 22
plant height (cm), TNO: tiller number, PNO: panicle number: GRNO: grain number, HSW:
hundred seed weight (g), GY: grain yield per plant (g/plant), TDM: total dry matter (g/plant),
GNP: grain nitrogen percent, SNP: straw nitrogen percent, GNPP: grain nitrogen/ plant,
SNPP: straw nitrogen/ plant, NHI: nitrogen harvest index, RGY: relative grain yield, RBM: rel-
ative biomass yield, RGN: relative grain nitrogen, RBN: relative biomass nitrogen, PNUE:
physiological nitrogen use efficiency, ANUE: agronomic nitrogen use efficiency, APE: agro-
physiological efficiency.
(XLSX)
S11 Table. A. Trait wise associations with phenotypic traits with single marker analysis of for
nine polymorphic SSRs. SPAD: SPAD value, LL: leaf length (cm), LW: leaf width (cm), LA:
leaf area (cm), DFF: days to 50% flowering, PH: plant height (cm), TNO: tiller number, PNO:
panicle number: GRNO: grain number, HSW: hundred seed weight (g), GY: grain yield per
plant (g/plant), TDM: total dry matter (g/plant), GNP: grain nitrogen percent, SNP: straw
nitrogen percent, GNPP: grain nitrogen/ plant, SNPP: straw nitrogen/ plant, NHI: nitrogen
harvest index, RGY: relative grain yield, RBM: relative biomass yield, RGN: relative grain
nitrogen, RBN: relative biomass nitrogen, PNUE: physiological nitrogen use efficiency,
ANUE: agronomic nitrogen use efficiency, APE: agro- physiological efficiency. B. Marker wise
associations with phenotypic traits with single marker analysis of for nine polymorphic SSRs.
SPAD: SPAD value, LL: leaf length (cm), LW: leaf width (cm), LA: leaf area (cm), DFF: days to
50% flowering, PH: plant height (cm), TNO: tiller number, PNO: panicle number: GRNO:
grain number, HSW: hundred seed weight (g), GY: grain yield per plant (g/plant), TDM: total
dry matter (g/plant), GNP: grain nitrogen percent, SNP: straw nitrogen percent, GNPP: grain
nitrogen/ plant, SNPP: straw nitrogen/ plant, NHI: nitrogen harvest index, RGY: relative grain
yield, RBM: relative biomass yield, RGN: relative grain nitrogen, RBN: relative biomass nitro-
gen, PNUE: physiological nitrogen use efficiency, ANUE: agronomic nitrogen use efficiency,
APE: agro- physiological efficiency.
(XLSX)
S12 Table. Details of QTL identified through CIM for traits under Recommeneded Nitro-
gen (RN). SPAD: SPAD value, LL: leaf length (cm), LW: leaf width (cm), LA: leaf area (cm),
DFF: days to 50% flowering, PH: plant height (cm), TNO: tiller number, PNO: panicle num-
ber: GRNO: grain number, HSW: hundred seed weight (g), GY: grain yield per plant (g/plant),
TDM: total dry matter (g/plant), GNP: grain nitrogen percent, SNP: straw nitrogen percent,
GNPP: grain nitrogen/ plant, SNPP: straw nitrogen/ plant, NHI: nitrogen harvest index, RN:
Recommended nitrogen, LN: Low nitrogen, WS: Wet season, DS: Dry season.
(XLSX)
S13 Table. The details of putative candidate genes in the region of pleiotropic QTL.
(XLSX)
S1 Fig. Details of inter trait correlation under recommended nitrogen in wet season (1-A),
recommended nitrogen in dry season (1-B), nitrogen efficiency indices in wet season (1-C)
and nitrogen efficiency indices in dry season (1-D). SPAD: SPAD value, LL: leaf length (cm),
LW: leaf width (cm), LA: leaf area (cm), DFF: days to 50% flowering, PH: plant height (cm),
TNO: tiller number, PNO: panicle number: GRNO: grain number, HSW: hundred seed weight
(g), GY: grain yield per plant (g/plant), TDM: total dry matter (g/plant), GNP: grain nitrogen
percent, SNP: straw nitrogen percent, GNPP: grain nitrogen/ plant, SNPP: straw nitrogen/
plant, NHI: nitrogen harvest index, RGY: relative grain yield, RBM: relative biomass yield,
RGN: relative grain nitrogen, RBN: relative biomass nitrogen, PNUE: physiological nitrogen
PLOS ONE Major pleiotropic QTL for yield components and nitrogen content in rice
PLOS ONE | https://doi.org/10.1371/journal.pone.0240854 October 20, 2020 17 / 22
use efficiency, ANUE: agronomic nitrogen use efficiency, APE: agro physiological efficiency.
(DOCX)
S2 Fig. Venn diagram showing unique and shared marker trait associations across under
low and recommended nitrogen levels across wet and dry seasons.
(DOC)
Acknowledgments
Authors are thankful to National Innovations on Climate Resilient Agriculture (NICRA),
Indian Council of Agricultural Research (ICAR).
Author Contributions
Conceptualization: C. N. Neeraja.
Formal analysis: T. Vishnukiran, D. Subrahmanyam.
Funding acquisition: P. Raghuveer Rao, S. R. Voleti.
Investigation: T. Vishnukiran, P. Vijayalakshmi.
Methodology: C. N. Neeraja, V. Jaldhani, P. Vijayalakshmi.
Project administration: C. N. Neeraja, S. R. Voleti.
Resources: C. N. Neeraja, D. Subrahmanyam.
Software: T. Vishnukiran.
Supervision: C. N. Neeraja, P. Raghuveer Rao, S. R. Voleti.
Validation: T. Vishnukiran.
Writing – original draft: T. Vishnukiran, C. N. Neeraja.
Writing – review & editing: C. N. Neeraja.
References1. Glass AD. Nitrogen use efficiency of crop plants: physiological constraints upon nitrogen absorption.
Crit Rev Plant Sci. 2003 Sep 1; 22(5): 453–470.
2. Raun WR, Johnson GV. Improving nitrogen use efficiency for cereal production. Agron J. 1999; 91(3):
357–63.
3. Vijayalakshmi P, Kiran TV, Rao YV, Srikanth B, Rao IS, Sailaja B, et al. Physiological approaches for
increasing nitrogen use efficiency in rice. Indian J Plant Physiol. 2013 Sep 1; 18(3):208–22.
4. Xia L, Zhiwei S, Lei J, Lei H, Chenggang R, Man W, et al. High/low nitrogen adapted hybrid of rice culti-
vars and their physiological responses. Afr J Biotechnol. 2011; 10(19): 3731–3738.
5. Namai S, Toriyama K, Fukuta Y. Genetic variations in dry matter production and physiological nitrogen
use efficiency in rice (Oryza sativa L.) varieties. Breed Sci. 2009; 59(3): 269–76.
6. Swamy KN, Kondamudi R, Vijayalakshmi P, Jaldhani V, Suchandranath BM, Kiran TV, et al. A compar-
ative study on nitrogen response among Upland, IRHTN, DRR and other released rice groups. Afr J
Agric Res. 2015; 10: 4364–4369.
7. Vijayalakshmi P, Vishnukiran T, Kumari BR, Srikanth B, Rao IS, Swamy KN, et al. Biochemical and
physiological characterization for nitrogen use efficiency in aromatic rice genotypes. Field Crops Res.
2015 Aug 1; 179:132–43.
8. Fageria NK and Baligar VC. Lowland rice response to nitrogen fertilization. Commun Soil Sci Plan.
2001 Jun 30; 32(9–10):1405–29.
9. Deshmukh R, Singh A, Jain N, Anand S, Gacche R, Singh A, et al. Identification of candidate genes for
grain number in rice (Oryza sativa L.) Funct Integr Genomic. 2010 Aug 1; 10(3):339–47.
PLOS ONE Major pleiotropic QTL for yield components and nitrogen content in rice
PLOS ONE | https://doi.org/10.1371/journal.pone.0240854 October 20, 2020 18 / 22
10. Chandra BS, Reddy TD, Ansari NA, Kumar SS. Correlation and Path Analysis for Yield and Yield Com-
ponents in Rice (Oryza Sativa L.). Agric Sci Digest. 2009; 29:45–47.
11. Cyprien M, Vinod Kumar V. Correlation and Path Coefficient Analysis of Rice Cultivars Data. J Reliab
Stat Stud. 2011 Dec; 4(2):119–31.
12. Seyoum M, Alamerew S, Bantte K. Genetic variability, heritability, correlation coefficient and path analy-
sis for yield and yield related traits in upland rice (Oryza sativa L.). J Plant Sci. 2012 Jan 1; 7(1):13–22.
13. Vinod KK, Heuer S. Approaches towards nitrogen-and phosphorus-efficient rice. AoB Plants. 2012 Jan
1; 2012.
14. Fang P, Wu P. QTL×N-level interaction for plant height in rice (Oriza Sativa L.). Plant Soil. 2001 Oct 1;
236(2):237–42.
15. Tong HH, Mei HW, Yu XQ, Xu XY, Li MS, Zhang SQ, et al. Identification of related QTLs at late develop-
mental stage in rice (Oryza sativa L.) under two nitrogen levels. Acta Genetica Sinica. 2006 May 1; 33
(5):458–67. https://doi.org/10.1016/S0379-4172(06)60073-5 PMID: 16722341
16. Cho YG, Kang HJ, Lee JS, Lee YT, Lim SJ, Gauch H, et al. Identification of quantitative trait loci in rice
for yield, yield components, and agronomic traits across years and locations. Crop Sci. 2007 Nov 1; 47
(6):2403–17.
17. Senthilvel S, Vinod KK, Malarvizhi P, Maheswaran M. QTL and QTL× environment effects on agro-
nomic and nitrogen acquisition traits in rice. J Integr Plant Biol. 2008 Sep; 50(9):1108–17. https://doi.
org/10.1111/j.1744-7909.2008.00713.x PMID: 18844779
18. Tong HH, Chen L, Li WP, Mei HW, Xing YZ, Yu XQet al. Identification and characterization of quantita-
tive trait loci for grain yield and its components under different nitrogen fertilization levels in rice (Oryza
sativa L.). Mol Breed. 2011 Dec 1; 28(4):495–509.
19. Yue F, Rong-rong Z, Ze-chuan L, Li-yong C, Xing-hua W, Shi-hua C. Quantitative trait locus analysis for
rice yield traits under two nitrogen levels. Rice Sci. 2015 May 1; 22(3):108–15.
20. Nguyen HT, Dang DT, Van Pham C, Bertin P. QTL mapping for nitrogen use efficiency and related
physiological and agronomical traits during the vegetative phase in rice under hydroponics. Euphytica.
2016 Dec 1; 212(3):473–500.
21. Ogawa S, Valencia MO, Lorieux M, Arbelaez JD, McCouch S, Ishitani M, et al. Identification of QTLs
associated with agronomic performance under nitrogen-deficient conditions using chromosome seg-
ment substitution lines of a wild rice relative, Oryza rufipogon. Acta Physiol Plant. 2016 Apr 1; 38
(4):103.
22. Jewel ZA, Ali J, Mahender A, Hernandez J, Pang Y, Li Z. Identification of quantitative trait loci associ-
ated with nutrient use efficiency traits, using SNP markers in an early backcross population of rice
(Oryza sativa L.). Int J Mol Sci. 2019 Jan; 20(4):900.
23. Mahender A, Ali J, Prahalada GD, Sevilla MA, Balachiranjeevi CH, Md J, et al. Genetic dissection of
developmental responses of agro-morphological traits under different doses of nutrient fertilizers using
high-density SNP markers. PloS one. 2019; 14(7): 1–28.
24. Vishnukiran T. PhD thesis on Identification of genomic regions associated with yield in rice under low
nitrogen conditions. Jawaharlal Nehru Technological University, India, 2018: 1–250.
25. Yoshida S, Coronel V. Nitrogen nutrition, leaf resistance, and leaf photosynthetic rate of the rice plant.
Soil Sci Plant Nutr. 1976 Jun 1; 22(2):207–11.
26. Fageria NK, De Morais OP, Dos Santos AB. Nitrogen use efficiency in upland rice genotypes. J Plant
Nutr. 2010 Aug 2; 33(11):1696–711.
27. Wei D, Cui K, Ye G, Pan J, Xiang J, Huang J, et al. QTL mapping for nitrogen-use efficiency and nitro-
gen-deficiency tolerance traits in rice. Plant Soil. 2012 Oct 1; 359(1–2):281–95.
28. Zheng K, Subudhi PK, Domingo J, Magpantay G, Huang N. Rapid DNA isolation for marker assisted
selection in rice breeding. Rice Genetics Newsletter. 1995; 12:255–258.
29. Rao IS, Srikanth B, Kishore VH, Suresh PB, Chaitanya U, Vemireddy LR, et al. Indel polymorphism in
sugar translocation and transport genes associated with grain filling of rice (Oryza sativa L.). Molecular
breeding. 2011 Dec 1; 28(4):683–91.
30. Lorieux M. MapDisto: a free user-friendly program for computing genetic maps. Computer demonstra-
tion given at the Plant and Animal Genome XV conference, 13–17 Jan 2007, San Diego, CA.
31. R core team. R: A language and environment for statistical computing (version 2.8) [software]. 2012.
Available at: http://www.R-project.org
32. de Mendiburu F. Agricolae: Statistical Procedures for Agricultural Research. R package version 1.
2012; 1–3. Available: http://CRAN.R-project.org/package=agricolae.
33. Dewey DR, Lu K. A Correlation and Path-Coefficient Analysis of Components of Crested Wheatgrass
Seed Production 1. Agron J. 1959 Sep 1; 51(9):515–8.
PLOS ONE Major pleiotropic QTL for yield components and nitrogen content in rice
PLOS ONE | https://doi.org/10.1371/journal.pone.0240854 October 20, 2020 19 / 22
34. Akintunde A. Path analysis step by step using excel. Journal of Technical science and Technologies.
2012 May 30; 1(1):09–15.
35. Rao IS, Neeraja CN, Srikanth B, Subrahmanyam D, Swamy KN, Rajesh K, et al. Identification of rice
landraces with promising yield and the associated genomic regions under low nitrogen. Sci Rep. 2018
Jun 15; 8(1):1–3. https://doi.org/10.1038/s41598-017-17765-5 PMID: 29311619
36. Wei D, Cui K, Pan J, Wang Q, Wang K, Zhang X, et al. Identification of quantitative trait loci for grain
yield and its components in response to low nitrogen application in rice. Aust J Crop Sci. 2012 Jun; 6
(6):986.
37. Bian JM, Shi H, Li CJ, Zhu CL, Yu QY, Peng XS, et al. QTL mapping and correlation analysis for 1000-
grain weight and percentage of grains with chalkiness in rice. J Genet. 2013 Aug 1; 92(2):281–7.
https://doi.org/10.1007/s12041-013-0267-6 PMID: 23970084
38. Lu C, Shen L, He P, Chen Y, Zhu L, Tan Z, et al. Comparative mapping of QTLs for agronomic traits of
rice across environments by using a doubled-haploid population. Theor Appl Genet. 1997 Jan 1; 94
(1):145–50. https://doi.org/10.1007/s001220050393 PMID: 19352757
39. Son YJ, Lee GH, Lee HS, Handoyo T, Yun BW, Kim KM. Analysis of High-Resolution QTL Markers
Associated with Rice Yields Using Data for Two Consecutive Years in Different Environmental Condi-
tions. Natural Science. 2014 Jul 18; 6:818–827.
40. Kaladhar K, Swamy BP, Babu AP, Reddy CS, Sarla N. Mapping quantitative trait loci for yield traits in
BC2F2 population derived from Swarna x O. nivara cross. Rice Genet Newslett. 2008; 24:34–36.
41. Sandhu N, Singh A, Dixit S, Cruz MT, Maturan PC, Jain RK, et al. Identification and mapping of stable
QTL with main and epistasis effect on rice grain yield under upland drought stress. BMC Genet. 2014
Dec 1; 15(1):63.
42. Redona ED, Mackill DJ. Quantitative trait locus analysis for rice panicle and grain characteristics. Theo-
retical and Applied Genetics. 1998 May 1; 96(6–7):957–963.
43. Liu T, Yu T, Xing Y. Identification and validation of a yield-enhancing QTL cluster in rice (Oryza sativa
L.). Euphytica. 2013 Jul 1; 192(1):145–153.
44. Zhan X, Sun B, Lin Z, Gao Z, Yu P, Liu Q, et al. Genetic mapping of a QTL controlling source–sink size
and heading date in rice. Gene. 2015 Oct 25; 571(2):263–270. https://doi.org/10.1016/j.gene.2015.06.
065 PMID: 26123916
45. Sabouri A, Toorchi M, Rabiei B, Aharizad S, Moumeni A, Singh R. Identification and mapping of QTLs
for agronomic traits in indica—indica cross of rice (Oryza sativa L.). Cereal Res Commun. 2010 Sep 1;
38(3):317–326.
46. Marri PR, Sarla N, Reddy LV, Siddiq EA. Identification and mapping of yield and yield related QTLs
from an Indian accession of Oryza rufipogon. BMC Genet. 2005 Dec 1; 6(1):33.
47. Marathi B, Guleria S, Mohapatra T, Parsad R, Mariappan N, Kurungara VK, et al. QTL analysis of novel
genomic regions associated with yield and yield related traits in new plant type based recombinant
inbred lines of rice (Oryza sativa L.). BMC Plant Biol. 2012 Dec; 12(1):137.
48. Matsubara K, Yamamoto E, Kobayashi N, Ishii T, Tanaka J, Tsunematsu H, et al. Improvement of rice
biomass yield through QTL-based selection. PloS one. 2016; 11(3).
49. Zou GH, Mei HW, Liu HY, Liu GL, Hu SP, Yu XQ, et al. Grain yield responses to moisture regimes in a
rice population: association among traits and genetic markers. Theor Appl Genet. 2005 Dec 1; 112
(1):106–113. https://doi.org/10.1007/s00122-005-0111-3 PMID: 16231161
50. Yamaya T, Obara M, Nakajima H, Sasaki S, Hayakawa T, Sato T. Genetic manipulation and quantita-
tive-trait loci mapping for nitrogen recycling in rice. J Exp Bot. 2002 Apr 15; 53(370):917–925. https://
doi.org/10.1093/jexbot/53.370.917 PMID: 11912234
51. Septiningsih EM, Prasetiyono J, Lubis E, Tai TH, Tjubaryat T, Moeljopawiro S, et al. Identification of
quantitative trait loci for yield and yield components in an advanced backcross population derived from
the Oryza sativa variety IR64 and the wild relative O. rufipogon. Theor Appl Genet. 2003 Nov 1; 107
(8):1419–1432. https://doi.org/10.1007/s00122-003-1373-2 PMID: 14513215
52. Zhuang JY, Fan YY, Rao ZM, Wu JL, Xia YW, Zheng KL. Analysis on additive effects and additive-by-
additive epistatic effects of QTLs for yield traits in a recombinant inbred line population of rice. Theor
Appl Genet. 2002 Dec 1; 105(8):1137–1145. https://doi.org/10.1007/s00122-002-0974-5 PMID:
12582891
53. Hittalmani S, Huang N, Courtois B, Venuprasad R, Shashidhar HE, Zhuang JY, et al. Identification of
QTL for growth-and grain yield-related traits in rice across nine locations of Asia. Theor Appl Genet.
2003 Aug 1; 107(4):679–690. https://doi.org/10.1007/s00122-003-1269-1 PMID: 12920521
54. Zhang H, Wang H, Qian Y, Xia J, Li Z, Shi Y, et al. Simultaneous improvement and genetic dissection of
grain yield and its related traits in a backbone parent of hybrid rice (Oryza sativa L.) using selective intro-
gression. Mol Breed. 2013 Jan 1; 31(1):181–194.
PLOS ONE Major pleiotropic QTL for yield components and nitrogen content in rice
PLOS ONE | https://doi.org/10.1371/journal.pone.0240854 October 20, 2020 20 / 22
55. Liu T, Li L, Zhang Y, Xu C, Li X, Xing Y. Comparison of quantitative trait loci for rice yield, panicle length
and spikelet density across three connected populations. J Genet. 2011 Aug 1; 90(2):377–382. https://
doi.org/10.1007/s12041-011-0083-9 PMID: 21869494
56. Fu Q, Zhang P, Tan L, Zhu Z, Ma D, Fu Y, et al. Analysis of QTLs for yield-related traits in Yuanjiang
common wild rice (Oryza rufipogon Griff.). J Genet Genomics. 2010 Feb 1; 37(2):147–157. https://doi.
org/10.1016/S1673-8527(09)60033-3 PMID: 20227048
57. Liu T, Shao D, Kovi MR, Xing Y. Mapping and validation of quantitative trait loci for spikelets per panicle
and 1,000-grain weight in rice (Oryza sativa L.). Theor Appl Genet. 2010 Mar 1; 120(5):933–942.
https://doi.org/10.1007/s00122-009-1222-z PMID: 19949766
58. Jing Z, Chen Y, Pan D, Qu Y, Fan Z, Chen J, et al. Development and evaluation of primary introgression
lines of rice by advanced backcross QTL strategy for Gaozhou wild rice (O. rufipogon). Rice Genomics
and Genetics. 2011 Nov 29; 2.
59. Mei HW, Xu JL, Li ZK, Yu XQ, Guo LB, Wang YP, et al. QTLs influencing panicle size detected in two
reciprocal introgressive line (IL) populations in rice (Oryza sativa L.). Theor Appl Genet. 2006 Feb 1;
112(4):648–656. https://doi.org/10.1007/s00122-005-0167-0 PMID: 16331475
60. Bai XF, Luo LJ, Yan WH, Kovi MR, Xing YZ. Quantitative trait loci for rice yield-related traits using
recombinant inbred lines derived from two diverse cultivars. J Genet. 2011 Aug 1; 90(2):209–15.
https://doi.org/10.1007/s12041-011-0057-y PMID: 21869469
61. Bai X, Luo L, Yan W, Kovi MR, Zhan W, Xing Y. Genetic dissection of rice grain shape using a recombi-
nant inbred line population derived from two contrasting parents and fine mapping a pleiotropic quantita-
tive trait locus qGL7. BMC Genet. 2010 Dec 1; 11(1):16.
62. Ya-dong Z, Ying-hui Z, Shao-ling D, Tao C, Qing-yong Z, Zhen Z, et al. QTL Mapping for Grain Size
Traits Based on Extra-Large Grain Rice Line TD70. Rice Sci. 2013; 20:400–406.
63. Srividhya A, Vemireddy LR, Sridhar S, Jayaprada M, Ramanarao PV, Hariprasad AS, et al. Molecular
mapping of QTLs for yield and its components under two water supply conditions in rice (Oryza sativa
L.). J Crop Sci Biotech. 2011 Mar 1; 14(1):45–56.
64. Rabiei B, Valizadeh M, Ghareyazie B, Moghaddam M, Ali AJ. Identification of QTLs for rice grain size
and shape of Iranian cultivars using SSR markers. Euphytica. 2004 Jun 1; 137(3):325–32.
65. Ishimaru K, Yano M, Aoki N, Ono K, Hirose T, Lin SY, et al. Toward the mapping of physiological and
agronomic characters on a rice function map: QTL analysis and comparison between QTLs and
expressed sequence tags. Theor Appl Genet. 2001 May 1; 102(6–7):793–800.
66. Shen B, Yu WD, Du JH, Fan YY, Wu JR, Zhuang JY. Validation and dissection of quantitative trait loci
for leaf traits in interval RM4923-RM402 on the short arm of rice chromosome 6. J Genet. 2011 Apr 1;
90(1):39–44. https://doi.org/10.1007/s12041-011-0019-4 PMID: 21677387
67. Jia B, Zhao X, Qin Y, Irfan M, Kim TH, Wang B, et al. Identification of quantitative trait loci for leaf traits
in rice. Genetika. 2016; 48(2):643–52.
68. Selvaraju K, Shanmugasundaram P, Mohankumar S, Asaithambi M, Balasaraswathi R. Detection of
quantitative trait locus for leaffolder (Cnaphalocrocis medinalis (Guenee)) resistance in rice on linkage
group 1 based on damage score and flag leaf width. Euphytica. 2007 Sep 1; 157(1–2):35–43.
69. Wang P, Zhou G, Yu H, Yu S. Fine mapping a major QTL for flag leaf size and yield-related traits in rice.
Theor Appl Genet. 2011 Dec 1; 123(8):1319–30. https://doi.org/10.1007/s00122-011-1669-6 PMID:
21830109
70. Yue R, Wang X, Chen J, Ma X, Zhang H, Mao C, et al. A rice stromal processing peptidase regulates
chloroplast and root development. Plant and cell physiol. 2010 Mar 1; 51(3):475–85.
71. Lim JH, Yang HJ, Jung KH, Yoo SC, Paek NC. Quantitative trait locus mapping and candidate gene
analysis for plant architecture traits using whole genome re-sequencing in rice. Mol cells. 2014 Feb 28;
37(2):149. https://doi.org/10.14348/molcells.2014.2336 PMID: 24599000
72. Zang J, Sun Y, Wang Y, Yang J, Li F, Zhou Y, et al. Dissection of genetic overlap of salt tolerance QTLs
at the seedling and tillering stages using backcross introgression lines in rice. Sci China Ser C-Life Sci.
2008 Jul 1; 51(7):583–91.
73. Kotla A, Agarwal S, Yadavalli VR, Vinukonda VP, Dhavala VC, Neelamraju S. Quantitative trait loci and
candidate genes for yield and related traits in Madhukar x Swarna RIL population of rice. J Crop Sci Bio-
tech. 2013 Mar 1; 16(1):35–44.
74. Ling-qiang LW, Yu-qing HE. Comparison of Quantitative Trait Locis Controlling Plant Height and Head-
ing Date in Rice Across Two Related Populations [J]. Journal of Huazhong Agricultural University (Natu-
ral Science Edition). 2007; 2.
75. Swamy BM, Kaladhar K, Ramesha MS, Viraktamath BC, Sarla N. Molecular mapping of QTLs for yield
and yield-related traits in Oryza sativa cv Swarna×O. nivara (IRGC81848) backcross population. Rice
Sci. 2011 Sep 1; 18(3):178–86.
PLOS ONE Major pleiotropic QTL for yield components and nitrogen content in rice
PLOS ONE | https://doi.org/10.1371/journal.pone.0240854 October 20, 2020 21 / 22
76. Ali J, Jewel ZA, Mahender A, Anandan A, Hernandez J, Li Z. Molecular genetics and breeding for nutri-
ent use efficiency in rice Int j mol sci. 2018 Jun; 19(6):1762.
77. Lian X, Xing Y, Yan H, Xu C, Li X, Zhang Q. QTLs for low nitrogen tolerance at seedling stage identified
using a recombinant inbred line population derived from an elite rice hybrid. Theor Appl Genet. 2005
Dec 1; 112(1):85–96. https://doi.org/10.1007/s00122-005-0108-y PMID: 16189659
78. Senthilvel S, Vinod KK, Malarvizhi P, Maheswaran M. QTL and QTL× environment effects on agro-
nomic and nitrogen acquisition traits in rice. J Integr Plant Biol. 2008 Sep; 50(9):1108–17. https://doi.
org/10.1111/j.1744-7909.2008.00713.x PMID: 18844779
79. Yu WA, Yong-Jian SU, Deng-Yin CH, Si-Bin YU. Analysis of quantitative trait loci in response to nitro-
gen and phosphorus deficiency in rice using chromosomal segment substitution lines. Acta Agron Sin.
2009 Apr 1; 35(4):580–7.
80. Metwally TF, Sedeek SE, Abdelkhalik AF, El-Rewinyl IM, Metwali EM. Genetic behaviour of some rice
(Oryza sativa L.) genotypes under different treatments of nitrogen levels. American-Eurasian J Agric &
Environ Sci. 2010; 1(5):1266–78.
81. Mhaskar NV, Dongale JH, Dademal AA, Khanvilkar SA. Performance of scented rice varieties under dif-
ferent nitrogen levels in lateritic soil of Konkan. Oryza. 2005; 42(4):323–326.
82. Lawlor DW. Carbon and nitrogen assimilation in relation to yield: mechanisms are the key to under-
standing production systems. J Exp Bot. 2002 Apr 15; 53(370):773–87.
83. Manzoor Z, Awan TH, Zahid MA, Faiz FA. Response of rice crop (super basmati) to different nitrogen
levels. J Anim Pl Sci. 2006; 16(1–2):52–5.
84. Haefele SM, Jabbar SM, Siopongco JD, Tirol-Padre A, Amarante ST, Cruz PS, et al. Nitrogen use effi-
ciency in selected rice (Oryza sativa L.) genotypes under different water regimes and nitrogen levels.
Field Crops Res. 2008 May 10; 107(2):137–46.
85. Haque MA, Haque MM. Growth, yield and nitrogen use efficiency of new rice variety under variable
nitrogen rates. Am J Plant Sci. 2016 Mar 10; 7(3):612–22.
86. Fageria NK, Santos AD. Yield and yield components of lowland rice genotypes as influenced by nitro-
gen fertilization. Communications in Soil Science and Plant Analysis. 2015 Aug 6; 46(14):1723–35.
87. Moro BM, Nuhu IR, Ato E, Naathanial B. Effect of nitrogen rates on the growth and yield of three rice
(Oryza sativa L.) varieties in rain-fed lowland in the forest agro-ecological zone of Ghana. Int J Agric.
2015 Sep; 5(7):878–85.
88. Nayak BR, Pramanik K, Panigrahy N, Dash AK, Swain SK. Yield, nitrogen uptake and nitrogen use effi-
ciency indices of aerobic rice (Oryza sativa L.) under various irrigation regimes and nitrogen levels. Int J
Bio-Resour Env Agril Sci. 2015 Jun; 1:8–13.
89. Suresh PB, Srikanth B, Kishore VH, Rao IS, Vemireddy LR, Dharika N, et al. Fine mapping of Rf3 and
Rf4 fertility restorer loci of WA-CMS of rice (Oryza sativa L.) and validation of the developed marker sys-
tem for identification of restorer lines. Euphytica. 2012 Oct 1; 187(3):421–35.
90. Hu SK, Zeng DL, Shi SY, Ye WJ, Dong GJ, Zhu L, et al. QTL analysis of nitrogen content of plant shoot
under two nitrogen conditions in rice (’Oryza sativa’L.). Aust J Crop Sci. 2012 Dec; 6(12):1737.
91. Dai GJ, Cheng SH, Hua ZT, Zhang ML, Jiang HB, Feng Y, et al. Mapping quantitative trait loci for nitro-
gen uptake and utilization efficiency in rice (Oryza sativa L.) at different nitrogen fertilizer levels. Genet
Mol Res. 2015 Jan 1; 8:10404–14.
PLOS ONE Major pleiotropic QTL for yield components and nitrogen content in rice
PLOS ONE | https://doi.org/10.1371/journal.pone.0240854 October 20, 2020 22 / 22