Embed Size (px)
Citation preview
Getting started with the COCO chemical process simulator - Part 2, plug flow reactorR. K. Herz <[email protected]> 2012
Please make sure you read Part 1 of these notes before starting Part 2.
Add a PFR unit operation and two material streams to the flowsheet.
p. 1 of 11
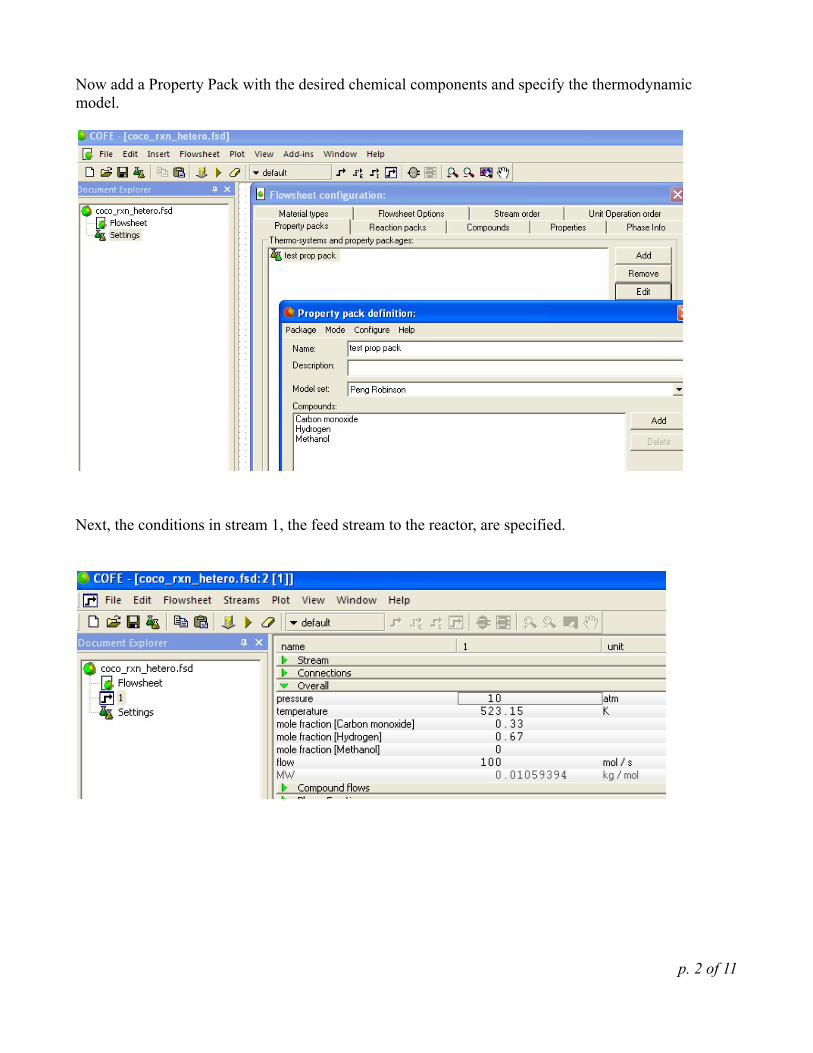
Now add a Property Pack with the desired chemical components and specify the thermodynamic model.
Next, the conditions in stream 1, the feed stream to the reactor, are specified.
p. 2 of 11
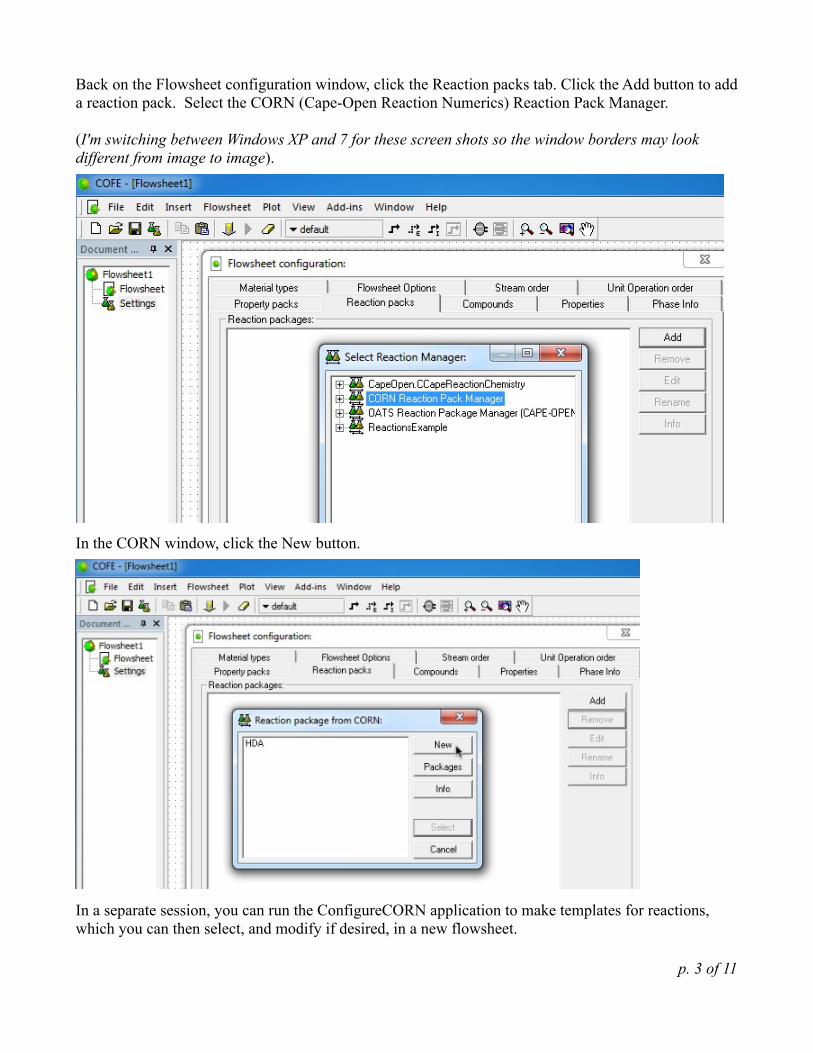
Back on the Flowsheet configuration window, click the Reaction packs tab. Click the Add button to add a reaction pack. Select the CORN (Cape-Open Reaction Numerics) Reaction Pack Manager.
(I'm switching between Windows XP and 7 for these screen shots so the window borders may look different from image to image).
In the CORN window, click the New button.
In a separate session, you can run the ConfigureCORN application to make templates for reactions, which you can then select, and modify if desired, in a new flowsheet.
p. 3 of 11
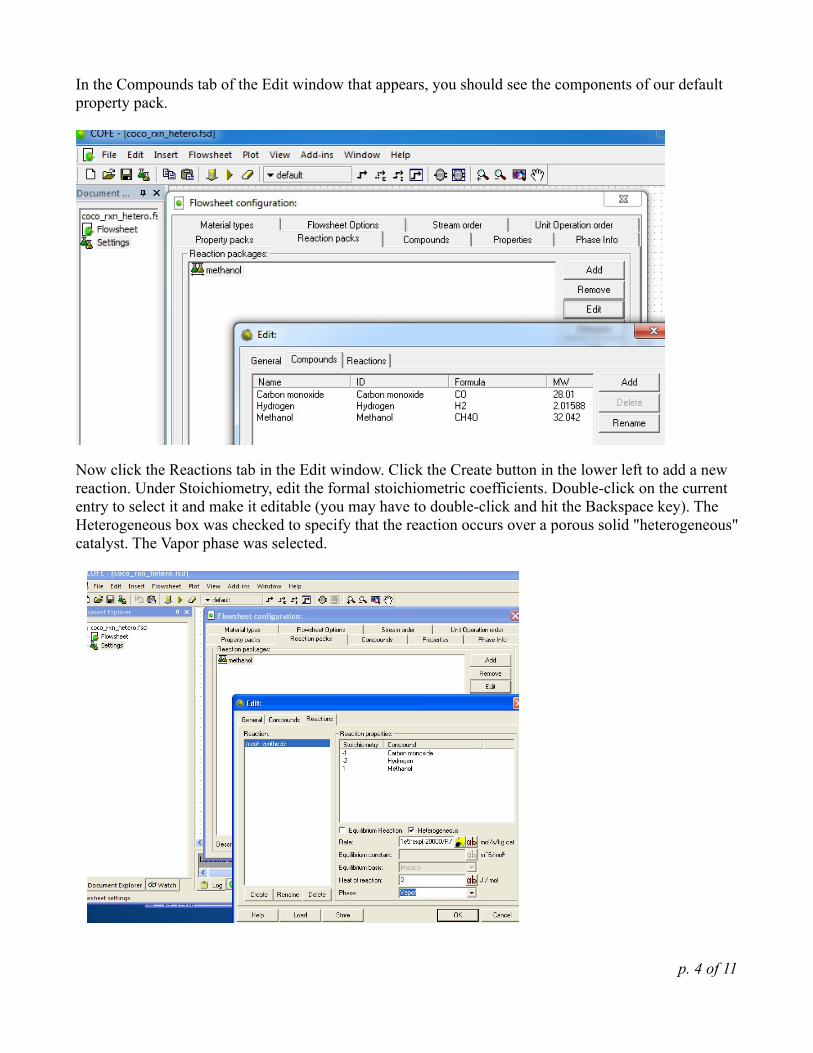
In the Compounds tab of the Edit window that appears, you should see the components of our default property pack.
Now click the Reactions tab in the Edit window. Click the Create button in the lower left to add a new reaction. Under Stoichiometry, edit the formal stoichiometric coefficients. Double-click on the current entry to select it and make it editable (you may have to double-click and hit the Backspace key). The Heterogeneous box was checked to specify that the reaction occurs over a porous solid "heterogeneous" catalyst. The Vapor phase was selected.
p. 4 of 11
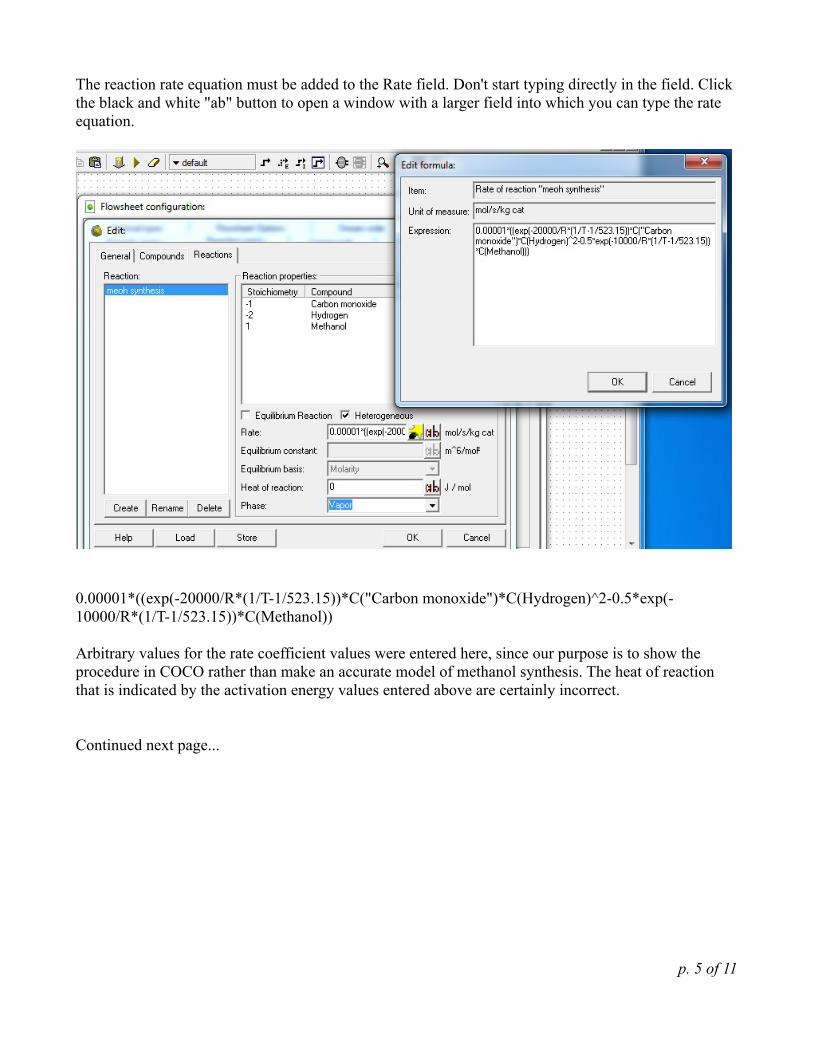
The reaction rate equation must be added to the Rate field. Don't start typing directly in the field. Click the black and white "ab" button to open a window with a larger field into which you can type the rate equation.
0.00001*((exp(-20000/R*(1/T-1/523.15))*C("Carbon monoxide")*C(Hydrogen)^2-0.5*exp(-10000/R*(1/T-1/523.15))*C(Methanol))
Arbitrary values for the rate coefficient values were entered here, since our purpose is to show the procedure in COCO rather than make an accurate model of methanol synthesis. The heat of reaction that is indicated by the activation energy values entered above are certainly incorrect.
Continued next page...
p. 5 of 11
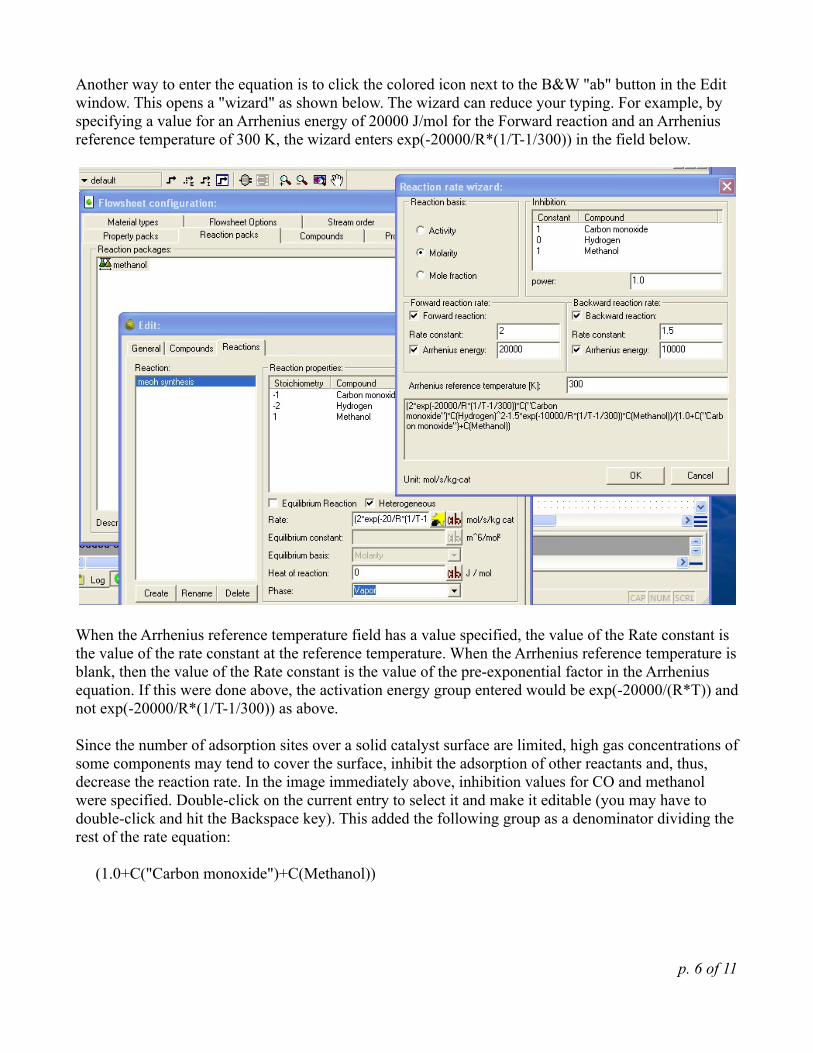
Another way to enter the equation is to click the colored icon next to the B&W "ab" button in the Edit window. This opens a "wizard" as shown below. The wizard can reduce your typing. For example, by specifying a value for an Arrhenius energy of 20000 J/mol for the Forward reaction and an Arrhenius reference temperature of 300 K, the wizard enters exp(-20000/R*(1/T-1/300)) in the field below.
When the Arrhenius reference temperature field has a value specified, the value of the Rate constant is the value of the rate constant at the reference temperature. When the Arrhenius reference temperature is blank, then the value of the Rate constant is the value of the pre-exponential factor in the Arrhenius equation. If this were done above, the activation energy group entered would be exp(-20000/(R*T)) and not exp(-20000/R*(1/T-1/300)) as above.
Since the number of adsorption sites over a solid catalyst surface are limited, high gas concentrations of some components may tend to cover the surface, inhibit the adsorption of other reactants and, thus, decrease the reaction rate. In the image immediately above, inhibition values for CO and methanol were specified. Double-click on the current entry to select it and make it editable (you may have to double-click and hit the Backspace key). This added the following group as a denominator dividing the rest of the rate equation:
(1.0+C("Carbon monoxide")+C(Methanol))
p. 6 of 11
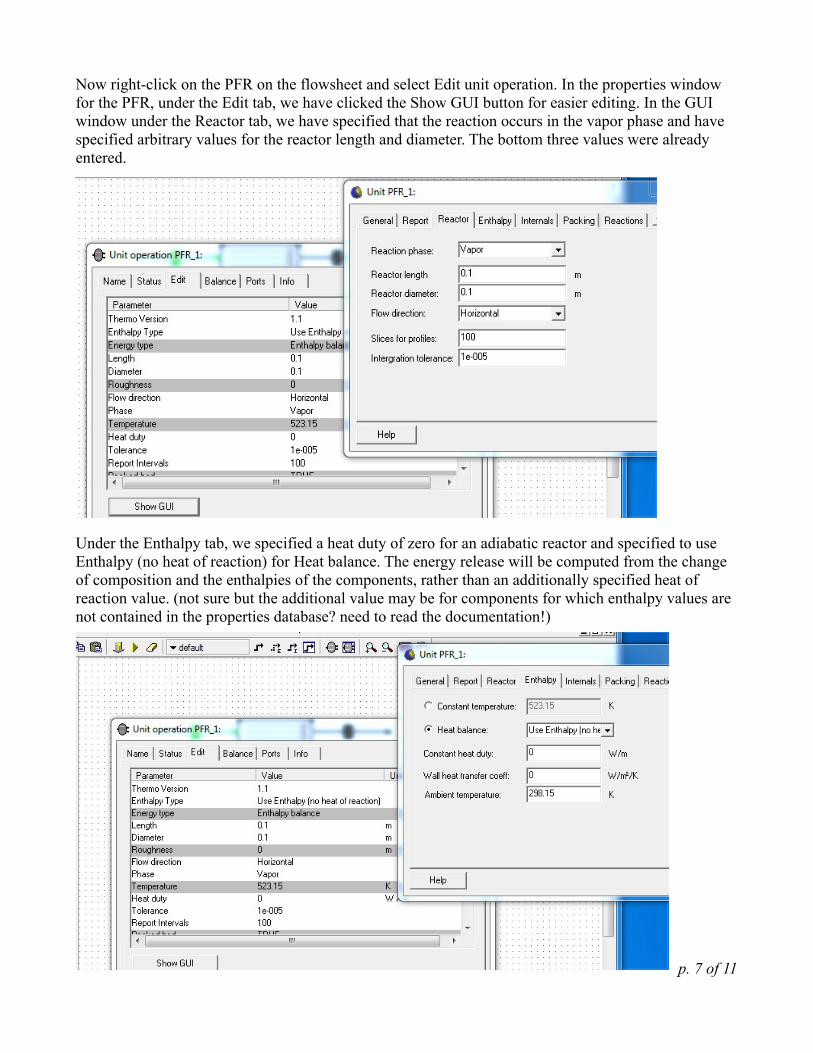
Now right-click on the PFR on the flowsheet and select Edit unit operation. In the properties window for the PFR, under the Edit tab, we have clicked the Show GUI button for easier editing. In the GUI window under the Reactor tab, we have specified that the reaction occurs in the vapor phase and have specified arbitrary values for the reactor length and diameter. The bottom three values were already entered.
Under the Enthalpy tab, we specified a heat duty of zero for an adiabatic reactor and specified to use Enthalpy (no heat of reaction) for Heat balance. The energy release will be computed from the change of composition and the enthalpies of the components, rather than an additionally specified heat of reaction value. (not sure but the additional value may be for components for which enthalpy values are not contained in the properties database? need to read the documentation!)
p. 7 of 11
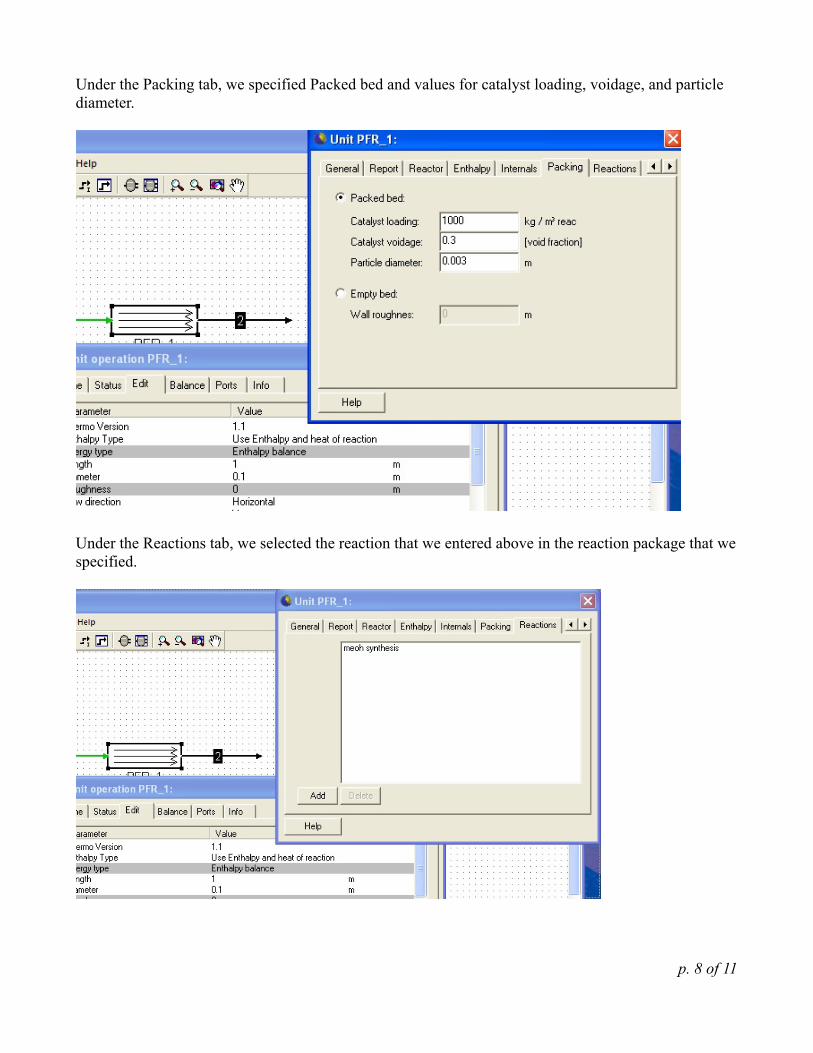
Under the Packing tab, we specified Packed bed and values for catalyst loading, voidage, and particle diameter.
Under the Reactions tab, we selected the reaction that we entered above in the reaction package that we specified.
p. 8 of 11
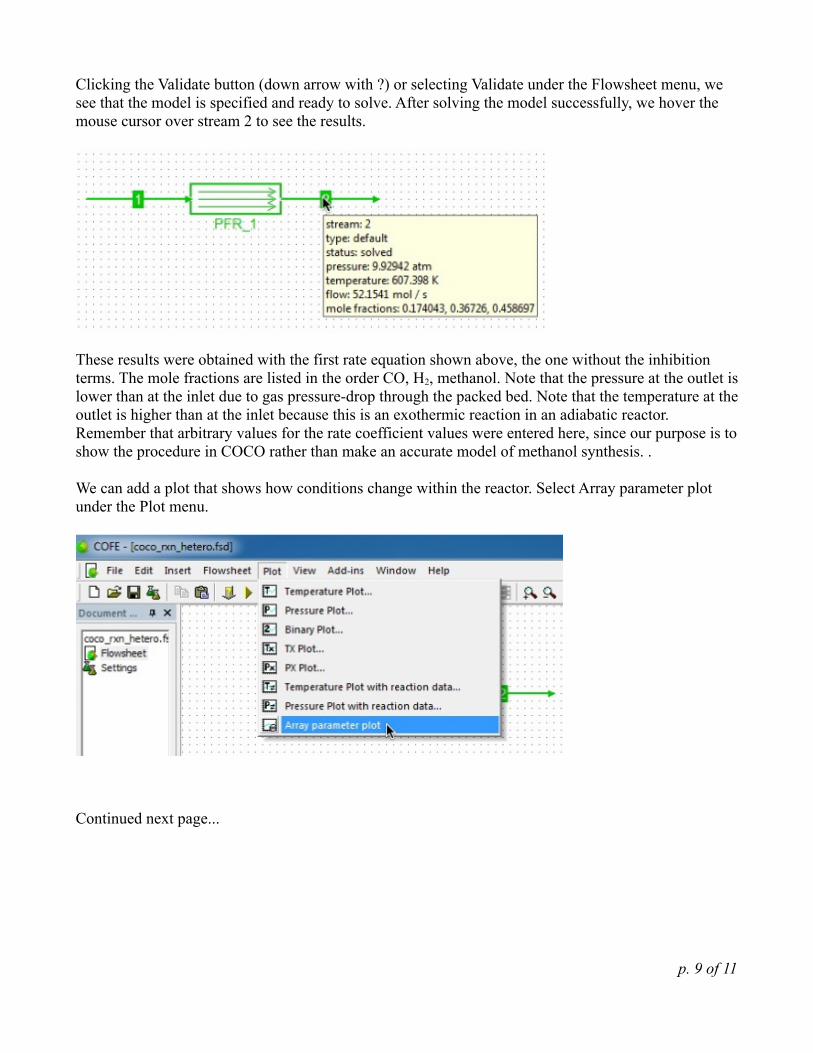
Clicking the Validate button (down arrow with ?) or selecting Validate under the Flowsheet menu, we see that the model is specified and ready to solve. After solving the model successfully, we hover the mouse cursor over stream 2 to see the results.
These results were obtained with the first rate equation shown above, the one without the inhibition terms. The mole fractions are listed in the order CO, H2, methanol. Note that the pressure at the outlet is lower than at the inlet due to gas pressure-drop through the packed bed. Note that the temperature at the outlet is higher than at the inlet because this is an exothermic reaction in an adiabatic reactor. Remember that arbitrary values for the rate coefficient values were entered here, since our purpose is to show the procedure in COCO rather than make an accurate model of methanol synthesis. .
We can add a plot that shows how conditions change within the reactor. Select Array parameter plot under the Plot menu.
Continued next page...
p. 9 of 11
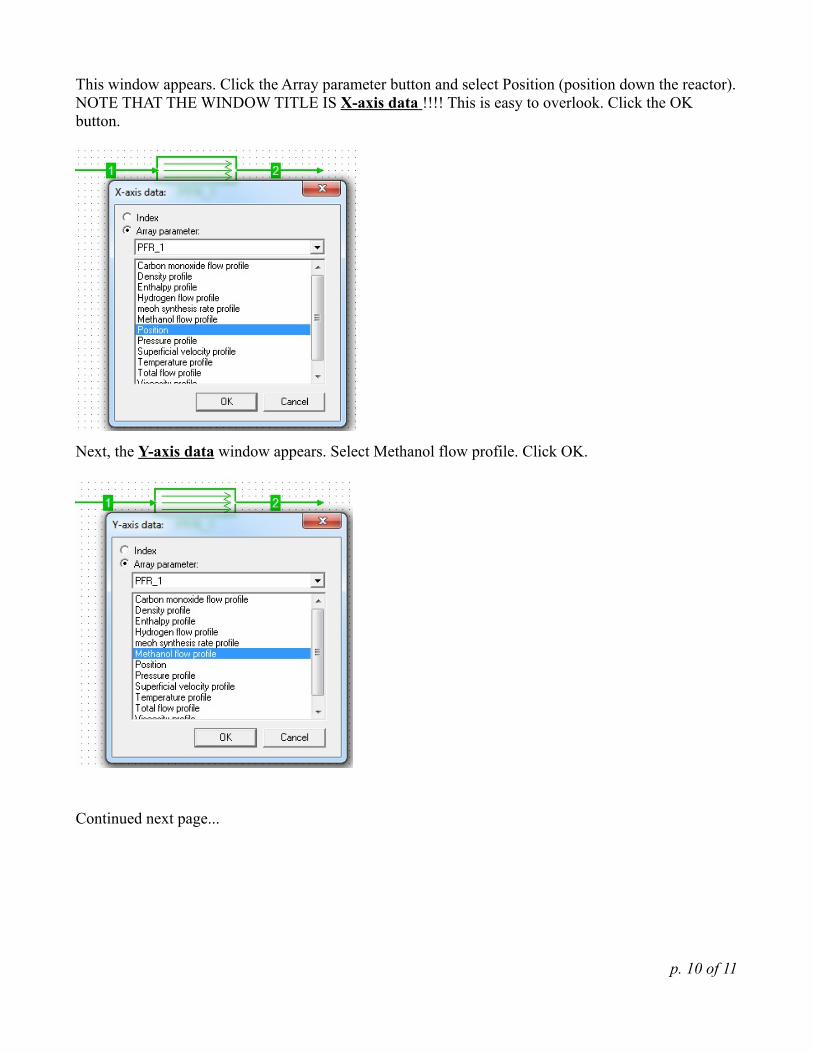
This window appears. Click the Array parameter button and select Position (position down the reactor). NOTE THAT THE WINDOW TITLE IS X-axis data !!!! This is easy to overlook. Click the OK button.
Next, the Y-axis data window appears. Select Methanol flow profile. Click OK.
Continued next page...
p. 10 of 11
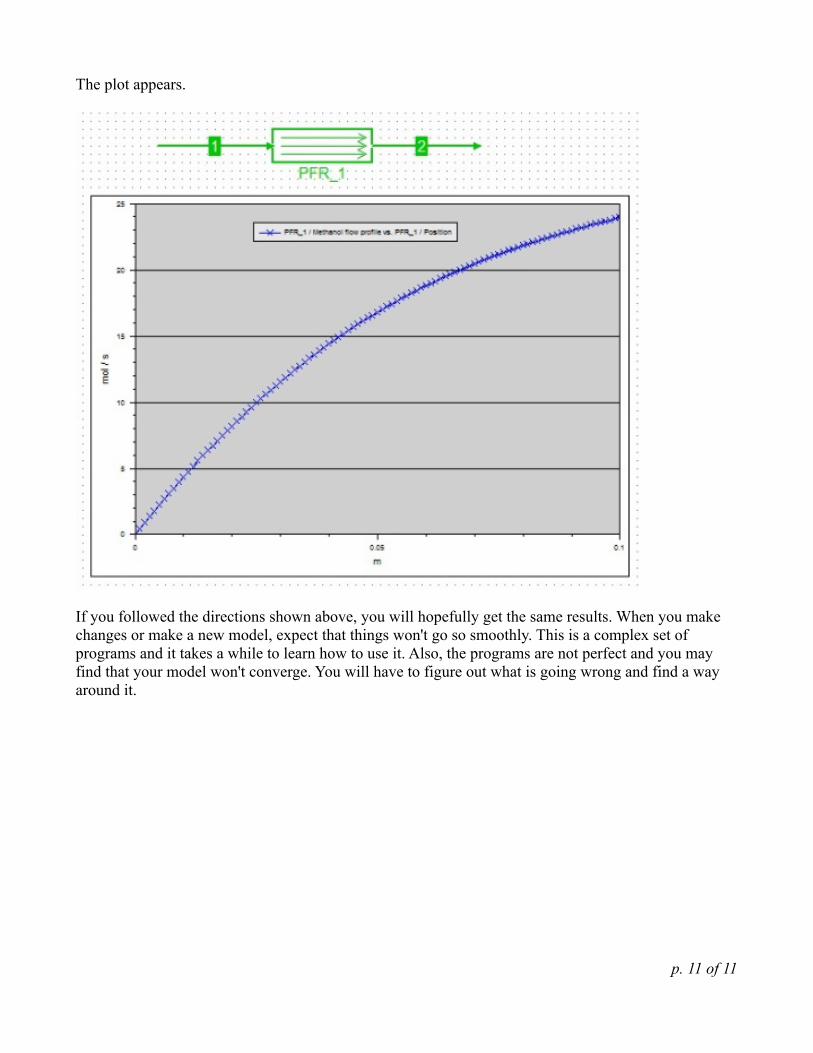
The plot appears.
If you followed the directions shown above, you will hopefully get the same results. When you make changes or make a new model, expect that things won't go so smoothly. This is a complex set of programs and it takes a while to learn how to use it. Also, the programs are not perfect and you may find that your model won't converge. You will have to figure out what is going wrong and find a way around it.
p. 11 of 11