Embed Size (px)
Citation preview
September 2011
Plastic Debris in the California Marine Ecosystem
A Summary of Current Research, Solution Efforts and Data Gaps
This report was commissioned by the California Ocean Protection Council and managed by California Ocean Science Trust.
Partial support for this publication was provided by the National Sea Grant College Program, National Oceanic and Atmospheric Administration, U.S. Department of Commerce, under grant number NA10OAR4170058, and by the California Natural Resources Agency. The views expressed herein do not necessarily reflect the views of NOAA or any of its sub-agencies. The U.S. Government is authorized to reproduce and distribute copies for governmental purposes.
Text and design produced under contract by:Charlotte Stevenson, M.S.Science Communications SpecialistUniversity of Southern California Sea GrantUniversity Park, Los Angeles, CA 90089-0373
Recommended citation of this report:
Plastic Debris in the California Marine Ecosystem: A Summary of Current Research, Solution Strategies and Data Gaps. 2011. C. Stevenson, University of Southern California Sea Grant. Synthetic Report. California Ocean Science Trust, Oakland, CA.
Photo credits:
Front and back cover image depicting marine debris on a Los Angeles beach courtesy of Heal the Bay.
All images used within the report were within the public domain or were permissioned for use in this report. None of the information within this report was reviewed by any of the individuals or groups providing images; therefore, the information in this report is not necessarily representative of the views of these individuals, organizations, or groups.
The author and OST thank Dr. Stephen Weisberg, Executive Director of the Southern California Coastal Water Research Project and member of the OPC Science Advisory Team (OPC-SAT), a multidisciplinary team of scientists, for providing a preliminary review of the first draft.
Additionally, this report was peer-reviewed per OST’s standard process. For this report, OST identified five reviewers representing expertise in the fields of marine ecology, environmental engineering, water quality, and marine debris policy. The author provided responses to all comments, and produced a revised report draft based on the comments. Finally, an expert mediator conducted a final assessment of the content of the report as well as the responses to peer review comments. The author would like to thank the five reviewers and expert mediator for their detailed comments and thorough assessment.
Acknowledgements
California Ocean Science Trust (OST) is a nonprofit 501(c)(3) public benefit corporation established to encourage coordinated, multi-agency, multi-institution approaches to translating and applying ocean science to management and policy. The mission of OST is to ensure that the best available science is applied to California policies and ocean management to successfully maintain a healthy, resilient, and productive ocean and coast. To achieve its mission, OST has two overarching organizational goals:
• Goal 1: Facilitate collaboration. Facilitate two-way connections between the world of science and that of policy and management by establishing and supporting multi-partner information systems and exchanges that yield tangible improvements in coastal and ocean management. OST serves as a bridge among science, management, and policy organizations, through activities such as its support of the California Ocean Protection Council (OPC) and coordination of science and research among the OPC, state agencies, federal agencies, academic institutions, and non-governmental organizations (NGOs).
• Goal 2: Institutionalize integration. Institutionalize the integration of best science, where necessary, into California coastal ocean policy and decision-making by building new organizations, programs, and processes and catalyzing applied research. This reflects the great need to develop, disseminate, and apply science that is designed to inform and improve policy and management. For more information about OST, please visit www.calost.org
The University of Southern California, one of the largest private universities in the United States, has participated in the National Sea Grant College Program for over 30 years and has more than a 100-year history of marine science research in Southern California. USC’s facilities, research, and curricula make it the principal university in the Los Angeles region for ocean studies, and it has demonstrated excellence in marine research and education from the beginning of the 20th Century.
The University of Southern California’s location in the middle of Los Angeles has made the Sea Grant Program at USC an important regional resource, concentrating on issues arising out of the necessity of managing people and resources in an intensely developed coastline. For this reason, in the 1980s the USC Sea Grant program adopted as its programmatic theme the “Urban Ocean.” The problems found in the “Urban Ocean” environment of Southern California are not unique to the region. In addressing the range of issues found here, USC Sea Grant will continue to provide information and models serving Los Angeles as well as other urban coastal regions in the U.S. and around the world.
USC Sea Grant funds research on the critical issues associated with the influence of massive cities on the sea, promotes connections between scientists and the policy-makers who must craft solutions, and broadly distributes information to the electorate through public education outreach efforts. USC Sea Grant’s primary responsibility is to contribute to solving the problems of the Urban Ocean, while recognizing the opportunities for coastal commerce, recreation and improving the quality of life in coastal regions such as Southern California. For more information on USC Sea Grant, please visit www.usc.edu/org/seagrant/
The California Ocean Protection Council (OPC) is a cabinet-level body created in 2004 under the California Ocean Protection Act (COPA). The mission of the OPC is to ensure that California maintains healthy, resilient, and productive ocean and coastal ecosystems for the benefit of current and future generations. The OPC’s overarching role is to coordinate and lead ocean management and protection in California in three primary ways: 1) by addressing cross-cutting ocean issues that do not fall neatly under
the purview of one agency; 2) by developing forward-looking policy recommendations to advance new or refine existing laws and regulations; and 3) by coordinating across state institutions whose decisions affect coastal waters and the ocean environment.
Table of Contents
Scope and Purpose...............................................................................................................................vMethods..............................................................................................................................................viExecutive Summary.............................................................................................................................viiGlossary...............................................................................................................................................ix
I. Characterization: What is Marine Debris?.........................................................................................1
II. Distribution and Abundance: Where is Marine Debris Found?........................................................4 A. Regional Patterns: North Pacific Ocean B. Local Patterns: California 1. On the seafloor 2. Floating debris 3. On the shore
III. Sources and Transport: How is Marine Debris Getting into the Ocean?........................................12 A. Debris from Ships B. Debris from Land-Based Sources C. National Municipal Waste Stream D. Municipal Waste in California E. Industrial Management and Transportation of Plastic in California F. Individual Waste, Littering, and Dumping IV. Impacts: Why is Marine Debris a Problem?...................................................................................19 A. Ingestion and Entanglement B. Accumulation, Transport, Toxicology, Bioavailability and the Food Chain 1. Plastics Accumulate and Transport Pollutants 2. Plastics Leach Pollutants 3. Toxicology 4. Bioavailability and Transport up the Food Chain C. Transport of Alien Species D. Impacted Habitats and Benthic Life E. Economic Impacts
V. Solutions: Types, Successes and Challenges....................................................................................34 A. Cleanup and Recovery 1. Organized Cleanup Efforts 2. Energy Recovery B. Reduction and Prevention 1. Structural controls 2. Recycling 3. Smart Design and Extended Producer Responsibility 4. Initiatives and Legislation a. National Initiatives b. Regional Initiatives c. State Legislation d. Local Initiatives 5. Education C. Alternatives: Biodegradable and Compostable Plastic
VI. Data Gaps....................................................................................................................................49
Conclusion.........................................................................................................................................53Endnotes.............................................................................................................................................54Alphabetical References.....................................................................................................................62
v
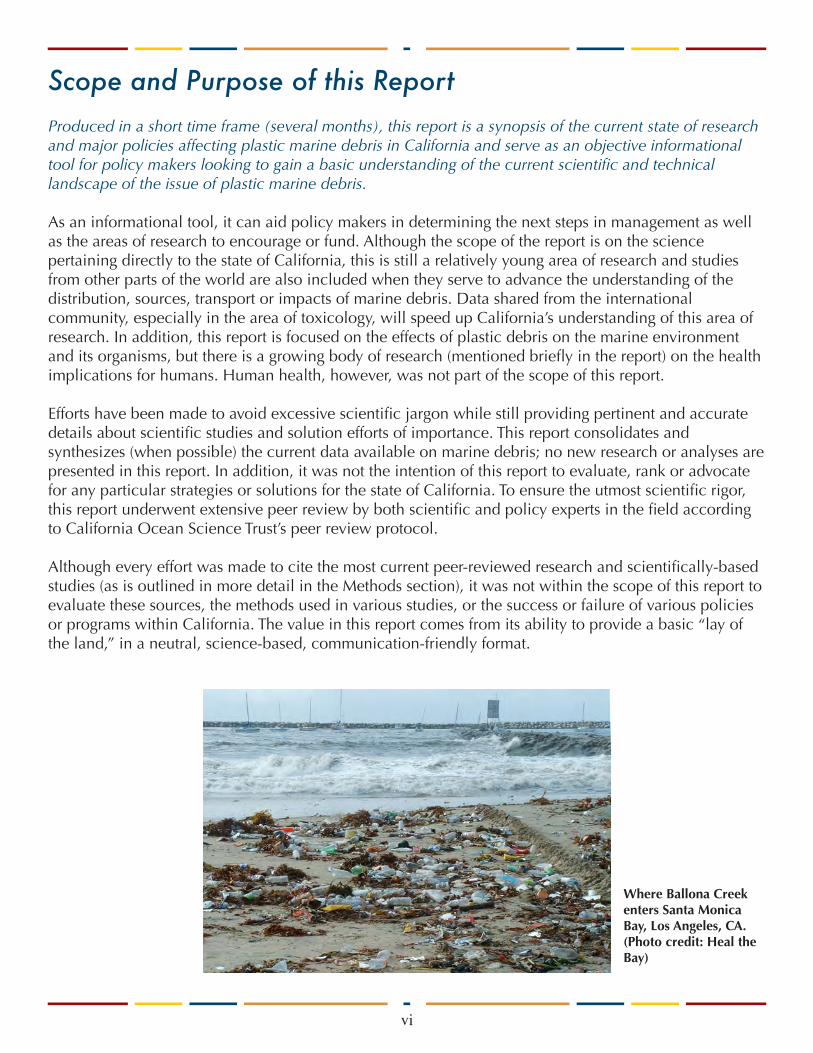
Produced in a short time frame (several months), this report is a synopsis of the current state of research and major policies affecting plastic marine debris in California and serve as an objective informational tool for policy makers looking to gain a basic understanding of the current scientific and technical landscape of the issue of plastic marine debris.
As an informational tool, it can aid policy makers in determining the next steps in management as well as the areas of research to encourage or fund. Although the scope of the report is on the science pertaining directly to the state of California, this is still a relatively young area of research and studies from other parts of the world are also included when they serve to advance the understanding of the distribution, sources, transport or impacts of marine debris. Data shared from the international community, especially in the area of toxicology, will speed up California’s understanding of this area of research. In addition, this report is focused on the effects of plastic debris on the marine environment and its organisms, but there is a growing body of research (mentioned briefly in the report) on the health implications for humans. Human health, however, was not part of the scope of this report.
Efforts have been made to avoid excessive scientific jargon while still providing pertinent and accurate details about scientific studies and solution efforts of importance. This report consolidates and synthesizes (when possible) the current data available on marine debris; no new research or analyses are presented in this report. In addition, it was not the intention of this report to evaluate, rank or advocate for any particular strategies or solutions for the state of California. To ensure the utmost scientific rigor, this report underwent extensive peer review by both scientific and policy experts in the field according to California Ocean Science Trust’s peer review protocol.
Although every effort was made to cite the most current peer-reviewed research and scientifically-based studies (as is outlined in more detail in the Methods section), it was not within the scope of this report to evaluate these sources, the methods used in various studies, or the success or failure of various policies or programs within California. The value in this report comes from its ability to provide a basic “lay of the land,” in a neutral, science-based, communication-friendly format.
Scope and Purpose of this Report
vi
Where Ballona Creek enters Santa Monica Bay, Los Angeles, CA. (Photo credit: Heal the Bay)
Search engines (primarily Web of Science, Google Scholar and University of Southern California journal databases) were used to generate a list of peer-reviewed literature that addressed the topics within the scope of this report. All major peer-reviewed literature to date that discuss issues within the scope of this report was included in this study. In addition, federal and state agencies and departments like the Na-tional Oceanic and Atmospheric Administration, the U.S. Environmental Protection Agency, California Integrated Waste Management Board, California Department of Transportation, and CalRecycle were used as sources of information for formal reports as well as for current data and information.
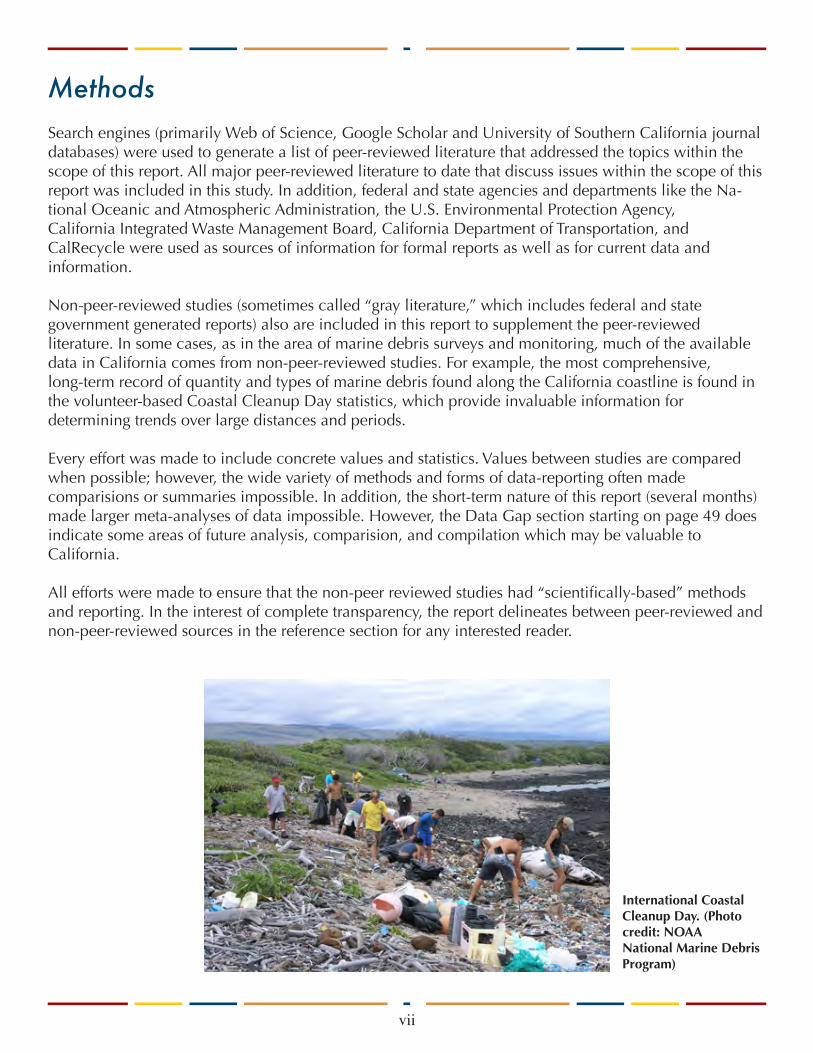
Non-peer-reviewed studies (sometimes called “gray literature,” which includes federal and state government generated reports) also are included in this report to supplement the peer-reviewed literature. In some cases, as in the area of marine debris surveys and monitoring, much of the available data in California comes from non-peer-reviewed studies. For example, the most comprehensive, long-term record of quantity and types of marine debris found along the California coastline is found in the volunteer-based Coastal Cleanup Day statistics, which provide invaluable information for determining trends over large distances and periods.
Every effort was made to include concrete values and statistics. Values between studies are compared when possible; however, the wide variety of methods and forms of data-reporting often made comparisions or summaries impossible. In addition, the short-term nature of this report (several months) made larger meta-analyses of data impossible. However, the Data Gap section starting on page 49 does indicate some areas of future analysis, comparision, and compilation which may be valuable to California.
All efforts were made to ensure that the non-peer reviewed studies had “scientifically-based” methods and reporting. In the interest of complete transparency, the report delineates between peer-reviewed and non-peer-reviewed sources in the reference section for any interested reader.
Methods
vii
International Coastal Cleanup Day. (Photo credit: NOAA National Marine Debris Program)
As the state with the largest population in the U.S. and 75% of that population living along its 1,100-mile coastline, it is no wonder that California has long been at the center of the discussion about the sources of, the impacts from, and the solutions to marine debris. The National Oceanic and Atmospheric Administration (NOAA) Marine Debris Program defines marine debris as “any persistent solid material that is manufactured or processed and directly or indirectly, intentionally or unintentionally, disposed of or abandoned into the marine environment or the Great Lakes.” Because of its extreme persistence and ubiquity, plastic marine debris has become the focus of most of the current scientific research and clean-up efforts. Studies now indicate that 60-80% of marine debris comes from land-based sources, and up to 80% of this debris is plastic.
Much of this plastic marine debris is in the form of micro-plastics created from the environmental break-down of larger pieces of plastic or originally created as precursor resin pellets for the industrial production of plastic products. Scientific estimates for the degradation of plastics in the ocean are on the order of hundreds to thousands of years. In fact, aside from plastic which has been incinerated, some scientists believe it is plausible that all the plastic ever created since its invention in the late 1940s still exists on the planet, either buried in landfills, buried on shorelines, floating in the ocean, or on the sea-floor.
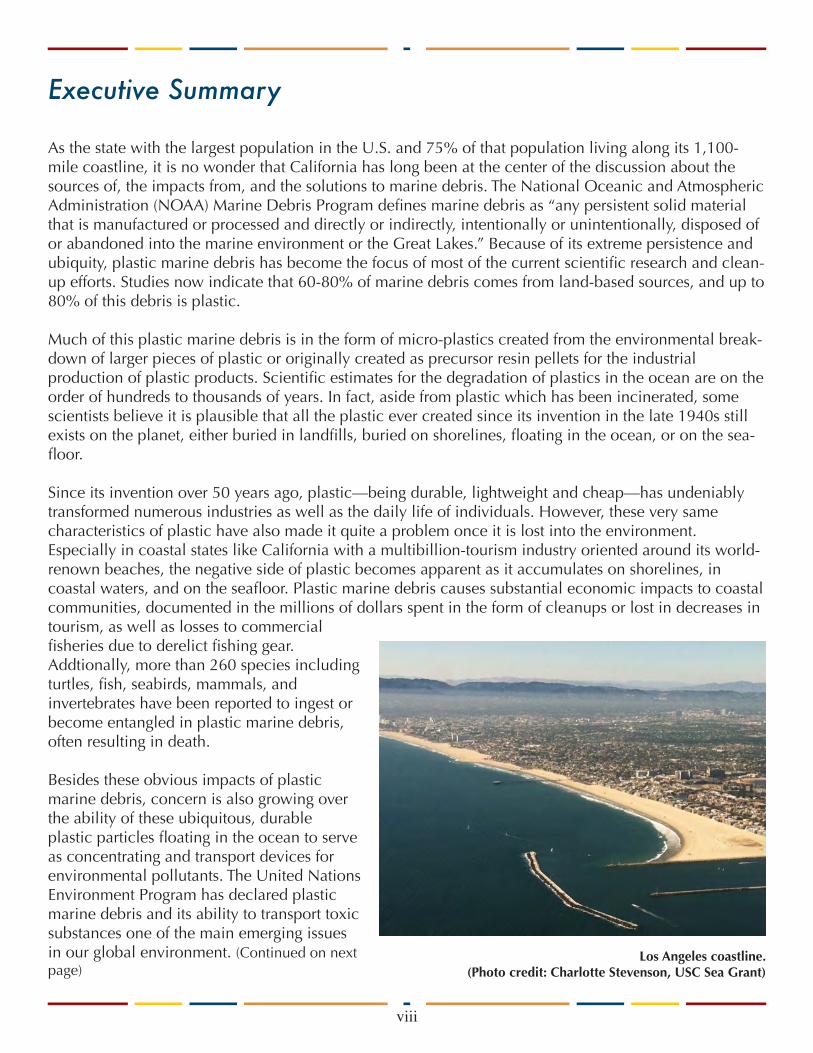
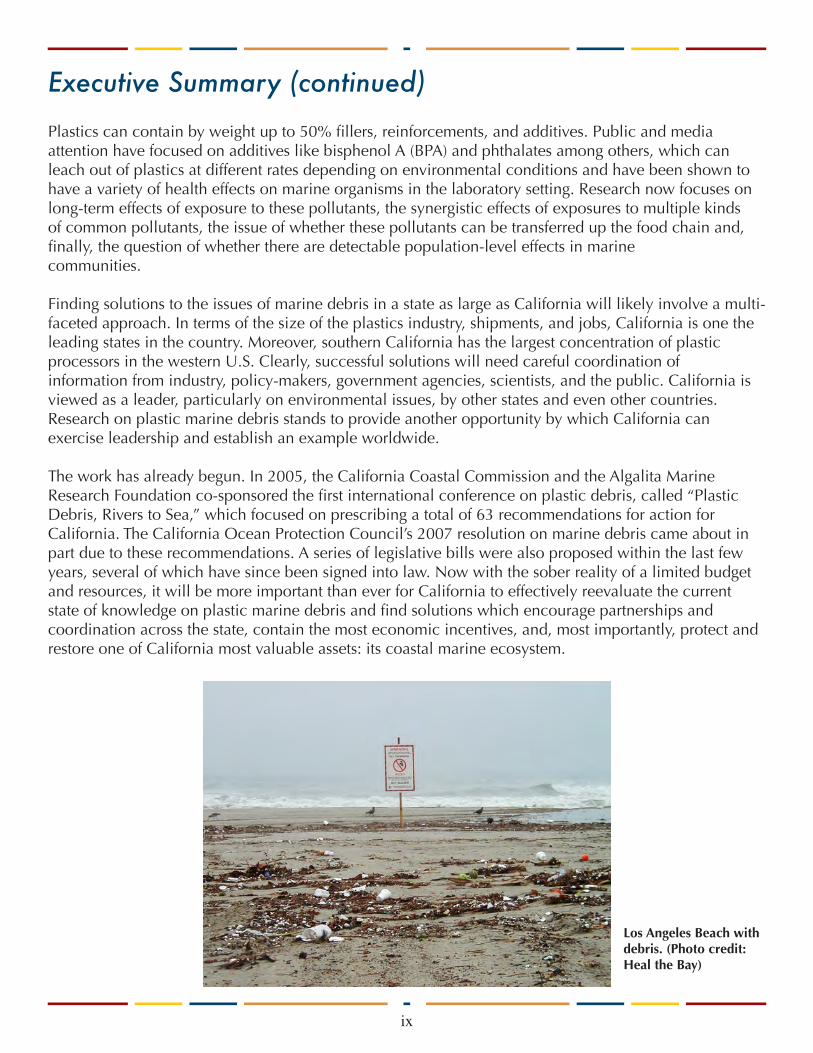
Since its invention over 50 years ago, plastic—being durable, lightweight and cheap—has undeniably transformed numerous industries as well as the daily life of individuals. However, these very same characteristics of plastic have also made it quite a problem once it is lost into the environment. Especially in coastal states like California with a multibillion-tourism industry oriented around its world-renown beaches, the negative side of plastic becomes apparent as it accumulates on shorelines, in coastal waters, and on the seafloor. Plastic marine debris causes substantial economic impacts to coastal communities, documented in the millions of dollars spent in the form of cleanups or lost in decreases in tourism, as well as losses to commercial fisheries due to derelict fishing gear. Addtionally, more than 260 species including turtles, fish, seabirds, mammals, and invertebrates have been reported to ingest or become entangled in plastic marine debris, often resulting in death.
Besides these obvious impacts of plastic marine debris, concern is also growing over the ability of these ubiquitous, durable plastic particles floating in the ocean to serve as concentrating and transport devices for environmental pollutants. The United Nations Environment Program has declared plastic marine debris and its ability to transport toxic substances one of the main emerging issues in our global environment. (Continued on next page)
Executive Summary
viii
Los Angeles coastline. (Photo credit: Charlotte Stevenson, USC Sea Grant)
Plastics can contain by weight up to 50% fillers, reinforcements, and additives. Public and media attention have focused on additives like bisphenol A (BPA) and phthalates among others, which can leach out of plastics at different rates depending on environmental conditions and have been shown to have a variety of health effects on marine organisms in the laboratory setting. Research now focuses on long-term effects of exposure to these pollutants, the synergistic effects of exposures to multiple kinds of common pollutants, the issue of whether these pollutants can be transferred up the food chain and, finally, the question of whether there are detectable population-level effects in marine communities.
Finding solutions to the issues of marine debris in a state as large as California will likely involve a multi-faceted approach. In terms of the size of the plastics industry, shipments, and jobs, California is one the leading states in the country. Moreover, southern California has the largest concentration of plastic processors in the western U.S. Clearly, successful solutions will need careful coordination of information from industry, policy-makers, government agencies, scientists, and the public. California is viewed as a leader, particularly on environmental issues, by other states and even other countries. Research on plastic marine debris stands to provide another opportunity by which California can exercise leadership and establish an example worldwide.
The work has already begun. In 2005, the California Coastal Commission and the Algalita Marine Research Foundation co-sponsored the first international conference on plastic debris, called “Plastic Debris, Rivers to Sea,” which focused on prescribing a total of 63 recommendations for action for California. The California Ocean Protection Council’s 2007 resolution on marine debris came about in part due to these recommendations. A series of legislative bills were also proposed within the last few years, several of which have since been signed into law. Now with the sober reality of a limited budget and resources, it will be more important than ever for California to effectively reevaluate the current state of knowledge on plastic marine debris and find solutions which encourage partnerships and coordination across the state, contain the most economic incentives, and, most importantly, protect and restore one of California most valuable assets: its coastal marine ecosystem.
Executive Summary (continued)
ix
Los Angeles Beach with debris. (Photo credit: Heal the Bay)

All acronyms included in the report are available for reference in this glossary. However, in order to aid readers less familiar with these acronyms, each acronym is spelled-out upon its first use in each subsequent chapter as a reminder.
Additives—Compounds added to plastic at the time of production; include UV stabilizers, heat stabilizers, softeners, flame-retardants, non-stick compounds, and colorants; some well-known and often-discussed additives are bisphenol A and phthalates
Adsorption—the adhesion of atoms, ions or molecules to a surface; the opposite is desorption; commonly con-fused with absorbtion in which a substance permeates another substance
AMRF—Algalita Marine Research Foundation
Anthropogenic—Effects, processes or materials derived from humans; not natural
ASTM—American Society for Testing and Materials
Benthic—On the ocean bottom
BPA—Bisphenol A, a plastic additive
CCD—Coastal Cleanup Day
CIWMB—California Integrated Waste Management Board which was eliminated on January 1, 2010 and replaced by the California Department of Resources, Recycling and Recovery, better known as CayRecycle
DDT— Dichlorodiphenyl trichloroethane is a well known pollutant; use of DDT was outlawed in the U.S. in 1972; DDE and DDD are breakdown products of DDT but still have toxicological effects
EPA—Environmental Protection Agency
IMO—International Maritime Organization, a body of the United Nations
LARWQCB—Los Angeles Regional Water Quality Control Board
Marine Debris—Any persistent solid material that is manufactured or processed and directly or indirectly, intentionally or unintentionally, disposed of or abandoned into the marine environment or the Great Lakes (NOAA definition)
MARPOL 73/78—International Convention for the Prevention of Pollution from Ships, as modified by the Protocol of 1978, implemented by the IMO under the United Nations
Mesopelagic—A zone in the ocean between 200 meters and 1000 meters depth
MSW—Municipal solid waste
NOAA—National Oceanic and Atmospheric Administration
North Pacific Subtropical Gyre—A semi-permanent, subtropical area of high pressure, relevant to this report be-cause marine debris tends to accumulate in this area
Glossary
x
Nurdles—Thermoplastic pre-production resin pellets; the pre-cursor raw material to plastic products, usually <5 mm
PAHs—Polycyclic aromatic hydrocarbons
PCBs—Polychlorinated biphenyls; a large class of compounds, many of which with known toxicological effects
Phthalates—Plastic additives with toxicological effects
Polymer—High molecular weight molecules, like plastic, consisting of up to millions of repeated linked units called monomers
POPs—Persistent Organic Pollutants
SCCWRP—Southern California Coastal Water Research Project
SFRWQCB—San Francisco Regional Water Quality Control Board
Southern California Bight—the 700 km (400 miles) of recessed coastline from Point Conception, in Santa Barbara County, California to Cabo Colnett, just south of Ensenada, Mexico
SWRCB—State Water Resources Control Board in California
TMDL—Total Maximum Daily Load; a regulatory term under the U.S. Clean Water Act indicating the maximum amount of a pollutant that a water body can have while still meeting water quality standards
UNEP—United Nations Environment Program
WCGA—West Coast Governors Agreement on Ocean Health, a collaboration established in 2006 among the governors of Washington, Oregon, and California to better manage ocean and coastal resources
Zooplankton—Tiny floating marine organisms near the bottom of the marine food chain
Glossary (continued)
xi
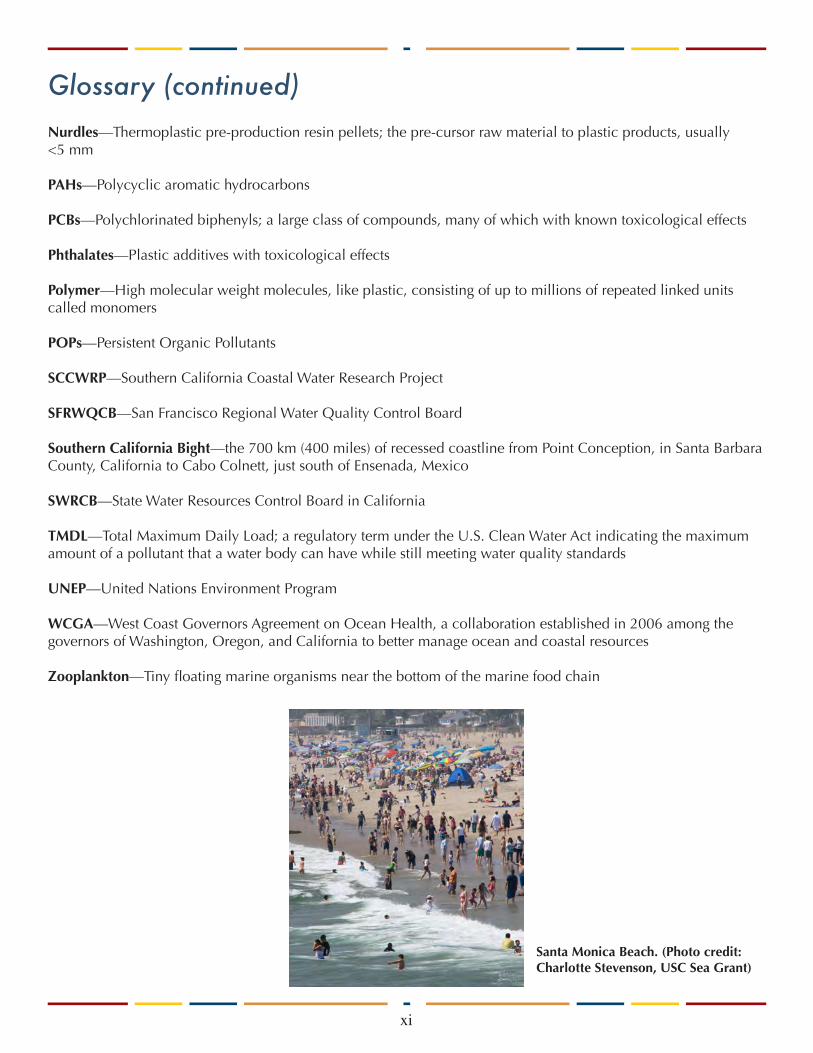
Santa Monica Beach. (Photo credit: Charlotte Stevenson, USC Sea Grant)
The National Oceanic and Atmospheric Administration (NOAA) Marine Debris Program defines marine debris as “any persistent solid material that is manufactured or processed and directly or indirectly, intentionally or unintentionally, disposed of or abandoned into the marine environment or the Great Lakes.” In general, four main size categories are used to classify marine debris: mega-debris (>100 mm diameter); macro-debris (20-100 mm diameter); meso-debris (5-20 mm diameter); and micro-debris (0.3-5 mm diameter). For reference, micro-debris ranges in size from the width of two human hairs side by side (0.3 mm) to the width of a grain of rice (5 mm).[1]
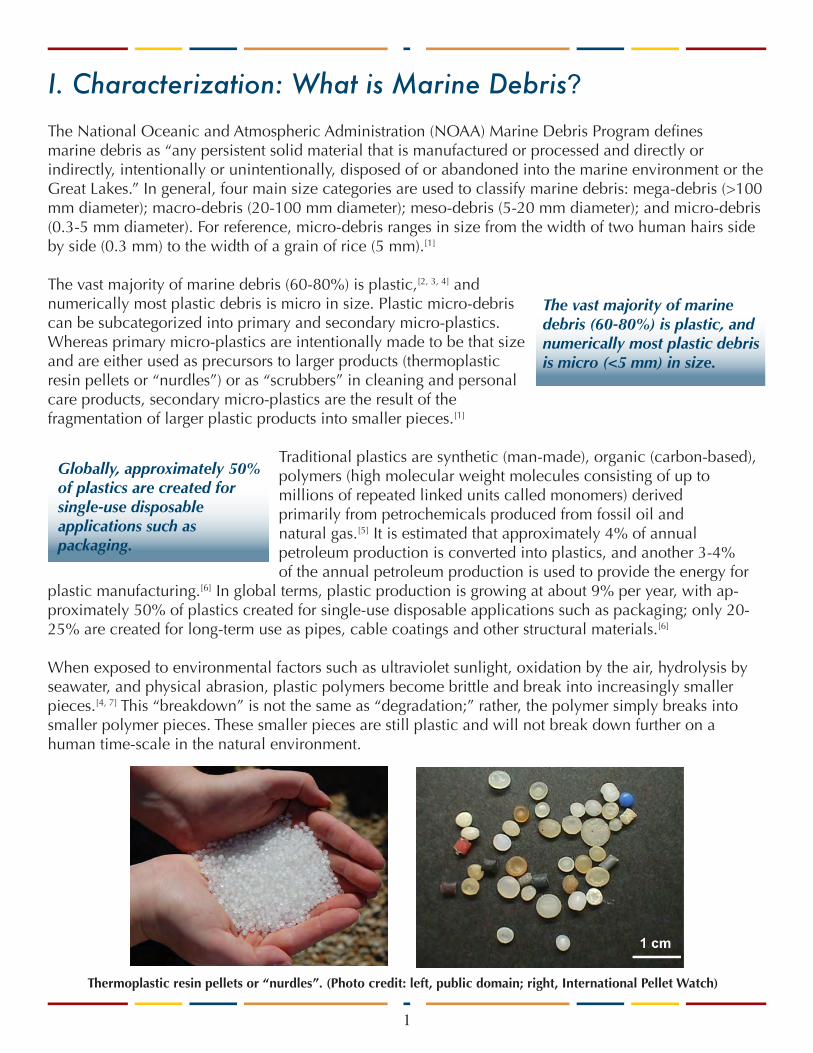
The vast majority of marine debris (60-80%) is plastic,[2, 3, 4] and numerically most plastic debris is micro in size. Plastic micro-debris can be subcategorized into primary and secondary micro-plastics. Whereas primary micro-plastics are intentionally made to be that size and are either used as precursors to larger products (thermoplastic resin pellets or “nurdles”) or as “scrubbers” in cleaning and personal care products, secondary micro-plastics are the result of the fragmentation of larger plastic products into smaller pieces.[1]
Traditional plastics are synthetic (man-made), organic (carbon-based), polymers (high molecular weight molecules consisting of up to millions of repeated linked units called monomers) derived primarily from petrochemicals produced from fossil oil and natural gas.[5] It is estimated that approximately 4% of annual petroleum production is converted into plastics, and another 3-4% of the annual petroleum production is used to provide the energy for
plastic manufacturing.[6] In global terms, plastic production is growing at about 9% per year, with ap-proximately 50% of plastics created for single-use disposable applications such as packaging; only 20-25% are created for long-term use as pipes, cable coatings and other structural materials.[6]
When exposed to environmental factors such as ultraviolet sunlight, oxidation by the air, hydrolysis by seawater, and physical abrasion, plastic polymers become brittle and break into increasingly smaller pieces.[4, 7] This “breakdown” is not the same as “degradation;” rather, the polymer simply breaks into smaller polymer pieces. These smaller pieces are still plastic and will not break down further on a human time-scale in the natural environment.
I. Characterization: What is Marine Debris?
The vast majority of marine debris (60-80%) is plastic, and numerically most plastic debris is micro (<5 mm) in size.
Globally, approximately 50% of plastics are created for single-use disposable applications such as packaging.
1
Thermoplastic resin pellets or “nurdles”. (Photo credit: left, public domain; right, International Pellet Watch)
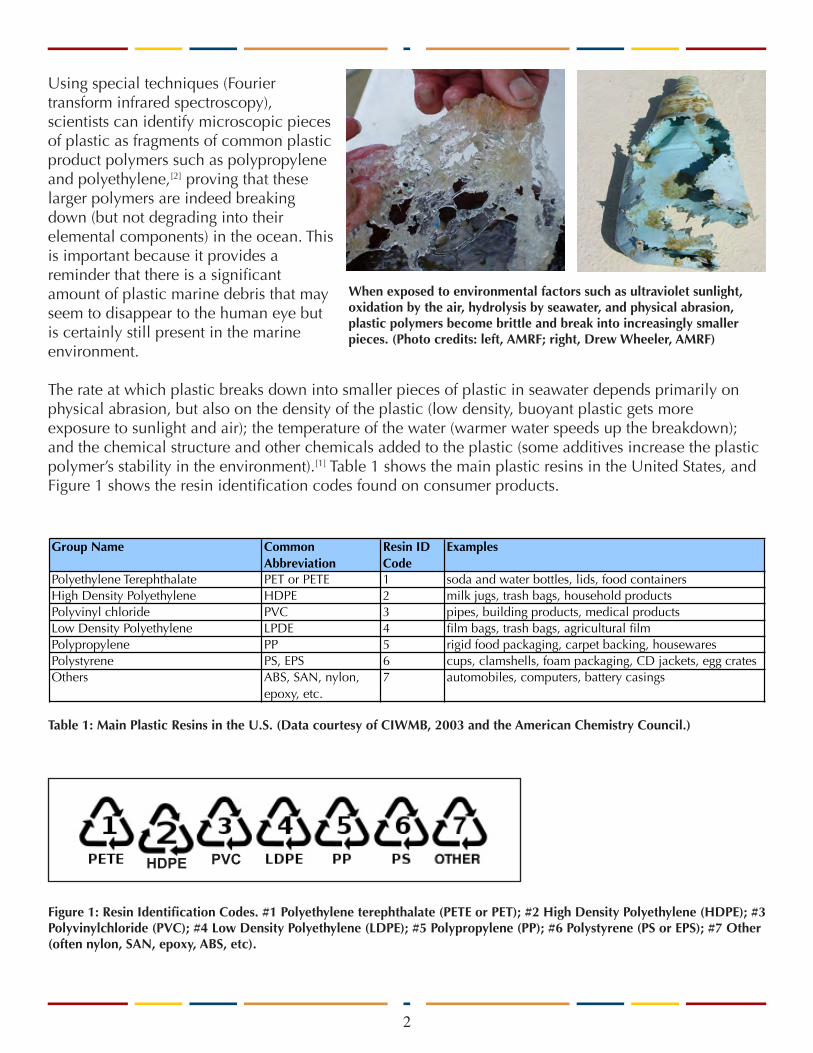
Using special techniques (Fourier transform infrared spectroscopy), scientists can identify microscopic pieces of plastic as fragments of common plastic product polymers such as polypropylene and polyethylene,[2] proving that these larger polymers are indeed breaking down (but not degrading into their elemental components) in the ocean. This is important because it provides a reminder that there is a significant amount of plastic marine debris that may seem to disappear to the human eye but is certainly still present in the marine environment.
The rate at which plastic breaks down into smaller pieces of plastic in seawater depends primarily on physical abrasion, but also on the density of the plastic (low density, buoyant plastic gets more exposure to sunlight and air); the temperature of the water (warmer water speeds up the breakdown); and the chemical structure and other chemicals added to the plastic (some additives increase the plastic polymer’s stability in the environment).[1] Table 1 shows the main plastic resins in the United States, and Figure 1 shows the resin identification codes found on consumer products.
Table 1: Main Plastic Resins in the U.S. (Data courtesy of CIWMB, 2003 and the American Chemistry Council.)
Figure 1: Resin Identification Codes. #1 Polyethylene terephthalate (PETE or PET); #2 High Density Polyethylene (HDPE); #3 Polyvinylchloride (PVC); #4 Low Density Polyethylene (LDPE); #5 Polypropylene (PP); #6 Polystyrene (PS or EPS); #7 Other (often nylon, SAN, epoxy, ABS, etc).
When exposed to environmental factors such as ultraviolet sunlight, oxidation by the air, hydrolysis by seawater, and physical abrasion, plastic polymers become brittle and break into increasingly smaller pieces. (Photo credits: left, AMRF; right, Drew Wheeler, AMRF)
2
HDPE PVC
Group Name Common Abbreviation
Resin ID Code
Examples
Polyethylene Terephthalate PET or PETE 1 soda and water bottles, lids, food containersHigh Density Polyethylene HDPE 2 milk jugs, trash bags, household productsPolyvinyl chloride PVC 3 pipes, building products, medical productsLow Density Polyethylene LPDE 4 film bags, trash bags, agricultural filmPolypropylene PP 5 rigid food packaging, carpet backing, housewaresPolystyrene PS, EPS 6 cups, clamshells, foam packaging, CD jackets, egg cratesOthers ABS, SAN, nylon,
epoxy, etc.7 automobiles, computers, battery casings
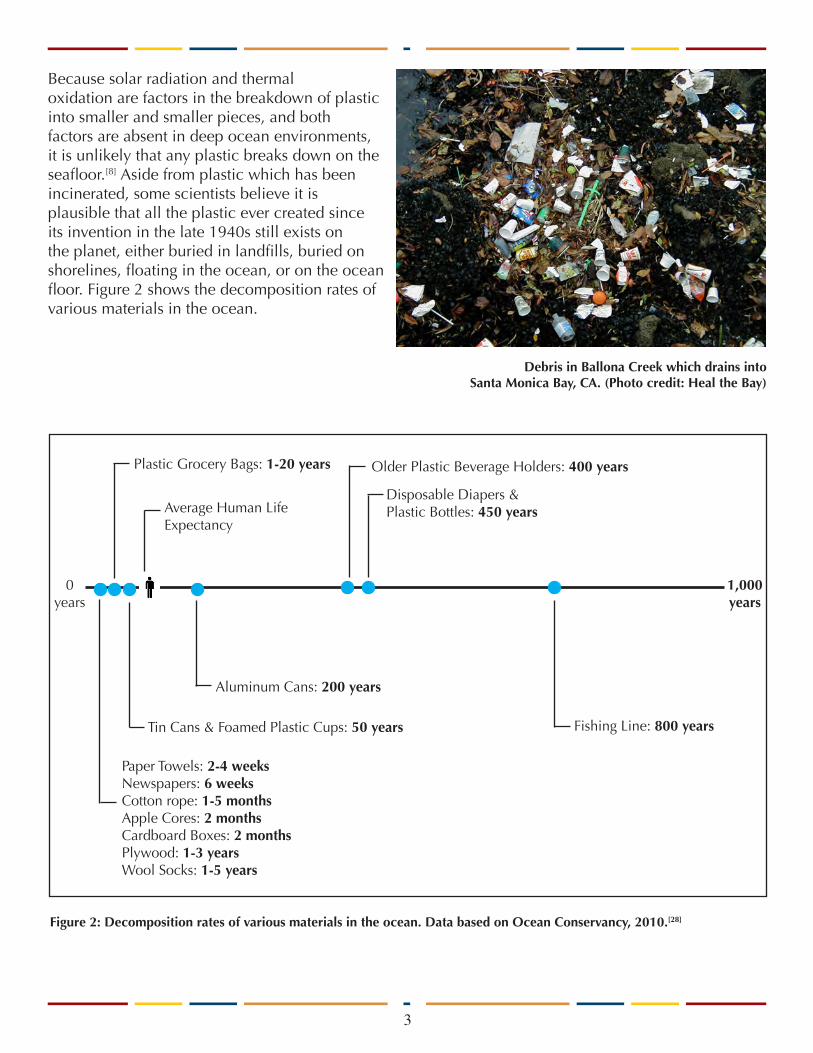
Because solar radiation and thermal oxidation are factors in the breakdown of plastic into smaller and smaller pieces, and both factors are absent in deep ocean environments, it is unlikely that any plastic breaks down on the seafloor.[8] Aside from plastic which has been incinerated, some scientists believe it is plausible that all the plastic ever created since its invention in the late 1940s still exists on the planet, either buried in landfills, buried on shorelines, floating in the ocean, or on the ocean floor. Figure 2 shows the decomposition rates of various materials in the ocean.
Figure 2: Decomposition rates of various materials in the ocean. Data based on Ocean Conservancy, 2010.[28]
3
Debris in Ballona Creek which drains into Santa Monica Bay, CA. (Photo credit: Heal the Bay)
0 years
1,000 years
Paper Towels: 2-4 weeksNewspapers: 6 weeksCotton rope: 1-5 monthsApple Cores: 2 monthsCardboard Boxes: 2 monthsPlywood: 1-3 yearsWool Socks: 1-5 years
Tin Cans & Foamed Plastic Cups: 50 years
Plastic Grocery Bags: 1-20 years
Aluminum Cans: 200 years
Older Plastic Beverage Holders: 400 years
Disposable Diapers & Plastic Bottles: 450 years
Fishing Line: 800 years
Average Human Life Expectancy

This section of the report focuses primarily on the distribution and abundance of plastic marine debris along the California coastline. In order to fully understand this distribution, however, it is important to be aware of some regional movement, migration, and accumulation patterns of plastic debris in the North Pacific Ocean.
A. Regional Patterns: North Pacific Ocean
Plastics accumulate adjacent to urban centers, on remote islands, in enclosed bays and seas, in high-pressure zones (such as the North Pacific Subtropical Gyre), and in convergence fronts (such as the North Pacific Subtropical Convergence Zone).[1, 9] As shown in Figure 3, the North Pacific Subtropical Gyre is made up of four large clockwise rotating currents in the North Pacific—the North Pacific Current, the California Current, the North Equatorial Current, and the Kuroshio Current. The North Pacific Subtropical Gyre—the 7-9 million square mile area at the center of these currents—is defined by NOAA’s Weather Service as “a semi-permanent, subtropical area of high pressure.”[1] This area of high pressure moves with the seasons, as some currents are stronger than others at different times of year.
II. Distribution and Abundance: Where is Marine Debris Found?
Figure 3: Diagram of North Pacific Subtropical Gyre (Image courtesy of the NOAA Marine Debris Program. NOAA disclaimer: “This map is an oversimplification of ocean currents and features in the Pacific Ocean. There are numerous factors that affect the location, size, and strength of all of these features throughout the year, including seasonality and El Niño/La Niña. Depicting that on a static map is very difficult.”)
4
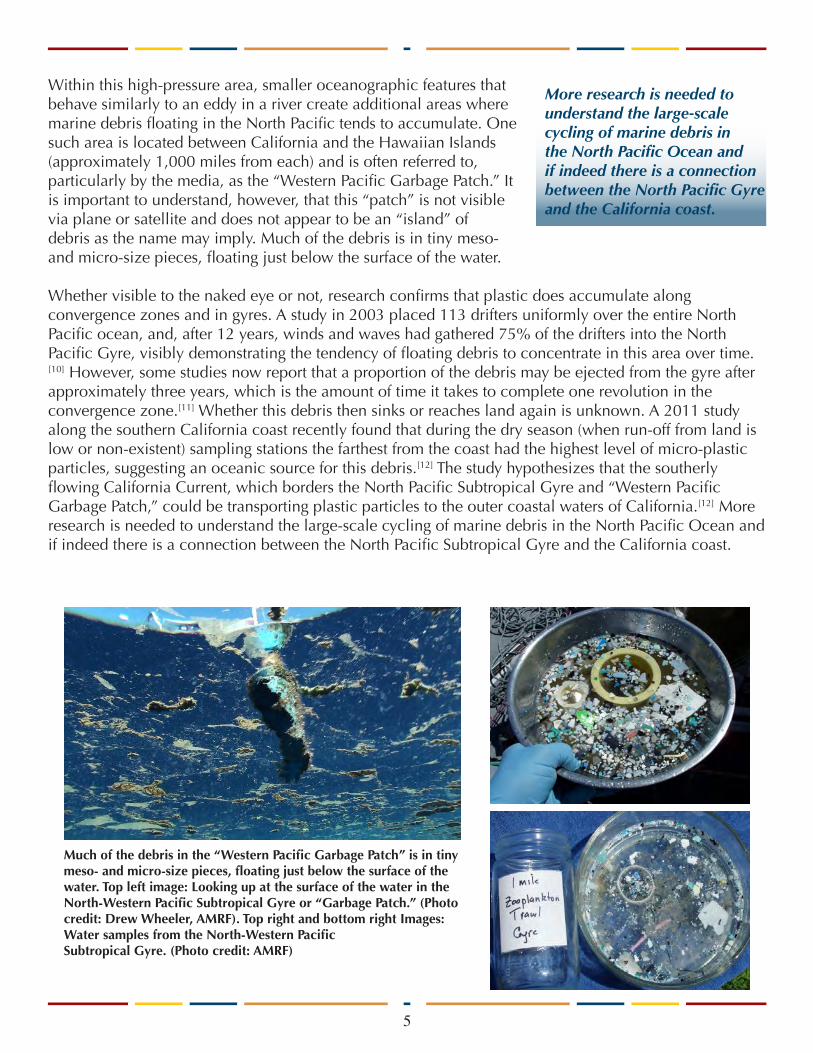
Within this high-pressure area, smaller oceanographic features that behave similarly to an eddy in a river create additional areas where marine debris floating in the North Pacific tends to accumulate. One such area is located between California and the Hawaiian Islands (approximately 1,000 miles from each) and is often referred to, particularly by the media, as the “Western Pacific Garbage Patch.” It is important to understand, however, that this “patch” is not visible via plane or satellite and does not appear to be an “island” of debris as the name may imply. Much of the debris is in tiny meso- and micro-size pieces, floating just below the surface of the water.
Whether visible to the naked eye or not, research confirms that plastic does accumulate along convergence zones and in gyres. A study in 2003 placed 113 drifters uniformly over the entire North Pacific ocean, and, after 12 years, winds and waves had gathered 75% of the drifters into the North Pacific Gyre, visibly demonstrating the tendency of floating debris to concentrate in this area over time.[10] However, some studies now report that a proportion of the debris may be ejected from the gyre after approximately three years, which is the amount of time it takes to complete one revolution in the convergence zone.[11] Whether this debris then sinks or reaches land again is unknown. A 2011 study along the southern California coast recently found that during the dry season (when run-off from land is low or non-existent) sampling stations the farthest from the coast had the highest level of micro-plastic particles, suggesting an oceanic source for this debris.[12] The study hypothesizes that the southerly flowing California Current, which borders the North Pacific Subtropical Gyre and “Western Pacific Garbage Patch,” could be transporting plastic particles to the outer coastal waters of California.[12] More research is needed to understand the large-scale cycling of marine debris in the North Pacific Ocean and if indeed there is a connection between the North Pacific Subtropical Gyre and the California coast.
Much of the debris in the “Western Pacific Garbage Patch” is in tiny meso- and micro-size pieces, floating just below the surface of the water. Top left image: Looking up at the surface of the water in the North-Western Pacific Subtropical Gyre or “Garbage Patch.” (Photo credit: Drew Wheeler, AMRF). Top right and bottom right Images: Water samples from the North-Western Pacific Subtropical Gyre. (Photo credit: AMRF)
5
More research is needed to understand the large-scale cycling of marine debris in the North Pacific Ocean and if indeed there is a connection between the North Pacific Gyre and the California coast.
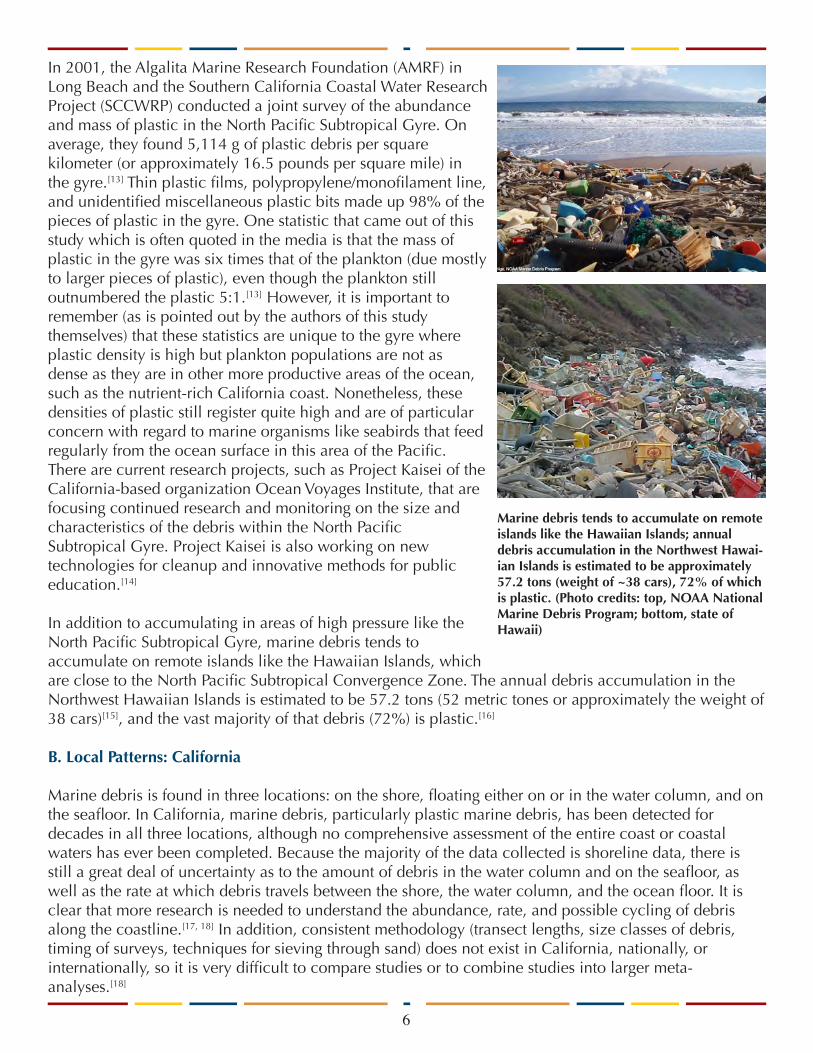
In 2001, the Algalita Marine Research Foundation (AMRF) in Long Beach and the Southern California Coastal Water Research Project (SCCWRP) conducted a joint survey of the abundance and mass of plastic in the North Pacific Subtropical Gyre. On average, they found 5,114 g of plastic debris per square kilometer (or approximately 16.5 pounds per square mile) in the gyre.[13] Thin plastic films, polypropylene/monofilament line, and unidentified miscellaneous plastic bits made up 98% of the pieces of plastic in the gyre. One statistic that came out of this study which is often quoted in the media is that the mass of plastic in the gyre was six times that of the plankton (due mostly to larger pieces of plastic), even though the plankton still outnumbered the plastic 5:1.[13] However, it is important to remember (as is pointed out by the authors of this study themselves) that these statistics are unique to the gyre where plastic density is high but plankton populations are not as dense as they are in other more productive areas of the ocean, such as the nutrient-rich California coast. Nonetheless, these densities of plastic still register quite high and are of particular concern with regard to marine organisms like seabirds that feed regularly from the ocean surface in this area of the Pacific. There are current research projects, such as Project Kaisei of the California-based organization Ocean Voyages Institute, that are focusing continued research and monitoring on the size and characteristics of the debris within the North Pacific Subtropical Gyre. Project Kaisei is also working on new technologies for cleanup and innovative methods for public education.[14]
In addition to accumulating in areas of high pressure like the North Pacific Subtropical Gyre, marine debris tends to accumulate on remote islands like the Hawaiian Islands, which are close to the North Pacific Subtropical Convergence Zone. The annual debris accumulation in the Northwest Hawaiian Islands is estimated to be 57.2 tons (52 metric tones or approximately the weight of 38 cars)[15], and the vast majority of that debris (72%) is plastic.[16]
B. Local Patterns: California
Marine debris is found in three locations: on the shore, floating either on or in the water column, and on the seafloor. In California, marine debris, particularly plastic marine debris, has been detected for decades in all three locations, although no comprehensive assessment of the entire coast or coastal waters has ever been completed. Because the majority of the data collected is shoreline data, there is still a great deal of uncertainty as to the amount of debris in the water column and on the seafloor, as well as the rate at which debris travels between the shore, the water column, and the ocean floor. It is clear that more research is needed to understand the abundance, rate, and possible cycling of debris along the coastline.[17, 18] In addition, consistent methodology (transect lengths, size classes of debris, timing of surveys, techniques for sieving through sand) does not exist in California, nationally, or internationally, so it is very difficult to compare studies or to combine studies into larger meta-analyses.[18]
Marine debris tends to accumulate on remote islands like the Hawaiian Islands; annual debris accumulation in the Northwest Hawai-ian Islands is estimated to be approximately 57.2 tons (weight of ~38 cars), 72% of which is plastic. (Photo credits: top, NOAA National Marine Debris Program; bottom, state of Hawaii)
6
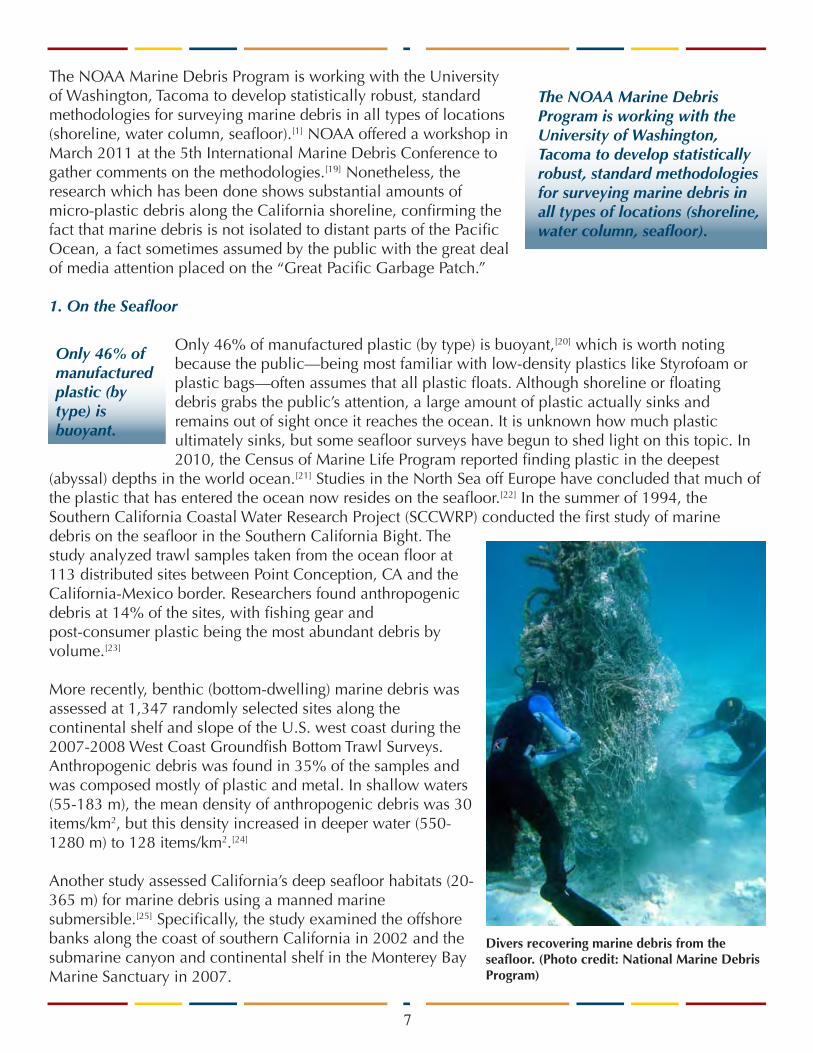
The NOAA Marine Debris Program is working with the University of Washington, Tacoma to develop statistically robust, standard methodologies for surveying marine debris in all types of locations (shoreline, water column, seafloor).[1] NOAA offered a workshop in March 2011 at the 5th International Marine Debris Conference to gather comments on the methodologies.[19] Nonetheless, the research which has been done shows substantial amounts of micro-plastic debris along the California shoreline, confirming the fact that marine debris is not isolated to distant parts of the Pacific Ocean, a fact sometimes assumed by the public with the great deal of media attention placed on the “Great Pacific Garbage Patch.”
1. On the Seafloor
Only 46% of manufactured plastic (by type) is buoyant,[20] which is worth noting because the public—being most familiar with low-density plastics like Styrofoam or plastic bags—often assumes that all plastic floats. Although shoreline or floating debris grabs the public’s attention, a large amount of plastic actually sinks and remains out of sight once it reaches the ocean. It is unknown how much plastic ultimately sinks, but some seafloor surveys have begun to shed light on this topic. In 2010, the Census of Marine Life Program reported finding plastic in the deepest
(abyssal) depths in the world ocean.[21] Studies in the North Sea off Europe have concluded that much of the plastic that has entered the ocean now resides on the seafloor.[22] In the summer of 1994, the Southern California Coastal Water Research Project (SCCWRP) conducted the first study of marine debris on the seafloor in the Southern California Bight. The study analyzed trawl samples taken from the ocean floor at 113 distributed sites between Point Conception, CA and the California-Mexico border. Researchers found anthropogenic debris at 14% of the sites, with fishing gear and post-consumer plastic being the most abundant debris by volume.[23]
More recently, benthic (bottom-dwelling) marine debris was assessed at 1,347 randomly selected sites along the continental shelf and slope of the U.S. west coast during the 2007-2008 West Coast Groundfish Bottom Trawl Surveys. Anthropogenic debris was found in 35% of the samples and was composed mostly of plastic and metal. In shallow waters (55-183 m), the mean density of anthropogenic debris was 30 items/km2, but this density increased in deeper water (550-1280 m) to 128 items/km2.[24]
Another study assessed California’s deep seafloor habitats (20-365 m) for marine debris using a manned marine submersible.[25] Specifically, the study examined the offshore banks along the coast of southern California in 2002 and the submarine canyon and continental shelf in the Monterey Bay Marine Sanctuary in 2007.
The NOAA Marine Debris Program is working with the University of Washington, Tacoma to develop statistically robust, standard methodologies for surveying marine debris in all types of locations (shoreline, water column, seafloor).
Divers recovering marine debris from the seafloor. (Photo credit: National Marine Debris Program)
Only 46% of manufactured plastic (by type) isbuoyant.
7
Plastic was the most common type of debris found in both central and southern California; however, while monofilament fishing line was the main component of the plastic debris in central California, there was a much greater diversity of types of plastic debris in southern California. Debris was found on 33% of the 321 transects conducted in southern California, with “hotspots” of accumulated debris at 43-Fathom Bank, east of San Nicolas Island, near Santa Barbara Island, and Kidney Bank. In central California, the study added a temporal dimension by comparing 112 transects in 2007 in the Monterey area to 161 transects done in the same areas in the 1990s. The average density of debris at these sites had increased over the last 15 years from 2 to 3.5 debris items per 100 meters of transect, although density had increased more substantially at some individual locations. In the 1990s and in 2007, Italian Ledge, southwest Soquel Canyon, and Monterey Canyon were identified as “hotspots” for accumulated debris, with up to 38 debris items per 100 meters.[25] Although some “hotspots” may have been identified in the isolated studies reported above, there is still very little known about the density of marine debris along California’s continental shelf, the rates of deposition from the sea surface, or the rates of loss off the continental shelf into deeper waters. More research is needed in all of these areas.
2. Floating Debris
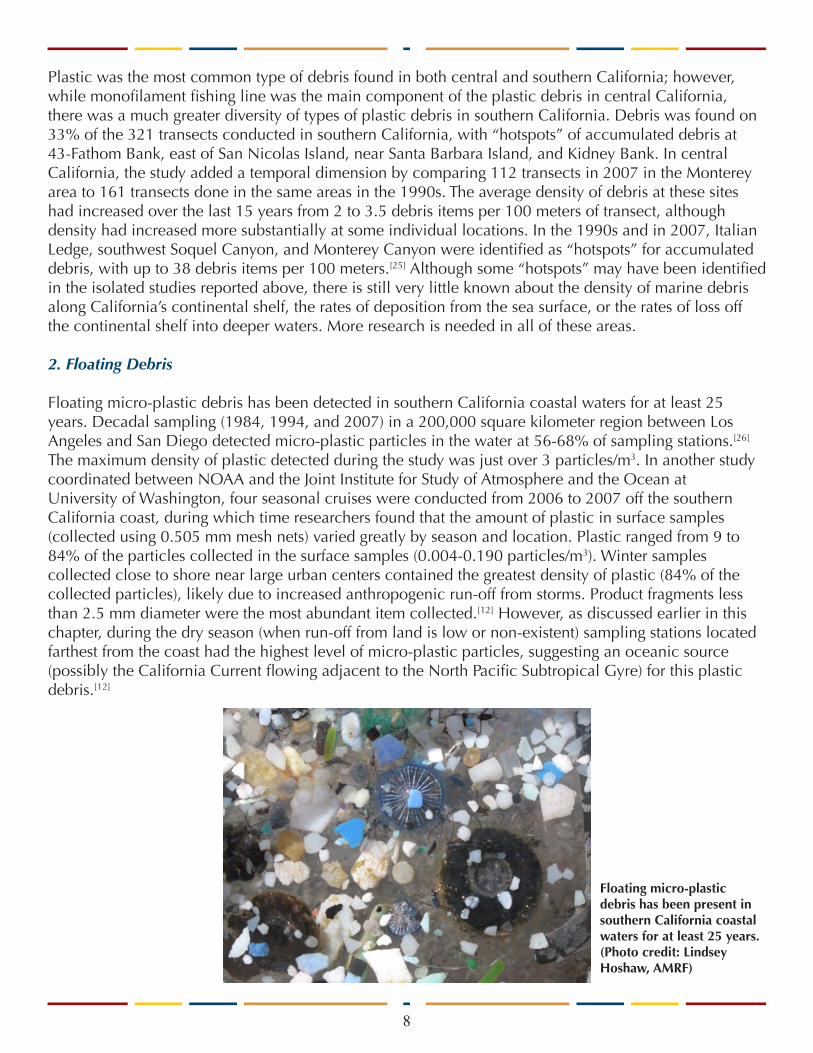
Floating micro-plastic debris has been detected in southern California coastal waters for at least 25 years. Decadal sampling (1984, 1994, and 2007) in a 200,000 square kilometer region between Los Angeles and San Diego detected micro-plastic particles in the water at 56-68% of sampling stations.[26] The maximum density of plastic detected during the study was just over 3 particles/m3. In another study coordinated between NOAA and the Joint Institute for Study of Atmosphere and the Ocean at University of Washington, four seasonal cruises were conducted from 2006 to 2007 off the southern California coast, during which time researchers found that the amount of plastic in surface samples (collected using 0.505 mm mesh nets) varied greatly by season and location. Plastic ranged from 9 to 84% of the particles collected in the surface samples (0.004-0.190 particles/m3). Winter samples collected close to shore near large urban centers contained the greatest density of plastic (84% of the collected particles), likely due to increased anthropogenic run-off from storms. Product fragments less than 2.5 mm diameter were the most abundant item collected.[12] However, as discussed earlier in this chapter, during the dry season (when run-off from land is low or non-existent) sampling stations located farthest from the coast had the highest level of micro-plastic particles, suggesting an oceanic source (possibly the California Current flowing adjacent to the North Pacific Subtropical Gyre) for this plastic debris.[12]
Floating micro-plastic debris has been present in southern California coastal waters for at least 25 years. (Photo credit: Lindsey Hoshaw, AMRF)
8

Between 2000 and 2001, SCCWRP and AMRF teamed up on several occasions to measure the density of plastic debris 5 mm or smaller in diameter in coastal southern California waters. This size is important for two reasons: it is the size which can be mistaken for food by filter-feeding marine organisms, and plastic less than 5 mm in diameter is not included in the regulatory trash limitations (Total Maximum Daily Loads or TMDLs) placed on nearby Los Angles River watersheds by the Los Angeles Regional Water Control Board (discussed more in Chapter V). After a storm in 2001, the density of floating plastic pieces offshore of the San Gabriel River in Long Beach increased on average from 3 pieces/m3 to 7.25 pieces/m3.[27] Several months later after another storm, the density of floating plastic pieces in Santa Monica Bay offshore of Ballona Creek increased on average from <1 piece/m3 to 18 pieces/m3.[17] In both cases, the density of debris after the storm was highest at sampling stations near the river mouths, likely reflecting the substantial contribution of land-based run-off to the increase in density of floating plastic debris along shore. The researchers also found that the density of plastic debris in seafloor samples declined after the storm, while midwater density increased, suggesting that the turbulence associated with the storm was adequate for resuspension of previous sunken plastic debris over the continental shelf.[17]
Notably, on the day after the storm, the density of the plastic in the water was found to be higher in southern California (7.25-18 pieces/m3) than even what has been recorded in the North Pacific Subtropical gyre (2.23 pieces/m3).[27] It should be noted, however, that the mass of plastic is still much greater in areas like the North Pacific Subtropical Gyre because it is a larger geographic area and because of the accumulation of macro-debris derived from the fishing and shipping industries. Nonetheless, the take-home message from a study like this (as well as the other abundance studies mentioned above) is that plastic marine debris is a significant local issue for California coastal waters and not just an issue in a distant location like the North Pacific Subtropical Gyre.
3. On the Shore
The majority of marine debris data available for California as well as worldwide comes from shoreline monitoring, and most of that derives from volunteer beach-cleanup efforts. The largest cleanup and monitoring effort occurs on the Annual International Coastal Cleanup Day (CCD) organized by Ocean Conservancy at 6,000 sites worldwide using the efforts of half a million volunteers.[28] Since 1985, the California Coastal Commission has organized the sites, volunteers, and waste removal in the state of California on Coastal Cleanup Day.[29] Compared to all the countries that participate, the U.S. cleans up the most miles of coastline, collects the most amount of debris, and has the highest number of volunteers. Within the U.S., California leads the nation in volunteer effort, number of miles covered, and pounds of debris collected.
Coastal Cleanup Day. (Photo credits: left, NOAA National Marine Debris Program; right, Sarah Sikich, Heal the Bay).
9
In 2009, volunteers collected over 3.6 million pounds (1,632 metric tons) of debris nationwide on CCD; over 1.6 million pounds (725 metric tons)—almost half of the national total—was collected in California alone.[30] In 2010, California still led the way among states with about 1.4 million pounds (636 metric tons) of the 4.3 million pounds (1,950 metric tons) collected nationally.[28] Several factors account for these totals, including
California’s long coastline, a large and productive volunteer effort, and a large population generating large amounts of debris. California had 82,365 volunteers on CCD in 2010, approximately four times as many volunteers as the next highest state volunteer total (Georgia; 23,668 volunteers).
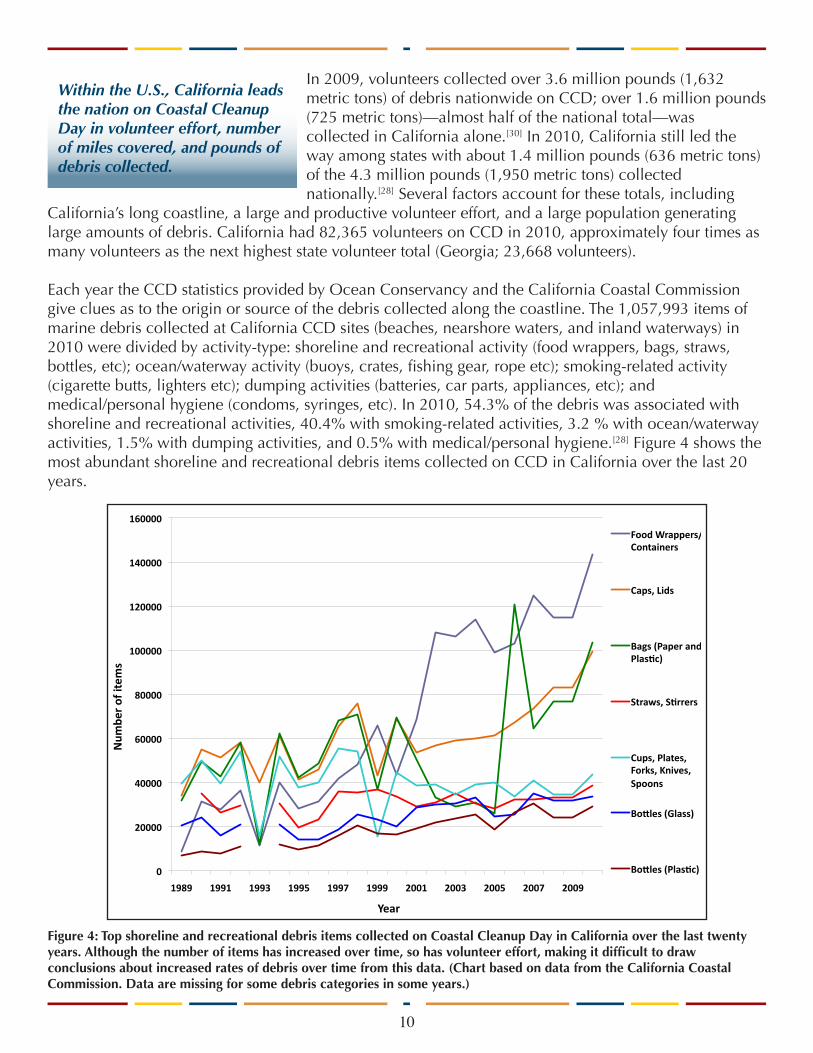
Each year the CCD statistics provided by Ocean Conservancy and the California Coastal Commission give clues as to the origin or source of the debris collected along the coastline. The 1,057,993 items of marine debris collected at California CCD sites (beaches, nearshore waters, and inland waterways) in 2010 were divided by activity-type: shoreline and recreational activity (food wrappers, bags, straws, bottles, etc); ocean/waterway activity (buoys, crates, fishing gear, rope etc); smoking-related activity (cigarette butts, lighters etc); dumping activities (batteries, car parts, appliances, etc); and medical/personal hygiene (condoms, syringes, etc). In 2010, 54.3% of the debris was associated with shoreline and recreational activities, 40.4% with smoking-related activities, 3.2 % with ocean/waterway activities, 1.5% with dumping activities, and 0.5% with medical/personal hygiene.[28] Figure 4 shows the most abundant shoreline and recreational debris items collected on CCD in California over the last 20 years.
Within the U.S., California leads the nation on Coastal Cleanup Day in volunteer effort, number of miles covered, and pounds of debris collected.
10
Figure 4: Top shoreline and recreational debris items collected on Coastal Cleanup Day in California over the last twenty years. Although the number of items has increased over time, so has volunteer effort, making it difficult to draw conclusions about increased rates of debris over time from this data. (Chart based on data from the California Coastal Commission. Data are missing for some debris categories in some years.)
0
20000
40000
60000
80000
100000
120000
140000
160000
1989 1991 1993 1995 1997 1999 2001 2003 2005 2007 2009
Num
ber of item
s
Year
Food Wrappers/Containers
Caps, Lids
Bags (Paper and PlasGc)
Straws, SGrrers
Cups, Plates, Forks, Knives, Spoons
BoOles (Glass)
BoOles (PlasGc)
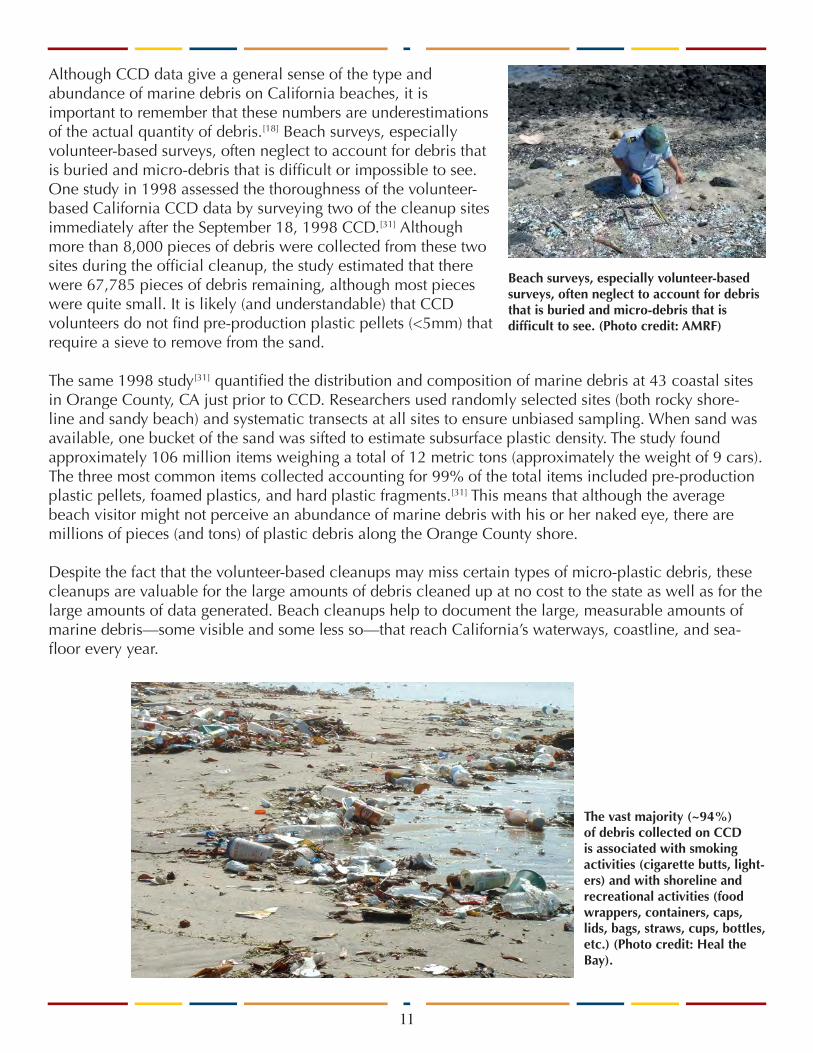
Although CCD data give a general sense of the type and abundance of marine debris on California beaches, it is important to remember that these numbers are underestimations of the actual quantity of debris.[18] Beach surveys, especially volunteer-based surveys, often neglect to account for debris that is buried and micro-debris that is difficult or impossible to see. One study in 1998 assessed the thoroughness of the volunteer-based California CCD data by surveying two of the cleanup sites immediately after the September 18, 1998 CCD.[31] Although more than 8,000 pieces of debris were collected from these two sites during the official cleanup, the study estimated that there were 67,785 pieces of debris remaining, although most pieces were quite small. It is likely (and understandable) that CCD volunteers do not find pre-production plastic pellets (<5mm) that require a sieve to remove from the sand.
The same 1998 study[31] quantified the distribution and composition of marine debris at 43 coastal sites in Orange County, CA just prior to CCD. Researchers used randomly selected sites (both rocky shore-line and sandy beach) and systematic transects at all sites to ensure unbiased sampling. When sand was available, one bucket of the sand was sifted to estimate subsurface plastic density. The study found approximately 106 million items weighing a total of 12 metric tons (approximately the weight of 9 cars). The three most common items collected accounting for 99% of the total items included pre-production plastic pellets, foamed plastics, and hard plastic fragments.[31] This means that although the average beach visitor might not perceive an abundance of marine debris with his or her naked eye, there are millions of pieces (and tons) of plastic debris along the Orange County shore.
Despite the fact that the volunteer-based cleanups may miss certain types of micro-plastic debris, these cleanups are valuable for the large amounts of debris cleaned up at no cost to the state as well as for the large amounts of data generated. Beach cleanups help to document the large, measurable amounts of marine debris—some visible and some less so—that reach California’s waterways, coastline, and sea-floor every year.
Beach surveys, especially volunteer-based surveys, often neglect to account for debris that is buried and micro-debris that is difficult to see. (Photo credit: AMRF)
11
The vast majority (~94%) of debris collected on CCD is associated with smoking activities (cigarette butts, light-ers) and with shoreline and recreational activities (food wrappers, containers, caps, lids, bags, straws, cups, bottles, etc.) (Photo credit: Heal the Bay).
Determining the origins of marine debris is important for determining appropriate solutions. There are two sources of plastic in the marine environment: 1) waste lost or dumped at sea from ships, platforms and aquaculture facilities, and 2) waste from land-based sources.
A. Debris from Ships
The International Maritime Organization (IMO), a body of the United Nations consisting of 152 countries, sets international maritime safety and pollution standards. The IMO created and implements the 1973 International Convention for the Prevention of Pollution from Ships, as modified by the Protocol of 1978, which is more commonly called MARPOL 73/78.[32] All ships (including cruise ships) flagged under countries that are signatories to MARPOL 73/78 must abide by the convention’s requirements. There are six requirements broken down into sections or annexes, which control pollution by oil, noxious liquid substances, harmful substances, sewage, garbage and plastics, and gas emissions. MARPOL 73/78 Annex V (dealing with garbage and plastics) was signed by the U.S in 1988, is implemented in the U.S. by the Act to Prevent Pollution from Ships (APPS, 33 U.S.C. §§1905-1915), and is regulated in U.S. waters by the U.S. Coast Guard.[32]
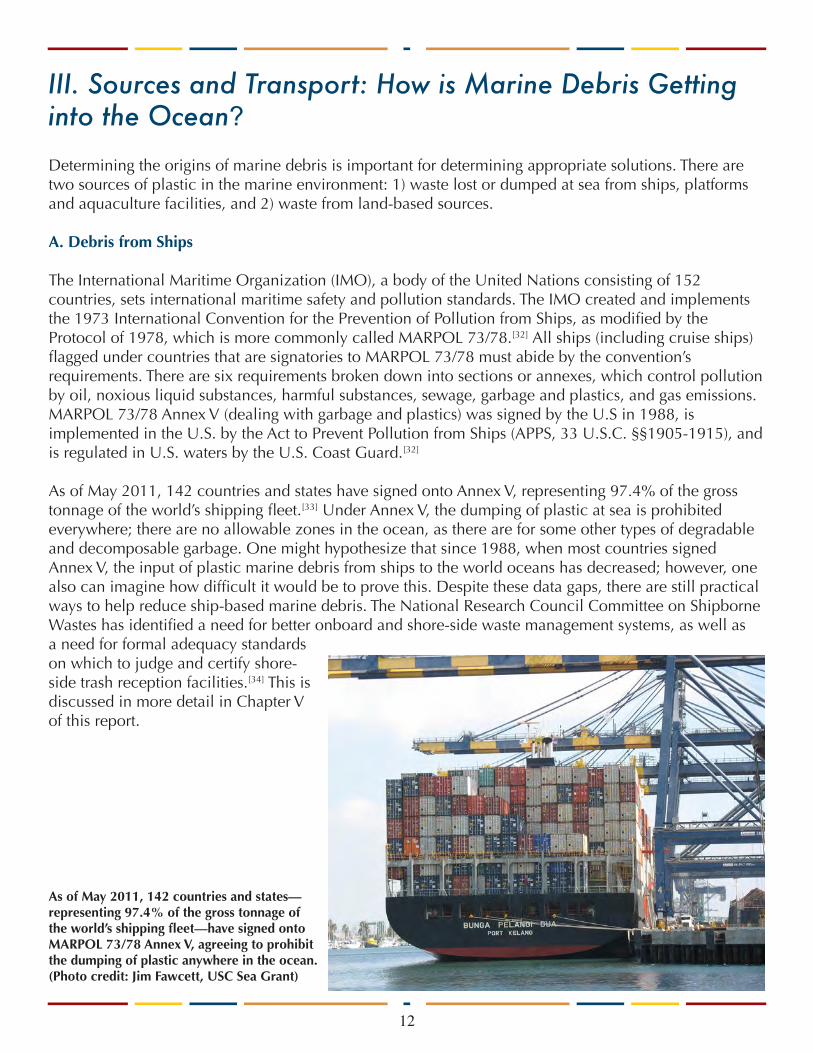
As of May 2011, 142 countries and states have signed onto Annex V, representing 97.4% of the gross tonnage of the world’s shipping fleet.[33] Under Annex V, the dumping of plastic at sea is prohibited everywhere; there are no allowable zones in the ocean, as there are for some other types of degradable and decomposable garbage. One might hypothesize that since 1988, when most countries signed Annex V, the input of plastic marine debris from ships to the world oceans has decreased; however, one also can imagine how difficult it would be to prove this. Despite these data gaps, there are still practical ways to help reduce ship-based marine debris. The National Research Council Committee on Shipborne Wastes has identified a need for better onboard and shore-side waste management systems, as well as a need for formal adequacy standards on which to judge and certify shore-side trash reception facilities.[34] This is discussed in more detail in Chapter V of this report.
III. Sources and Transport: How is Marine Debris Getting into the Ocean?
As of May 2011, 142 countries and states—representing 97.4% of the gross tonnage of the world’s shipping fleet—have signed onto MARPOL 73/78 Annex V, agreeing to prohibit the dumping of plastic anywhere in the ocean. (Photo credit: Jim Fawcett, USC Sea Grant)
12

B. Debris from Land-Based Sources
Are ocean-based sources or land-based sources more responsible for plastic marine debris? Although this question cannot be definitively answered, many researchers are now pointing to data that indicate that land-based sources may be the largest. Two long-term studies found that the quantity of plastic in the stomach contents of fulmar seabirds in the North Sea and shearwater seabirds in the Bering Sea had not increased over the last 20 years; however, the composition of the plastic had changed greatly. Since the 1980s, the mass of plastic originating from land-based consumer products has doubled (and in some years tripled).[35, 36]
A study off southern California of floating plastic particles found that the highest concentrations of plastic during wet weather were associated with large urban centers, implicating land-based runoff as the main contributor to floating plastic debris in coastal waters.[26] The data from Ocean Conservancy’s International Coastal Cleanup Day indicate that somewhere between 60-80% of marine debris starts out on land; this is determined based on the type of debris and its likely original use.[28] During one storm event in 1997, the Los Angeles Department of Beaches and Harbors recorded 13 metric tons (approximately equivalent to the weight of 9.5 automobiles) of anthropogenic debris discharged from Ballona Creek into Santa Monica Bay.[23] In a 1998-2000 California Department of Transportation study, plastic accounted for 43% of the litter sampled from storm drains,[37] a confirmation that plastic is trans-ported to the shoreline from inland locations.
While it is clear that debris from land-based sources is transported to the shoreline via rivers, stormwater channels, wind, or direct littering, the original sources of this plastic debris are more difficult to identify. Was this debris intentionally dumped into a watershed or gutter? Was it blown by the wind from a waste management or industrial facility? Did it fall from the back of a truck while being transported? Tracing the ultimate sources of marine debris is difficult but clearly important for developing targeted solutions.
Marine debris can be transported via watersheds and storm drains to the ocean. During one storm event in 1997, the Los Angeles Department of Beaches and Harbors recorded 13 metric tons (approximately equivalent to the weight of 7-9 cars) of anthropogenic debris discharged from Ballona Creek into Santa Monica Bay. In a 1998-2000 California Department of Transportation study, plastic accounted for 43% of the litter sampled from storm drains. (Photo Credits: left, Heal the Bay; right, Ocean Conservancy).
13
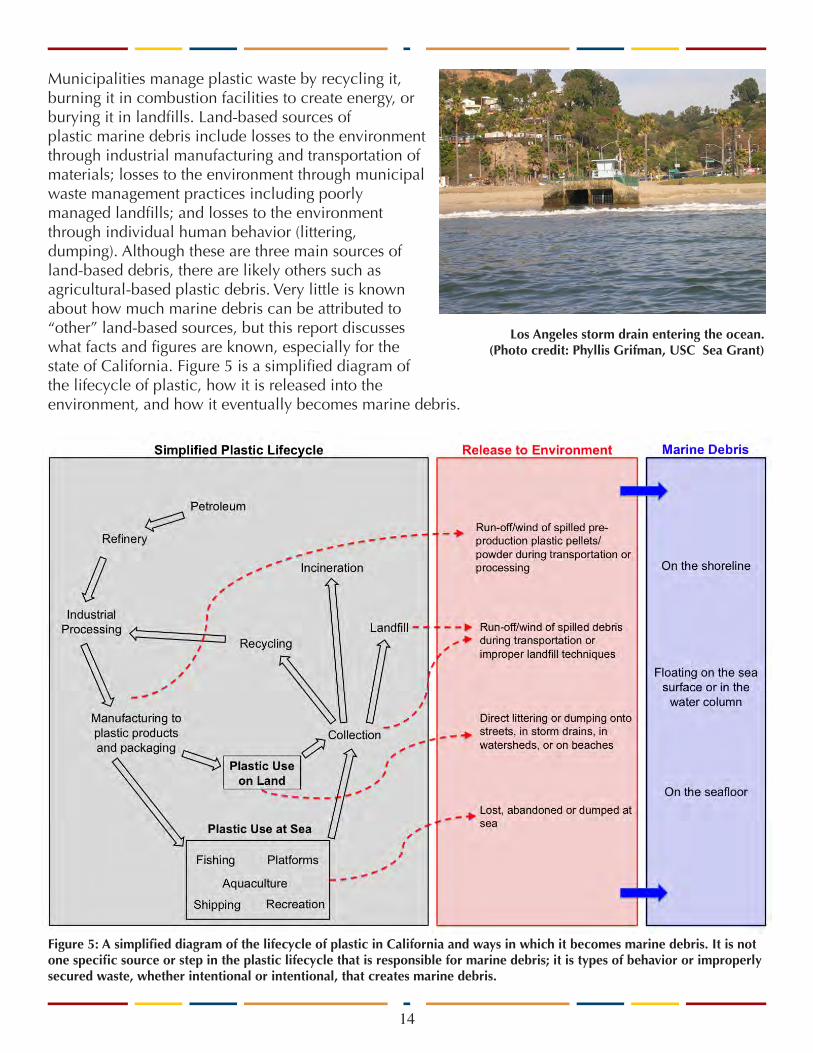
Municipalities manage plastic waste by recycling it, burning it in combustion facilities to create energy, or burying it in landfills. Land-based sources of plastic marine debris include losses to the environment through industrial manufacturing and transportation of materials; losses to the environment through municipal waste management practices including poorly managed landfills; and losses to the environment through individual human behavior (littering, dumping). Although these are three main sources of land-based debris, there are likely others such as agricultural-based plastic debris. Very little is known about how much marine debris can be attributed to “other” land-based sources, but this report discusses what facts and figures are known, especially for the state of California. Figure 5 is a simplified diagram of the lifecycle of plastic, how it is released into the environment, and how it eventually becomes marine debris.
Figure 5: A simplified diagram of the lifecycle of plastic in California and ways in which it becomes marine debris. It is not one specific source or step in the plastic lifecycle that is responsible for marine debris; it is types of behavior or improperly secured waste, whether intentional or intentional, that creates marine debris.
14
Los Angeles storm drain entering the ocean. (Photo credit: Phyllis Grifman, USC Sea Grant)

C. National Municipal Waste Stream
Mass production of plastics for commercial use began in the 1950s,[9] and the high demand for light-weight, durable, and cheap plastic encouraged the industry to grow exponentially over the following decades. In 1960, plastics made up an estimated 390,000 tons (<1%) of the municipal solid waste stream (MSW).[38] In 2009, plastics accounted for 29.8 million tons (~12.3%) of the national MSW.[38] Currently, the majority of this plastic waste (12.5 million tons or 42%) consists of disposable containers and packaging (e.g., bags, sacks, and wraps, other packaging, PET bottles, jars and HDPE natural bottles).[38]
Only 2.1 million tons (~7.1%) of the plastics in the national MSW are recovered for recycling.[38] Figure 6 shows the rate of plastic waste generation and recovery in the U.S. from 1960 to 2009, according to the U.S. Environmental Protection Agency (EPA). However, recovery of certain types of plastic containers is more significant; in 2009, PET bottles and jars (resin indication code or “recycling number” one), and high-density polyethylene natural bottles (resin indication code or “recycling number” two) were recovered at a rate of approximately 28%.[38]
Although global statistics are outside the scope of this report, it is important to keep in mind that the U.S. is no longer the only large player in the global market for plastics, with 65,000 plastic processers in India and China consuming nearly as much pre-production plastic resin (~50 mt/yr) as the United States.[39] This global, growing demand for plastic is not surprising, since economically there are no other materials that compete with plastic. One pound (25,000 pellets) of preproduction plastic resin pellets—precursors to a huge variety of plastic products—costs one U.S. dollar.[4]
Figure 6: Generation and recovery of plastics in the United States from 1960 to 2009. (Image courtesy of US EPA, 2010.)
15
D. Municipal Waste in California
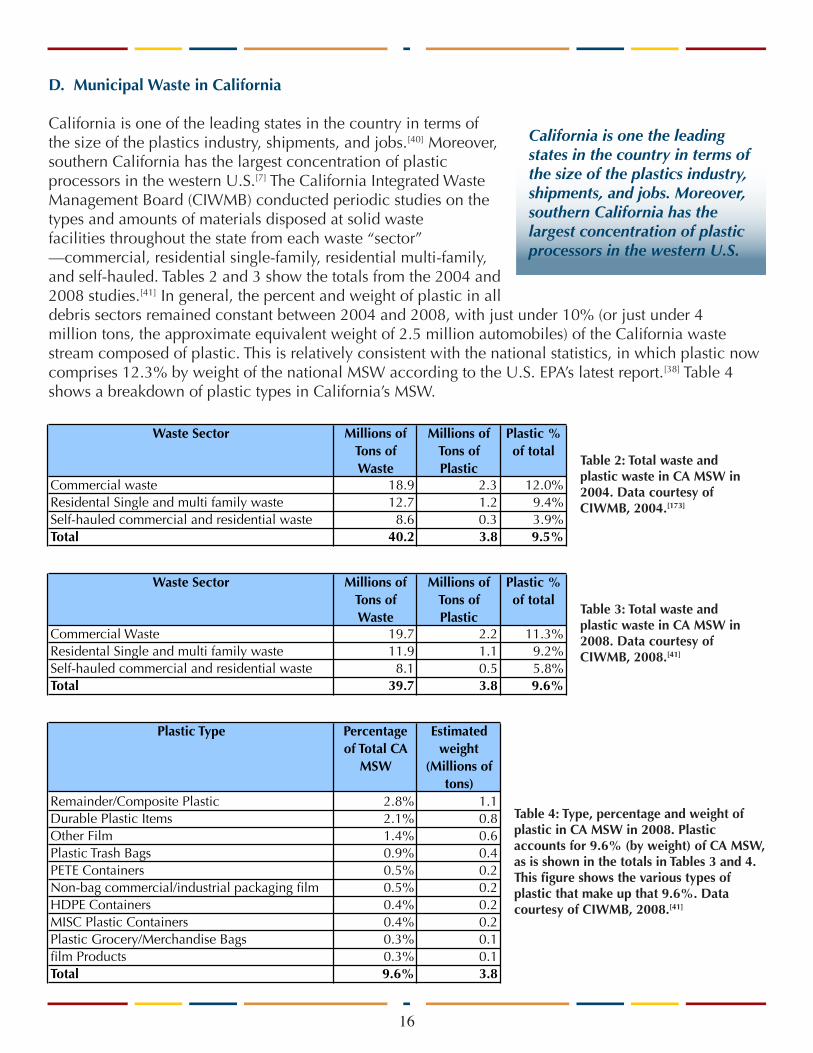
California is one of the leading states in the country in terms of the size of the plastics industry, shipments, and jobs.[40] Moreover, southern California has the largest concentration of plastic processors in the western U.S.[7] The California Integrated Waste Management Board (CIWMB) conducted periodic studies on the types and amounts of materials disposed at solid waste facilities throughout the state from each waste “sector”—commercial, residential single-family, residential multi-family, and self-hauled. Tables 2 and 3 show the totals from the 2004 and 2008 studies.[41] In general, the percent and weight of plastic in all debris sectors remained constant between 2004 and 2008, with just under 10% (or just under 4 million tons, the approximate equivalent weight of 2.5 million automobiles) of the California waste stream composed of plastic. This is relatively consistent with the national statistics, in which plastic now comprises 12.3% by weight of the national MSW according to the U.S. EPA’s latest report.[38] Table 4 shows a breakdown of plastic types in California’s MSW.
Table 2: Total waste and plastic waste in CA MSW in 2004. Data courtesy of CIWMB, 2004.[173]
Table 3: Total waste and plastic waste in CA MSW in 2008. Data courtesy of CIWMB, 2008.[41]
California is one the leading states in the country in terms of the size of the plastics industry, shipments, and jobs. Moreover, southern California has the largest concentration of plastic processors in the western U.S.
16
Table 4: Type, percentage and weight of plastic in CA MSW in 2008. Plastic accounts for 9.6% (by weight) of CA MSW, as is shown in the totals in Tables 3 and 4. This figure shows the various types of plastic that make up that 9.6%. Data courtesy of CIWMB, 2008.[41]
Waste Sector Millions of Tons of Waste
Millions of Tons of Plastic
Plastic % of total
Commercial waste 18.9 2.3 12.0%Residental Single and multi family waste 12.7 1.2 9.4%Self-hauled commercial and residential waste 8.6 0.3 3.9%Total 40.2 3.8 9.5%
Waste Sector Millions of Tons of Waste
Millions of Tons of Plastic
Plastic % of total
Commercial Waste 19.7 2.2 11.3%Residental Single and multi family waste 11.9 1.1 9.2%Self-hauled commercial and residential waste 8.1 0.5 5.8%Total 39.7 3.8 9.6%
Plastic Type Percentage of Total CA
MSW
Estimated weight
(Millions of tons)
Remainder/Composite Plastic 2.8% 1.1Durable Plastic Items 2.1% 0.8Other Film 1.4% 0.6Plastic Trash Bags 0.9% 0.4PETE Containers 0.5% 0.2Non-bag commercial/industrial packaging film 0.5% 0.2HDPE Containers 0.4% 0.2MISC Plastic Containers 0.4% 0.2Plastic Grocery/Merchandise Bags 0.3% 0.1film Products 0.3% 0.1Total 9.6% 3.8
Although Tables 2, 3 and 4 give the estimated weight of plastic, analyzing the volume of plastic in the waste stream may give a different perspective of the contribution of plastic to the overall waste stream, since even large pieces of plastic can be very light-weight. For instance, a 2003 CIWMB report found that although plastic was just under 10% of the waste stream by weight, it was estimated to be 17.8% by volume of the material landfilled in California. This ranks plastic as the second-largest category of waste volume (behind paper) going into California municipal landfills.[40] Ultimately, despite the large amounts of plastic heading to landfills, and with only an estimated 5% by weight overall recycling rate for California,[174, 175] significant amounts of plastic debris end up as marine debris.
E. Industrial Management and Transportation of Plastic in California
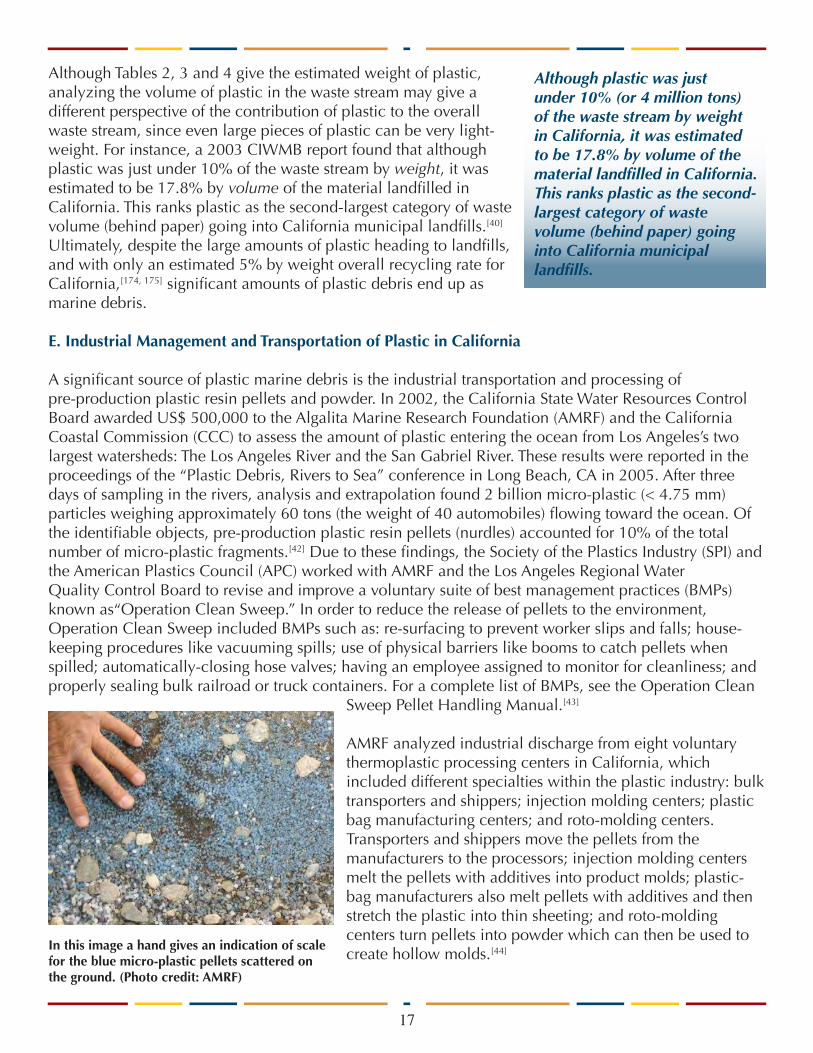
A significant source of plastic marine debris is the industrial transportation and processing of pre-production plastic resin pellets and powder. In 2002, the California State Water Resources Control Board awarded US$ 500,000 to the Algalita Marine Research Foundation (AMRF) and the California Coastal Commission (CCC) to assess the amount of plastic entering the ocean from Los Angeles’s two largest watersheds: The Los Angeles River and the San Gabriel River. These results were reported in the proceedings of the “Plastic Debris, Rivers to Sea” conference in Long Beach, CA in 2005. After three days of sampling in the rivers, analysis and extrapolation found 2 billion micro-plastic (< 4.75 mm) particles weighing approximately 60 tons (the weight of 40 automobiles) flowing toward the ocean. Of the identifiable objects, pre-production plastic resin pellets (nurdles) accounted for 10% of the total number of micro-plastic fragments.[42] Due to these findings, the Society of the Plastics Industry (SPI) and the American Plastics Council (APC) worked with AMRF and the Los Angeles Regional Water Quality Control Board to revise and improve a voluntary suite of best management practices (BMPs) known as“Operation Clean Sweep.” In order to reduce the release of pellets to the environment, Operation Clean Sweep included BMPs such as: re-surfacing to prevent worker slips and falls; house-keeping procedures like vacuuming spills; use of physical barriers like booms to catch pellets when spilled; automatically-closing hose valves; having an employee assigned to monitor for cleanliness; and properly sealing bulk railroad or truck containers. For a complete list of BMPs, see the Operation Clean
Sweep Pellet Handling Manual.[43]
AMRF analyzed industrial discharge from eight voluntary thermoplastic processing centers in California, which included different specialties within the plastic industry: bulk transporters and shippers; injection molding centers; plastic bag manufacturing centers; and roto-molding centers. Transporters and shippers move the pellets from the manufacturers to the processors; injection molding centers melt the pellets with additives into product molds; plastic-bag manufacturers also melt pellets with additives and then stretch the plastic into thin sheeting; and roto-molding centers turn pellets into powder which can then be used to create hollow molds.[44]In this image a hand gives an indication of scale
for the blue micro-plastic pellets scattered on the ground. (Photo credit: AMRF)
17
Although plastic was just under 10% (or 4 million tons) of the waste stream by weight in California, it was estimated to be 17.8% by volume of the material landfilled in California. This ranks plastic as the second-largest category of waste volume (behind paper) going into California municipal landfills.

The eight centers were analyzed before and after the implementation of many of the Operation Clean Sweep BMPs and the analysis found a 50% reduction (by count) in pellet discharge to the environment during dry weather, demonstrating the success of many of the BMPs under Operation Clean Sweep.[44] However, during rain events, none of the examined thermoplastic resin processing facilities were able to retain pellets on site since physical controls like catch basin inserts (mesh to catch debris but allow water through) overflowed or were removed to prevent flooding; therefore, there were no measures to stop the release of pellets already on the ground of the facility prior to the rain event. Rail yards were noted in the study as having the largest potential for pellet loss, especially during wet weather. Pellets were photographed flowing across the rail yard gravel to storm drains during major storm events during the study. Additionally, the report mentioned that further study into plastic powders and shavings is needed since wind blows such extremely fine particles into the environment, and numerous plastic powder spills were observed during the course of the study.[44]
On one hand, this analysis of eight plastic industry centers in California supports the use of the voluntary Clean Sweep Program; the results indicate that even partial compliance with Operation Clean Sweep BMPs can make a significant difference in pellet discharge to the environment. As a result, in 2007 the California legislature passed a bill that required all plastic manufacturers in the state to use best management practices to prevent pellet spillage. The State Water Resources Control Board (SWRCB) was put in charge of implementation and enforcement of this bill, as discussed in detail in Chapter V.[45] However, it is clear that more follow-up studies are warranted to investigate facility improvements over time, percentage of the plastic industry in full compliance with the state bill and Operation Clean Sweep, BMPs that are effective in wet weather, and the fate of plastic powders and shavings spilled in these industrial facilities. It is also worth noting that the creation of Operation Clean Sweep as well as this 2005 follow-up study are good examples of the results and information attainable when industry, government, and scientists work together.
F. Individual Waste, Littering, and Dumping
Municipal and industrial processes and practices are not solely to blame for the loss of plastic debris to the environment. Littering and illegal dumping of materials by individuals is also a main source of debris, especially in urban runoff.[34] The top 4 items collected during Coastal Cleanup Day in California over the last decade have been cigarette butts, food wrappers and containers, bottle caps and lids, and plastic bags.[29] Items like these, which are often unintentionally dropped or intentionally littered on the ground, make their way to the coastline via the storm drain system, creeks, rivers, or wind. These items are also very commonly used on beaches and shorelines, so when lost, do not have far to travel to the ocean. Unless one visibly sees a person littering or dumping debris, it is impossible to tell exactly how much plastic marine debris results from these types of individual behaviors. However, simple yet effective solutions (discussed in more detail in Chapter V of this report) for correcting individual behaviors are: greater availability of public trash and recycling receptacles and more public education. Debris along the edge of Ballona Creek, which
enters the ocean in Santa Monica Bay, CA. (Photo credit: Heal the Bay)
18

19
The large amount of time and effort put into investigating the distribution, sources, and pathways of plastics is due to the large (and growing) awareness of the number of biological, ecological, and economic impacts of plastic debris. While some of the impact studies pertain specifically to California, the vast majority do not. Nevertheless, many of the studies, especially laboratory-based toxicological studies, are informative for all managers and policy-makers considering the impacts of plastic marine debris in the environment.
A. Ingestion and Entanglement
More than 260 species including turtles, fish, seabirds, mammals, and invertebrates, have been reported to ingest or become entangled in plastic marine debris. When abandoned or lost fishing gear (nets, monofilament line, traps) continues to catch marine organisms, this is often termed “ghostfishing.” Entanglement and ingestion results in a range of documented impacts including lacerations, drowning (for mammals and turtles which need to breathe air regularly), limited feeding, digestive ulcers, and starvation (due to digestive tracts full of non-passable plastic), limited predator avoidance, and reduced reproductive output.[1, 9, 46-50] The most dangerous debris items to wildlife include: bags (paper and plastic), balloons, caps, lids, clothing, shoes, food wrappers/containers, pull tabs, 6-pack rings, straws, stirrers, buoys/floats, fishing gear (traps, monofilament line, lures, light sticks, nets), plastic sheeting/tarps, rope, strapping bands, cigarettes filters, cigarette lighters, and cigar tips.[28]
IV. Impacts: Why is Marine Debris a Problem?
More than 260 species including turtles, fish, seabirds, mammals, and invertebrates have been reported to ingest or become entangled in plastic marine debris. (Photo credits: seals and turtle, NOAA; albatross top-left, Cynthia Vanderlip, AMRF; seabirds bottom-left and bottom center, Ocean Conservancy.)
20
A meta-analysis of seven databases of entanglement records along central California and the northwest coast of the U.S. found that between 2001 and 2005, there were 454 entanglements documented, encompassing 31 bird species, nine marine mammal species and one leatherback turtle.[51] Common murres, Western gulls and California sea lions were the most commonly entangled species, which partially reflects the high abundance of these species in the study area.[51] Plastic monofilament fishing line was the most common entanglement item, although 22 Northern elephant seals and several other species have been recorded entangled in plastic rings and packing straps.[51] The study found three records of Guadalupe fur seals—listed as threatened under the U.S. Endangered Species Act—being entangled in fishing line and netting.[51]
Another study over a similar time period (2001-2006) analyzed the records of five wildlife rehabilitation facilities in California, and found that there were 1,090 fishing gear related injuries (entanglement and ingestion) among brown pelicans (589), gulls (375), California sea lions (106), elephant seals (16), and harbor seals (4).[52] These studies do note that although this meta-analysis of multiple databases provides a unique overview of entanglement over a broad geographic range and time period, these records represent an unknown proportion of the total entangled/impacted animals that die at sea and are not washed ashore.[51]
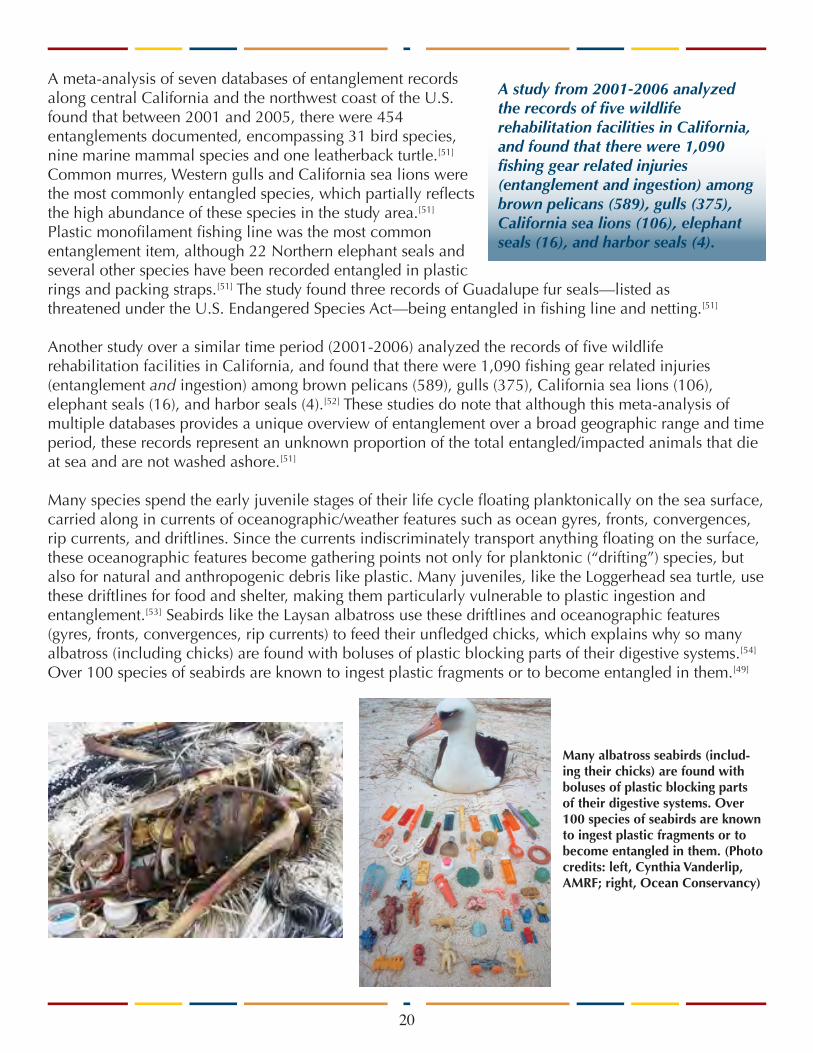
Many species spend the early juvenile stages of their life cycle floating planktonically on the sea surface, carried along in currents of oceanographic/weather features such as ocean gyres, fronts, convergences, rip currents, and driftlines. Since the currents indiscriminately transport anything floating on the surface, these oceanographic features become gathering points not only for planktonic (“drifting”) species, but also for natural and anthropogenic debris like plastic. Many juveniles, like the Loggerhead sea turtle, use these driftlines for food and shelter, making them particularly vulnerable to plastic ingestion and entanglement.[53] Seabirds like the Laysan albatross use these driftlines and oceanographic features (gyres, fronts, convergences, rip currents) to feed their unfledged chicks, which explains why so many albatross (including chicks) are found with boluses of plastic blocking parts of their digestive systems.[54] Over 100 species of seabirds are known to ingest plastic fragments or to become entangled in them.[49]
A study from 2001-2006 analyzed the records of five wildlife rehabilitation facilities in California, and found that there were 1,090 fishing gear related injuries (entanglement and ingestion) among brown pelicans (589), gulls (375), California sea lions (106), elephant seals (16), and harbor seals (4).
Many albatross seabirds (includ-ing their chicks) are found with boluses of plastic blocking parts of their digestive systems. Over 100 species of seabirds are known to ingest plastic fragments or to become entangled in them. (Photo credits: left, Cynthia Vanderlip, AMRF; right, Ocean Conservancy)
21
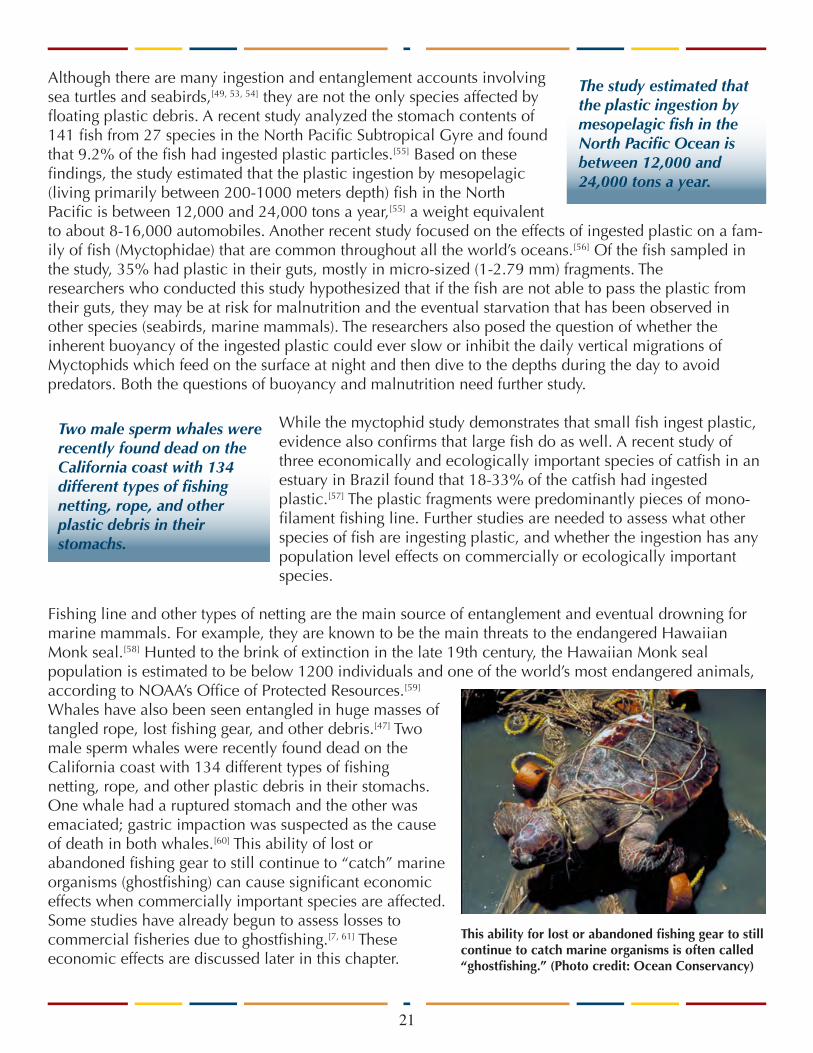
Although there are many ingestion and entanglement accounts involving sea turtles and seabirds,[49, 53, 54] they are not the only species affected by floating plastic debris. A recent study analyzed the stomach contents of 141 fish from 27 species in the North Pacific Subtropical Gyre and found that 9.2% of the fish had ingested plastic particles.[55] Based on these findings, the study estimated that the plastic ingestion by mesopelagic (living primarily between 200-1000 meters depth) fish in the North Pacific is between 12,000 and 24,000 tons a year,[55] a weight equivalent to about 8-16,000 automobiles. Another recent study focused on the effects of ingested plastic on a fam-ily of fish (Myctophidae) that are common throughout all the world’s oceans.[56] Of the fish sampled in the study, 35% had plastic in their guts, mostly in micro-sized (1-2.79 mm) fragments. The researchers who conducted this study hypothesized that if the fish are not able to pass the plastic from their guts, they may be at risk for malnutrition and the eventual starvation that has been observed in other species (seabirds, marine mammals). The researchers also posed the question of whether the inherent buoyancy of the ingested plastic could ever slow or inhibit the daily vertical migrations of Myctophids which feed on the surface at night and then dive to the depths during the day to avoid predators. Both the questions of buoyancy and malnutrition need further study.
While the myctophid study demonstrates that small fish ingest plastic, evidence also confirms that large fish do as well. A recent study of three economically and ecologically important species of catfish in an estuary in Brazil found that 18-33% of the catfish had ingested plastic.[57] The plastic fragments were predominantly pieces of mono-filament fishing line. Further studies are needed to assess what other species of fish are ingesting plastic, and whether the ingestion has any population level effects on commercially or ecologically important species.
Fishing line and other types of netting are the main source of entanglement and eventual drowning for marine mammals. For example, they are known to be the main threats to the endangered Hawaiian Monk seal.[58] Hunted to the brink of extinction in the late 19th century, the Hawaiian Monk seal population is estimated to be below 1200 individuals and one of the world’s most endangered animals, according to NOAA’s Office of Protected Resources.[59] Whales have also been seen entangled in huge masses of tangled rope, lost fishing gear, and other debris.[47] Two male sperm whales were recently found dead on the California coast with 134 different types of fishing netting, rope, and other plastic debris in their stomachs. One whale had a ruptured stomach and the other was emaciated; gastric impaction was suspected as the cause of death in both whales.[60] This ability of lost or abandoned fishing gear to still continue to “catch” marine organisms (ghostfishing) can cause significant economic effects when commercially important species are affected. Some studies have already begun to assess losses to commercial fisheries due to ghostfishing.[7, 61] These economic effects are discussed later in this chapter.
The study estimated that the plastic ingestion by mesopelagic fish in the North Pacific Ocean is between 12,000 and 24,000 tons a year.
Two male sperm whales were recently found dead on the California coast with 134 different types of fishing netting, rope, and other plastic debris in their stomachs.
This ability for lost or abandoned fishing gear to still continue to catch marine organisms is often called “ghostfishing.” (Photo credit: Ocean Conservancy)
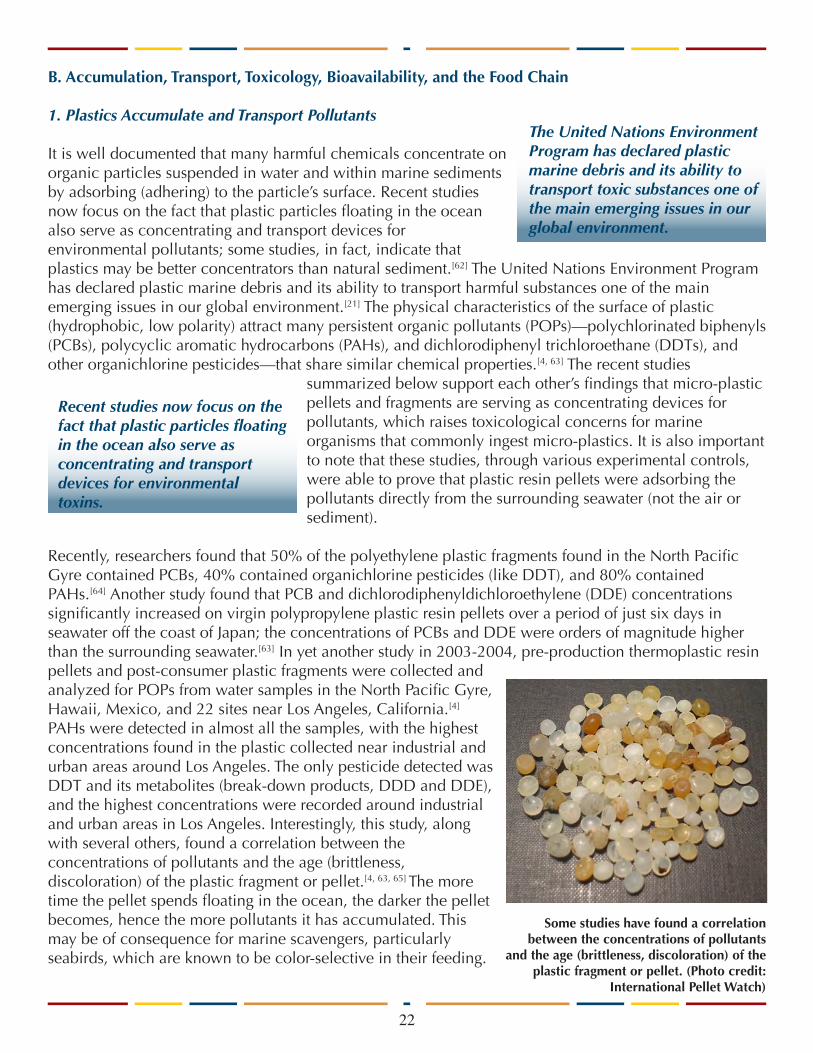
22
B. Accumulation, Transport, Toxicology, Bioavailability, and the Food Chain
1. Plastics Accumulate and Transport Pollutants
It is well documented that many harmful chemicals concentrate on organic particles suspended in water and within marine sediments by adsorbing (adhering) to the particle’s surface. Recent studies now focus on the fact that plastic particles floating in the ocean also serve as concentrating and transport devices for environmental pollutants; some studies, in fact, indicate that plastics may be better concentrators than natural sediment.[62] The United Nations Environment Program has declared plastic marine debris and its ability to transport harmful substances one of the main emerging issues in our global environment.[21] The physical characteristics of the surface of plastic (hydrophobic, low polarity) attract many persistent organic pollutants (POPs)—polychlorinated biphenyls (PCBs), polycyclic aromatic hydrocarbons (PAHs), and dichlorodiphenyl trichloroethane (DDTs), and other organichlorine pesticides—that share similar chemical properties.[4, 63] The recent studies
summarized below support each other’s findings that micro-plastic pellets and fragments are serving as concentrating devices for pollutants, which raises toxicological concerns for marine organisms that commonly ingest micro-plastics. It is also important to note that these studies, through various experimental controls, were able to prove that plastic resin pellets were adsorbing the pollutants directly from the surrounding seawater (not the air or sediment).
Recently, researchers found that 50% of the polyethylene plastic fragments found in the North Pacific Gyre contained PCBs, 40% contained organichlorine pesticides (like DDT), and 80% contained PAHs.[64] Another study found that PCB and dichlorodiphenyldichloroethylene (DDE) concentrations significantly increased on virgin polypropylene plastic resin pellets over a period of just six days in seawater off the coast of Japan; the concentrations of PCBs and DDE were orders of magnitude higher than the surrounding seawater.[63] In yet another study in 2003-2004, pre-production thermoplastic resin pellets and post-consumer plastic fragments were collected and analyzed for POPs from water samples in the North Pacific Gyre, Hawaii, Mexico, and 22 sites near Los Angeles, California.[4] PAHs were detected in almost all the samples, with the highest concentrations found in the plastic collected near industrial and urban areas around Los Angeles. The only pesticide detected was DDT and its metabolites (break-down products, DDD and DDE), and the highest concentrations were recorded around industrial and urban areas in Los Angeles. Interestingly, this study, along with several others, found a correlation between the concentrations of pollutants and the age (brittleness, discoloration) of the plastic fragment or pellet.[4, 63, 65] The more time the pellet spends floating in the ocean, the darker the pellet becomes, hence the more pollutants it has accumulated. This may be of consequence for marine scavengers, particularly seabirds, which are known to be color-selective in their feeding.
Recent studies now focus on the fact that plastic particles floating in the ocean also serve as concentrating and transport devices for environmental toxins.
The United Nations Environment Program has declared plastic marine debris and its ability to transport toxic substances one of the main emerging issues in our global environment.
Some studies have found a correlation between the concentrations of pollutants
and the age (brittleness, discoloration) of the plastic fragment or pellet. (Photo credit:
International Pellet Watch)

23
Scientists at Tokyo University recently started the International Pellet Watch.[70] Under this program, samples of polyethylene pellets have been collected at 30 beaches in 17 countries and analyzed for pollutant concentrations. PCB concentrations were highest on U.S. coasts, and DDT was highest in southern California (likely due to the Palos Verdes Superfund Site) and Vietnam (likely due to the continued usage of the pesticide for malaria control). The pellet concentrations of PCBs were also positively correlated with pollutant concentrations in shellfish measured by Mussel Watch,[72, 73] a NOAA program run in California since 1976 by the Department of Fish and Game to detect toxic substances in California’s estuarine and marine waters. In 2005, another study analyzed beached plastic resin pellets from various locations in coastal Japan and found that PCB concentrations on the pellets varied regionally and were mirrored by concentrations in marine mussels located in the study sites.[65] These studies suggest that the plastic resin pellets, like the mussels, reflect concentrations of pollutants found in regional seawater. Other studies have begun to focus on plastic as a transport vector for POPs to more remote areas like the Arctic.[74]
A Brief Background on Persistent Organic Pollutants
Persistent Organic Pollutants (POPs) are synthetic (man-made), organic (carbon-based) compounds that were used worldwide following World War II for pest and disease control, crop production, and industry. They are transported great distances by wind and water, are stable in both terrestrial and aquatic environments, and can be transmitted and bioaccumulated up the food chain. In wildlife, many POPs have been linked to population declines, diseases, or behavioral or physical abnormalities; in humans, some POPs have been linked to reproductive, developmental, behavioral, neurologic, endocrine, and immunologic adverse health effects.[66] The United States joined 90 other countries in May 2001 to sign a United Nations treaty, known as the Stockholm Convention, in an effort to reduce or eliminate the production, use, and release of 12 main POPs now known colloquially as the “Dirty Dozen.” However, many of these chemicals are still used commonly in developing countries. The Dirty Dozen list includes: aldrin, chlordane, dichlorodiphenyl trichloroethane (DDT), dieldrin, endrin, heptachlor, hexachlorobenzene, mirex, toxaphene, polychlorinated biphenyls (PCBs), polychlorinated dibenzo-p-dioxins (dioxins), and polychlorinated dibenzofurans (furans).
It is important to understand that some of these classes of pollutants, like PCBs, are mixtures of up to 209 different individual chlorinated compounds, 113 of which are known to be present in the environment.[67, 66] Polycyclic aromatic hydrocarbons (PAHs) are another well-studied group of POPs, 16 of which are classified by the USEPA as “priority pollutants” that are toxic and bioaccumulate in aquatic organisms; seven of those are classified as probable human carcinogens.[68] Bisphenol A (BPA) and phthalates are also commonly discussed pollutants, although their “persistence” is still under debate.[62] What is not under debate is their pervasiveness in the global environment and the number of studies linking them to wildlife and human health impairments, including endocrine-disrupting activities. Even if BPA and phthalates do degrade under some environmental conditions, the fact that researchers have trouble creating phthalate-free controls in experiments is a testament to the ubiquity and durability of these chemicals.[69]
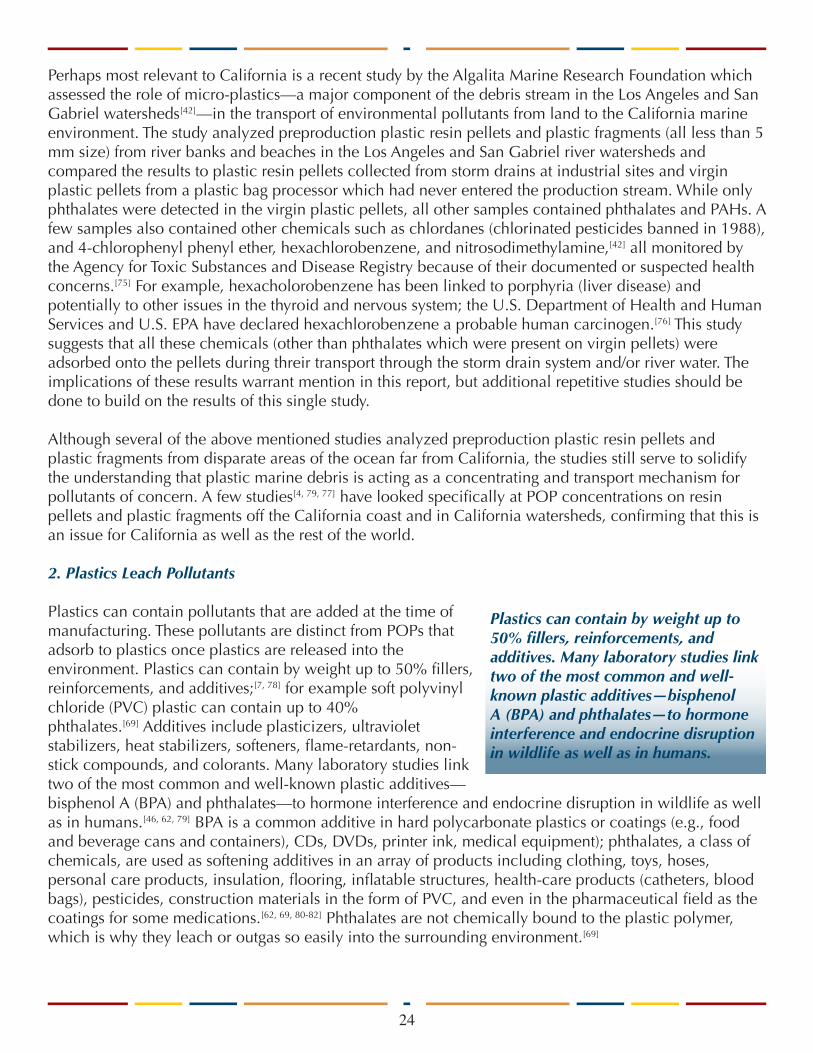
24
Perhaps most relevant to California is a recent study by the Algalita Marine Research Foundation which assessed the role of micro-plastics—a major component of the debris stream in the Los Angeles and San Gabriel watersheds[42]—in the transport of environmental pollutants from land to the California marine environment. The study analyzed preproduction plastic resin pellets and plastic fragments (all less than 5 mm size) from river banks and beaches in the Los Angeles and San Gabriel river watersheds and compared the results to plastic resin pellets collected from storm drains at industrial sites and virgin plastic pellets from a plastic bag processor which had never entered the production stream. While only phthalates were detected in the virgin plastic pellets, all other samples contained phthalates and PAHs. A few samples also contained other chemicals such as chlordanes (chlorinated pesticides banned in 1988), and 4-chlorophenyl phenyl ether, hexachlorobenzene, and nitrosodimethylamine,[42] all monitored by the Agency for Toxic Substances and Disease Registry because of their documented or suspected health concerns.[75] For example, hexacholorobenzene has been linked to porphyria (liver disease) and potentially to other issues in the thyroid and nervous system; the U.S. Department of Health and Human Services and U.S. EPA have declared hexachlorobenzene a probable human carcinogen.[76] This study suggests that all these chemicals (other than phthalates which were present on virgin pellets) were adsorbed onto the pellets during threir transport through the storm drain system and/or river water. The implications of these results warrant mention in this report, but additional repetitive studies should be done to build on the results of this single study.
Although several of the above mentioned studies analyzed preproduction plastic resin pellets and plastic fragments from disparate areas of the ocean far from California, the studies still serve to solidify the understanding that plastic marine debris is acting as a concentrating and transport mechanism for pollutants of concern. A few studies[4, 79, 77] have looked specifically at POP concentrations on resin pellets and plastic fragments off the California coast and in California watersheds, confirming that this is an issue for California as well as the rest of the world.
2. Plastics Leach Pollutants
Plastics can contain pollutants that are added at the time of manufacturing. These pollutants are distinct from POPs that adsorb to plastics once plastics are released into the environment. Plastics can contain by weight up to 50% fillers, reinforcements, and additives;[7, 78] for example soft polyvinyl chloride (PVC) plastic can contain up to 40% phthalates.[69] Additives include plasticizers, ultraviolet stabilizers, heat stabilizers, softeners, flame-retardants, non-stick compounds, and colorants. Many laboratory studies link two of the most common and well-known plastic additives—bisphenol A (BPA) and phthalates—to hormone interference and endocrine disruption in wildlife as well as in humans.[46, 62, 79] BPA is a common additive in hard polycarbonate plastics or coatings (e.g., food and beverage cans and containers), CDs, DVDs, printer ink, medical equipment); phthalates, a class of chemicals, are used as softening additives in an array of products including clothing, toys, hoses, personal care products, insulation, flooring, inflatable structures, health-care products (catheters, blood bags), pesticides, construction materials in the form of PVC, and even in the pharmaceutical field as the coatings for some medications.[62, 69, 80-82] Phthalates are not chemically bound to the plastic polymer, which is why they leach or outgas so easily into the surrounding environment.[69]
Plastics can contain by weight up to 50% fillers, reinforcements, and additives. Many laboratory studies link two of the most common and well-known plastic additives—bisphenol A (BPA) and phthalates—to hormone interference and endocrine disruption in wildlife as well as in humans.

25
Additives like BPA, phthalates, PBDEs, and nonylphenol can leach out of plastics at different rates depending on environmental conditions.[7, 62] For example, polycarbonate plastics (very hard plastic used in glass coatings, the automotive industry, and in older multi-use water bottles) leach BPA at an accelerated rate when exposed to the salts in seawater, especially at warm temperatures.[83] As plastics become more brittle and begin to breakdown into smaller pieces in the environment, more surface area is exposed, allowing for more leaching to occur. However, plastics are not the only source of these chemicals in the marine environment; for example, BPA also leaches from epoxy resins, millions of gallons of which are used each year to seal the hulls of ships to protect them from rust and fouling organisms like barnacles.[84]
Although studies like the ones mentioned above confirm that plastics themselves do indeed leach chemicals as well as accumulate them from the environment (seawater and sediment), the rates and quantities being released are largely unknown and clearly vary due to a variety of factors such as plastic composition and environmental exposure. More research is needed to answer important management questions such as: which types of plastic leach the contaminants of greatest concern?
Endocrine Disruption
The endocrine system is made up of glands throughout the body (e.g., the hypothalamus, pituitary, thyroid, pancreas, adrenals, testes, ovaries) and the hormones that are made by the glands. These hormones (e.g., estrogen, testosterone, growth hormone, insulin, epinephrine and many more) travel through the bloodstream, acting as chemical messengers, regulating many critical bodily functions such as metabolism, blood sugar levels, reproductive function, development, and growth. Mammals, fish, birds, and many other living organisms have endocrine systems. An endocrine disrupting chemical is one that affects the normal functioning of the endocrine system by mimicking the behavior of normal hormones or blocking the effects of normal hormones. Endocrine disruption, especially over long periods of time, can have a broad range of consequences from abnormal growth, to delayed or inhibited reproductive function, to cancer. Regarding endocrine disrupters, the U.S. Environmental Protection Agency (EPA) states that “there is strong evidence that chemical exposure has been associated with adverse developmental and reproductive effects on fish and wildlife in particular locations.” There are known instances of human endocrine disruption; however, in general, the field of human endocrine disruption caused by exposure to environmentally released chemicals is not well understood.[85]
BPA is a common additive in hard polycarbonate plastics or coatings (food and beverage cans and containers coatings, CDs, DVDs, printer ink, medical equipment, etc); phthalates, a class of chemicals, are used as softening additives in a huge array of products including clothing, toys, hoses, personal care products, insulation, flooring, inflatable structures, health-care products (catheters, blood bags), pesticides, construction materials in the form of PVC, and even in the pharma-ceutical field as the coatings for some medications. (Photo credit: public domain)
26
3. Toxicology
Although the rates of release of potentially harmful chemicals into the ocean are not well understood, it is well known that chemicals are present in the ocean. There is ample evidence to show that plastic marine debris not only accumulates (adsorbs) chemical pollutants from the surrounding seawater and marine sediments but also leaches chemical pollutants that were added to the plastic during manufacturing. The fate of chemicals such as phthalates and BPA is of great importance because of their wide-spread use for decades and emerging evidence of their toxicological effects on wildlife. Both have been used for over 100 years and are produced worldwide at rates of more than 2.7 million metric tons a year for phthalates[86] and more than 2.5 million metric tons a year for BPA.[87] Below is a summary of the organisms and negative effects linked to exposure to phthalates and BPA. Studies to date have focused on well-known plastic additives like phthalates and BPA, but there are large gaps in information for less well-known additives. Likewise, many of the organisms which have been tested are commonly used in laboratory settings, but there are many types of organisms that have not yet been tested.
In rats, phthalates have been shown to cause functional, structural, and developmental impairments of the male reproductive system.[69, 82, 88, 88-91] Thus far in aquatic organisms, phthalate exposure in laboratory settings have been shown to have negative effects on marine tubeworms, marine mussels, and even some species of fish. Depending on the level of exposure, phthalates cause symptoms such as: decrease in fertilization, chromosomal aberrations, developmental issues, altered metabolic pathways, altered behavior, and even effects on community density and structure.[78]
BPA was originally developed by the medical industry in 1933 to be a synthetic estrogen, but was soon replaced by another more effective synthetic estrogen in 1938.[69, 78] In the 1950s, a new use for BPA was discovered when a chemist combined BPA and phosgene to produce polycarbonate plastic.[78] Therefore, although originally invented as a synthetic estrogen, BPA’s primary commercial application since 1950 has been in the plastic industry. Although the public and the media’s attention have only recently focused on BPA as an endocrine disrupter, forcing many manufacturers to create BPA-free water and baby bottles, knowing the history of BPA’s original purpose as a synthetic estrogen makes these recent events seem inevitable and almost surprisingly delayed. Since the 1930s, multiple studies showed the ability of BPA to mimic natural hormones, and, at elevated levels, to cause various adverse effects in rats, including altered development, reduced survival, lowered birth rate, and delayed onset of puberty.[69]
To date, BPA has been shown to have effects on the following aquatic organisms: freshwater ramshorn snails, marine mussels, marine copepods, carp, and cod.[78] Depending on the level of exposure, BPA can cause altered juvenile development, alterations of sex steroids, superfeminization (additional sex organs and sex gland enlargement), increased female mortality, induced spawning in both sexes, damaged ovarian follicles, and alterations in the biochemistry of cell growth, embryogensis, and the immune system.[78] Studies of BPA and phthalates have also found a variety of effects on terrestrial species, especially amphibians.[78] Given the fact that many of these effects are documented in wildlife at environmentally relevant concentrations, researchers believe that it is probable that population level effects are occurring, especially for highly exposed and highly vulnerable species.[78] Population level effects (decrease in birth rate, increase in death rate, prevalence of disease, population decline) can occur when a pollutant affects enough individuals in a population.
Although originally developed by the medical industry in the 1930s, BPA’s primary commercial application since 1950 has been in the plastic industry.
27
Although BPA and phthalates are discussed primarily in this report, studies do exist for other plastic additives like polybrominated diphenyl ethers (PBDEs), which are commonly used as flame-retardant coatings. Studies in rats show that PBDEs can cause endocrine-disrupting effects on the thyroid and reproductive system and neurological abnormalities (especially in rats exposed during periods of early brain development).[82] Since there are so many additives used in plastic, more research is needed to determine which additives have toxicological effects, at what concentrations, and what types of organisms are most vulnerable.
Plastics and Human Health
The effects on humans of plastics and the chemicals pollutants associated with them are outside of the scope of this report. It should be noted, however, that although humans commonly see themselves as quite separate from wildlife, humans, in fact, share a great deal of biochemistry with many organisms, including invertebrates like marine mussels and worms. This is why many of the same documented toxicological effects in wildlife are subsequently documented in humans; many effects of DDT were first noted in wildlife and only later identified in humans. However, not all chemicals that have toxicological effects in wildlife have effects in humans, and even the chemicals that have effects in wildlife and humans may not have the same effects in both groups due to differences in exposure and variations in the way biological systems metabolize chemicals. It cannot be assumed, therefore, that the toxicological effects on wildlife will have similar effects on humans. Proven toxicological effects on wildlife, however, can raise red flags and certainly warrant additional studies to ascertain if there are indeed any human health concerns.
Since the late 1990s, studies have detected measurable levels of BPA in humans around the globe, including 93% of the U.S. population.[69] Many studies have indicated that food and drinks seem to be the main pathway of exposure for people.[67, 69, 79, 82] Some studies have focused specifically on the levels of phthalates in human neonates hospitalized in intensive care units who are exposed to phthalates in catheters, blood-bags, nasogastric and intravenous tubes.[82, 92] Some isolated and very recent studies have linked exposure to various endocrine-disrupting chemicals to cancer, decreased human sperm count, increased frequency of male reproductive abnormalities, and the growing trend of early onset puberty in females.[82] Further biological and epidemiological studies are needed to investigate the health risks of the human body burden of BPA, other endocrine-disrupting chemicals, and other plastic additives. For more information on plastics and human health, see the recent review papers of Meeker et al., 2009; Koch and Calafat, 2009; and Talsness et al., 2009.
For some governments, the existing data (however inconclusive) has warranted a precautionary approach when it comes to certain endocrine-disrupting chemicals. In 1997, the endocrine-disrupting potential of BPA became of concern in Japan, and as a result, most food and beverage can manufacturing companies in Japan eliminated BPA from interior can coatings. A study of Japanese students conducted before and after 1997 found a significant reduction in the body burden of BPA in the students.[93] Due to the proven toxicological effects of BPA on wildlife, in September 2010 the Canadian government became the first government officially to declare BPA a toxin to the environment and human health by adding BPA to the list of toxic substances under the Canadian Environmental Protection Act.[94] Canada and the European Union banned the use of BPA in baby bottles beginning in 2011.[95; 96]
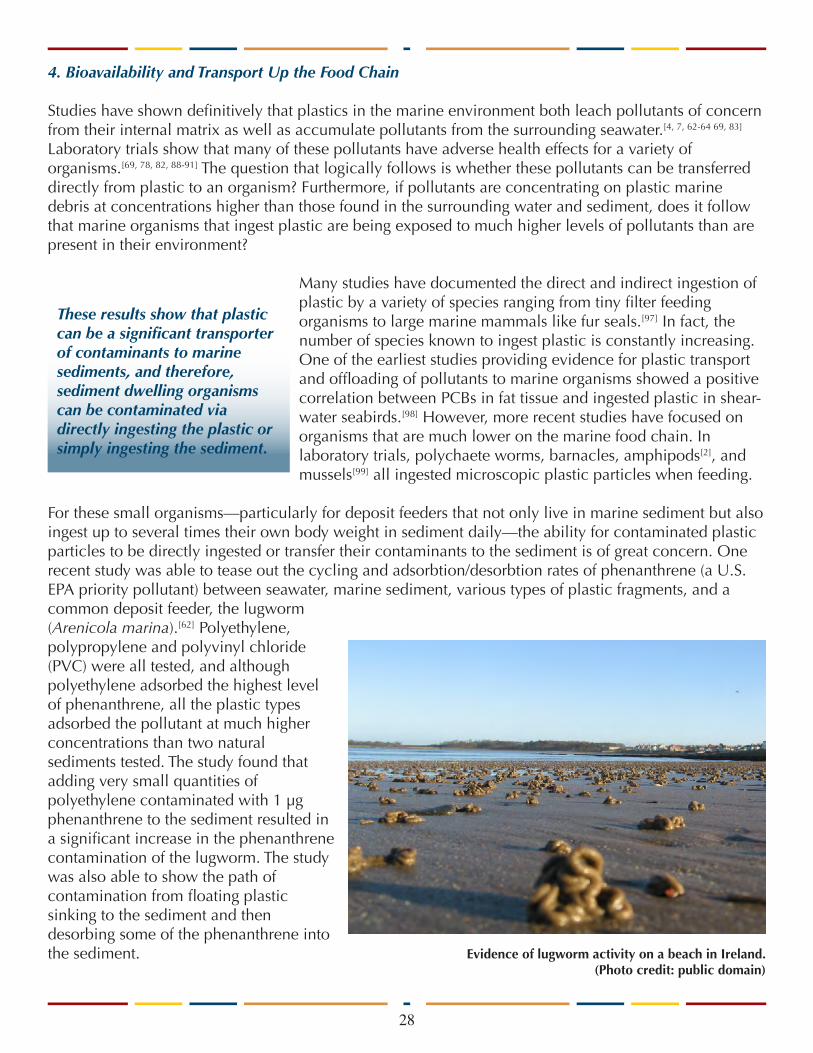
28
4. Bioavailability and Transport Up the Food Chain
Studies have shown definitively that plastics in the marine environment both leach pollutants of concern from their internal matrix as well as accumulate pollutants from the surrounding seawater.[4, 7, 62-64 69, 83] Laboratory trials show that many of these pollutants have adverse health effects for a variety of organisms.[69, 78, 82, 88-91] The question that logically follows is whether these pollutants can be transferred directly from plastic to an organism? Furthermore, if pollutants are concentrating on plastic marine debris at concentrations higher than those found in the surrounding water and sediment, does it follow that marine organisms that ingest plastic are being exposed to much higher levels of pollutants than are present in their environment?
Many studies have documented the direct and indirect ingestion of plastic by a variety of species ranging from tiny filter feeding organisms to large marine mammals like fur seals.[97] In fact, the number of species known to ingest plastic is constantly increasing. One of the earliest studies providing evidence for plastic transport and offloading of pollutants to marine organisms showed a positive correlation between PCBs in fat tissue and ingested plastic in shear-water seabirds.[98] However, more recent studies have focused on organisms that are much lower on the marine food chain. In laboratory trials, polychaete worms, barnacles, amphipods[2], and mussels[99] all ingested microscopic plastic particles when feeding.
For these small organisms—particularly for deposit feeders that not only live in marine sediment but also ingest up to several times their own body weight in sediment daily—the ability for contaminated plastic particles to be directly ingested or transfer their contaminants to the sediment is of great concern. One recent study was able to tease out the cycling and adsorbtion/desorbtion rates of phenanthrene (a U.S. EPA priority pollutant) between seawater, marine sediment, various types of plastic fragments, and a common deposit feeder, the lugworm (Arenicola marina).[62] Polyethylene, polypropylene and polyvinyl chloride (PVC) were all tested, and although polyethylene adsorbed the highest level of phenanthrene, all the plastic types adsorbed the pollutant at much higher concentrations than two natural sediments tested. The study found that adding very small quantities of polyethylene contaminated with 1 μg phenanthrene to the sediment resulted in a significant increase in the phenanthrene contamination of the lugworm. The study was also able to show the path of contamination from floating plastic sinking to the sediment and then desorbing some of the phenanthrene into the sediment. Evidence of lugworm activity on a beach in Ireland.
(Photo credit: public domain)
These results show that plastic can be a significant transporter of contaminants to marine sediments, and therefore, sediment dwelling organisms can be contaminated via directly ingesting the plastic or simply ingesting the sediment.
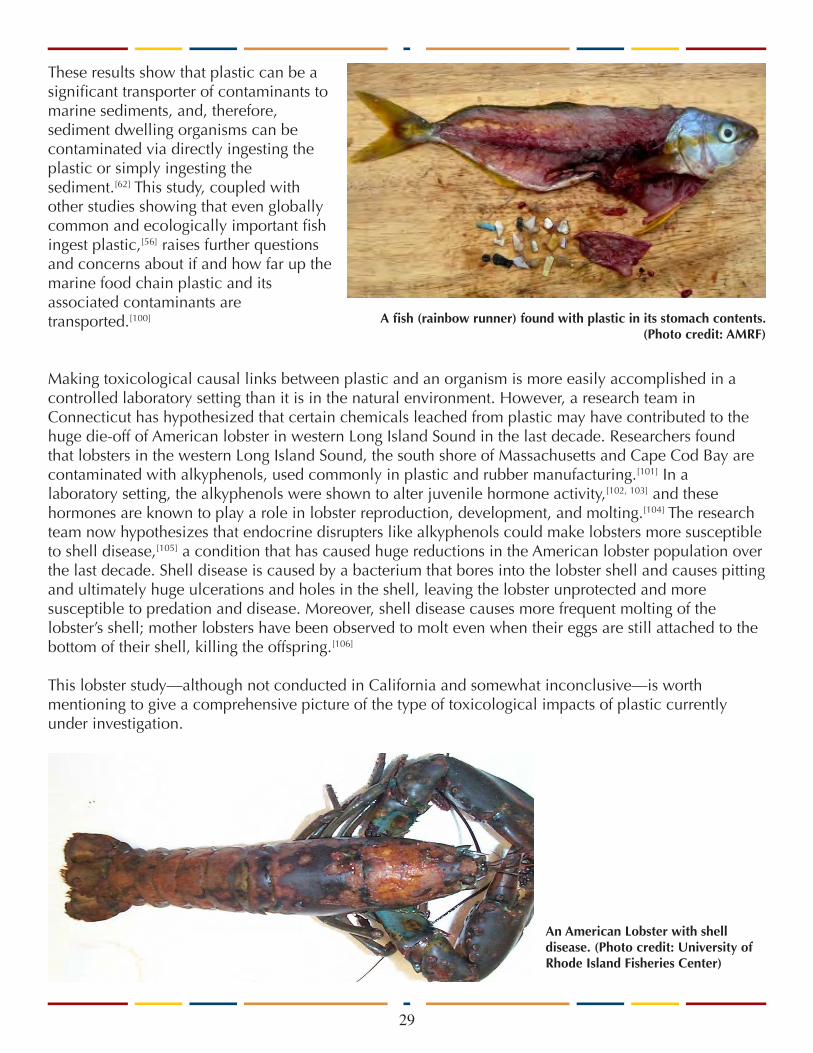
29
These results show that plastic can be a significant transporter of contaminants to marine sediments, and, therefore, sediment dwelling organisms can be contaminated via directly ingesting the plastic or simply ingesting the sediment.[62] This study, coupled with other studies showing that even globally common and ecologically important fish ingest plastic,[56] raises further questions and concerns about if and how far up the marine food chain plastic and its associated contaminants are transported.[100]
Making toxicological causal links between plastic and an organism is more easily accomplished in a controlled laboratory setting than it is in the natural environment. However, a research team in Connecticut has hypothesized that certain chemicals leached from plastic may have contributed to the huge die-off of American lobster in western Long Island Sound in the last decade. Researchers found that lobsters in the western Long Island Sound, the south shore of Massachusetts and Cape Cod Bay are contaminated with alkyphenols, used commonly in plastic and rubber manufacturing.[101] In a laboratory setting, the alkyphenols were shown to alter juvenile hormone activity,[102, 103] and these hormones are known to play a role in lobster reproduction, development, and molting.[104] The research team now hypothesizes that endocrine disrupters like alkyphenols could make lobsters more susceptible to shell disease,[105] a condition that has caused huge reductions in the American lobster population over the last decade. Shell disease is caused by a bacterium that bores into the lobster shell and causes pitting and ultimately huge ulcerations and holes in the shell, leaving the lobster unprotected and more susceptible to predation and disease. Moreover, shell disease causes more frequent molting of the lobster’s shell; mother lobsters have been observed to molt even when their eggs are still attached to the bottom of their shell, killing the offspring.[106]
This lobster study—although not conducted in California and somewhat inconclusive—is worth mentioning to give a comprehensive picture of the type of toxicological impacts of plastic currently under investigation.
A fish (rainbow runner) found with plastic in its stomach contents. (Photo credit: AMRF)
An American Lobster with shell disease. (Photo credit: University of Rhode Island Fisheries Center)

30
C. Transport of Alien Species
One relatively new concern in the scientific community is the ability of invasive species to use floating plastic debris as transport devices. The U.S. EPA’s definition of an invasive species is “a plant or animal that is non-native (or alien) to an ecosystem, and whose introduction is likely to cause economic, human health, or environmental damage in that ecosystem; once established, it is extremely difficult to control their spread.”[107] One of the most well-known invasive species in the United States is the aquatic zebra mussel, which was inadvertently introduced into Lake St. Clair (at the border of Michigan and Canada) in 1988 and subsequently spread throughout the Great Lakes as well as other inland lakes, rivers, and canals. Zebra mussels have almost completely eliminated the native clam population in that area and drastically reduced the food source for many other species, in turn causing ecological concerns for many other native species. Economically, the U.S. Fish and Wildlife Service estimates that zebra mussel impacts have been in the billions of dollars as they have caused severe problems at power plants and municipal water supplies by clogging pipes.[108] California had its own scare in 2000 with an aggressive invasive species of tropical marine algae called Caulerpa taxifola that also spread to southern Australia, as well as to the Mediterranean Sea. In the Mediterranean, action was not taken quickly enough and Caulerpa has since become too widespread to eradicate. It has caused tremendous ecological and economic impacts to European fisheries and tourism.[109] California and southern Australia are currently spending millions of dollars attempting to eradicate this seaweed to avoid the same fate. Although Caulerpa and zebra mussels were not spread by plastic marine debris, these infamous examples demonstrate why scientists and managers are very concerned about the spread of aggressive invasive species.
Invasive species have traditionally spread via direct human introduction, transportation via ships or naturally floating debris like wood. Some scientists believe that the large and growing presence of human debris, particularly durable and buoyant plastic, more than doubles the rafting opportunities for organisms[3, 110] by providing an ideal vector for the dispersal of organisms (bryozoans, barnacles, polychaete worms, hydroids, coralline algae, and mollusks) across great distances in the ocean.[47, 111, 112] Table 5 lists a number of documented examples of invasive species transported via plastic debris.
Encrusting invertebrates such as bryzoans, barnacles, polychaete worms, hydroids, coralline algae, and mollusks that adhere to plastic containers may be transported over long distances. (Photo credit: Lindsey Hoshaw, AMRF)
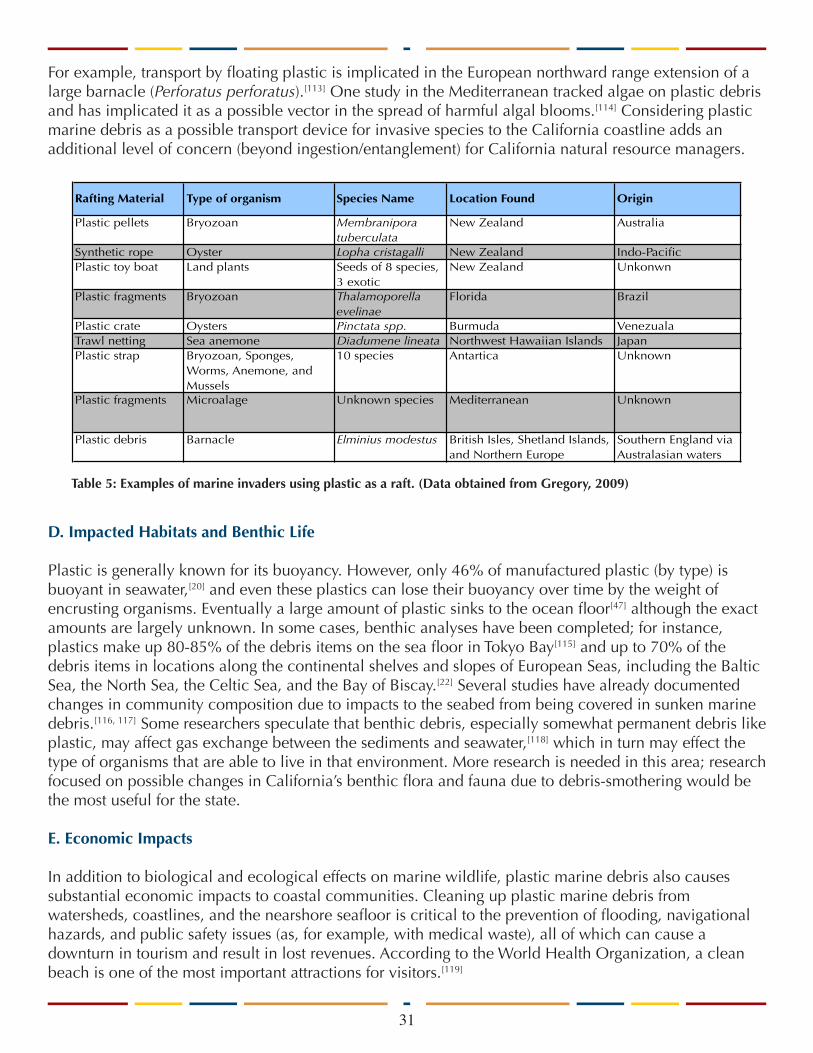
31
For example, transport by floating plastic is implicated in the European northward range extension of a large barnacle (Perforatus perforatus).[113] One study in the Mediterranean tracked algae on plastic debris and has implicated it as a possible vector in the spread of harmful algal blooms.[114] Considering plastic marine debris as a possible transport device for invasive species to the California coastline adds an additional level of concern (beyond ingestion/entanglement) for California natural resource managers.
D. Impacted Habitats and Benthic Life
Plastic is generally known for its buoyancy. However, only 46% of manufactured plastic (by type) is buoyant in seawater,[20] and even these plastics can lose their buoyancy over time by the weight of encrusting organisms. Eventually a large amount of plastic sinks to the ocean floor[47] although the exact amounts are largely unknown. In some cases, benthic analyses have been completed; for instance, plastics make up 80-85% of the debris items on the sea floor in Tokyo Bay[115] and up to 70% of the debris items in locations along the continental shelves and slopes of European Seas, including the Baltic Sea, the North Sea, the Celtic Sea, and the Bay of Biscay.[22] Several studies have already documented changes in community composition due to impacts to the seabed from being covered in sunken marine debris.[116, 117] Some researchers speculate that benthic debris, especially somewhat permanent debris like plastic, may affect gas exchange between the sediments and seawater,[118] which in turn may effect the type of organisms that are able to live in that environment. More research is needed in this area; research focused on possible changes in California’s benthic flora and fauna due to debris-smothering would be the most useful for the state.
E. Economic Impacts
In addition to biological and ecological effects on marine wildlife, plastic marine debris also causes substantial economic impacts to coastal communities. Cleaning up plastic marine debris from watersheds, coastlines, and the nearshore seafloor is critical to the prevention of flooding, navigational hazards, and public safety issues (as, for example, with medical waste), all of which can cause a downturn in tourism and result in lost revenues. According to the World Health Organization, a clean beach is one of the most important attractions for visitors.[119]
Table 5: Examples of marine invaders using plastic as a raft. (Data obtained from Gregory, 2009)
Rafting Material Type of organism Species Name Location Found Origin
Plastic pellets Bryozoan Membranipora tuberculata
New Zealand Australia
Synthetic rope Oyster Lopha cristagalli New Zealand Indo-PacificPlastic toy boat Land plants Seeds of 8 species,
3 exoticNew Zealand Unkonwn
Plastic fragments Bryozoan Thalamoporella evelinae
Florida Brazil
Plastic crate Oysters Pinctata spp. Burmuda VenezualaTrawl netting Sea anemone Diadumene lineata Northwest Hawaiian Islands JapanPlastic strap Bryozoan, Sponges,
Worms, Anemone, and Mussels
10 species Antartica Unknown
Plastic fragments Microalage Unknown species Mediterranean Unknown
Plastic debris Barnacle Elminius modestus British Isles, Shetland Islands, and Northern Europe
Southern England via Australasian waters
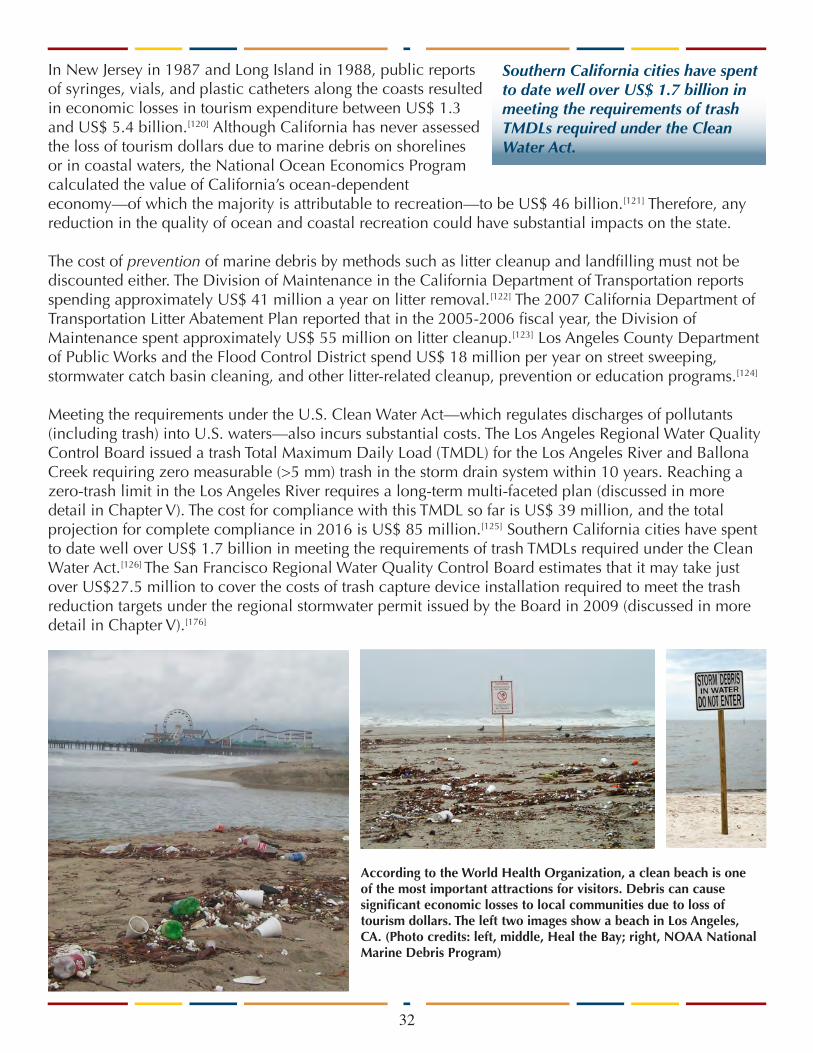
32
In New Jersey in 1987 and Long Island in 1988, public reports of syringes, vials, and plastic catheters along the coasts resulted in economic losses in tourism expenditure between US$ 1.3 and US$ 5.4 billion.[120] Although California has never assessed the loss of tourism dollars due to marine debris on shorelines or in coastal waters, the National Ocean Economics Program calculated the value of California’s ocean-dependent economy—of which the majority is attributable to recreation—to be US$ 46 billion.[121] Therefore, any reduction in the quality of ocean and coastal recreation could have substantial impacts on the state.
The cost of prevention of marine debris by methods such as litter cleanup and landfilling must not be discounted either. The Division of Maintenance in the California Department of Transportation reports spending approximately US$ 41 million a year on litter removal.[122] The 2007 California Department of Transportation Litter Abatement Plan reported that in the 2005-2006 fiscal year, the Division of Maintenance spent approximately US$ 55 million on litter cleanup.[123] Los Angeles County Department of Public Works and the Flood Control District spend US$ 18 million per year on street sweeping, stormwater catch basin cleaning, and other litter-related cleanup, prevention or education programs.[124]
Meeting the requirements under the U.S. Clean Water Act—which regulates discharges of pollutants (including trash) into U.S. waters—also incurs substantial costs. The Los Angeles Regional Water Quality Control Board issued a trash Total Maximum Daily Load (TMDL) for the Los Angeles River and Ballona Creek requiring zero measurable (>5 mm) trash in the storm drain system within 10 years. Reaching a zero-trash limit in the Los Angeles River requires a long-term multi-faceted plan (discussed in more detail in Chapter V). The cost for compliance with this TMDL so far is US$ 39 million, and the total projection for complete compliance in 2016 is US$ 85 million.[125] Southern California cities have spent to date well over US$ 1.7 billion in meeting the requirements of trash TMDLs required under the Clean Water Act.[126] The San Francisco Regional Water Quality Control Board estimates that it may take just over US$27.5 million to cover the costs of trash capture device installation required to meet the trash reduction targets under the regional stormwater permit issued by the Board in 2009 (discussed in more detail in Chapter V).[176]
According to the World Health Organization, a clean beach is one of the most important attractions for visitors. Debris can cause significant economic losses to local communities due to loss of tourism dollars. The left two images show a beach in Los Angeles, CA. (Photo credits: left, middle, Heal the Bay; right, NOAA National Marine Debris Program)
Southern California cities have spent to date well over US$ 1.7 billion in meeting the requirements of trash TMDLs required under the Clean Water Act.
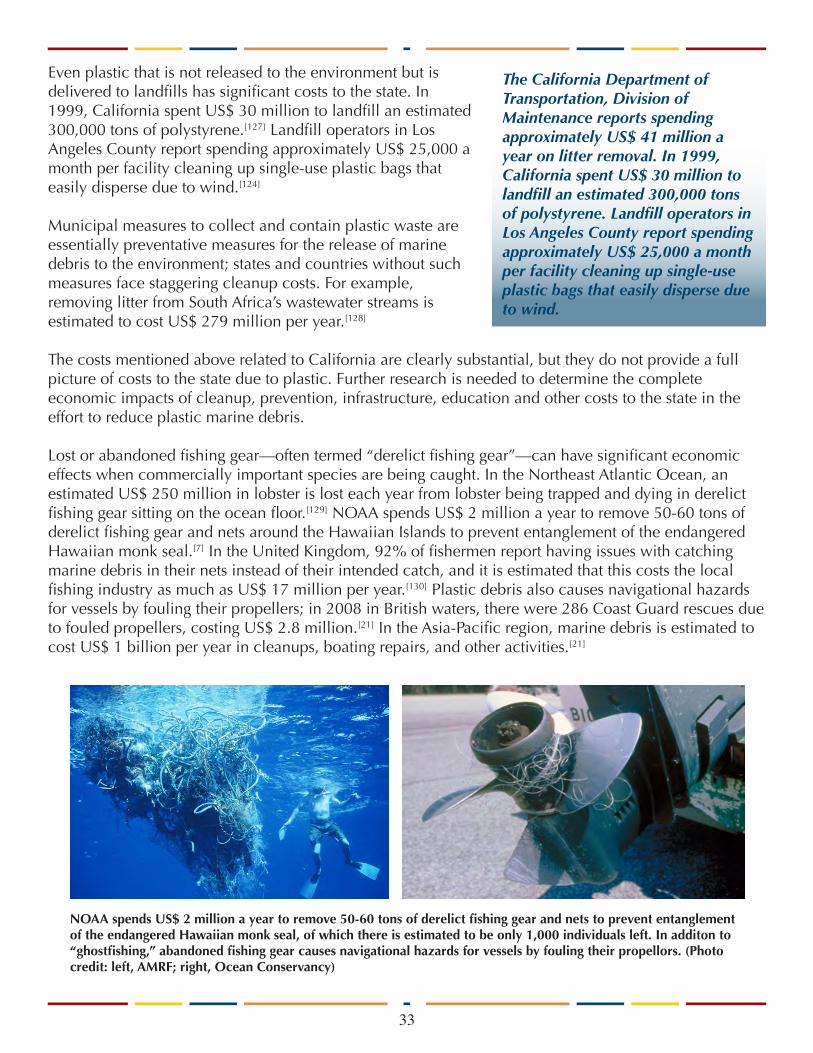
33
Even plastic that is not released to the environment but is delivered to landfills has significant costs to the state. In 1999, California spent US$ 30 million to landfill an estimated 300,000 tons of polystyrene.[127] Landfill operators in Los Angeles County report spending approximately US$ 25,000 a month per facility cleaning up single-use plastic bags that easily disperse due to wind.[124]
Municipal measures to collect and contain plastic waste are essentially preventative measures for the release of marine debris to the environment; states and countries without such measures face staggering cleanup costs. For example, removing litter from South Africa’s wastewater streams is estimated to cost US$ 279 million per year.[128]
The costs mentioned above related to California are clearly substantial, but they do not provide a full picture of costs to the state due to plastic. Further research is needed to determine the complete economic impacts of cleanup, prevention, infrastructure, education and other costs to the state in the effort to reduce plastic marine debris.
Lost or abandoned fishing gear—often termed “derelict fishing gear”—can have significant economic effects when commercially important species are being caught. In the Northeast Atlantic Ocean, an estimated US$ 250 million in lobster is lost each year from lobster being trapped and dying in derelict fishing gear sitting on the ocean floor.[129] NOAA spends US$ 2 million a year to remove 50-60 tons of derelict fishing gear and nets around the Hawaiian Islands to prevent entanglement of the endangered Hawaiian monk seal.[7] In the United Kingdom, 92% of fishermen report having issues with catching marine debris in their nets instead of their intended catch, and it is estimated that this costs the local fishing industry as much as US$ 17 million per year.[130] Plastic debris also causes navigational hazards for vessels by fouling their propellers; in 2008 in British waters, there were 286 Coast Guard rescues due to fouled propellers, costing US$ 2.8 million.[21] In the Asia-Pacific region, marine debris is estimated to cost US$ 1 billion per year in cleanups, boating repairs, and other activities.[21]
NOAA spends US$ 2 million a year to remove 50-60 tons of derelict fishing gear and nets to prevent entanglement of the endangered Hawaiian monk seal, of which there is estimated to be only 1,000 individuals left. In additon to “ghostfishing,” abandoned fishing gear causes navigational hazards for vessels by fouling their propellors. (Photo credit: left, AMRF; right, Ocean Conservancy)
The California Department of Transportation, Division of Maintenance reports spending approximately US$ 41 million a year on litter removal. In 1999, California spent US$ 30 million to landfill an estimated 300,000 tons of polystyrene. Landfill operators in Los Angeles County report spending approximately US$ 25,000 a month per facility cleaning up single-use plastic bags that easily disperse due to wind.

34
This chapter focuses on solutions which are ongoing or developing in California, as well as major solutions in use in other parts of the world. It is not within the scope of this report to provide a comprehensive list of solutions or policy recommendations for the state. Therefore, this chapter should be read as informational, and although it may report on some successes or challenges facing various solution types, it is not an endorsement or criticism of any of these solutions or policies for the state of California.
A. Cleanup and Recovery
1. Organized Cleanup Efforts
Whether in watersheds, along coastlines, on the sea surface, in the water column, or on the seafloor, plastic marine debris can continue to harm wildlife and the marine environment until it is removed. Efforts like the volunteer-based International Coastal Cleanup Day (CCD)—which began in 1986 and is organized in California by the California Coastal Commission (CCC)—are invaluable for the geographical expanse that is covered and the amount of work that is done on a single day. In 2009, volunteers collected over 3.6 million pounds (1,636 metric tons) of debris nationwide on CCD. Over 1.6 million pounds (727 metric tons)—almost half of the national total—was collected in California alone.[30] In 2010, California still led the way among states claiming just under 1.4 million pounds (636 metric tons) of the 4.3 million pounds (1,934 metric tons) collected nationally.[28] These data are described in more detail in Chapter II of this report.
2. Energy Recovery
Describing the pros and cons of the transformation of waste-to-energy are beyond the scope of this report. However, it is worth noting that some programs and countries have begun to create energy from incinerating plastic waste. Some countries like Japan, Denmark and Sweden have more advanced infrastructure designed to deal with incinerating large amounts of municipal solid waste, including plastics.[6] Without appropriate infrastructure, incineration of mixed plastic wastes can release hazardous chemicals such as dioxins, PCBs, and furans into the environment.[131]
In Hawaii, the “Nets to Energy Program and Part-nership” transports plastic fishing nets collected at all NOAA marine debris cleanups to the Schnitzer Steel Hawai’i Corporation where the nets are chopped into small pieces suitable for combustion. The pulverized nets are burned at the Honolulu’s H-Power facility, producing steam, which drives a turbine and creates usable electricity.[132] Catalyzed by the success of this Hawaiian program and partnership, the NOAA Marine Debris Program, the National Fish and Wildlife Foundation, and Covanta Energy Corporation formed a partnership in 2008 called the “Fishing for Energy Program.”[133]
V. Solutions: Types, Successes and Challenges
International Coastal Cleanup Day. (Photo credit: Ocean Conservancy)
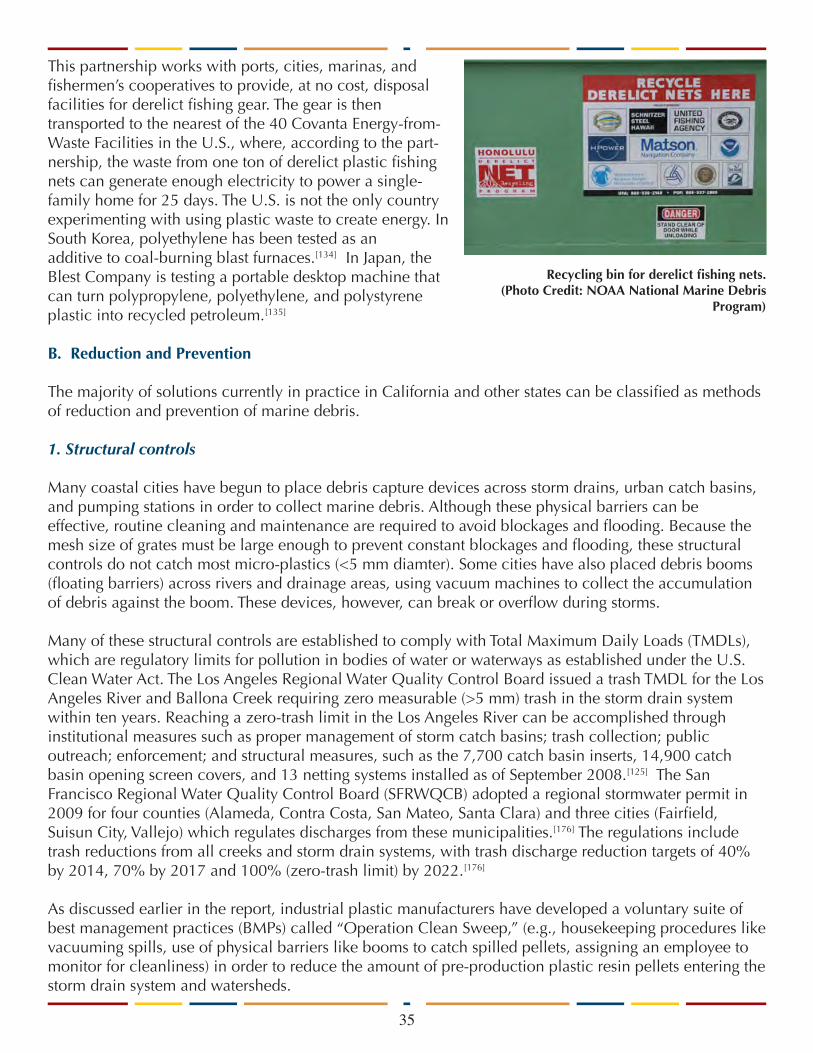
35
This partnership works with ports, cities, marinas, and fishermen’s cooperatives to provide, at no cost, disposal facilities for derelict fishing gear. The gear is then transported to the nearest of the 40 Covanta Energy-from-Waste Facilities in the U.S., where, according to the part-nership, the waste from one ton of derelict plastic fishing nets can generate enough electricity to power a single-family home for 25 days. The U.S. is not the only country experimenting with using plastic waste to create energy. In South Korea, polyethylene has been tested as an additive to coal-burning blast furnaces.[134] In Japan, the Blest Company is testing a portable desktop machine that can turn polypropylene, polyethylene, and polystyrene plastic into recycled petroleum.[135]
B. Reduction and Prevention
The majority of solutions currently in practice in California and other states can be classified as methods of reduction and prevention of marine debris.
1. Structural controls
Many coastal cities have begun to place debris capture devices across storm drains, urban catch basins, and pumping stations in order to collect marine debris. Although these physical barriers can be effective, routine cleaning and maintenance are required to avoid blockages and flooding. Because the mesh size of grates must be large enough to prevent constant blockages and flooding, these structural controls do not catch most micro-plastics (<5 mm diamter). Some cities have also placed debris booms (floating barriers) across rivers and drainage areas, using vacuum machines to collect the accumulation of debris against the boom. These devices, however, can break or overflow during storms.
Many of these structural controls are established to comply with Total Maximum Daily Loads (TMDLs), which are regulatory limits for pollution in bodies of water or waterways as established under the U.S. Clean Water Act. The Los Angeles Regional Water Quality Control Board issued a trash TMDL for the Los Angeles River and Ballona Creek requiring zero measurable (>5 mm) trash in the storm drain system within ten years. Reaching a zero-trash limit in the Los Angeles River can be accomplished through institutional measures such as proper management of storm catch basins; trash collection; public outreach; enforcement; and structural measures, such as the 7,700 catch basin inserts, 14,900 catch basin opening screen covers, and 13 netting systems installed as of September 2008.[125] The San Francisco Regional Water Quality Control Board (SFRWQCB) adopted a regional stormwater permit in 2009 for four counties (Alameda, Contra Costa, San Mateo, Santa Clara) and three cities (Fairfield, Suisun City, Vallejo) which regulates discharges from these municipalities.[176] The regulations include trash reductions from all creeks and storm drain systems, with trash discharge reduction targets of 40% by 2014, 70% by 2017 and 100% (zero-trash limit) by 2022.[176]
As discussed earlier in the report, industrial plastic manufacturers have developed a voluntary suite of best management practices (BMPs) called “Operation Clean Sweep,” (e.g., housekeeping procedures like vacuuming spills, use of physical barriers like booms to catch spilled pellets, assigning an employee to monitor for cleanliness) in order to reduce the amount of pre-production plastic resin pellets entering the storm drain system and watersheds.
Recycling bin for derelict fishing nets. (Photo Credit: NOAA National Marine Debris
Program)
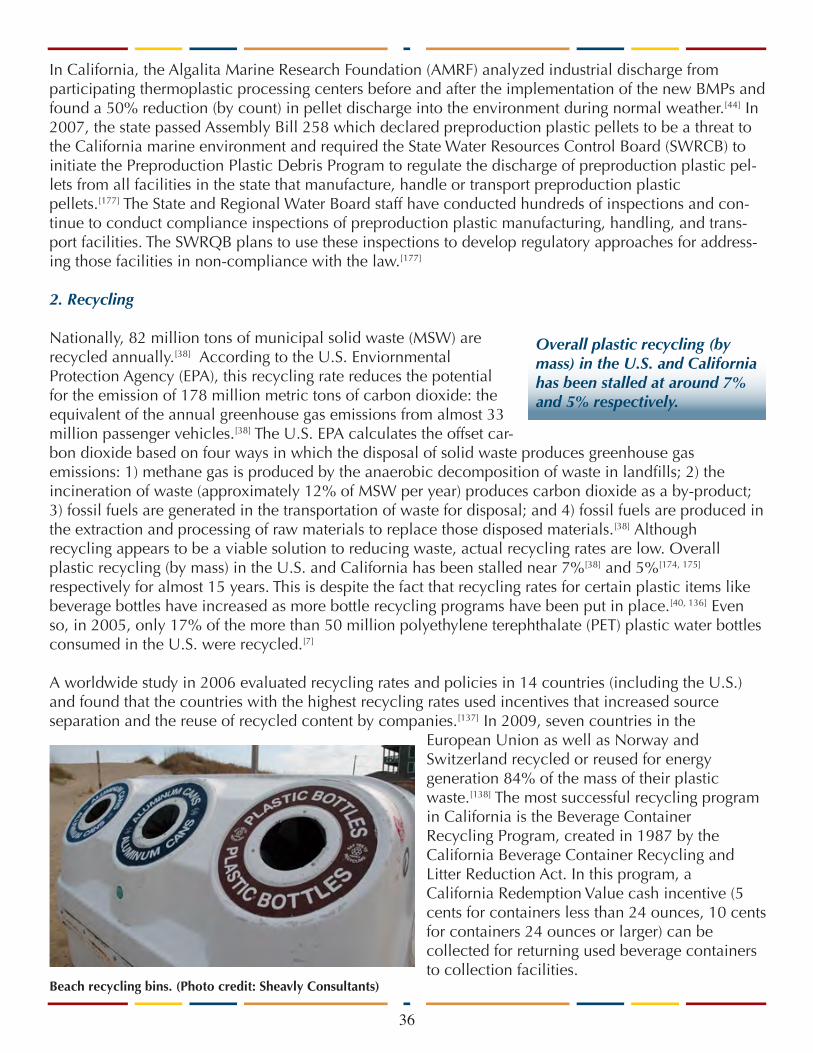
36
In California, the Algalita Marine Research Foundation (AMRF) analyzed industrial discharge from participating thermoplastic processing centers before and after the implementation of the new BMPs and found a 50% reduction (by count) in pellet discharge into the environment during normal weather.[44] In 2007, the state passed Assembly Bill 258 which declared preproduction plastic pellets to be a threat to the California marine environment and required the State Water Resources Control Board (SWRCB) to initiate the Preproduction Plastic Debris Program to regulate the discharge of preproduction plastic pel-lets from all facilities in the state that manufacture, handle or transport preproduction plastic pellets.[177] The State and Regional Water Board staff have conducted hundreds of inspections and con-tinue to conduct compliance inspections of preproduction plastic manufacturing, handling, and trans-port facilities. The SWRQB plans to use these inspections to develop regulatory approaches for address-ing those facilities in non-compliance with the law.[177]
2. Recycling
Nationally, 82 million tons of municipal solid waste (MSW) are recycled annually.[38] According to the U.S. Enviornmental Protection Agency (EPA), this recycling rate reduces the potential for the emission of 178 million metric tons of carbon dioxide: the equivalent of the annual greenhouse gas emissions from almost 33 million passenger vehicles.[38] The U.S. EPA calculates the offset car-bon dioxide based on four ways in which the disposal of solid waste produces greenhouse gas emissions: 1) methane gas is produced by the anaerobic decomposition of waste in landfills; 2) the incineration of waste (approximately 12% of MSW per year) produces carbon dioxide as a by-product; 3) fossil fuels are generated in the transportation of waste for disposal; and 4) fossil fuels are produced in the extraction and processing of raw materials to replace those disposed materials.[38] Although recycling appears to be a viable solution to reducing waste, actual recycling rates are low. Overall plastic recycling (by mass) in the U.S. and California has been stalled near 7%[38] and 5%[174, 175]
respectively for almost 15 years. This is despite the fact that recycling rates for certain plastic items like beverage bottles have increased as more bottle recycling programs have been put in place.[40, 136] Even so, in 2005, only 17% of the more than 50 million polyethylene terephthalate (PET) plastic water bottles consumed in the U.S. were recycled.[7]
A worldwide study in 2006 evaluated recycling rates and policies in 14 countries (including the U.S.) and found that the countries with the highest recycling rates used incentives that increased source separation and the reuse of recycled content by companies.[137] In 2009, seven countries in the
European Union as well as Norway and Switzerland recycled or reused for energy generation 84% of the mass of their plastic waste.[138] The most successful recycling program in California is the Beverage Container Recycling Program, created in 1987 by the California Beverage Container Recycling and Litter Reduction Act. In this program, a California Redemption Value cash incentive (5 cents for containers less than 24 ounces, 10 cents for containers 24 ounces or larger) can be collected for returning used beverage containers to collection facilities.
Beach recycling bins. (Photo credit: Sheavly Consultants)
Overall plastic recycling (by mass) in the U.S. and California has been stalled at around 7% and 5% respectively.

37
According to CalRecycle (officially known as the California Department of Resources, Recycling and Recovery), 230 billion aluminum, glass, and plastic beverage containers have been recycled since the beginning of the program.[139] In the most recent “Biannual Report of Beverage Container Sales, Returns, Redemption, and Recycling Rates,” California’s rate of beverage container recycling was 86%. Specifically, recycling rates for certain types of material, including plastic, were: aluminum (95%); glass (90%); #1 PET (74%); #2 HDPE (98%); #3 PVC (0%); #4 LDPE (1%); #5 PP (2%); #6 PS (8%); #7 other (12%); and bimetal (14%). Not all types of plastic are currently recycled successfully, but the rates for #1 and #2 plastics are high enough to indicate that with appropriate education, incentives, and collection facilities, higher rates of recycling for other types of plastics may be possible.
Even with improved rates of household and municipal recycling for all materials, there are still more issues to address with the physical processes, economics, infrastructure and policies regarding recycling. Using recycled materials, especially plastic, can be expensive and difficult from a product-quality standpoint. Post-consumer resin plastic can have lower quality mechanical properties due to contamination from other materials such as dirt, contaminants, labels and adhesives, and other plastic polymers.[140] Because washing is the most expensive step in the plastic recycling process,[140] the cost of recycled plastic material often exceed those of using virgin plastic material.[7] Economic incentives created by new legislation and policies, in addition to public education, may prove necessary in order to increase recycling rates in California. Nonetheless, California has or is in the process of developing and analyzing a number of ways (some legislative, some regulatory, some voluntary) in which to increase recycling in the state:
Rigid Plastic Container Program of California: Established by law and enforced by CayRecycle, the RPPC program requires that companies whose products are sold in California must be made of at least 25% post-consumer resin, be source-reduced (light-weighted) by 10%, reused or refilled at least 5 times, or have a recycling rate of at least 45%. However, because these options are technologically infeasible for certain types of containers, waivers are also available.[139]
California Trash Bag Recycled Content Act: California’s trash bag law requires plastic trash bag manufacturers to use a specific amount of plastic postconsumer material to produce the trash bags sold in California.[141]
Hospital Blue Wrap: CalRecycle is currently trying to coordinate and facilitate the recycling of sterile, uncontaminated hospital blue wrap (polypropylene, #5) which is used for wrapping surgical instruments for sterilization. Estimates from the Health Care Industry are that 20% of its waste stream is from surgical services, and much of this waste is actually clean blue wrap.[142]
Due to the California Beverage Container Recycling Program, in which a California Redemption Value cash incentive can be collected for returning used beverage containers to collection facilities, recycling rates of plastic bottles are high compared to other plastic products. However, plastic bottles are still a common debris item found on California Beaches. (Photo credit: Heal the Bay)
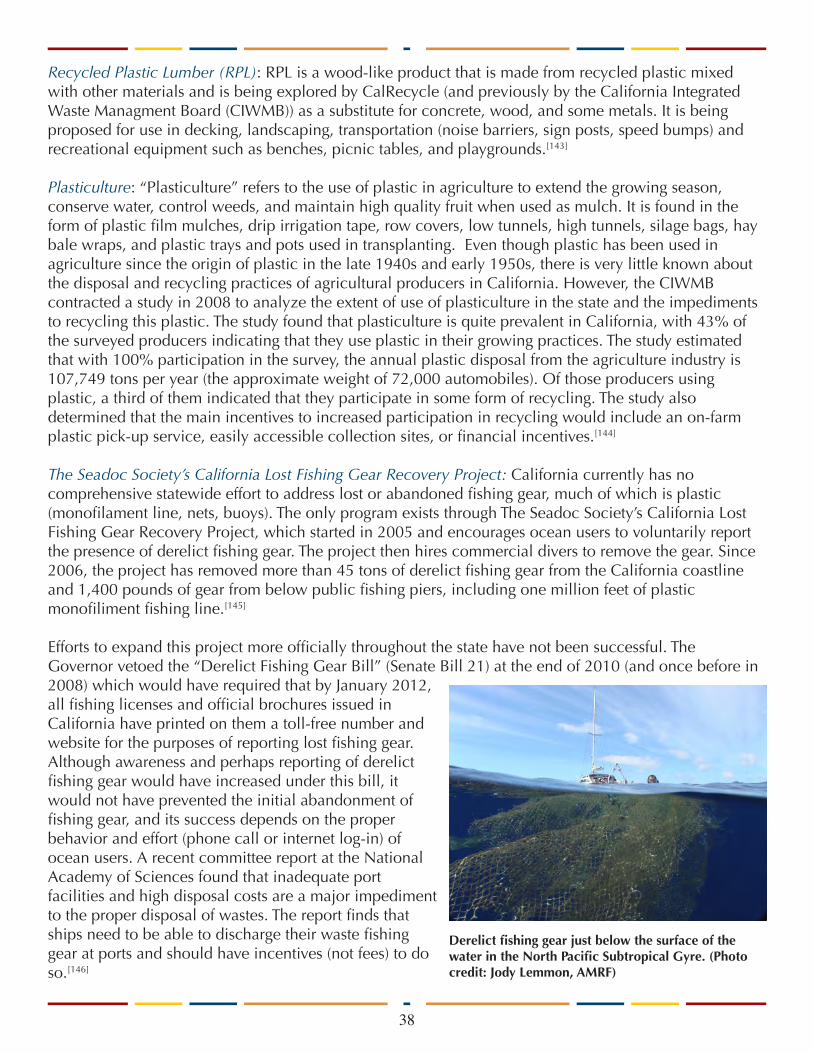
38
Recycled Plastic Lumber (RPL): RPL is a wood-like product that is made from recycled plastic mixed with other materials and is being explored by CalRecycle (and previously by the California Integrated Waste Managment Board (CIWMB)) as a substitute for concrete, wood, and some metals. It is being proposed for use in decking, landscaping, transportation (noise barriers, sign posts, speed bumps) and recreational equipment such as benches, picnic tables, and playgrounds.[143]
Plasticulture: “Plasticulture” refers to the use of plastic in agriculture to extend the growing season, conserve water, control weeds, and maintain high quality fruit when used as mulch. It is found in the form of plastic film mulches, drip irrigation tape, row covers, low tunnels, high tunnels, silage bags, hay bale wraps, and plastic trays and pots used in transplanting. Even though plastic has been used in agriculture since the origin of plastic in the late 1940s and early 1950s, there is very little known about the disposal and recycling practices of agricultural producers in California. However, the CIWMB contracted a study in 2008 to analyze the extent of use of plasticulture in the state and the impediments to recycling this plastic. The study found that plasticulture is quite prevalent in California, with 43% of the surveyed producers indicating that they use plastic in their growing practices. The study estimated that with 100% participation in the survey, the annual plastic disposal from the agriculture industry is 107,749 tons per year (the approximate weight of 72,000 automobiles). Of those producers using plastic, a third of them indicated that they participate in some form of recycling. The study also determined that the main incentives to increased participation in recycling would include an on-farm plastic pick-up service, easily accessible collection sites, or financial incentives.[144]
The Seadoc Society’s California Lost Fishing Gear Recovery Project: California currently has no comprehensive statewide effort to address lost or abandoned fishing gear, much of which is plastic (monofilament line, nets, buoys). The only program exists through The Seadoc Society’s California Lost Fishing Gear Recovery Project, which started in 2005 and encourages ocean users to voluntarily report the presence of derelict fishing gear. The project then hires commercial divers to remove the gear. Since 2006, the project has removed more than 45 tons of derelict fishing gear from the California coastline and 1,400 pounds of gear from below public fishing piers, including one million feet of plastic monofiliment fishing line.[145]
Efforts to expand this project more officially throughout the state have not been successful. The Governor vetoed the “Derelict Fishing Gear Bill” (Senate Bill 21) at the end of 2010 (and once before in 2008) which would have required that by January 2012, all fishing licenses and official brochures issued in California have printed on them a toll-free number and website for the purposes of reporting lost fishing gear. Although awareness and perhaps reporting of derelict fishing gear would have increased under this bill, it would not have prevented the initial abandonment of fishing gear, and its success depends on the proper behavior and effort (phone call or internet log-in) of ocean users. A recent committee report at the National Academy of Sciences found that inadequate port facilities and high disposal costs are a major impediment to the proper disposal of wastes. The report finds that ships need to be able to discharge their waste fishing gear at ports and should have incentives (not fees) to do so.[146]
Derelict fishing gear just below the surface of the water in the North Pacific Subtropical Gyre. (Photo credit: Jody Lemmon, AMRF)
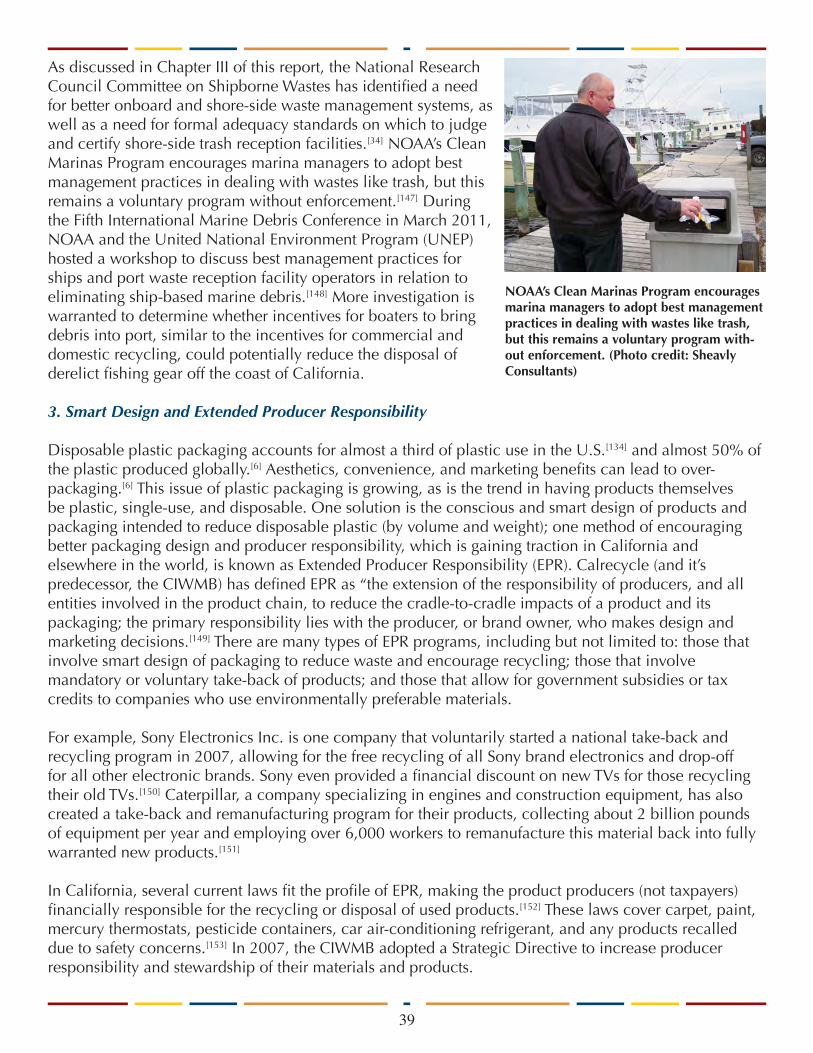
39
As discussed in Chapter III of this report, the National Research Council Committee on Shipborne Wastes has identified a need for better onboard and shore-side waste management systems, as well as a need for formal adequacy standards on which to judge and certify shore-side trash reception facilities.[34] NOAA’s Clean Marinas Program encourages marina managers to adopt best management practices in dealing with wastes like trash, but this remains a voluntary program without enforcement.[147] During the Fifth International Marine Debris Conference in March 2011, NOAA and the United National Environment Program (UNEP) hosted a workshop to discuss best management practices for ships and port waste reception facility operators in relation to eliminating ship-based marine debris.[148] More investigation is warranted to determine whether incentives for boaters to bring debris into port, similar to the incentives for commercial and domestic recycling, could potentially reduce the disposal of derelict fishing gear off the coast of California.
3. Smart Design and Extended Producer Responsibility
Disposable plastic packaging accounts for almost a third of plastic use in the U.S.[134] and almost 50% of the plastic produced globally.[6] Aesthetics, convenience, and marketing benefits can lead to over-packaging.[6] This issue of plastic packaging is growing, as is the trend in having products themselves be plastic, single-use, and disposable. One solution is the conscious and smart design of products and packaging intended to reduce disposable plastic (by volume and weight); one method of encouraging better packaging design and producer responsibility, which is gaining traction in California and elsewhere in the world, is known as Extended Producer Responsibility (EPR). Calrecycle (and it’s predecessor, the CIWMB) has defined EPR as “the extension of the responsibility of producers, and all entities involved in the product chain, to reduce the cradle-to-cradle impacts of a product and its packaging; the primary responsibility lies with the producer, or brand owner, who makes design and marketing decisions.[149] There are many types of EPR programs, including but not limited to: those that involve smart design of packaging to reduce waste and encourage recycling; those that involve mandatory or voluntary take-back of products; and those that allow for government subsidies or tax credits to companies who use environmentally preferable materials.
For example, Sony Electronics Inc. is one company that voluntarily started a national take-back and recycling program in 2007, allowing for the free recycling of all Sony brand electronics and drop-off for all other electronic brands. Sony even provided a financial discount on new TVs for those recycling their old TVs.[150] Caterpillar, a company specializing in engines and construction equipment, has also created a take-back and remanufacturing program for their products, collecting about 2 billion pounds of equipment per year and employing over 6,000 workers to remanufacture this material back into fully warranted new products.[151]
In California, several current laws fit the profile of EPR, making the product producers (not taxpayers) financially responsible for the recycling or disposal of used products.[152] These laws cover carpet, paint, mercury thermostats, pesticide containers, car air-conditioning refrigerant, and any products recalled due to safety concerns.[153] In 2007, the CIWMB adopted a Strategic Directive to increase producer responsibility and stewardship of their materials and products.
NOAA’s Clean Marinas Program encourages marina managers to adopt best management practices in dealing with wastes like trash, but this remains a voluntary program with-out enforcement. (Photo credit: Sheavly Consultants)
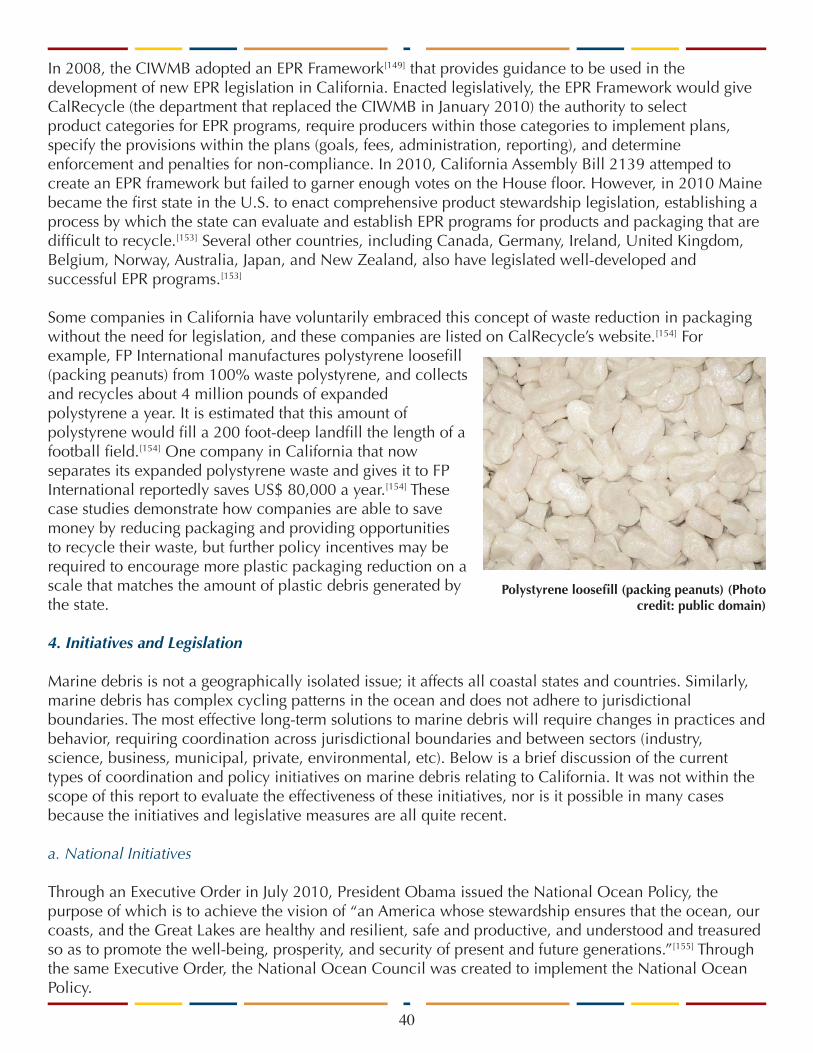
40
In 2008, the CIWMB adopted an EPR Framework[149] that provides guidance to be used in the development of new EPR legislation in California. Enacted legislatively, the EPR Framework would give CalRecycle (the department that replaced the CIWMB in January 2010) the authority to select product categories for EPR programs, require producers within those categories to implement plans, specify the provisions within the plans (goals, fees, administration, reporting), and determine enforcement and penalties for non-compliance. In 2010, California Assembly Bill 2139 attemped to create an EPR framework but failed to garner enough votes on the House floor. However, in 2010 Maine became the first state in the U.S. to enact comprehensive product stewardship legislation, establishing a process by which the state can evaluate and establish EPR programs for products and packaging that are difficult to recycle.[153] Several other countries, including Canada, Germany, Ireland, United Kingdom, Belgium, Norway, Australia, Japan, and New Zealand, also have legislated well-developed and successful EPR programs.[153]
Some companies in California have voluntarily embraced this concept of waste reduction in packaging without the need for legislation, and these companies are listed on CalRecycle’s website.[154] For example, FP International manufactures polystyrene loosefill (packing peanuts) from 100% waste polystyrene, and collects and recycles about 4 million pounds of expanded polystyrene a year. It is estimated that this amount of polystyrene would fill a 200 foot-deep landfill the length of a football field.[154] One company in California that now separates its expanded polystyrene waste and gives it to FP International reportedly saves US$ 80,000 a year.[154] These case studies demonstrate how companies are able to save money by reducing packaging and providing opportunities to recycle their waste, but further policy incentives may be required to encourage more plastic packaging reduction on a scale that matches the amount of plastic debris generated by the state.
4. Initiatives and Legislation
Marine debris is not a geographically isolated issue; it affects all coastal states and countries. Similarly, marine debris has complex cycling patterns in the ocean and does not adhere to jurisdictional boundaries. The most effective long-term solutions to marine debris will require changes in practices and behavior, requiring coordination across jurisdictional boundaries and between sectors (industry, science, business, municipal, private, environmental, etc). Below is a brief discussion of the current types of coordination and policy initiatives on marine debris relating to California. It was not within the scope of this report to evaluate the effectiveness of these initiatives, nor is it possible in many cases because the initiatives and legislative measures are all quite recent.
a. National Initiatives
Through an Executive Order in July 2010, President Obama issued the National Ocean Policy, the purpose of which is to achieve the vision of “an America whose stewardship ensures that the ocean, our coasts, and the Great Lakes are healthy and resilient, safe and productive, and understood and treasured so as to promote the well-being, prosperity, and security of present and future generations.”[155] Through the same Executive Order, the National Ocean Council was created to implement the National Ocean Policy.
Polystyrene loosefill (packing peanuts) (Photo credit: public domain)
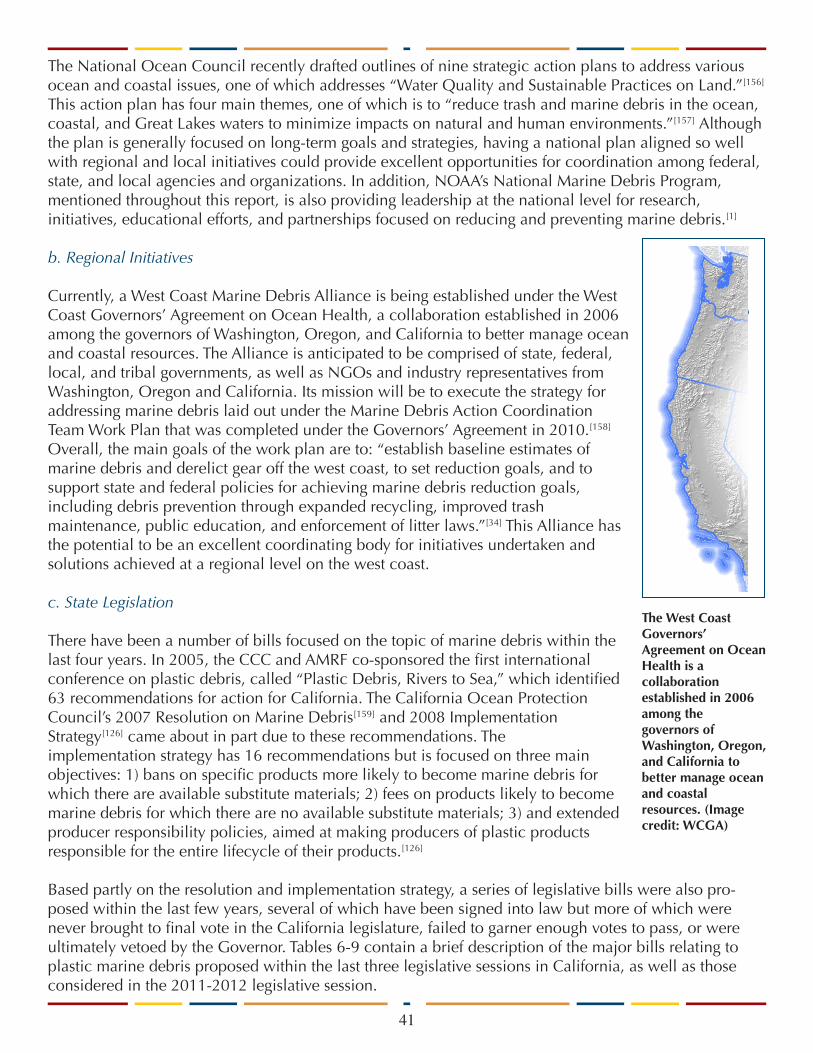
The National Ocean Council recently drafted outlines of nine strategic action plans to address various ocean and coastal issues, one of which addresses “Water Quality and Sustainable Practices on Land.”[156] This action plan has four main themes, one of which is to “reduce trash and marine debris in the ocean, coastal, and Great Lakes waters to minimize impacts on natural and human environments.”[157] Although the plan is generally focused on long-term goals and strategies, having a national plan aligned so well with regional and local initiatives could provide excellent opportunities for coordination among federal, state, and local agencies and organizations. In addition, NOAA’s National Marine Debris Program, mentioned throughout this report, is also providing leadership at the national level for research, initiatives, educational efforts, and partnerships focused on reducing and preventing marine debris.[1]
b. Regional Initiatives
Currently, a West Coast Marine Debris Alliance is being established under the West Coast Governors’ Agreement on Ocean Health, a collaboration established in 2006 among the governors of Washington, Oregon, and California to better manage ocean and coastal resources. The Alliance is anticipated to be comprised of state, federal, local, and tribal governments, as well as NGOs and industry representatives from Washington, Oregon and California. Its mission will be to execute the strategy for addressing marine debris laid out under the Marine Debris Action Coordination Team Work Plan that was completed under the Governors’ Agreement in 2010.[158] Overall, the main goals of the work plan are to: “establish baseline estimates of marine debris and derelict gear off the west coast, to set reduction goals, and to support state and federal policies for achieving marine debris reduction goals, including debris prevention through expanded recycling, improved trash maintenance, public education, and enforcement of litter laws.”[34] This Alliance has the potential to be an excellent coordinating body for initiatives undertaken and solutions achieved at a regional level on the west coast.
c. State Legislation
There have been a number of bills focused on the topic of marine debris within the last four years. In 2005, the CCC and AMRF co-sponsored the first international conference on plastic debris, called “Plastic Debris, Rivers to Sea,” which identified 63 recommendations for action for California. The California Ocean Protection Council’s 2007 Resolution on Marine Debris[159] and 2008 Implementation Strategy[126] came about in part due to these recommendations. The implementation strategy has 16 recommendations but is focused on three main objectives: 1) bans on specific products more likely to become marine debris for which there are available substitute materials; 2) fees on products likely to become marine debris for which there are no available substitute materials; 3) and extended producer responsibility policies, aimed at making producers of plastic products responsible for the entire lifecycle of their products.[126]
Based partly on the resolution and implementation strategy, a series of legislative bills were also pro-posed within the last few years, several of which have been signed into law but more of which were never brought to final vote in the California legislature, failed to garner enough votes to pass, or were ultimately vetoed by the Governor. Tables 6-9 contain a brief description of the major bills relating to plastic marine debris proposed within the last three legislative sessions in California, as well as those considered in the 2011-2012 legislative session.
41
The West Coast Governors’ Agreement on Ocean Health is a collaboration established in 2006 among the governors of Washington, Oregon, and California to better manage ocean and coastal resources. (Image credit: WCGA)
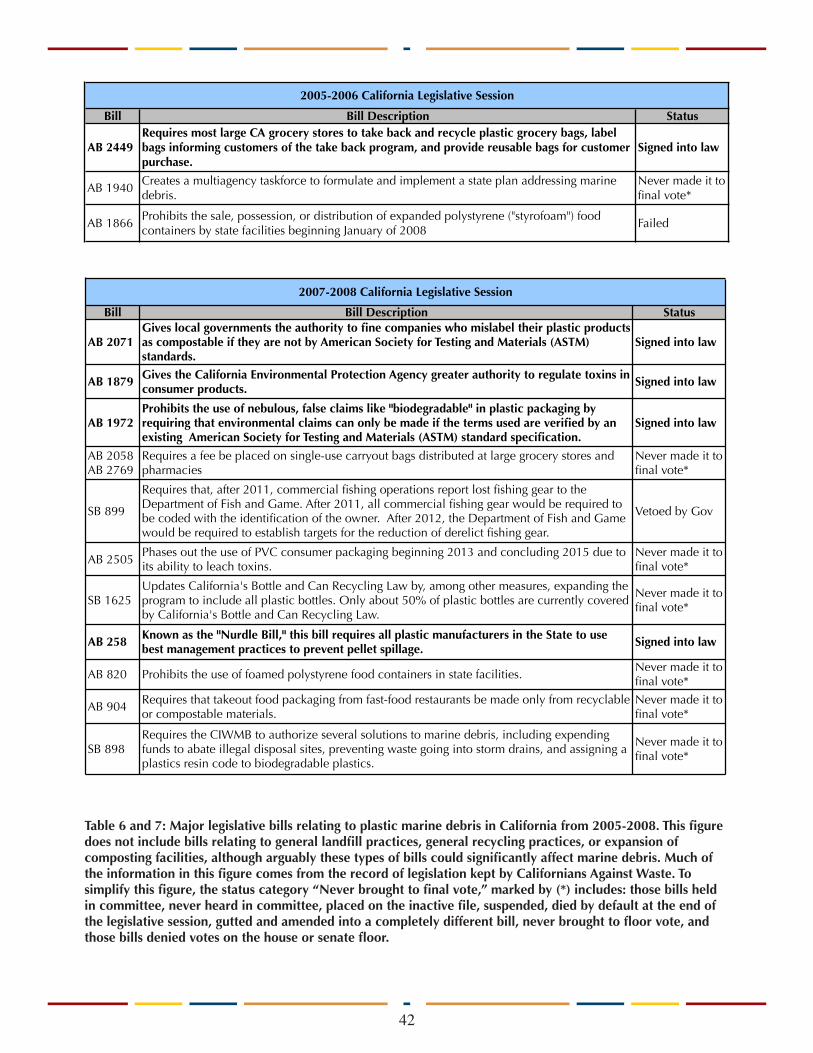
42
Table 6 and 7: Major legislative bills relating to plastic marine debris in California from 2005-2008. This figure does not include bills relating to general landfill practices, general recycling practices, or expansion of composting facilities, although arguably these types of bills could significantly affect marine debris. Much of the information in this figure comes from the record of legislation kept by Californians Against Waste. To simplify this figure, the status category “Never brought to final vote,” marked by (*) includes: those bills held in committee, never heard in committee, placed on the inactive file, suspended, died by default at the end of the legislative session, gutted and amended into a completely different bill, never brought to floor vote, and those bills denied votes on the house or senate floor.
Bill Bill Description Status
AB 2449Requires most large CA grocery stores to take back and recycle plastic grocery bags, label bags informing customers of the take back program, and provide reusable bags for customer purchase.
Signed into law
AB 1940Creates a multiagency taskforce to formulate and implement a state plan addressing marine debris.
Never made it to final vote*
AB 1866Prohibits the sale, possession, or distribution of expanded polystyrene ("styrofoam") food containers by state facilities beginning January of 2008
Failed
2005-2006 California Legislative Session
Bill Bill Description Status
AB 2071Gives local governments the authority to fine companies who mislabel their plastic products as compostable if they are not by American Society for Testing and Materials (ASTM) standards.
Signed into law
AB 1879 Gives the California Environmental Protection Agency greater authority to regulate toxins in consumer products.
Signed into law
AB 1972Prohibits the use of nebulous, false claims like "biodegradable" in plastic packaging by requiring that environmental claims can only be made if the terms used are verified by an existing American Society for Testing and Materials (ASTM) standard specification.
Signed into law
AB 2058 AB 2769
Requires a fee be placed on single-use carryout bags distributed at large grocery stores and pharmacies
Never made it to final vote*
SB 899
Requires that, after 2011, commercial fishing operations report lost fishing gear to the Department of Fish and Game. After 2011, all commercial fishing gear would be required to be coded with the identification of the owner. After 2012, the Department of Fish and Game would be required to establish targets for the reduction of derelict fishing gear.
Vetoed by Gov
AB 2505Phases out the use of PVC consumer packaging beginning 2013 and concluding 2015 due to its ability to leach toxins.
Never made it to final vote*
SB 1625Updates California's Bottle and Can Recycling Law by, among other measures, expanding the program to include all plastic bottles. Only about 50% of plastic bottles are currently covered by California's Bottle and Can Recycling Law.
Never made it to final vote*
AB 258 Known as the "Nurdle Bill," this bill requires all plastic manufacturers in the State to use best management practices to prevent pellet spillage.
Signed into law
AB 820 Prohibits the use of foamed polystyrene food containers in state facilities.Never made it to final vote*
AB 904 Requires that takeout food packaging from fast-food restaurants be made only from recyclable or compostable materials.
Never made it to final vote*
SB 898Requires the CIWMB to authorize several solutions to marine debris, including expending funds to abate illegal disposal sites, preventing waste going into storm drains, and assigning a plastics resin code to biodegradable plastics.
Never made it to final vote*
2007-2008 California Legislative Session

43
Table 8 and 9: Major legislative bills relating to plastic marine debris in California from 2009 to July 2011. This figure does not include bills relating to general landfill practices, general recycling practices, or expansion of composting facilities, although arguably these types of bills could significantly affect marine debris. Much of the information in this figure comes from the record of legislation kept by Californians Against Waste. To simplify this figure, the status category “Never brought to final vote,” marked by (*) includes: those bills held in committee, never heard in committee, placed on the inactive file, suspended, died by default at the end of the legislative session, gutted and amended into a completely different bill, never brought to floor vote, and those bills denied votes on the house or senate floor.
Bill Bill Description Status
SB 567Expands the scope of current plastic end-of-life claim labeling requirements from bags and food packaging to all plastic products. Restricts the labeling of plastics as "biodegradable", regardless of plastic type.
Currently active
SB 568 Prohibits food vendors from dispensing cooked food in polystyrene foam or Styrofoam containers.
Currently active
AB 1149
Extends a January 1, 2012 sunset for the Plastic Market Development program. Encourages existing California-based manufacturers of products and packaging to utilize recycled plastic in-state, reducing pollution and waste, and increase jobs and economic opportunity in California.
Currently active
2011-2012 Current California Legislative Session
Bill Bill Description Status
SB 21Known as the "Derelict Fishing Gear Bill," this bill requires by January 2012 that all fishing licenses and official brochures issued in California have printed on them a toll-free number and website for the purposes of reporting lost fishing gear.
Vetoed by Gov
SB 4Banned smoking at all 64 state beaches and 278 state parks, thereby reducing the amount of cigarette butt litter in the environment. Failed
AB 2139
Known as “Take it Back," this bill would establish a producer take-back system, or Extended Producer Responsibility (EPR). This system would have required manufacturers to develop product stewardship plans for certain hazardous products such as medical sharps, pesticide containers, and small propane tanks.
Failed
SB 803 Directs CIWMB to reduce the volume of Polyvinyl Chloride (PVC) packaging by 50% beginning 2011.
Never made it to final vote*
AB 1358 Bans the use of expanded polystyrene food packaging.Never made it to final vote*
AB 925 Requires bottle caps be attached to the container and be recyclable. Never made it to final vote*
AB 68 AB 87
Requires that consumers pay a $0.25 fee for single-use bags distributed at large grocery stores, pharmacies and convenience stores.
Never made it to final vote*
AB 925 Known as “Leash Your Lid,” this bill requires bottle manufacturers to redesign plastic beverage bottles with attached lids made of recyclable material, similar to aluminum can pull-tabs.
Failed
AB 238Gives the CIWMB the authority to select products for inclusion in an Extended Producer Responsibility program. After 2012, selected products would be required to improve waste collection, maximize recycling, and reduce overall the life-cycle impact of the product.
Never made it to final vote*
SB 1454
Expands the scope of current plastic end-of-life claim labeling requirements from bags and food packaging to all plastic products. Prevents consumer deception by tying end-of-life claims to pass/fail technical standards (American Society for Testing and Materials) and explicitly prohibits inherently misleading and dishonest claims, like “biodegradable”.
Vetoed by Gov
AB 1141Requires manufacturers of plastic bags to pay a $0.001 per-bag fee, but denies the proceeds of this fee to cities that have banned any single-use bag. Also requires cities that have banned single-use bags to provide alternative single-use bags at no cost.
Never made it to final vote*
AB 2138 Requires food providers to use only recyclable or compostable takeout food packaging and bags.
Never made it to final vote*
AB 1998 Bans plastic bags at grocery stores, pharmacies, convenience stores, and similar stores. Failed
2009-2010 California Legislative Session
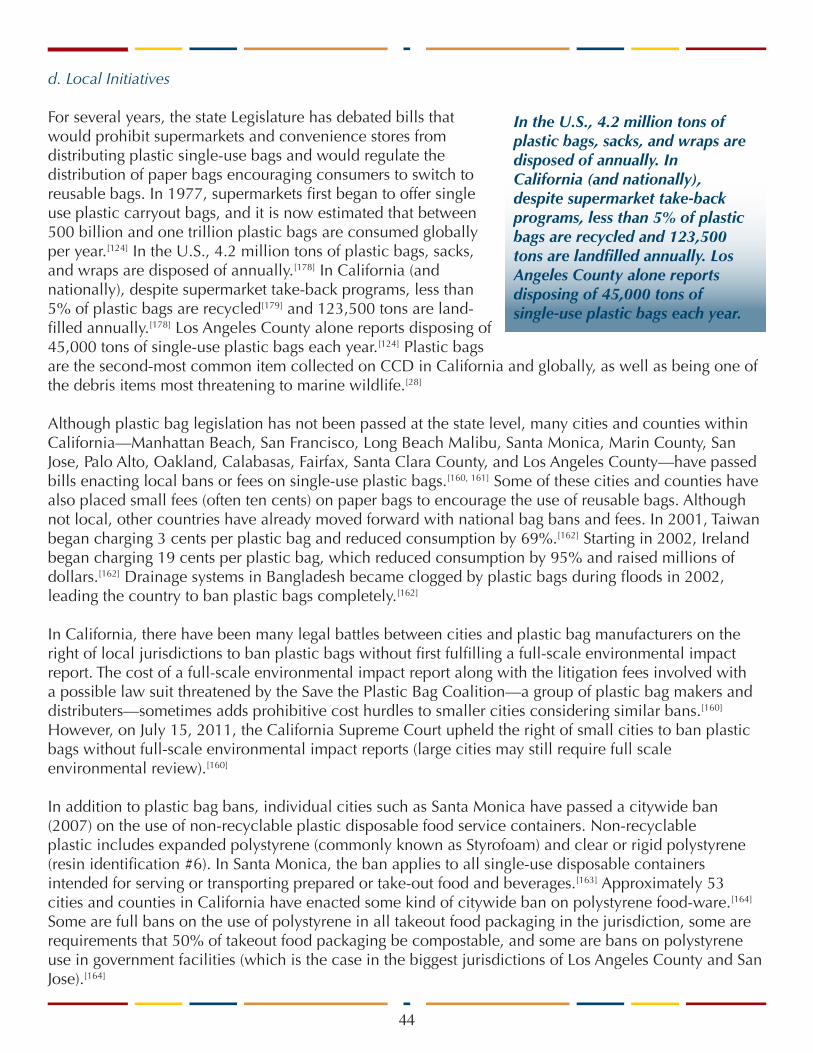
44
d. Local Initiatives
For several years, the state Legislature has debated bills that would prohibit supermarkets and convenience stores from distributing plastic single-use bags and would regulate the distribution of paper bags encouraging consumers to switch to reusable bags. In 1977, supermarkets first began to offer single use plastic carryout bags, and it is now estimated that between 500 billion and one trillion plastic bags are consumed globally per year.[124] In the U.S., 4.2 million tons of plastic bags, sacks, and wraps are disposed of annually.[178] In California (and nationally), despite supermarket take-back programs, less than 5% of plastic bags are recycled[179] and 123,500 tons are land-filled annually.[178] Los Angeles County alone reports disposing of 45,000 tons of single-use plastic bags each year.[124] Plastic bags are the second-most common item collected on CCD in California and globally, as well as being one of the debris items most threatening to marine wildlife.[28]
Although plastic bag legislation has not been passed at the state level, many cities and counties within California—Manhattan Beach, San Francisco, Long Beach Malibu, Santa Monica, Marin County, San Jose, Palo Alto, Oakland, Calabasas, Fairfax, Santa Clara County, and Los Angeles County—have passed bills enacting local bans or fees on single-use plastic bags.[160, 161] Some of these cities and counties have also placed small fees (often ten cents) on paper bags to encourage the use of reusable bags. Although not local, other countries have already moved forward with national bag bans and fees. In 2001, Taiwan began charging 3 cents per plastic bag and reduced consumption by 69%.[162] Starting in 2002, Ireland began charging 19 cents per plastic bag, which reduced consumption by 95% and raised millions of dollars.[162] Drainage systems in Bangladesh became clogged by plastic bags during floods in 2002, leading the country to ban plastic bags completely.[162]
In California, there have been many legal battles between cities and plastic bag manufacturers on the right of local jurisdictions to ban plastic bags without first fulfilling a full-scale environmental impact report. The cost of a full-scale environmental impact report along with the litigation fees involved with a possible law suit threatened by the Save the Plastic Bag Coalition—a group of plastic bag makers and distributers—sometimes adds prohibitive cost hurdles to smaller cities considering similar bans.[160] However, on July 15, 2011, the California Supreme Court upheld the right of small cities to ban plastic bags without full-scale environmental impact reports (large cities may still require full scale environmental review).[160]
In addition to plastic bag bans, individual cities such as Santa Monica have passed a citywide ban (2007) on the use of non-recyclable plastic disposable food service containers. Non-recyclable plastic includes expanded polystyrene (commonly known as Styrofoam) and clear or rigid polystyrene (resin identification #6). In Santa Monica, the ban applies to all single-use disposable containers intended for serving or transporting prepared or take-out food and beverages.[163] Approximately 53 cities and counties in California have enacted some kind of citywide ban on polystyrene food-ware.[164] Some are full bans on the use of polystyrene in all takeout food packaging in the jurisdiction, some are requirements that 50% of takeout food packaging be compostable, and some are bans on polystyrene use in government facilities (which is the case in the biggest jurisdictions of Los Angeles County and San Jose).[164]
In the U.S., 4.2 million tons of plastic bags, sacks, and wraps are disposed of annually. In California (and nationally), despite supermarket take-back programs, less than 5% of plastic bags are recycled and 123,500 tons are landfilled annually. Los Angeles County alone reports disposing of 45,000 tons of single-use plastic bags each year.
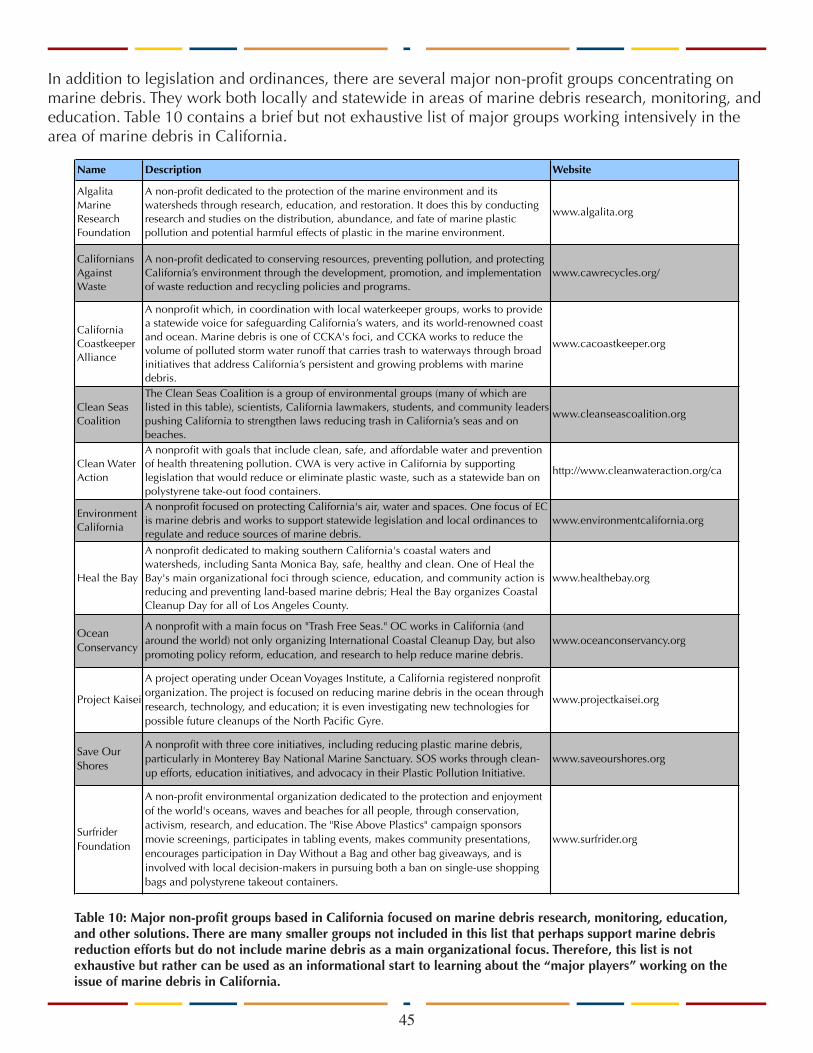
45
In addition to legislation and ordinances, there are several major non-profit groups concentrating on marine debris. They work both locally and statewide in areas of marine debris research, monitoring, and education. Table 10 contains a brief but not exhaustive list of major groups working intensively in the area of marine debris in California.
Table 10: Major non-profit groups based in California focused on marine debris research, monitoring, education, and other solutions. There are many smaller groups not included in this list that perhaps support marine debris reduction efforts but do not include marine debris as a main organizational focus. Therefore, this list is not exhaustive but rather can be used as an informational start to learning about the “major players” working on the issue of marine debris in California.
Name Description Website
Algalita Marine Research Foundation
A non-profit dedicated to the protection of the marine environment and its watersheds through research, education, and restoration. It does this by conducting research and studies on the distribution, abundance, and fate of marine plastic pollution and potential harmful effects of plastic in the marine environment.
www.algalita.org
Californians Against Waste
A non-profit dedicated to conserving resources, preventing pollution, and protecting California’s environment through the development, promotion, and implementation of waste reduction and recycling policies and programs.
www.cawrecycles.org/
California Coastkeeper Alliance
A nonprofit which, in coordination with local waterkeeper groups, works to provide a statewide voice for safeguarding California’s waters, and its world-renowned coast and ocean. Marine debris is one of CCKA's foci, and CCKA works to reduce the volume of polluted storm water runoff that carries trash to waterways through broad initiatives that address California’s persistent and growing problems with marine debris.
www.cacoastkeeper.org
Clean Seas Coalition
The Clean Seas Coalition is a group of environmental groups (many of which are listed in this table), scientists, California lawmakers, students, and community leaders pushing California to strengthen laws reducing trash in California’s seas and on beaches.
www.cleanseascoalition.org
Clean Water Action
A nonprofit with goals that include clean, safe, and affordable water and prevention of health threatening pollution. CWA is very active in California by supporting legislation that would reduce or eliminate plastic waste, such as a statewide ban on polystyrene take-out food containers.
http://www.cleanwateraction.org/ca
Environment California
A nonprofit focused on protecting California's air, water and spaces. One focus of EC is marine debris and works to support statewide legislation and local ordinances to regulate and reduce sources of marine debris.
www.environmentcalifornia.org
Heal the Bay
A nonprofit dedicated to making southern California's coastal waters and watersheds, including Santa Monica Bay, safe, healthy and clean. One of Heal the Bay's main organizational foci through science, education, and community action is reducing and preventing land-based marine debris; Heal the Bay organizes Coastal Cleanup Day for all of Los Angeles County.
www.healthebay.org
Ocean Conservancy
A nonprofit with a main focus on "Trash Free Seas." OC works in California (and around the world) not only organizing International Coastal Cleanup Day, but also promoting policy reform, education, and research to help reduce marine debris.
www.oceanconservancy.org
Project Kaisei
A project operating under Ocean Voyages Institute, a California registered nonprofit organization. The project is focused on reducing marine debris in the ocean through research, technology, and education; it is even investigating new technologies for possible future cleanups of the North Pacific Gyre.
www.projectkaisei.org
Save Our Shores
A nonprofit with three core initiatives, including reducing plastic marine debris, particularly in Monterey Bay National Marine Sanctuary. SOS works through clean-up efforts, education initiatives, and advocacy in their Plastic Pollution Initiative.
www.saveourshores.org
Surfrider Foundation
A non-profit environmental organization dedicated to the protection and enjoyment of the world's oceans, waves and beaches for all people, through conservation, activism, research, and education. The "Rise Above Plastics" campaign sponsors movie screenings, participates in tabling events, makes community presentations, encourages participation in Day Without a Bag and other bag giveaways, and is involved with local decision-makers in pursuing both a ban on single-use shopping bags and polystyrene takeout containers.
www.surfrider.org
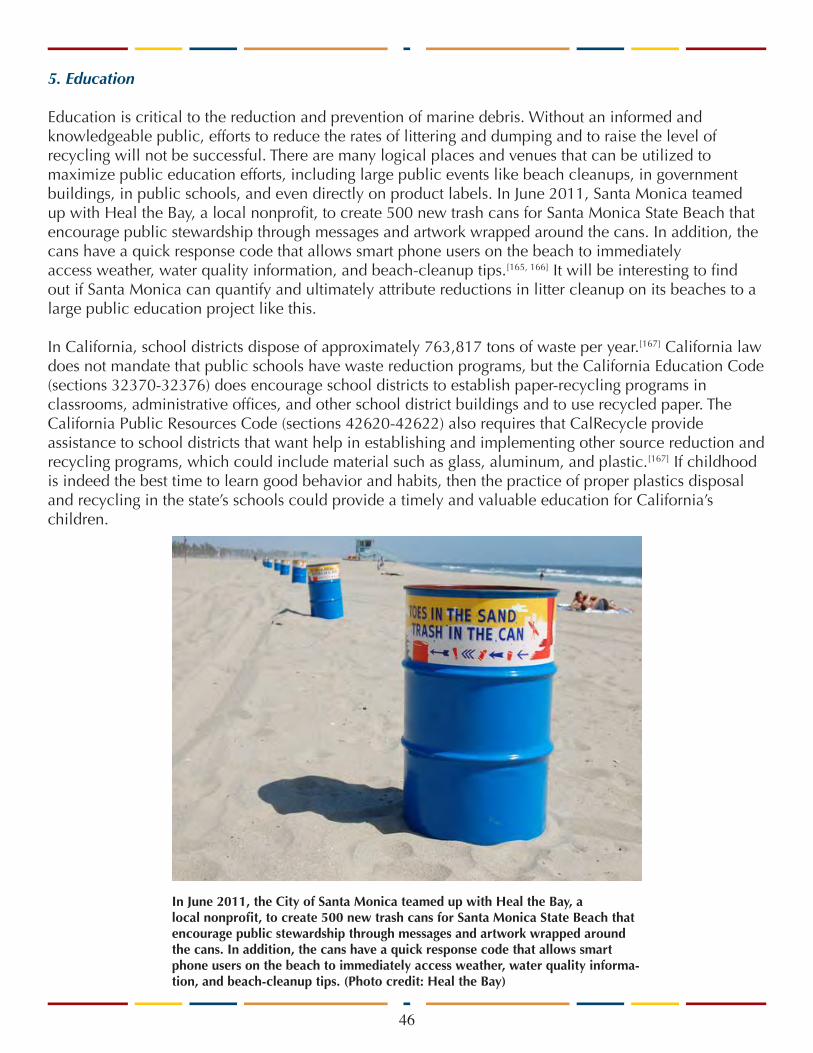
5. Education
Education is critical to the reduction and prevention of marine debris. Without an informed and knowledgeable public, efforts to reduce the rates of littering and dumping and to raise the level of recycling will not be successful. There are many logical places and venues that can be utilized to maximize public education efforts, including large public events like beach cleanups, in government buildings, in public schools, and even directly on product labels. In June 2011, Santa Monica teamed up with Heal the Bay, a local nonprofit, to create 500 new trash cans for Santa Monica State Beach that encourage public stewardship through messages and artwork wrapped around the cans. In addition, the cans have a quick response code that allows smart phone users on the beach to immediately access weather, water quality information, and beach-cleanup tips.[165, 166] It will be interesting to find out if Santa Monica can quantify and ultimately attribute reductions in litter cleanup on its beaches to a large public education project like this.
In California, school districts dispose of approximately 763,817 tons of waste per year.[167] California law does not mandate that public schools have waste reduction programs, but the California Education Code (sections 32370-32376) does encourage school districts to establish paper-recycling programs in classrooms, administrative offices, and other school district buildings and to use recycled paper. The California Public Resources Code (sections 42620-42622) also requires that CalRecycle provide assistance to school districts that want help in establishing and implementing other source reduction and recycling programs, which could include material such as glass, aluminum, and plastic.[167] If childhood is indeed the best time to learn good behavior and habits, then the practice of proper plastics disposal and recycling in the state’s schools could provide a timely and valuable education for California’s children.
46
In June 2011, the City of Santa Monica teamed up with Heal the Bay, a local nonprofit, to create 500 new trash cans for Santa Monica State Beach that encourage public stewardship through messages and artwork wrapped around the cans. In addition, the cans have a quick response code that allows smart phone users on the beach to immediately access weather, water quality informa-tion, and beach-cleanup tips. (Photo credit: Heal the Bay)
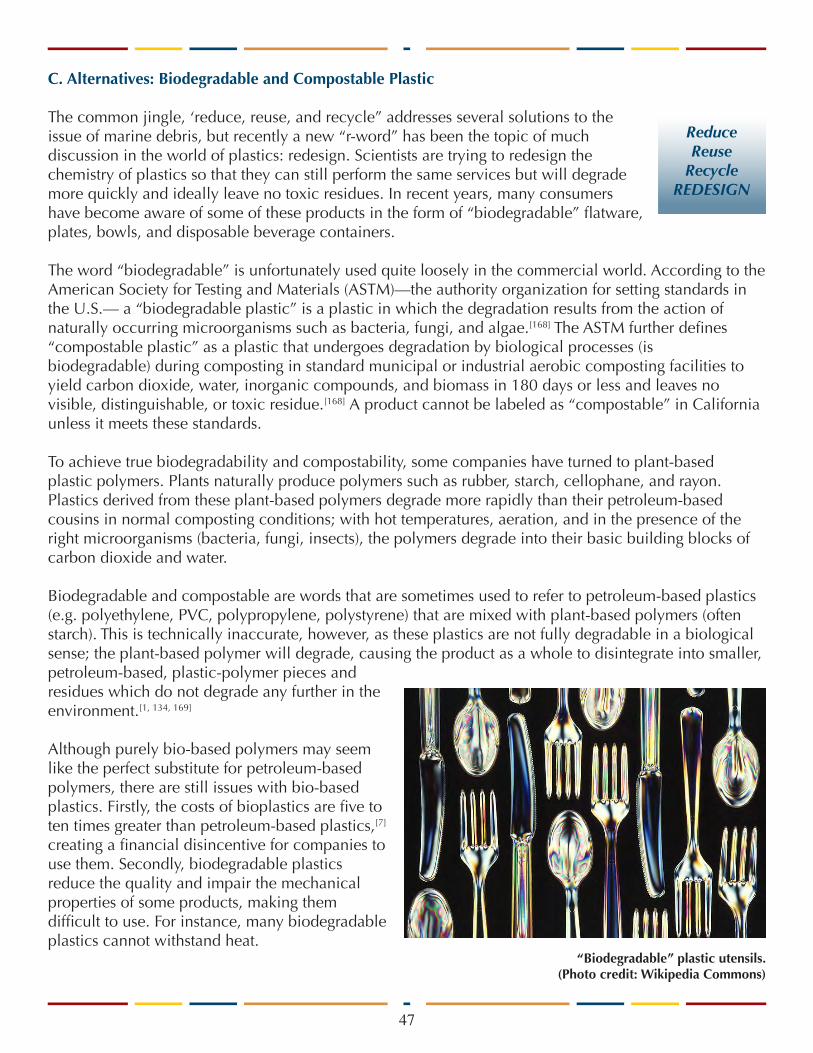
47
C. Alternatives: Biodegradable and Compostable Plastic
The common jingle, ‘reduce, reuse, and recycle” addresses several solutions to the issue of marine debris, but recently a new “r-word” has been the topic of much discussion in the world of plastics: redesign. Scientists are trying to redesign the chemistry of plastics so that they can still perform the same services but will degrade more quickly and ideally leave no toxic residues. In recent years, many consumers have become aware of some of these products in the form of “biodegradable” flatware, plates, bowls, and disposable beverage containers.
The word “biodegradable” is unfortunately used quite loosely in the commercial world. According to the American Society for Testing and Materials (ASTM)—the authority organization for setting standards in the U.S.— a “biodegradable plastic” is a plastic in which the degradation results from the action of naturally occurring microorganisms such as bacteria, fungi, and algae.[168] The ASTM further defines “compostable plastic” as a plastic that undergoes degradation by biological processes (is biodegradable) during composting in standard municipal or industrial aerobic composting facilities to yield carbon dioxide, water, inorganic compounds, and biomass in 180 days or less and leaves no visible, distinguishable, or toxic residue.[168] A product cannot be labeled as “compostable” in California unless it meets these standards.
To achieve true biodegradability and compostability, some companies have turned to plant-based plastic polymers. Plants naturally produce polymers such as rubber, starch, cellophane, and rayon. Plastics derived from these plant-based polymers degrade more rapidly than their petroleum-based cousins in normal composting conditions; with hot temperatures, aeration, and in the presence of the right microorganisms (bacteria, fungi, insects), the polymers degrade into their basic building blocks of carbon dioxide and water.
Biodegradable and compostable are words that are sometimes used to refer to petroleum-based plastics (e.g. polyethylene, PVC, polypropylene, polystyrene) that are mixed with plant-based polymers (often starch). This is technically inaccurate, however, as these plastics are not fully degradable in a biological sense; the plant-based polymer will degrade, causing the product as a whole to disintegrate into smaller, petroleum-based, plastic-polymer pieces and residues which do not degrade any further in the environment.[1, 134, 169]
Although purely bio-based polymers may seem like the perfect substitute for petroleum-based polymers, there are still issues with bio-based plastics. Firstly, the costs of bioplastics are five to ten times greater than petroleum-based plastics,[7] creating a financial disincentive for companies to use them. Secondly, biodegradable plastics reduce the quality and impair the mechanical properties of some products, making them difficult to use. For instance, many biodegradable plastics cannot withstand heat.
“Biodegradable” plastic utensils. (Photo credit: Wikipedia Commons)
Reduce Reuse
Recycle REDESIGN
48
From an environmental perspective, there are also problems with bio-based plastics. Many of these bio-based plastics will not degrade easily in an ocean environment or in typical landfills.[169, 170, 171] In general, typical landfills and the ocean do not have conditions (temperatures, appropriate bacteria, physical mulching) that are conducive to the degradation of biodegradable or compostable plastic.[172] The current ASTM standard for biodegradation in the marine environment only requires that at least 30% of the mass of the sample be converted to carbon dioxide after 180 days.[169, 170, 171]
A recent study produced by the CIWMB tested a number of common biodegradable-certified and compostable-certified products (e.g., UV-degradable six-pack rings, oxodegradable plastic trash bags, PLA (polylactide) straws, corn starch trash bags, MirelTM bags, Ecoflex bags, and Stalk Market sugarcane lids) and found that none of them degraded (or even disintegrated) in ocean water except for the MirelTM bags which demonstrated some disintegration.[169]
Even if the perfect, completely bio-based, plastic polymer were invented—one that would biodegrade in all environmental conditions and leave no toxic residues—some problematic issues would still remain. Bio-based plastics are dependent on crop production and land availability, putting them in direct competition with the resources and space required for food production, and in some cases with production of biofuels. There is a limited amount of fertile cropland in the U.S. and elsewhere in the world; competing uses for this land could present global problems. One could argue that this issue could be avoided if food-waste was used to generate these bio-polymers, but then polymer-production would be dependent on the success of food waste collection services.[46] Municipal composting programs and facilities would need to be created in all major cites, and even then it is unknown (and unlikely) whether the supply of uncontaminated food waste would be adequate to meet plastic production needs.
As a possible solution to the need for cropland or food-waste, a great deal of research has gone into bacterial fermentation processes in large industrial bioreactors to generate bio-polymers such as PLA and PHAs (a type of polyester) that are currently used in some packaging, coatings, compost bags, disposable flatware, bottles, and other consumer products. The use of fermentation to produce polymers may need continued research as bioreactors require careful monitoring, have size and production limits, and some studies indicate that production of PHA may consume more fossil-fuels than petroleum-based plastics.[134]
It is apparent that many engineering, environmental, and financial concerns arise when considering the replacement of petroleum-based plastics with bio-plastics: an obstacle by definition but also an indication of a specific area of research warranting continued study.
Many of these bio-based plastics will not degrade easily in an ocean environment or in typical landfills.
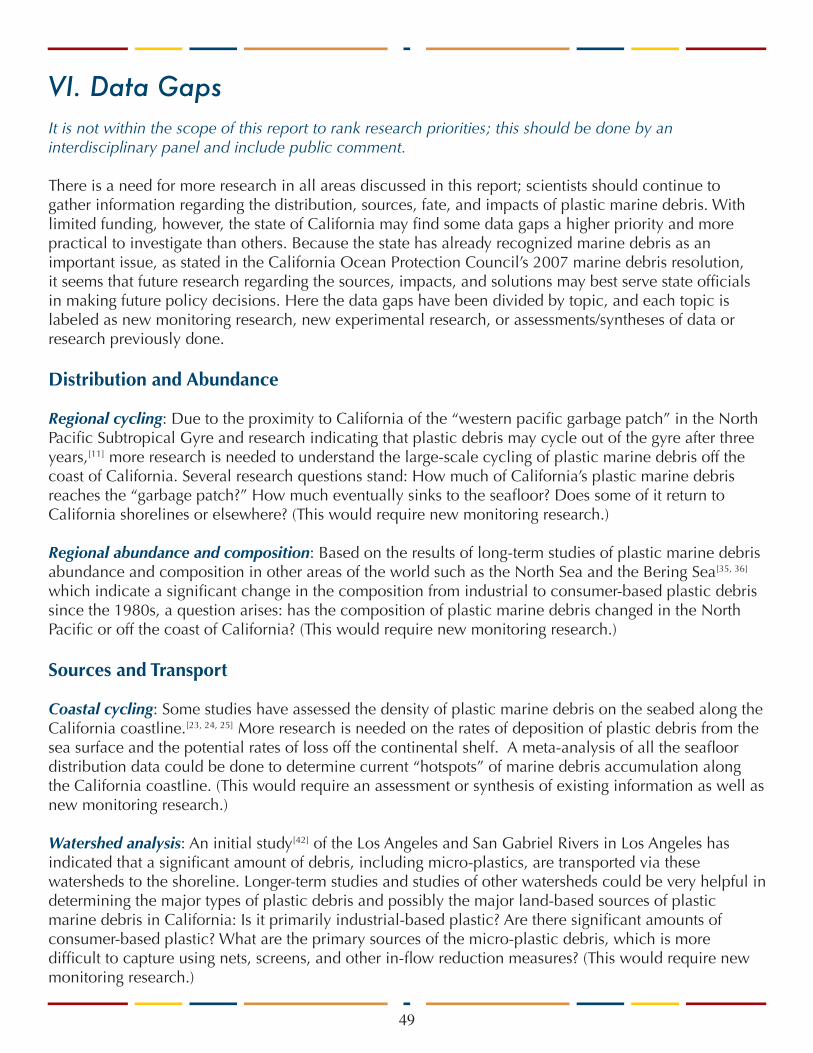
49
It is not within the scope of this report to rank research priorities; this should be done by an interdisciplinary panel and include public comment.
There is a need for more research in all areas discussed in this report; scientists should continue to gather information regarding the distribution, sources, fate, and impacts of plastic marine debris. With limited funding, however, the state of California may find some data gaps a higher priority and more practical to investigate than others. Because the state has already recognized marine debris as an important issue, as stated in the California Ocean Protection Council’s 2007 marine debris resolution, it seems that future research regarding the sources, impacts, and solutions may best serve state officials in making future policy decisions. Here the data gaps have been divided by topic, and each topic is labeled as new monitoring research, new experimental research, or assessments/syntheses of data or research previously done.
Distribution and Abundance
Regional cycling: Due to the proximity to California of the “western pacific garbage patch” in the North Pacific Subtropical Gyre and research indicating that plastic debris may cycle out of the gyre after three years,[11] more research is needed to understand the large-scale cycling of plastic marine debris off the coast of California. Several research questions stand: How much of California’s plastic marine debris reaches the “garbage patch?” How much eventually sinks to the seafloor? Does some of it return to California shorelines or elsewhere? (This would require new monitoring research.)
Regional abundance and composition: Based on the results of long-term studies of plastic marine debris abundance and composition in other areas of the world such as the North Sea and the Bering Sea[35, 36] which indicate a significant change in the composition from industrial to consumer-based plastic debris since the 1980s, a question arises: has the composition of plastic marine debris changed in the North Pacific or off the coast of California? (This would require new monitoring research.)
Sources and Transport
Coastal cycling: Some studies have assessed the density of plastic marine debris on the seabed along the California coastline.[23, 24, 25] More research is needed on the rates of deposition of plastic debris from the sea surface and the potential rates of loss off the continental shelf. A meta-analysis of all the seafloor distribution data could be done to determine current “hotspots” of marine debris accumulation along the California coastline. (This would require an assessment or synthesis of existing information as well as new monitoring research.)
Watershed analysis: An initial study[42] of the Los Angeles and San Gabriel Rivers in Los Angeles has indicated that a significant amount of debris, including micro-plastics, are transported via these watersheds to the shoreline. Longer-term studies and studies of other watersheds could be very helpful in determining the major types of plastic debris and possibly the major land-based sources of plastic marine debris in California: Is it primarily industrial-based plastic? Are there significant amounts of consumer-based plastic? What are the primary sources of the micro-plastic debris, which is more difficult to capture using nets, screens, and other in-flow reduction measures? (This would require new monitoring research.)
VI. Data Gaps
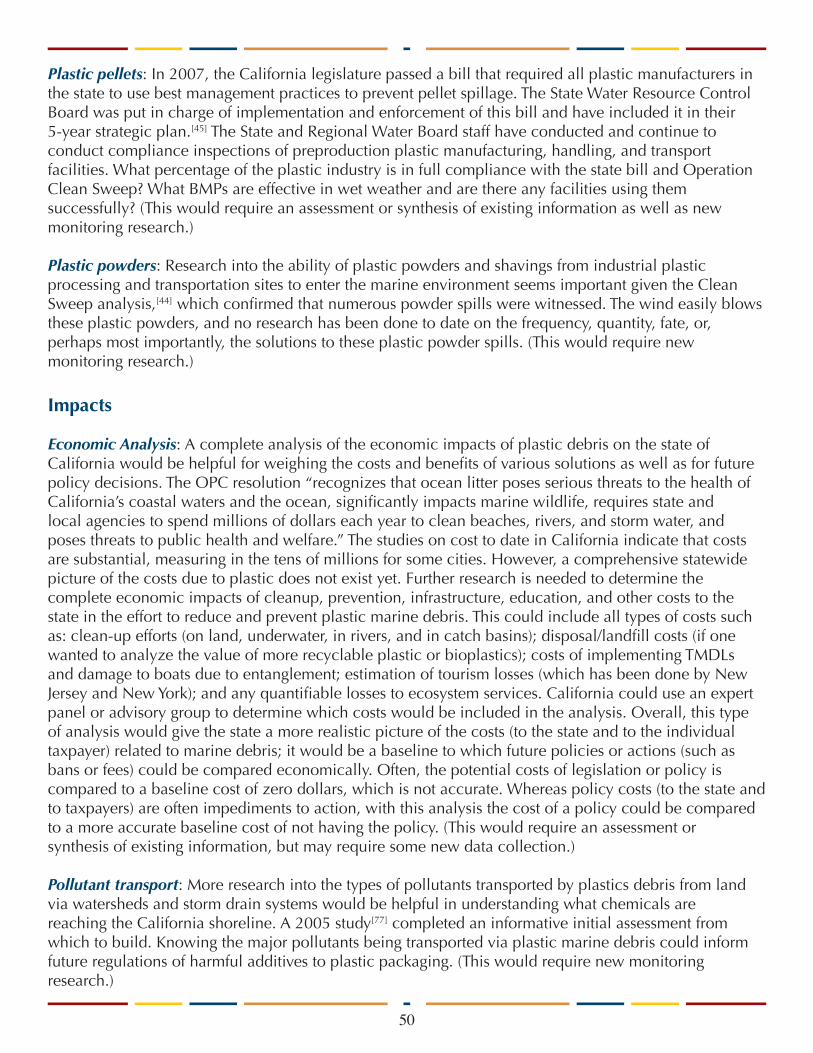
50
Plastic pellets: In 2007, the California legislature passed a bill that required all plastic manufacturers in the state to use best management practices to prevent pellet spillage. The State Water Resource Control Board was put in charge of implementation and enforcement of this bill and have included it in their 5-year strategic plan.[45] The State and Regional Water Board staff have conducted and continue to conduct compliance inspections of preproduction plastic manufacturing, handling, and transport facilities. What percentage of the plastic industry is in full compliance with the state bill and Operation Clean Sweep? What BMPs are effective in wet weather and are there any facilities using them successfully? (This would require an assessment or synthesis of existing information as well as new monitoring research.)
Plastic powders: Research into the ability of plastic powders and shavings from industrial plastic processing and transportation sites to enter the marine environment seems important given the Clean Sweep analysis,[44] which confirmed that numerous powder spills were witnessed. The wind easily blows these plastic powders, and no research has been done to date on the frequency, quantity, fate, or, perhaps most importantly, the solutions to these plastic powder spills. (This would require new monitoring research.)
Impacts
Economic Analysis: A complete analysis of the economic impacts of plastic debris on the state of California would be helpful for weighing the costs and benefits of various solutions as well as for future policy decisions. The OPC resolution “recognizes that ocean litter poses serious threats to the health of California’s coastal waters and the ocean, significantly impacts marine wildlife, requires state and local agencies to spend millions of dollars each year to clean beaches, rivers, and storm water, and poses threats to public health and welfare.” The studies on cost to date in California indicate that costs are substantial, measuring in the tens of millions for some cities. However, a comprehensive statewide picture of the costs due to plastic does not exist yet. Further research is needed to determine the complete economic impacts of cleanup, prevention, infrastructure, education, and other costs to the state in the effort to reduce and prevent plastic marine debris. This could include all types of costs such as: clean-up efforts (on land, underwater, in rivers, and in catch basins); disposal/landfill costs (if one wanted to analyze the value of more recyclable plastic or bioplastics); costs of implementing TMDLs and damage to boats due to entanglement; estimation of tourism losses (which has been done by New Jersey and New York); and any quantifiable losses to ecosystem services. California could use an expert panel or advisory group to determine which costs would be included in the analysis. Overall, this type of analysis would give the state a more realistic picture of the costs (to the state and to the individual taxpayer) related to marine debris; it would be a baseline to which future policies or actions (such as bans or fees) could be compared economically. Often, the potential costs of legislation or policy is compared to a baseline cost of zero dollars, which is not accurate. Whereas policy costs (to the state and to taxpayers) are often impediments to action, with this analysis the cost of a policy could be compared to a more accurate baseline cost of not having the policy. (This would require an assessment or synthesis of existing information, but may require some new data collection.)
Pollutant transport: More research into the types of pollutants transported by plastics debris from land via watersheds and storm drain systems would be helpful in understanding what chemicals are reaching the California shoreline. A 2005 study[77] completed an informative initial assessment from which to build. Knowing the major pollutants being transported via plastic marine debris could inform future regulations of harmful additives to plastic packaging. (This would require new monitoring research.)

51
Long-term toxicology: Toxicological analysis of long-term exposures of organisms to environmentally relevant concentrations of pollutants adsorbed or leached by plastic marine debris is necessary for determining the chronic effects of exposure to contaminated plastic marine debris. (This would require new experimental research.)
Mixtures and toxicology: There is need for the study of environmentally relevant mixtures of pollutants to which marine organisms (and humans) may be exposed as a result of marine debris. Single pollutant laboratory studies are important for determining the exact effects of a given chemical, but these traditional studies fail to consider the real-world milieu of chemicals leaching or adsorbed to plastic that may be entering the food chain simultaneously. (This would require new experimental research.)
Bioaccumulation: More research is needed regarding the capacity of pollutants in or adsorbed onto plastics to enter marine organisms and be passed up the food chain. This is of particular concern when considered from a seafood safety perspective. (This would require new experimental and monitoring research.)
Population Level Effects: Research is needed to determine if there are any population level effects of the noted impacts of marine debris on individual organisms. (This would require new experimental and monitoring research.)
Invasive Species: Are there any specific species of concern that have the potential to use plastic as a mode of transport to the California shoreline? (This would require an assessment or synthesis of existing information.)
Seafloor Impacts: The impacts of sunken plastic marine debris on benthic communities are still relatively unknown. A few studies indicate changes in benthic community composition and suggest changes in gas exchange between the water and the sediment as a result of marine debris.[116, 117, 118] There have been no studies to date focused on potential smothering effects of plastic marine debris in California specifically. (This would require new monitoring and experimental research.)
Solutions
Education: California has formal and informal educational programs on the nature of marine debris, proper disposal of debris, and recycling. Analyzing programs that have been the most successful could help state managers determine which might have the greatest impact if applied statewide. (This would require an assessment or synthesis of existing information.)
Structural controls: Although Los Angeles may have made considerable headway in its efforts to meet the zero-trash requirements of the Trash TMDL for the Los Angeles River and Ballona Creek, these controls and this policy do not address micro-plastic debris less than 5 mm diameter. More research is needed into the sources and preventative measures for land-based micro-plastic reaching the California shoreline. (This would require new experimental and monitoring research.)
Recycling: What are the impediments—cost, infrastructure, compliance, incentives—to raising the level of plastic recycling in California? For example, several pieces of legislation (which have failed) in California in the last six years have attempted to increase the availability of recycling receptacles to multi-family homes. (This would require an assessment or synthesis of existing information.)

52
Derelict Fishing Gear: A recent committee report at the National Academy of Sciences found that inadequate port facilities and high disposal costs are a major impediment to the proper disposal of wastes. Ships need to be able to discharge their waste fishing gear at ports and should have incentives (not fees) to do so.[146] Several countries such as the Republic of Korea and the countries surrounding the North Sea have developed such incentive programs. More investigation could be warranted to determine whether incentives for boaters to bring debris into port, similar to the incentives for commercial and domestic recycling, could potentially reduce the disposal of derelict fishing gear off the coast of California. (This would represent an assessment or synthesis of existing information. It may also require some original social science research.)
Energy Recovery: What are the pros and cons (environmental, economic) of a more advanced and comprehensive energy recovery program for recycled plastic in California? (This would require an assessment or synthesis of existing information.)
Bio-plastics: Many engineering, environmental, and financial concerns arise when considering the replacement of petroleum-based plastics with bio-plastics, but this is also clearly an important area of research warranting continued study. (This would require new experimental research.)
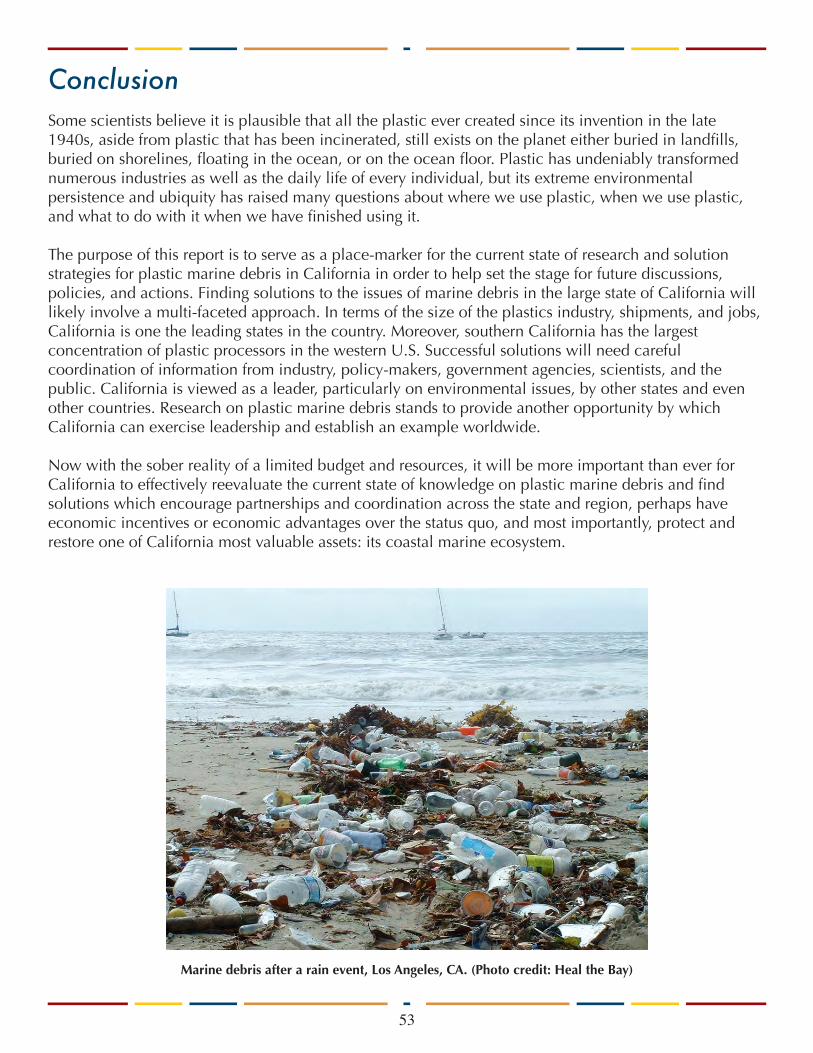
53
ConclusionSome scientists believe it is plausible that all the plastic ever created since its invention in the late 1940s, aside from plastic that has been incinerated, still exists on the planet either buried in landfills, buried on shorelines, floating in the ocean, or on the ocean floor. Plastic has undeniably transformed numerous industries as well as the daily life of every individual, but its extreme environmental persistence and ubiquity has raised many questions about where we use plastic, when we use plastic, and what to do with it when we have finished using it.
The purpose of this report is to serve as a place-marker for the current state of research and solution strategies for plastic marine debris in California in order to help set the stage for future discussions, policies, and actions. Finding solutions to the issues of marine debris in the large state of California will likely involve a multi-faceted approach. In terms of the size of the plastics industry, shipments, and jobs, California is one the leading states in the country. Moreover, southern California has the largest concentration of plastic processors in the western U.S. Successful solutions will need careful coordination of information from industry, policy-makers, government agencies, scientists, and the public. California is viewed as a leader, particularly on environmental issues, by other states and even other countries. Research on plastic marine debris stands to provide another opportunity by which California can exercise leadership and establish an example worldwide.
Now with the sober reality of a limited budget and resources, it will be more important than ever for California to effectively reevaluate the current state of knowledge on plastic marine debris and find solutions which encourage partnerships and coordination across the state and region, perhaps have economic incentives or economic advantages over the status quo, and most importantly, protect and restore one of California most valuable assets: its coastal marine ecosystem.
Marine debris after a rain event, Los Angeles, CA. (Photo credit: Heal the Bay)
54
[1] NOAA Marine Debris Program. 7 June 2011. Web 17 June 2011. <http://marinedebris.noaa.gov/>.
[2] Thompson, R. C.; Olsen, Y.; Mitchell, R. P.; Davis, A.; Rowland, S. J.; John, A. W. G.; McGonigle, D; Russel,l A. E. Lost at Sea: where is all the plastic? Science. 2004, 304: 838.
[3] Barnes, D. K. A.; Milner, P. Drifting plastic and its consequences for sessile organisms dispersal in the Atlantic Ocean. Mar. Biol. 2005, 146 (4): 815-825.
[4] Rios, Lorena M.; Moore, Charles; Jones, Patrick R. Persistent organic pollutants carried by synthetic polymers in the ocean environment. Mar. Pollut. Bull. 2007, 54: 1230-1237.
[5] American Chemistry Council. “Lifecycle of a Plastic Product.” Web. 3 July 2011. < http://plastics.americanchemistry.com/Life-Cycle>.
[6] Hopewell, J.; Dvorak, R.; Kosior, E. Plastics recycling: challenges and opportunities. Phil. Trans. R. Soc. B. 2009, 364: 2115-2126.
[7] Moore, C. J. Synthetic polymers in the marine environment: A rapidly increasing long-term threat. Environ. Res. 2008, 108: 131-139.
[8] Gregory, M. R.; Andrady, A. L. 2003. Plastics in the marine environment. In: Andrady, AlL. (Ed.), Plastics and the Environment. John Wiley and Sons, Inc., Hoboken, New Jersey, pp. 379-401.
[9] Barnes, David K. A.; Galganai, Francois; Thompson, Richard C.; Barlaz, Morton. Accumulation and fragmentation of plastic debris in global environments. Phil. Trans. R. Soc. B. 2009, 364: 1985-1998.
[10] Ebbesmeyer, C. C.; Ingraham Jr.; Royer, T. C.; Grosch, C. E. Tub Toys Orbit the Pacific Subarctic Gyre. EOS. 2007, 88 (1): 1-12.
[11] Ebbesmeyer, C. Scigliano, E. Flotsametrics and the Floating World: How One Man’s Obsession with Runaway Sneakers and Rubber Ducks Revolutionized Ocean Science. Smithsonian Books/Collins/HarperCollins, Washington, DC, 2009.
[12] Doyle, Miriam J.; Watson, William; Bowlin, Noelle M.; Sheavly, Seba B. Plastic particles in coastal pelagic ecosystems of the Northeast Pacific ocean. Mar. Environ. Res. 2011, 71 (1): 41-52.
[13] Moore, C. J.; S. L. Moore; M. K. Leecaster; S. B. Weisberg. A Comparison of Plastic and Plankton in the North Pacific Central Gyre. Mar. Pollut. Bull. 2001, 42 (12): 1297-1300.
[14] Project Kaisei. “About Project Kaisei.” Web. 24 July 2011. <http://www.projectkaisei.org/index.aspx>.
[15] Dameron, Oliver J.; Park, Michael; Albins, Mark A.; Brainard, Russel. Marine debris accumulation in the Northwestern Hawaiian Islands: An examination of rates and processes. Mar. Pollut. Bull. 2007, 54 (4): 423-433.
[16] McDermid, Karla J.; McMullen, Tracy L. Quantitative analysis of small-plastic debris on beaches in the Hawaiian archipelago. Mar. Pollut. Bull. 2004, 48: 790-794.
[17] Lattin, G. L.; Moore, C. J.; Zellers,k A. F.; Moore, S. L.; Weisberg, S. B. A comparison of neustonic plastic and zooplankton at different depths near the southern California shore. Mar. Pollut. Bull. 2004, 49: 291-294.
[18] Ryan, P. G.; Moore, Charles J.; van Franeker, Jan A.; Moloney, Coleen L. Monitoring the abundance of plastic debris in the marine environment. Phil. Trans. R. Soc. B. 2009, 364: 1999-2012.
[19] 5th International Marine Debris Conference. “Workshop on learning shoreline assessment protocols for marine debris.” March 20-25, 2011, Honolulu, HI. Web. <http://www.5imdc.org/>.
[20] USEPA. Plastic pellets in the aquatic environment: Sources, and recommendations. United States Environmental Protection Agency Oceans and Coastal Protection Division Report 842-B-92-010. Washington, D.C., 1992.
[21] UNEP. UNEP Year Book 2011: Emerging Issues in Our Global Environment. United Nations Environment Program. 2011: 20-33.
[22] Galgani, F.; Leaute, J. P.; Moguedet, P.; Souplet, A.; Verin, Y.; Capentier, A.; Goraguer, H.; Latrouite, D.; Andral, B.; Cadiou, Y.; Mahe, J. C.; Poulard, J. C.; Nerisson, P. Litter on the Sea Floor Along European Coasts. Mar. Pol. Bull. 2000, 40 (6): 516-527.
[23] Moore, S.L.; Allen, M. J. Distribution of anthropogenic and natural debris on the mainland shelf of the Southern California Bight. Mar. Pollut. Bull. 2000, 40: 83-88.
Endnotes
55
[24] Keller, Aimee A.; Fruh, Erica L.; Johnson, Melanie M.; Simon, Victor; McGourty, Catherine. Distribution and abundance of anthropo-genic marine debris along the shelf and slope of the US West Coast. Mar. Pollut. Bull. 2010, 60 (5): 692-700.
[25] Watters, Diana L.; Yoklavich, Mary M.; Love, Milton; Schroeder, Donna M. Assessing marine debris in deep seafloor habitats off Cali-fornia. Bull. Mar. Sci. 2010, 60: 131-138.
[26] Gilfillan, L.R.; Ohman, M.D.; Doyle, M.J.; Watson, W. Occurrence of Plastic Micro-Debris in the Southern California Current System. CalCOFI Rep., Vol 50, 2009.
[27] Moore, C. J.; Moore, S. L.; Weisberg, S. B.; Lattin, G. L.; Zellers, A. F. A comparison of neustonic plastic and zooplankton abundance in southern California’s coastal waters. Mar. Pollut. Bull. 2002, 44: 1035-1038.
[28] Ocean Conservancy. Trash Travels. International Coastal Cleanup Report. 2010.
[29] CCC. California Coastal Commission Public Education Program for California Coastal Cleanup Day. Web. 23 Feb 2011. <http://www.coastal.ca.gov/publiced/ccd/ccd.html>.
[30] Ocean Conservancy. A Rising Tide of Ocean Debris. International Coastal Cleanup Report. 2009.
[31] Moore, S. L.; Gregorio, D.; Carreon, M.; Weisberg, S. B.; Leecaster, M. K. Composition and Distribution of Beach Debris in Orange County, California. Mar. Pollut. Bull. 2001, 42 (3): 241-245.
[32] Copeland, Claudia. Cruise Ship Pollution: Background, Laws and Regulations, and Key Issues. CRS Report for Congress, order code: RL32450. Updated 6 Feb 2008.
[33] IMO. Status of Multilateral Conventions and Instruments in Respect of which the International Maritime Organization or its Secretary General Performs Depositary or Other Functions. International Maritime Organization Report, 31 May 2011. Web. 30 Jun 2011. < L:\LED\LO\MS-Depositary\STATUS OF MULTILATERAL CONVENTIONS\Status - 2011.docx>.
[34] WCGA. West Coast Governors’ Agreement on Ocean Health Marine Debris Action Work Plan. May, 2010.
[35] Franeker, J.A van.; Meijboom, A.; de jong, M.; Verdaat, H. (2010). Fulmar litter EcoQO monitoring in the Netherlands 1979-2007 in relation to EU Directive 200/59/EC on Port Reception Facilities. Report nr: CO32/09. IMARES Wageningen UR.
[36] Vlietstra, L.S.; Parga, J.A. Long-term changes in the type, but not amount, of ingested plastic particles in short-tailed shearwaters in the southereastern Bering Sea. Mar. Pollut. Bull. 2002, 44 (9): 945-955.
[37] CaDoT. Final Report: District 7 Litter Management Pilot Study. Produced under contract by URS Greiner, Woodward, Clyde, No. 43A0004C. 2000, California Department of Transportation No. CT-SW-RT-00-013.
[38] USEPA. Municipal Solid Waste in the United States 2009. United States Environmental Protection Agency Report: EPA530-R-10-012, Washington, D.C., 2010.
[39] Mehta, A. China-India Plastics Industry Summit 2007—Visit Report. Summit of Chinese and Indian Plastic Industrties, Guanzhou, China, May 20, 2007.
[40] CIWMB. Plastics White Paper: Optimizing Plastics Use, Recycling, and Disposal in California. California Integrated Waste Manage-ment Board, 2003.
[41] CIWMB. Contractor’s Report to the Board: California 2008 Statewide Waste Characterization Study. Produced under contract with the California Integrated Waste Management Board by Cascadia Consulting Group, 2008.
[42] Moore, C. J. Lattin, G. L.; Zellers, A. F. Working our way upstream: a snapshot of landbased contributions of plastic and other trash to coastal waters and beaches of Southern California. In: Proceedings of the Plastic Debris Rivers to Sea Conference, Algalita Marine Research Foundation, Long Beach, CA, 2005b.
[43] American Chemistry Council. “Operation Clean Sweep Pellet Handling Manual.” 2010. Web. 3 July 2011. <www.opcleansweep.org>.
[44] Moore, C. J. Lattin, G. L.; Zellers, A. F. Measuring the effectiveness of voluntary plastic industry efforts: AMRF’s analysis of Opera-tion Clean Sweep. In: Proceedings of the Plastic Debris Rivers to Sea Conference, Algalita Marine Research Foundation, Long Beach, CA, 2005c.
[45] SWRCB. Strategic Plan Update 2008-2012. State Water Resources Control Board. Adopted 2 Sept 2008.
[46] Thompson, Richard C.; Moore, Charles J.; vom Saal, Fredrick S.; Swan, Shanna H. Plastics, the environment and human health: current consensus and future trends. Phil. Trans. R. Soc. 2009, 364: 2153-2166.
56
[47] Gregory, M.R. Environmental implications of plastic debris in marine settings—entanglement, ingestion, smothering, hangers-on, hitch-hiking and alien invasions. Phil. Trns. R. Soc. B. 2009, 364: 2013-2025.
[48] Laist, David W. Overview of the biological effects of lost and discarded plastic debris in the marine environment. Mar. Poll. Bull. 1987, 18 (6) (2): 319-326.
[49] Laist, D. W. Impacts of marine debris: entanglement of marine life in marine debris including a comprehensive list of species with entanglement and ingestion records. Pp. 99–139 in J. M. Coe and D. B. Rogers, eds., Marine Debris- Sources, Impacts, and Solutions. New York: Springer-Verlag, 1997.
[50] Derraik, J. G. B. The pollution of the marine environment by plastic debris: a review. Mar. Poll. Bull. 2002, 44 (9): 842-852.
[51] Moore, E.; Lyday, S.; Roletto, J. Litle, K.; Parrish, J.K.; Nevins, H.; Harvey, J.; Mortenson, J.; Greig, D.; Piazza, M.; Hermance, A.; Lee, D.; Adams, D.; Allen, S.; Kell, S. Entanglements of marine mammals and seabirds in central California and the north-west coast of the United States 2001–2005. Mar. Pollut. Bull. 2009, 58 (7): 1045-1051.
[52] Dau, B.K.; Gilardi, K.V.K.; Gulland, F.M.; Higgins, A.; Holcomb, J.B.; St. Leger, J.; Ziccardi, M.H. Fishing gear-related injury in Califor-nia marine wildlife. J. Mar. Wild Dis. 2009, 45 (2): 355-362.
[53] Carr, Archie. Impacts of nondegradable marine debris on the ecology and survival outlook of sea turtles. Mar. Pol. Bull. 1987, 18 (6) (2): 352-356.
[54] Young, Lindsay C.; Vanderlip, Cynthia; Duffy, David C.; Afanasyev, Vsevolod; Shaffer, Scott A. Bringing Home the Trash: Do Colony-Based Differences in Foraging Distribution Lead to Increased Plastic Ingestion in Laysan Albatrosses? PLoS One. 2009, 4 (10): e7623.
[55] Davidson, P.; Asch, R. G. Plastic ingestion by mesopelagic fishes in the North Pacific Subtropical Gyre. Mar Ecol Prog Ser. 2011, 432: 173-180.
[56] Boerger, Christiana M.; Lattin, Gwendolyn L.; Moore, Shelly L.; Moore, Charles J. Plastic ingestion by planktivorous fishes in the North Pacific Central Gyre. Mar. Pol. Bull. 2010, 60: 2275-2278.
[57] Possatto, Fernanda E; Barletta, Mario; Costa, Monica F.; Ivar do Sul, Juliana A.; Dantas, David V. Plastic debris ingestion by marine catfish: An unexpected fisheries impact. Mar. Pollut. Bull. 2011, doi: 10.1016/j.marpolbul.2011.01.036.
[58] Donohue, M. J.; Foley, D. G. Remote Sensing Revealing Links Among the Endangered Hawaiian Monk Seal, Marine Debris, and El Nino. Mar. Mamm. Sci. 2007, 23 (2): 468-473.
[59] NOAA Fisheries Office of Protected Resources. “Hawaiian Monk Seal (Monachus schauinslandi). 30 June 2011. Web. 3 July 2011. <http://www.nmfs.noaa.gov/pr/species/mammals/pinnipeds/hawaiianmonkseal.htm#population>.
[60] Jacobsen, J. K.; Massey, L.; Gulland, F. Fatal Ingestion of floating net debris by two sperm whales (Physeter macrocephalus). Mar. Poll. Bull. 2010, 60 (5): 765-767.
[61] Brown, James; Macfadyen, Graeme. Ghost fishing in European waters: Impacts and management responses. Mar. Pol. 2007, 31 (4): 488-504.
[62] Teuten, Emma L. et al. Transport and release of chemicals from plastics to the environment and to wildlife. Phil. Trans. R. Soc. B. 2009, 364: 2027-2045.
[63] Mato, Yukie; Isobe, Tomohiko; Takada, Hideshige; Kanehiro, Haruyuki; Ohtake, Chiyoko; Kaminuma, Tsuguchika. Plastic Resin Pellets as a Transport Mechanism for Toxic Chemicals in the Marine Environment. Environ. Sci. Technol. 2001, 35 (2): 318-324.
[64] Rios, Lorena M.; Jones, Patrick R.; Moore, Charles; Narayan, Urja V. Quantitation of persistent organic pollutants adsorbed on plastic debris from the Northern Pacific Gyre’s “eastern garbage patch.” J. Environ. Monit. 2010, 12: 2226-2236.
[65] Endo, Satoshi; Takizawa, Reiko; Okuda, Keiji; Takada, Hideshige; Chiba, Kazuhiro; Kanehiro, Haruyuki; Ogi, Haruo; Yamashita, Rei; Date, Takeshi. Concentration of polychlorinated biphenyls (PCBs) in beached resin pellets: Variability among individual particles and re-gional differences. Mar. Pollut. Bull. 2005, 50 (10): 1103-1114.
[66] USEPA. “Persistent Organic Pollutants: A Global Response.” United States Environmental Protection Agency. 12 Jan 2011. Web. 4 Feb 2011. <http://www.epa.gov/oia/toxics/pop.html>.
[67] Pascal, Melvin A.; Zabik, Mary E.; Zabik, Matthew J.; Hernandez, Ruben J.; Uptake of Polychlorinated Biphenyls (PCBs) from an Aque-ous Medium by Polyethylene, Polyvinyl Chloride, and Polystyrene Films. J. Agric. Food Chem. 2005, 53 (1): 164-169.

57
[68] Bojes Heidi K.; Pope, Peter G. Characterization of EPA’s 16 priority pollutant polycyclic aromatic hydrocarbons (PAHs) in tank bottom solids and associated contaminated soils at oil exploration and production sites in Texas. Reg Toxicol. Pharm. 2007, 47: 288-295.
[69] Koch, H. M.; Calafat, Antonia M. Human body burdens of chemicals used in plastic manufacture. Phil. Trans. R. Soc. B. 2009, 364: 2063-2078.
[70] Takada, H. “International Pellet Watch.” Laboratory of Organic Geochemistry, Tokyo University of Agriculture and Technology. Web. 17 Jun 2011. <http://www.pelletwatch.org/>.
[71] Lang, Richard C.; Laursen, Duane; Danner, Brenda. Stewardson, Nickol; Thompson, Richard C. International Pellet Watch: Global monitoring of persistent organic pollutants (POPs) in coastal waters. 1. Initial phase data on PCBs, DDTs, and HCHs. Mar. Pollut. Bull. 2009, 58 (10): 1437-1446.
[72] NOAA Mussel Watch Program. “Mussel Watch Contaminant Monitoring.” 10 Mar 2011. Web. 28 June 2011. <http://ccma.nos.noaa.gov/about/coast/nsandt/musselwatch.aspx>.
[73] NCCOS. “International Mussel Watch Study.” National Centers for Coastal Ocean Science. 17 Feb 2011. Web. 28 June 2011. <http://ccma.nos.noaa.gov/stressors/pollution/assessments/as_intl_mw_study.aspx>.
[74] Zarfi, Christiane; Matthies, Michael. Are marine plastic particles transport vectors for organic pollutants to the Arctic? Mar. Pollut. Bull. 2010, 60 (10): 1810-1814.
[75] ATSDR. “Toxic Substances Portal.” Agency for Toxic Substance and Disease Registry. 3 March 2011. Web. 17 June 2011. <http://www.atsdr.cdc.gov/substances/index.asp>.
[76] ATSDR. “Public Health Statement for Hexachlorobenzene.” Toxic Substanced Portal: Agency for Toxic Substance and Disease Registry. CAS# 118-74-1. September 2002.
[77] Moore, C. J. Lattin, G. L.; Zellers, A. F. A brief analysis of organic pollutants sorbed to pre and postproduction plastic particles from the Los Angeles and San Gabriel River Watersheds. In: Proceedings of the Plastic Debris Rivers to Sea Conference, Algalita Marine Research Foundation, Long Beach, CA, 2005a.
[78] Oehlmann, Jorg et al. A critical analysis of the biological impacts of plasticizers on wildlife. Phil. Trans. R. Soc. B. 2009, 364: 2047-2062.
[79] Muncke, Jane. Exposure to endocrine disrupting compounds via the food chain: Is packaging a relevant source? Sci Tot. Envir. 2009, 407 (16): 4549-4559.
[80] David, R. M.; McKee, R. H.; Butala, J. H.; Barter, R. A.; Kayser, M. 2001. Esters of aromatic mono-, di-, and tricarboxylic acids, aro-matic diacids, and di-, tri-, or polyalcohols. In Patty’s Toxicology, vol 6 (eds E. Bingham, B. Cohrssen & C. H. Powell), pp. 635–932, 5th edn. New York, NY: John Wiley & Sons.
[81] Hauser, R., Duty, S.; Godfrey-Bailey, L; Calafat, A. M. Medications as a source of human exposure to phthalates. Environ. Health Per-spect. 2004, 112: 751–753.
[82] Talsness, C. E.; Andrade, A. J. M.; Kuriyama, S. N.; Taylor, J. A.; vom Saal, F. S. Components of plastic: experimental studies in animals and relevance for human health. Phil. Trans. R. Soc. B. 2009, 364: 2079–2096.
[83] Sajiki, J., Yonekubo, J. Leaching of bisphenol A (BPA) to seawater from polycarbonate plastic and its degradation by reactive oxygen species. Chemosphere. 2003, 51 (1): 55-62.
[84] American Chemical Society. “Hard plastics decompose in oceans, releasing endocrine disruptor BPA.” ScienceDaily. 24 March 2010. Web. 1 March 2011. <http://www.sciencedaily.com/releases/2010/03/100323184607.htm>.
[85] USEPA. “Endocrine Disruption Screening Program (EDSP).” United States Environmental Protection Agency. 22 Apr 2010. Web. 24 Jun 2011. <http://www.epa.gov/endo/pubs/edspoverview/whatare.htm>.
[86] Bauer, M. J.; Herrmann, R. Estimation of the environmental contamination by phthalic acid esters leaching from household wastes. Sci. Total Environ. 1997, 208: 49–57.
[87] Staples, C. A.; Woodburn, K.; Caspers, N.; Hall, A. T.; Klecka, G. M. A weight of evidence approach to the aquatic hazard assessment of bisphenol A. Hum. Ecol. Risk Assess. 2002, 8: 1083–1105.
[88] Foster, P. M. D. Disruption of reproductive development in male rat offspring following in utero exposure to phthalate esters. Int. J. Androl. 2006, 29: 140–147.
58
[89] Gray, L. E.; Ostby, J.; Furr, J.; Price, M.; Veeramachaneni, D. N. R.; Parks, L. Perinatal exposure to the phthalates DEHP, BBP, and DINP, but not DEP, DMP, or DOTP, alters sexual differentiation of the male rat. Toxicol. Sci. 2000, 58: 350–365.
[90] Lee, K. Y.; Shibutani, M.; Takagi, H.; Kato, N.; Takigami, S.; Uneyama, C.; Hirose, M. Diverse developmental toxicity of di-n-butyl phthalate in both sexes of rat offspring after maternal exposure during the period from late gestation through lactation. Toxicology, 2004, 203: 221–238.
[91] Tyl, R. W.; Myers, C. B.; Marr, M. C.; Fail, P. A.; Seely, J. C.; Brine, D. R.; Barter, R. A.; Butala, J. H. Reproductive toxicity evaluation of dietary butyl benzyl phthalate (BBP) in rats. Reprod. Toxicol. 2004, 18: 241–264.
[92] Koch, H. M.; Preuss, R.; Angerer, J. Di(2-ethylhexyl) phthalate (DEHP): human metabolism and internal exposure—an update and latest results. Int. J. Androl. 2006, 29: 155–165.
[93] Matsumoto, A.; Kunugita, N.; Kitagawa, K.; Isse, T.; Oyama, T.; Foureman, G. L.; Morita, M.; Kawamoto, T. Bisphenol A levels in human urine. Environ. Health Perspect. 2003, 111: 101–104.
[94] Canada Gazette. “Order Adding a Toxic Substance to Schedule 1 to the Canadian Environmental Protection Act, 1999.” SOR/2010-194 September 23, 2010. 10 Oct 2010. Web. 28 June 2011. < http://gazette.gc.ca/rp-pr/p2/2010/2010-10-13/html/sor-dors194-eng.html>.
[95] Austen, Ian. “ Canada Takes Steps to Ban Most Plastic Baby Bottles.” New York Times April 19, 2008. Web. 28 June 2011. <http://www.nytimes.com/2008/04/19/business/worldbusiness/19plastic.html>.
[96] European Commission. “Bisphenol A: EU ban on baby bottles to enter into force tomorrow.” Press Release, May 31, 2011. Reference: IP/11/664. Web. 28 June 2011. <http://europa.eu/rapid/pressReleasesAction.do?reference=IP/11/664&format=HTML>.
[97] Eriksson, C.; Burton, H. Origins and biological accumulation of small plastic particles in fur seals from Macquire Island. Ambio. 2003, 32: 380-384.
[98] Ryan, P. G.; Connel, A. D.; Gardner, B. D. Plastic ingestion and PCBs in seabirds: Is there a relationship? Mar. Pollut. Bull. 1998, 19: 174-176.
[99] Browne, M. A.; Dissanayke, A.; Galloway, T. S.; Lowe, D. M.; Thompson, R. C. Ingested microscopic platic translocates to the circula-tory system of the mussel, Mytilus edulis (L.). Environ. Sci. Technol. 2008, 42: 5026-5031.
[100] Teuten, Emma L.; Rowland, Steven J.; Galloway, Tamara S.; Thompson, Richard C. Potential for Plastics to Transport Hydrophobic Contaminants. Environ. Sci. Technol. 2007, 41: 7759-7764.
[101] Biggers, William J.; Laufer, Hans. Identification of Juvenile Hormone-Active Alkylphenols in the Lobster Homarus americanus and in Marine Sediments. Biol. Bull. 2004, 206: 13-24.
[102] Biggers, W. J.; Laufer, H. Detection of juvenile hormone-active compounds by larvae of the marine annelid Capitella sp. I. Arch. Insect Biochem. Physiol. 1996, 32: 475–484.
[103] Biggers, W. J.; Laufer, H. Chemical induction of settlement and metamorphosis of Capitella capitata sp. I. (Polychaetea) larvae by juvenile hormone-active compounds. Invertebr. Reprod. Dev. 1992, 22: 39–46.
[104] Laufer, H.; Biggers, J. W. Unifying concepts learned from methyl farnesoate for invertebrate reproduction and post-embryonic devel-opment. Am. Zool. 2001, 41: 442–457.
[105] Buckley, Christine. “Lobster Dieoffs Linked to Chemicals in Plastics.” UConn Today, University of Connecticut. Web. 10 Aug 2010. <http://today.unconn.edu/?p=18691>.
[106] Somers, Barbara. “Lobster Shell Disease Fact Sheet.” Rhode Island Sea Grant: Nov 2005. Web. 17 June 2011. <http://seagrant.gso.uri.edu/factsheets/lobster_shell_disease.html>.
[107] USEPA. “Invasive Species.” United States Environmental Protection Agency. 20 Nov 2009. Web. 10 Mar 2011. <http://www.epa.gov/greatlakes/invasive/>.
[108] USFWS. “Zebra Mussel: Economic Impact.” United States Fish and Wildlife Service. 31 Jan 2008. Web. 10 Mar 2011. <http://www.glsc.usgs.gov/main.php?content=research_invasive_zebramussel&title=Invasive%20Invertebrates0&menu=research_invasive_inverte-brates>.
[109] Sea Grant: University of Southern California. “Caulerpa Taxifola: Case Study.” Web. 16 Mar 2011. <http://www.usc.edu/org/seagrant/caulerpa/casestudy.html>.
59
[110] Barnes, D. K. A. Biodiversity: Invasions by marine life on plastic debris. Nature. 2002, 416: 808-809.
[111] Astudillo, J.C.; Bravo, M.; Dumont, C.P.; Thiel, M. Detached aquaculture buoys in the SE Pacific: potential dispersal vehicles for as-sociated organisms. Aquat. Biol. 2009, 5: 219-231.
[112] Barnes, D. K. A.; Sanderson, W. G. Latitudinal patterns in the colonization of marine debris. Proceedings of the 11th International Bryzoology Association Conference. 2000: 154-160.
[113] Rees, E. I. S.; Southward, A. J. Plastic flotsam as an agent for dispersal of Perforatus perfoatus (Cirripedia: Balanidae). J. Mar. Biol. 2008, Assoc. UK (JABA2-Biodiversity Records, published online).
[114] Masó, Mercedes; Garcés, Esther; Pagès, Francesc; Camp, Jordi. Drifting plastic debris as a potential vector for dispersing Harmful Algal Bloom (HAB) species. Sci. Mar. 2003, 67 (1): 107-111.
[115] Kanehiro, H.; Tokai, T.; Matuda, K. Marine litter composition and distribution on the sea-bed of Tokyo Bay. Fish. Eng. 1995, 31: 195–199.
[116] Katsanevakis, S.; Verriopoulos, G.; Nicolaidou, A.; Thessalou-Legaki, M. Effect of marine litter on the benthic megafauna of coastal soft bottoms: a manipulative field experiment. Mar. Pollut. Bull. 2007, 54: 771–778.
[117] Backhurst, M. K.; Cole, R. G. Subtidal benthic marine litter at Kawau Island, north-eastern New Zealand. J. Environ. Manage. 2000, 60: 227–237.
[118] Goldberg, E. D. Plasticizing the seafloor: an overview. Environ. Technol. 1997, 18: 195–202.
[119] Bartram, J.; Rees, G.; Monitoring Bathing Waters: A Practical Guide to the Design and Implementation of Assessments and Monitor-ing Programmes. 2000, Taylor & Francis, New York.
[120] Valle-Levinson, A. and R. L. Swanson. Wind-induced scattering of medically-related and sewage-related items. Mar. Technol. Soc. J. 1991, 25 (2): 49-56.
[121] NOEP. California’s Ocean Economy. National Ocean Economics Program. July 2005: 24-26.
[122] CaDoT. “Don’t Trash California Campaign.” CalTrans Maintenance Program. Web. 8 July 2011. <http://www.donttrashcalifornia.info/>.
[123] CaDoT. The California Department of Transportation Litter Abatement Plan. The California Department of Transportation Litter Abate-ment Task Force. 1 May, 2007.
[124] Los Angeles County. “An Overview of Carryout Bags in Los Angeles.” Los Angeles County Board of Supervisors Staff Report. August 2007.
[125] City of Los Angeles. “Los Angeles River Trash TMDL.” City of Los Angeles Stormwater Program. Web. 3 July 2011. <http://www.last-ormwater.org/Siteorg/program/TMDLs/tmdl_lariver_trash.htm>.
[126] California Ocean Protection Council. An Implementation Strategy for the California Ocean Protection Council Resolution to Reduce and Prevent Ocean Litter. 20 Nov 2008.
[127] CIWMB. Use and Disposal of Polystyrene in California: A Report to the California Legislature. Publication No. 432-04-003, 2004.
[128] Brink, P. ten; Lutchman, I.; Bassi, S.; Speck, S.; Sheavly, S.; Register, K. Woolaway, C. Guidelines on the Use of Market-based Instru-ments to Address the Problem of Marine Litter. Institute for European Environmental Policy (IEEP), Brussels, Belgium, and Sheavely Consul-tants. Virginia Beach, USA, 2009.
[129] UNEP. Marine Litter: A global Challenge. Nairobi: United Nations Environment Program. 2009: 232 pp.
[130] Hall, K. Impacts of Marine Debris and Oil. Economic & Social Costs to Coastal Communities. Kommunenes Iternasjonale Miljoorgan-isasjon (KIMO), 2009.
[131] Gilpin,R.; Wagel, D.; Solch, J. Production, distribution, and fate of polycholorinated dibenzo-p-dioxins, dibenzofurans, and related organohalogens in the environment. In Dioxins and health (eds A. Schecter & T. Gasiewicz), 2nd edn. Hoboken, NJ: John Wiley & Sons Inc, 2003.
[132] NOAA Marine Debris Program. “Nets to Energy Program.” 7 June 2011. Web. 17 June 2011. <http://marinedebris.noaa.gov/projects/netstoenergy.html>.
60
[133] NOAA Marine Debris Program. “Fishing for Energy Program.” 7 June 2011. Web. 17 June 2011. <http://marinedebris.noaa.gov/proj-ects/fishing4energy.html>.
[134] Mooney, Brian P. The second green revolution? Production of plant-based biodegradable plastics. Biochem. J. 2009, 418: 219-232.
[135] Blest Company, Ltd. “Waste Plastic Oiling System.” Web. 22 March 2011. <http://www.blest.co.jp/seihin-english.html>.
[136] USEPA. Municipal Solid Waste Generation in the United States, 1999. Prepared by Franklin Associates, Ltd. for the United States Environmental Protection Agency, Washington, D.C., 2000.
[137] Loughlin, Daniel H.; Barlaz, Morton A. Critical Review: Policies for Strengthening Markets for Recyclables: A Worldwide Perspective. Environ. Sci. & Technol. 2006, 36: 287-326.
[138] EuPC (European Plastics Converters), EPRO (European Association of Plastics Recycling and Recovery Organizations), EuPR (Euro-pean Plastics Recyclers) and PlasticsEurope. 2009. The Compelling Facts About Plastics 2009: An analysis of European plastic productivity, demand and recovery for 2008.
[139] CalRecycle. “Beverage Container Recycling.” 24 January 2011. Web. 22 March 2011. <http://www.calrecycle.ca.gov/bevcontainer/>.
[140] CIWMB. Contractor’s Report to the Board: Postconsumer Resin Quality Assurance and Testing Protocol. Produced under contract with the California Integrated Waste Management Board by Chico State University, Chico Research Foundation, 2005.
[141] CalRecycle. “Recycled-Content Trash Bag Program.” 26 Jan 2011. Web. 6 July 2011. <http://www.calrecycle.ca.gov/buyrecycled/trashbags/>.
[142] CalRecycle. “Hospital Blue Wrap.” CalRecycle Hospital Waste Reduction and Recycling Team. Document: IWMB-2009-004.
[143] CIWMB. “Recycled Plastic Lumber.” California Integrated Waste Management Board. 8 Nov 2010. Web. 16 Feb 2011. <http://www.calrecycle.ca.gov/Plastics/recycled/lumber/>.
[144] CIWMB. Contractor’s Report to the Board: Postconsumer Agricultural Plastic Report. Produced under contract with the California Integrated Waste Management Board by Sea Hurley, California Polytechnic State University, Publication No. IWMB-2008-019, 2008.
[145] Seadoc. California Lost Fishing Gear Recovery Project. Web. 20 July 2011. <http://www.seadocsociety.org/lostfishinggear>.
[146] National Academy of Sciences. Briefing for Ocean Studies Board: Tackling Marine Debris in the 21st Century. Presented by the Com-mittee on Effectiveness of International and National Measures to Prevent and Reduce Marine Debris and Its Impacts. October, 23, 2008.
[147] NOAA Oean and Coastal Resource Management. “Clean Marina Program.” 17 Sept 2010. Web. 22 July 2011. <http://coastalmanage-ment.noaa.gov/marinas.html>.
[148] 5th International Marine Debris Conference. “Workshop on the importance of adequate port reception facilities (for ship generated waste) in reducing marine debris.” March 20-25, 2011, Honolulu, HI. Web. <http://www.5imdc.org/>.
[149] CIWMB. Overall Framework for an Extended Producer Responsibility System in California. California Integrated Waste Management Board Meeting, Agenda Item 12, Attachment 1. January 23, 2008. Web. 22 July 2011. <http://www.calrecycle.ca.gov/EPR/Framework/Framework.pdf>.
[150] Smith, D. “National Takeback and Recycling Program.” Sony Electronics Inc. 24 June 2010. Web. 22 July 2011. <http://www.calre-cycle.ca.gov/EPR/Framework/2008April/Presentation/Smith.pdf>.
[151] Allen, J. “Cradle-to-Cradle: Achieving the Vision Through Remanufacturing.” Caterpillar Reman Services. 24 June 2010. Web. 22 July 2011. <http://www.calrecycle.ca.gov/agendas/mtgdocs/2008/05/00023461.pdf>.
[152] CalRecycle. “About EPR and Product Stewardship at CalRecycle.” 24 June 2010. Web. 22 July 2011. <http://www.calrecycle.ca.gov/EPR/About.htm>.
[153] CalRecycle. “Policy and Law: Product Stewardship and Extended Producer Responsibility (EPR).” 10 Dec 2010. Web. 22 July 2011. <http://www.calrecycle.ca.gov/EPR/PolicyLaw/default.htm>.
[154] CalRecycle. “Reduce Waste: Packaging.” 24 January 2011. Web. 22 March 2011. <http://www.calrecycle.ca.gov/ReduceWaste/Pack-aging/default.htm>.
[155] White House, President Barack Obama. National Ocean Policy. Issued as Executive Order, July 19, 2011. Web. 22 July 2011. <http://www.whitehouse.gov/files/documents/2010stewardship-eo.pdf>.
61
[156] NOC. “Strategic Action Plans.” National Ocean Council. Web. 22 July 2011. <http://www.whitehouse.gov/administration/eop/oceans/sap>.
[157] NOC. “Water Quality and Sustainable Practices on Land Strategic Action Plan.” National Ocean Council. 2 June 2011. Web. 22 July 2011. <http://www.whitehouse.gov/sites/default/files/microsites/ceq/sap_7_water_quality_full_content_outline_06-02-11_clean.pdf>.
[158] WCGA. West Coast Governors’ Agreement on Ocean Health. 15 Apr 2011. Web. 20 July 2011. <http://westcoastoceans.gov/>.
[159] California Ocean Protection Council. Resolution to Reduce and Prevent Ocean Litter. 8 Feb 2007.
[160] Dolan, M. “Plastic bag bans upheld by California Supreme Court.” The Los Angeles Times. 15 July 2011. < http://articles.latimes.com/2011/jul/15/local/la-me-0715-plastic-bags-20110715>.
[161] Californians Against Waste. “Plastic Bags: Local Ordinances.” Web. 23 July 2011. <http://www.cawrecycles.org/issues/plastic_cam-paign/plastic_bags/local>.
[162] Romer, J.R. The Evolution of San Francisco’s Plastic-Bag Ban. Golden Gate U. Envtl. L.J. 2007, 1 (2)(5): 439-468.
[163] City of Santa Monica. “Container Ban Frequently Asked Questions.” City Office of Sustainability and the Environment. Web. 25 April 2011. <http://www.smgov.net/Departments/OSE/Business/Container_Ban_Frequently_Asked_Questions.aspx>.
[164] Californians Against Waste. “Polystyrene: Local Ordinances.” Web. 23 July 2011. <http://www.cawrecycles.org/issues/plastic_cam-paign/polystyrene/local>.
[165] City of Santa Monica. “’Smart’ Beach Cans Rolled-Out for Summer Season.” City Office of Sustainability and the Environment. Web. 8 July 2011. <http://www.smgov.net/departments/ose/>.
[166] Carpenter, Susan. “Trash cans get ‘smart’ at Santa Monica State Beach.” The Los Angeles Times. 1 June 2011. <http://latimesblogs.latimes.com/greenspace/2011/06/smart-trash-can.html>.
[167] CalRecycle. “Schools.” 25 October 2011. Web. 22 March 2011. <http://www.calrecycle.ca.gov/ReduceWaste/Schools/#Help >.
[168] ASTM. “Standard Specification for Compostable Plastics.” American Society for Testing and Materials Standard No. D6400.
[169] CIWMB. Contractor’s Report to the Board: Performance Evaluation of Environmentally Degradable Plastic Packaging and Dispos-able Food Service Ware-Final Report. Produced under contract with the California Integrated Waste Management Board by California State University Chico Research Foundation. Publication No. 432-08-001, 2007.
[170] ASTM. “Standard Test Method for Determining Aerobic Biodegradation of Plastic Materials in the Marine Environment by a Defined Microbial Consortium or Natural Sea Water Inoculum.” American Society for Testing and Materials Standard No. D6691.
[171] ASTM. “Standard Specification for Non-Floating Biodegradable Plastics in the Marine Environment.” American Society for Testing and Materials Standard No. D7081.
[172] Song, J.H.; Murphy, R.J.; Narayan, R.; Davies, G.B.H. Biodegradable and compostable alternatives to conventional plastics. Phil. Trans. R. Soc. B. 2009, 364 (1526): 2127-2139.
[173] CIWMB. Contractor’s Report to the Board: California 2004 Statewide Waste Characterization Study. Produced under contract with the California Integrated Waste Management Board by Cascadia Consulting Group, 2004.
[174] CalRecycle. “Plastic Information and Resources.” 23 February 2010. Web. 16 August 2011. <http://www.calrecycle.ca.gov/Plastics/>.
[175] Fevert, Kathy, CalRecycle. Personal communication regarding recycling rates for plastic in Califonria. 26 Aug 2011.
[176] SWRCB. California Regional Water Quality Control Board San Francisco Bay Region Municipal Regional Stormwater NPDES Permit. State Water Resources Control Board. Order R2-2009-0074, NPDES Permit No. CAS612008, Issued October 14, 2009.
[177] SWRCB. Preproduction Plastic Debris Program. State Water Resources Control Board. 5 May 2011. Web. 1 Sept 2011. <http://www.swrcb.ca.gov/water_issues/programs/stormwater/plasticdebris.shtml>.
[178] CalRecycle. “At-Store Recycling Program: Plastic Carryout Bags.” 6 April 2011. Web. 23 July 2011. <http://www.calrecycle.ca.gov/Plastics/AtStore/default.htm>.
[179] CIWMB. Staff Report, Agenda Item 14. California Integrated Waste Management Board. June 12, 2007.

62
# Non-peer-reviewed (“gray”) literature* Contains specific information on California
#5th International Marine Debris Conference. “Workshop on learning shoreline assessment protocols for marine debris.” March 20-25, 2011, Honolulu, HI. Web. <http://www.5imdc.org/>.
#5th International Marine Debris Conference. “Workshop on the importance of adequate port reception facilities (for ship generated waste) in reducing marine debris.” March 20-25, 2011, Honolulu, HI. Web. <http://www.5imdc.org/>.
#Allen, J. “Cradle-to-Cradle: Achieving the Vision Through Remanufacturing.” Caterpillar Reman Services. 24 June 2010. Web. 22 July 2011. <http://www.calrecycle.ca.gov/agendas/mtgdocs/2008/05/00023461.pdf>.
#American Chemical Society. “Hard plastics decompose in oceans, releasing endocrine disruptor BPA.” ScienceDaily. 24 March 2010. Web. 1 March 2011. <http://www.sciencedaily.com/releases/2010/03/100323184607.htm>.
#American Chemistry Council. “Lifecycle of a Plastic Product.” Web. 3 July 2011. < http://plastics.americanchemistry.com/Life-Cycle>.
#American Chemistry Council. “Operation Clean Sweep Pellet Handling Manual.” 2010. Web. 3 July 2011. <www.opcleansweep.org>.
#ASTM. “Standard Specification for Compostable Plastics.” American Society for Testing and Materials Standard No. D6400.
#ASTM. “Standard Test Method for Determining Aerobic Biodegradation of Plastic Materials in the Marine Environment by a Defined Mi-crobial Consortium or Natural Sea Water Inoculum.” American Society for Testing and Materials Standard No. D6691.
#ASTM. “Standard Specification for Non-Floating Biodegradable Plastics in the Marine Environment.” American Society for Testing and Materials Standard No. D7081.
#ATSDR. “Toxic Substances Portal.” Agency for Toxic Substance and Disease Registry. 3 March 2011. Web. 17 June 2011. <http://www.atsdr.cdc.gov/substances/index.asp>.
#ATSDR. “Public Health Statement for Hexachlorobenzene.” Toxic Substanced Portal: Agency for Toxic Substance and Disease Registry. CAS# 118-74-1. September 2002.
#Austen, Ian. “ Canada Takes Steps to Ban Most Plastic Baby Bottles.” New York Times April 19, 2008. Web. 28 June 2011. <http://www.nytimes.com/2008/04/19/business/worldbusiness/19plastic.html>.
Astudillo, J.C.; Bravo, M.; Dumont, C.P.; Thiel, M. Detached aquaculture buoys in the SE Pacific: potential dispersal vehicles for associated organisms. Aquat. Biol. 2009, 5: 219-231.
Backhurst, M. K.; Cole, R. G. Subtidal benthic marine litter at Kawau Island, north-eastern New Zealand. J. Environ. Manage. 2000, 60: 227–237.
Barnes, David K. A.; Galganai, Francois; Thompson, Richard C.; Barlaz, Morton. Accumulation and fragmentation of plastic debris in global environments. Phil. Trans. R. Soc. B. 2009, 364: 1985-1998.
Barnes, D. K. A. Biodiversity: Invasions by marine life on plastic debris. Nature. 2002, 416: 808-809.
Barnes, D. K. A.; Milner, P. Drifting plastic and its consequences for sessile organisms dispersal in the Atlantic Ocean. Mar. Biol. 2005, 146 (4): 815-825.
Barnes, D. K. A.; Sanderson, W. G. Latitudinal patterns in the colonization of marine debris. Proceedings of the 11th International Bryzool-ogy Association Conference. 2000: 154-160.
Bartram, J.; Rees, G.; Monitoring Bathing Waters: A Practical Guide to the Design and Implementation of Assessments and Monitoring Pro-grammes. 2000, Taylor & Francis, New York.
References (Alphabetical)
63
Bauer, M. J.; Herrmann, R. Estimation of the environmental contamination by phthalic acid esters leaching from household wastes. Sci. Total Environ. 1997, 208: 49–57.
Biggers, William J.; Laufer, Hans. Identification of Juvenile Hormone-Active Alkylphenols in the Lobster Homarus americanus and in Marine Sediments. Biol. Bull. 2004, 206: 13-24.
Biggers, W. J.; Laufer, H. Detection of juvenile hormone-active compounds by larvae of the marine annelid Capitella sp. I. Arch. Insect Biochem. Physiol. 1996, 32: 475–484.
Biggers, W. J.; Laufer, H. Chemical induction of settlement and metamorphosis of Capitella capitata sp. I. (Polychaetea) larvae by juvenile hormone-active compounds. Invertebr. Reprod. Dev. 1992, 22: 39–46.
#Blest Company, Ltd. “Waste Plastic Oiling System.” Web. 22 March 2011. < http://www.blest.co.jp/seihin-english.html>
Bojes Heidi K.; Pope, Peter G. Characterization of EPA’s 16 priority pollutant polycyclic aromatic hydrocarbons (PAHs) in tank bottom solids and associated contaminated soils at oil exploration and production sites in Texas. Reg Toxicol. Pharm. 2007, 47: 288-295.
Boerger, Christiana M.; Lattin, Gwendolyn L.; Moore, Shelly L.; Moore, Charles J. Plastic ingestion by planktivorous fishes in the North Pacific Central Gyre. Mar. Pol. Bull. 2010, 60: 2275-2278.
#Brink, P. ten; Lutchman, I.; Bassi, S.; Speck, S.; Sheavly, S.; Register, K. Woolaway, C. Guidelines on the Use of Market-based Instruments to Address the Problem of Marine Litter. Institute for European Environmental Policy (IEEP), Brussels, Belgium, and Sheavely Consultants. Virginia Beach, USA, 2009.
Brown, James; Macfadyen, Graeme. Ghost fishing in European waters: Impacts and management responses. Mar. Pol. 2007, 31 (4): 488-504.
Browne, M. A.; Dissanayke, A.; Galloway, T. S.; Lowe, D. M.; Thompson, R. C. Ingested microscopic platic translocates to the circulatory system of the mussel, Mytilus edulis (L.). Environ. Sci. Technol. 2008, 42: 5026-5031.
#Buckley, Christine. “Lobster Dieoffs Linked to Chemicals in Plastics.” UConn Today, University of Connecticut. Web. 10 Aug 2010. <http://today.unconn.edu/?p=18691>.
*#CaDoT. “Don’t Trash California Campaign.” CalTrans Maintenance Program. Web. 8 July 2011. <http://www.donttrashcalifornia.info/>.
*#CaDoT. The California Department of Transportation Litter Abatement Plan. The California Department of Transportation Litter Abatement Task Force. 1 May, 2007.
*# CaDoT. Final Report: District 7 Litter Management Pilot Study. Produced under contract by URS Greiner, Woodward, Clyde, No. 43A0004C. 2000, California Department of Transportation No. CT-SW-RT-00-013.
*#California Ocean Protection Council. An Implementation Strategy for the California Ocean Protection Council Resolution to Reduce and Prevent Ocean Litter. 20 Nov 2008.
*#California Ocean Protection Council. Resolution to Reduce and Prevent Ocean Litter. 8 Feb 2007.
*#CalRecycle. “About EPR and Product Stewardship at CalRecycle.” 24 June 2010. Web. 22 July 2011. <http://www.calrecycle.ca.gov/EPR/About.htm>.
*#CalRecycle. “At-Store Recycling Program: Plastic Carryout Bags.” 6 April 2011. Web. 23 July 2011. <http://www.calrecycle.ca.gov/Plas-tics/AtStore/default.htm>.
*#CalRecycle. “Beverage Container Recycling.” 24 January 2011. Web. 22 March 2011. <http://www.calrecycle.ca.gov/bevcontainer/>.
*#CalRecycle. “Hospital Blue Wrap.” CalRecycle Hospital Waste Reduction and Recycling Team. Document: IWMB-2009-004.
*#CalRecycle. “Plastic Information and Resources.” 23 February 2010. Web. 16 August 2011. <http://www.calrecycle.ca.gov/Plastics/>.
*#CalRecycle. “Policy and Law: Product Stewardship and Extended Producer Responsibility (EPR).” 10 Dec 2010. Web. 22 July 2011. <http://www.calrecycle.ca.gov/EPR/PolicyLaw/default.htm>.
*#CalRecycle. “Recycled-Content Trash Bag Program.” 26 Jan 2011. Web. 6 July 2011. <http://www.calrecycle.ca.gov/buyrecycled/trash-bags/>.
64
*#CalRecycle. “Reduce Waste: Packaging.” 24 January 2011. Web. 22 March 2011. <http://www.calrecycle.ca.gov/ReduceWaste/Packag-ing/default.htm>.
*#CalRecycle. “Schools.” 25 October 2011. Web. 22 March 2011. <http://www.calrecycle.ca.gov/ReduceWaste/Schools/#Help >.
*#Californians Against Waste. “Plastic Bags: Local Ordinances.” Web. 23 July 2011. <http://www.cawrecycles.org/issues/plastic_campaign/plastic_bags/local>.
*#Californians Against Waste. “Polystyrene: Local Ordinances.” Web. 23 July 2011. <http://www.cawrecycles.org/issues/plastic_campaign/polystyrene/local>.
#Canada Gazette. “Order Adding a Toxic Substance to Schedule 1 to the Canadian Environmental Protection Act, 1999.” SOR/2010-194 September 23, 2010. 10 Oct 2010. Web. 28 June 2011. < http://gazette.gc.ca/rp-pr/p2/2010/2010-10-13/html/sor-dors194-eng.html>.
*#Carpenter, Susan. “Trash cans get ‘smart’ at Santa Monica State Beach.” The Los Angeles Times. 1 June 2011. <http://latimesblogs.latimes.com/greenspace/2011/06/smart-trash-can.html>.
Carr, Archie. Impacts of nondegradable marine debris on the ecology and survival outlook of sea turtles. Mar. Pol. Bull. 1987, 18 (6) (2): 352-356.
*#CCC. California Coastal Commission Public Education Program for California Coastal Cleanup Day. Web. 23 Feb 2011. <http://www.coastal.ca.gov/publiced/ccd/ccd.html>.
*#City of Los Angeles. “Los Angeles River Trash TMDL.” City of Los Angeles Stormwater Program. Web. 3 July 2011. <http://www.lastorm-water.org/Siteorg/program/TMDLs/tmdl_lariver_trash.htm>.
*#City of Santa Monica. “Container Ban Frequently Asked Questions.” City Office of Sustainability and the Environment. Web. 25 April 2011. <http://www.smgov.net/Departments/OSE/Business/Container_Ban_Frequently_Asked_Questions.aspx>.
*#City of Santa Monica. “’Smart’ Beach Cans Rolled-Out for Summer Season.” City Office of Sustainability and the Environment. Web. 8 July 2011. <http://www.smgov.net/departments/ose/>.
*#CIWMB. “Recycled Plastic Lumber.” California Integrated Waste Management Board. 8 Nov 2010. Web. 16 Feb 2011. <http://www.calrecycle.ca.gov/Plastics/recycled/lumber/>.
*#CIWMB. Contractor’s Report to the Board: California 2008 Statewide Waste Characterization Study. Produced under contract with the California Integrated Waste Management Board by Cascadia Consulting Group, 2008.
*#CIWMB. Contractor’s Report to the Board: Postconsumer Agricultural Plastic Report. Produced under contract with the California Inte-grated Waste Management Board by Sea Hurley, California Polytechnic State University, Publication No. IWMB-2008-019, 2008.
*#CIWMB. Overall Framework for an Extended Producer Responsibility System in California. California Integrated Waste Management Board Meeting, Agenda Item 12, Attachment 1. January 23, 2008. Web. 22 July 2011. <http://www.calrecycle.ca.gov/EPR/Framework/Framework.pdf>.
*#CIWMB. Contractor’s Report to the Board: Performance Evaluation of Environmentally Degradable Plastic Packaging and Disposable Food Service Ware-Final Report. Produced under contract with the California Integrated Waste Management Board by California State Uni-versity Chico Research Foundation. Publication No. 432-08-001, 2007.
*#CIWMB. Staff Report, Agenda Item 14. California Integrated Waste Management Board. June 12, 2007.
*#CIWMB. Contractor’s Report to the Board: Postconsumer Resin Quality Assurance and Testing Protocol. Produced under contract with the California Integrated Waste Management Board by Chico State University, Chico Research Foundation, 2005.
*#CIWMB. Use and Disposal of Polystyrene in California: A Report to the California Legislature. Publication No. 432-04-003, 2004.
*#CIWMB. Contractor’s Report to the Board: California 2004 Statewide Waste Characterization Study. Produced under contract with the California Integrated Waste Management Board by Cascadia Consulting Group, 2004.
*#CIWMB. Plastics White Paper: Optimizing Plastics Use, Recycling, and Disposal in California. California Integrated Waste Management Board, 2003.
#Copeland, Claudia. Cruise Ship Pollution: Background, Laws and Regulations, and Key Issues. CRS Report for Congress, order code: RL32450. Updated 6 Feb 2008.

65
Dameron, Oliver J.; Park, Michael; Albins, Mark A.; Brainard, Russel. Marine debris accumulation in the Northwestern Hawaiian Islands: An examination of rates and processes. Mar. Pollut. Bull. 2007, 54 (4): 423-433.
*Dau, B.K.; Gilardi, K.V.K.; Gulland, F.M.; Higgins, A.; Holcomb, J.B.; St. Leger, J.; Ziccardi, M.H. Fishing gear-related injury in California marine wildlife. J. Mar. Wild Dis. 2009, 45 (2): 355-362.
David, R. M.; McKee, R. H.; Butala, J. H.; Barter, R. A.; Kayser, M. 2001. Esters of aromatic mono-, di-, and tricarboxylic acids, aromatic diacids, and di-, tri-, or polyalcohols. In Patty’s Toxicology, vol 6 (eds E. Bingham, B. Cohrssen & C. H. Powell), pp. 635–932, 5th edn. New York, NY: John Wiley & Sons.
Davidson, P.; Asch, R. G. Plastic ingestion by mesopelagic fishes in the North Pacific Subtropical Gyre. Mar. Ecol. Prog. Ser. 2011, 432: 173-180.
Derraik, J. G. B. The Pollution of the marine environment by plasti debris: a review. Mar. Poll. Bull. 2002, 44 (9): 842-852.
*#DoDolan, M. “Plastic bag bans upheld by California Supreme Court.” The Los Angeles Times. 15 July 2011. < http://articles.latimes.com/2011/jul/15/local/la-me-0715-plastic-bags-20110715>.
Donohue, M. J.; Foley, D. G. Remote Sensing Revealing Links Among the Endangered Hawaiian Monk Seal, Marine Debris, and El Nino. Mar. Mamm. Sci. 2007, 23 (2): 468-473.
Doyle, Miriam J.; Watson, William; Bowlin, Noelle M.; Sheavly, Seba B. Plastic particles in coastal pelagic ecosystems of the Northeast Pacific ocean. Mar. Environ. Res. 2011, 71 (1): 41-52.
Ebbesmeyer, C. Scigliano, E. Flotsametrics and the Floating World: How One Man’s Obsession with Runaway Sneakers and Rubber Ducks Revolutionized Ocean Science. Smithsonian Books/Collins/HarperCollins, Washington, DC, 2009.
Ebbesmeyer, C. C.; Ingraham Jr.; Royer, T. C.; Grosch, C. E. Tub Toys Orbit the Pacific Subarctic Gyre. EOS. 2007, 88 (1): 1-12.
Endo, Satoshi; Takizawa, Reiko; Okuda, Keiji; Takada, Hideshige; Chiba, Kazuhiro; Kanehiro, Haruyuki; Ogi, Haruo; Yamashita, Rei; Date, Takeshi. Concentration of polychlorinated biphenyls (PCBs) in beached resin pellets: Variability among individual particles and regional dif-ferences. Mar. Pollut. Bull. 2005, 50 (10): 1103-1114.
Eriksson, C.; Burton, H. Origins and biological accumulation of small plastic particles in fur seals from Macquire Island. Ambio. 2003, 32: 380-384.
#European Commission. “Bisphenol A: EU ban on baby bottles to enter into force tomorrow.” Press Release, May 31, 2011. Reference: IP/11/664. Web. 28 June 2011. <http://europa.eu/rapid/pressReleasesAction.do?reference=IP/11/664&format=HTML>.
#EuPC (European Plastics Converters), EPRO (European Association of Plastics Recycling and Recovery Organizations), EuPR (European Plastics Recyclers) and PlasticsEurope. 2009. The Compelling Facts About Plastics 2009: An analysis of European plastic productivity, de-mand and recovery for 2008.
*#Fevert, Kathy, CalRecycle. Personal communication regarding recycling rates for plastic in Califonria. 26 Aug 2011.
#Franeker, J.A van.; Meijboom, A.; de jong, M.; Verdaat, H. (2010). Fulmar litter EcoQO monitoring in the Netherlands 1979-2007 in rela-tion to EU Directive 200/59/EC on Port Reception Facilities. Report nr: CO32/09. IMARES Wageningen UR.
Foster, P. M. D. Disruption of reproductive development in male rat offspring following in utero exposure to phthalate esters. Int. J. Androl. 2006, 29: 140–147.
Galgani, F.; Leaute, J. P.; Moguedet, P.; Souplet, A.; Verin, Y.; Capentier, A.; Goraguer, H.; Latrouite, D.; Andral, B.; Cadiou, Y.; Mahe, J. C.; Poulard, J. C.; Nerisson, P. Litter on the Sea Floor Along European Coasts. Mar. Pol. Bull. 2000, 40 (6): 516-527.
*#Gilfillan, L.R.; Ohman, M.D.; Doyle, M.J.; Watson, W. Occurrence of Plastic Micro-Debris in the Southern California Current System. CalCOFI Rep., Vol 50, 2009.
Gilpin,R.; Wagel, D.; Solch, J. Production, distribution, and fate of polycholorinated dibenzo-p-dioxins, dibenzofurans, and related organo-halogens in the environment. In Dioxins and health (eds A. Schecter & T. Gasiewicz), 2nd edn. Hoboken, NJ: John Wiley & Sons Inc, 2003.
Goldberg, E. D. Plasticizing the seafloor: an overview. Environ. Technol. 1997, 18: 195–202.
Gray, L. E.; Ostby, J.; Furr, J.; Price, M.; Veeramachaneni, D. N. R.; Parks, L. Perinatal exposure to the phthalates DEHP, BBP, and DINP, but not DEP, DMP, or DOTP, alters sexual differentiation of the male rat. Toxicol. Sci. 2000, 58: 350–365.
66
Gregory, M. R.; Andrady, A. L. 2003. Plastics in the marine environment. In: Andrady, AlL. (Ed.), Plastics and the Environment. John Wiley and Sons, Inc., Hoboken, New Jersey, pp. 379-401.
Gregory, M.R. Environmental implications of plastic debris in marine settings—entanglement, ingestion, smothering, hangers-on, hitch-hiking and alien invasions. Phil. Trns. R. Soc. B. 2009, 364: 2013-2025.
#Hall, K. Impacts of Marine Debris and Oil. Economic & Social Costs to Coastal Communities. Kommunenes Iternasjonale Miljoorganisas-jon (KIMO), 2009.
Hauser, R., Duty, S.; Godfrey-Bailey, L; Calafat, A. M. Medications as a source of human exposure to phthalates. Environ. Health Perspect. 2004, 112: 751–753.
Hopewell, J.; Dvorak, R.; Kosior, E. Plastics recycling: challenges and opportunities. Phil. Trans. R. Soc. B. 2009, 364: 2115-2126.
#IMO. Status of Multilateral Conventions and Instruments in Respect of which the International Maritime Organization or its Secretary Gen-eral Performs Depositary or Other Functions. International Maritime Organization Report, 31 May 2011. Web. 30 Jun 2011. < L:\LED\LO\MS-Depositary\STATUS OF MULTILATERAL CONVENTIONS\Status - 2011.docx>.
*Jacobsen, J. K.; Massey, L.; Gulland, F. Fatal Ingestion of floating net debris by two sperm whales (Physeter macrocephalus). Mar. Poll. Bull. 2010, 60 (5): 765-767.
Kanehiro, H.; Tokai, T.; Matuda, K. Marine litter composition and distribution on the sea-bed of Tokyo Bay. Fish. Eng. 1995, 31: 195–199.
Katsanevakis, S.; Verriopoulos, G.; Nicolaidou, A.; Thessalou-Legaki, M. Effect of marine litter on the benthic megafauna of coastal soft bot-toms: a manipulative field experiment. Mar. Pollut. Bull. 2007, 54: 771–778.
*Keller, Aimee A.; Fruh, Erica L.; Johnson, Melanie M.; Simon, Victor; McGourty, Catherine. Distribution and abundance of anthropogenic marine debris along the shelf and slope of the US West Coast. Mar. Pollut. Bull. 2010, 60 (5): 692-700.
Koch, H. M.; Calafat, Antonia M. Human body burdens of chemicals used in plastic manufacture. Phil. Trans. R. Soc. B. 2009, 364: 2063-2078.
Koch, H. M.; Preuss, R.; Angerer, J. Di(2-ethylhexyl) phthalate (DEHP): human metabolism and internal exposure—an update and latest results. Int. J. Androl. 2006, 29: 155–165.
Laist, D. W. Impacts of marine debris: entanglement of marine life in marine debris including a comprehensive list of species with entangle-ment and ingestion records. Pp. 99–139 in J. M. Coe and D. B. Rogers, eds., Marine Debris- Sources, Impacts, and Solutions. New York: Springer-Verlag, 1997.
Laist, David W. Overview of the biological effects of lost and discarded plastic debris in the marine environment. Mar. Poll. Bull. 1987, 18 (6) (2): 319-326.
*Lang, Richard C.; Laursen, Duane; Danner, Brenda. Stewardson, Nickol; Thompson, Richard C. International Pellet Watch: Global moni-toring of persistent organic pollutants (POPs) in coastal waters. 1. Initial phase data on PCBs, DDTs, and HCHs. Mar. Pollut. Bull. 2009, 58 (10): 1437-1446.
*Lattin, G. L.; Moore, C. J.; Zellers, K. A. F.; Moore, S. L.; Weisberg, S. B. A comparison of neustonic plastic and zooplankton at different depths near the southern California shore. Mar. Pollut. Bull. 2004, 49: 291-294.
Laufer, H.; Biggers, J. W. Unifying concepts learned from methyl farnesoate for invertebrate reproduction and post-embryonic development. Am. Zool. 2001, 41: 442–457.
Lee, K. Y.; Shibutani, M.; Takagi, H.; Kato, N.; Takigami, S.; Uneyama, C.; Hirose, M. Diverse developmental toxicity of di-n-butyl phthal-ate in both sexes of rat offspring after maternal exposure during the period from late gestation through lactation. Toxicology, 2004, 203: 221–238.
*#Los Angeles County. “An Overview of Carryout Bags in Los Angeles.” Los Angeles County Board of Supervisors Staff Report. August 2007.
Loughlin, Daniel H.; Barlaz, Morton A. Critical Review: Policies for Strengthening Markets for Recyclables: A Worldwide Perspective. Envi-ron. Sci. & Technol. 2006, 36: 287-326.
Mato, Yukie; Isobe, Tomohiko; Takada, Hideshige; Kanehiro, Haruyuki; Ohtake, Chiyoko; Kaminuma, Tsuguchika. Plastic Resin Pellets as a Transport Mechanism for Toxic Chemicals in the Marine Environment. Environ. Sci. Technol. 2001, 35 (2): 318-324.
67
Masó, Mercedes; Garcés, Esther; Pagès, Francesc; Camp, Jordi. Drifting plastic debris as a potential vector for dispersing Harmful Algal Bloom (HAB) species. Sci. Mar. 2003, 67 (1): 107-111.
Matsumoto, A.; Kunugita, N.; Kitagawa, K.; Isse, T.; Oyama, T.; Foureman, G. L.; Morita, M.; Kawamoto, T. Bisphenol A levels in human urine. Environ. Health Perspect. 2003, 111: 101–104.
McDermid, Karla J.; McMullen, Tracy L. Quantitative analysis of small-plastic debris on beaches in the Hawaiian archipelago. Mar. Pollut. Bull. 2004, 48: 790-794.
#Mehta, A. China-India Plastics Industry Summit 2007—Visit Report. Summit of Chinese and Indian Plastic Industrties, Guanzhou, China, May 20, 2007.
Mooney, Brian P. The second green revolution? Production of plant-based biodegradable plastics. Biochem. J. 2009, 418: 219-232.
*Moore, E.; Lyday, S.; Roletto, J. Litle, K.; Parrish, J.K.; Nevins, H.; Harvey, J.; Mortenson, J.; Greig, D.; Piazza, M.; Hermance, A.; Lee, D.; Adams, D.; Allen, S.; Kell, S. Entanglements of marine mammals and seabirds in central California and the north-west coast of the United States 2001–2005. Mar. Pollut. Bull. 2009, 58 (7): 1045-1051.
Moore, C. J. Synthetic polymers in the marine environment: A rapidly increasing long-term threat. Environ. Res. 2008, 108: 131-139.
*#Moore, C. J. Lattin, G. L.; Zellers, A. F. A brief analysis of organic pollutants sorbed to pre and postproduction plastic particles from the Los Angeles and San Gabriel River Watersheds. In: Proceedings of the Plastic Debris Rivers to Sea Conference, Algalita Marine Research Foundation, Long Beach, CA, 2005a.
*#Moore, C. J. Lattin, G. L.; Zellers, A. F. Working our way upstream: a snapshot of landbased contributions of plastic and other trash to coastal waters and beaches of Southern California. In: Proceedings of the Plastic Debris Rivers to Sea Conference, Algalita Marine Research Foundation, Long Beach, CA, 2005b.
*#Moore, C. J. Lattin, G. L.; Zellers, A. F. Measuring the effectiveness of voluntary plastic industry efforts: AMRF’s analysis of Operation Clean Sweep. In: Proceedings of the Plastic Debris Rivers to Sea Conference, Algalita Marine Research Foundation, Long Beach, CA, 2005c.
*Moore, C. J.; Moore, S. L.; Weisberg, S. B.; Lattin, G. L.; Zellers, A. F. A comparison of neustonic plastic and zooplankton abundance in southern California’s coastal waters. Mar. Pollut. Bull. 2002, 44: 1035-1038.
*Moore, C. J.; S. L. Moore; M. K. Leecaster; S. B. Weisberg. A Comparison of Plastic and Plankton in the North Pacific Central Gyre. Mar. Pollut. Bull. 2001, 42 (12): 1297-1300.
*Moore, S. L.; Gregorio, D.; Carreon, M.; Weisberg, S. B.; Leecaster, M. K. Composition and Distribution of Beach Debris in Orange County, California. Mar. Pollut. Bull. 2001, 42 (3): 241-245.
*Moore, S.L.; Allen, M. J. Distribution of anthropogenic and natural debris on the mainland shelf of the Southern California Bight. Mar. Pol-lut. Bull. 2000, 40: 83-88.
Muncke, Jane. Exposure to endocrine disrupting compounds via the food chain: Is packaging a relevant source? Sci Tot. Envir. 2009, 407 (16): 4549-4559.
#National Academy of Sciences. Briefing for Ocean Studies Board: Tackling Marine Debris in the 21st Century. Presented by the Committee on Effectiveness of International and National Measures to Prevent and Reduce Marine Debris and Its Impacts. October, 23, 2008.
#NCCOS. “International Mussel Watch Study.” National Centers for Coastal Ocean Science. 17 Feb 2011. Web. 28 June 2011. <http://ccma.nos.noaa.gov/stressors/pollution/assessments/as_intl_mw_study.aspx>.
#NOAA Oean and Coastal Resource Management. “Clean Marine Program.” 17 Sept 2010. Web. 22 July 2011. <http://coastalmanage-ment.noaa.gov/marinas.html>.
#NOAA Fisheries Office of Protected Resources. “Hawaiian Monk Seal (Monachus schauinslandi). 30 June 2011. Web. 3 July 2011. <http://www.nmfs.noaa.gov/pr/species/mammals/pinnipeds/hawaiianmonkseal.htm#population>.
#NOAA Marine Debris Program. 7 June 2011. Web 17 June 2011. <http://marinedebris.noaa.gov/>.
#NOAA Marine Debris Program. “Nets to Energy Program.” 7 June 2011. Web. 17 June 2011. <http://marinedebris.noaa.gov/projects/net-stoenergy.html>.
#NOAA Marine Debris Program. “Fishing for Energy Program.” 7 June 2011. Web. 17 June 2011. <http://marinedebris.noaa.gov/projects/fishing4energy.html>.

68
#NOAA Mussel Watch Program. “Mussel Watch Contaminant Monitoring.” 10 Mar 2011. Web. 28 June 2011. <http://ccma.nos.noaa.gov/about/coast/nsandt/musselwatch.aspx>.
#NOC. “Strategic Action Plans.” National Ocean Council. Web. 22 July 2011. <http://www.whitehouse.gov/administration/eop/oceans/sap>.
#NOC. “Water Quality and Sustainable Practices on Land Strategic Action Plan.” National Ocean Council. 2 June 2011. Web. 22 July 2011. <http://www.whitehouse.gov/sites/default/files/microsites/ceq/sap_7_water_quality_full_content_outline_06-02-11_clean.pdf>.
*#NOEP. California’s Ocean Economy. National Ocean Economics Program. July 2005: 24-26
*#Ocean Conservancy. Trash Travels. International Coastal Cleanup Report. 2010.
*#Ocean Conservancy. A Rising Tide of Ocean Debris. International Coastal Cleanup Report. 2009.
Oehlmann, Jorg et al. A critical analysis of the biological impacts of plasticizers on wildlife. Phil. Trans. R. Soc. B. 2009, 364: 2047-2062.
Pascal, Melvin A.; Zabik, Mary E.; Zabik, Matthew J.; Hernandez, Ruben J.; Uptake of Polychlorinated Biphenyls (PCBs) from an Aqueous Medium by Polyethylene, Polyvinyl Chloride, and Polystyrene Films. J. Agric. Food Chem. 2005, 53 (1): 164-169.
Possatto, Fernanda E; Barletta, Mario; Costa, Monica F.; Ivar do Sul, Juliana A.; Dantas, David V. Plastic debris ingestion by marine catfish: An unexpected fisheries impact. Mar. Pollut. Bull. 2011, doi: 10.1016/j.marpolbul.2011.01.036.
*#Project Kaisei. “About Project Kaisei.” Web. 24 July 2011. <http://www.projectkaisei.org/index.aspx>.
Rees, E. I. S.; Southward, A. J. Plastic flotsam as an agent for dispersal of Perforatus perfoatus (Cirripedia: Balanidae). J. Mar. Biol. 2008, As-soc. UK (JABA2-Biodiversity Records, published online).
Rios, Lorena M.; Jones, Patrick R.; Moore, Charles; Narayan, Urja V. Quantitation of persistent organic pollutants adsorbed on plastic debris from the Northern Pacific Gyre’s “eastern garbage patch.” J. Environ. Monit. 2010, 12: 2226-2236.
Rios, Lorena M.; Moore, Charles; Jones, Patrick R. Persistent organic pollutants carried by synthetic polymers in the ocean environment. Mar. Pollut. Bull. 2007, 54: 1230-1237.
*Romer, J.R. The Evolution of San Francisco’s Plastic-Bag Ban. Golden Gate U. Envtl. L.J. 2007, 1 (2)(5): 439-468.
Ryan, P. G.; Moore, Charles J.; van Franeker, Jan A.; Moloney, Coleen L. Monitoring the abundance of plastic debris in the marine environ-ment. Phil. Trans. R. Soc. B. 2009, 364: 1999-2012.
Ryan, P. G.; Connel, A. D.; Gardner, B. D. Plastic ingestion and PCBs in seabirds: Is there a relationship? Mar. Pollut. Bull. 1998, 19: 174-176.
Sajiki, J., Yonekubo, J. Leaching of bisphenol A (BPA) to seawater from polycarbonate plastic and its degradation by reactive oxygen species. Chemosphere. 2003, 51 (1): 55-62.
*#Seadoc. California Lost Fishing Gear Recovery Project. Web. 20 July 2011. <http://www.seadocsociety.org/lostfishinggear>.
*#Sea Grant: University of Southern California. “Caulerpa Taxifola: Case Study.” Web. 16 Mar 2011. <http://www.usc.edu/org/seagrant/caulerpa/casestudy.html>.
#Smith, D. “National Takeback and Recycling Program.” Sony Electronics Inc. 24 June 2010. Web. 22 July 2011. <http://www.calrecycle.ca.gov/EPR/Framework/2008April/Presentation/Smith.pdf>.
#Somers, Barbara. “Lobster Shell Disease Fact Sheet.” Rhode Island Sea Grant: Nov 2005. Web. 17 June 2011. <http://seagrant.gso.uri.edu/factsheets/lobster_shell_disease.html>.
Song, J.H.; Murphy, R.J.; Narayan, R.; Davies, G.B.H. Biodegradable and compostable alternatives to conventional plastics. Phil. Trans. R. Soc. B. 2009, 364 (1526): 2127-2139.
Staples, C. A.; Woodburn, K.; Caspers, N.; Hall, A. T.; Klecka, G. M. A weight of evidence approach to the aquatic hazard assessment of bisphenol A. Hum. Ecol. Risk Assess. 2002, 8: 1083–1105.
*#SWRCB. California Regional Water Quality Control Board San Francisco Bay Region Municipal Regional Stormwater NPDES Permit. State Water Resources Control Board. Order R2-2009-0074, NPDES Permit No. CAS612008, Issued October 14, 2009.

69
*#SWRCB. Preproduction Plastic Debris Program. State Water Resources Control Board. 5 May 2011. Web. 1 Sept 2011. <http://www.swrcb.ca.gov/water_issues/programs/stormwater/plasticdebris.shtml>.
*#SWRCB. Strategic Plan Update 2008-2012. State Water Resources Control Board. Adopted 2 Sept 2008.
#Takada, H. “International Pellet Watch.” Laboratory of Organic Geochemistry, Tokyo University of Agriculture and Technology. Web. 17 Jun 2011. <http://www.pelletwatch.org/>.
Talsness, C. E.; Andrade, A. J. M.; Kuriyama, S. N.; Taylor, J. A.; vom Saal, F. S. Components of plastic: experimental studies in animals and relevance for human health. Phil. Trans. R. Soc. B. 2009, 364: 2079–2096.
Teuten, Emma L. et al. Transport and release of chemicals from plastics to the environment and to wildlife. Phil. Trans. R. Soc. B. 2009, 364: 2027-2045.
Teuten, Emma L.; Rowland, Steven J.; Galloway, Tamara S.; Thompson, Richard C. Potential for Plastics to Transport Hydrophobic Contami-nants. Environ. Sci. Technol. 2007, 41: 7759-7764.
Thompson, Richard C.; Moore, Charles J.; vom Saal, Fredrick S.; Swan, Shanna H. Plastics, the environment and human health: current consensus and future trends. Phil. Trans. R. Soc. B. 2009, 364: 2153-2166.
Thompson, R. C.; Olsen, Y.; Mitchell, R. P.; Davis, A.; Rowland, S. J.; John, A. W. G.; McGonigle, D; Russel,l A. E. Lost at Sea: where is all the plastic? Science. 2004, 304: 838.
Tyl, R. W.; Myers, C. B.; Marr, M. C.; Fail, P. A.; Seely, J. C.; Brine, D. R.; Barter, R. A.; Butala, J. H. Reproductive toxicity evaluation of dietary butyl benzyl phthalate (BBP) in rats. Reprod. Toxicol. 2004, 18: 241–264.
#UNEP. UNEP Year Book 2011: Emerging Issues in Our Global Environment. United Nations Environment Program. 2011: 20-33.
#UNEP. Marine Litter: A global Challenge. Nairobi: United Nations Environment Program. 2009: 232 pp.
#USEPA. “Persistent Organic Pollutants: A Global Response.” United States Environmental Protection Agency. 12 Jan 2011. Web. 4 Feb 2011. <http://www.epa.gov/oia/toxics/pop.html>.
#USEPA. “Endocrine Disruption Screening Program (EDSP).” United States Environmental Protection Agency. 22 Apr 2010. Web. 24 Jun 2011. <http://www.epa.gov/endo/pubs/edspoverview/whatare.htm>.
#USEPA. Municipal Solid Waste in the United States 2009. United States Environmental Protection Agency Report: EPA530-R-10-012, Washington, D.C., 2010.
#USEPA. “Invasive Species.” United States Environmental Protection Agency. 20 Nov 2009. Web. 10 Mar 2011. <http://www.epa.gov/great-lakes/invasive/>.
#USEPA. Municipal Solid Waste Generation in the United States, 1999. Prepared by Franklin Associates, Ltd. for the United States Environ-mental Protection Agency, Washington, D.C., 2000.
#USEPA. Plastic pellets in the aquatic environment: Sources, and recommendations. United States Environmental Protection Agency Oceans and Coastal Protection Division Report 842-B-92-010. Washington, D.C., 1992.
#USFWS. “Zebra Mussel: Economic Impact.” United States Fish and Wildlife Service. 31 Jan 2008. Web. 10 Mar 2011. <http://www.glsc.usgs.gov/main.php?content=research_invasive_zebramussel&title=Invasive%20Invertebrates0&menu=research_invasive_invertebrates>.
Valle-Levinson, A. and R. L. Swanson. Wind-induced scattering of medically-related and sewage-related items. Mar. Technol. Soc. J. 1991, 25 (2): 49-56.
Vlietstra, L.S.; Parga, J.A. Long-term changes in the type, but not amount, of ingested plastic particles in short-tailed shearwaters in the southereastern Bering Sea. Mar. Pollut. Bull. 2002, 44 (9): 945-955.
*Watters, Diana L.; Yoklavich, Mary M.; Love, Milton; Schroeder, Donna M. Assessing marine debris in deep seafloor habitats off California. Bull. Mar. Sci. 2010, 60: 131-138.

*#WCGA. West Coast Governors’ Agreement on Ocean Health. 15 Apr 2011. Web. 20 July 2011. <http://westcoastoceans.gov/>.
*#WCGA. West Coast Governors’ Agreement on Ocean Health Marine Debris Action Work Plan. May, 2010.
White House, President Barack Obama. National Ocean Policy. Issued as Executive Order, July 19, 2011. Web. 22 July 2011. <http://www.whitehouse.gov/files/documents/2010stewardship-eo.pdf>.
Young, Lindsay C.; Vanderlip, Cynthia; Duffy, David C.; Afanasyev, Vsevolod; Shaffer, Scott A. Bringing Home the Trash: Do Colony-Based Differences in Foraging Distribution Lead to Increased Plastic Ingestion in Laysan Albatrosses? PLoS One. 2009, 4 (10): e7623.
Zarfi, Christiane; Matthies, Michael. Are marine plastic particles transport vectors for organic pollutants to the Arctic? Mar. Pollut. Bull. 2010, 60 (10): 1810-1814.
70
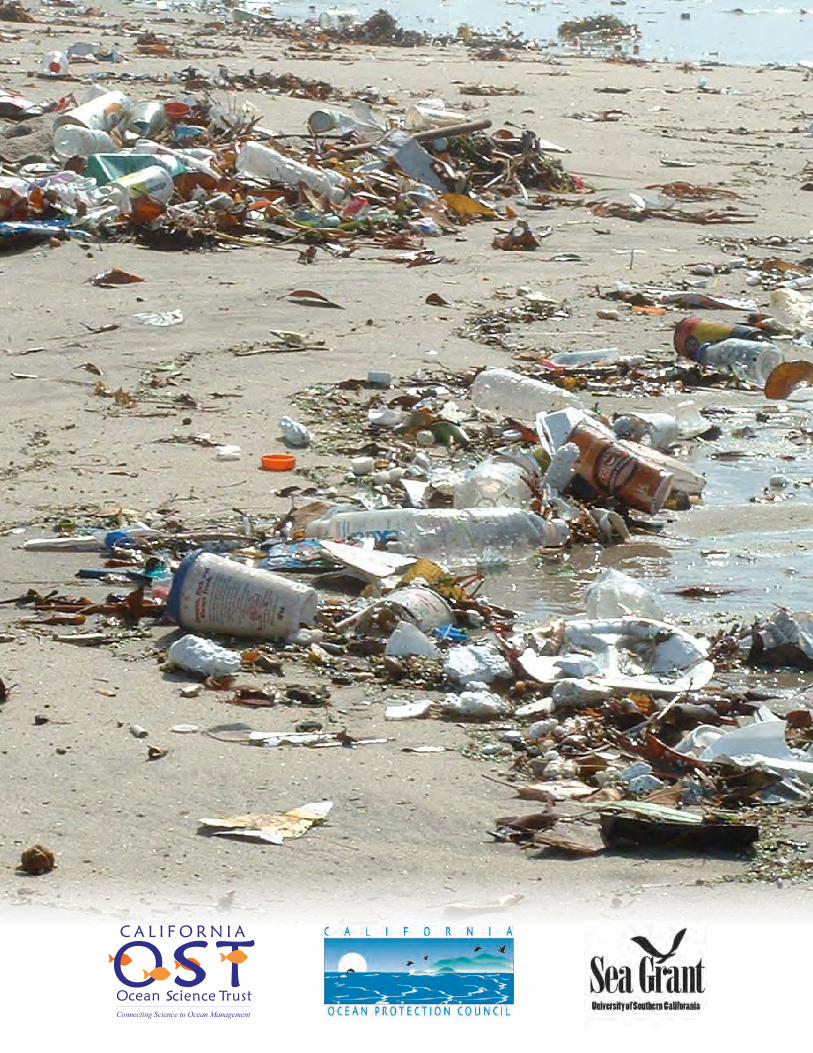
72