Embed Size (px)
Citation preview
`
106. PROFILE ON THE PRODUCTION OF PLASTER
OF PARIS
106-1
TABLE OF CONTENTS
PAGE
I. SUMMARY 106-2
II. PRODUCT DESCRIPTION & APPLICATION 106-3
III. MARKET STUDY AND PLANT CAPACITY 106-3
A. MARKET STUDY 106-3
B. PLANT CAPACITY & PRODUCTION PROGRAM 106-8
IV. MATERIALS AND INPUTS 106-8
A. RAW & AUXILIARY MATERIALS 106-8
B. UTILITIES 106-9
V. TECHNOLOGY & ENGINEERING 106-9
A. TECHNOLOGY 106-9
B. ENGINEERING 106-10
VI. HUMAN RESOURCE & TRAINING REQUIREMENT 106-14
A. HUMAN RESOURCE REQUIREMENT 106-14
B. TRAINING REQUIREMENT 106-14
VII. FINANCIAL ANLYSIS 106-14
A. TOTAL INITIAL INVESTMENT COST 106-15
B. PRODUCTION COST 106-16
C. FINANCIAL EVALUATION 106-17
D. ECONOMIC AND SOCIAL BENEFITS 106-18
106-2
I. SUMMARY
This profile envisages the establishment of a plant for the production of plaster of Paris with a
capacity of 600 tons per annum. It is widely used in the manufacture of models in pottery
industry, for making ornamental castings, plaster boards, for building decoration as wall plaster
and floor cement and as dentist & orthopedic plaster.
The demand for plaster of Paris is met through domestic production and import. The present
(2012) unsatisfied demand for plaster of Paris is estimated at 5,784 tons. The demand for plaster
of Paris is projected to reach 9,315 tons and 15,003 tons by the year 2017 and 2022, respectively.
The principal raw materials required is the dehydrated gypsum rock (CaSo4. 2H2O) which is
available locally.
The total investment cost of the project including working capital is estimated at Birr 2.38
million. From the total investment cost, the highest share (Birr 1.78 million or 75.03%) is
accounted by fixed investment cost followed by pre operation cost ( Birr 517.24 thousand or
21.70%) and initial working capital (Birr 78.04 thousand or 3.27%). From the total investment
cost, Birr 285.66 thousand or 11.98% is required in foreign currency.
The project is financially viable with an internal rate of return (IRR) of 32.23% and a net present
value (NPV) of Birr 2.68 million, discounted at 10%.
The project can create employment for 10 persons. The establishment of such factory will have a
foreign exchange saving effect to the country by substituting the current imports. The project
will also create backward linkage with the mining sector and forward linkage with the pottery,
education materials production, construction and medical instrument supplies sub sectors and
also generates income for the Government in terms of tax revenue and payroll tax.
106-3
II. PRODUCT DESCRIPTION AND APPLICATION
Plaster of Paris is produced from Gypsum, which is a naturally occurring crystal of calcium
sulphate (CaSO4.2H2O). Gypsum is created from the evaporation of sea water that is trapped in
lagoons of subsoil and is usually found in mountains. The impure gypsum (that it is found in the
subsoil) can have different color variations, such as grey, brown or red. The pure however plaster
color is white. It can be quarried in different parts of the world in slightly different forms. Plaster
is made from gypsum by grinding it to powder and then gently heating it to drive off some, or
all, of the water of crystallization.
Chemically, Plaster of Paris is calcium sulphate having molecular formula CaSo4½H2O. It is a
white hygroscopic powder very slightly soluble in water particularly at high temperature. It is
widely used in the manufacture of models in pottery industry, for making ornamental castings,
plaster boards and chalk crayons, etc. Other uses of this cheap commodity are for building
decoration as wall plaster and floor cement and dentist plaster. It is also used as orthopedic
plaster in surgery for setting of broken bones, etc.
III. MARKET STUDY AND PLANT CAPACITY
A. MARKET STUDY
1. Past Supply and Present Demand
Although some amount of the demand for Plaster of Paris for some uses like medical and
decorative uses is met through import, the major volume of the demand for the product is met
through local production in Ethiopia. Previously, the Education Materials Production and
Distribution Agency of the Ministry of Education and a few private firms were the domestic
suppliers. Now the Agency has stopped producing Plaster of Paris, and the local suppliers of the
product are private firms. For the purpose of determining the unsatisfied demand import data of
Plaster of Paris during the past twelve years (2000-2011) is shown in Table 3.1.
106-4
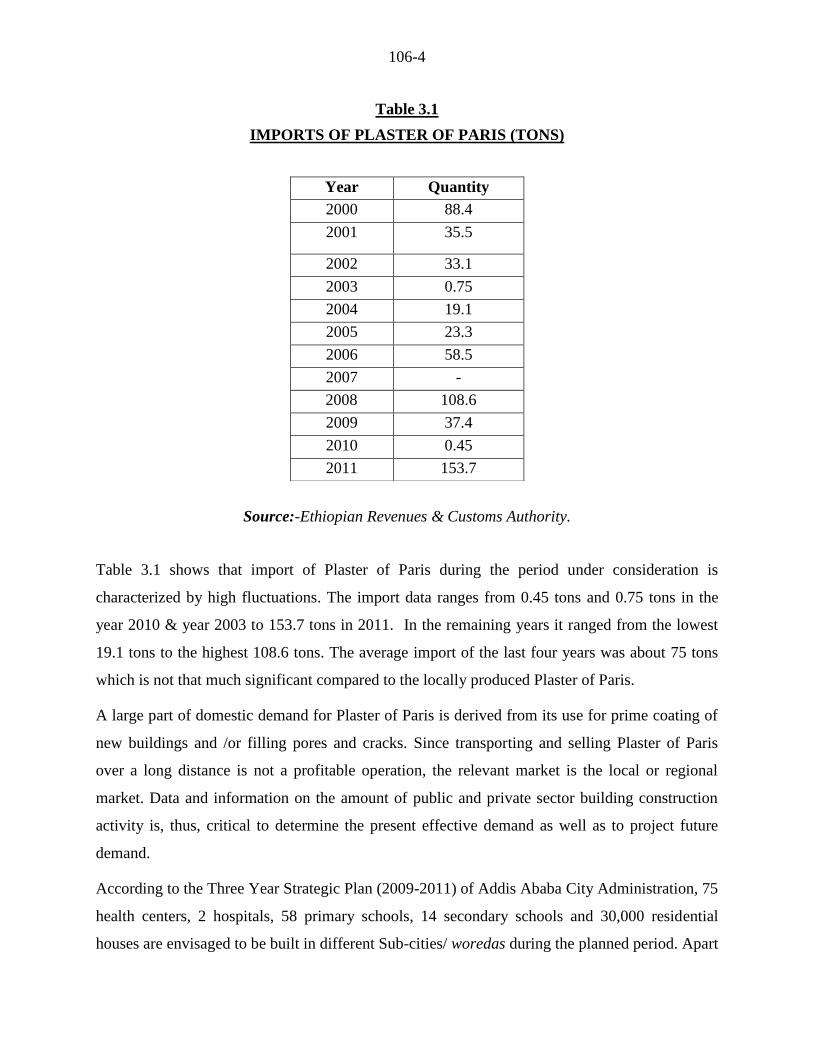
Table 3.1
IMPORTS OF PLASTER OF PARIS (TONS)
Source:-Ethiopian Revenues & Customs Authority.
Table 3.1 shows that import of Plaster of Paris during the period under consideration is
characterized by high fluctuations. The import data ranges from 0.45 tons and 0.75 tons in the
year 2010 & year 2003 to 153.7 tons in 2011. In the remaining years it ranged from the lowest
19.1 tons to the highest 108.6 tons. The average import of the last four years was about 75 tons
which is not that much significant compared to the locally produced Plaster of Paris.
A large part of domestic demand for Plaster of Paris is derived from its use for prime coating of
new buildings and /or filling pores and cracks. Since transporting and selling Plaster of Paris
over a long distance is not a profitable operation, the relevant market is the local or regional
market. Data and information on the amount of public and private sector building construction
activity is, thus, critical to determine the present effective demand as well as to project future
demand.
According to the Three Year Strategic Plan (2009-2011) of Addis Ababa City Administration, 75
health centers, 2 hospitals, 58 primary schools, 14 secondary schools and 30,000 residential
houses are envisaged to be built in different Sub-cities/ woredas during the planned period. Apart
Year Quantity
2000 88.4
2001 35.5
2002 33.1
2003 0.75
2004 19.1
2005 23.3
2006 58.5
2007 -
2008 108.6
2009 37.4
2010 0.45
2011 153.7
106-5
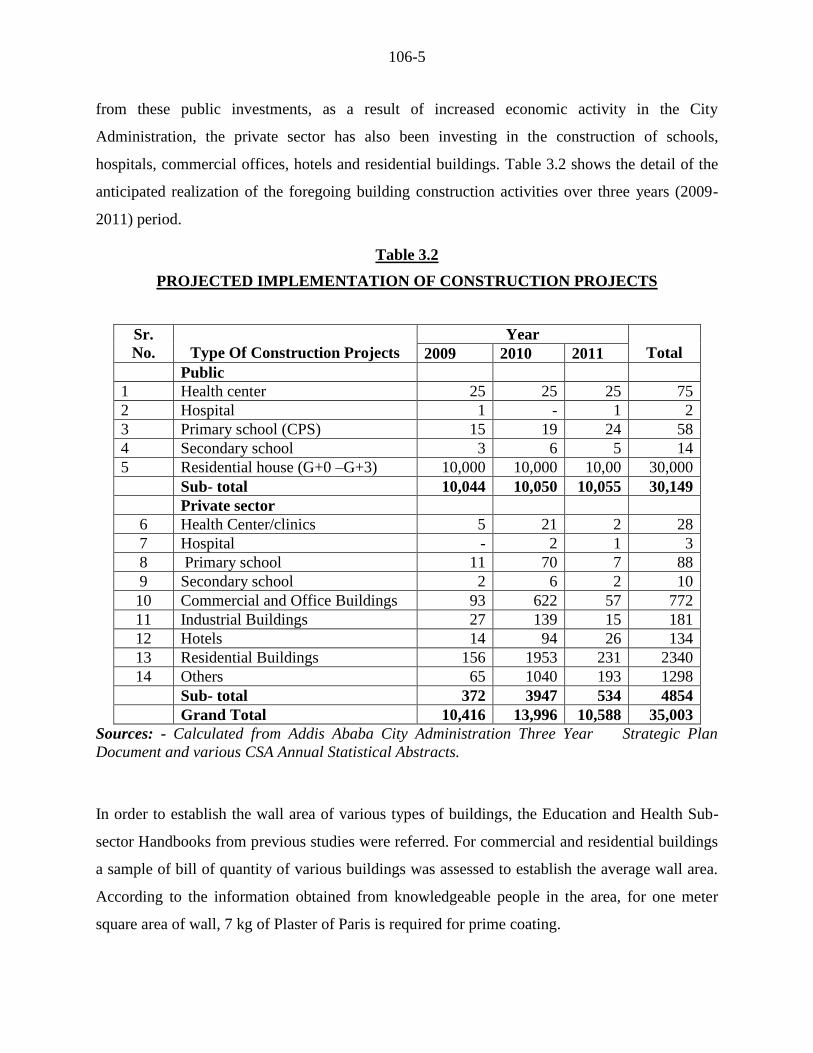
from these public investments, as a result of increased economic activity in the City
Administration, the private sector has also been investing in the construction of schools,
hospitals, commercial offices, hotels and residential buildings. Table 3.2 shows the detail of the
anticipated realization of the foregoing building construction activities over three years (2009-
2011) period.
Table 3.2
PROJECTED IMPLEMENTATION OF CONSTRUCTION PROJECTS
Sr.
No.
Type Of Construction Projects
Year
Total 2009 2010 2011
Public
1 Health center 25 25 25 75
2 Hospital 1 - 1 2
3 Primary school (CPS) 15 19 24 58
4 Secondary school 3 6 5 14
5 Residential house (G+0 –G+3) 10,000 10,000 10,00 30,000
Sub- total 10,044 10,050 10,055 30,149
Private sector
6 Health Center/clinics 5 21 2 28
7 Hospital - 2 1 3
8 Primary school 11 70 7 88
9 Secondary school 2 6 2 10
10 Commercial and Office Buildings 93 622 57 772
11 Industrial Buildings 27 139 15 181
12 Hotels 14 94 26 134
13 Residential Buildings 156 1953 231 2340
14 Others 65 1040 193 1298
Sub- total 372 3947 534 4854
Grand Total 10,416 13,996 10,588 35,003
Sources: - Calculated from Addis Ababa City Administration Three Year Strategic Plan
Document and various CSA Annual Statistical Abstracts.
In order to establish the wall area of various types of buildings, the Education and Health Sub-
sector Handbooks from previous studies were referred. For commercial and residential buildings
a sample of bill of quantity of various buildings was assessed to establish the average wall area.
According to the information obtained from knowledgeable people in the area, for one meter
square area of wall, 7 kg of Plaster of Paris is required for prime coating.
106-6
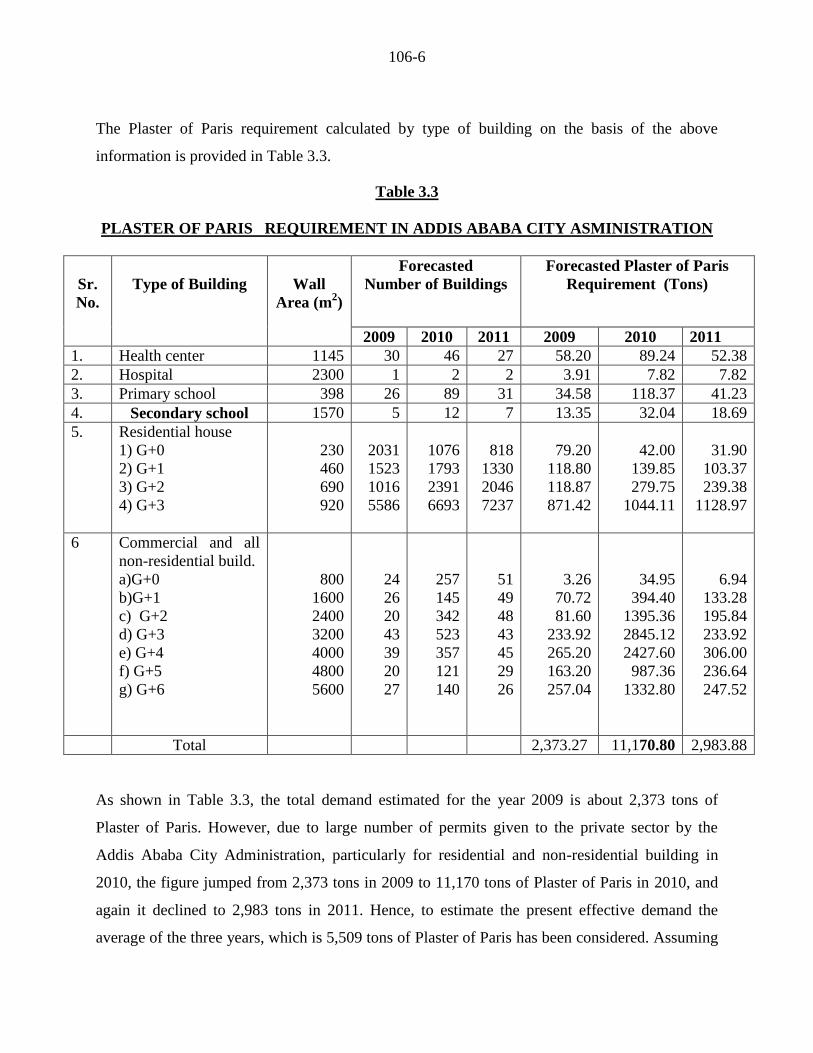
The Plaster of Paris requirement calculated by type of building on the basis of the above
information is provided in Table 3.3.
Table 3.3
PLASTER OF PARIS REQUIREMENT IN ADDIS ABABA CITY ASMINISTRATION
Sr.
No.
Type of Building
Wall
Area (m2)
Forecasted
Number of Buildings
Forecasted Plaster of Paris
Requirement (Tons)
2009 2010 2011 2009 2010 2011
1. Health center 1145 30 46 27 58.20 89.24 52.38
2. Hospital 2300 1 2 2 3.91 7.82 7.82
3. Primary school 398 26 89 31 34.58 118.37 41.23
4. Secondary school 1570 5 12 7 13.35 32.04 18.69
5. Residential house
1) G+0
2) G+1
3) G+2
4) G+3
230
460
690
920
2031
1523
1016
5586
1076
1793
2391
6693
818
1330
2046
7237
79.20
118.80
118.87
871.42
42.00
139.85
279.75
1044.11
31.90
103.37
239.38
1128.97
6 Commercial and all
non-residential build.
a)G+0
b)G+1
c) G+2
d) G+3
e) G+4
f) G+5
g) G+6
800
1600
2400
3200
4000
4800
5600
24
26
20
43
39
20
27
257
145
342
523
357
121
140
51
49
48
43
45
29
26
3.26
70.72
81.60
233.92
265.20
163.20
257.04
34.95
394.40
1395.36
2845.12
2427.60
987.36
1332.80
6.94
133.28
195.84
233.92
306.00
236.64
247.52
Total 2,373.27 11,170.80 2,983.88
As shown in Table 3.3, the total demand estimated for the year 2009 is about 2,373 tons of
Plaster of Paris. However, due to large number of permits given to the private sector by the
Addis Ababa City Administration, particularly for residential and non-residential building in
2010, the figure jumped from 2,373 tons in 2009 to 11,170 tons of Plaster of Paris in 2010, and
again it declined to 2,983 tons in 2011. Hence, to estimate the present effective demand the
average of the three years, which is 5,509 tons of Plaster of Paris has been considered. Assuming
106-7
that there would be wastage during utilization, 5% allowance has been made and thus the present
demand for the project to be established in Addis Ababa City Administration for the year 2012 is
estimated at 5,784 tons of Plaster of Paris.
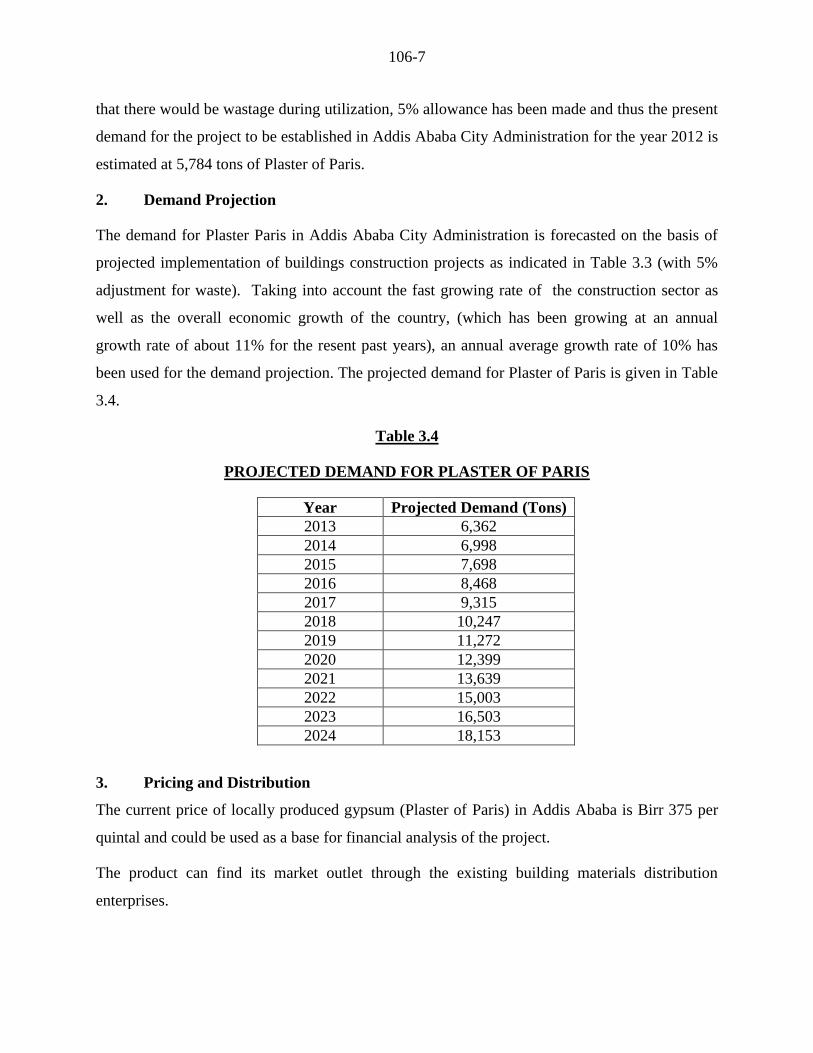
2. Demand Projection
The demand for Plaster Paris in Addis Ababa City Administration is forecasted on the basis of
projected implementation of buildings construction projects as indicated in Table 3.3 (with 5%
adjustment for waste). Taking into account the fast growing rate of the construction sector as
well as the overall economic growth of the country, (which has been growing at an annual
growth rate of about 11% for the resent past years), an annual average growth rate of 10% has
been used for the demand projection. The projected demand for Plaster of Paris is given in Table
3.4.
Table 3.4
PROJECTED DEMAND FOR PLASTER OF PARIS
Year Projected Demand (Tons)
2013 6,362
2014 6,998
2015 7,698
2016 8,468
2017 9,315
2018 10,247
2019 11,272
2020 12,399
2021 13,639
2022 15,003
2023 16,503
2024 18,153
3. Pricing and Distribution
The current price of locally produced gypsum (Plaster of Paris) in Addis Ababa is Birr 375 per
quintal and could be used as a base for financial analysis of the project.
The product can find its market outlet through the existing building materials distribution
enterprises.
106-8
B. PLANT CAPACITY AND PRODUCTION PROGRAM
1. Plant Capacity
Considering the market study and minimum economic scale, the plant is proposed to have a
theoretical production capacity of 500 tons of Plaster of Paris per annum assuming 300 working
days a year.
2. Production Program
The plant is assumed to start production at 70% of the full capacity due to the problem of market
penetration with a 15% capacity build-up until it reaches 100% in the third year and then after.
IV. RAW MATERIALS AND INPUTS
A. RAW MATERIALS
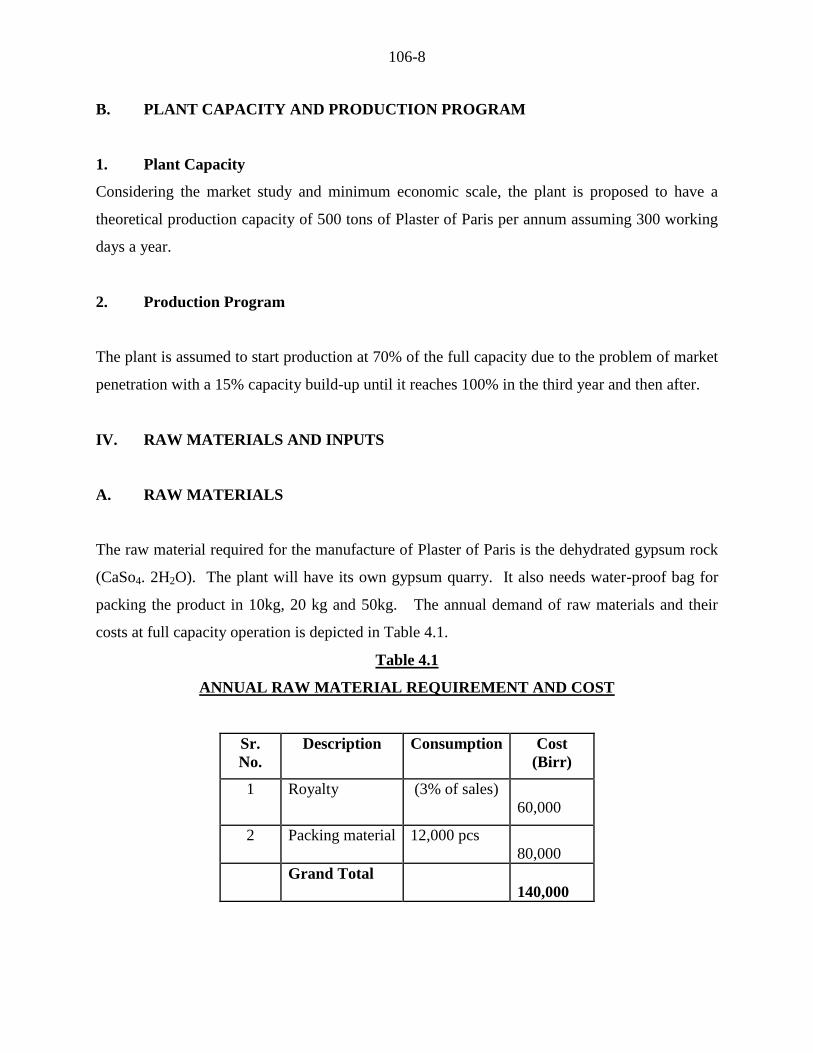
The raw material required for the manufacture of Plaster of Paris is the dehydrated gypsum rock
(CaSo4. 2H2O). The plant will have its own gypsum quarry. It also needs water-proof bag for
packing the product in 10kg, 20 kg and 50kg. The annual demand of raw materials and their
costs at full capacity operation is depicted in Table 4.1.
Table 4.1
ANNUAL RAW MATERIAL REQUIREMENT AND COST
Sr.
No.
Description Consumption Cost
(Birr)
1 Royalty (3% of sales)
60,000
2 Packing material 12,000 pcs
80,000
Grand Total
140,000
106-9
B. UTILITIES
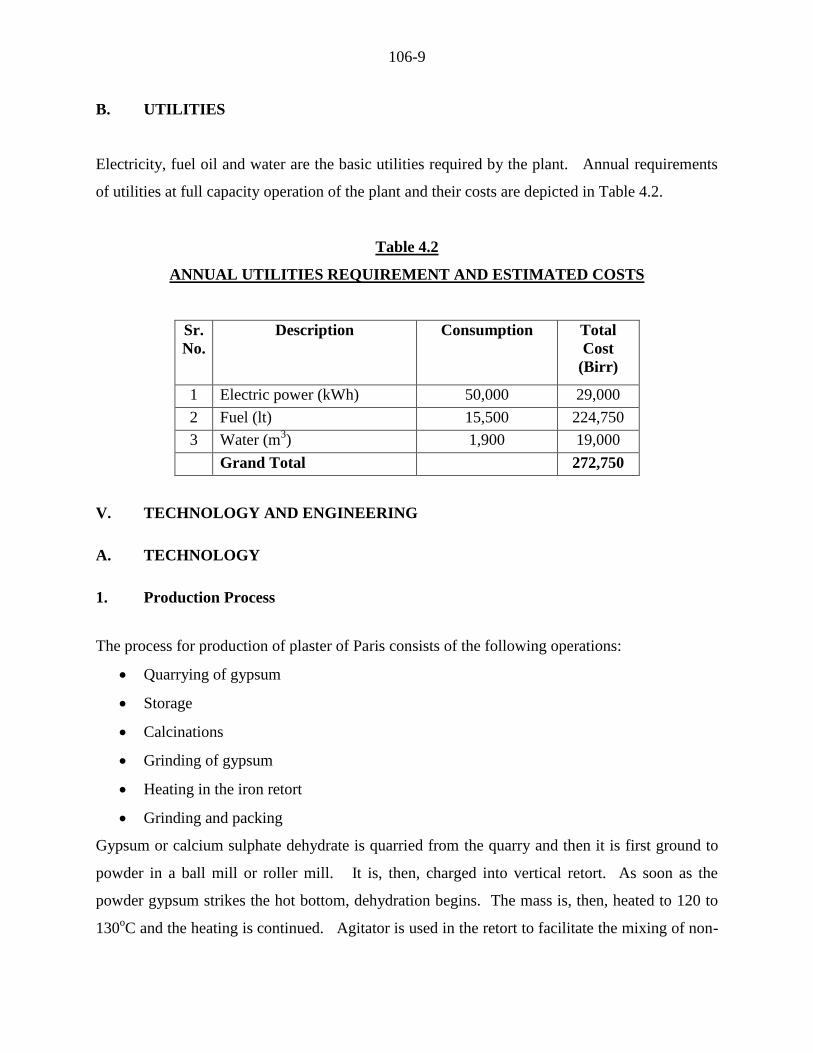
Electricity, fuel oil and water are the basic utilities required by the plant. Annual requirements
of utilities at full capacity operation of the plant and their costs are depicted in Table 4.2.
Table 4.2
ANNUAL UTILITIES REQUIREMENT AND ESTIMATED COSTS
Sr.
No.
Description Consumption Total
Cost
(Birr)
1 Electric power (kWh) 50,000 29,000
2 Fuel (lt) 15,500 224,750
3 Water (m3) 1,900 19,000
Grand Total 272,750
V. TECHNOLOGY AND ENGINEERING
A. TECHNOLOGY
1. Production Process
The process for production of plaster of Paris consists of the following operations:
Quarrying of gypsum
Storage
Calcinations
Grinding of gypsum
Heating in the iron retort
Grinding and packing
Gypsum or calcium sulphate dehydrate is quarried from the quarry and then it is first ground to
powder in a ball mill or roller mill. It is, then, charged into vertical retort. As soon as the
powder gypsum strikes the hot bottom, dehydration begins. The mass is, then, heated to 120 to
130oC and the heating is continued. Agitator is used in the retort to facilitate the mixing of non-
106-10
hydrated gypsum with the Plaster of Paris. Temperature rises rapidly and when the temperature
reaches 160oC, the charge is thrown out. The product obtained is calcined gypsum or Plaster of
Paris. It is cooled and stored. It is again ground in the same ball mill and then screened in a 200
mesh size screen. It is packed in 10 kg, 20 kg and 50 kg water proof bags in order to avoid
contact with moisture.
2. Environmental Impact Assessment
The envisaged plant doesn’t have any adverse impact to the environment.
B. ENGINEERING
1. Machinery and Equipment
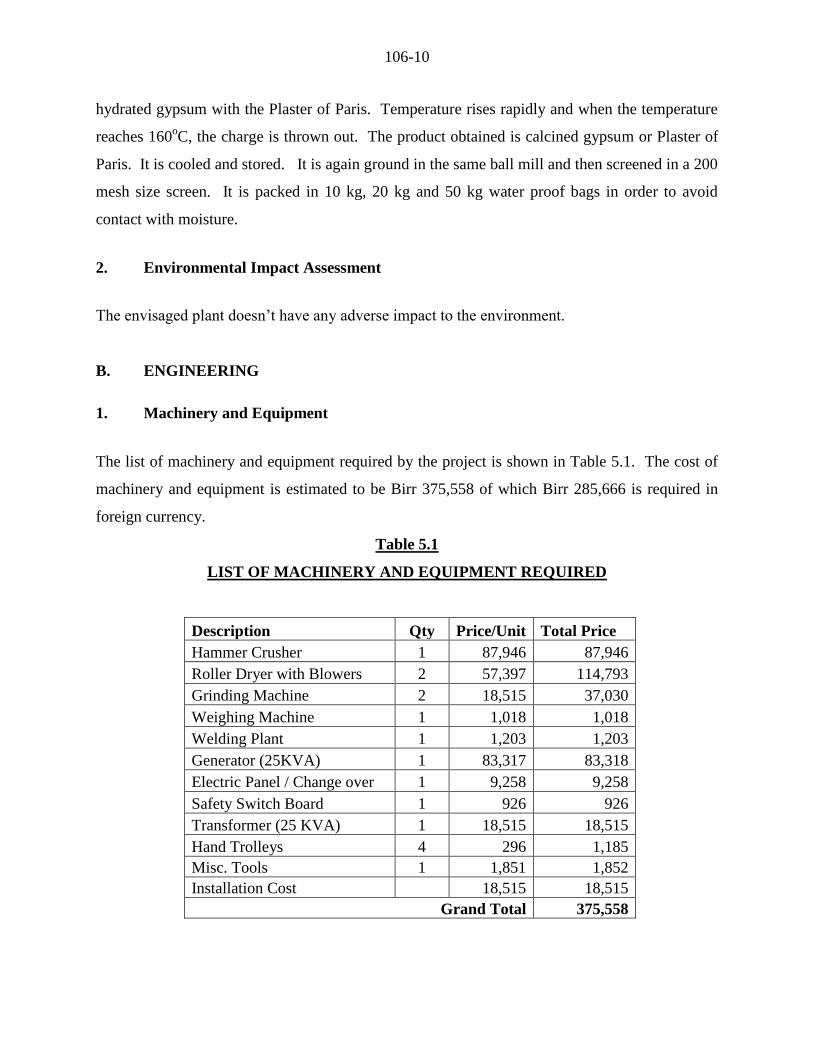
The list of machinery and equipment required by the project is shown in Table 5.1. The cost of
machinery and equipment is estimated to be Birr 375,558 of which Birr 285,666 is required in
foreign currency.
Table 5.1
LIST OF MACHINERY AND EQUIPMENT REQUIRED
Description Qty Price/Unit Total Price
Hammer Crusher 1 87,946 87,946
Roller Dryer with Blowers 2 57,397 114,793
Grinding Machine 2 18,515 37,030
Weighing Machine 1 1,018 1,018
Welding Plant 1 1,203 1,203
Generator (25KVA) 1 83,317 83,318
Electric Panel / Change over 1 9,258 9,258
Safety Switch Board 1 926 926
Transformer (25 KVA) 1 18,515 18,515
Hand Trolleys 4 296 1,185
Misc. Tools 1 1,851 1,852
Installation Cost
18,515 18,515
Grand Total 375,558
106-11
2. Land, Building and Civil Works
The total area of land required by the project is estimated to be 500 m2, out of which 87.5 m
2 will
be built-up area. Construction cost, at a rate of Birr 3,200 per m2, is estimated to be Birr
800,000.
According to the Federal Legislation on the Lease Holding of Urban Land (Proclamation No.
721/2004) in principle, urban land permit by lease is on auction or negotiation basis, however,
the time and condition of applying the proclamation shall be determined by the concerned
regional or city government depending on the level of development.
The legislation has also set the maximum on lease period and the payment of lease prices. The
lease period ranges from 99 years for education, cultural research health, sport, NGO , religious
and residential area to 80 years for industry and 70 years for trade while the lease payment
period ranges from 10 years to 60 years based on the towns grade and type of investment.
Moreover, advance payment of lease based on the type of investment ranges from 5% to
10%.The lease price is payable after the grace period annually. For those that pay the entire
amount of the lease will receive 0.5% discount from the total lease value and those that pay in
installments will be charged interest based on the prevailing interest rate of banks. Moreover,
based on the type of investment, two to seven years grace period shall also be provided.
However, the Federal Legislation on the Lease Holding of Urban Land apart from setting the
maximum has conferred on regional and city governments the power to issue regulations on the
exact terms based on the development level of each region.
In Addis Ababa, the City’s Land Administration and Development Authority is directly
responsible in dealing with matters concerning land. However, regarding the manufacturing
sector, industrial zone preparation is one of the strategic intervention measures adopted by the
City Administration for the promotion of the sector and all manufacturing projects are assumed
to be located in the developed industrial zones.
106-12
Regarding land allocation of industrial zones if the land requirement of the project is below
5,000 m2, the land lease request is evaluated and decided upon by the Industrial Zone
Development and Coordination Committee of the City’s Investment Authority. However, if the
land request is above 5,000 m2, the request is evaluated by the City’s Investment Authority and
passed with recommendation to the Land Development and Administration Authority for
decision, while the lease price is the same for both cases.
Moreover, the Addis Ababa City Administration has recently adopted a new land lease floor
price for plots in the city. The new prices will be used as a benchmark for plots that are going to
be auctioned by the city government or transferred under the new “Urban Lands Lease Holding
Proclamation.”
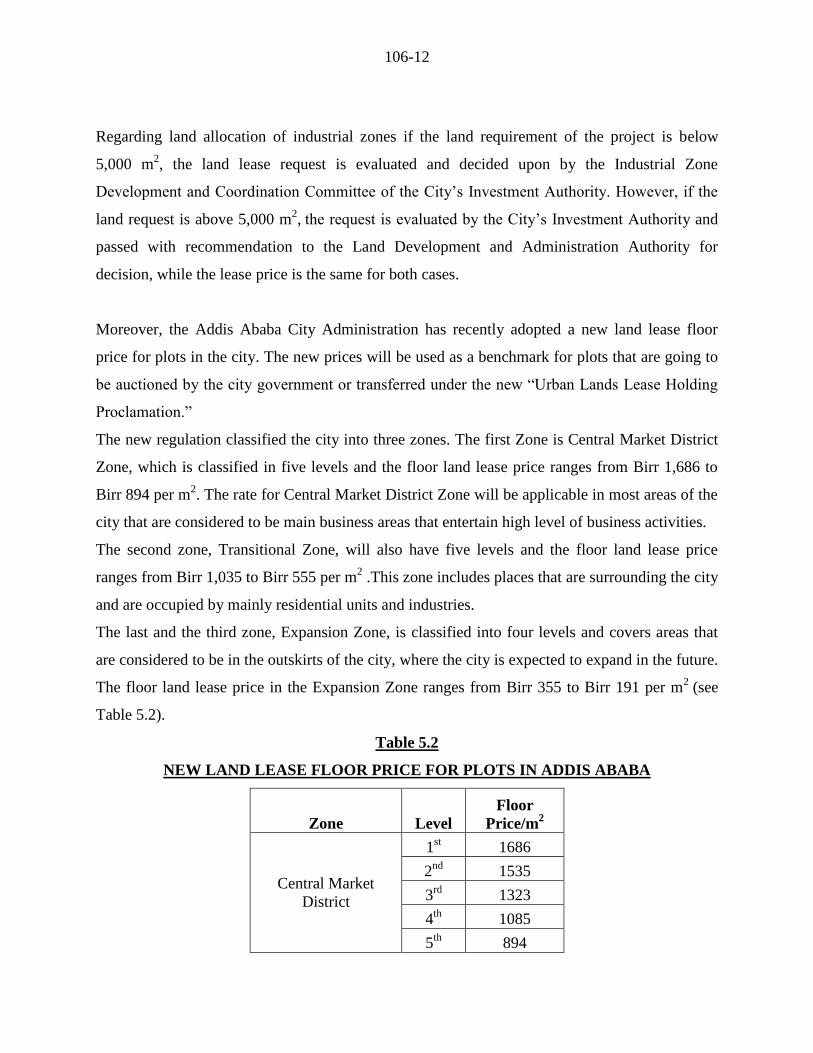
The new regulation classified the city into three zones. The first Zone is Central Market District
Zone, which is classified in five levels and the floor land lease price ranges from Birr 1,686 to
Birr 894 per m2. The rate for Central Market District Zone will be applicable in most areas of the
city that are considered to be main business areas that entertain high level of business activities.
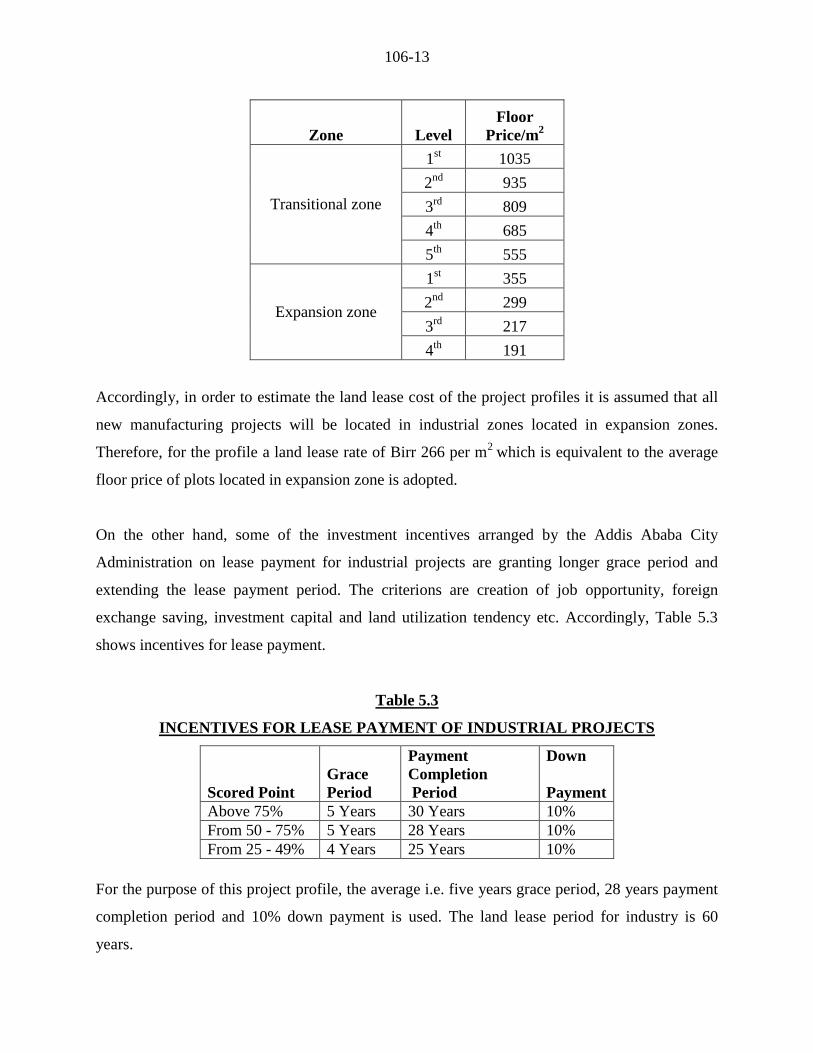
The second zone, Transitional Zone, will also have five levels and the floor land lease price
ranges from Birr 1,035 to Birr 555 per m2 .This zone includes places that are surrounding the city
and are occupied by mainly residential units and industries.
The last and the third zone, Expansion Zone, is classified into four levels and covers areas that
are considered to be in the outskirts of the city, where the city is expected to expand in the future.
The floor land lease price in the Expansion Zone ranges from Birr 355 to Birr 191 per m2
(see
Table 5.2).
Table 5.2
NEW LAND LEASE FLOOR PRICE FOR PLOTS IN ADDIS ABABA
Zone Level
Floor
Price/m2
Central Market
District
1st 1686
2nd
1535
3rd
1323
4th
1085
5th
894
106-13
Zone Level
Floor
Price/m2
Transitional zone
1st 1035
2nd
935
3rd
809
4th
685
5th
555
Expansion zone
1st 355
2nd
299
3rd
217
4th
191
Accordingly, in order to estimate the land lease cost of the project profiles it is assumed that all
new manufacturing projects will be located in industrial zones located in expansion zones.
Therefore, for the profile a land lease rate of Birr 266 per m2
which is equivalent to the average
floor price of plots located in expansion zone is adopted.
On the other hand, some of the investment incentives arranged by the Addis Ababa City
Administration on lease payment for industrial projects are granting longer grace period and
extending the lease payment period. The criterions are creation of job opportunity, foreign
exchange saving, investment capital and land utilization tendency etc. Accordingly, Table 5.3
shows incentives for lease payment.
Table 5.3
INCENTIVES FOR LEASE PAYMENT OF INDUSTRIAL PROJECTS
Scored Point
Grace
Period
Payment
Completion
Period
Down
Payment
Above 75% 5 Years 30 Years 10%
From 50 - 75% 5 Years 28 Years 10%
From 25 - 49% 4 Years 25 Years 10%
For the purpose of this project profile, the average i.e. five years grace period, 28 years payment
completion period and 10% down payment is used. The land lease period for industry is 60
years.
106-14
Accordingly, the total land lease cost at a rate of Birr 266 per m2 is estimated at Birr 133,000 of
which 10% or Birr 13,300 will be paid in advance. The remaining Birr 119,700 will be paid in
equal installments with in 28 years i.e. Birr 4,275 annually
VI. HUMANRESOURCE AND TRAINING REQUIREMENT
A. HUMANRESOURCE REQUIREMENT
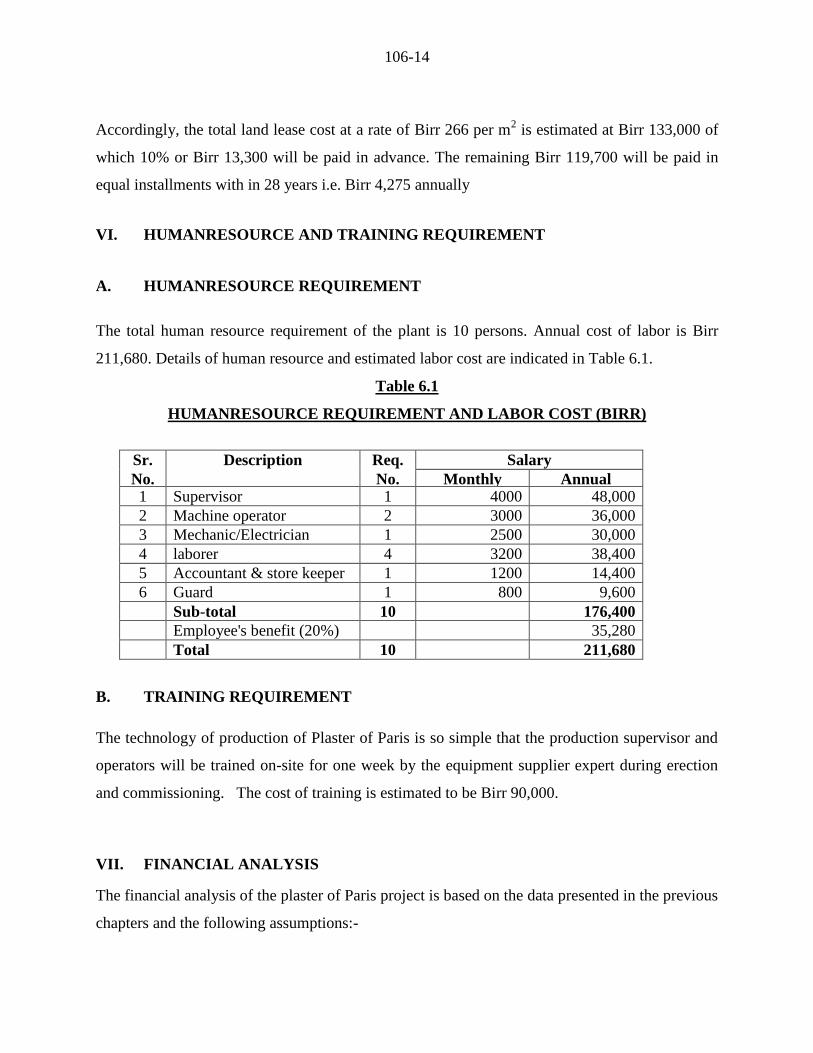
The total human resource requirement of the plant is 10 persons. Annual cost of labor is Birr
211,680. Details of human resource and estimated labor cost are indicated in Table 6.1.
Table 6.1
HUMANRESOURCE REQUIREMENT AND LABOR COST (BIRR)
Sr. Description Req. Salary
No. No. Monthly Annual 1 Supervisor 1 4000 48,000
2 Machine operator 2 3000 36,000
3 Mechanic/Electrician 1 2500 30,000
4 laborer 4 3200 38,400
5 Accountant & store keeper 1 1200 14,400
6 Guard 1 800 9,600
Sub-total 10 176,400
Employee's benefit (20%) 35,280
Total 10 211,680
B. TRAINING REQUIREMENT
The technology of production of Plaster of Paris is so simple that the production supervisor and
operators will be trained on-site for one week by the equipment supplier expert during erection
and commissioning. The cost of training is estimated to be Birr 90,000.
VII. FINANCIAL ANALYSIS
The financial analysis of the plaster of Paris project is based on the data presented in the previous
chapters and the following assumptions:-
106-15
Construction period 1 year
Source of finance 30 % equity & 70 loan
Tax holidays 5 years
Bank interest 10%
Discount cash flow 10%
Accounts receivable 30 days
Raw material local 30 days
Work in progress 1 day
Finished products 30 days
Cash in hand 5 days
Accounts payable 30 days
Repair and maintenance 5% of machinery cost
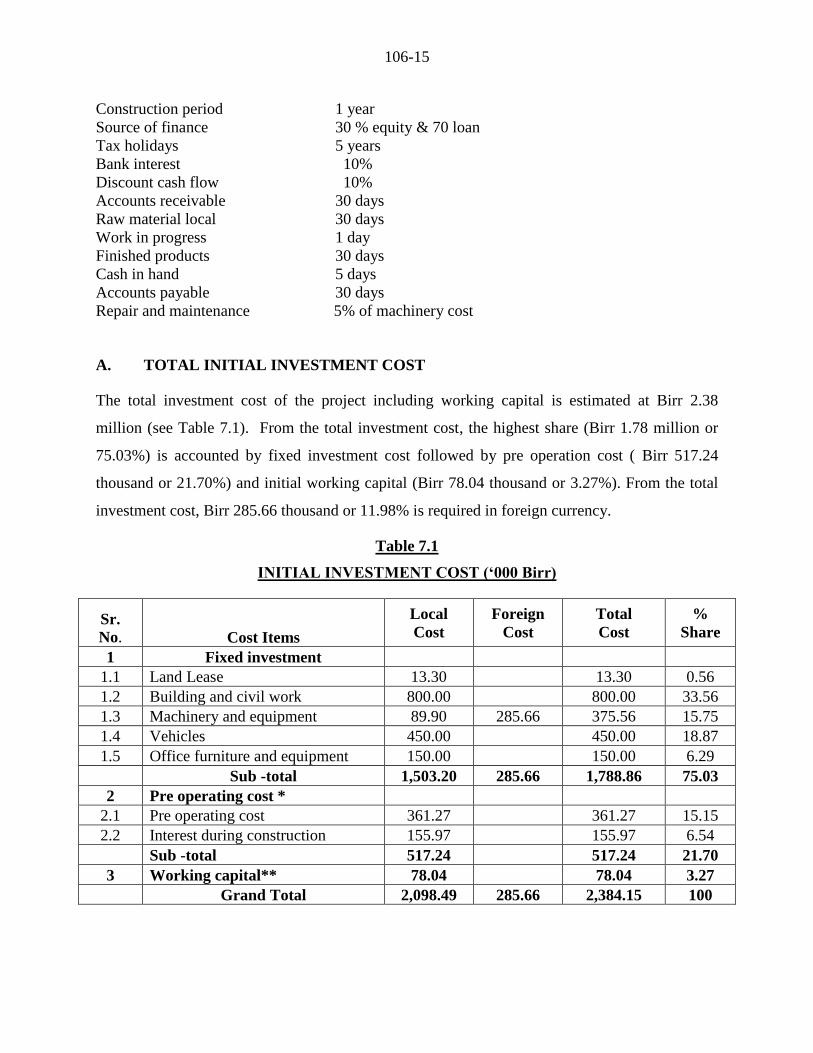
A. TOTAL INITIAL INVESTMENT COST
The total investment cost of the project including working capital is estimated at Birr 2.38
million (see Table 7.1). From the total investment cost, the highest share (Birr 1.78 million or
75.03%) is accounted by fixed investment cost followed by pre operation cost ( Birr 517.24
thousand or 21.70%) and initial working capital (Birr 78.04 thousand or 3.27%). From the total
investment cost, Birr 285.66 thousand or 11.98% is required in foreign currency.
Table 7.1
INITIAL INVESTMENT COST (‘000 Birr)
Sr.
No. Cost Items
Local
Cost
Foreign
Cost
Total
Cost
%
Share
1 Fixed investment
1.1 Land Lease 13.30 13.30 0.56
1.2 Building and civil work 800.00 800.00 33.56
1.3 Machinery and equipment 89.90 285.66 375.56 15.75
1.4 Vehicles 450.00 450.00 18.87
1.5 Office furniture and equipment 150.00 150.00 6.29
Sub -total 1,503.20 285.66 1,788.86 75.03
2 Pre operating cost *
2.1 Pre operating cost 361.27 361.27 15.15
2.2 Interest during construction 155.97 155.97 6.54
Sub -total 517.24 517.24 21.70
3 Working capital** 78.04 78.04 3.27
Grand Total 2,098.49 285.66 2,384.15 100
106-16
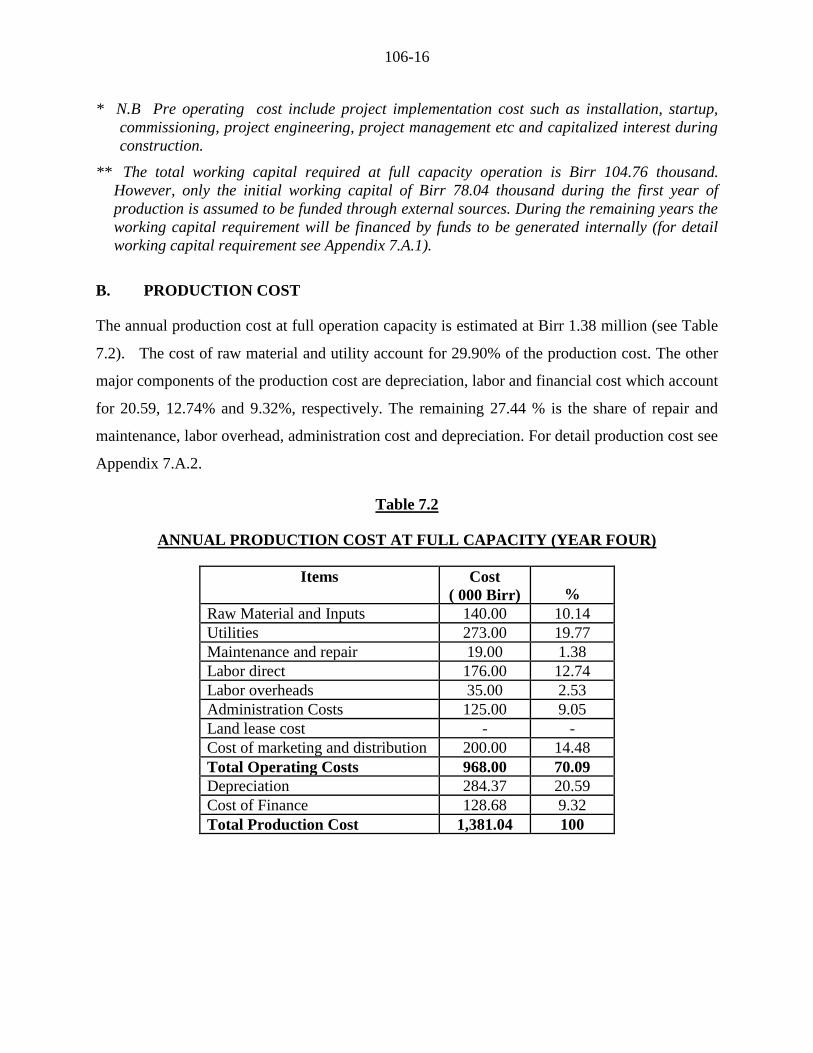
* N.B Pre operating cost include project implementation cost such as installation, startup,
commissioning, project engineering, project management etc and capitalized interest during
construction.
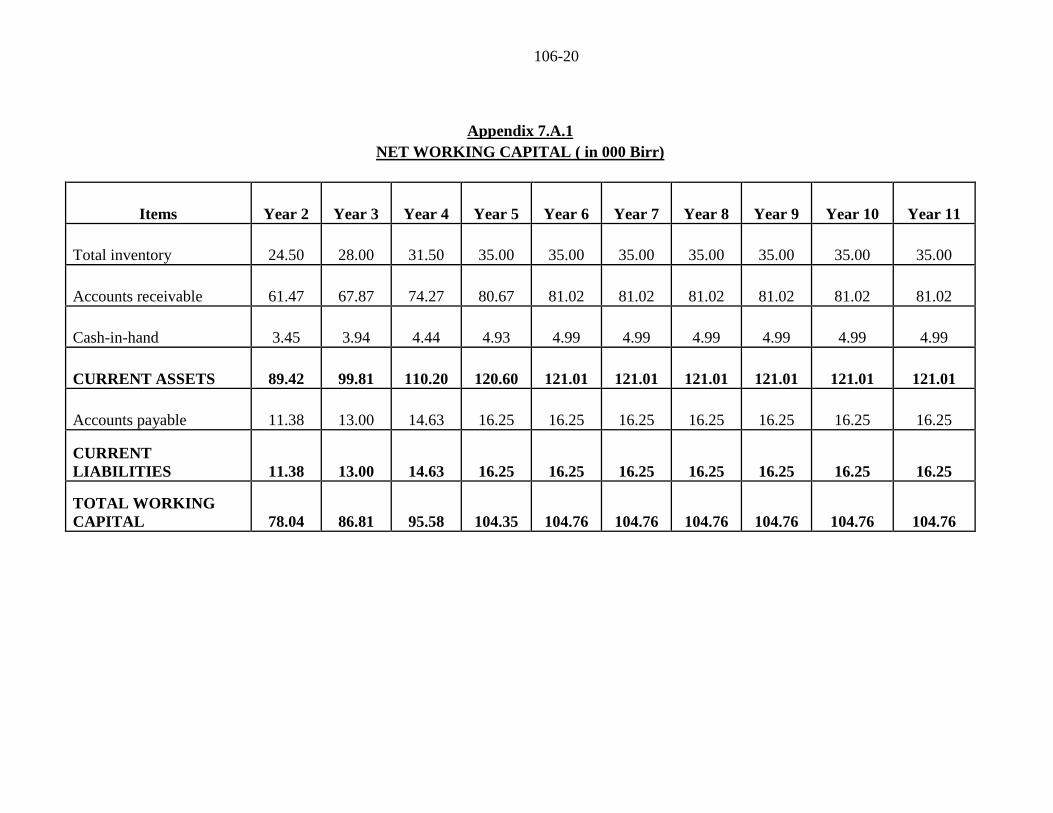
** The total working capital required at full capacity operation is Birr 104.76 thousand.
However, only the initial working capital of Birr 78.04 thousand during the first year of
production is assumed to be funded through external sources. During the remaining years the
working capital requirement will be financed by funds to be generated internally (for detail
working capital requirement see Appendix 7.A.1).
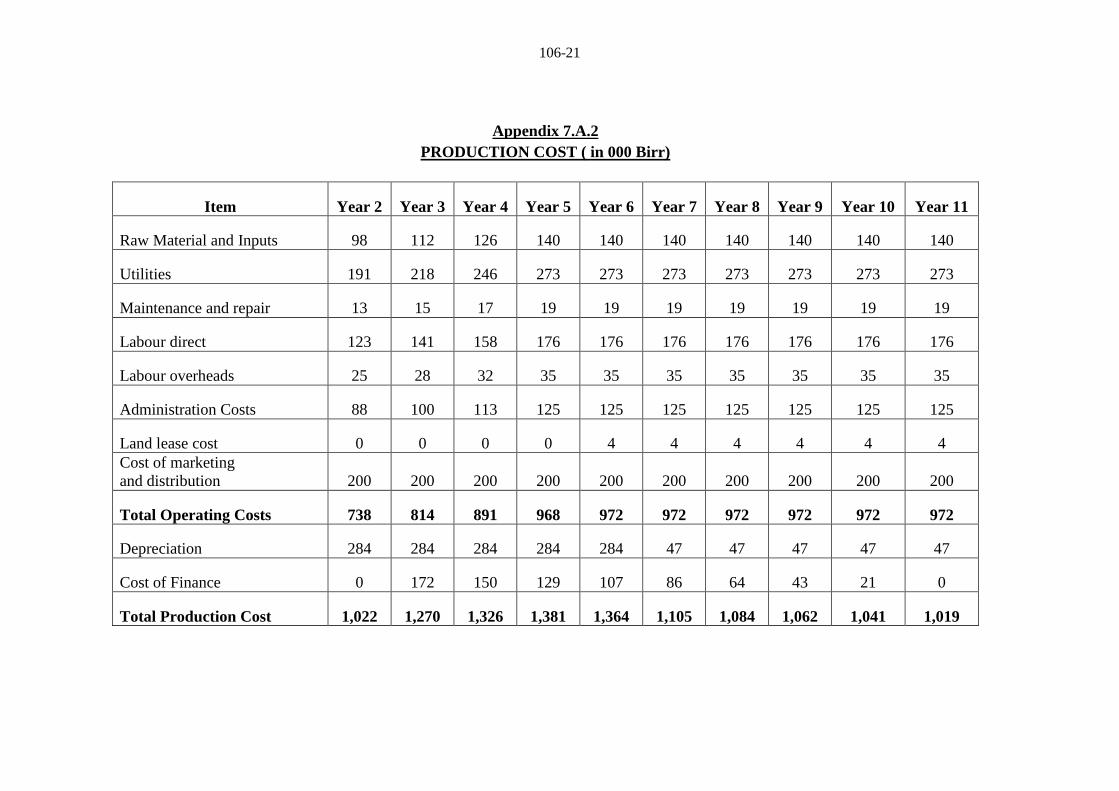
B. PRODUCTION COST
The annual production cost at full operation capacity is estimated at Birr 1.38 million (see Table
7.2). The cost of raw material and utility account for 29.90% of the production cost. The other
major components of the production cost are depreciation, labor and financial cost which account
for 20.59, 12.74% and 9.32%, respectively. The remaining 27.44 % is the share of repair and
maintenance, labor overhead, administration cost and depreciation. For detail production cost see
Appendix 7.A.2.
Table 7.2
ANNUAL PRODUCTION COST AT FULL CAPACITY (YEAR FOUR)
Items Cost
( 000 Birr) %
Raw Material and Inputs 140.00 10.14
Utilities 273.00 19.77
Maintenance and repair 19.00 1.38
Labor direct 176.00 12.74
Labor overheads 35.00 2.53
Administration Costs 125.00 9.05
Land lease cost - -
Cost of marketing and distribution 200.00 14.48
Total Operating Costs 968.00 70.09
Depreciation 284.37 20.59
Cost of Finance 128.68 9.32
Total Production Cost 1,381.04 100
106-17
C. FINANCIAL EVALUATION
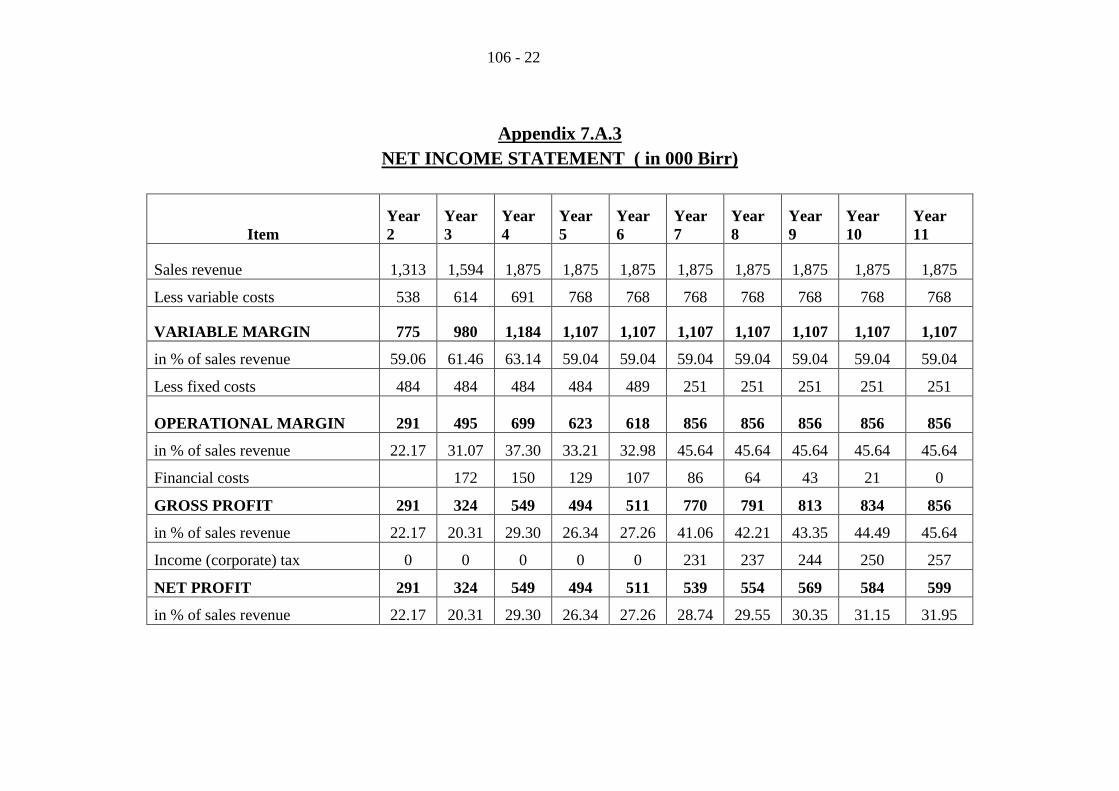
1. Profitability
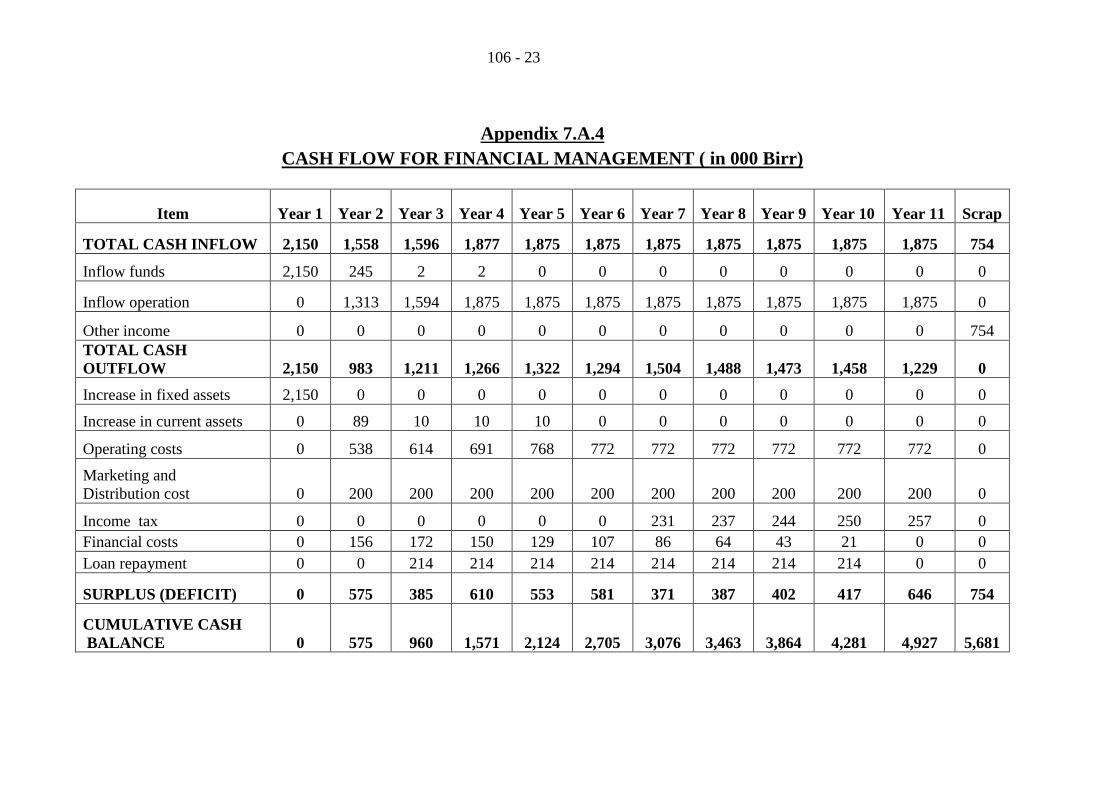
Based on the projected profit and loss statement, the project will generate a profit through out its
operation life. Annual net profit after tax will grow from Birr 291 thousand to Birr 599 thousand
during the life of the project. Moreover, at the end of the project life the accumulated net cash
flow amounts to Birr 5.68 million. For profit and loss statement and cash flow projection see
Appendix 7.A.3 and 7.A.4, respectively.
2. Ratios
In financial analysis, financial ratios and efficiency ratios are used as an index or yardstick for
evaluating the financial position of a firm. It is also an indicator for the strength and weakness of
the firm or a project. Using the year-end balance sheet figures and other relevant data, the most
important ratios such as return on sales which is computed by dividing net income by revenue,
return on assets (operating income divided by assets), return on equity (net profit divided by
equity) and return on total investment (net profit plus interest divided by total investment) has
been carried out over the period of the project life and all the results are found to be satisfactory.
3. Break-even Analysis
The break-even analysis establishes a relationship between operation costs and revenues. It
indicates the level at which costs and revenue are in equilibrium. To this end, the break-even
point for capacity utilization and sales value estimated by using income statement projection are
computed as followed.
Break- Even Sales Value = Fixed Cost + Financial Cost = Birr 820,403
Variable Margin ratio (%)
Break -Even Capacity utilization = Break- even Sales Value X 100 = 44 %
Sales revenue
4. Pay-back Period
The pay- back period, also called pay – off period is defined as the period required for recovering
the original investment outlay through the accumulated net cash flows earned by the project.
106-18
Accordingly, based on the projected cash flow it is estimated that the project’s initial investment
will be fully recovered within 3 years.
5. Internal Rate of Return
The internal rate of return (IRR) is the annualized effective compounded return rate that can be
earned on the invested capital, i.e., the yield on the investment. Put another way, the internal rate
of return for an investment is the discount rate that makes the net present value of the
investment's income stream total to zero. It is an indicator of the efficiency or quality of an
investment. A project is a good investment proposition if its IRR is greater than the rate of return
that could be earned by alternate investments or putting the money in a bank account.
Accordingly, the IRR of this project is computed to 32.23% indicating the viability of the
project.
6. Net Present Value
Net present value (NPV) is defined as the total present (discounted) value of a time series of cash
flows. NPV aggregates cash flows that occur during different periods of time during the life of a
project in to a common measuring unit i.e. present value. It is a standard method for using the
time value of money to appraise long-term projects. NPV is an indicator of how much value an
investment or project adds to the capital invested. In principle, a project is accepted if the NPV is
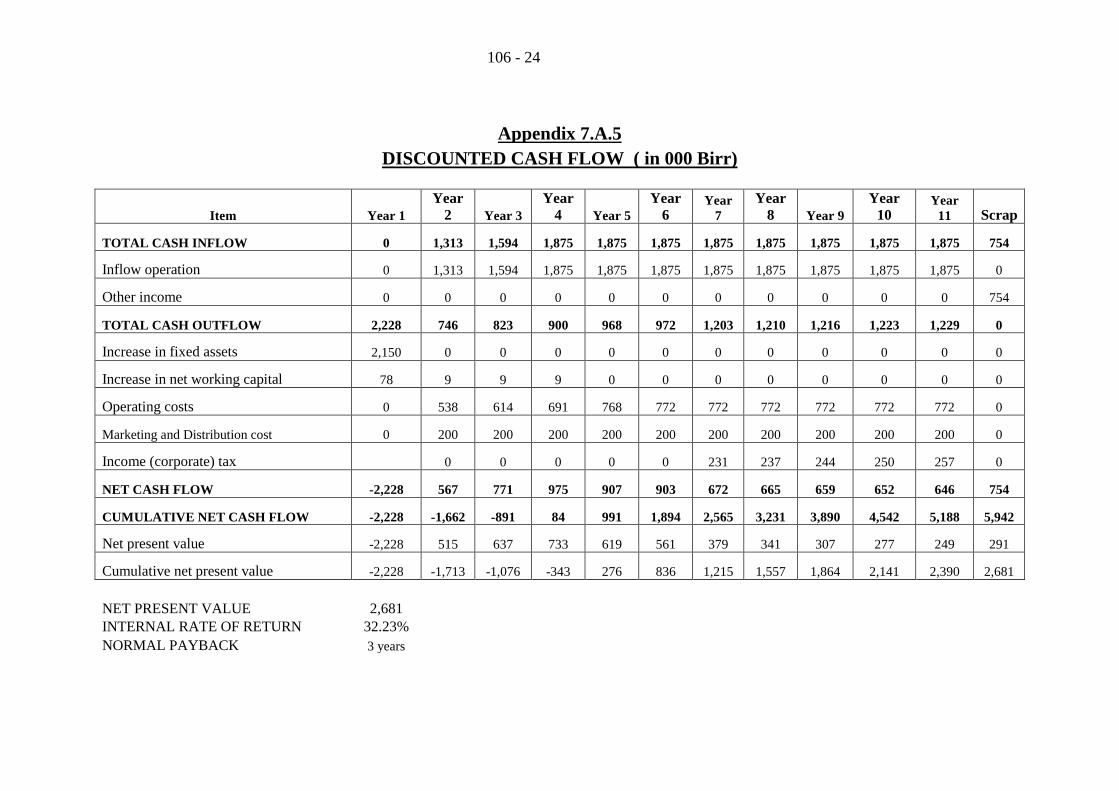
non-negative. Accordingly, the net present value of the project at 10% discount rate is found to
be Birr 2.68 million which is acceptable. For detail discounted cash flow see Appendix 7.A.5.
D. ECONOMIC AND SOCIAL BENEFITS
The project can create employment for 10 persons. The project will generate Birr 1.21 million in
terms of tax revenue. The establishment of such factory will have a foreign exchange saving
effect to the country by substituting the current imports. The project will also create forward
linkage with the pottery, education materials production, construction and medical instrument
supplies sub sectors and also generate other income for the Government.
106-19
Appendix 7.A
FINANCIAL ANALYSES SUPPORTING TABLES
106-20
Appendix 7.A.1
NET WORKING CAPITAL ( in 000 Birr)
Items Year 2 Year 3 Year 4 Year 5 Year 6 Year 7 Year 8 Year 9 Year 10 Year 11
Total inventory 24.50 28.00 31.50 35.00 35.00 35.00 35.00 35.00 35.00 35.00
Accounts receivable 61.47 67.87 74.27 80.67 81.02 81.02 81.02 81.02 81.02 81.02
Cash-in-hand 3.45 3.94 4.44 4.93 4.99 4.99 4.99 4.99 4.99 4.99
CURRENT ASSETS 89.42 99.81 110.20 120.60 121.01 121.01 121.01 121.01 121.01 121.01
Accounts payable 11.38 13.00 14.63 16.25 16.25 16.25 16.25 16.25 16.25 16.25
CURRENT
LIABILITIES 11.38 13.00 14.63 16.25 16.25 16.25 16.25 16.25 16.25 16.25
TOTAL WORKING
CAPITAL 78.04 86.81 95.58 104.35 104.76 104.76 104.76 104.76 104.76 104.76
106-21
Appendix 7.A.2
PRODUCTION COST ( in 000 Birr)
Item Year 2 Year 3 Year 4 Year 5 Year 6 Year 7 Year 8 Year 9 Year 10 Year 11
Raw Material and Inputs 98 112 126 140 140 140 140 140 140 140
Utilities 191 218 246 273 273 273 273 273 273 273
Maintenance and repair 13 15 17 19 19 19 19 19 19 19
Labour direct 123 141 158 176 176 176 176 176 176 176
Labour overheads 25 28 32 35 35 35 35 35 35 35
Administration Costs 88 100 113 125 125 125 125 125 125 125
Land lease cost 0 0 0 0 4 4 4 4 4 4
Cost of marketing
and distribution 200 200 200 200 200 200 200 200 200 200
Total Operating Costs 738 814 891 968 972 972 972 972 972 972
Depreciation 284 284 284 284 284 47 47 47 47 47
Cost of Finance 0 172 150 129 107 86 64 43 21 0
Total Production Cost 1,022 1,270 1,326 1,381 1,364 1,105 1,084 1,062 1,041 1,019
106 - 22
Appendix 7.A.3
NET INCOME STATEMENT ( in 000 Birr)
Item
Year
2
Year
3
Year
4
Year
5
Year
6
Year
7
Year
8
Year
9
Year
10
Year
11
Sales revenue 1,313 1,594 1,875 1,875 1,875 1,875 1,875 1,875 1,875 1,875
Less variable costs 538 614 691 768 768 768 768 768 768 768
VARIABLE MARGIN 775 980 1,184 1,107 1,107 1,107 1,107 1,107 1,107 1,107
in % of sales revenue 59.06 61.46 63.14 59.04 59.04 59.04 59.04 59.04 59.04 59.04
Less fixed costs 484 484 484 484 489 251 251 251 251 251
OPERATIONAL MARGIN 291 495 699 623 618 856 856 856 856 856
in % of sales revenue 22.17 31.07 37.30 33.21 32.98 45.64 45.64 45.64 45.64 45.64
Financial costs 172 150 129 107 86 64 43 21 0
GROSS PROFIT 291 324 549 494 511 770 791 813 834 856
in % of sales revenue 22.17 20.31 29.30 26.34 27.26 41.06 42.21 43.35 44.49 45.64
Income (corporate) tax 0 0 0 0 0 231 237 244 250 257
NET PROFIT 291 324 549 494 511 539 554 569 584 599
in % of sales revenue 22.17 20.31 29.30 26.34 27.26 28.74 29.55 30.35 31.15 31.95
106 - 23
Appendix 7.A.4
CASH FLOW FOR FINANCIAL MANAGEMENT ( in 000 Birr)
Item Year 1 Year 2 Year 3 Year 4 Year 5 Year 6 Year 7 Year 8 Year 9 Year 10 Year 11 Scrap
TOTAL CASH INFLOW 2,150 1,558 1,596 1,877 1,875 1,875 1,875 1,875 1,875 1,875 1,875 754
Inflow funds 2,150 245 2 2 0 0 0 0 0 0 0 0
Inflow operation 0 1,313 1,594 1,875 1,875 1,875 1,875 1,875 1,875 1,875 1,875 0
Other income 0 0 0 0 0 0 0 0 0 0 0 754
TOTAL CASH
OUTFLOW 2,150 983 1,211 1,266 1,322 1,294 1,504 1,488 1,473 1,458 1,229 0
Increase in fixed assets 2,150 0 0 0 0 0 0 0 0 0 0 0
Increase in current assets 0 89 10 10 10 0 0 0 0 0 0 0
Operating costs 0 538 614 691 768 772 772 772 772 772 772 0
Marketing and
Distribution cost 0 200 200 200 200 200 200 200 200 200 200 0
Income tax 0 0 0 0 0 0 231 237 244 250 257 0
Financial costs 0 156 172 150 129 107 86 64 43 21 0 0
Loan repayment 0 0 214 214 214 214 214 214 214 214 0 0
SURPLUS (DEFICIT) 0 575 385 610 553 581 371 387 402 417 646 754
CUMULATIVE CASH
BALANCE 0 575 960 1,571 2,124 2,705 3,076 3,463 3,864 4,281 4,927 5,681
106 - 24
Appendix 7.A.5
DISCOUNTED CASH FLOW ( in 000 Birr)
Item Year 1
Year
2 Year 3
Year
4 Year 5
Year
6 Year
7
Year
8 Year 9
Year
10 Year
11 Scrap
TOTAL CASH INFLOW 0 1,313 1,594 1,875 1,875 1,875 1,875 1,875 1,875 1,875 1,875 754
Inflow operation 0 1,313 1,594 1,875 1,875 1,875 1,875 1,875 1,875 1,875 1,875 0
Other income 0 0 0 0 0 0 0 0 0 0 0 754
TOTAL CASH OUTFLOW 2,228 746 823 900 968 972 1,203 1,210 1,216 1,223 1,229 0
Increase in fixed assets 2,150 0 0 0 0 0 0 0 0 0 0 0
Increase in net working capital 78 9 9 9 0 0 0 0 0 0 0 0
Operating costs 0 538 614 691 768 772 772 772 772 772 772 0
Marketing and Distribution cost 0 200 200 200 200 200 200 200 200 200 200 0
Income (corporate) tax 0 0 0 0 0 231 237 244 250 257 0
NET CASH FLOW -2,228 567 771 975 907 903 672 665 659 652 646 754
CUMULATIVE NET CASH FLOW -2,228 -1,662 -891 84 991 1,894 2,565 3,231 3,890 4,542 5,188 5,942
Net present value -2,228 515 637 733 619 561 379 341 307 277 249 291
Cumulative net present value -2,228 -1,713 -1,076 -343 276 836 1,215 1,557 1,864 2,141 2,390 2,681
NET PRESENT VALUE 2,681
INTERNAL RATE OF RETURN 32.23%
NORMAL PAYBACK 3 years
106 - 25