Embed Size (px)
Citation preview
Plasmas in Space: From the Surface of the Sun to the Orbit of the Earth
Steven R. Spangler, University of IowaDivision of Plasma Physics, American Physical Society
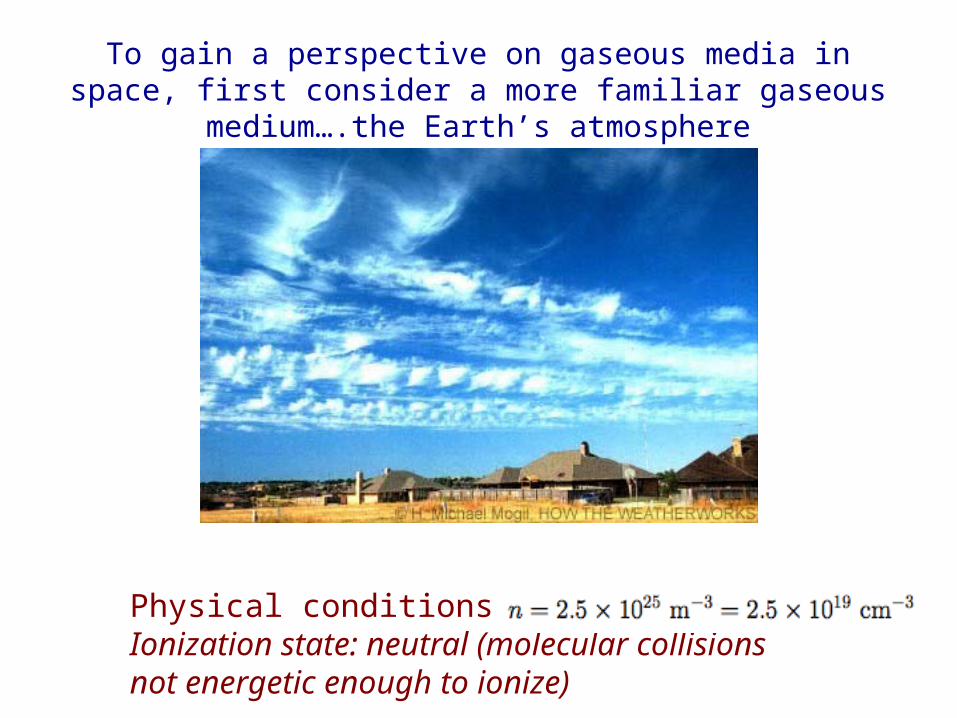
To gain a perspective on gaseous media in space, first consider a more familiar gaseous medium….the Earth’s atmosphere
Physical conditions: T=290K, Ionization state: neutral (molecular collisions not energetic enough to ionize)
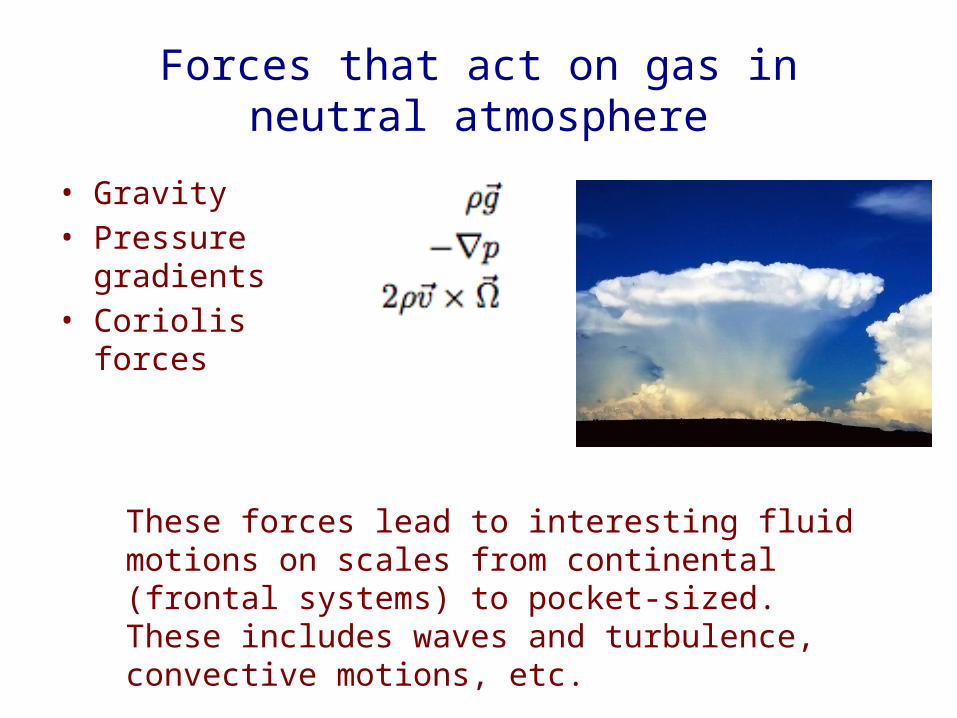
Forces that act on gas in neutral atmosphere
• Gravity• Pressure gradients• Coriolis forces
These forces lead to interesting fluid motions on scales from continental (frontal systems) to pocket-sized. These includes waves and turbulence, convective motions, etc.
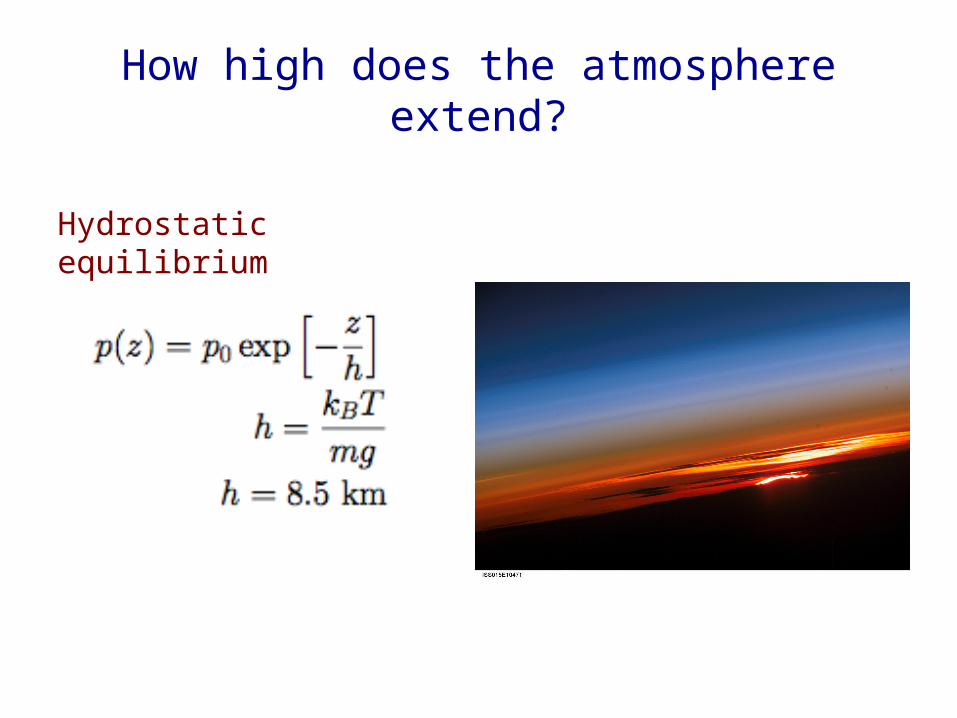
How high does the atmosphere extend?
Hydrostatic equilibrium
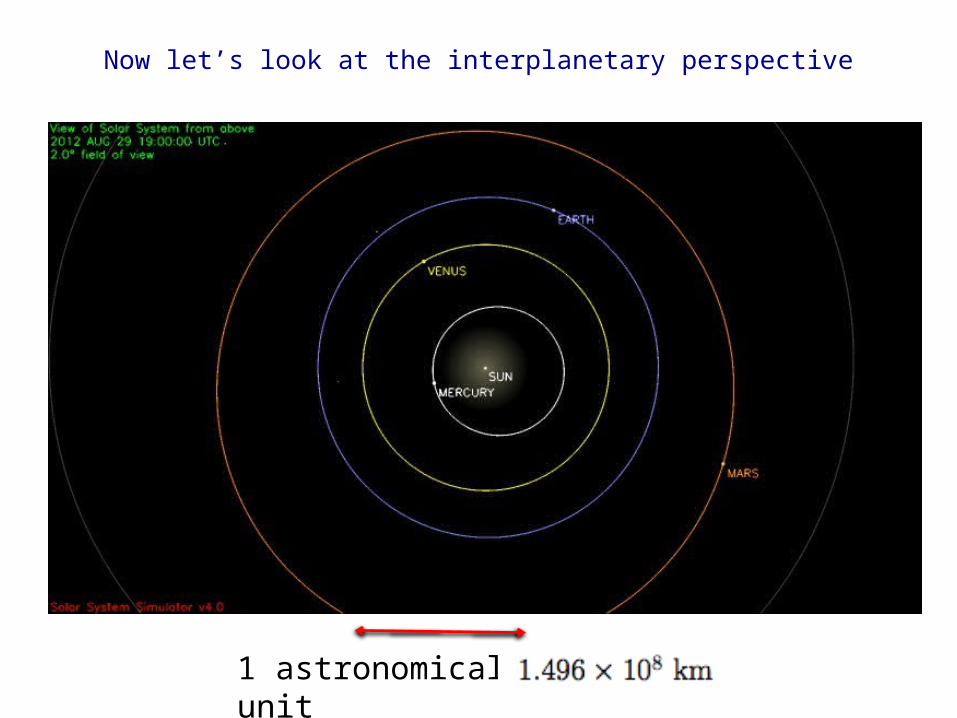
Now let’s look at the interplanetary perspective
1 astronomical unit
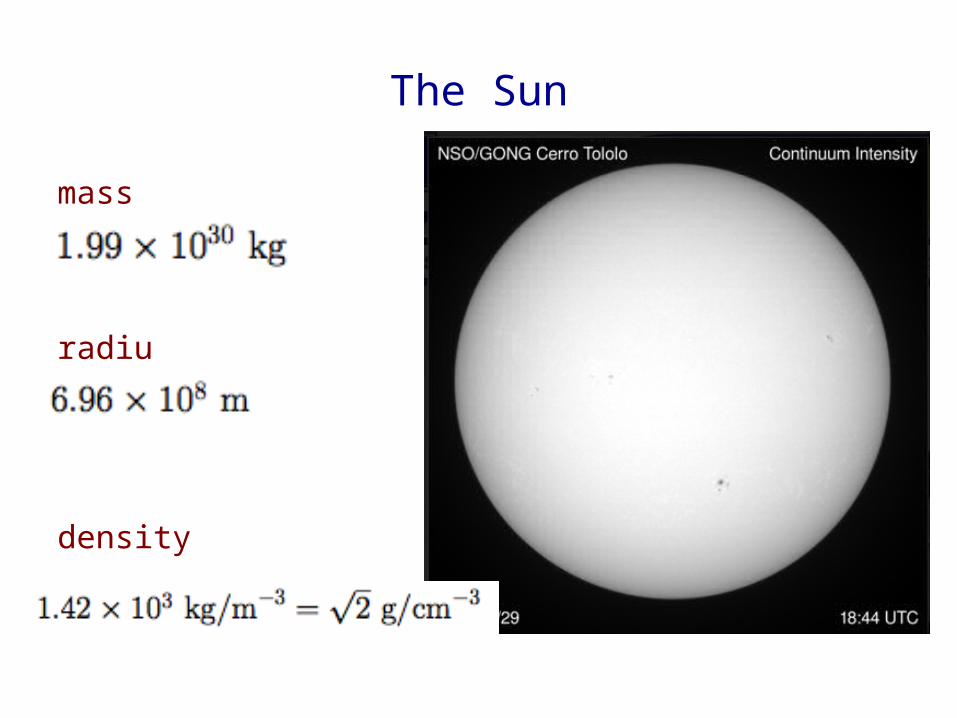
The Sun
mass
radius
density
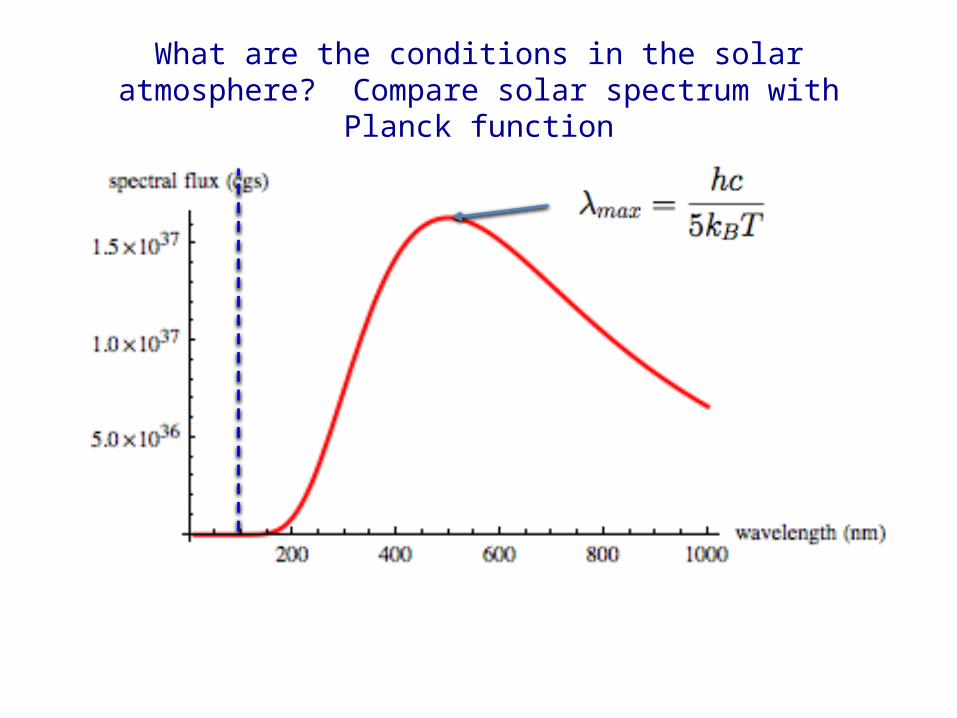
What are the conditions in the solar atmosphere? Compare solar spectrum with Planck function
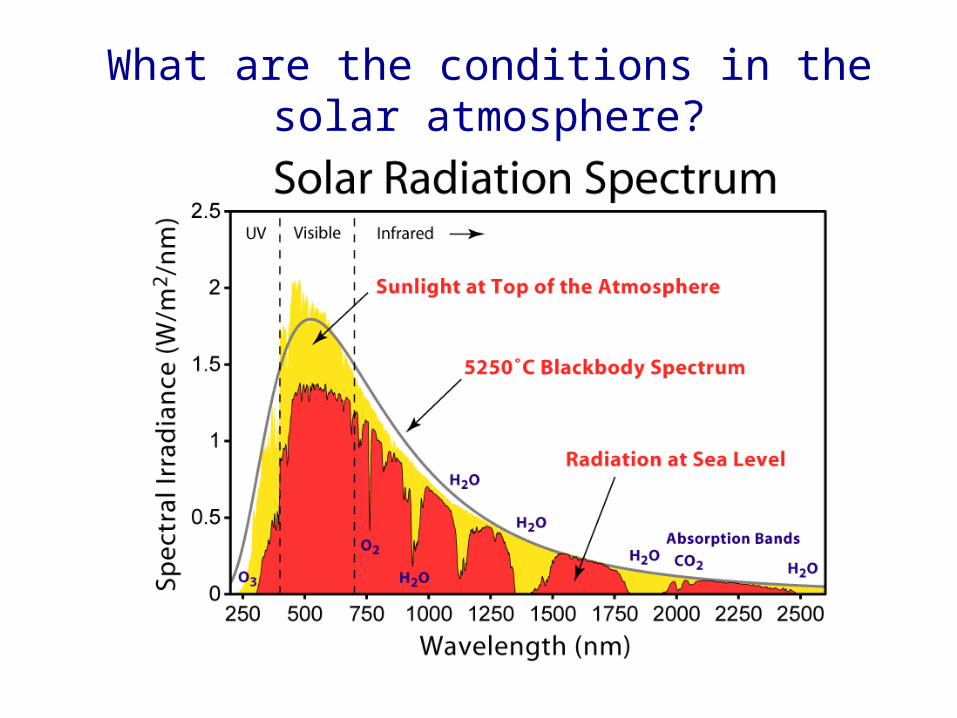
What are the conditions in the solar atmosphere?
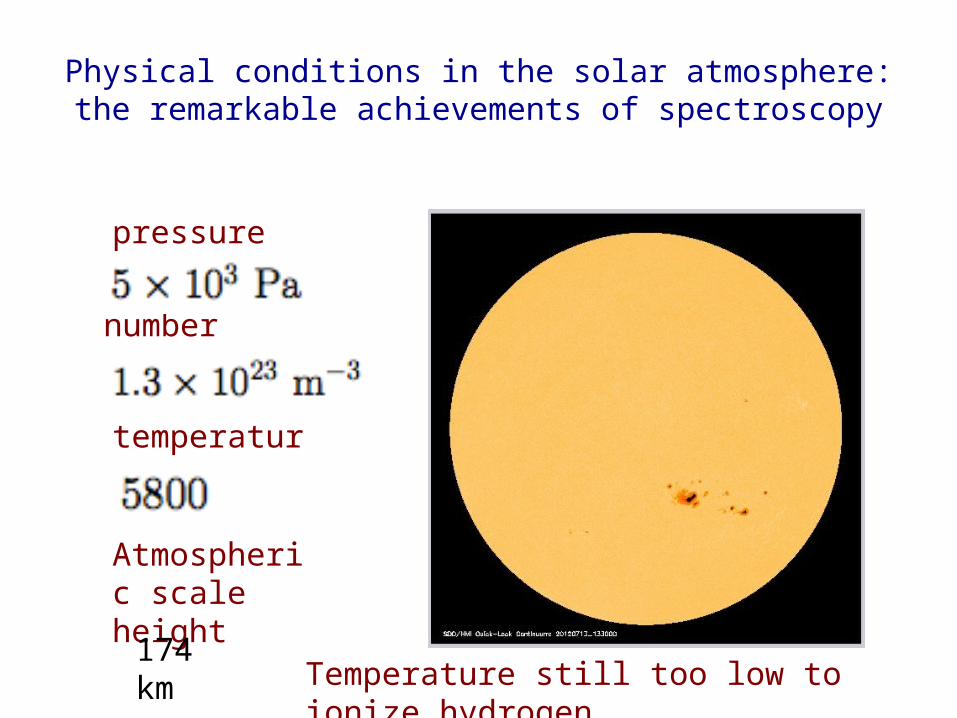
Physical conditions in the solar atmosphere: the remarkable achievements of spectroscopy
pressure
number density
temperature
Temperature still too low to ionize hydrogen
Atmospheric scale height
174 km
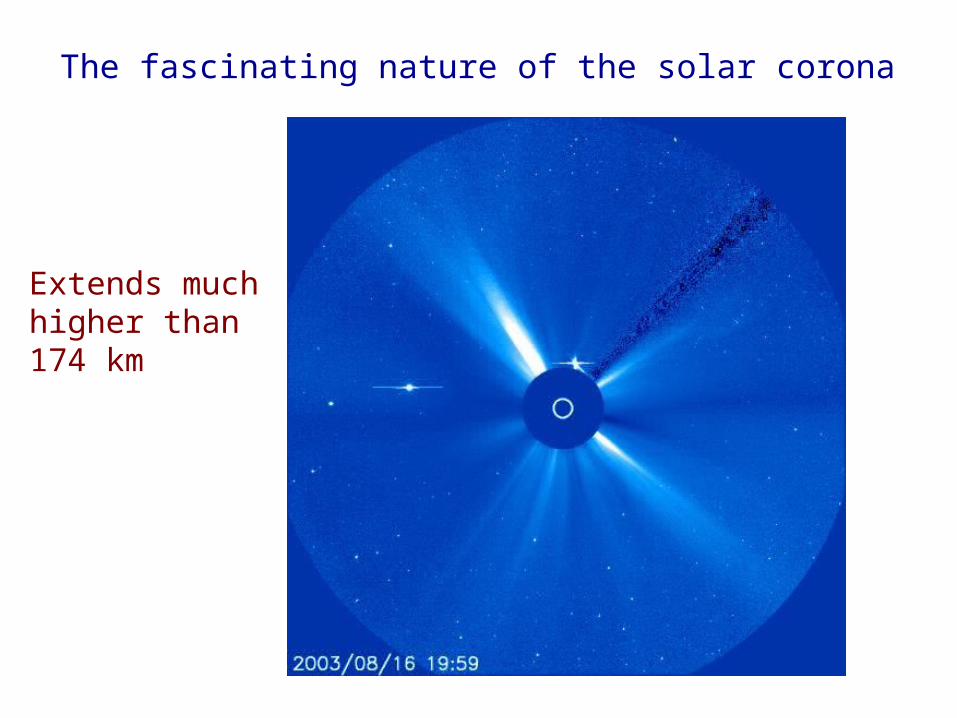
The fascinating nature of the solar corona
Extends much higher than 174 km
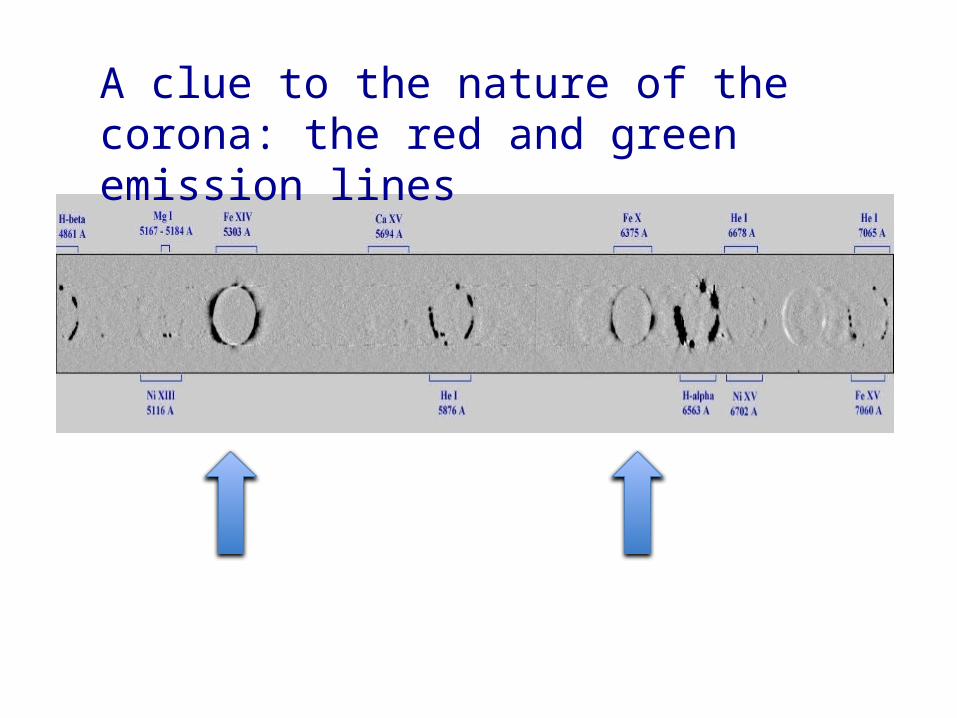
A clue to the nature of the corona: the red and green emission lines
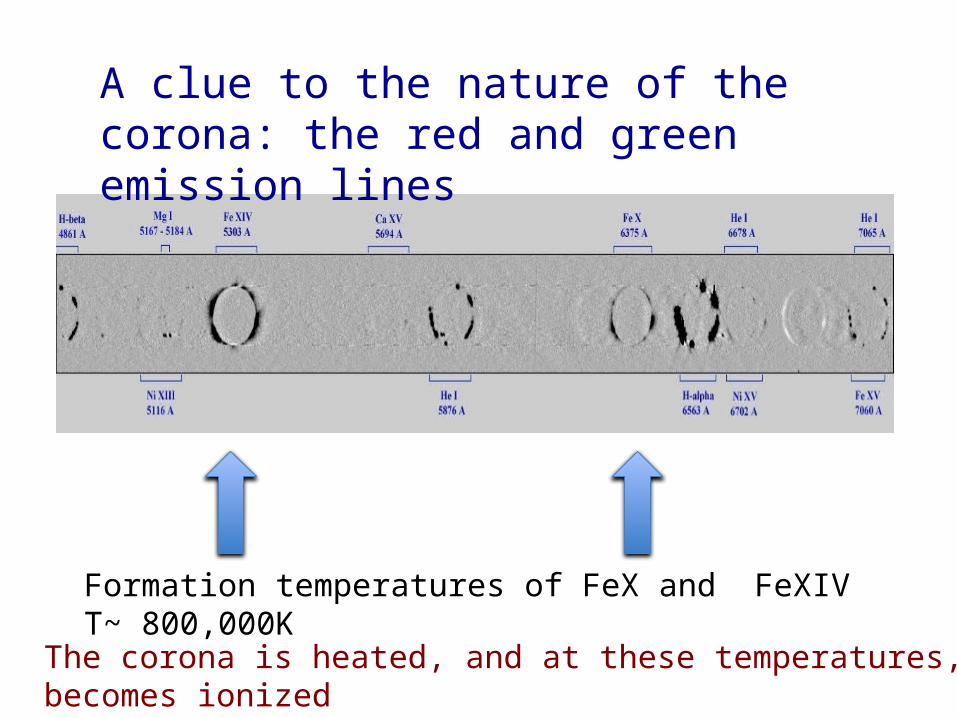
A clue to the nature of the corona: the red and green emission lines
Formation temperatures of FeX and FeXIV T~ 800,000K
The corona is heated, and at these temperatures, becomes ionized
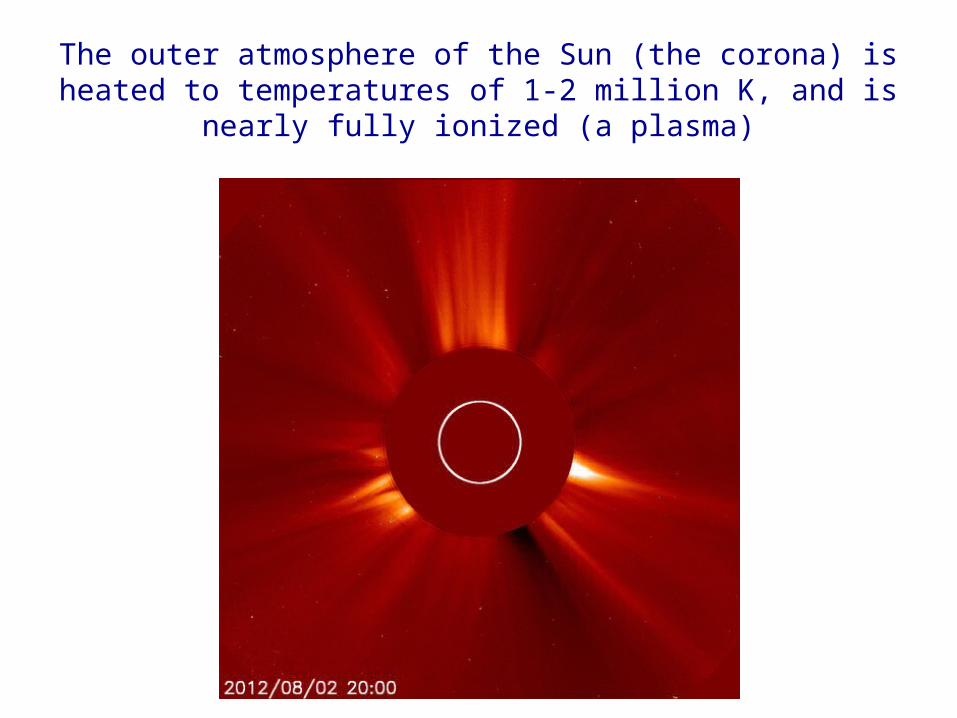
The outer atmosphere of the Sun (the corona) is heated to temperatures of 1-2 million K, and is nearly fully ionized (a
plasma)
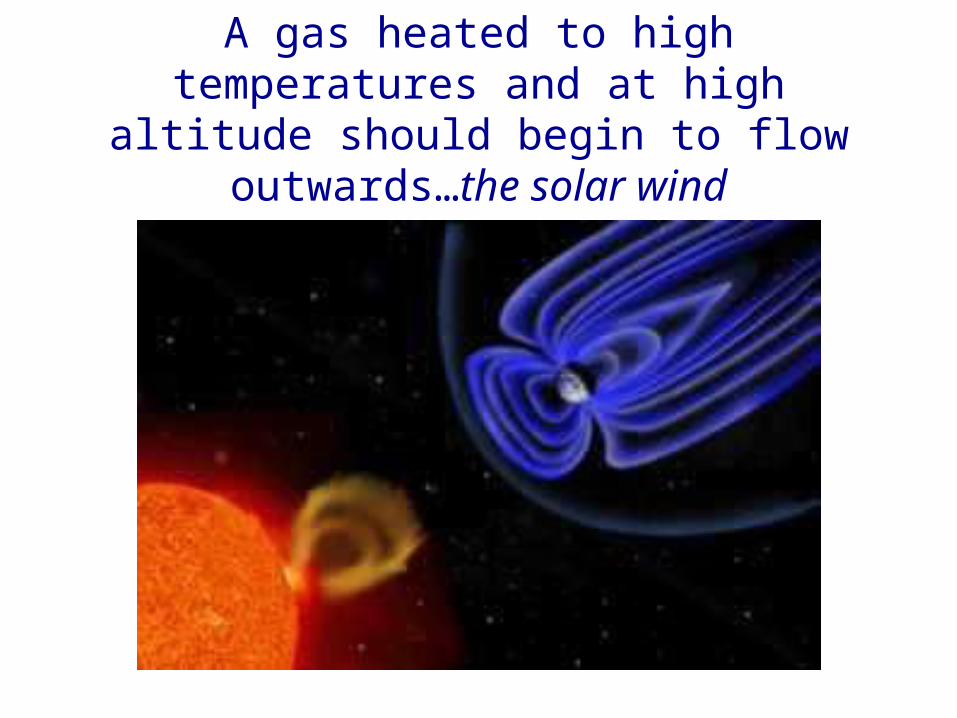
A gas heated to high temperatures and at high altitude should begin to flow outwards…the
solar wind
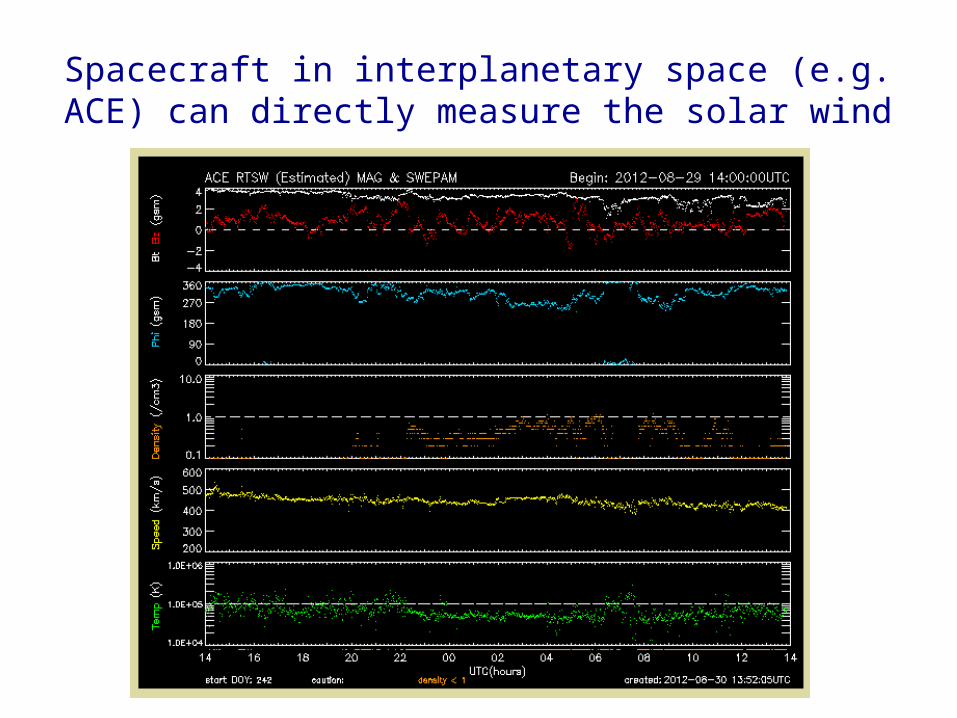
Spacecraft in interplanetary space (e.g. ACE) can directly measure the solar wind
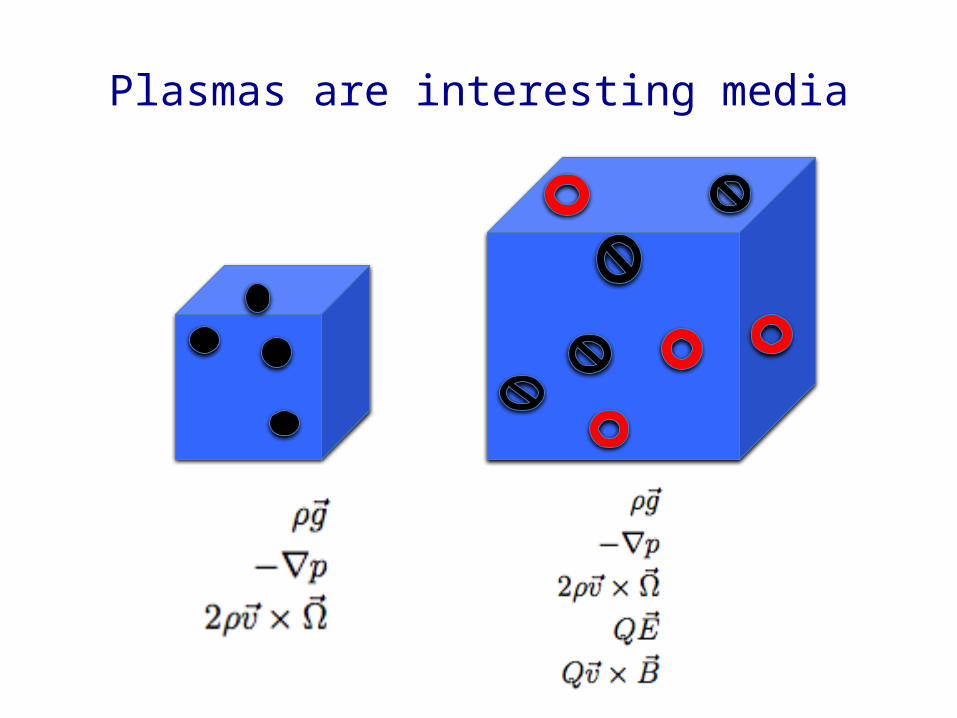
Plasmas are interesting media
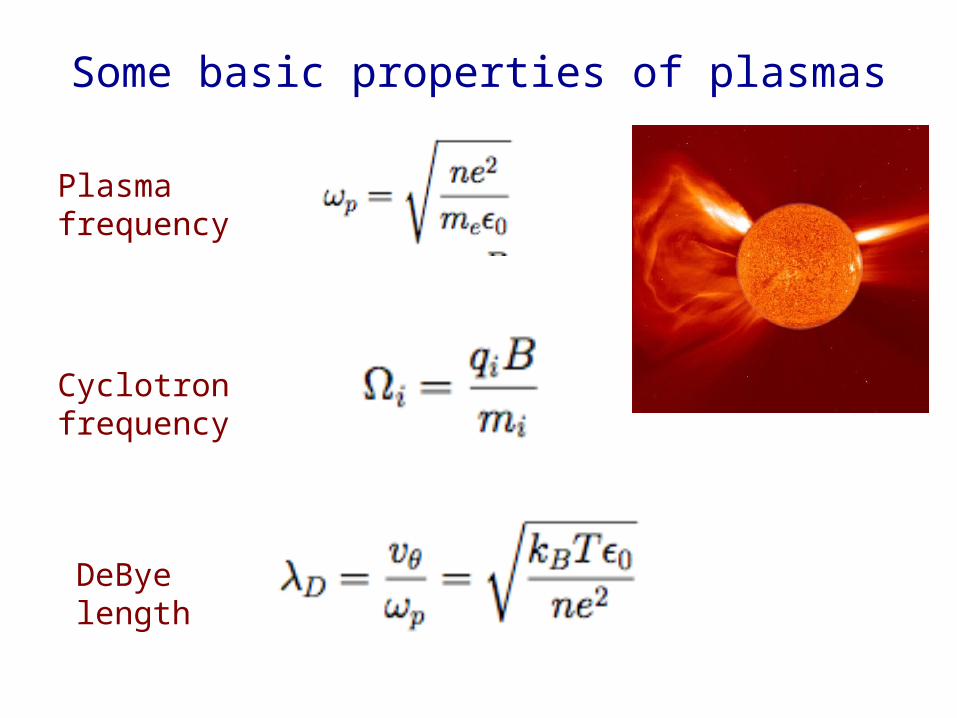
Some basic properties of plasmas
Plasma frequency
Cyclotron frequency
DeBye length
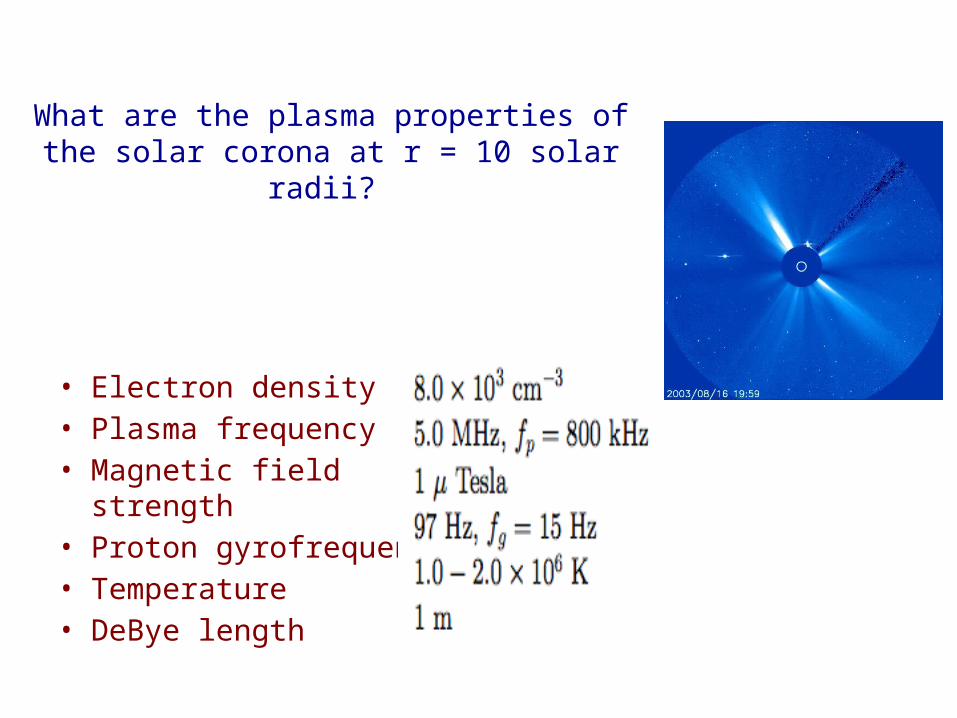
What are the plasma properties of the solar corona at r = 10 solar radii?
• Electron density• Plasma frequency• Magnetic field strength• Proton gyrofrequency• Temperature • DeBye length
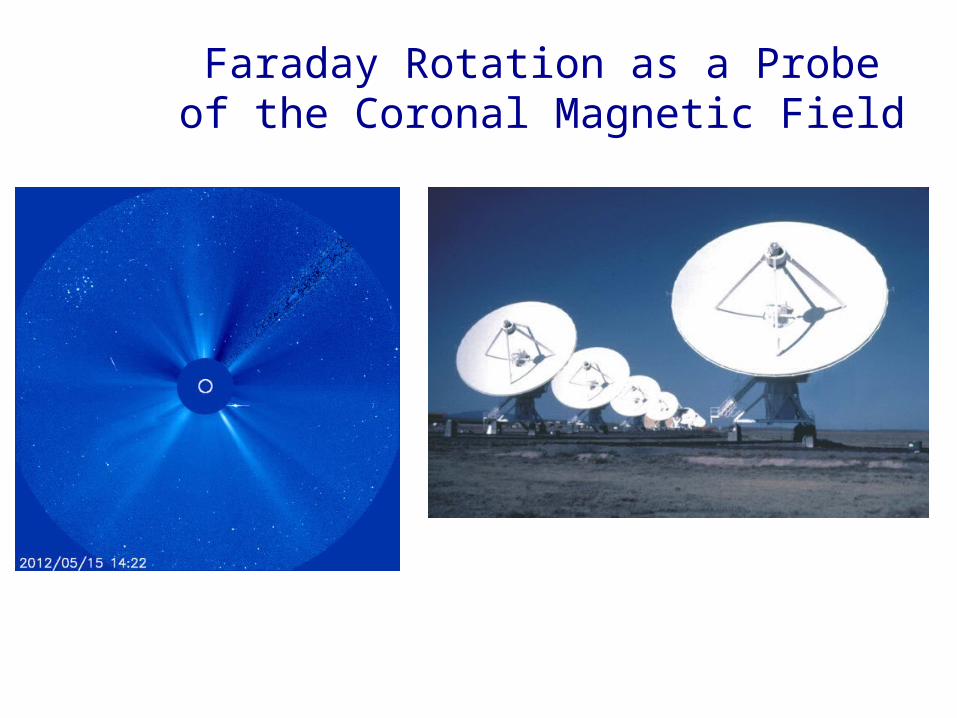
Faraday Rotation as a Probe of the Coronal Magnetic Field
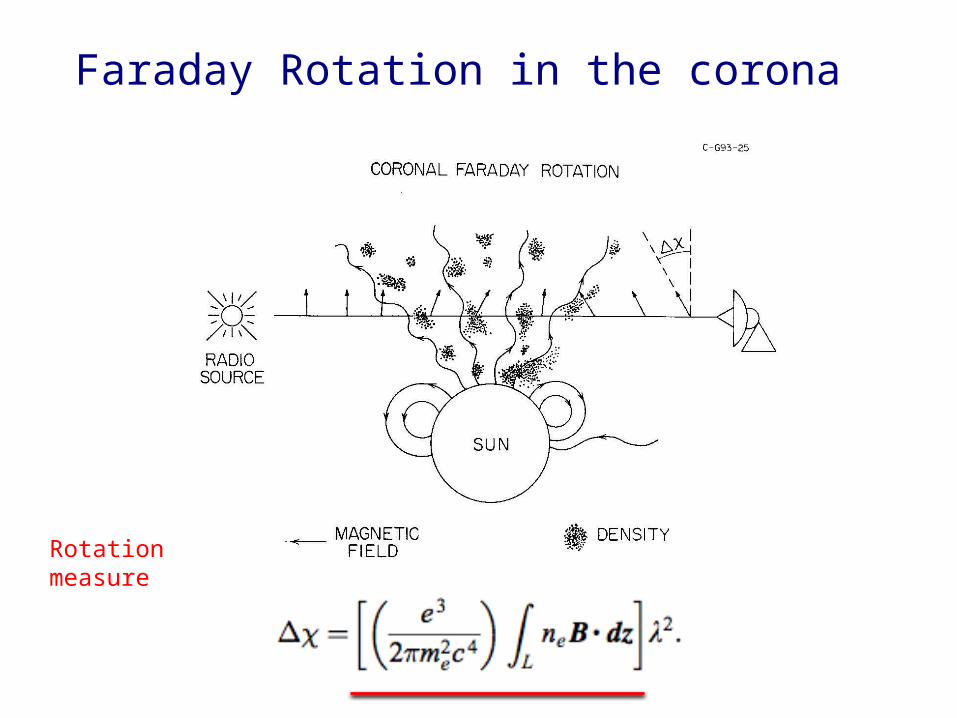
Faraday Rotation in the corona
Rotation measure
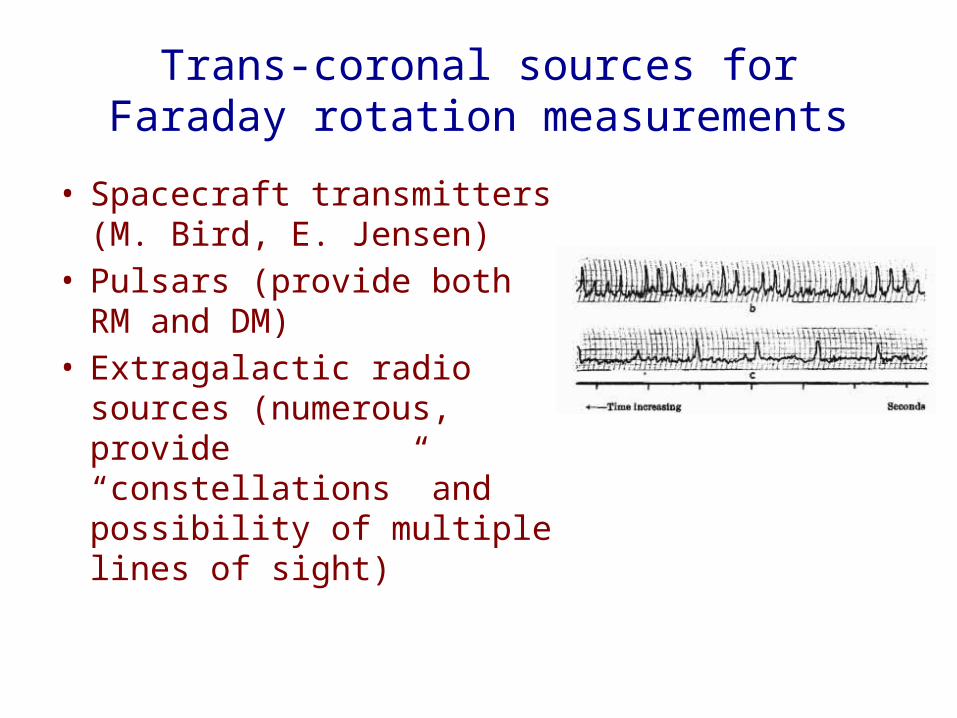
Trans-coronal sources for Faraday rotation measurements
• Spacecraft transmitters (M. Bird, E. Jensen)
• Pulsars (provide both RM and DM)
• Extragalactic radio sources (numerous, provide “constellations” and possibility of multiple lines of sight)
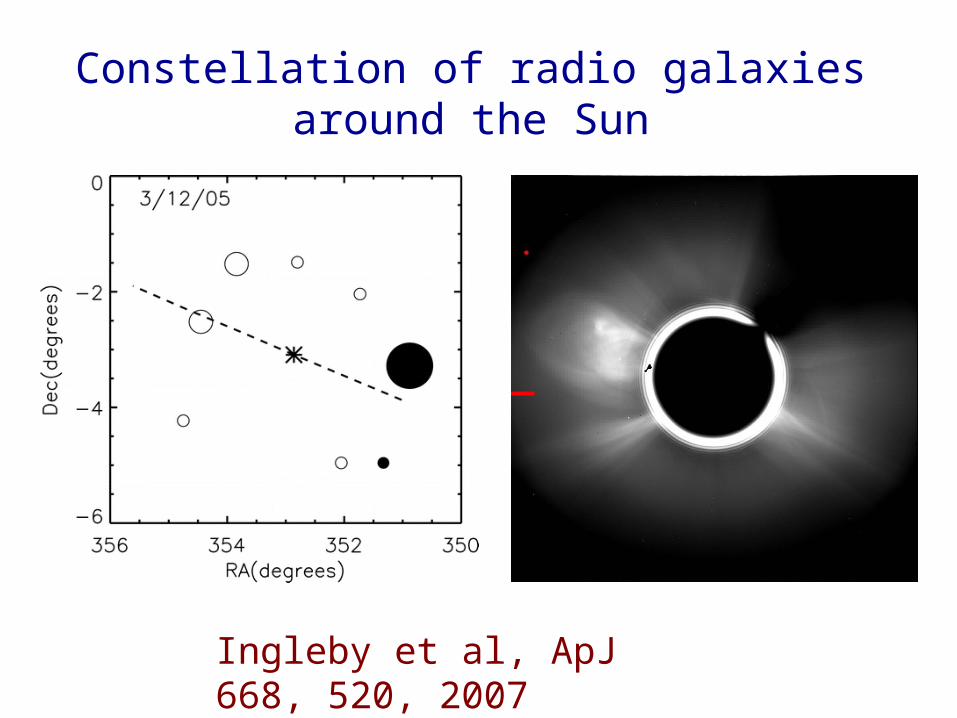
Constellation of radio galaxies around the Sun
Constellation of radio sources LASCO coronagraph image during observing sessionIngleby et al, ApJ 668, 520, 2007
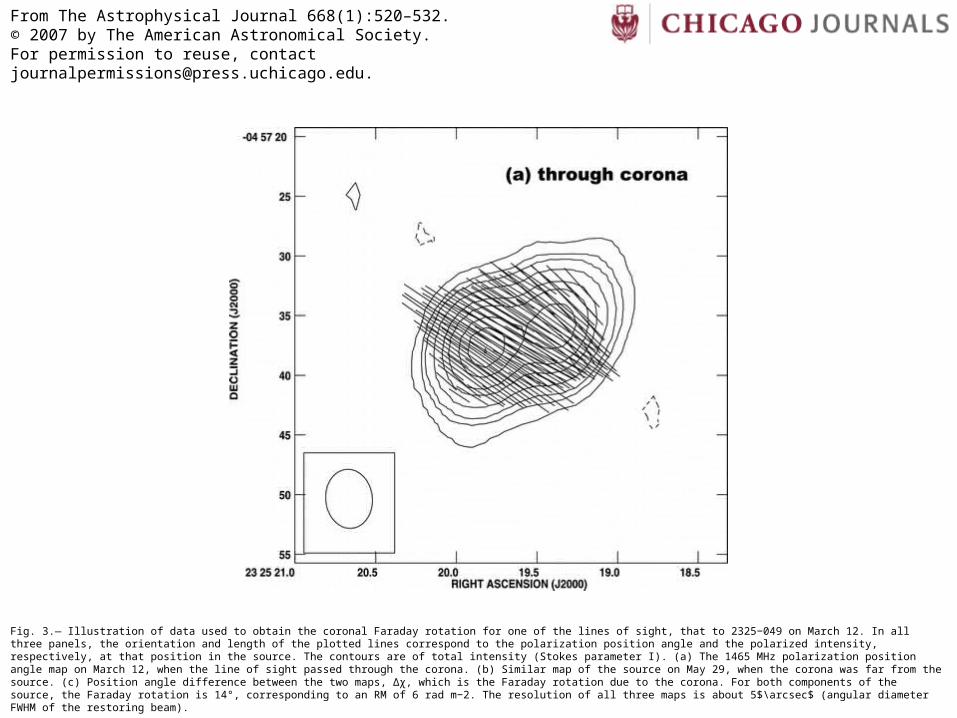
Fig. 3.— Illustration of data used to obtain the coronal Faraday rotation for one of the lines of sight, that to 2325−049 on March 12. In all three panels, the orientation and length of the plotted lines correspond to the polarization position angle and the polarized intensity, respectively, at that position in the source. The contours are of total intensity (Stokes parameter I). (a) The 1465 MHz polarization position angle map on March 12, when the line of sight passed through the corona. (b) Similar map of the source on May 29, when the corona was far from the source. (c) Position angle difference between the two maps, Δχ, which is the Faraday rotation due to the corona. For both components of the source, the Faraday rotation is 14°, corresponding to an RM of 6 rad m−2. The resolution of all three maps is about 5$\arcsec$ (angular diameter FWHM of the restoring beam).
From The Astrophysical Journal 668(1):520–532.© 2007 by The American Astronomical Society.For permission to reuse, contact [email protected].
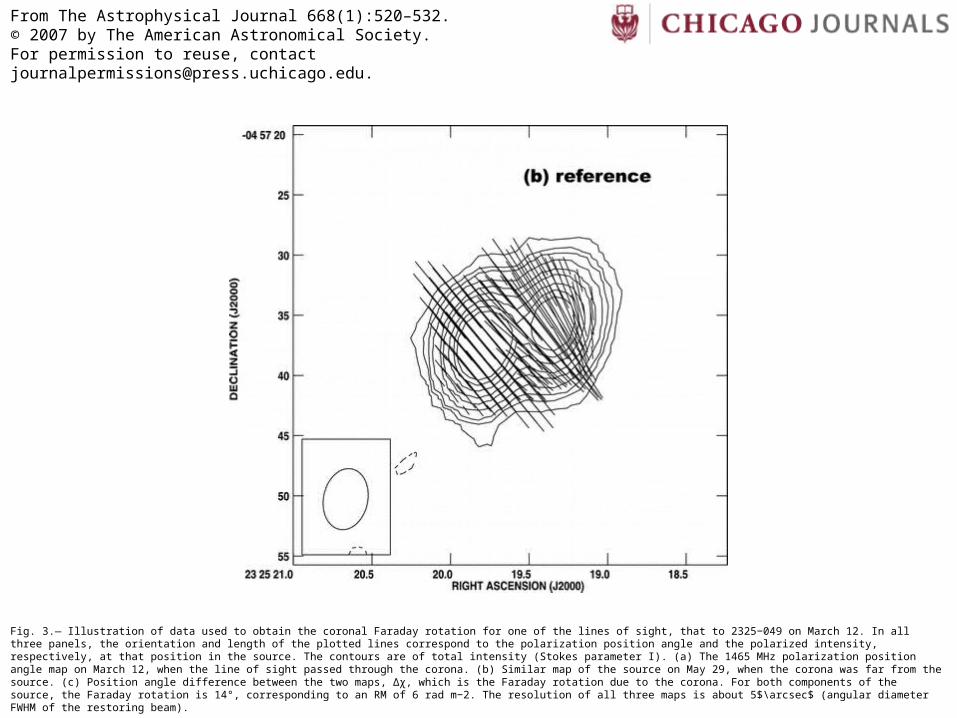
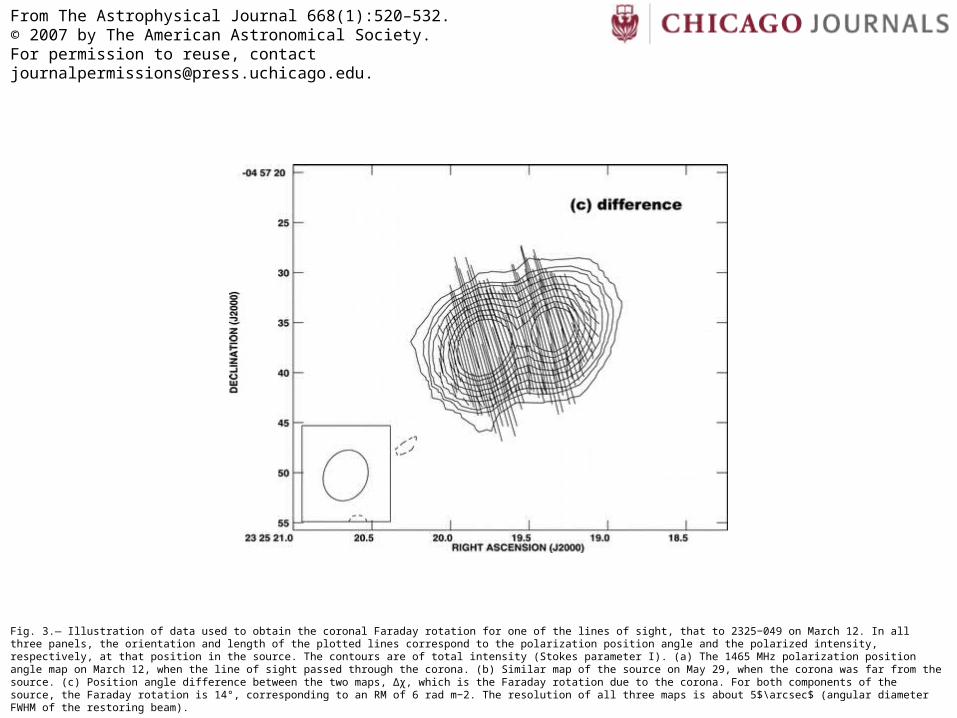
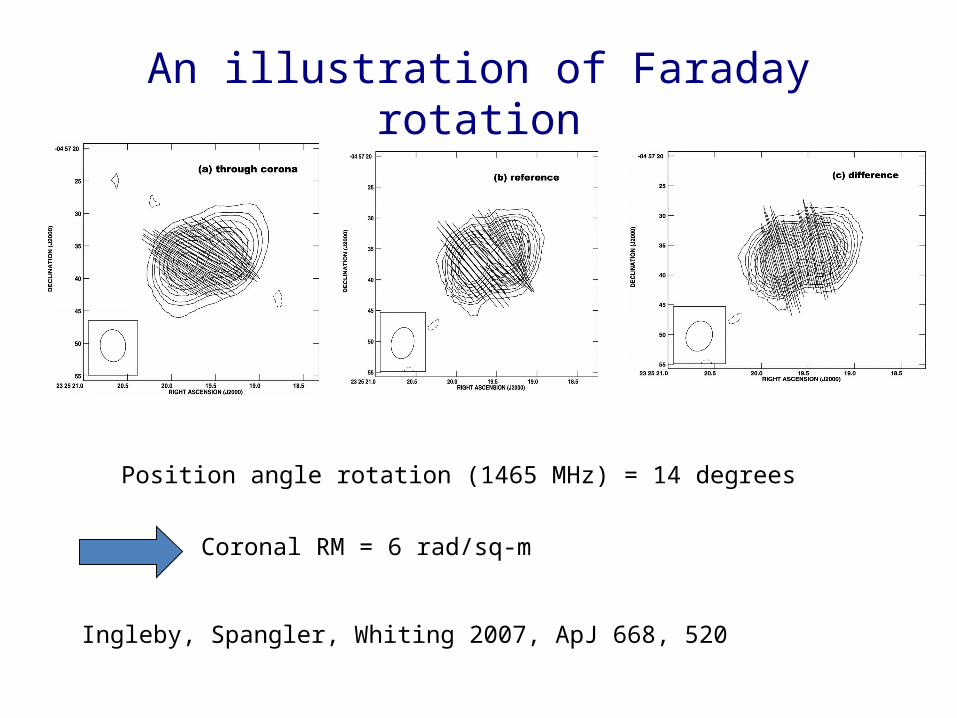
An illustration of Faraday rotation
Position angle rotation (1465 MHz) = 14 degrees
Coronal RM = 6 rad/sq-m
Ingleby, Spangler, Whiting 2007, ApJ 668, 520
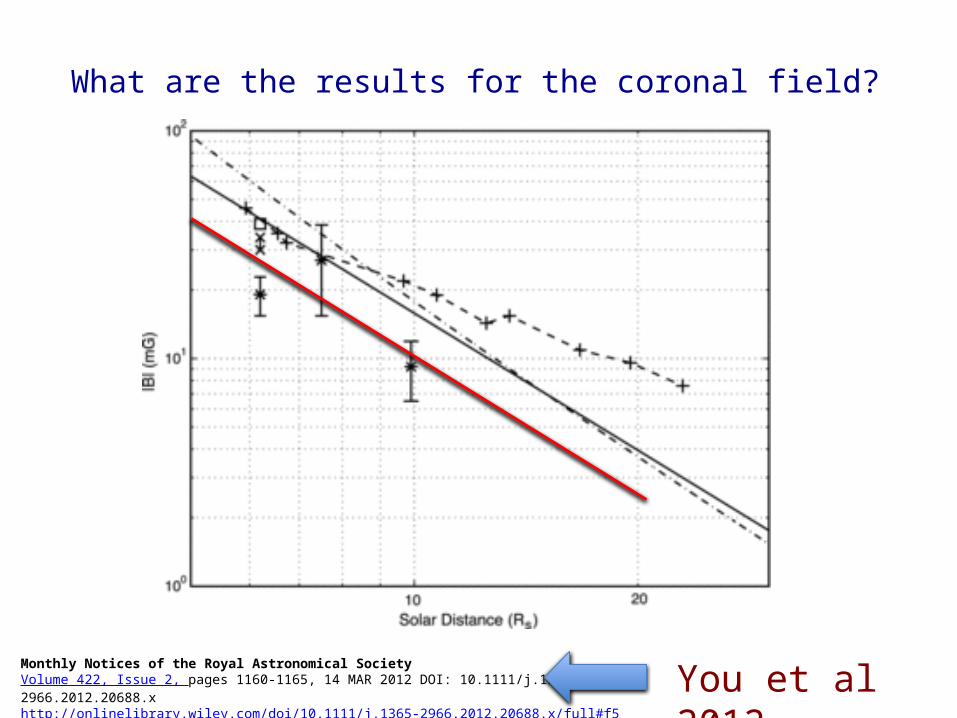
What are the results for the coronal field?
Monthly Notices of the Royal Astronomical SocietyVolume 422, Issue 2, pages 1160-1165, 14 MAR 2012 DOI: 10.1111/j.1365-2966.2012.20688.xhttp://onlinelibrary.wiley.com/doi/10.1111/j.1365-2966.2012.20688.x/full#f5
You et al 2012
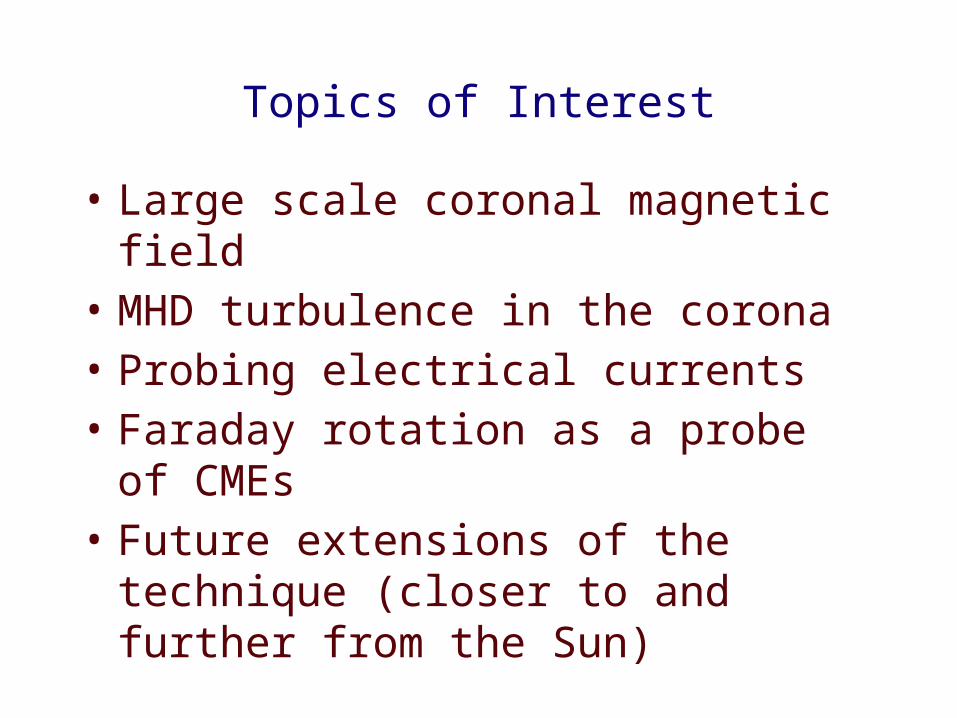
Topics of Interest
• Large scale coronal magnetic field• MHD turbulence in the corona• Probing electrical currents• Faraday rotation as a probe of CMEs• Future extensions of the technique (closer
to and further from the Sun)
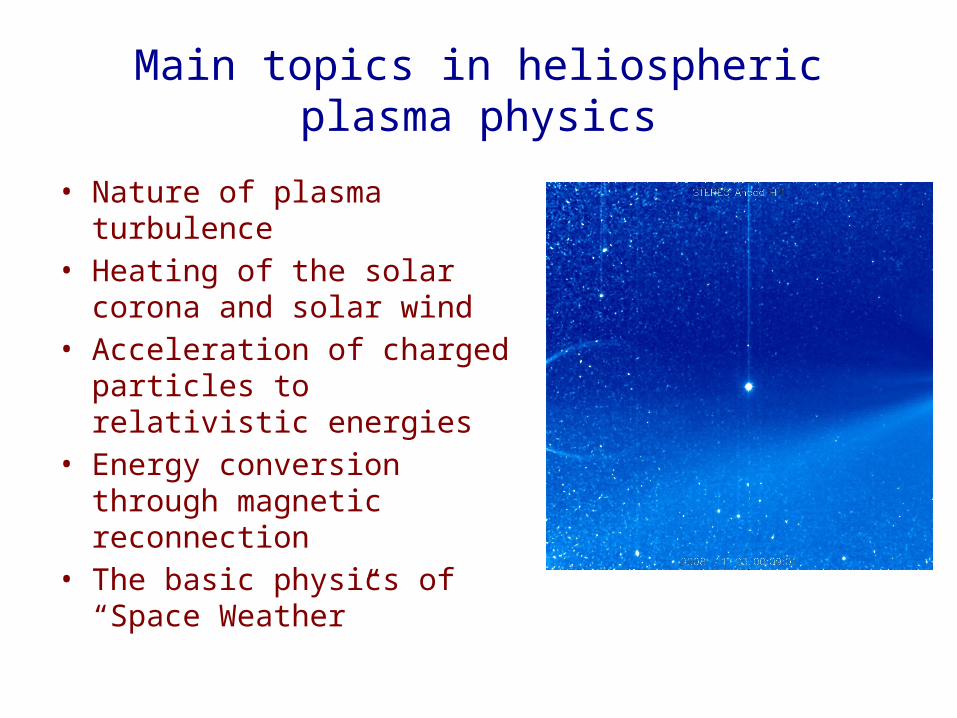
Main topics in heliospheric plasma physics
• Nature of plasma turbulence• Heating of the solar corona and
solar wind• Acceleration of charged particles
to relativistic energies• Energy conversion through
magnetic reconnection• The basic physics of “Space
Weather”
There are many exciting things to study in astrophysical plasma physics and plasma physics in general. Come join us!


![Orbit type: Sun Synchronous Orbit ] Orbit height: …...Orbit type: Sun Synchronous Orbit ] PSLV - C37 Orbit height: 505km Orbit inclination: 97.46 degree Orbit period: 94.72 min ISL](https://img.pdfslide.us/doc/110x75/5f781053e671b364921403bc/orbit-type-sun-synchronous-orbit-orbit-height-orbit-type-sun-synchronous.jpg)