Embed Size (px)
Citation preview

A plasma discharge model of a microwave plasma diamond CVD reactor
Pushpa Mahalingam1 and David S. DandyDepartment of Chemical Engineering
Colorado State UniversityFort Collins, Colorado 80523
Abstract
A self-consistent electromagnetic �eld model and a uid plasma model have been
developed for a microwave plasma reactor used for diamond chemical vapor deposition.
The coupled numerical models simulate the electromagnetic excitation of the hydro-
gen discharge and the hydrogen plasma discharge characteristics. The time-varying
electric and magnetic �elds inside the reactor, both inside and outside the plasma
discharge region, are obtained by applying a �nite-di�erence time-domain method to
solve Maxwell's equations. The electromagnetic �eld interactions with the plasma
discharge are described using electron and ion momentum transport equations. The
plasma discharge characteristics are simulated using a uid plasma model which solves
the electron and ion continuity equations, electron energy balance equation, and the
Poisson equation. Simulations have been performed to study the e�ect of input power
and pressure on hydrogen discharge characteristics such as the electron temperature
and plasma density.
Introduction
Microwave plasma assisted diamond chemical vapor deposition (CVD) is a commonly-
used technique for diamond growth [1-5]. Such reactors have been extensively studied during
the last several years in an e�ort to develop satisfactory plasma transport models that
provide an estimation of species and temperature spatial distributions in the deposition
chamber [6-15]. However, to date the studies have involved development of one-dimensional
plasma discharge models [6, 12-14], in simple reactor geometries [7]. It is widely recognized
that an understanding of the microwave excited plasma discharge characteristics and its
sensitivity to process parameters such as the ambient pressure and input power are essential
1Present Address: Texas Instruments Inc.
13121 TI Blvd., MS 352, Dallas, TX 75243
1

to correctly determine the ow �eld, temperature, and concentrations of activated species
at the substrate surface. In order to understand the behavior of the plasma inside a reactor,
the coupled relationship between the multidimensional microwave �elds, gas transport, and
energy transport need to be investigated. To accurately explain these issues, a self-consistent
two-dimensional numerical model is developed that simulates the electromagnetic �elds as
well as the excitation mechanism and characteristics of the plasma discharges used during
diamond CVD in a microwave plasma reactor.
In this study, the microwave plasma is excited by coupling the microwave energy into
the discharge by joule heating [16]. The electromagnetic �eld energy is imparted to the
electron gas, where the energy is then transferred to ions and neutrals by elastic and inelastic
collisions. The electromagnetic �elds inside the reactor are determined by the �nite-di�erence
time-domain (FDTD) method [17]. The FDTD method is a non-traditional approach to
numerical electromagnetics for engineering applications where analytic methods such as the
frequency-domain integral equation approaches have dominated for almost three decades [18].
The FDTD method has been utilized in recent studies for the solution of three-dimensional
scattering problems, lossy dielectric materials, resonant cavities, and electromagnetic �elds
inside a compact electron cyclotron resonance ion source [19-21]. The FDTD method has
the advantage over analytical methods of ease of implementation for complicated geometries,
because spatially varying dielectric parameters can be assigned using grid points. Moreover,
most of the plasma numerical models may be easily coupled to the FDTD model because
both are in the time domain.
The numerical model developed here for plasma discharge simulation is the uid (con-
tinuum) plasma model, which solves for the moments of the Boltzmann equation, including
the continuity equation, momentum transport equation, and energy transport equation. The
2

electric �elds causing plasma excitation inside the plasma discharge are governed by Pois-
son's equation. A self-consistent electromagnetic and plasma discharge solution is obtained
by iteratively solving the coupled electromagnetic �eld and the uid plasma models. The
details of the coupling of the FDTD electromagnetic �eld model and the uid plasma model
are provided in the following sections.
A 6-inch inside diameter microwave plasma reactor loaded with a hydrogen discharge is
simulated in this study. The hydrogen plasma was chosen because diamond �lm deposition
processes consist of high percentages of hydrogen in the discharge [1, 2]. As shown by
Koemtzopoulos et al. [7], adding small amounts of methane to a hydrogen discharge has
only a minimal e�ect on the electron energy distribution function. The spatial electric �eld
patterns, power absorption patterns, plasma density, electron energy, and plasma potential,
are simulated and analyzed for di�erent input conditions.
Background
Electromagnetic �eld model review
In this section, a review of the electromagnetic �eld model and the plasma discharge
model is presented. The electromagnetic �elds in a system can be obtained by solving the
di�erential form of Maxwell's equations in either the time domain or the frequency domain.
To solve the electromagnetic �elds in the frequency domain, electromagnetic quantities such
as the electric and magnetic �elds are often assumed to be time-harmonic, that is, their time
dependence can be described by a periodic sinusoid which is included in Maxwell's equations
as a factor of the form ej!t, where ! is the frequency of the imposed electromagnetic �elds [22].
Then, the Maxwell equations are converted to vector Helmholtz equations, and the electric
and magnetic �elds are solved analytically in cylindrical coordinates (for a cylindrical cavity)
3

in terms of a set of Bessel function-type solutions [22]. One major di�culty in applying the
frequency domain electromagnetic �eld solutions is the geometry of the plasma discharge.
If the load is geometrically complex, the number of boundary conditions needed for �eld
solutions increases, leading to intractable computer solutions.
An alternative approach to determine the electromagnetic �eld inside the cavity is to di-
rectly solve the time-dependent Maxwell's equations by using a �nite di�erence time-domain
method. The FDTD technique was �rst proposed to examine interactions of electromag-
netic waves with a perfectly conducting material [17]. In that model, the time-dependent
Maxwell's equations in a rectangular coordinate system were expanded to a set of six scalar
equations which were further discretized in both the time and space domain to obtain a
set of �nite di�erence equations. The numerical solutions of the FDTD model can achieve
second order accuracy both in space and time by a staggered spatial mesh arrangement and
by the leapfrog time marching method.
Review of plasma discharge models
Generally, for plasma-aided processing, there are two major approaches to simulate the
transport behavior of discharges. One is the particle approach, which is carried out using a
particle simulation technique that treats the plasma as a combination of particles (electrons,
ions, neutrals) and calculates the trajectories of many particles in time to obtain the macro-
scopic quantities of the plasma [23-27]. This technique is particularly well suited for low
pressure (mTorr), ECR, and non-equilibrium discharge simulation. However, its inherently
time-consuming nature largely reduces its e�ciency when implemented in computer pro-
grams. This is especially unattractive for simulation domains much larger than the particle
mean free path or three-dimensional simulations.
The other approach is the continuum (or uid) method, which treats the plasma as a uid
4

and solves the moment equations of the Boltzmann transport equation (BTE), including the
continuity equation, momentum transport equation and energy transport equation of each
plasma species [28-30]. The uid models and the particle models are sometimes coupled as
a hybrid uid/particle model to provide self-consistent solutions [31]. However, uid models
may not be applied when the mean free path of particles (particularly electrons) are not the
smallest characteristic length in the system, for non-equilibrium discharges, or large density
(or energy) gradient regions. However, the uid models have the advantage of being less
computationally-intensive than the particle model. Therefore, in this study the microwave
discharges are modeled based on uid techniques since the pressure typically used during
diamond microwave plasma CVD is in the 10-100 Torr range [1-5].
Model Formulation
The overall numerical model includes an electromagnetic model and a uid plasma model
that are described in the following sections. The coupling of these two models is also de-
scribed. The schematic of the reactor and the problem domain used for the FDTD model
and the uid plasma model is shown in Fig. 1. The microwave plasma reactor modeled in
this work is cylindrical and is azimuthally symmetrical; therefore, a two-dimensional (r and
z directions as shown in Fig. 1) cylindrical coordinate system is adopted in the discretization
of the governing equations of the FDTD and uid plasma models.
FDTD electromagnetic model
The electromagnetic �elds inside the microwave plasma reactor are obtained by solving
the time-dependent Maxwell's equations, which are given by [32]
r� E = ��@H
@t(1)
5
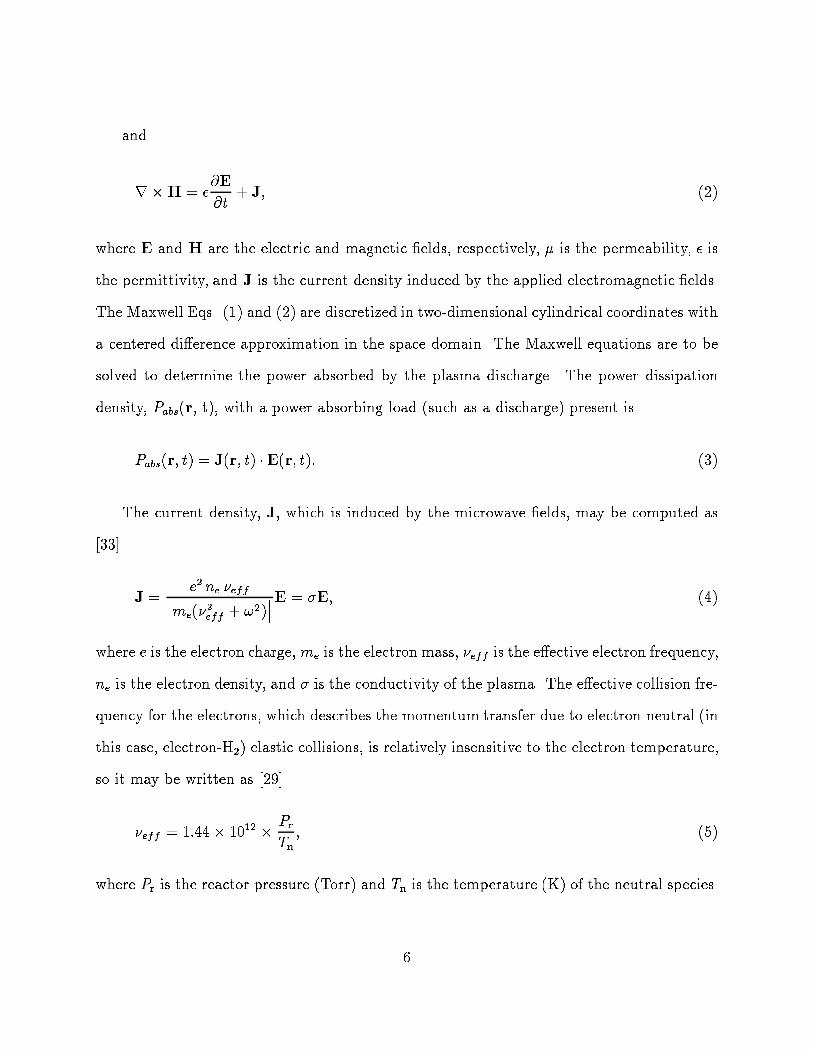
and
r�H = �@E
@t+ J; (2)
where E and H are the electric and magnetic �elds, respectively, � is the permeability, � is
the permittivity, and J is the current density induced by the applied electromagnetic �elds.
The Maxwell Eqs. (1) and (2) are discretized in two-dimensional cylindrical coordinates with
a centered di�erence approximation in the space domain. The Maxwell equations are to be
solved to determine the power absorbed by the plasma discharge. The power dissipation
density, Pabs(r, t), with a power absorbing load (such as a discharge) present is
Pabs(r; t) = J(r; t) �E(r; t): (3)
The current density, J, which is induced by the microwave �elds, may be computed as
[33]
J =e2 ne �effh
me(�2eff + !2)iE = �E; (4)
where e is the electron charge, me is the electron mass, �eff is the e�ective electron frequency,
ne is the electron density, and � is the conductivity of the plasma. The e�ective collision fre-
quency for the electrons, which describes the momentum transfer due to electron-neutral (in
this case, electron-H2) elastic collisions, is relatively insensitive to the electron temperature,
so it may be written as [29]
�eff = 1:44� 1012 �Pr
Tn; (5)
where Pr is the reactor pressure (Torr) and Tn is the temperature (K) of the neutral species.
6

From the above equations (1)-(4), it may be seen that the current density, J, depends on
spatially-dependent discharge characteristics such as electron density and the electric �eld.
The electron density must be determined in a self-consistent manner using a uid plasma
model.
The boundary conditions for the electric �elds used in the FDTD model are described
below. The metallic reactor walls and the substrate are assumed to be perfect conductors,
such that the normal electric �eld components can exist and tangential components of the
electric �elds vanish on these surfaces. This boundary condition implies that the electro-
magnetic waves propagating to the perfectly-conducting wall boundaries would be totally
re ected and no �eld would penetrate through these boundaries. Therefore, the grids used
for the FDTD model may be truncated at the wall boundaries because no �elds can exist
outside these boundaries. However, the input end of the reactor where the microwave energy
is imparted to the reactor is an open boundary, i.e., the domain in which the �eld has to be
computed is unbounded. The electromagnetic waves, either incident or re ected, do exist
outside the boundary and the number of grids needed for simulation becomes unlimited in
principle. Therefore, at this open boundary a truncation method, which also prevents any
arti�cial re ection of the outgoing wave, must be used for limiting the domain in which
the �eld is computed. The schematic of the grid structure used in the electromagnetic �eld
model is illustrated in Fig. 2. The non-re ecting boundary condition applied in this model
may be written as [20]
En+1r (i; k0) = En
r (i; k0 � 1) +[�t=(��)1=2��z]
[�t=(��)1=2+�z]� [En+1
r (i; k0 � 1)� Enr (i; k0)] (6)
and
En+1� (i; k0) = En
�(i; k0 � 1) +[�t=(��)1=2��z]
[�t=(��)1=2+�z]� [En+1
� (i; k0 � 1)� En�(i; k0)] (7)
7

where i denotes the grid location in the r-direction and k0 is the grid terminating point in
the z-direction.
The electric �elds on the source points at the top end of the reactor as shown in Fig. 2
are prescribed to be [19]
En+1r (i; k1) = En
r (i; k1) + Csin(2�!t); (8)
where C is the amplitude of the electric �eld source, k1 is the grid plane where the source is
located, and ! is the excitation frequency (in this case, 2.45 GHz).
Fluid Plasma Model
The behavior of the charged particles in a weakly ionized gas can be described by the
particle, momentum, and energy balance equations for electrons and ions, which are obtained
from the moments of the Boltzmann equation. These equations are often combined with
Poisson's equation to provide a self-consistent space charge �eld. At steady state, Poisson's
equation is written as [34]
r2 =
e
�(ne � ni) (9)
where is the potential (E = �r ). The electron and ion continuity equations are repre-
sented by
r � Je = nennkion � �rnine (10)
and
r � Ji = nennkion � �rnine (11)
8

respectively. The momentum balance equations for electrons and ions are given by
Je = �ne�eE�Derne (12)
and
Ji = ni�iE�Dirni (13)
respectively [35]. The �rst and second terms on the right hand sides of Eqs. (12) and (13)
represent particle drift due to the applied electric �eld and the di�usive term due to the
particle concentration gradient. The electron energy balance equation is given by
r � qe = eJe �E� nenn(�ionkion + �extkext + �diskdis)
�2me
mn
�3
2kBTe �
3
2kBTn
��mne
�3
2kBTe�rnine (14)
with the total electron energy ux given by
qe =5
2kBTeJe �
�5
2kBDene
�rTe: (15)
The �rst term in Eq. (15) is the kinetic energy and the second term is the thermal energy. In
the above equations, ne and ni are the electron and ion densities, respectively; Je and Ji are
the electron and ion uxes, respectively; Te is the electron temperature; and qe is the electron
energy ux. For the partially-ionized and partially-dissociated H2 plasma discharge processes
simulated in this study, the major particle interactions are electron-H2 gas inelastic collisions,
electron-H2 gas elastic collisions and electron-hydrogen ion recombination. The electron-H2
inelastic collisions include H2 gas ionization, excitation and dissociation processes. The rate
coe�cients for these collision processes are expressed using an Arrhenius relationship [35] as
9

kj = Ajexp(��j=kBTe), where kj is the inelastic rate constant and j = ion, ext, and dis, for
the three processes of ionization, excitation, and dissociation. The threshold energy for each
collision process is �j and Aj is the pre-exponential factor. The types of inelastic collisions
in a H2 discharge and their corresponding rate parameters are summarized in Table I. The
reactions that are used here have been used previously to simulate a H2 discharge [8, 34].
In Eqs. (10), (11), and (14), �r is the recombination rate constant. The elastic losses are
represented by the electron-neutral momentum transfer frequency, �m, which is assumed to
be equal to the e�ective electron-neutral momentum transfer frequency (�e�), and mn is the
neutral species mass. The quantities De;i and �e;i are the electron and ion di�usivities and
mobilities, respectively.
The boundaries for the uid plasma simulation are the substrate and the edge of the
plasma volume. In this work, a set of experimentally-determined empirical equations devel-
oped by King [36] is used to determine the neutral temperature and plasma volume based on
the pressure and the input microwave power. The empirical equations were formulated based
on statistically-designed experimental data obtained by discharge diagnostics in a parameter
space including microwave power and reactor pressure. The empirical equations used for the
translational temperature of H2 gas and the discharge volume are [36]
Tn = 226:6 + 374:3Pabs + 16:5Pr � 94:2 (16)
and
V = 449:7 + 116:2Pabs � 18:1Pr + 57:1P 2abs + 0:25P 2
r � 5:4PrPabs � 15:4; (17)
where the units for Tn, Pabs, and Pr are K, kW, and Torr respectively.
The boundary conditions for the uid plasma model at the substrate and the edge of the
10

plasma volume are
ne = ni = 0;
Te = Tn;
= 0; (18)
and at the centerline r = 0,
@ne@r
=@ni@r
=@Te@r
=@
@r= 0: (19)
Inside the plasma discharge volume region, the translational temperature given by Eq. (16)
is equal to the neutral temperature [8].
Solution Method
Finite di�erence techniques are used to discretize the cylindrical coordinates form of
Eqns. (9){(15). Newton's method is used to solve the nonlinear, discretized equations,
to obtain the electron temperature (Te), electron density (ne), ion density (ni), and plasma
potential ( ). Note that the heating term, eJe�E in Eq. (14), represents the microwave power
absorbed by the plasma, which is determined from the FDTD electromagnetic �eld model.
First, the electromagnetic �elds are computed using the FDTD model with an assumed
electron density distribution. The power absorbed by the plasma (Pabs) is then obtained
from the FDTD model. The time domain used for the FDTD model is twenty microwave
cycles because the total stored electromagnetic energy in the plasma reaches a steady state
at this time. A steady state is reached because the input power from the source points equals
the power absorbed by the plasma. Then, the approximate solutions for the electron (ne)
and ion densities (ni), along with the Pabs �eld are input to the electron energy balance, Eq.
(14), to determine the electron temperature (Te). Next, the calculated electron temperature
11

is input to the coupled Poisson Eq. (9), electron continuity Eq. (10), and ion continuity
Eq. (11) equations, which are solved using Newton's method. From these equations, the
unknowns computed at each grid point are the electron and ion densities (ne, ni), and plasma
potential ( ). The electron and ion uxes are then determined from Eqs. (12) and (13) using
the known electron and ion densities and the plasma potential. The calculated electron and
ion densities and plasma potential are fed back to the electron energy balance equation. The
converged discharge characteristics information is then transferred back to the FDTD model
to modify the plasma conductivity and calculate a new power absorption. The �nal stable
solution of electron density and temperature is achieved by iteratively solving the continuity,
Poisson, electron energy balance and Maxwell equations.
Results and Discussion
Eight simulations were performed to examine the e�ects of power absorption by the
plasma and reactor pressure on the plasma discharge characteristics. The input conditions
for microwave power (400, 600, and 900 W) and pressure (15, 25, and 40 Torr) used in this
study are the operating conditions used in our reactor to grow diamond �lms. The results are
categorized into two areas based on the variation of absorbed power and system pressure in
di�erent runs. In each run, the plasma volume is computed using Eq. (17) and the substrate
temperature is �xed at 1200 K. In this study, it is assumed that 100% of the microwave
power coupled into the reactor is absorbed by the plasma.
E�ect of Power Absorption
Four runs|I, II, III, and IV|were performed at the same reactor pressure (15 Torr),
but for di�erent absorbed power by the plasma, 30, 400, 600, and 900 W, respectively. Run
parameters for each simulation are given in Table II.
12

The electric �eld and power absorption patterns are compared for the lowest (30 W,
Run I) and highest (900 W, Run IV) power absorption by the plasma at a constant reactor
pressure of 15 Torr. The simulation results for the electric �eld distribution in the entire
reactor are shown in Figs. 3(a), and 3(b) for the radial component Er and axial component
Ez of the 30 W (Run I) case; and Figs. 4(a) and 4(b) correspond to the Er and Ez �eld
components of Run IV, 900 W. The e�ect of the electric �eld caused by the presence of the
discharge may be observed in Figs. 5(a), 5(b), 6(a), and 6(b). The plasma discharge reduces
the amplitude of the electric �eld in the plasma discharge region for runs I (30 W) and IV
(900 W), since electromagnetic power is absorbed in the discharge region. The electric �eld
patterns, i.e., Er and Ez inside the plasma discharge region are shown in Figs. 5(a) and 5(b)
for Run I (30 W) and 6(a) and 6(b) for Run IV (900 W) respectively. It may be seen that
the Ez and the Er �elds do not simply decay into the discharge but are concentrated close to
the plasma discharge center in the plasma simulation region. This behavior arises because
the discharge has a �nite size and the plasma density is not uniform. Therefore, the electric
�eld propagates into the plasma simulation region and is concentrated within the region
close to the center axis of the reactor without being blocked by the discharge. Figs. 7(a) and
7(b) illustrate the power absorption pattern for runs I (30 W) and IV (900 W) respectively.
Fig. 7(a) indicates that the microwave power absorbed by the plasma is distributed fairly
uniformly in the plasma region compared to Fig. 7(b) where most of the microwave power is
absorbed primarily at the plasma boundaries, and not throughout the entire plasma volume.
The predicted electron temperatures are shown in Figs. 8(a) and 8(b) for Runs I and
IV. The electron temperature is fairly uniform for Run I (30 W), as shown in Fig. 8(a)
although the electron temperature is highest at the plasma boundaries for Run IV (900 W)
as illustrated in Figs. 8(b). The corresponding results for electron density are shown in
Figs. 9(a) and 9(b). The plasma density is high at the center of the discharge and at some
13

points in the plasma boundary for Run I (30 W), as shown in Fig. 9(a); however, the plasma
density is concentrated more at the plasma boundaries for Run IV (900 W) as shown in Fig.
9(b). The spatial variation of dissociation of H2 is shown in Fig. 10 for Run II (400 W) and
indicates that the dissociation rate is higher at the plasma boundaries due to the electron
temperature and electron density being higher at that region.
The average electron temperature and maximum electron temperature in the plasma
region are plotted versus power for di�erent pressures in Figs. 11(a) and 11(b) to com-
pare the e�ect of absorbed plasma power on electron temperature. Similarly, the average
plasma density and maximum electron density in the plasma region are plotted versus power
for di�erent pressures in Figs. 12(a) and 12(b). The electron temperature increases with
higher absorbed power (refer to Figs. 11(a) and 11(b)) because the measured neutral gas
temperature increases with microwave power, as indicated by Eq. (16). The higher neutral
gas temperature leads to a lower neutral density and, hence, to a reduced electron-neutral
collision rate (which is an electron energy loss mechanism) at a given electron temperature.
The plasma density increases with an increase in the absorbed microwave power at a given
reactor pressure (see Figs. 12(a) and 12(b)) because the electron temperature increases with
power. The higher electron temperature leads to a higher ionization rate, producing more
electrons. It should be noted that the recombination rate of the electrons remains una�ected
by the electron temperature (see Table I). The increase in the predicted average electron
temperature with absorbed power agrees with published results [8].
The absorbed microwave power and the plasma density are concentrated at the plasma
boundaries and not throughout the entire plasma volume at a higher absorbed power (greater
than 30 W) (see Figs. 7(b) and 9(b)) because at higher absorbed power, the plasma density
increases. The increase in plasma density leads to an increase in the plasma conductivity
14

(see Eq. 4), which reduces the magnitude of the electric �eld exponentially with penetra-
tion into the plasma discharge region [37, 38] as the microwave skin depth decreases. The
microwave skin depth (�) is de�ned as the distance from the conductor surface (in this case,
the plasma discharge surface) at which the magnitude of the electric �elds have decreased
to 1/`n�1(1) (approximately 37%) of their values at the conductor surface. The microwave
skin depth is � = c=!p, where c is the speed of light and !p is the plasma frequency, given
by !p = (neq2=me�)
1=2. The concentration of electric �elds at the plasma boundaries at
higher absorbed power leads to a concentration of absorbed microwave power and plasma
density in that region. Such a phenomenon for the absorption of power at the plasma edges
at high plasma density has been predicted by Tan and Grotjohn [39] and is also discussed
in detail in the literature [37, 38]. Gicquel [40] reported an upper bound of 1018 m�3 for
the plasma density above which the microwave energy would not be able to penetrate the
plasma e�ciently.
In the present study, a plasma density of 1018 m�3 is attained for absorbed plasma power
greater than 30 W at 15 Torr pressure. This agrees with the experimental and modeling
results reported by Kelkar et al. [41] in an argon plasma in a similar microwave reactor.
Kelkar et al. [41] report an electron density of 1018 m�3 for an absorbed plasma power of
16.5 W at 5 Torr pressure. Interestingly, Kelkar et al. indicate that only 2%-5% (10-35 W)
of the input power (680 W) coupled into their reactor is deposited in the plasma. It is
speculated that the power coupling e�ciency in the reactor system used in this study could
be less than 100%, thereby in e�ect depositing less power in the plasma than is input into the
reactor (i.e., 400 W, 600 W, and 900 W). Work is underway to measure the electric �elds to
determine the power absorbed in the plasma. In another similar study of a low pressure (10-
100 mTorr) rf argon discharge, Kortshagen et al. [42] found that their numerically predicted
electron number density exceeded those measured experimentally by around a factor of 4.
15

It is indicated that their assumption of 100% power absorption by the plasma may be the
reason. Mak and Asmussen [43] also found that the Langmuir probe measurements of the
electron number density in an argon plasma 3 cm downstream of the bulk plasma were
a factor of 2-4 lower than those predicted from their simple global reactor model (for an
input power of 277 W, 1-7 mTorr). It was argued that electron recombination between the
bulk plasma and the downstream probe location would account for some of this discrepancy
although it is suspected that the remaining discrepancy may be a result of a power coupling
e�ciency less than 100%.
E�ect of Pressure
Three runs|II, V, VI were performed at the same absorbed microwave power (400 W)
but at reactor pressures of 15, 25, and 40 Torr; runs IV, VII, and VIII were performed at
the same absorbed microwave power of 900 W at pressures of 15, 25, and 40 Torr. The
predicted average and maximum electron temperatures in the plasma are shown in Figs.
11(a) and 11(b). The electron temperature drops with increase in pressure because neutral
density increases with pressure, as does the collision frequency between electrons and neu-
trals. Therefore, electrons more easily transfer their energy to neutral particles and reduce
their kinetic energy. The simulation results of plasma density are shown in Figs. 12(a)
and 12(b) for all the runs performed in this study. The average plasma density increases
with increasing pressure since the neutral density increases linearly with increase in pressure
leading to an increase in ionization rate producing more electrons and ions. However, the
maximum predicted plasma density at pressures of 25 and 40 Torr are similar because the
decrease in the ionization rate due to lower electron temperature at higher pressure is o�-
set by the increase in ionization rate due to the higher neutral density at higher pressures.
The predicted variation of average electron temperature and plasma density with pressure
16

agree well with published experimental [44] and plasma modeling [45] studies although these
studies were carried out at very low pressures (1-7 mTorr).
Summary
A self-consistent electromagnetic �eld model and a uid plasma model is presented for
a microwave plasma reactor operating under conditions characteristic of diamond chemical
vapor deposition. The electromagnetic �eld model solved by the FDTD method is coupled
to a uid plasma model. The uid plasma model is solved by the Newton-Raphson method.
A microwave plasma reactor loaded with a H2 discharge is simulated using this numerical
model. The input parameters for the microwave plasma reactor simulation include the
reactor pressure and absorbed microwave power. It is assumed in this study that 100% of
the microwave power input into the reactor is absorbed by the plasma. The electromagnetic
behavior of the discharge, including the electric �eld distributions and power absorption
patterns, were studied for di�erent input conditions. The characteristics of the plasma
discharge (the electron temperature, plasma density, and ionization rate of H2) were predicted
for di�erent input conditions.
It is found that, for constant absorbed microwave power, the electron temperature de-
creases with an increase in pressure, while the plasma density increases. At constant pressure
it is found that both the electron temperature and plasma density increase with absorbed
microwave power. At higher absorbed microwave power for constant reactor pressure, the
electric �elds, absorbed power, and plasma density are concentrated at the plasma bound-
aries instead of being distributed throughout the entire plasma volume because the microwave
skin depth decreases with increasing microwave power. In this study, the plasma density and
absorbed power are concentrated at the plasma boundaries for an absorbed plasma power
17

greater than only 30 W at a reactor pressure of 15 Torr. It is therefore speculated that less
than 100% of the power coupled into the reactor is deposited in the plasma. Work is in
progress to conduct probe measurements of the electric �eld in our reactor to determine the
power absorbed by the plasma.
Future studies would involve coupling the plasma model with a hydrodynamic model to
simulate the ow, temperature, and concentration of hydrocarbon species in the microwave
plasma diamond CVD reactor. Towards this end, the predicted electron elastic energy loss
will be coupled to the energy equation in the hydrodynamic model to compute the increase
in temperature of the gas due to momentum transfer between the electrons and the gas.
The plasma density and electron temperature predicted by the plasma model will be used
to compute the gas-phase reaction rates of electron-neutral and electron-ion reactions which
a�ect the concentration and gas-to-substrate ux of various hydrocarbon ions and radicals
(such as H, CH3, etc.) responsible for diamond growth. The ux of the reactive species will
be utilized in a microscopic scale Monte Carlo model to simulate diamond �lm growth and
develop an understanding between the process-microstructure-property relationship during
diamond CVD.
References
1. K. E. Spear, and M. Frenklach, Synthetic Diamond: Emerging CVD Science and
Technology, eds. K. E. Spear, and J. P. Dismukes (John Wiley & Sons, Inc.,
1994).
2. H. Liu and D. S. Dandy, Diamond Chemical Vapor Deposition: Nucleation and
Early Growth Stages (Noyes Publications, Park Ridge, New Jersey, 1995).
3. D. M. Bhusari, J. R. Yang, and L. C. Chen, Solid State Comm.; an international
18

journal 107, 301 (1998).
4. Y.-H. Chen, C.-T. Hu, and I.-N Lin, Appl. Surf. Sci. 113/114, 231 (1997).
5. M. A. Khan, M. S. Haque, and A. P. Malshe, Thin Solid Films 332, 93 (1998).
6. E. Hyman, K. Tsang, and A. Drobot, J. Vacuum Sci. Technol. A 12, 1474 (1994).
7. C. R. Koemtzopoulos, D. J. Economou, and R. Pollard, Diam. Rel. Mater. 2, 25
(1993).
8. W. Tan and T. A. Grotjohn, Diam. Rel. Mater. 4, 1145 (1995).
9. E. Hyman, K. Tsang, I. Lottati, A. Drobot, B. Lane, R. Post, and H. Sawin, Surf.
Coatings Technol. 49, 387 (1991).
10. Y. A. Mankelevich, A. T. Rakhimov, N. V. Suetin, S. V. Kostiuk, Diam. Related
Mater. 5, 964 (1996).
11. Y. A. Mankelevich, A. T. Rakhimov, N. V. Suetin, Diam. Related Mater. 5, 888
(1996).
12. M. Capitelli, G. Colonna, K. Hassouni, and A. Gicquel, Plasma Chem. Plasma
Proc. 16, 153 (1994).
13. K. Hassouni, S. Farhat, C. D. Scott, and A. Gicquel, J. de Physique III 6, 1229
(1996).
14. K. Hassouni, O. Leroy, S. Farhat, and A. Gicquel, Plasma Chem. Plasma Proc.
18, 325 (1998).
15. M. Funer, C. Wild, P. Koidl, Surf. Coatings Technol. 74-75, 221 (1995).
16. J. Asmussen, J. Vac. Sci. Technol. A 7, 883 (1989).
17. K. S. Yee, IEEE Trans. Antennas Propagat. 14, 302 (1966).
19

18. A. Ta ove and K. R. Umashankar, Electromagnetics 10, 105 (1990).
19. A. Ta ove and M. E. Brodwin, IEEE Trans. Microwave Theory Tech. 23, 623
(1975).
20. G. Mur, IEEE Trans. Electromagn. Compat. 23, 377 (1981).
21. T. A. Grotjohn, W. Tan, V. Gopinath, A. K. Srivatsava, and J. Asmussen, Rev.
Sci. Instrum. 65, 1312 (1994).
22. R. F. Harrington, Time-Harmonic Electromagnetic Fields (McGraw-Hill, 1961).
23. M. J. Kushner, J. Appl. Phys. 54, 4958 (1983).
24. B. E. Thompson and H. Sawin, J. Appl. Phys. 63, 2241 (1988).
25. J. I. Ulacia and J. P. McVittie, J. Appl. Phys. 65, 1484 (1989).
26. G. R. Govinda Raja and M. S. Dincer, IEEE Trans. Plasma Sci. 18, 819 (1990).
27. T. E. Sheridan, M. J. Goeckner, and J. Goree, Vac. Sci. Technol. A 8, 30 (1990).
28. D. B. Graves and K. F. Jensen, IEEE Trans. Plasma Sci. 14, 78 (1986).
29. D. B. Graves, J. Appl. Phys. 62, 88 (1987).
30. J. P. Boeuf, Phys. Rev. A 36, 2782 (1987).
31. Y. Weng and M. J. Kushner, J. Appl. Phys. 72, 33 (1992).
32. A. Ta ove, Computational Electrodynamics: A Finite-Di�erence Time-Domain
Method (Artech House, Boston, 1995).
33. B. E. Cherrington, Gaseous Electronics and Gas Lasers (Pergamon, New York,
1979).
34. M. Surendra, D. B. Graves, and L. S. Plano, J. Appl. Phys. 71, 5189 (1992).
35. J. D. P. Passchier and W. J. Goeheer, J. Appl. Phys. 74, 3744 (1993).
20

36. G. King, Ph.D. Dissertation (Michigan State University, 1994).
37. S. Ramo, J. R. Whinnery, and T. Van Duzer, Fields and Waves in Communication
Electronics (Wiley, New York, 1984).
38. Handbook of Plasma Processing Technology (Noyes Publications, Park Ridge,
New Jersey, 1990), Ch. 3.
39. W. Tan and T. A. Grotjohn, J. Vac. Sci. Technol. A 12, 1216 (1994).
40. A. Gicquel, in Handbbok of Industrial Diamonds and Diamond Films edited by
M. Prelas, G. Popovici, and L. K. Bigelow (Marcel Dekker, New York, 1997), Ch.
13, pp. 590.
41. U. M. Kelkar, M. H. Gordon, L. A. Roe, and Y. Li, J. Vac. Sci. Technol. A 17,
125 (1999).
42. U. Kortshagen, I. Puropski, and L. D. Tsendin, Phys. Rev. E 51, 6063 (1995).
43. P. Mak and J. Asmussen, J. Vac. Sci. Technol. A 15, 154 (1997).
44. S. M. Gorbatkin, L. A. Berry, and J. B. Roberto, J. Vac. Sci. Technol. A 8, 2893
(1990).
45. M. Meyyappan and T. R. Govindan, J. Appl. Phys. 78, 6432 (1995).
21

Table I: H2 reaction rates [8]
Reaction Expression Threshold energy Pre-exponential factor(m3s�1)
Ionization e + H2 ! e + H+2 + e 15.4 eV 1.0 � 10�14
H+2 + H2 ! H+
3 + H 0 eV H+3 is the dominant
speciesExcitation e + H2 ! H�
2 + e 12 eV 6.5 � 10�15
Dissociation e + H2 ! e + H + H 10 eV 1.0 � 10�14
Recombination e + ion ! neutral 0 eV 1.0 � 10�14
Table II: Physical parameters for simulation
Run Reactor pressure Absorbed power Plasma volume Plasma radius Plasma height(Torr) (W) (cm3) (cm) (cm)
I 15 30 219.6 4.20 4.00II 15 400 243.07 3.87 5.16III 15 600 261.53 4 5.2IV 15 900 297.78 4.15 5.5V 25 400 110.08 2.97 3.97VI 25 900 167.38 3.32 5.0VII 40 400 80.32 2.68 3.56VIII 40 900 66.73 2.44 3.61
22

Figure Captions
1. Schematic of the microwave plasma reactor used for diamond �lm deposition. The
reactor has a 6 inch inner diameter.
2. Schematic of the grid used in the numerical solution of the electromagnetic and
uid plasma models.
3. (a) Radial electric �eld Er(V/m) distribution in the entire reactor for a pressure
of 15 Torr and absorbed microwave power of 30 W.
3. (b) Axial electric �eld Ez(V/m) distribution in the entire reactor for a pressure
of 15 Torr and absorbed microwave power of 30 W.
4. (a) Radial electric �eld Er(V/m) distribution in the entire reactor for a pressure
of 15 Torr and absorbed microwave power of 900 W.
4. (b) Axial electric �eld Ez(V/m) distribution in the entire reactor for a pressure
of 15 Torr and absorbed microwave power of 900 W.
5. (a) Radial electric �eld Er(V/m) distribution in the plasma discharge region for
a pressure of 15 Torr and absorbed microwave power of 30 W.
5. (b) Axial electric �eld Ez(V/m) distribution in the plasma discharge region for
a pressure of 15 Torr and absorbed microwave power of 30 W.
6. (a) Radial electric �eld Er(V/m) distribution in the plasma discharge region for
a pressure of 15 Torr and absorbed microwave power of 900 W.
6. (b) Axial electric Ez(V/m) �eld distribution in the plasma discharge region for
a pressure of 15 Torr and absorbed microwave power of 900 W.
7. (a) Absorbed microwave power distribution in the plasma discharge for a pressure
of 15 Torr and absorbed microwave power of 30 W.
23

7. (b) Absorbed microwave power distribution in the plasma discharge for a pressure
of 15 Torr and absorbed microwave power of 900 W.
8. (a) Electron temperature (K) distribution for a pressure of 15 Torr and absorbed
microwave power of 30 W.
8. (b) Electron temperature (K) distribution for a pressure of 15 Torr and absorbed
microwave power of 900 W.
9. (a) Electron density distribution for a pressure of 15 Torr and absorbed microwave
power of 30 W.
9. (b) Electron density distribution for a pressure of 15 Torr and absorbed microwave
power of 900 W.
10. H2 dissociation rate (m�3s�1) in the plasma discharge for a pressure of 15 Torr
and absorbed microwave power of 400 W.
11. (a) Average electron temperature versus absorbed plasma power for three di�erent
reactor pressures of 15, 25, and 40 Torr.
11. (b) Maximum calculated electron temperature versus absorbed plasma power for
three di�erent reactor pressures of 15, 25, and 40 Torr.
12. (a) Average electron density versus absorbed plasma power for three di�erent
reactor pressures of 15, 25 and 40 Torr.
12. (b) Maximum computed electron density versus absorbed plasma power for three
reactor pressures of 15, 25, and 40 Torr.
24

Figure 1
25

Figure 2
26

Figure 3a
27

Figure 3b
28

Figure 4a
29

Figure 4b
30

Figure 5a
31

Figure 5b
32

Figure 6a
33

Figure 6b
34

Figure 7a
35

Figure 7b
36
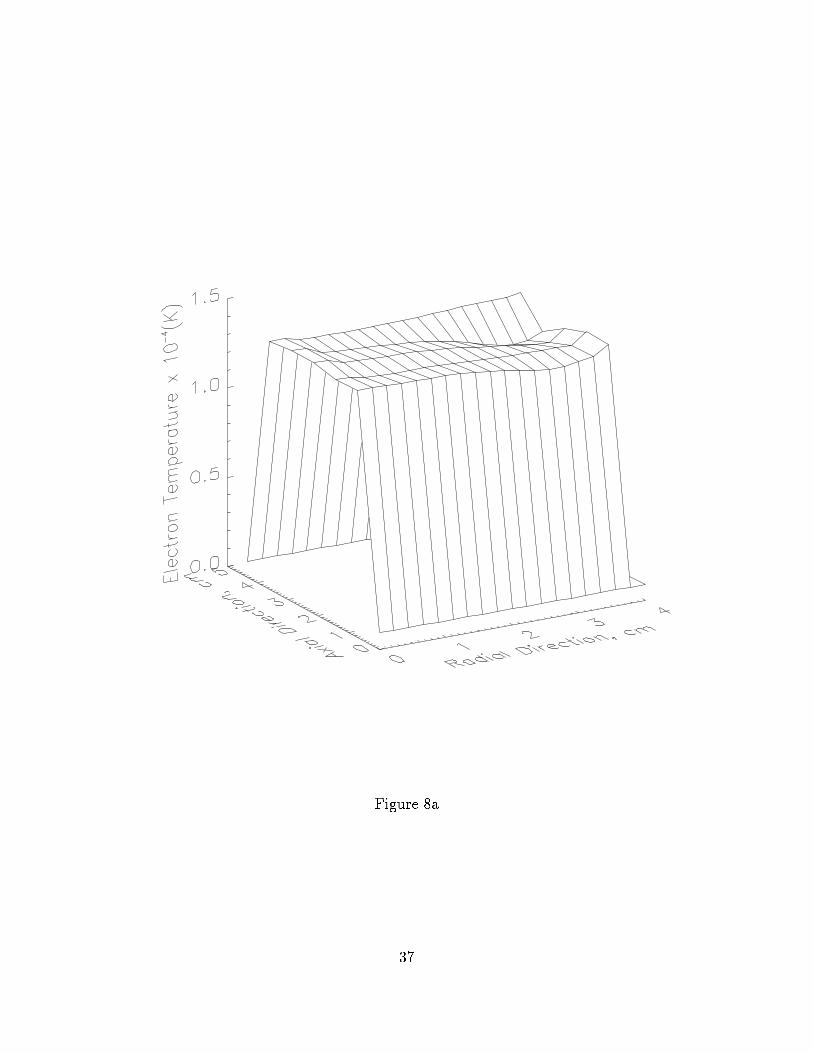
Figure 8a
37
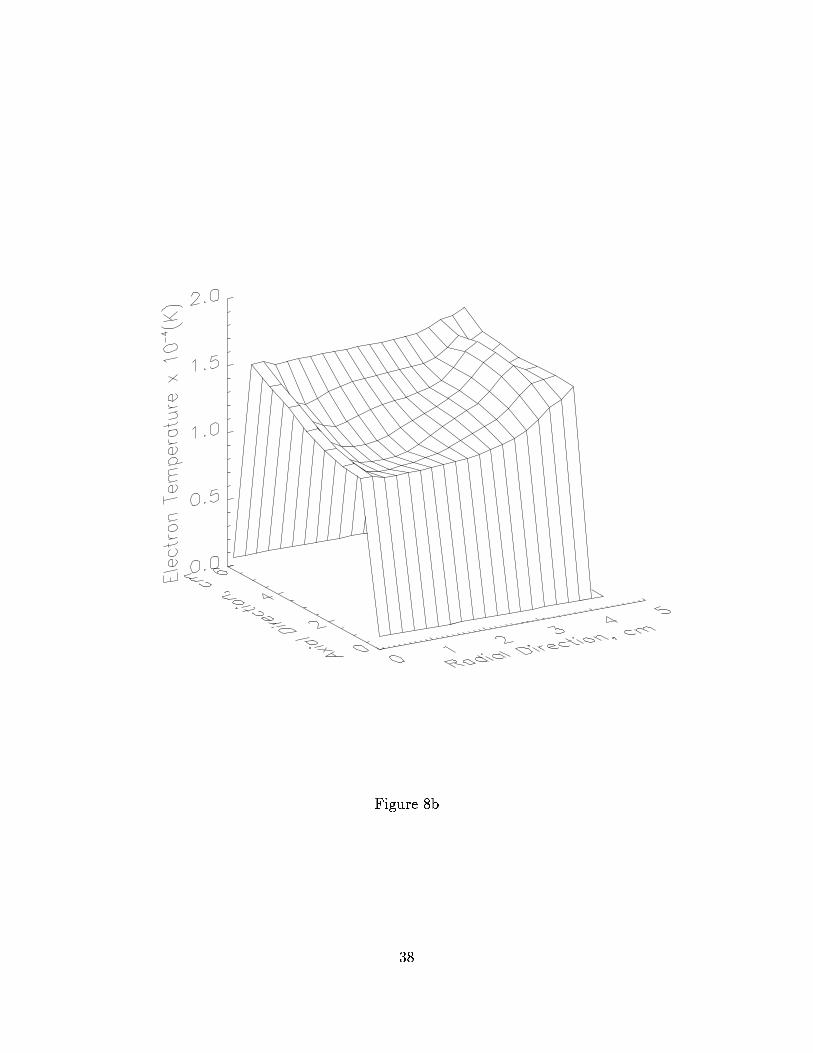
Figure 8b
38

Figure 9a
39

Figure 9b
40

Figure 10
41

0 200 400 600 800 1000Absorbed plasma power (W)
10500
10750
11000
11250
11500
11750
12000
12250
12500
Ave
rage
ele
ctro
n te
mpe
ratu
re (
K)
15 Torr
25 Torr
40 Torr
Figure 11a
42

0 200 400 600 800 1000Absorbed plasma power (W)
14000
14500
15000
15500
16000
16500
17000
17500
18000
Max
imum
ele
ctro
n te
mpe
ratu
re in
pla
sma
(K)
40 Torr
15 Torr
25 Torr
Figure 11b
43

0 100 200 300 400 500 600 700 800 900 1000Absorbed plasma power (W)
0
0.5
1
1.5
2
2.5
3
Ave
rage
ele
ctro
n de
nsity
x 1
0−18
(m
−3 )
40 Torr
25 Torr
15 Torr
Figure 12a
44

0 200 400 600 800 1000Absorbed plasma power (W)
0
1
2
3
4
5
6
7
8
9
10
Max
imum
ele
ctro
n de
nsity
in p
lasm
a x
10−
18 (
m−
3 )
15 Torr
25 Torr
40 Torr
Figure 12b
45


![EZ harge V2...EZ-harge V2 Multi-hannel Remote F ompliance This device complies with Part í ñ of the FCC Rules. Operation is subject to the following two conditions [] This device](https://img.pdfslide.us/doc/110x75/5f3bef0dbd0fed3a3d2ee5e8/ez-harge-v2-ez-harge-v2-multi-hannel-remote-f-ompliance-this-device-complies.jpg)