Embed Size (px)
Citation preview
Plant of the day!
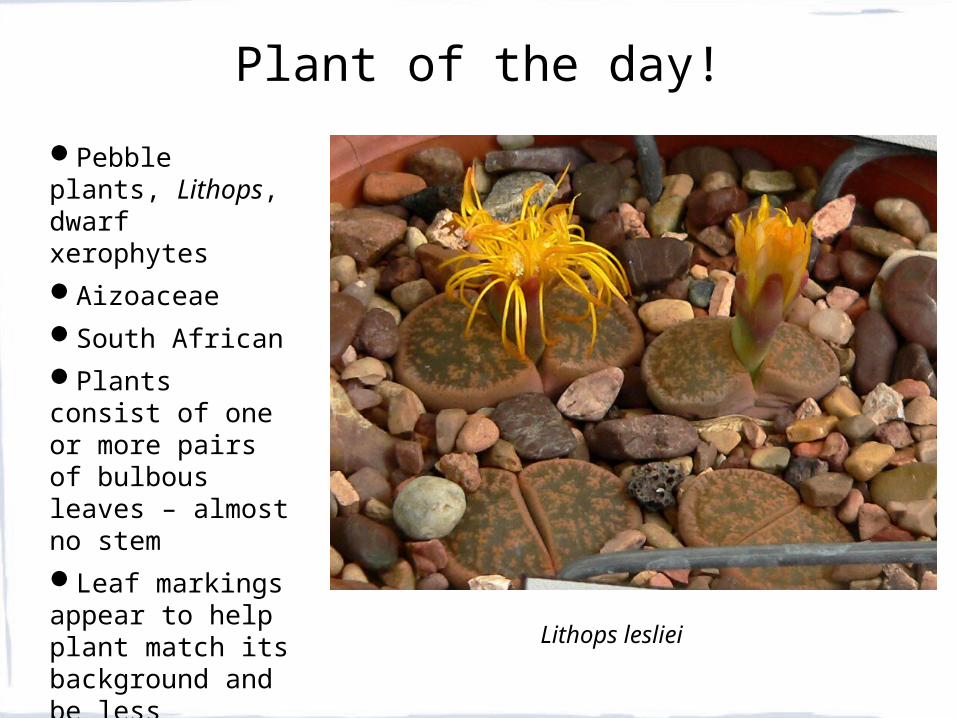
Pebble plants, Lithops, dwarf xerophytes AizoaceaeSouth AfricanPlants consist of one or more pairs of bulbous leaves – almost no stemLeaf markings appear to help plant match its background and be less vulnerable to herbivory Lithops lesliei
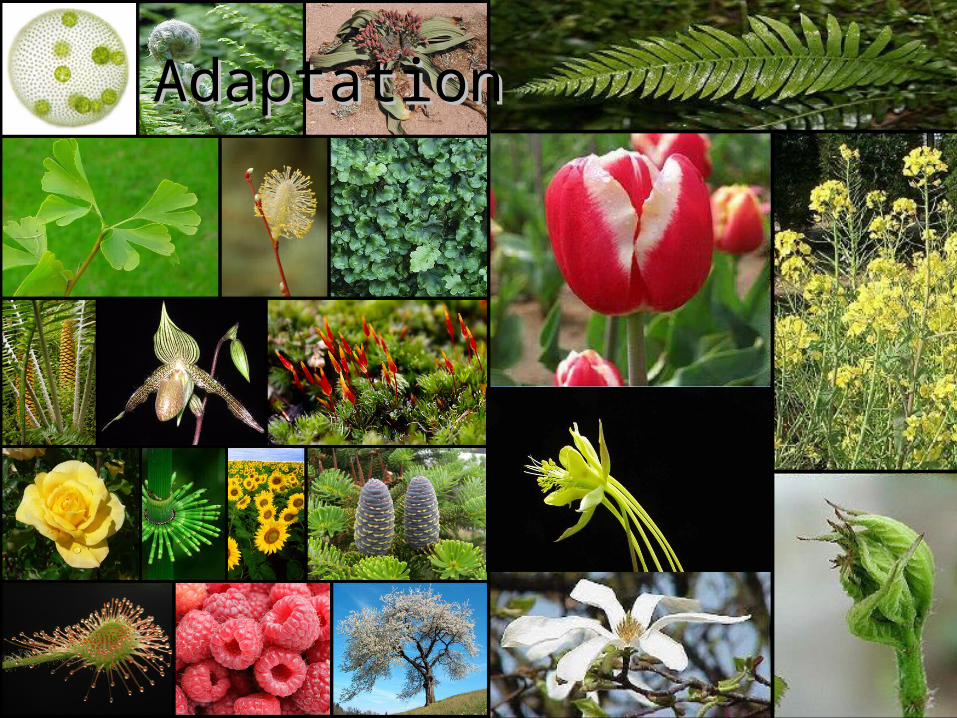
AdaptationAdaptation
Goals
• Understand some top down and bottom up approaches used to identify genes responsible for adaptations
• Explain patterns of sequence variation expected with positive and balancing selection
• Understand the principles of population genetic tests of selection

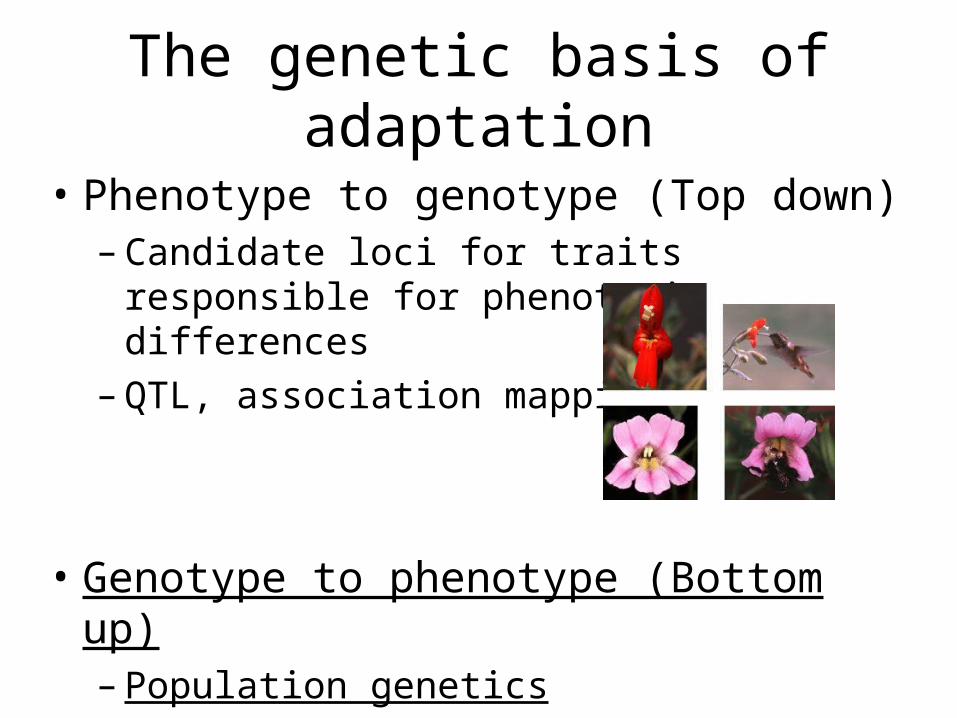
The genetic basis of adaptation
• Phenotype to genotype (Top down)– Candidate loci for traits responsible for
phenotypic differences– QTL, association mapping
• Genotype to phenotype (Bottom up)– Population genetics
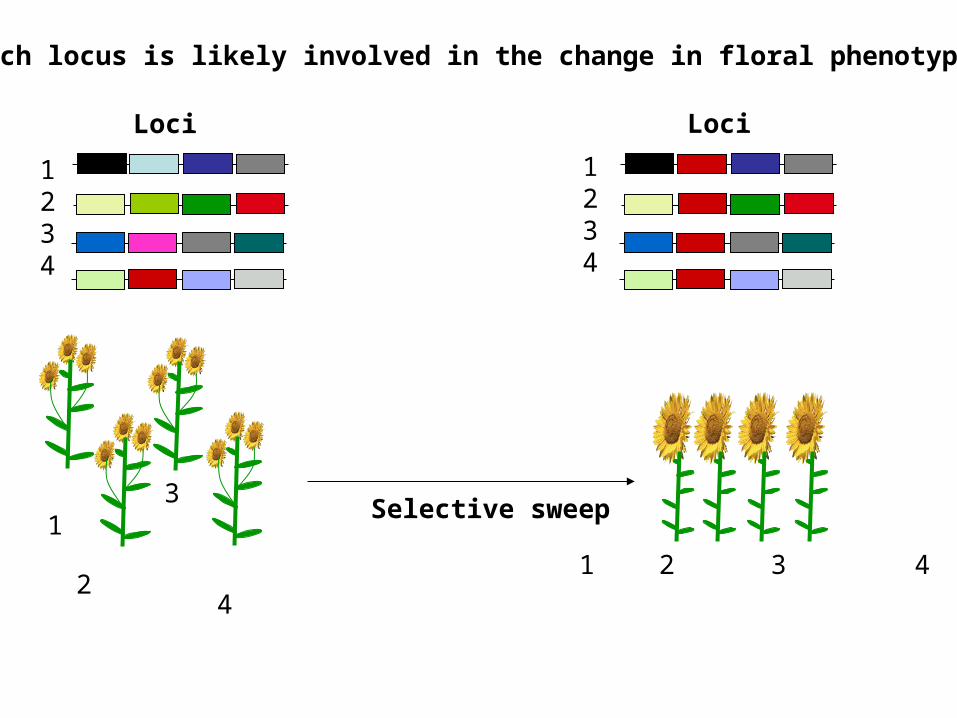
Selective sweep
Which locus is likely involved in the change in floral phenotype?
2
1234
1234
1 2 3 4
Loci Loci
1 3
4
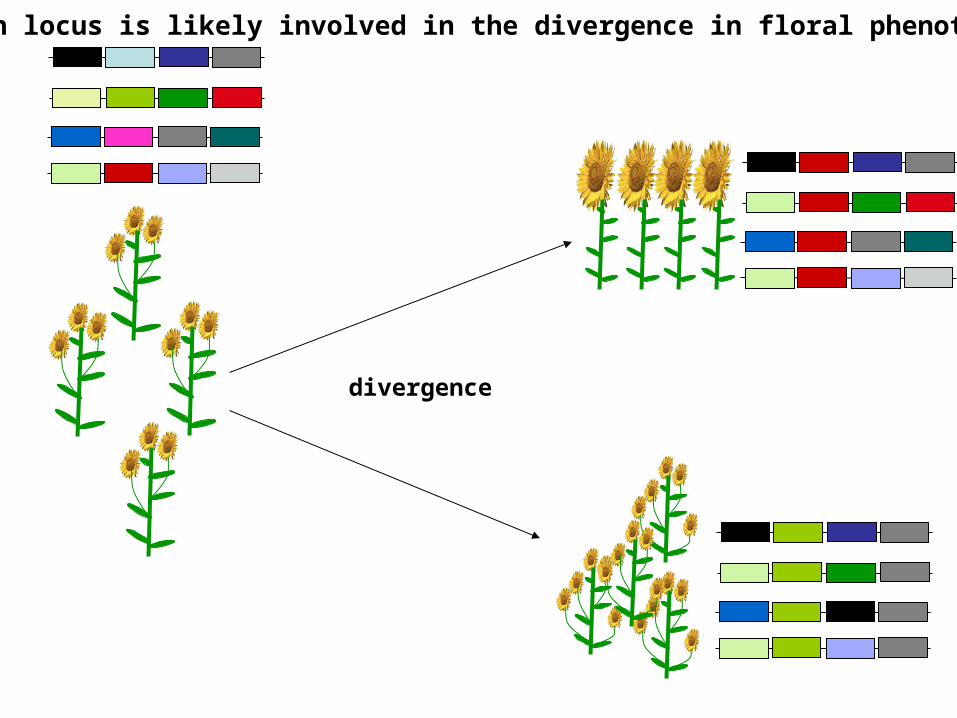
divergence
Which locus is likely involved in the divergence in floral phenotype?
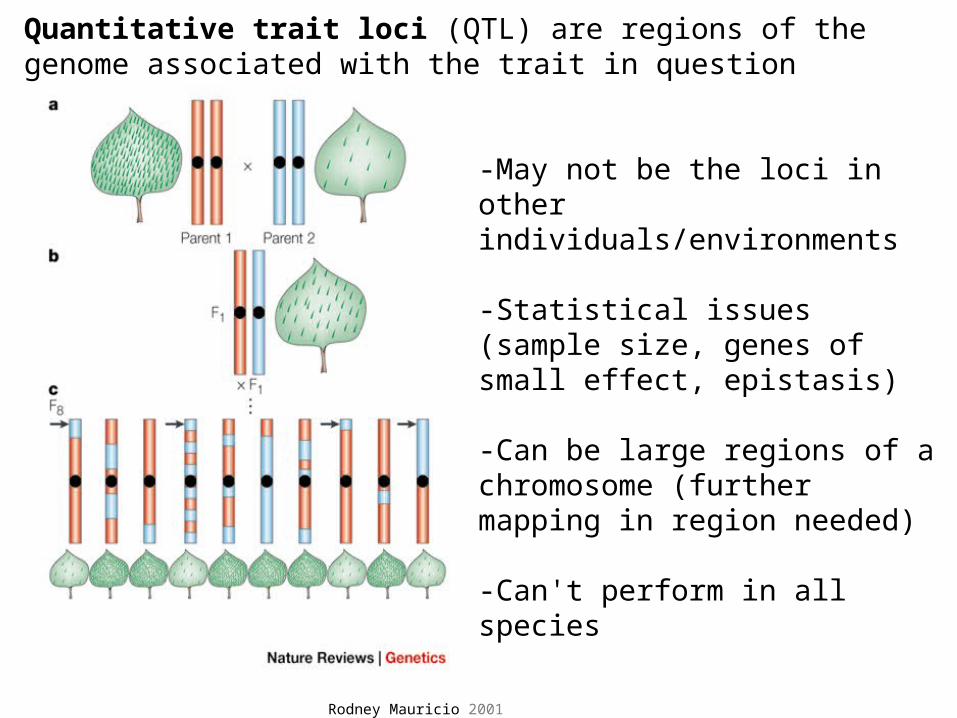
Quantitative trait loci (QTL) are regions of the genome associated with the trait in question
Rodney Mauricio 2001
-May not be the loci in other individuals/environments
-Statistical issues (sample size, genes of small effect, epistasis)
-Can be large regions of a chromosome (further mapping in region needed)
-Can't perform in all species
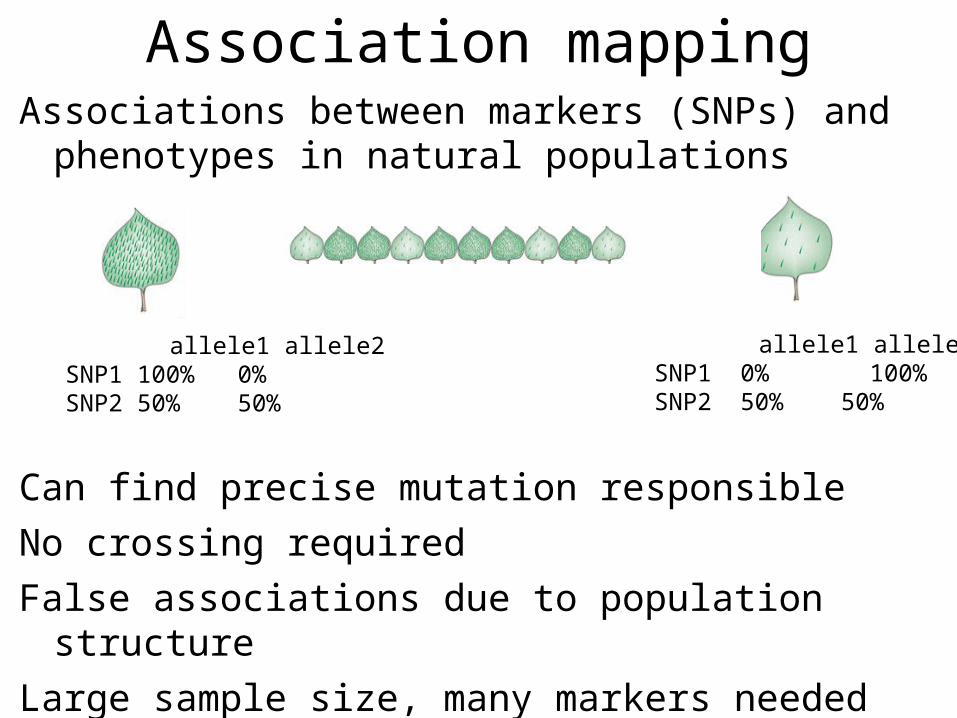
Association mappingAssociations between markers (SNPs) and phenotypes
in natural populations
Can find precise mutation responsible
No crossing required
False associations due to population structure
Large sample size, many markers needed (if no candidate loci)
allele1 allele2SNP1 100% 0%SNP2 50% 50%
allele1 allele2SNP1 0% 100%SNP2 50% 50%
The genetic basis of adaptation
• Phenotype to genotype (Top down)– Candidate loci for traits responsible for
phenotypic differences– QTL, association mapping
• Genotype to phenotype (Bottom up)– Population genetics
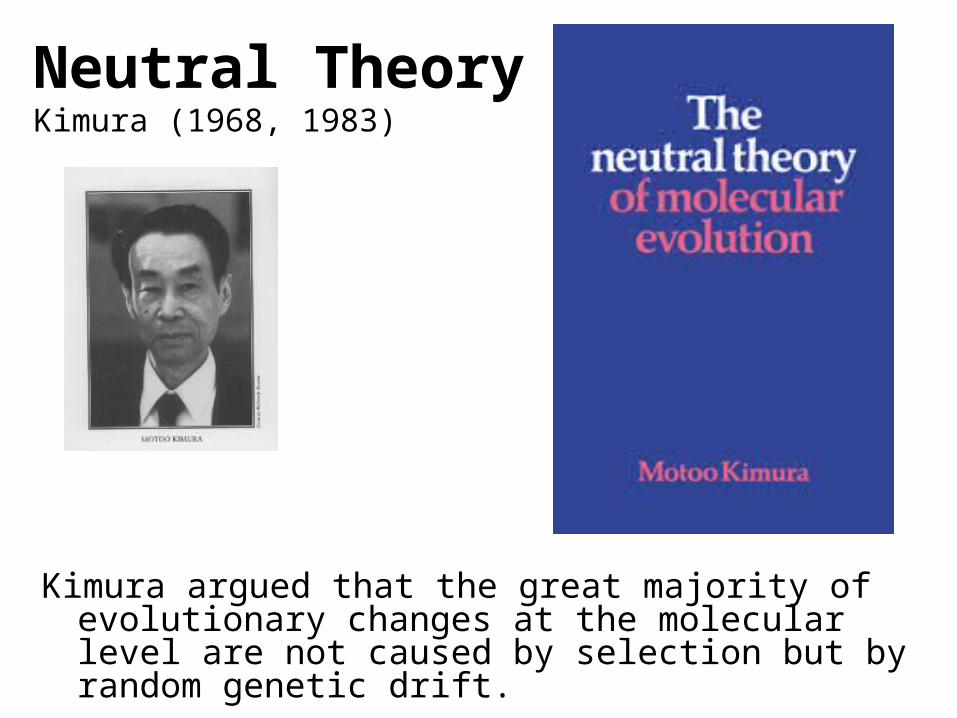
Neutral TheoryKimura (1968, 1983)
Kimura argued that the great majority of evolutionary changes at the molecular level are not caused by selection but by random genetic drift.
Motoo Kimura (1924-1994)Ph.D. University of Wisconsin in 1956Under James Crow
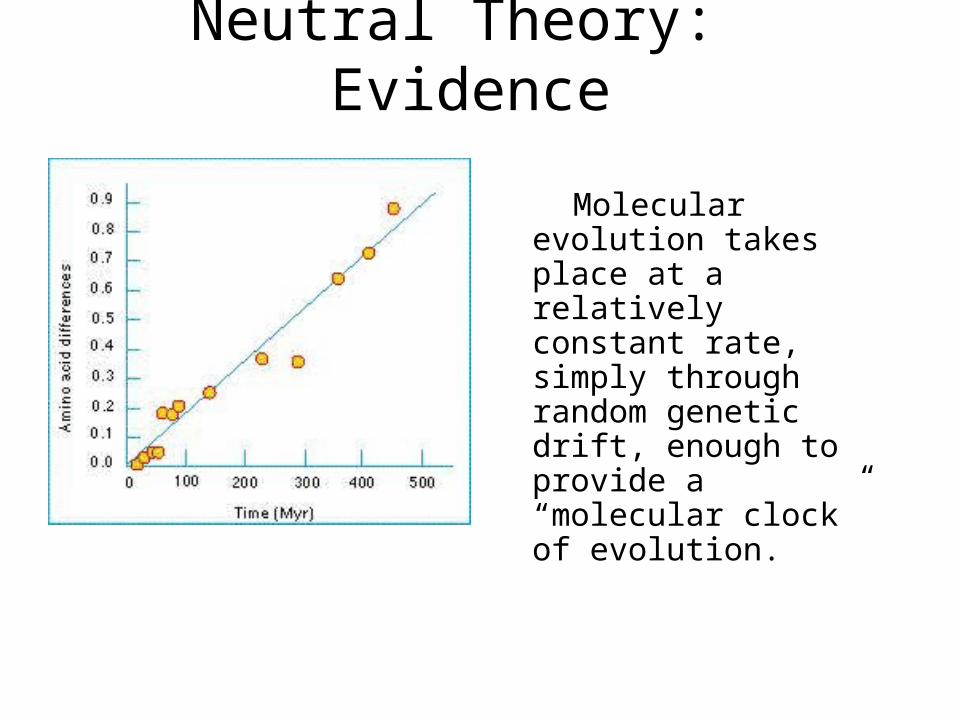
Neutral Theory: Evidence
Molecular evolution takes place at a relatively constant rate, simply through random genetic drift, enough to provide a “molecular clock” of evolution.

Selection-Neutral Debate
• Kimura’s work spawned a heated debate on the relative importance of neutral evolution (genetic drift) versus genetic variation that is a result of natural selection.
Neutral Theory
• Now considered the “null model” against which evidence for selection should be tested

Detecting Natural SelectionThere are many statistical tests for detecting Natural selection
The approach is to test for deviations from a null neutral model (where genetic variation arises only from genetic drift)
Null hypothesis: Neutral, no selection
Deviation from Neutral: selection
Inferences regarding selection provide a powerful tool for the prediction of genes underlying traits of ecological or economic value
The effects of selection on the genome
Directional selection– Best allele(s) sweep to fixation– Loss of variation– Change in frequency distribution of
polymorphisms– Increase in linkage disequilibrium around the site
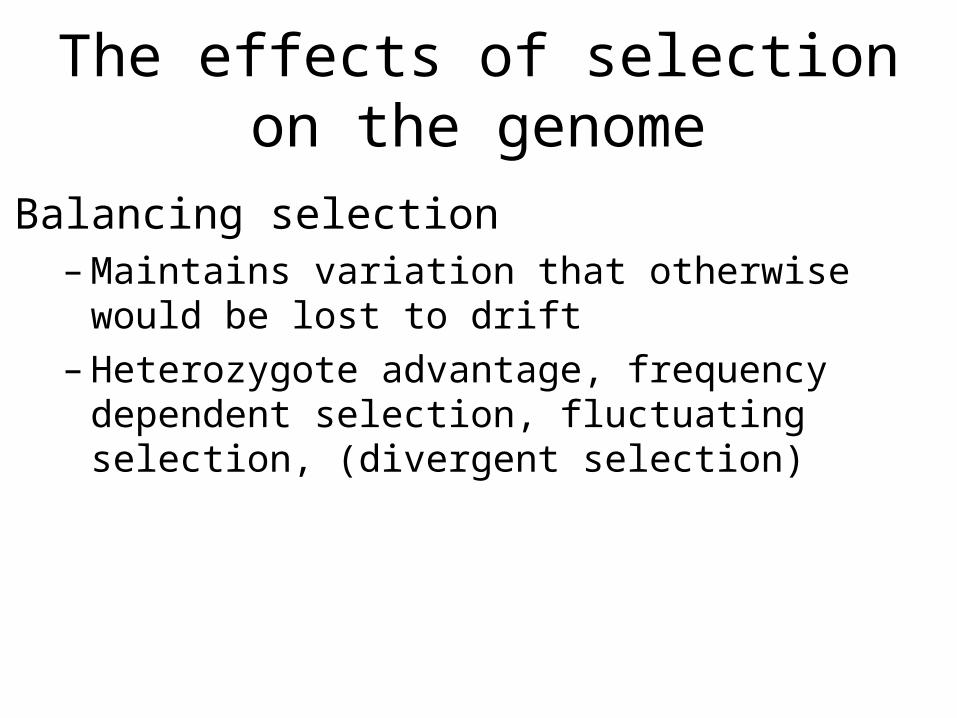
The effects of selection on the genome
Balancing selection– Maintains variation that otherwise would be lost to
drift– Heterozygote advantage, frequency dependent
selection, fluctuating selection, (divergent selection)
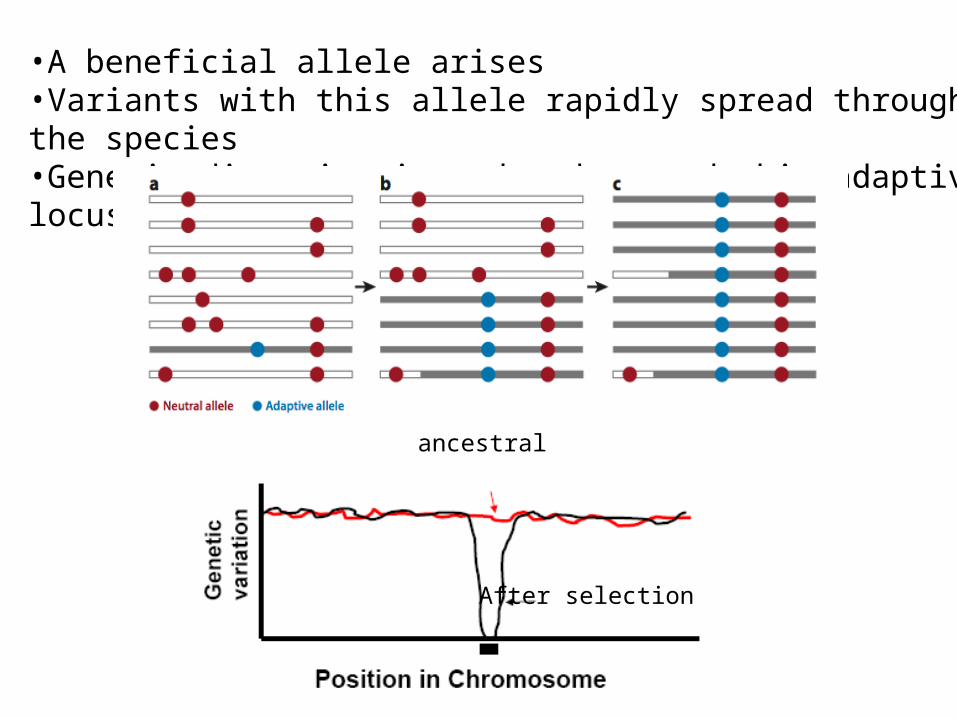
•A beneficial allele arises•Variants with this allele rapidly spread through the species•Genetic diversity is reduced around this adaptive locus
ancestral
After selection
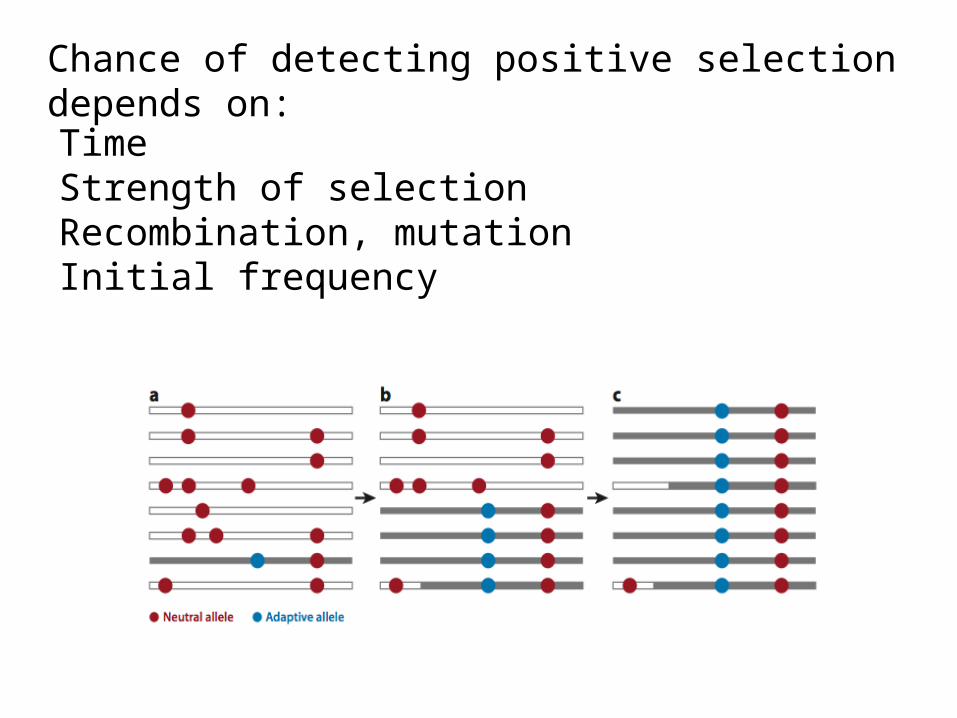
TimeStrength of selectionRecombination, mutationInitial frequency
Chance of detecting positive selection depends on:
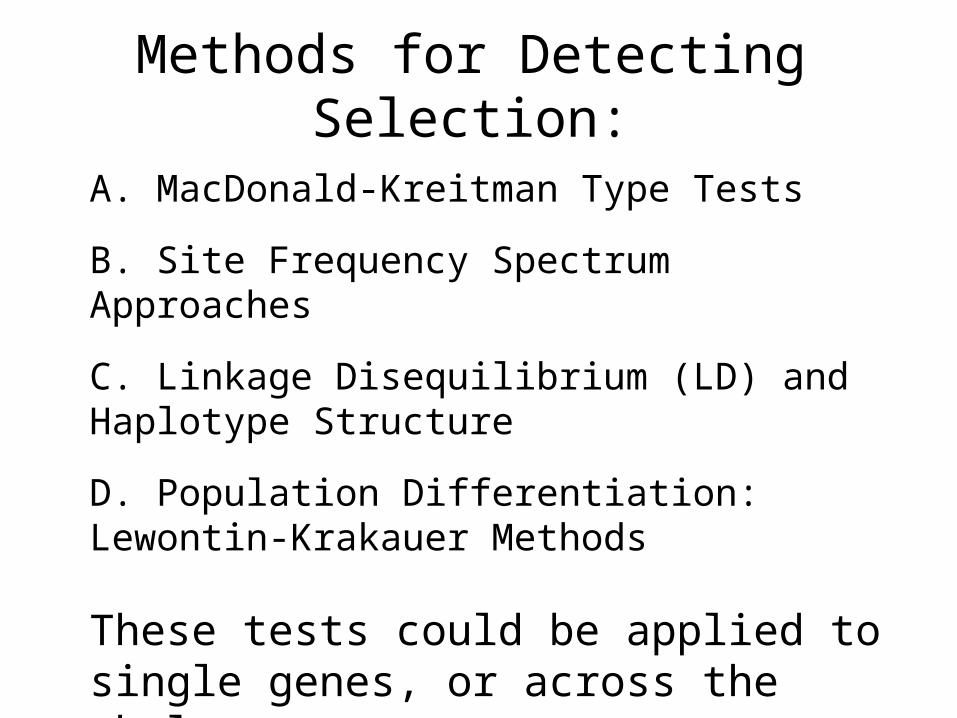
Methods for Detecting Selection:
A. MacDonald-Kreitman Type Tests
B. Site Frequency Spectrum Approaches
C. Linkage Disequilibrium (LD) and Haplotype Structure
D. Population Differentiation: Lewontin-Krakauer Methods
These tests could be applied to single genes, or across the whole genome.
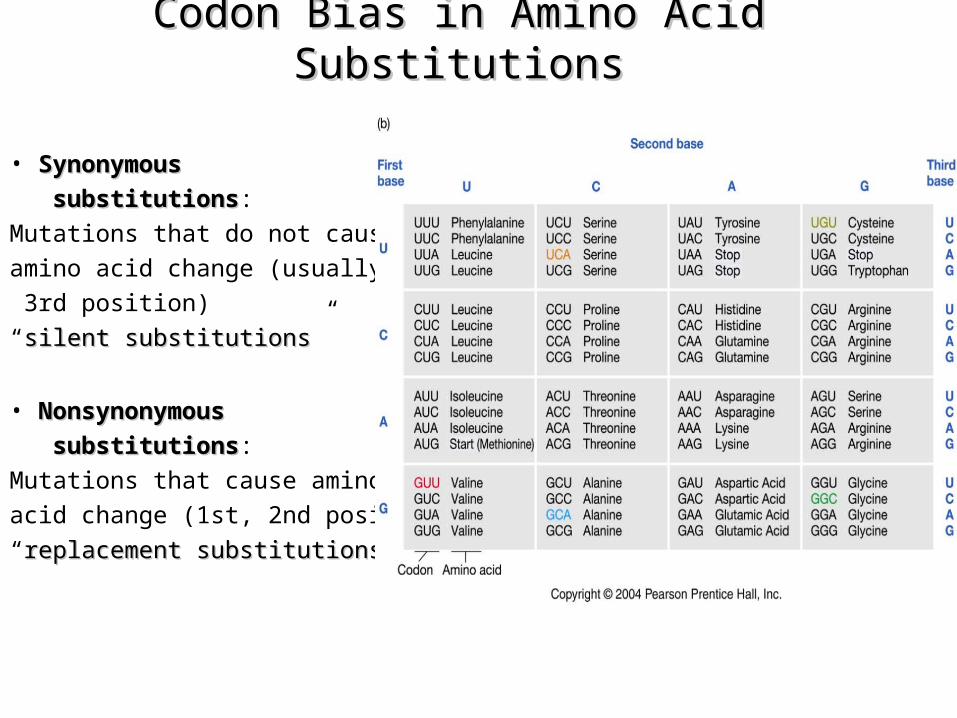
Codon Bias in Amino Acid SubstitutionsCodon Bias in Amino Acid Substitutions
QuickTime™ and aPhoto - JPEG decompressor
are needed to see this picture.
• Synonymous Synonymous
substitutionssubstitutions: Mutations that do not cause amino acid change (usually 3rd position)“silent substitutionssilent substitutions”
• NonsynonymousNonsynonymous
substitutionssubstitutions: Mutations that cause amino acid change (1st, 2nd position)“replacement substitutionsreplacement substitutions”
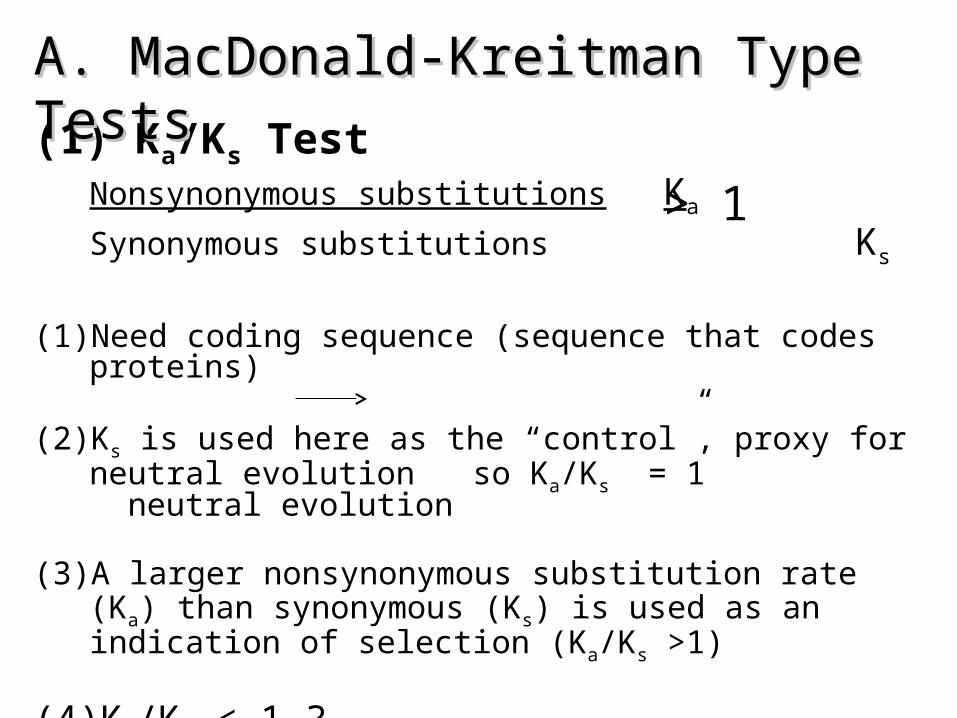
(1) Ka/Ks TestNonsynonymous substitutions Ka
Synonymous substitutions Ks
(1) Need coding sequence (sequence that codes proteins)
(2) Ks is used here as the “control”, proxy for neutral evolution so Ka/Ks = 1 neutral evolution
(3) A larger nonsynonymous substitution rate (Ka) than synonymous (Ks) is used as an indication of selection (Ka/Ks >1)
(4) Ka/Ks < 1 ?
> 1
A. MacDonald-Kreitman Type TestsA. MacDonald-Kreitman Type Tests
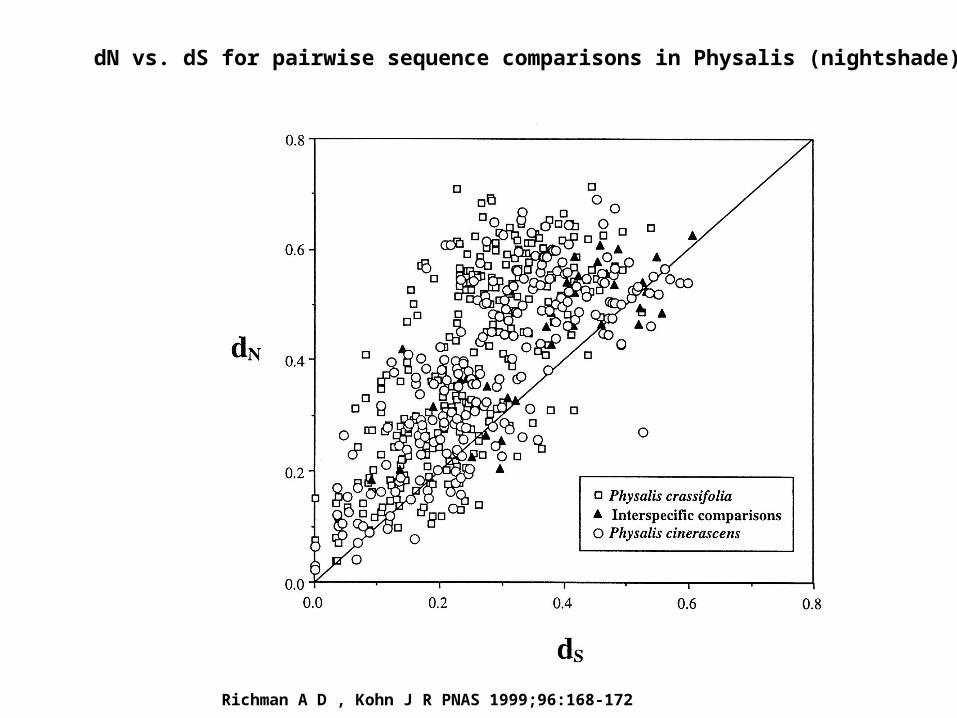
dN vs. dS for pairwise sequence comparisons in Physalis (nightshade)
Richman A D , Kohn J R PNAS 1999;96:168-172
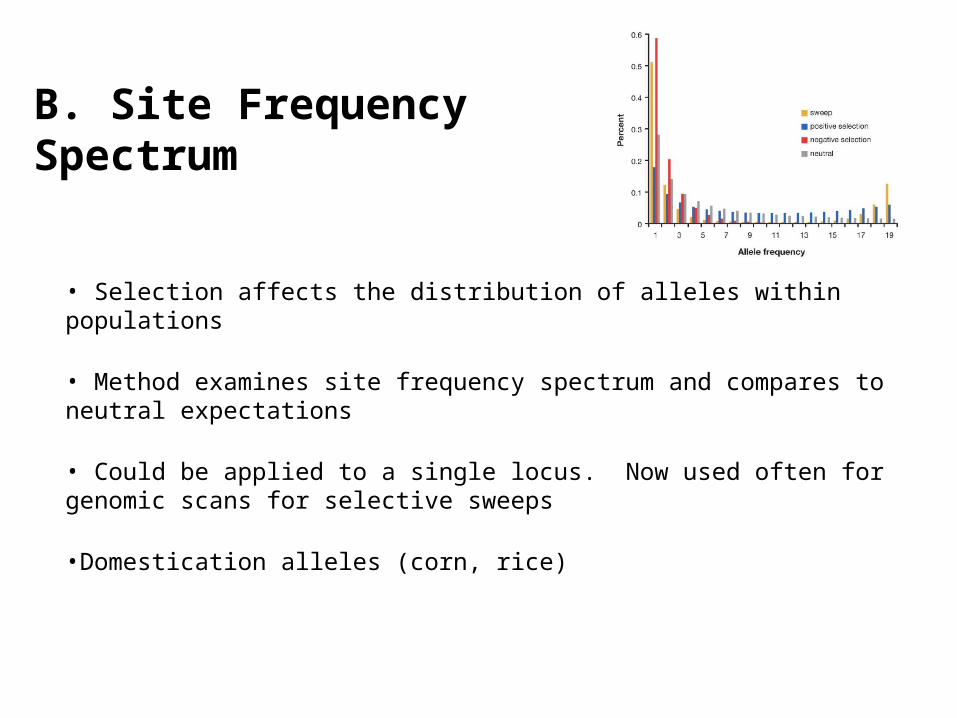
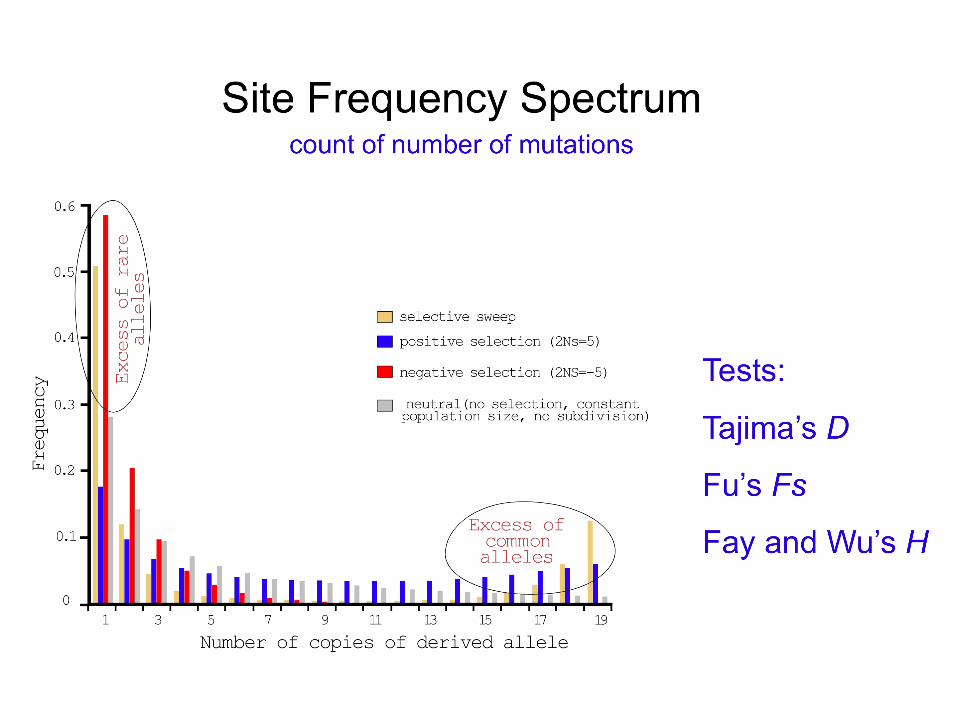
B. Site Frequency Spectrum
• Selection affects the distribution of alleles within populations
• Method examines site frequency spectrum and compares to neutral expectations
• Could be applied to a single locus. Now used often for genomic scans for selective sweeps
•Domestication alleles (corn, rice)
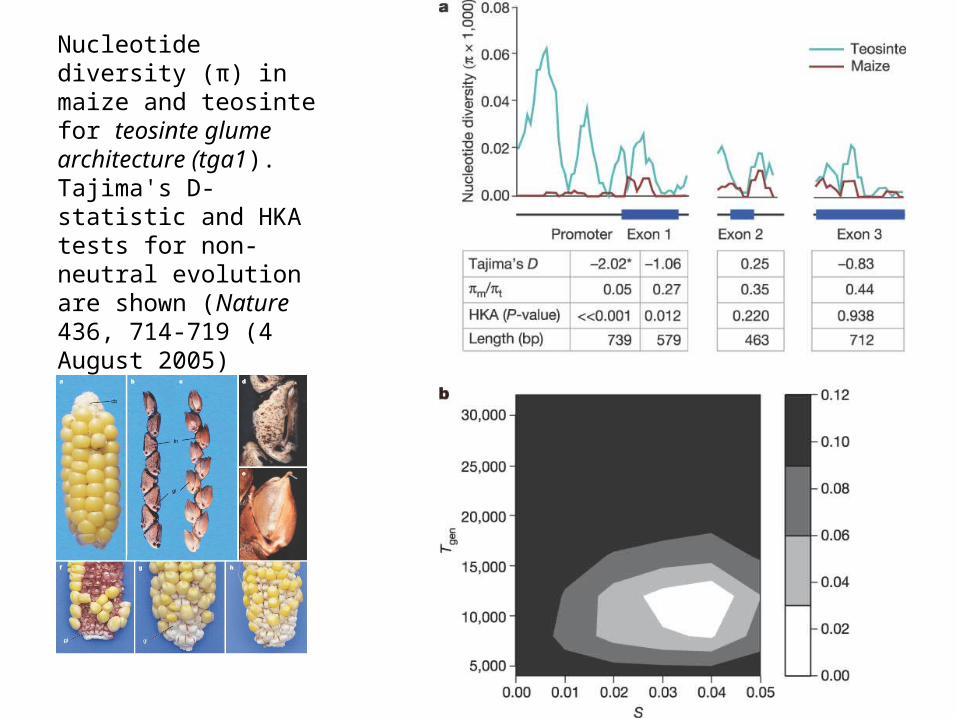
Nucleotide diversity (π) in maize and teosinte for teosinte glume architecture (tga1). Tajima's D-statistic and HKA tests for non-neutral evolution are shown (Nature 436, 714-719 (4 August 2005)
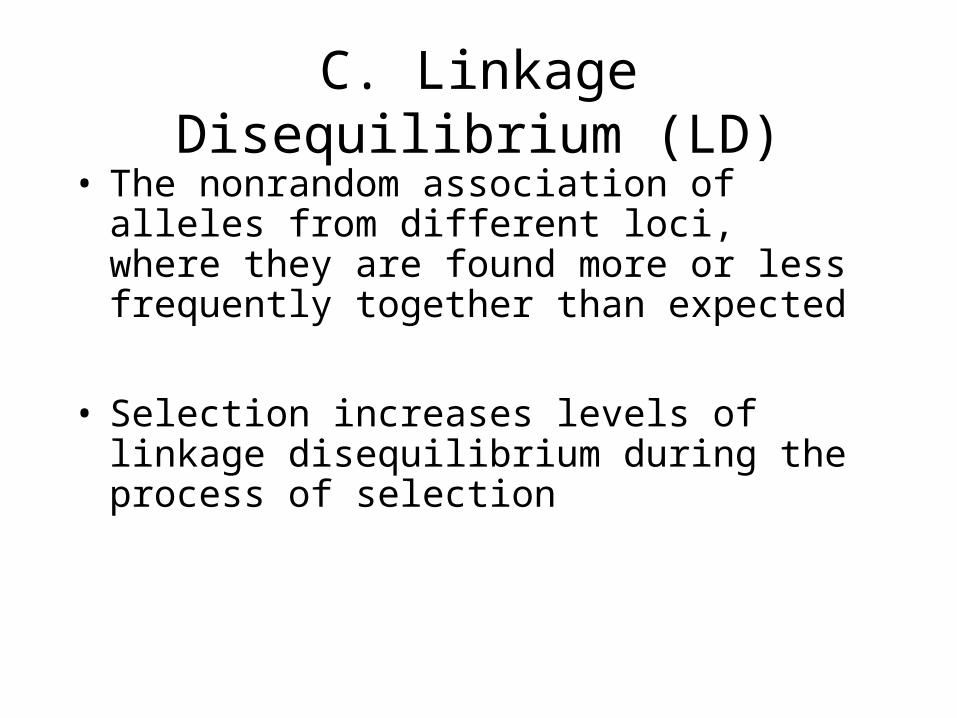
C. Linkage Disequilibrium (LD)• The nonrandom association of alleles from
different loci, where they are found more or less frequently together than expected
• Selection increases levels of linkage disequilibrium during the process of selection
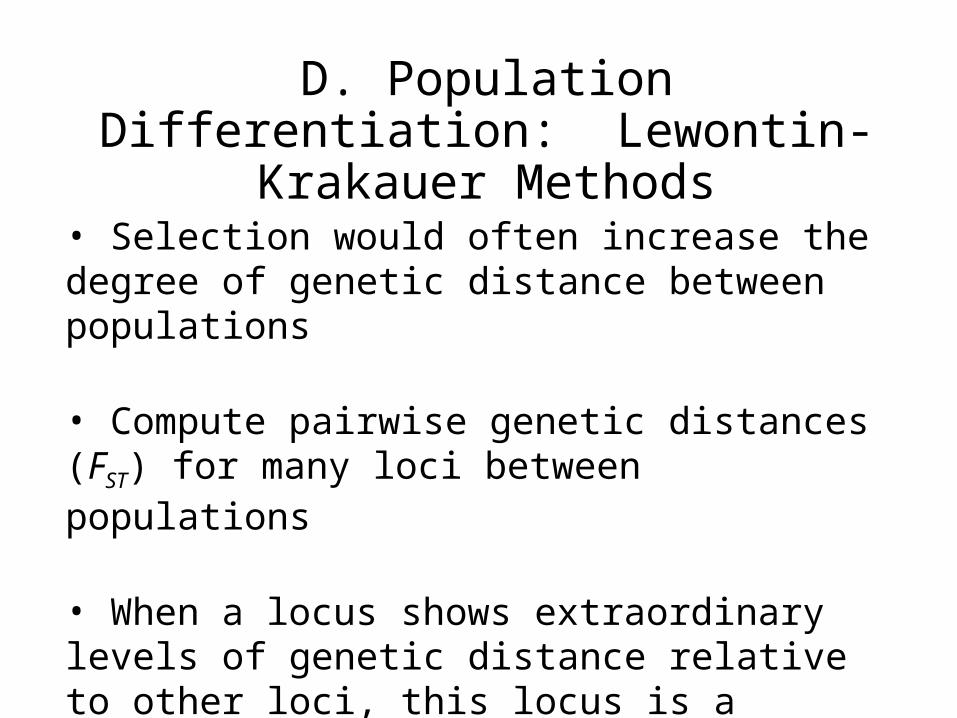
D. Population Differentiation: Lewontin-Krakauer Methods
• Selection would often increase the degree of genetic distance between populations
• Compute pairwise genetic distances (FST) for many loci between populations
• When a locus shows extraordinary levels of genetic distance relative to other loci, this locus is a candidate for positive selection
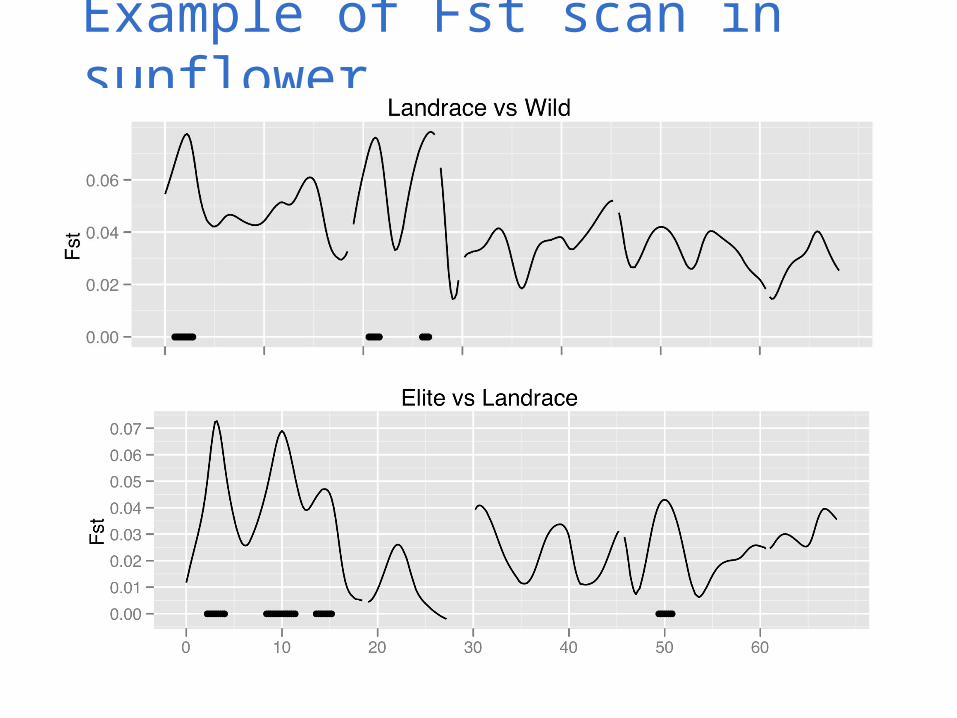
Example of Fst scan in sunflower
cM