Embed Size (px)
Citation preview
Planning Urban Ring Rail Transit Lines: A Case Study of
Shanghai, China
Saeid Saidi
1 , MSc
PhD. Candidate
E-mail: [email protected]
Corresponding author
Yuxiong Ji2, PhD
Associate Professor
Email: [email protected]
Cheng Cheng2
PhD. Candidate
Email: [email protected]
Jinping Guan2
PhD. Candidate
Email: [email protected]
Shengchuan Jiang2
PhD. Candidate
Email: [email protected]
Lina Kattan1, PhD, PEng
Associate Professor
E-mail: [email protected]
Yuchuan Du2, PhD
Professor
Email: [email protected]
S.C. Wirasinghe1, PhD, PEng
Professor
E-mail: [email protected]
1 Department of Civil Engineering, University of Calgary, Calgary, AB T2N 1N4, Canada
2 School of Transportation Engineering, Tongji University, Shanghai, 201804, China
Reviewing Committee: AP065 - Rail Transit Systems
In response to the call for a paper on Rail Transit Congestion Monitoring and Management
Transportation Research Board’s 95th Annual Meeting, Washington DC, USA
2
TRB 2016 Annual Meeting Paper revised from original submittal.
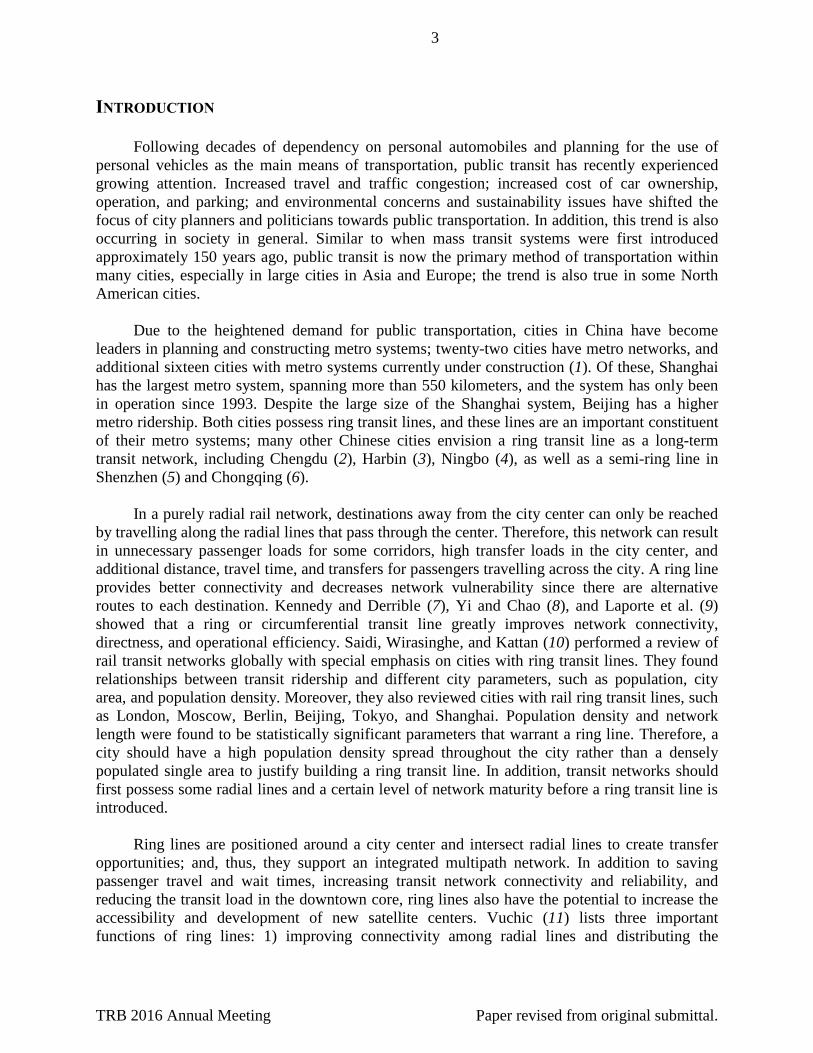
ABSTRACT
Shanghai has the largest metro system in the world with a network length of more than 550
kilometers. Both Shanghai and Beijing are in the top five cities in terms of ridership, and some of
the most important components of their metro systems are the ring transit lines. Many other
cities, in China and elsewhere, also envision a ring transit line for their future rail transit
networks. Using a previously developed analytical model for the long-range planning of ring
transit lines, we compare the current alignment of the Shanghai ring line with the optimized
model output, and recommend a potential second ring transit line for the future Shanghai
network. Our findings suggest that the alignment of an existing ring line will impact the optimal
alignment of the second ring line. In addition, if an outer ring line exists (or is planned to be
constructed), the optimal location of the inner ring line may change. Furthermore, a sensitivity
analysis was conducted to test the impact of changes on demand, value of time, and passenger
ride cost on the second ring line. Zones that obtain the greatest benefit from introducing the
second ring line were also determined. While we present a case study of Shanghai ring lines; the
outcomes provide useful information for cities that are considering the expansion of their transit
network with a first or second ring line. Unlike simulations and agent-based models, our model
is easily transferable to any transit network.
Keywords: ring transit line; circumferential transit line; Shanghai
3
TRB 2016 Annual Meeting Paper revised from original submittal.
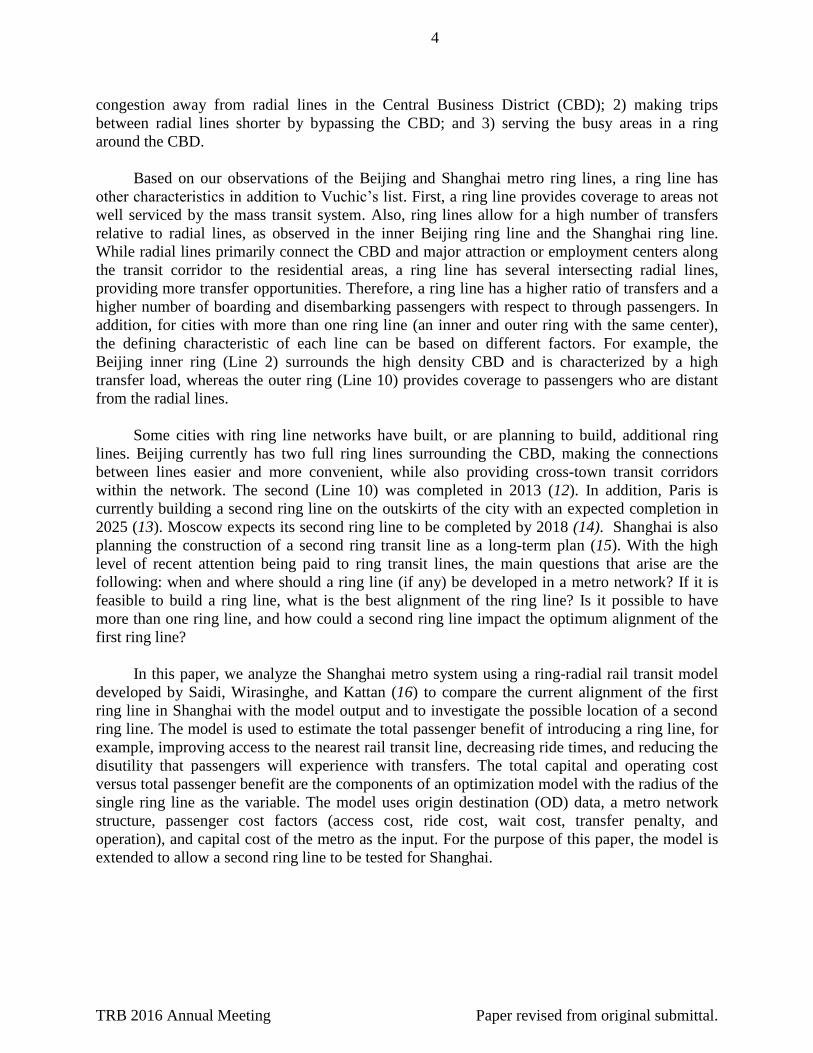
INTRODUCTION
Following decades of dependency on personal automobiles and planning for the use of
personal vehicles as the main means of transportation, public transit has recently experienced
growing attention. Increased travel and traffic congestion; increased cost of car ownership,
operation, and parking; and environmental concerns and sustainability issues have shifted the
focus of city planners and politicians towards public transportation. In addition, this trend is also
occurring in society in general. Similar to when mass transit systems were first introduced
approximately 150 years ago, public transit is now the primary method of transportation within
many cities, especially in large cities in Asia and Europe; the trend is also true in some North
American cities.
Due to the heightened demand for public transportation, cities in China have become
leaders in planning and constructing metro systems; twenty-two cities have metro networks, and
additional sixteen cities with metro systems currently under construction (1). Of these, Shanghai
has the largest metro system, spanning more than 550 kilometers, and the system has only been
in operation since 1993. Despite the large size of the Shanghai system, Beijing has a higher
metro ridership. Both cities possess ring transit lines, and these lines are an important constituent
of their metro systems; many other Chinese cities envision a ring transit line as a long-term
transit network, including Chengdu (2), Harbin (3), Ningbo (4), as well as a semi-ring line in
Shenzhen (5) and Chongqing (6).
In a purely radial rail network, destinations away from the city center can only be reached
by travelling along the radial lines that pass through the center. Therefore, this network can result
in unnecessary passenger loads for some corridors, high transfer loads in the city center, and
additional distance, travel time, and transfers for passengers travelling across the city. A ring line
provides better connectivity and decreases network vulnerability since there are alternative
routes to each destination. Kennedy and Derrible (7), Yi and Chao (8), and Laporte et al. (9)
showed that a ring or circumferential transit line greatly improves network connectivity,
directness, and operational efficiency. Saidi, Wirasinghe, and Kattan (10) performed a review of
rail transit networks globally with special emphasis on cities with ring transit lines. They found
relationships between transit ridership and different city parameters, such as population, city
area, and population density. Moreover, they also reviewed cities with rail ring transit lines, such
as London, Moscow, Berlin, Beijing, Tokyo, and Shanghai. Population density and network
length were found to be statistically significant parameters that warrant a ring line. Therefore, a
city should have a high population density spread throughout the city rather than a densely
populated single area to justify building a ring transit line. In addition, transit networks should
first possess some radial lines and a certain level of network maturity before a ring transit line is
introduced.
Ring lines are positioned around a city center and intersect radial lines to create transfer
opportunities; and, thus, they support an integrated multipath network. In addition to saving
passenger travel and wait times, increasing transit network connectivity and reliability, and
reducing the transit load in the downtown core, ring lines also have the potential to increase the
accessibility and development of new satellite centers. Vuchic (11) lists three important
functions of ring lines: 1) improving connectivity among radial lines and distributing the
4
TRB 2016 Annual Meeting Paper revised from original submittal.
congestion away from radial lines in the Central Business District (CBD); 2) making trips
between radial lines shorter by bypassing the CBD; and 3) serving the busy areas in a ring
around the CBD.
Based on our observations of the Beijing and Shanghai metro ring lines, a ring line has
other characteristics in addition to Vuchic’s list. First, a ring line provides coverage to areas not
well serviced by the mass transit system. Also, ring lines allow for a high number of transfers
relative to radial lines, as observed in the inner Beijing ring line and the Shanghai ring line.
While radial lines primarily connect the CBD and major attraction or employment centers along
the transit corridor to the residential areas, a ring line has several intersecting radial lines,
providing more transfer opportunities. Therefore, a ring line has a higher ratio of transfers and a
higher number of boarding and disembarking passengers with respect to through passengers. In
addition, for cities with more than one ring line (an inner and outer ring with the same center),
the defining characteristic of each line can be based on different factors. For example, the
Beijing inner ring (Line 2) surrounds the high density CBD and is characterized by a high
transfer load, whereas the outer ring (Line 10) provides coverage to passengers who are distant
from the radial lines.
Some cities with ring line networks have built, or are planning to build, additional ring
lines. Beijing currently has two full ring lines surrounding the CBD, making the connections
between lines easier and more convenient, while also providing cross-town transit corridors
within the network. The second (Line 10) was completed in 2013 (12). In addition, Paris is
currently building a second ring line on the outskirts of the city with an expected completion in
2025 (13). Moscow expects its second ring line to be completed by 2018 (14). Shanghai is also
planning the construction of a second ring transit line as a long-term plan (15). With the high
level of recent attention being paid to ring transit lines, the main questions that arise are the
following: when and where should a ring line (if any) be developed in a metro network? If it is
feasible to build a ring line, what is the best alignment of the ring line? Is it possible to have
more than one ring line, and how could a second ring line impact the optimum alignment of the
first ring line?
In this paper, we analyze the Shanghai metro system using a ring-radial rail transit model
developed by Saidi, Wirasinghe, and Kattan (16) to compare the current alignment of the first
ring line in Shanghai with the model output and to investigate the possible location of a second
ring line. The model is used to estimate the total passenger benefit of introducing a ring line, for
example, improving access to the nearest rail transit line, decreasing ride times, and reducing the
disutility that passengers will experience with transfers. The total capital and operating cost
versus total passenger benefit are the components of an optimization model with the radius of the
single ring line as the variable. The model uses origin destination (OD) data, a metro network
structure, passenger cost factors (access cost, ride cost, wait cost, transfer penalty, and
operation), and capital cost of the metro as the input. For the purpose of this paper, the model is
extended to allow a second ring line to be tested for Shanghai.
5
TRB 2016 Annual Meeting Paper revised from original submittal.
OVERVIEW OF SHANGHAI METRO SYSTEM
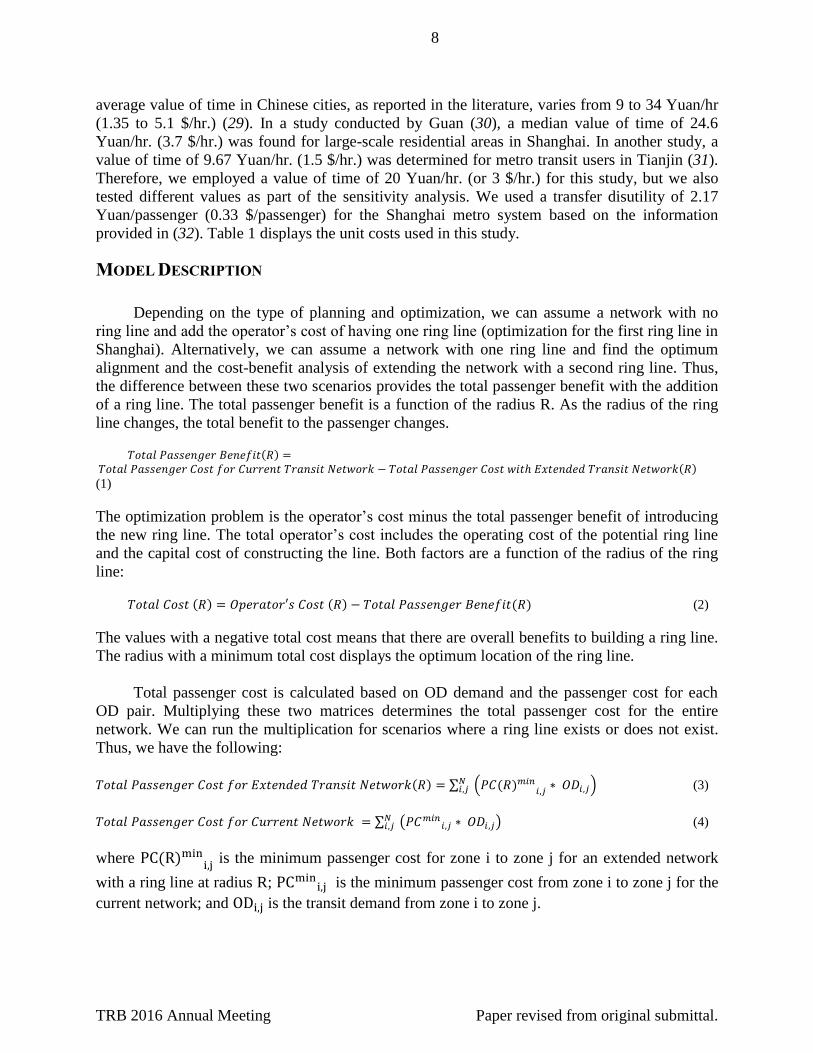
The largest metro system in the world opened its first metro line in 1993, making Shanghai
the third city in Mainland China, after Beijing and Tianjin, to have a rail rapid transit system.
Since then, the Shanghai metro has become one of the fastest growing networks in the world
with several lines currently under construction. Figure 1 shows the development of the Shanghai
metro system over time. This growth has stemmed from the extremely high usage that the system
regularly experiences. As of January 2014, in a normal weekday over 8 million passengers use
the Shanghai metro; Shanghai set a ‘daily total number of boarding’ record of 10.28 million on
September 25, 2015 (17).
The idea of building a metro line in Shanghai was first proposed in August 1956 as a
military defense measure, and a preliminary plan originated for building an underground tunnel.
Two lines were initially planned: Line 1 from north to south, and Line 2 from east to west. The
actual construction of the metro lines in Shanghai commenced more than 30 years later in 1990.
The first section of metro Line 1 was completed in 1993, and construction of Line 2 began in
1995. Line 2 now plays a vital role in the west-east corridor (18) as it connects the major airports
in Shanghai: Hongqiao (mostly a domestic airport) and Pudong International Airport. In addition,
the Century Avenue station is located on this line, and this station connects with three other lines
(4, 6, and 9). Due to the extremely high demand for boarding and alighting, there are special
regulations for passengers during peak hours to control crowding at this station in particular. The
availability of the old railway line in Shanghai that connected the Shanghai Railway station to
the city of Hangzhou reduced the required investment and construction time for Line 3. Lines 3
and 4 share the track for almost half of the ring, and construction of these lines commenced in
1997 and 2005, respectively (19).
The Shanghai ring line (Line 4) was originally planned to be longer (36 km vs. the current
33 km line), but with the high cost of construction and the savings from the partly shared track
with Line 3, the original plan was changed to the current system. Further, the alignment of the
Shanghai ring line follows, in part, underneath the alignment of the Shanghai inner ring road
(20). Currently, one of the major problems with the shared track is maintaining appropriate
headway. The headway on different sections of the ring corridor is not uniform, and this situation
creates additional wait times and passenger overflow. Therefore, the Shanghai metro is planning
to change the current operation of Line 3 so that it will only operate on the north section up to the
ring corridor, but not on the ring corridor itself. In this way, the headway on the ring corridor
will be uniform, but passengers from the north part of Line 3 will be required to transfer to Line
4 at Baoshan Road station. (20)
Line 5 was the first light rail transit line introduced in Shanghai (21); it begins at the final
station of Line 1 at Xinzhuang and extends further south. Line 8 is another major line in
Shanghai because the People’s Square, (the central station at the heart of Shanghai), the
Shanghai Expo area, and other major attractions in the city are easily accessible from this line. It
connects the Yangpu district to the downtown core, and mitigates the traffic pressure in the
downtown area. Line 10 opened in 2010, and is the first autonomous line in China, operating
without a driver (22). Furthermore, the Shanghai metro introduced the first line, Line 11, that
6
TRB 2016 Annual Meeting Paper revised from original submittal.
crosses two provinces (Shanghai and Jiangsu) in China, and in the future, this line will also be
connected to Line S1 in Suzhou (23).
Figure 1. Shanghai metro evolution (1993-2013).
7
TRB 2016 Annual Meeting Paper revised from original submittal.
The Shanghai metro currently boasts a total of 14 lines, 337 stations, and 548 km of rail
line, making it the most extensive metro network in the world, but, in terms of ridership, after
Beijing and is on par with Seoul and Moscow(1). As the Shanghai metro continues to expand, it
is expected that by 2020 six more lines will be constructed.
To conduct a cost-benefit analysis and optimize the alignment of the ring lines in Shanghai,
we should use transportation or land use zonal OD data for an accurate and realistic analysis.
However, due to the limited ability to access such data for Shanghai, we used peak period metro
station OD data for a typical workday in 2013, and the 2013 network for the analysis. Total OD
demand is 3.6 million per day for 263 zones; some zones produce as high as 60,000 and some as
low as 1,000 trips. The average demand produced is 13,637 trips with a standard deviation of
11,686. For the purpose of data validation, we obtained the number of cell phone users for
different areas throughout Shanghai during a typical workday in 2015. Metro lines other than the
ring lines are assumed to be straight and are modeled as radial lines merging at the CBD, or are
connected to another radial line via a diametrical line. The actual location of the stations and the
current metro network were obtained in polar coordinates. Using this data and coding the radial
and ring line of the Shanghai network, we assumed the radial lines to be linear and the ring line
to be circular. We removed information for two lines (one whole line and half of another line), as
they could not be coded as radial nor as a full ring line on the developed ring-radial model. We
analyzed the Shanghai metro network to address the following questions:
- Assuming that the current Shanghai metro had no ring line, what would be the best
alignment of a ring line in Shanghai? The result found from the model can be compared
with the current ring line in Shanghai.
- Assuming Shanghai’s current metro network with the ring line, what is the optimal
alignment of a second ring line? Will such a line be beneficial when compared to the cost
of construction and operation?
The costs of constructing a metro line in different cities in China ranges from 500 million
CNY (75 million USD) per kilometer in Shanghai (24) up to 800 million CNY (120 million
USD) and, in some cases, 1 billion CNY (150 million USD) per kilometer for one of the newest
metro lines in Xi’an (25). Since such an investment will be used for many years, we should
calculate the investment for the annual or daily benefits of having a metro line. Shang and Zhang
analyzed the operating cost of the Shanghai and Hangzhou metro systems by considering
different factors, such as wages, maintenance fees, business cost, taxes, and surcharges (26).
According to this study, the cost of the Shanghai metro operation is approximately 5.7 billion
Yuan per year, or 12 million CNY (1.8 million USD) per kilometer per year. To estimate the
average passenger access cost to the metro stations, we determined the composition of different
access modes for the Shanghai metro. Pan et al. (27) investigated the average mode share of
passenger access to, or egress from, a metro station in Shanghai. Different modes were
considered, and the average percentages for access and egress modes, respectively, were
estimated as follows: walk (51%, 81%), bus (29%, 13%), bike (11%, 1%), motorcycle (6%, 1%),
and car (3%, 4%). Using the average speed of the different modes in Shanghai based on the fifth
travel survey conducted by the Shanghai City Comprehensive Transportation Planning Institute
(28), we were able to calculate the average speed of access/egress and metro ride for passengers.
Value of time is also important for this analysis to estimate passenger ride and wait costs. The
8
TRB 2016 Annual Meeting Paper revised from original submittal.
average value of time in Chinese cities, as reported in the literature, varies from 9 to 34 Yuan/hr
(1.35 to 5.1 $/hr.) (29). In a study conducted by Guan (30), a median value of time of 24.6
Yuan/hr. (3.7 $/hr.) was found for large-scale residential areas in Shanghai. In another study, a
value of time of 9.67 Yuan/hr. (1.5 $/hr.) was determined for metro transit users in Tianjin (31).
Therefore, we employed a value of time of 20 Yuan/hr. (or 3 $/hr.) for this study, but we also
tested different values as part of the sensitivity analysis. We used a transfer disutility of 2.17
Yuan/passenger (0.33 $/passenger) for the Shanghai metro system based on the information
provided in (32). Table 1 displays the unit costs used in this study.
MODEL DESCRIPTION
Depending on the type of planning and optimization, we can assume a network with no
ring line and add the operator’s cost of having one ring line (optimization for the first ring line in
Shanghai). Alternatively, we can assume a network with one ring line and find the optimum
alignment and the cost-benefit analysis of extending the network with a second ring line. Thus,
the difference between these two scenarios provides the total passenger benefit with the addition
of a ring line. The total passenger benefit is a function of the radius R. As the radius of the ring
line changes, the total benefit to the passenger changes.
𝑇𝑜𝑡𝑎𝑙 𝑃𝑎𝑠𝑠𝑒𝑛𝑔𝑒𝑟 𝐵𝑒𝑛𝑒𝑓𝑖𝑡(𝑅) = 𝑇𝑜𝑡𝑎𝑙 𝑃𝑎𝑠𝑠𝑒𝑛𝑔𝑒𝑟 𝐶𝑜𝑠𝑡 𝑓𝑜𝑟 𝐶𝑢𝑟𝑟𝑒𝑛𝑡 𝑇𝑟𝑎𝑛𝑠𝑖𝑡 𝑁𝑒𝑡𝑤𝑜𝑟𝑘 − 𝑇𝑜𝑡𝑎𝑙 𝑃𝑎𝑠𝑠𝑒𝑛𝑔𝑒𝑟 𝐶𝑜𝑠𝑡 𝑤𝑖𝑡ℎ 𝐸𝑥𝑡𝑒𝑛𝑑𝑒𝑑 𝑇𝑟𝑎𝑛𝑠𝑖𝑡 𝑁𝑒𝑡𝑤𝑜𝑟𝑘(𝑅) (1)
The optimization problem is the operator’s cost minus the total passenger benefit of introducing
the new ring line. The total operator’s cost includes the operating cost of the potential ring line
and the capital cost of constructing the line. Both factors are a function of the radius of the ring
line:
𝑇𝑜𝑡𝑎𝑙 𝐶𝑜𝑠𝑡 (𝑅) = 𝑂𝑝𝑒𝑟𝑎𝑡𝑜𝑟′𝑠 𝐶𝑜𝑠𝑡 (𝑅) − 𝑇𝑜𝑡𝑎𝑙 𝑃𝑎𝑠𝑠𝑒𝑛𝑔𝑒𝑟 𝐵𝑒𝑛𝑒𝑓𝑖𝑡(𝑅) (2)
The values with a negative total cost means that there are overall benefits to building a ring line.
The radius with a minimum total cost displays the optimum location of the ring line.
Total passenger cost is calculated based on OD demand and the passenger cost for each
OD pair. Multiplying these two matrices determines the total passenger cost for the entire
network. We can run the multiplication for scenarios where a ring line exists or does not exist.
Thus, we have the following:
𝑇𝑜𝑡𝑎𝑙 𝑃𝑎𝑠𝑠𝑒𝑛𝑔𝑒𝑟 𝐶𝑜𝑠𝑡 𝑓𝑜𝑟 𝐸𝑥𝑡𝑒𝑛𝑑𝑒𝑑 𝑇𝑟𝑎𝑛𝑠𝑖𝑡 𝑁𝑒𝑡𝑤𝑜𝑟𝑘(𝑅) = ∑ (𝑃𝐶(𝑅)𝑚𝑖𝑛𝑖,𝑗
∗ 𝑂𝐷𝑖,𝑗) 𝑁𝑖,𝑗 (3)
𝑇𝑜𝑡𝑎𝑙 𝑃𝑎𝑠𝑠𝑒𝑛𝑔𝑒𝑟 𝐶𝑜𝑠𝑡 𝑓𝑜𝑟 𝐶𝑢𝑟𝑟𝑒𝑛𝑡 𝑁𝑒𝑡𝑤𝑜𝑟𝑘 = ∑ (𝑃𝐶𝑚𝑖𝑛𝑖,𝑗 ∗ 𝑂𝐷𝑖,𝑗) 𝑁
𝑖,𝑗 (4)
where PC(R)mini,j
is the minimum passenger cost for zone i to zone j for an extended network
with a ring line at radius R; PCmini,j is the minimum passenger cost from zone i to zone j for the
current network; and ODi,j is the transit demand from zone i to zone j.
9
TRB 2016 Annual Meeting Paper revised from original submittal.
The minimum passenger cost for each OD pair is obtained by considering different
passenger route choices for each OD pair. Readers are referred to (15) for additional details of a
passenger route choice model for a single ring line. The model is extended to allow a second ring
line in the paper. We assume a rail transit network with only two types of lines: radial and ring
lines. Radial lines connect the CBD to the edges of the city, with some connecting to other radial
lines at the CBD, forming a diametrical line. Therefore, passengers can either take the same line,
without transferring, to travel to another side of the network, or they may have to transfer in the
CBD and take another radial line. The ring-radial model (15) uses OD data input to depict a
realistic travel pattern, as travel demands are not necessarily uniformly distributed or follow a
particular continuous function as assumed in (33-35). Having a combination of many radial lines
and two ring lines creates different route choices. Passengers will choose an alternative route
with a minimum total travel cost. Different route alternatives in the ring-radial model are listed
below:
1. Direct access from a given origin to a given destination without using the metro network.
2. Use only a radial line:
2.1 Access the nearest radial line, take the radial line, access destination (1 wait cost);
2.2 Access the nearest radial line, take the radial line, access destination; if needed
transfer to another radial line in the CBD, or direct access to the destination (either 1 wait cost,
or 2 wait costs and 1 transfer); and
2.3 Direct access to the CBD and then take the radial line, access the destination (1
wait cost).
3. Use one ring line (radial line may also be used).
3.1 Access the ring line, take the ring line, access destination (1 wait cost);
3.2 Access the ring line, take the ring line, transfer to a radial line, access destination;
if needed transfer to another radial line in the CBD, or direct access to destination from CBD
(either 2 wait costs and 1 transfer, or 3 wait costs and 2 transfers);
3.3 Access the nearest radial line, take the radial line, transfer to a ring line, access
destination (2 wait costs and 1 transfer);
3.4 Access the nearest radial line, take the radial line, transfer to a ring line, transfer
to another radial line, access destination (3 wait costs and 2 transfers); and
3.5 Direct access to the CBD, take radial line, transfer to a ring line, take the ring line,
access destination (2 wait costs and, 1 transfer).
4. Use both ring lines (a radial line may also be used).
4.1 Access a ring line, take the ring line, transfer to a radial line, if needed transfer to
another radial line in the CBD, transfer to the other ring line, access destination (3 wait cost, 2
transfers or 4 wait cost, 3 transfers);
4.2 Access a ring line, take the ring line, transfer to a radial line, transfer to another
ring line, transfer to another radial line, access destination (4 wait cost, 3 transfers);
4.3 Access a radial line, take the radial line, transfer to a ring line, take the ring line,
transfer to another radial line, take the radial line, access destination (4 wait costs and 3
transfers);
10
TRB 2016 Annual Meeting Paper revised from original submittal.
Alternatives 4.1, 4.2, and 4.3 are unlikely to be the options with the minimum passenger
cost. The main changes to the total passenger cost for different route alternatives occur for
alternative 3, where for each OD pair, one of the ring lines can be in the route with the minimum
passenger cost.
We used the deterministic passenger route choice model to calculate passenger costs for
different route options for each OD pair. The passenger route choice model calculates the
minimum cost option for each of the different available routes. The model then uses the
passenger cost of each route, with the minimum cost for each OD pair, for alternatives with a
ring line or no ring line in place. The general passenger cost equations for the above alternatives
are:
Direct Access Alternative: 𝛾𝑎(𝐷) (5)
Radial Line Alternative: 𝛾𝑎𝐷𝑜 + 𝛾𝑎𝐷𝑑 + 𝜁𝑅𝐿𝑘𝐻𝑅𝐿𝛾𝑤 + (𝜁𝑅𝐿 − 1)𝛾𝑇 + 𝛾𝑅𝐷𝑅 (6)
Ring Line Alternative: 𝛾𝑎𝐷𝑜 + 𝛾𝑎𝐷𝑑 + 𝜁𝑅𝑁𝑘𝐻𝑅𝑁𝛾𝑤 + 𝜁𝑅𝐿𝑘𝐻𝑅𝐿𝛾𝑤 + (𝜁𝑅𝐿+𝜁𝑅𝐿 − 1)𝛾𝑇 + 𝛾𝑅𝐷𝑅 (7)
where: 𝛾𝑎 is the generalized access cost to reach the destination or rail line per kilometer per passenger;
𝛾𝑤 is the wait cost per hour per passenger;
D is the access distance (radial, circumferential, or both) travelled from the origin to the destination;
𝐷𝑜 is the distance (radial, circumferential, or both) between the transit line and the origin;
𝐷𝑑 is the radial (radial, circumferential, or both) distance between the transit line and the destination;
𝐷𝑅 is the ride (radial, circumferential, or both) distance travelled;
R is radius of the ring line;
𝛾𝑅 is ride cost per unit distance per passenger;
𝐻𝑅𝐿 is headway on the radial line;
𝐻𝑅𝑁 is headway on the ring line;
𝛾𝑇 is transfer penalty that passengers suffer in case they need to transfer from one rail line to another
𝛾𝑤 is the wait cost per hour per passenger;
𝛾𝑇 is the transfer cost per transfer per passenger;
𝜁𝑅𝐿= 0, 1, 2, 3, or 4 in case a transfer is needed on radial lines; and
𝜁𝑅𝑁= 0, 1, 2, or 3 in case a transfer is needed on ring lines.
We employed a fixed generalized access cost per unit distance for this analysis, which is used to calculate both access cost and egress cost functions:
𝛾𝑎(𝑟, 𝜃) = 𝛾𝑎 (8)
For the input data of this model, we required a transit OD matrix that showed the demand for
travel between each zone pair. We also required coordinates of each zone’s centroid. With this
input data, minimum passenger cost matrices for the current and extended network were
obtained. Table 1 shows the unit cost factors used for the model.
11
TRB 2016 Annual Meeting Paper revised from original submittal.
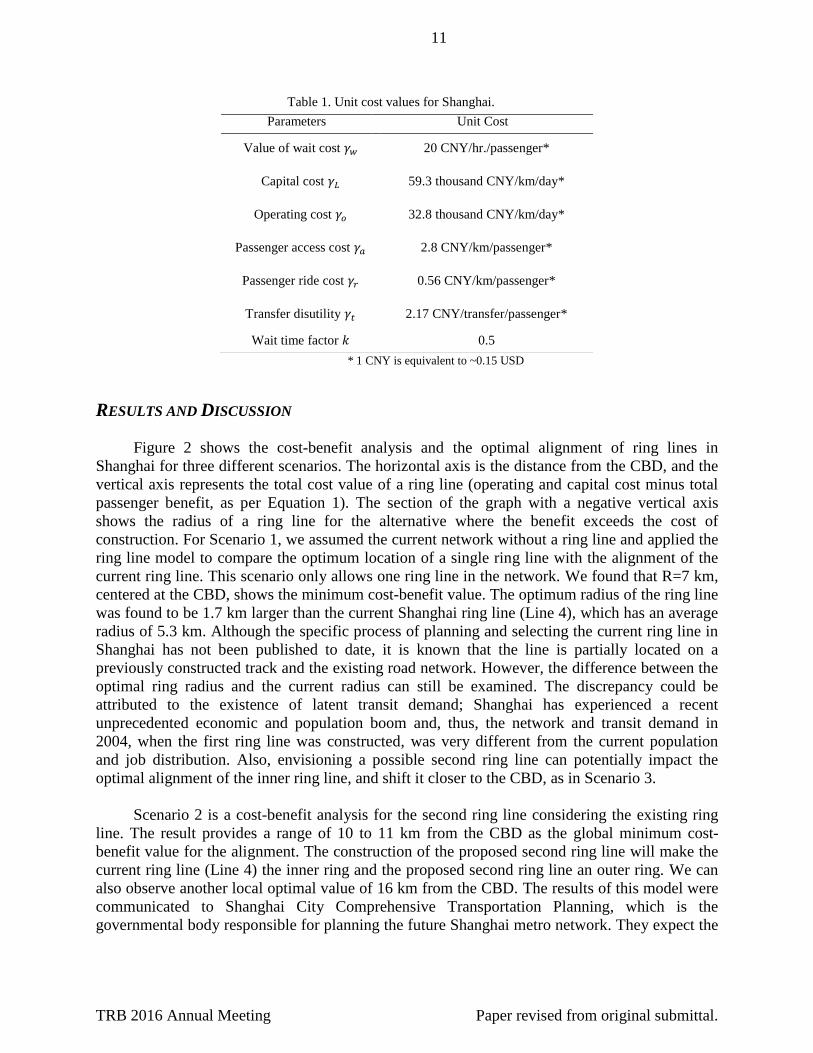
Table 1. Unit cost values for Shanghai.
RESULTS AND DISCUSSION
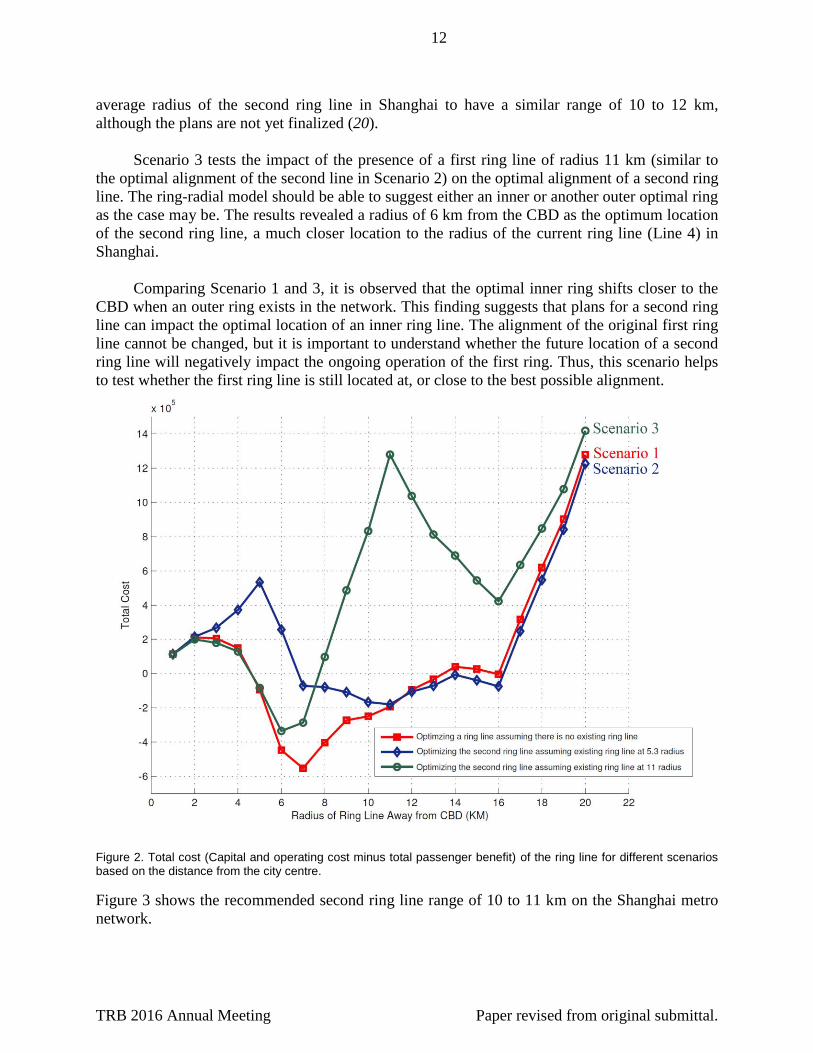
Figure 2 shows the cost-benefit analysis and the optimal alignment of ring lines in
Shanghai for three different scenarios. The horizontal axis is the distance from the CBD, and the
vertical axis represents the total cost value of a ring line (operating and capital cost minus total
passenger benefit, as per Equation 1). The section of the graph with a negative vertical axis
shows the radius of a ring line for the alternative where the benefit exceeds the cost of
construction. For Scenario 1, we assumed the current network without a ring line and applied the
ring line model to compare the optimum location of a single ring line with the alignment of the
current ring line. This scenario only allows one ring line in the network. We found that R=7 km,
centered at the CBD, shows the minimum cost-benefit value. The optimum radius of the ring line
was found to be 1.7 km larger than the current Shanghai ring line (Line 4), which has an average
radius of 5.3 km. Although the specific process of planning and selecting the current ring line in
Shanghai has not been published to date, it is known that the line is partially located on a
previously constructed track and the existing road network. However, the difference between the
optimal ring radius and the current radius can still be examined. The discrepancy could be
attributed to the existence of latent transit demand; Shanghai has experienced a recent
unprecedented economic and population boom and, thus, the network and transit demand in
2004, when the first ring line was constructed, was very different from the current population
and job distribution. Also, envisioning a possible second ring line can potentially impact the
optimal alignment of the inner ring line, and shift it closer to the CBD, as in Scenario 3.
Scenario 2 is a cost-benefit analysis for the second ring line considering the existing ring
line. The result provides a range of 10 to 11 km from the CBD as the global minimum cost-
benefit value for the alignment. The construction of the proposed second ring line will make the
current ring line (Line 4) the inner ring and the proposed second ring line an outer ring. We can
also observe another local optimal value of 16 km from the CBD. The results of this model were
communicated to Shanghai City Comprehensive Transportation Planning, which is the
governmental body responsible for planning the future Shanghai metro network. They expect the
Parameters Unit Cost
Value of wait cost 𝛾𝑤 20 CNY/hr./passenger*
Capital cost 𝛾𝐿 59.3 thousand CNY/km/day*
Operating cost 𝛾𝑜 32.8 thousand CNY/km/day*
Passenger access cost 𝛾𝑎 2.8 CNY/km/passenger*
Passenger ride cost 𝛾𝑟 0.56 CNY/km/passenger*
Transfer disutility 𝛾𝑡 2.17 CNY/transfer/passenger*
Wait time factor 𝑘 0.5
* 1 CNY is equivalent to ~0.15 USD
12
TRB 2016 Annual Meeting Paper revised from original submittal.
average radius of the second ring line in Shanghai to have a similar range of 10 to 12 km,
although the plans are not yet finalized (20).
Scenario 3 tests the impact of the presence of a first ring line of radius 11 km (similar to
the optimal alignment of the second line in Scenario 2) on the optimal alignment of a second ring
line. The ring-radial model should be able to suggest either an inner or another outer optimal ring
as the case may be. The results revealed a radius of 6 km from the CBD as the optimum location
of the second ring line, a much closer location to the radius of the current ring line (Line 4) in
Shanghai.
Comparing Scenario 1 and 3, it is observed that the optimal inner ring shifts closer to the
CBD when an outer ring exists in the network. This finding suggests that plans for a second ring
line can impact the optimal location of an inner ring line. The alignment of the original first ring
line cannot be changed, but it is important to understand whether the future location of a second
ring line will negatively impact the ongoing operation of the first ring. Thus, this scenario helps
to test whether the first ring line is still located at, or close to the best possible alignment.
Figure 2. Total cost (Capital and operating cost minus total passenger benefit) of the ring line for different scenarios based on the distance from the city centre.
Figure 3 shows the recommended second ring line range of 10 to 11 km on the Shanghai metro
network.
13
TRB 2016 Annual Meeting Paper revised from original submittal.
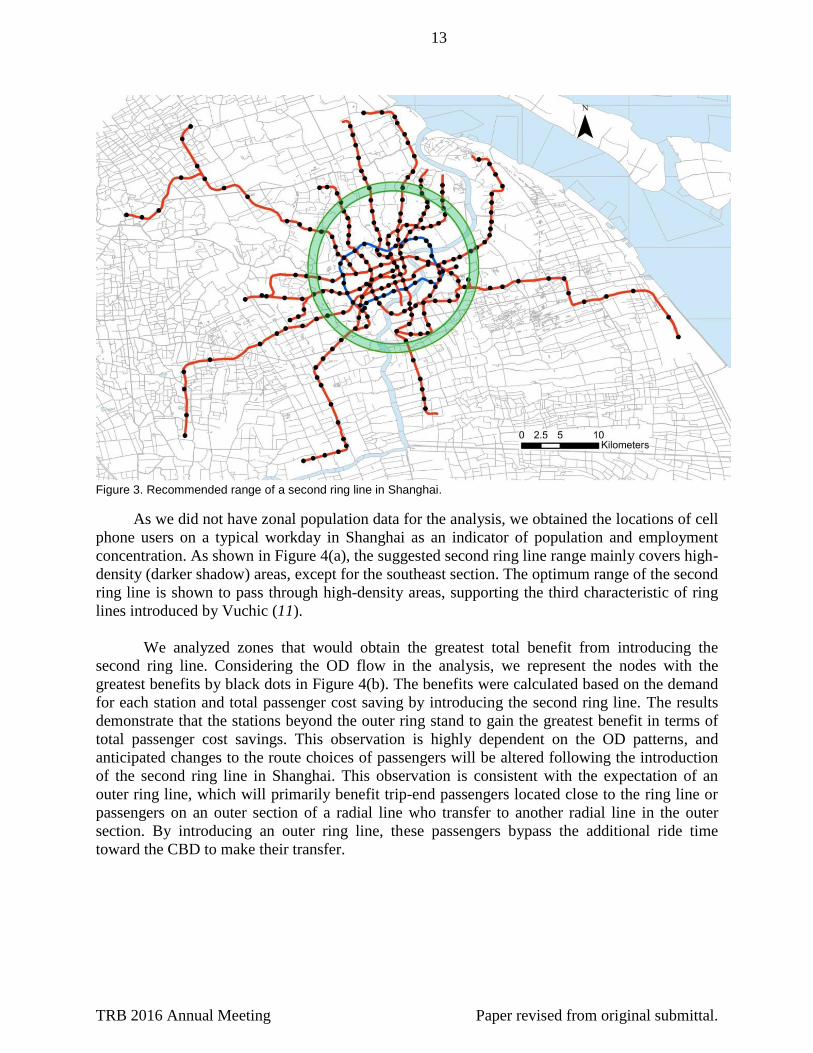
Figure 3. Recommended range of a second ring line in Shanghai.
As we did not have zonal population data for the analysis, we obtained the locations of cell
phone users on a typical workday in Shanghai as an indicator of population and employment
concentration. As shown in Figure 4(a), the suggested second ring line range mainly covers high-
density (darker shadow) areas, except for the southeast section. The optimum range of the second
ring line is shown to pass through high-density areas, supporting the third characteristic of ring
lines introduced by Vuchic (11).
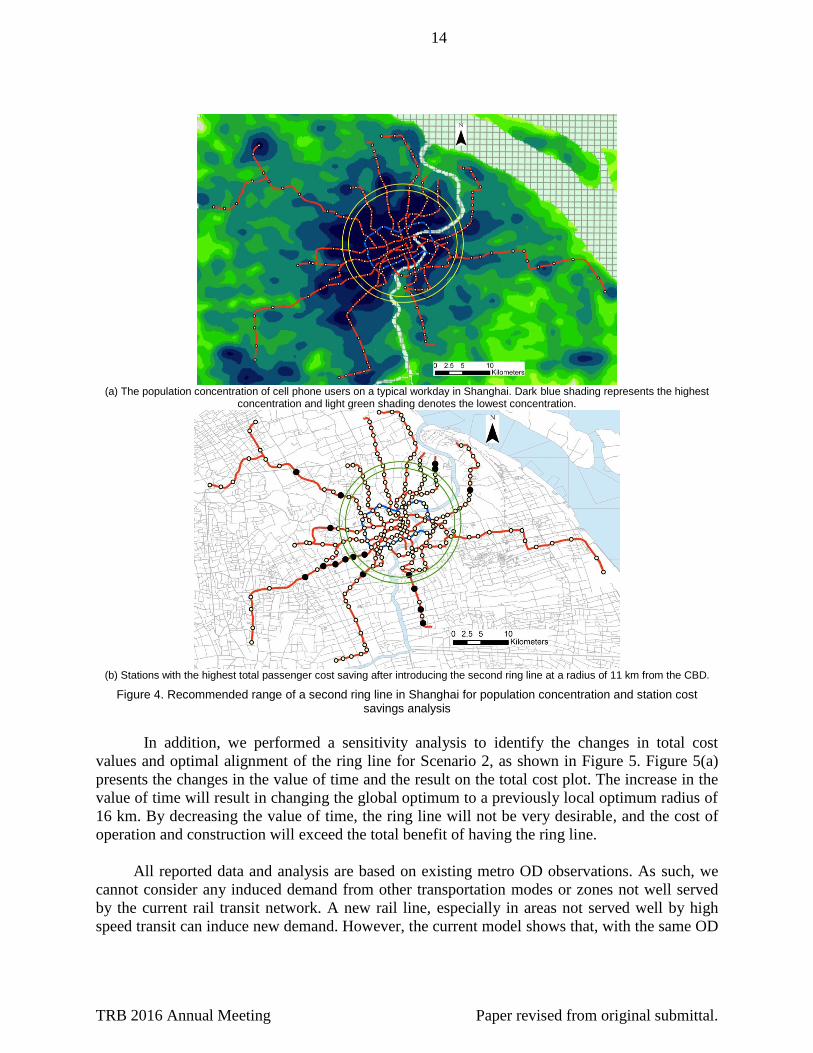
We analyzed zones that would obtain the greatest total benefit from introducing the
second ring line. Considering the OD flow in the analysis, we represent the nodes with the
greatest benefits by black dots in Figure 4(b). The benefits were calculated based on the demand
for each station and total passenger cost saving by introducing the second ring line. The results
demonstrate that the stations beyond the outer ring stand to gain the greatest benefit in terms of
total passenger cost savings. This observation is highly dependent on the OD patterns, and
anticipated changes to the route choices of passengers will be altered following the introduction
of the second ring line in Shanghai. This observation is consistent with the expectation of an
outer ring line, which will primarily benefit trip-end passengers located close to the ring line or
passengers on an outer section of a radial line who transfer to another radial line in the outer
section. By introducing an outer ring line, these passengers bypass the additional ride time
toward the CBD to make their transfer.
14
TRB 2016 Annual Meeting Paper revised from original submittal.
(a) The population concentration of cell phone users on a typical workday in Shanghai. Dark blue shading represents the highest
concentration and light green shading denotes the lowest concentration.
(b) Stations with the highest total passenger cost saving after introducing the second ring line at a radius of 11 km from the CBD.
Figure 4. Recommended range of a second ring line in Shanghai for population concentration and station cost savings analysis
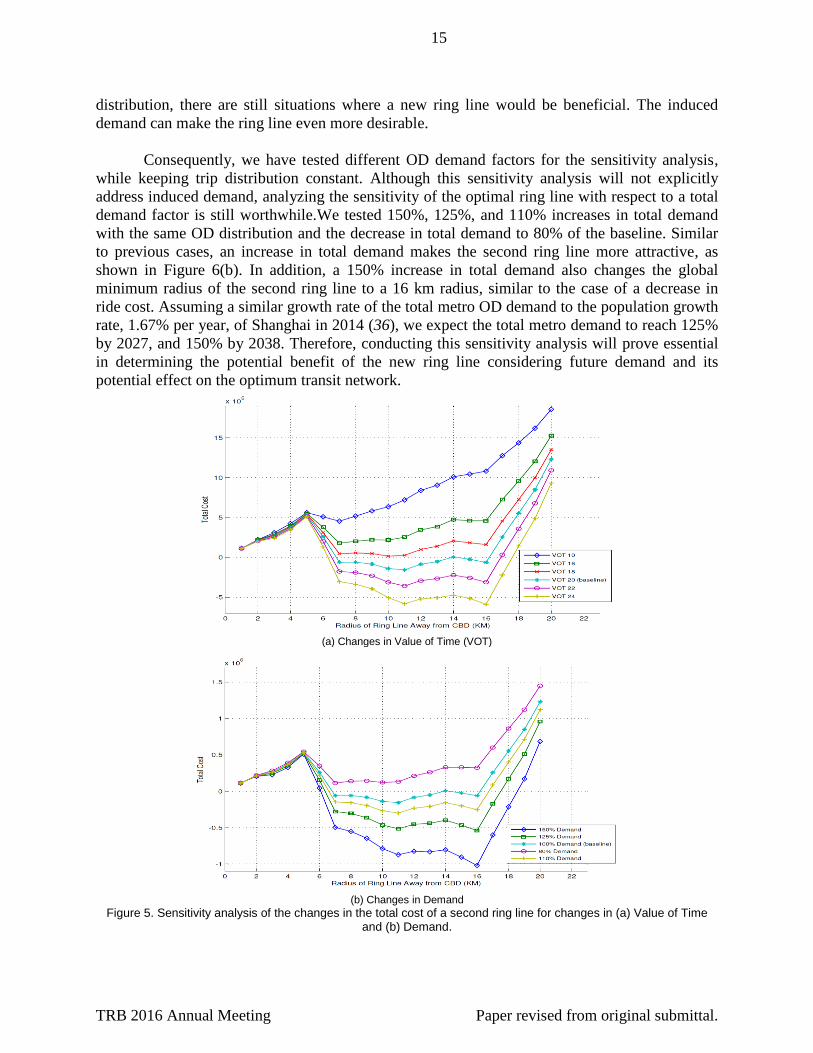
In addition, we performed a sensitivity analysis to identify the changes in total cost
values and optimal alignment of the ring line for Scenario 2, as shown in Figure 5. Figure 5(a)
presents the changes in the value of time and the result on the total cost plot. The increase in the
value of time will result in changing the global optimum to a previously local optimum radius of
16 km. By decreasing the value of time, the ring line will not be very desirable, and the cost of
operation and construction will exceed the total benefit of having the ring line.
All reported data and analysis are based on existing metro OD observations. As such, we
cannot consider any induced demand from other transportation modes or zones not well served
by the current rail transit network. A new rail line, especially in areas not served well by high
speed transit can induce new demand. However, the current model shows that, with the same OD
15
TRB 2016 Annual Meeting Paper revised from original submittal.
distribution, there are still situations where a new ring line would be beneficial. The induced
demand can make the ring line even more desirable.
Consequently, we have tested different OD demand factors for the sensitivity analysis,
while keeping trip distribution constant. Although this sensitivity analysis will not explicitly
address induced demand, analyzing the sensitivity of the optimal ring line with respect to a total
demand factor is still worthwhile.We tested 150%, 125%, and 110% increases in total demand
with the same OD distribution and the decrease in total demand to 80% of the baseline. Similar
to previous cases, an increase in total demand makes the second ring line more attractive, as
shown in Figure 6(b). In addition, a 150% increase in total demand also changes the global
minimum radius of the second ring line to a 16 km radius, similar to the case of a decrease in
ride cost. Assuming a similar growth rate of the total metro OD demand to the population growth
rate, 1.67% per year, of Shanghai in 2014 (36), we expect the total metro demand to reach 125%
by 2027, and 150% by 2038. Therefore, conducting this sensitivity analysis will prove essential
in determining the potential benefit of the new ring line considering future demand and its
potential effect on the optimum transit network.
(a) Changes in Value of Time (VOT)
(b) Changes in Demand
Figure 5. Sensitivity analysis of the changes in the total cost of a second ring line for changes in (a) Value of Time and (b) Demand.
16
TRB 2016 Annual Meeting Paper revised from original submittal.
SUMMARY AND CONCLUSIONS
In this study, we analyzed the Shanghai ring line using the long-term planning model for
ring-radial urban rail transit networks developed by Saidi, Wirasinghe, and Kattan (16). The
model was extended to optimize a possible second ring line for the purpose of long-term
planning in Shanghai. A total of three scenarios were tested. In the first scenario, we used the
Shanghai network assuming no ring line, and optimizing one ring line in the network. We found
that the optimal radius of the ring line is slightly larger than the average radius of the existing
Shanghai ring line (Line 4). In the second scenario, we used the Shanghai network with the
current ring line to optimize a second ring line. The optimal location of the second ring line was
found to be at a distance of 10 to 11 km from the CBD. In the third scenario, we tested a
hypothetical case of one ring line at a radius of 11 km instead of the current ring line, and we
used a ring-radial rail transit model to optimize a second ring line. This scenario showed that the
second ring line is feasible and optimal at a radius of 6 km from the CBD, a radius very close to
the current 5.3 km ring line. Taken together, the results for the three scenarios demonstrate that
the location of one ring line will impact the optimal location of the second ring line. Therefore, if
an outer ring line is planned for construction, the optimal alignment of the inner ring line may
change. The alignment of the original inner ring line cannot be changed after construction and,
thus, it is important to ensure that while a second ring line may be planned later, the original ring
line is located at the best possible alignment and will not be negatively impacted by the second
ring line. This problem can be handled in two ways. First, it is important to consider the
possibility of a second ring line in the original long term transit network plan. Or, if such long
term planning has not occurred, the objective should be to optimize the alignment of the new line
and to maintain the effective operation of the inner ring line.
We conducted a sensitivity analysis and found that an increase in value of time and an
increase in demand will create a more desirable ring line, while shifting the optimal radius of the
ring line further away from the CBD. Additionally, by analyzing all of the attraction and
production nodes, we found that by introducing an outer ring line, nodes located outside of this
ring will obtain the greatest benefit in terms of total passenger cost savings.
The results from this study are particularly useful for cities considering an expansion of
their transit network. Unlike simulations and agent-based models, this long-range model for the
planning of ring transit lines is easily transferable to other transit networks. Therefore, given
access to current and future OD data and transit network data, the model can be directly
implemented for any given city.
However, one of the main limitations of this study is the use of the metro station OD data
as the input for the model. One of the primary purposes of a ring line (or any metro line in
general) is to effectively service new catchment areas not served well with the current radial
transit system. The use of transportation or land use zonal OD data can address this issue, model
the passenger route choices, and provide detailed trip-end movements and thus result in a more
accurate cost-benefit analysis for different locations of the ring line. Since we only had station
OD data (not transportation zone OD data) for the Shanghai case study, trip attraction and
production nodes remain the same with without a ring line. Thus, the new ring line is only
optimized to create faster routes for the same passengers with the same station origin or
17
TRB 2016 Annual Meeting Paper revised from original submittal.
destination. This limitation could have been resolved by using transportation zone OD as the
input.
ACKNOWLEDGMENT
This work was funded in part by the Natural Sciences and Engineering Research Council
of Canada (NSERC), the Killam Trusts, Calgary Transit, the Urban Alliance, the University of
Calgary, and the Schulich School of Engineering. This paper is based on a joint case study
between the University of Calgary, Canada and Tongji University, China. The authors would like
to thank Bizhuang Chen, Zhiguo Dong, and Yunzhang Shen from the Shanghai City
Comprehensive Transportation Planning Institute for their valuable time and input. We greatly
appreciate the Shanghai Traffic Information Center for providing the Shanghai cell phone
concentration data. We would also like to thank Yin Wang and Zheng Meng from the
Department of Transportation Planning in Beijing for providing valuable insight into the Beijing
metro ring lines. Finally, we thank Shichao Sun for providing data on the Shanghai metro.
REFERENCES
1. Wikipedia. List of metro systems. https://en.wikipedia.org/wiki/List_of_metro_systems.
Accessed June 25, 2015.
2. Wikipedia. Chengdu Metro. https://en.wikipedia.org/wiki/Chengdu_Metro. Accessed 25
June, 2015.
3. Railway-Technology. Harbin Metro, Underground Rapid Transit System, China.
http://www.railway-technology.com/projects/-harbin-metro-china/-harbin-metro-
china1.html Accessed 25 June, 2015.
4. Ningbo Municipal Engineering Administration Department Planning Bureau. Ningbo
Urban Rail Transit Network Plan, 2015.
http://www.nbplan.gov.cn/zhz/news/201506/n65305.html. Accessed July 2, 2015.
5. Wikipedia. Shenzhen Metro. https://en.wikipedia.org/wiki/Shenzhen_Metro. Accessed
June 25, 2015.
6. Maxxelli. Chongqing Subway lines remain under construction. http://maxxelli-
blog.com/fr/2010/09/chongqing-subway-lines-remain-under-construction/. Accessed
June 25, 2015.
7. Kennedy, C. and S. J. Derrible. Network Analysis of World Subway Systems Using
Updated Graph Theory. In Transportation Research Record: Journal of the
Transportation Research Board, No. 2112, Transportation Research Board of the
National Academies, Washington, D.C., vol. 3, 2009, pp. 17-25.
18
TRB 2016 Annual Meeting Paper revised from original submittal.
8. Yi, W. and Y. Chao. Morphological and Functional Analysis of Urban Rail Transit
Networks. Transportation Research Board 89th
Annual Meeting, Washington, D.C., No.
10-3018, 2010.
9. Laporte, G., J. A. Mesa, and F. A. Ortega. Assessing the efficiency of rapid transit
configurations. Top, Vol. 5, No. 1, 1997, pp. 95-104.
10. Saidi, S., S. C. Wirasinghe, and L. Kattan. Rail Transit – An Exploration with Emphasis
on Ring Lines. In Transportation Research Record: Journal of the Transportation
Research Board, No. 2419. Transportation Research Board of the National Academies,
Washington, D.C., Transit 2014, Vol. 5, 2014, pp. 23-32.
11. Vuchic V. Planning, design and operation of rail transit networks. Metro Report
International. 2014, pp. 48-53.
12. China Daily. Beijing welcomes second loop subway line, 2013.
http://usa.chinadaily.com.cn/china/2013-05/05/content_16477387.htm , Accessed July 6,
2015.
13. Freemark, Y. Paris Region Moves Ahead with 125 Miles of New Metro Lines. The
Transport Plitic, 2011, http://www.thetransportpolitic.com/2011/05/27/paris-region-
moves-ahead-with-125-miles-of-new-metro-lines. accessed July 9, 2015.
14. Panin, A. New Metro Ring Line On Track for 2018, The Moscow Times, Feb 2014,
http://www.themoscowtimes.com/business/article/new-metro-ring-line-on-track-for-
2018/493979.html.
15. Bai, Y. and S. Yan. Shanghai outer ring road’s congestion and planning to build metro
2nd ring line, Shidai Newspaper, Feb 2013, http://sh.sina.com.cn/news/b/2013-02-
01/075532968.html
16. Saidi. S., S.C. Wirasinghe, and L. Kattan. Long Term Planning for Ring-Radial Urban
Rail Transit Networks. Tech Report, 2015.
17. Shanghai Shentong Metro Group Operations Management Department. Metro micro
data. http://weibo.com/1742987497/CFthkl8i7. Accessed November 2, 2015.
18. Anan, M. Absolute Confidential: Shanghai subway construction in the history of the
seven little-known story. 2013. JFDaily. http://data.jfdaily.com/a/6187027.htm .
Accessed July 7, 2015.
19. Shanghai Transportation Trade Association. The charm of high-speed railway. 2009.
http://www.shcti.cn/cc/vxhhk.jsp?hkid=14&zbtid=242. Accessed July 2, 2015.
19
TRB 2016 Annual Meeting Paper revised from original submittal.
20. Officials at Shanghai City Comprehensive Transportation Planning Institute. May 2015.
Personal communication.
21. Xinhuanet. Shanghai Rail Transit Line test run today. 2010.
http://www.sh.xinhuanet.com/2003-11/25/content_1251436.htm. Accessed June 31,
2015. (http://baike.baidu.com/view/1199987.htm)
22. Baidu. Shanghai Rail Transit Line 10. http://baike.baidu.com/view/947444.htm .
Accessed May 16, 2015.
23. Baidu. Shanghai Rail Transit Line 11. http://baike.baidu.com/view/947316.htm.
Accessed May 16, 2015.
24. Smith, S. Why China’s Subway Boom Went Bust. CityLab. 2012.
http://www.citylab.com/commute/2012/09/why-chinas-subway-boom-went-bust/3207.
Accessed July 2, 2015.
25. Dingding, X., W. Xiaodong and S. Yingying. Subway Costs feared to go off the rails.
China Daily. 2012. http://usa.chinadaily.com.cn/china/2012-
07/31/content_15633448.htm
26. Shang, B. and X. Zhang. Study of Urban Rail Transit Operation Costs, In Procedia -
Social and Behavioral Sciences, Vol 96, 2013, pp. 565-573,
http://dx.doi.org/10.1016/j.sbspro.2013.08.066.
27. Pan, H., Shen, Q., and X. Song Xue. Intermodal Transfer between Bicycles and Rail
Transit in Shanghai, China. In Transportation Research Record: Journal of the
Transportation Research Board, No 2144, Transportation Research Board of the
National Academies, Washington, D.C., 2010, pp. 181–188.
28. Lu, X. and Gu, X. The fifth Travel Survey of Residents in Shanghai and Characteristics
Analysis. In Urban of Transport of China, 2011, Vol. 9, No. 5, pp. 1-7.
29. Guan, J., and D. Yang. Travel Behavior of Two Major Groups in Large Scale
Residential Areas in the Periphery of Shanghai: A Case Study of Jinhexincheng, Jiading
District. Transportation Research Board 92nd Annual Meeting, Washington, D.C., No.
13-0510. 2013.
30. Guan, J. Residents' Characteristics and Transport Policy Analysis in Large-Scale
Residential Areas on City Periphery: Case Study of Jinhexincheng, Shanghai, China. In
Transportation Research Record: Journal of the Transportation Research Board, No.
15-0846, Transportation Research Board of the National Academies, Washington, D.C.,
2015.
31. Jiang, Y., Li, T., and R.F. Di Bona. Value of Travel Time: an SP Survey in Tianjin. In
Urban Transport of China, Vol. 7, 2009, pp. 68–73.
20
TRB 2016 Annual Meeting Paper revised from original submittal.
32. Guan, J. Travel Behavior of Large Scale Residential Areas on City Periphery, case study
of Shanghai, Shanghai. Tongji University Thesis, 2015.
33. Badia, H., M. Estrada, and F. Robusté. Competitive Transit Network Design in Cities
with Radial Street Patterns. In Transportation Research Part B: Methodological, 2014,
Vol. 59, pp 161-181.
34. Tirachini, A., D.A. Hensher, and S.R. Jara-Díaz. Comparing Operator and Users Costs
of Light Rail, Heavy Rail and Bus Rapid Transit Over a Radial Public Transport
Network, In Research in Transportation Economics, 2010, Vol. 29, pp 231-242.
35. Tsekeris, T. and N. Geroliminis. City Size, Network Structure and Traffic congestion.
In Journal of Urban Economics, 2013, Vol. 76, pp 1–14.
36. Cox, W. China’s Shifting Population Growth Patterns. New Geography. 2015.
http://www.newgeography.com/content/004904-chinas-shifting-population-growth-
patterns Accessed July 2, 2015.