Embed Size (px)
Citation preview
Queensland Reconstruction Authority
Part 1 – Interim measures to support floodplain management in existing planning schemes
Planning for stronger, more resilient floodplains
The Authority acknowledges the following organisations that have provided their support to this important program of work:
• Geoscience Australia
• Banana Shire Council
• Fitzroy Basin Association
• Central Highlands Regional Council
• Local Government Association of Queensland
• Bureau of Meteorology
• CSIRO
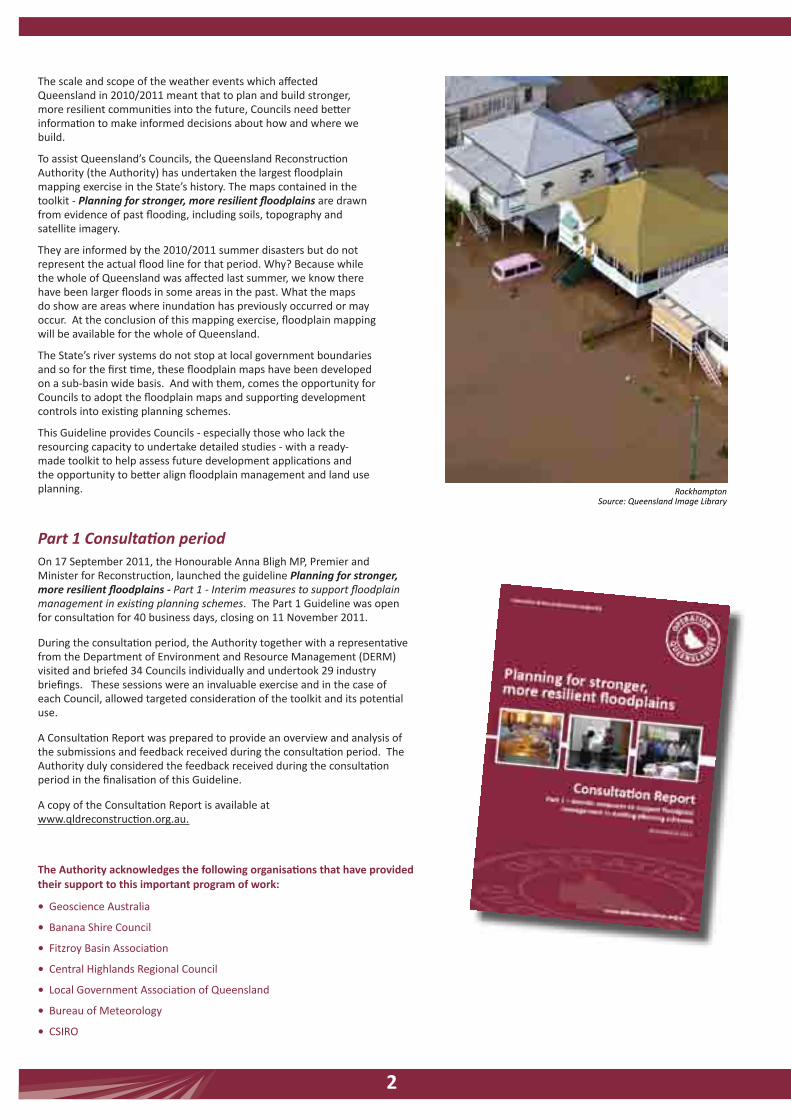
The scale and scope of the weather events which affected Queensland in 2010/2011 meant that to plan and build stronger, more resilient communities into the future, Councils need better information to make informed decisions about how and where we build.
To assist Queensland’s Councils, the Queensland Reconstruction Authority (the Authority) has undertaken the largest floodplain mapping exercise in the State’s history. The maps contained in the toolkit - Planning for stronger, more resilient floodplains are drawn from evidence of past flooding, including soils, topography and satellite imagery.
They are informed by the 2010/2011 summer disasters but do not represent the actual flood line for that period. Why? Because while the whole of Queensland was affected last summer, we know there have been larger floods in some areas in the past. What the maps do show are areas where inundation has previously occurred or may occur. At the conclusion of this mapping exercise, floodplain mapping will be available for the whole of Queensland.
The State’s river systems do not stop at local government boundaries and so for the first time, these floodplain maps have been developed on a sub-basin wide basis. And with them, comes the opportunity for Councils to adopt the floodplain maps and supporting development controls into existing planning schemes.
This Guideline provides Councils - especially those who lack the resourcing capacity to undertake detailed studies - with a ready-made toolkit to help assess future development applications and the opportunity to better align floodplain management and land use planning.
Part 1 Consultation period On 17 September 2011, the Honourable Anna Bligh MP, Premier and Minister for Reconstruction, launched the guideline Planning for stronger, more resilient floodplains - Part 1 - Interim measures to support floodplain management in existing planning schemes. The Part 1 Guideline was open for consultation for 40 business days, closing on 11 November 2011.
During the consultation period, the Authority together with a representative from the Department of Environment and Resource Management (DERM) visited and briefed 34 Councils individually and undertook 29 industry briefings. These sessions were an invaluable exercise and in the case of each Council, allowed targeted consideration of the toolkit and its potential use.
A Consultation Report was prepared to provide an overview and analysis of the submissions and feedback received during the consultation period. The Authority duly considered the feedback received during the consultation period in the finalisation of this Guideline.
A copy of the Consultation Report is available at www.qldreconstruction.org.au.
Rockhampton Source: Queensland Image Library
2
Key information is provided throughout this Guideline. It is marked with this symbol. It has been provided courtesy of the Queensland Floods Science, Engineering and Technology Panel Understanding Floods – Questions and Answers.A full copy of this document can be downloaded from: www.chiefscientist.qld.gov.au
The journey towards stronger, more resilient floodplains
Most of our towns and cities are located on floodplains, both inland and coastal. This is an historical fact, principally for reasons associated with water supply, transportation, waste disposal, advantageous points for river crossings, access to productive soils or recreation purposes. Hence, these towns and cities will be subject to flooding from time to time.
Put simply, if we are to use floodplains for these purposes, we need to acknowledge and plan for flooding in a way that improves resilience of our built form and encourages the safety and well being for our communities and individuals.
Seeing significant change in Queensland’s floodplains will be generational – the full implementation of this improved resilience will be seen over time through specific shifts in local land use planning policy and development assessment decision-making that take account of the vulnerabilities of development in the floodplain. However, through interim changes to the way development is addressed in these risk areas, real steps can be taken now to ensure new development in Queensland’s floodplains considers and responds to adverse flood events.
The key to ensuring our State copes with these flood events is improving the resilience of our communities. In response, the Authority has prepared the two-part Guideline Planning for stronger, more resilient floodplains.
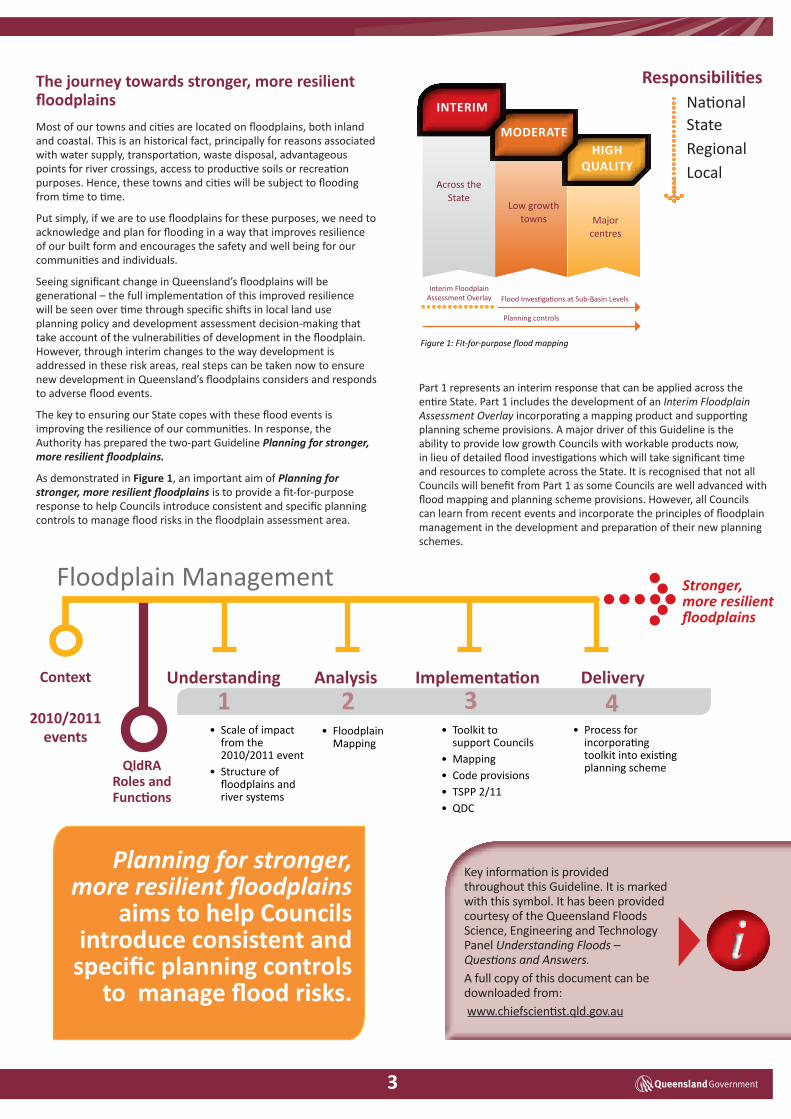
As demonstrated in Figure 1, an important aim of Planning for stronger, more resilient floodplains is to provide a fit-for-purpose response to help Councils introduce consistent and specific planning controls to manage flood risks in the floodplain assessment area.
Part 1 represents an interim response that can be applied across the entire State. Part 1 includes the development of an Interim Floodplain Assessment Overlay incorporating a mapping product and supporting planning scheme provisions. A major driver of this Guideline is the ability to provide low growth Councils with workable products now, in lieu of detailed flood investigations which will take significant time and resources to complete across the State. It is recognised that not all Councils will benefit from Part 1 as some Councils are well advanced with flood mapping and planning scheme provisions. However, all Councils can learn from recent events and incorporate the principles of floodplain management in the development and preparation of their new planning schemes.
Understanding Analysis Implementation Delivery 1 2 3 4
Stronger, more resilient floodplains
Context
2010/2011 events
Floodplain Management
• Scale of impact from the 2010/2011 event
• Structure of floodplains and river systems
QldRA Roles and Functions
• Toolkit to support Councils
• Mapping• Code provisions• TSPP 2/11• QDC
• Floodplain Mapping
• Process for incorporating toolkit into existing planning scheme
HigH QUAlITy
MoDeRATe
Responsibilities
inteRim
Across the State
Low growth towns Major
centres
Interim Floodplain Assessment Overlay Flood Investigations at Sub-Basin Levels
Planning controls
StateNational
RegionalLocal
Planning for stronger, more resilient floodplains
aims to help Councils introduce consistent and
specific planning controls to manage flood risks.
Figure 1: Fit-for-purpose flood mapping
3
The management of our floodplains is complex. Balancing the role of the floodplain from protection of agriculture and the environment, to stimulating economic growth and supporting new population growth is a difficult process to manage. Each has its role and arguably each is as important as the other.
To ensure that Queensland learns from the recent natural disasters the Authority has partnered with the Department of Local Government and Planning (DLGP) including Building Codes Queensland (BCQ), DERM and the Department of Community Safety (DCS) to deliver a body of work supporting greater resilience and understanding of our floodplains and to better inform and influence the land use planning process.
An outcome of this partnership is the development of the two-part Guideline, entitled Planning for stronger, more resilient floodplains. The Guideline raises awareness and represents the start of a journey to improve floodplain management throughout Queensland utilising the land use planning process.
Part 1 – Interim measures to support floodplain management in existing planning schemes delivers a toolkit that includes interim planning scheme measures and supporting mapping to those Councils who currently do not have any floodplain mapping. The mapping has been produced with the support of DERM and the mapping product provided represents an Interim Floodplain Assessment Overlay (Floodplain Maps). The Guideline also identifies a clear implementation path for those Councils that choose to adopt the interim code provisions and mapping.
Part 2 – Measures to support floodplain management in future planning schemes provides more detailed floodplain assessment guidance to Councils who are looking to prepare their new Planning Schemes under the Sustainable Planning Act 2009 (SPA).
In support of this process, the Authority has partnered with Banana Shire Council (BSC), a Council that was significantly affected by events in December 2010/ January 2011. Together with the Fitzroy Basin Association (FBA) the BSC will use both Part 1 and Part 2 to help improve the management of floodplains through the land use planning process.
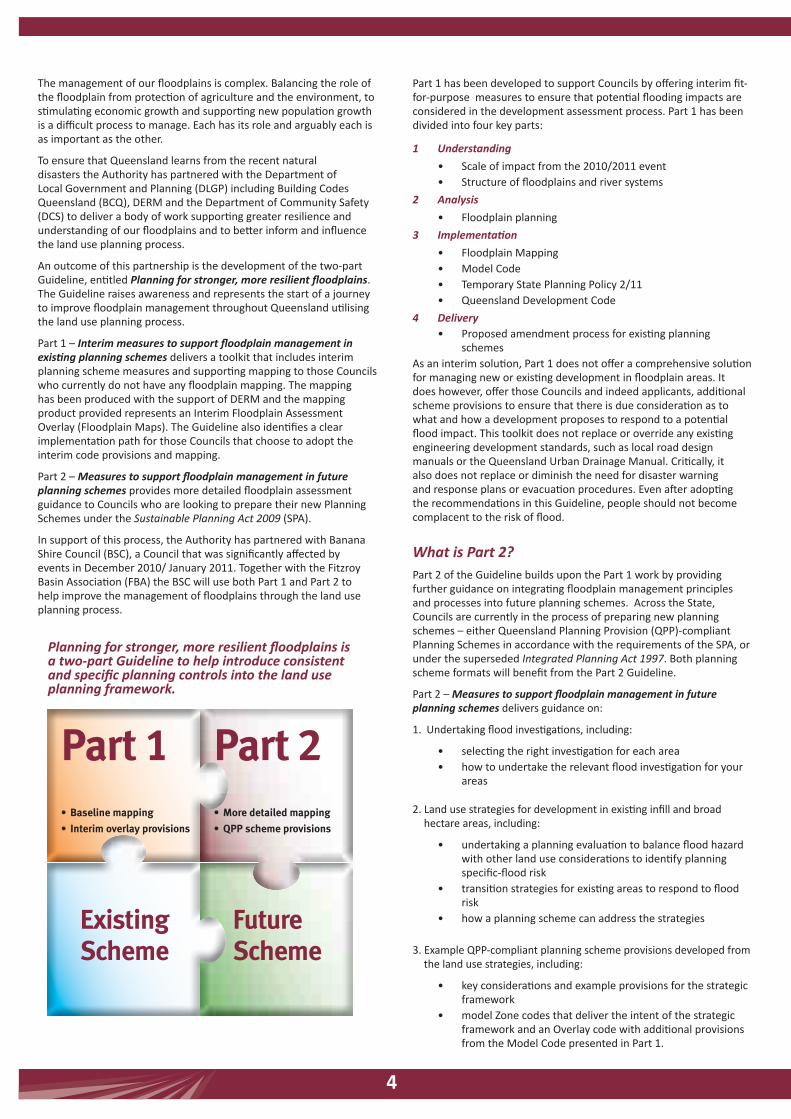
Part 1 has been developed to support Councils by offering interim fit-for-purpose measures to ensure that potential flooding impacts are considered in the development assessment process. Part 1 has been divided into four key parts:
1 Understanding
• Scale of impact from the 2010/2011 event• Structure of floodplains and river systems
2 Analysis
• Floodplain planning
3 Implementation
• Floodplain Mapping• Model Code• Temporary State Planning Policy 2/11• Queensland Development Code
4 Delivery • Proposed amendment process for existing planning
schemes As an interim solution, Part 1 does not offer a comprehensive solution for managing new or existing development in floodplain areas. It does however, offer those Councils and indeed applicants, additional scheme provisions to ensure that there is due consideration as to what and how a development proposes to respond to a potential flood impact. This toolkit does not replace or override any existing engineering development standards, such as local road design manuals or the Queensland Urban Drainage Manual. Critically, it also does not replace or diminish the need for disaster warning and response plans or evacuation procedures. Even after adopting the recommendations in this Guideline, people should not become complacent to the risk of flood.
What is Part 2? Part 2 of the Guideline builds upon the Part 1 work by providing further guidance on integrating floodplain management principles and processes into future planning schemes. Across the State, Councils are currently in the process of preparing new planning schemes – either Queensland Planning Provision (QPP)-compliant Planning Schemes in accordance with the requirements of the SPA, or under the superseded Integrated Planning Act 1997. Both planning scheme formats will benefit from the Part 2 Guideline.
Part 2 – Measures to support floodplain management in future planning schemes delivers guidance on:
1. Undertaking flood investigations, including:
• selecting the right investigation for each area• how to undertake the relevant flood investigation for your
areas
2. Land use strategies for development in existing infill and broad hectare areas, including:
• undertaking a planning evaluation to balance flood hazard with other land use considerations to identify planning specific-flood risk
• transition strategies for existing areas to respond to flood risk
• how a planning scheme can address the strategies
3. Example QPP-compliant planning scheme provisions developed from the land use strategies, including:
• key considerations and example provisions for the strategic framework
• model Zone codes that deliver the intent of the strategic framework and an Overlay code with additional provisions from the Model Code presented in Part 1.
4
FutureScheme
Part 1• Baseline mapping• Interim overlay provisions
Part 2• More detailed mapping• QPP scheme provisions
Existing Scheme
Planning for stronger, more resilient floodplains is a two-part Guideline to help introduce consistent and specific planning controls into the land use planning framework.
4
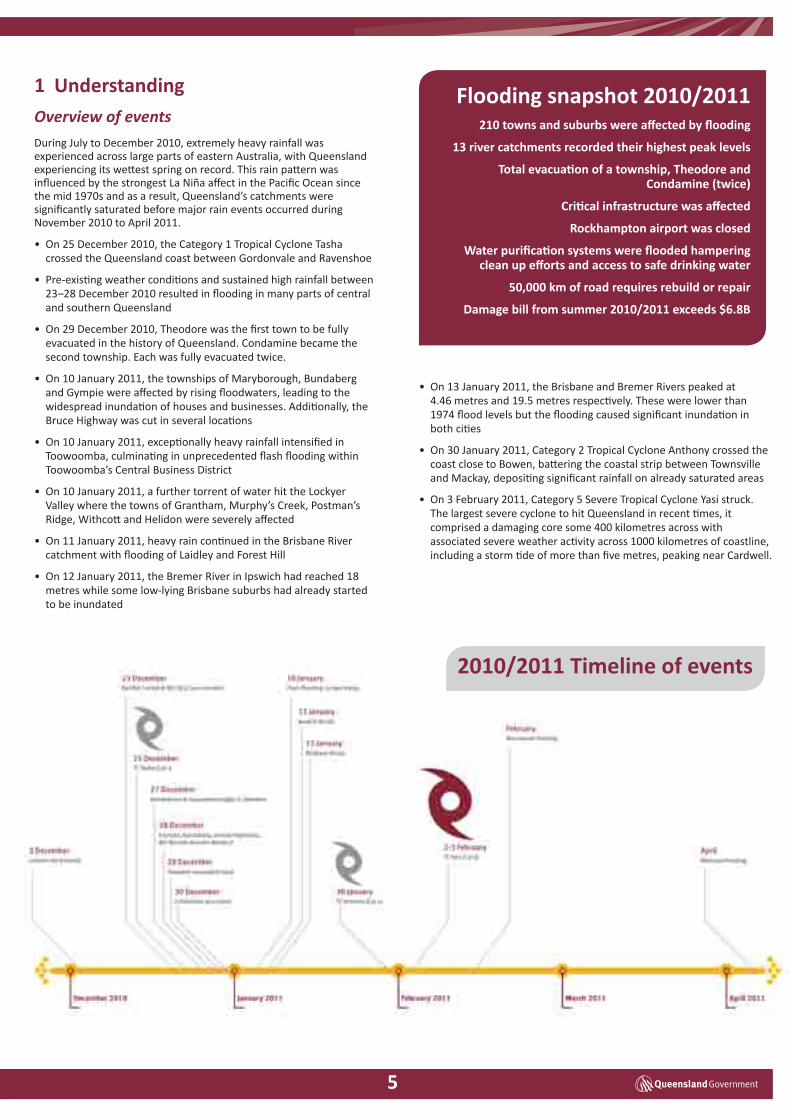
1 UnderstandingOverview of events During July to December 2010, extremely heavy rainfall was experienced across large parts of eastern Australia, with Queensland experiencing its wettest spring on record. This rain pattern was influenced by the strongest La Niña affect in the Pacific Ocean since the mid 1970s and as a result, Queensland’s catchments were significantly saturated before major rain events occurred during November 2010 to April 2011.
• On 25 December 2010, the Category 1 Tropical Cyclone Tasha crossed the Queensland coast between Gordonvale and Ravenshoe
• Pre-existing weather conditions and sustained high rainfall between 23–28 December 2010 resulted in flooding in many parts of central and southern Queensland
• On 29 December 2010, Theodore was the first town to be fully evacuated in the history of Queensland. Condamine became the second township. Each was fully evacuated twice.
• On 10 January 2011, the townships of Maryborough, Bundaberg and Gympie were affected by rising floodwaters, leading to the widespread inundation of houses and businesses. Additionally, the Bruce Highway was cut in several locations
• On 10 January 2011, exceptionally heavy rainfall intensified in Toowoomba, culminating in unprecedented flash flooding within Toowoomba’s Central Business District
• On 10 January 2011, a further torrent of water hit the Lockyer Valley where the towns of Grantham, Murphy’s Creek, Postman’s Ridge, Withcott and Helidon were severely affected
• On 11 January 2011, heavy rain continued in the Brisbane River catchment with flooding of Laidley and Forest Hill
• On 12 January 2011, the Bremer River in Ipswich had reached 18 metres while some low-lying Brisbane suburbs had already started to be inundated
• On 13 January 2011, the Brisbane and Bremer Rivers peaked at 4.46 metres and 19.5 metres respectively. These were lower than 1974 flood levels but the flooding caused significant inundation in both cities
• On 30 January 2011, Category 2 Tropical Cyclone Anthony crossed the coast close to Bowen, battering the coastal strip between Townsville and Mackay, depositing significant rainfall on already saturated areas
• On 3 February 2011, Category 5 Severe Tropical Cyclone Yasi struck. The largest severe cyclone to hit Queensland in recent times, it comprised a damaging core some 400 kilometres across with associated severe weather activity across 1000 kilometres of coastline, including a storm tide of more than five metres, peaking near Cardwell.
Flooding snapshot 2010/2011210 towns and suburbs were affected by flooding
13 river catchments recorded their highest peak levels
Total evacuation of a township, Theodore and Condamine (twice)
Critical infrastructure was affected
Rockhampton airport was closed
Water purification systems were flooded hampering clean up efforts and access to safe drinking water
50,000 km of road requires rebuild or repair
Damage bill from summer 2010/2011 exceeds $6.8B
2010/2011 Timeline of events
5
Flooding and floodplains
Australia’s floodplains are the commercial, social and ecological arteries of the nation. As such they constitute a national asset: an asset subject to damage when floods occur.
Most of our towns and cities are located on floodplains, both inland and coastal. This is an historical fact, principally for reasons associated with water supply, transportation, waste disposal, advantageous points for river crossings, access to productive soils or recreation purposes. Hence, these towns and cities subject to flooding from time to time.
Over time, uses in these areas have also become entrenched and in more recent times lifestyle, mobility and consumer sentiment has meant that these areas continue to be used for a range of commercial, social and ecological purposes. While these uses remain, so too will the potential risks when floods occur.
Put simply, if we are to use floodplains for these purposes, we need to acknowledge and plan for flooding in a way that improves resilience of our built form and encourages the safety and well being for our communities and individuals.
In Australia, flooding can be caused by four different mechanisms: heavy rainfall, storm surge, tsunami and dam failure. Rainfall and storm surge flooding create the most common and significant threats to social and economic well being of flood-prone communities. Tsunami and dam failure can result in catastrophic damage and likely loss of life. The probability of this type of flooding in Australia is low.
Thus, as devastating as recent events have been, they are not unique: 77 floods were recorded in Australia in the last 35 years of the 20th century; eight major floods were recorded in Australia in the 19th century and six in the first decade of the 21st century. Nature will undoubtedly continue to surprise us.
Floodplains are generally the more fertile areas of the continent. A significant proportion of Australia’s agricultural output is produced on floodplains including irrigated agriculture. Regular flooding of these areas enhances agriculture by increasing soil moisture.
Cost of flooding
In Australia, floods are the most expensive type of natural disaster with direct costs for the period from 1967 to 2005 estimated at an average of $377 million per year (calculated in 2008 dollars).1
Until recently, the most expensive year for floods in Australia was 1974, when floods affecting New South Wales, Victoria and Queensland resulted in a total damage bill in today’s figures of $2.9 billion. The Queensland Government estimates costs for the 2010/2011 floods will exceed this figure with the damage to local government infrastructure estimated at $2.5 billion and the total damage to public infrastructure across the State at $6.8 billion.
1 Floodplain Management in Australia, Best Practice Principles and Guidelines, SCARM Report 73, CSIRO Publishing
What factors contribute to floods?Rainfall is the most important factor in creating a flood, but there are many other contributing factors. When rain falls on a catchment, the amount of rainwater that reaches the waterways depends on the characteristics of the catchment, particularly its size, shape and land use. Some rainfall is ‘captured’ by soil and vegetation, and the remainder enters waterways as flow. River characteristics such as size and shape, the vegetation in and around the river, and the presence of structures in and adjacent to the waterway all affect the level of water in the waterway.
Conversely, and as discussed in Section 3 – Implementation, flooding should be the most manageable type of natural disaster.
History of floodplain management
Floodplain management in Australia has evolved through four successive phases:
1. structural works
2. planning
3. flood emergency management
4. all-embracing management
During the structural works phase, predominantly in the 1970s, structural works (typically levees) were used to protect existing properties at risk. Little consideration was given to the use of levees and their potential impact on the environment, risk management planning or even land use planning. However, in 1974 a series of severe floods in New South Wales, Victoria and Queensland caused widespread and significant damage. The outcome was that a better understanding and regulation of levees was required.
In the 1980s and 1990s the importance of flood emergency management was brought into focus predominantly by the New South Wales Bogan River flood in April 1990 which required the forced evacuation of the town of Nyngan.
From the early 1990s the importance of an all-embracing approach to floodplain management was apparent with the States / Territories being far more advanced than previously in an integrated approach to floodplain management.
What exactly is floodplain management?
The objectives of floodplain management as determined by the Standing Committee on Agriculture and Resource Management (SCARM) are to:
• limit to acceptable levels the effect of flooding on the well-being, health and safety of flood-prone land, individuals and communities
• limit to acceptable levels the damage caused by flooding to private and public property
• ensure that the natural function of the floodplain – to convey and store floodwaters during a flood – is preserved
• encourage the planning and use of floodplains as a valuable and sustainable resource capable of multiple, but compatible, land uses of benefit to the community
6
Floodplain Management Process
Understanding how our river systems work here in Queensland acknowledges that an integrated approach to land use planning on floodplains is required to bring together the diverse issues and stakeholders that affect, or are affected by, floodplain management. This approach takes flooding hazard and risk into account, along with all other relevant planning factors.
The end product of this process is an approach to floodplain management that facilitates the use of the floodplain for appropriate purposes; limits flood risk, and damage to socially acceptable levels; enhances the waterway and floodplain environment; and fosters flood warning, response, evacuation, clean-up and recovery in the onset and aftermath of a flood.
Ultimately the preferred way to manage our floodplains is through an integrated and appropriate mix of measures which are specific for each floodplain area.
Floodplain Management in Australia – Best Practice Principles recommends the adoption of an approach to floodplain management at a total catchment (sub-basin) level beyond the LGA boundaries.
The comprehensive floodplain management process typically encompasses three sequential stages2:
• Flood Study – a technical investigation to determine the nature and extent of flooding
• Floodplain Risk Management Study – an options assessment which evaluates management measures and options for the floodplain in respect to both existing and future development
• Floodplain Management Plan – formal adoption of a plan of management for the floodplain.
The time scale for this process can be in excess of 2 years and includes extensive community consultation. It is well understood that comprehensive community consultation throughout the floodplain management process leads to greater community acceptance of the outcomes. Without appropriate community consultation the estimate of flood risk can often be incorrect. This Guideline should be seen as part of a continuum towards best practice in mapping and managing risk in floodplains.
2 Mark Babister, WMA Water, Natural Disaster Insurance Review August 2011
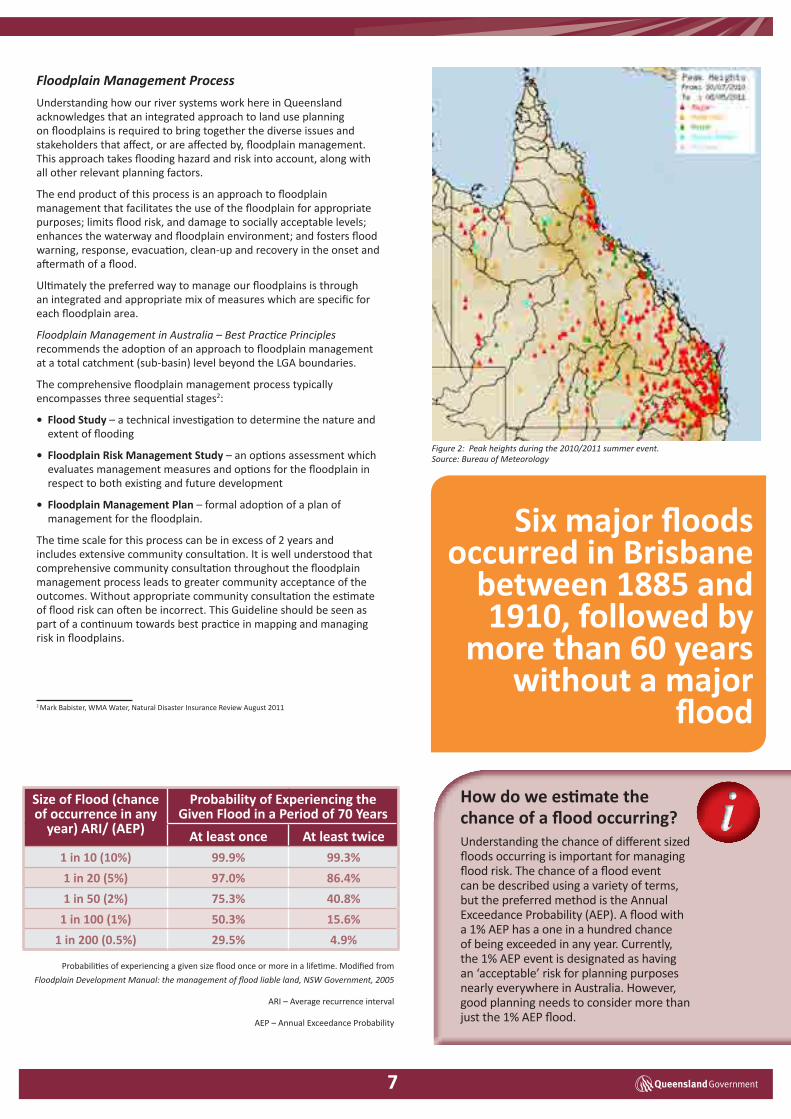
How do we estimate the chance of a flood occurring?Understanding the chance of different sized floods occurring is important for managing flood risk. The chance of a flood event can be described using a variety of terms, but the preferred method is the Annual Exceedance Probability (AEP). A flood with a 1% AEP has a one in a hundred chance of being exceeded in any year. Currently, the 1% AEP event is designated as having an ‘acceptable’ risk for planning purposes nearly everywhere in Australia. However, good planning needs to consider more than just the 1% AEP flood.
Size of Flood (chance of occurrence in any
year) ARI/ (AeP)
Probability of experiencing the Given Flood in a Period of 70 years
At least once At least twice 1 in 10 (10%) 99.9% 99.3%
1 in 20 (5%) 97.0% 86.4%
1 in 50 (2%) 75.3% 40.8%
1 in 100 (1%) 50.3% 15.6%
1 in 200 (0.5%) 29.5% 4.9%
Probabilities of experiencing a given size flood once or more in a lifetime. Modified from
Floodplain Development Manual: the management of flood liable land, NSW Government, 2005
ARI – Average recurrence interval
AEP – Annual Exceedance Probability
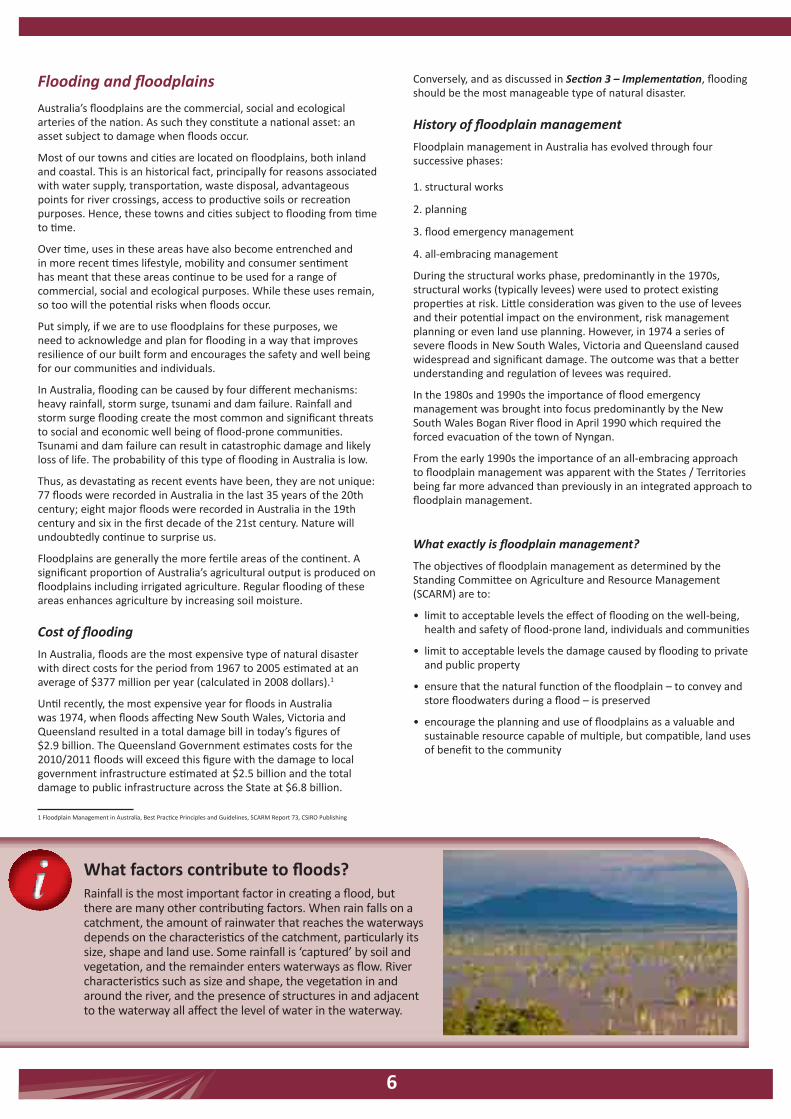
Figure 2: Peak heights during the 2010/2011 summer event. Source: Bureau of Meteorology
Six major floods occurred in Brisbane
between 1885 and 1910, followed by
more than 60 years without a major
flood
7
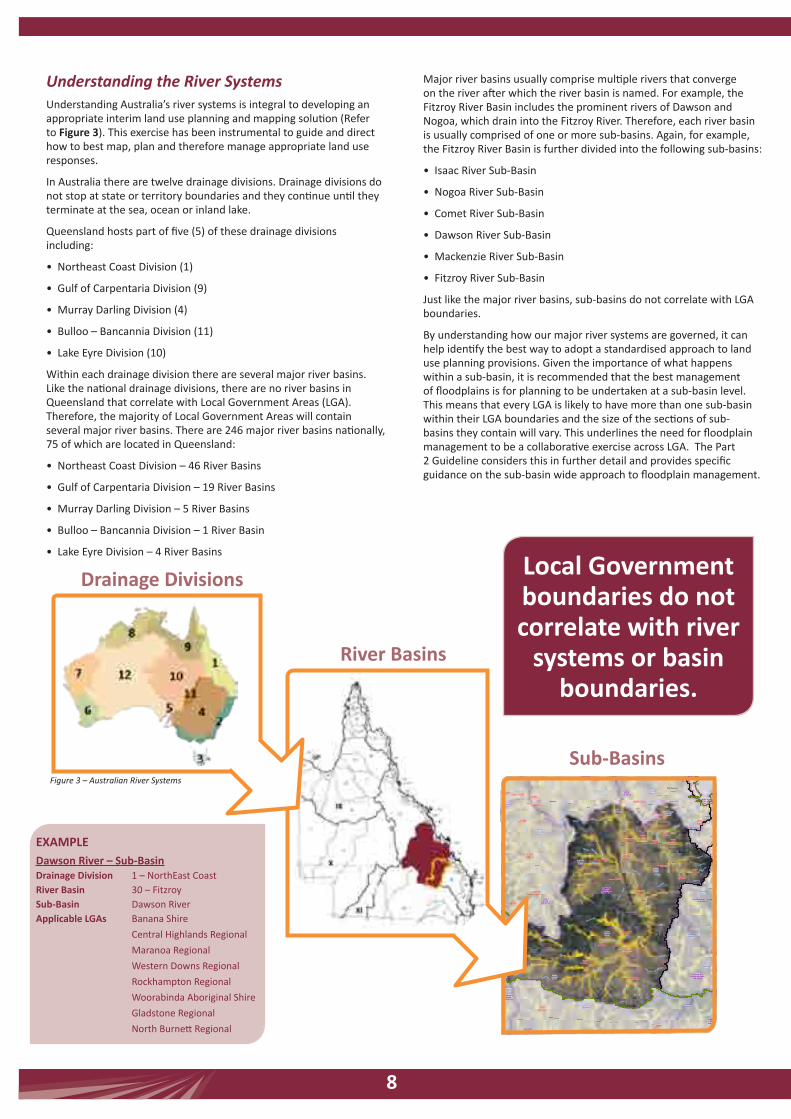
Understanding the River Systems Understanding Australia’s river systems is integral to developing an appropriate interim land use planning and mapping solution (Refer to Figure 3). This exercise has been instrumental to guide and direct how to best map, plan and therefore manage appropriate land use responses.
In Australia there are twelve drainage divisions. Drainage divisions do not stop at state or territory boundaries and they continue until they terminate at the sea, ocean or inland lake.
Queensland hosts part of five (5) of these drainage divisions including:
• Northeast Coast Division (1)
• Gulf of Carpentaria Division (9)
• Murray Darling Division (4)
• Bulloo – Bancannia Division (11)
• Lake Eyre Division (10)
Within each drainage division there are several major river basins. Like the national drainage divisions, there are no river basins in Queensland that correlate with Local Government Areas (LGA). Therefore, the majority of Local Government Areas will contain several major river basins. There are 246 major river basins nationally, 75 of which are located in Queensland:
• Northeast Coast Division – 46 River Basins
• Gulf of Carpentaria Division – 19 River Basins
• Murray Darling Division – 5 River Basins
• Bulloo – Bancannia Division – 1 River Basin
• Lake Eyre Division – 4 River Basins
Major river basins usually comprise multiple rivers that converge on the river after which the river basin is named. For example, the Fitzroy River Basin includes the prominent rivers of Dawson and Nogoa, which drain into the Fitzroy River. Therefore, each river basin is usually comprised of one or more sub-basins. Again, for example, the Fitzroy River Basin is further divided into the following sub-basins:
• Isaac River Sub-Basin
• Nogoa River Sub-Basin
• Comet River Sub-Basin
• Dawson River Sub-Basin
• Mackenzie River Sub-Basin
• Fitzroy River Sub-Basin
Just like the major river basins, sub-basins do not correlate with LGA boundaries.
By understanding how our major river systems are governed, it can help identify the best way to adopt a standardised approach to land use planning provisions. Given the importance of what happens within a sub-basin, it is recommended that the best management of floodplains is for planning to be undertaken at a sub-basin level. This means that every LGA is likely to have more than one sub-basin within their LGA boundaries and the size of the sections of sub-basins they contain will vary. This underlines the need for floodplain management to be a collaborative exercise across LGA. The Part 2 Guideline considers this in further detail and provides specific guidance on the sub-basin wide approach to floodplain management.
Figure 3 – Australian River Systems
River Basins
Sub-Basins
Drainage Divisions
CONDAMINERIVER
SUB-BASIN
WATERPARKCREEK
SUB-BASIN
SHOALWATERSUB-BASINISAAC RIVER
SUB-BASIN
BALONNERIVER
SUB-BASIN
NOGOARIVER
SUB-BASIN
MARANOARIVER
SUB-BASIN
BOYNE &AUBURN RIVERS
SUB-BASIN
UPPER BURNETT RIVERSUB-BASIN
COMETRIVER
SUB-BASIN
CURTISISLAND
SUB-BASIN
BOYNE RIVERSUB-BASIN
CALLIOPERIVER
SUB-BASIN
STYX RIVERSUB-BASIN
MACKENZIERIVER
SUB-BASIN
MISC OTHERISLANDS
SUB-BASIN
FITZROYRIVER
SUB-BASIN
DAWSONRIVER
SUB-BASIN
WAMBOPLANNINGSCHEME
BUNGILPLANNINGSCHEME
MURILLAPLANNINGSCHEME
BENDEMEREPLANNINGSCHEME
TAROOMPLANNINGSCHEME
WONDAIPLANNINGSCHEME
MUNDUBBERAPLANNINGSCHEME
EIDSVOLDPLANNINGSCHEME
BAUHINIAPLANNINGSCHEME
BANANAPLANNINGSCHEME
DUARINGAPLANNINGSCHEME
MONTOPLANNINGSCHEME
TARAPLANNINGSCHEME
WARROOPLANNINGSCHEME
FITZROYPLANNINGSCHEME
MOUNT MORGANPLANNINGSCHEME
BROADSOUNDPLANNINGSCHEME
PEAK DOWNSPLANNINGSCHEME
EMERALDPLANNINGSCHEME
BOORINGAPLANNINGSCHEME
CALLIOPEPLANNINGSCHEME
CHINCHILLAPLANNINGSCHEME
LIVINGSTONEPLANNINGSCHEME
Yaamba Taranganba
Princhester
Macalister
TheCaves
Wallumbilla
MountChalmers
Cawarral Emu Park
MulambinRosslyn
Tieri
Kogan
Stanwell
Condamine Warra
Brigalow
Jandowae
Muckadilla
Cracow
Yuleba TchanningJackson Dulacca Drillham
Miles Columboola
Amby
Hodgson Blythdale
Guluguba
Wandoan
Injune
Taroom
Redbank
Eidsvold
Cynthia
RawbelleKapaldo
Mulgildie
Theodore
Monto
Moonford
Bauhinia
RollestonBanana
Thangool
Jambin
Callide
Woorabinda
Baralaba
Goovigen
Wowan
Dululu
AmbroseMount
Larcom
Yarwun
Dingo
DuaringaBoolburra
Gogango
Westwood
Marmor
Bajool
Raglan
Comet Bluff
Kabra
Bouldercombe
Gracemere
KeppelSands
SouthYaamba
Roma
Moura
Biloela
MountMorgan
Emerald
Blackwater
Chinchilla
Yeppoon
Rockhampton
Con damin e Ri ver
Three Moon
Creek
Rop
er C
reek
Sandy
C re ek
Am
b
y C
reek
Humbo
ld t Creek
R uined Castl e C r eek
Ca l lid e C reek
Six M
ile Cr
ee
k
Lorra
ine Cre
e k
Eu rombah Creek
Euro mb ah Cre
ek
Concili ation Creek
Wa
m
bo Cre
ek
Banana
Creek
Sprin gton Creek
Oa ky C reek
Duck
worth Cre ek
Calli
de Cr
e
ek
In
june Creek
Par
ker C
reek
Twel ve
Mi le Creek
Mi m osa Cree k
M
i
mosa Creek
Ro
cky G
ully
No rth K
ar iboe
Cree k
Bell Cre ek
Wilk
ie
Cr eek
Moo layemb
er Cr
eek
Mu
ck
ad
illa
Cr
eek
Ca
stl e Cr ee k
Cameron Creek
Dawson River
Au
burn
River
Allig
at or Cr
ee
k
Yuleb a Creek
Wo le e
bee Cr
ee
k
North B unga
ban C reek
Spr ing sure
Creek
C ocka too Cre ek
Gr a
nt C
reek
Dawson Ri v er
Con damin
e Riv er
Fitzroy Rive
r
Fitzroy R i ve
r
Mur il la Cr
eek
Bo
ne Cr eek
Un
dulla
Creek
Kroombi t Cree k
Z
amia Creek
Za mia Cre ek
The resa Creek
Mercu
rah C
reek
Lonesome Creek
Ca llio
pe Ri v er
Charley Creek
Mar
lbor
ough C
reek
Ro cky Creek
Mack enzie River
R agla
n Cre
ek
Fitzroy R
iver
M
acken
zie River
M eteor
Cr
eek
Y
ule
ba Cr
eek
Blackwater Creek
St John Creek
Juan
dah C
reek
Clema
tis Creek
Carnarvon Creek
Bu
r rab
u rri
Creek
Sa rdine Cre ek
Do n River
Bu nga
ba
n Cre ek
De e Rive r
Cons
ue
l o Creek
Daws
on River
Tch
annin
g Creek
Bul lar oo Creek
C ooroo ra Creek
Dogwood Cre ek
Dogwoo d Creek
M inerva Creek
Ho
rse Cr
ee
k
Bun
gew
or g orai Creek
Cogoon River
Nogo
R iver
Baff le Creek
Sp
ring Creek
Bun g i l C
r eek
Bu
ngil Creek
Darga l Creek
St ock
yard Cree
k
Fish
Cre
ek
Char
lev
ue Creek
Ki
ang a Creek
Bro
wn
Rive
r
Nogoa River
D
ulacca Creek
Bur
gagay
Creek
Com
et Ri
ver
San
dhurst Creek
Palm Tre e Cre
ek
Gre v illea Cree k
Plan
et C
reek
Catt
le Cre
ek
C
e ntr a l Cree k
Yalebo ne Creek
Blackboy C reek
Robinson Cr ee k
Ro bi nso
n Creek
Cad
arga
Cree
k
Nudley Creek
Ce
nt re Creek
Co
me t River
Dawso
n R
iver
Blyt
h Cr eek
Hu tt on Creek
Ba lonn
e R
ive
r
Cooranga C reek
Aubu
rn Rive
r
Charl ey s C reek
Dawson Riv
er
Jo
hns
on Cr
ee
k
ISAAC REGIONAL
MARANOAREGIONAL
WESTERN DOWNS REGIONAL
NORTH BURNETT REGIONAL
BANANA SHIRE
CENTRALHIGHLANDSREGIONAL
GLADSTONEREGIONAL
ROCKHAMPTONREGIONAL
GaugingStation No.130316A
Gauging StationNo.130317B
GaugingStation
No.130319A
Gauging StationNo.130322A
GaugingStation
No.130324A
GaugingStation
No.130327A
GaugingStationNo.130334A
Gauging StationNo.130335A
GaugingStation
No.130336A
Gauging StationNo.130344A
Gauging StationNo.130348A
GaugingStation
No.130349A
GaugingStation No.130363A
GaugingStationNo.130374A
GaugingStation
No.130375A
GaugingStation No.130502B
GaugingStation No.130504B
Gauging StationNo.130506A
Gauging StationNo.130302A
GaugingStation
No.130510A
GaugingStation
No.132001A
GaugingStation
No.136101C
GaugingStation No.136103B
Gauging StationNo.136106A
GaugingStation
No.136108A
GaugingStationNo.136305A
GaugingStationNo.136306A
Gauging StationNo.422202B
GaugingStation
No.422210A
GaugingStationNo.422219A
GaugingStation
No.422220A
GaugingStation
No.422308C
GaugingStation No.130003B
Gauging StationNo.422336A
Gauging StationNo.422343A
GaugingStationNo.422344A
Gauging StationNo.129001A
GaugingStationNo.130004A
GaugingStation
No.130005A
GaugingStation No.130509A
Gauging StationNo.130105A
GaugingStation
No.130113A
Gauging StationNo.130206A Gauging
Station No.130219A
GaugingStation
No.130306B
Gauging StationNo.130313A
GaugingStation
No.422325A
151°0'0"E
151°0'0"E
150°30'0"E
150°30'0"E
150°0'0"E
150°0'0"E
149°30'0"E
149°30'0"E
149°0'0"E
149°0'0"E
148°30'0"E
148°30'0"E
23°0
'0"S
23°0
'0"S
23°3
0'0"
S
23°3
0'0"
S
24°0
'0"S
24°0
'0"S
24°3
0'0"
S
24°3
0'0"
S
25°0
'0"S
25°0
'0"S
25°3
0'0"
S
25°3
0'0"
S
26°0
'0"S
26°0
'0"S
26°3
0'0"
S
26°3
0'0"
S
27°0
'0"S
27°0
'0"S
INTERIM FLOODPLAIN ASSESSMENT OVERLAYDAWSON RIVER SUB-BASIN
2011 V1.1
ESRI ArcGIS Online Imagery Basemap
Digital Cadastral Database (DCDB) is current at November 2011. Positional accuracy representing the 'maximum error' has been calculated at ± 57 metres.
For more information regarding the capture of this line please see the Foreword at the front of thesub-basin atlases.
The average accuracy of the data is plus or minus 25 metres in the horizontal position.
Dawson River
Fitzroy
North East Coast
Horizontal - Geocentric Datum of Australia 1994 (GDA94)
Horizontal - Geocentric Datum of Australia 1994 (GDA94)
Graticule lines are at 30 minute intervals
Imagery:
Cadastre:
Floodplain Assessment Overlay:
Watercourses:
Drainage Sub-Basin:
Drainage Basin:
Drainage Division:
Datum:
Projection:
Graticule:
MAP INFORMATION
0 5 10 15 20 25 30 35 401 2 3 4
Kilometers
LEGEND
Drainage Divisions
Drainage Basins
!\ Gauging Station
Planning Scheme Boundaries
Current Local Government Boundaries
Cadastre
Interim Floodplain Assessment Overlay
Major Watercourses
Original Size is A1
Map No.:
Technical enquiries:The ManagerGIS Mapping Services (Client Outcomes), Spatial Information GroupDepartment of Environment and Resource ManagementGPO Box 2454, Brisbane QLD 4001
While every care is taken to ensure the accuracy of this data, the Department of Environment and Resource Management, and/orcontributors to this publication, makes no representations or warranties about its accuracy, reliability, completeness or suitability for anyparticular purpose and disclaims all responsibility and all liability (including without limitation, liability in negligence) for all injuries,expenses, losses, damages (including indirect or consequential damage) and costs which might be incurred as a result of the databeing inaccurate or incomplete in any way or for any reason.
SCALE 1:600000
© The State of Queensland (Department of Environment and Resource Management) 2011. Imagery © ESRI 2009.
Produced for the Queensland Reconstruction Authority by the Department of Environment and Resource Management, November 2011.
OV1303.
eXAMPle Dawson River – Sub-BasinDrainage Division 1 – NorthEast CoastRiver Basin 30 – FitzroySub-Basin Dawson RiverApplicable lGAs Banana Shire
Central Highlands Regional
Maranoa Regional
Western Downs Regional
Rockhampton Regional
Woorabinda Aboriginal Shire
Gladstone Regional
North Burnett Regional
local Government boundaries do not correlate with river
systems or basin boundaries.
8
2 Analysis
The recent flood events seen across the State have highlighted the importance of considered land use planning that responds to the risks presented by natural hazards and particularly flooding.
As per current best practice principles the approach to floodplain management is best undertaken at a total catchment (sub-basin) level.
This sub-basin approach is needed in order to manage effectively the result of existing development and the cumulative effects of future development on stormwater and mainstream flooding. It includes both the upstream and downstream implications of proposed land use developments and floodplain management activities.
This approach requires collaboration from many stakeholders to support the ultimate goal of integrated management of our floodplains and therefore should extend beyond the development assessment process.
Traditionally a flood study is a comprehensive technical investigation of flooding behaviour that defines the extent, depth and velocity of floodwaters for floods of various magnitudes.
There are two principle components to a conventional flood study:
Hydrologic analysis or estimation of flood discharges for floods of various magnitudes.
Hydraulic analysis or determination of the extent, depths and velocities of flooding.
This level of detail is not always required or necessary to facilitate improved floodplain management particularly in areas where there is limited population and/or growth. The Part 2 Guideline provides further detail on an alternative fit-for-purpose approach understanding the need to ensure land use planning gives due consideration to flood hazard and flood risk particularly in the preparation of future planning schemes.
In recognition of the time and cost to prepare detailed flood mapping and studies by Councils, the Authority, with the support of DERM, commenced a State-wide mapping exercise to establish interim mapping of floodplains at a sub-basin level. Acknowledging the need to improve the availability and quality of flood mapping across the State focus was initially applied to large areas of the State where no flood mapping existed. The mapping exercise has resulted in the development of a State-wide product known as the Interim Floodplain Assessment Overlay (Floodplain Maps).
level 0
No Flood Mapping
level 1
Interim Floodplain
Assessment Overlay
(Floodplain Maps & Code
Provisions)
level 2
Confirmed by Local
Government
level 3
Flood Investigations
(Sub-basin Level)
level 4
Flood Risk Management
Studies
level 5
Floodplain Management
Plan
Mitigation Works
Stronger, more resilient floodplains
Figure 4 – Flood Maturity Mapping Model
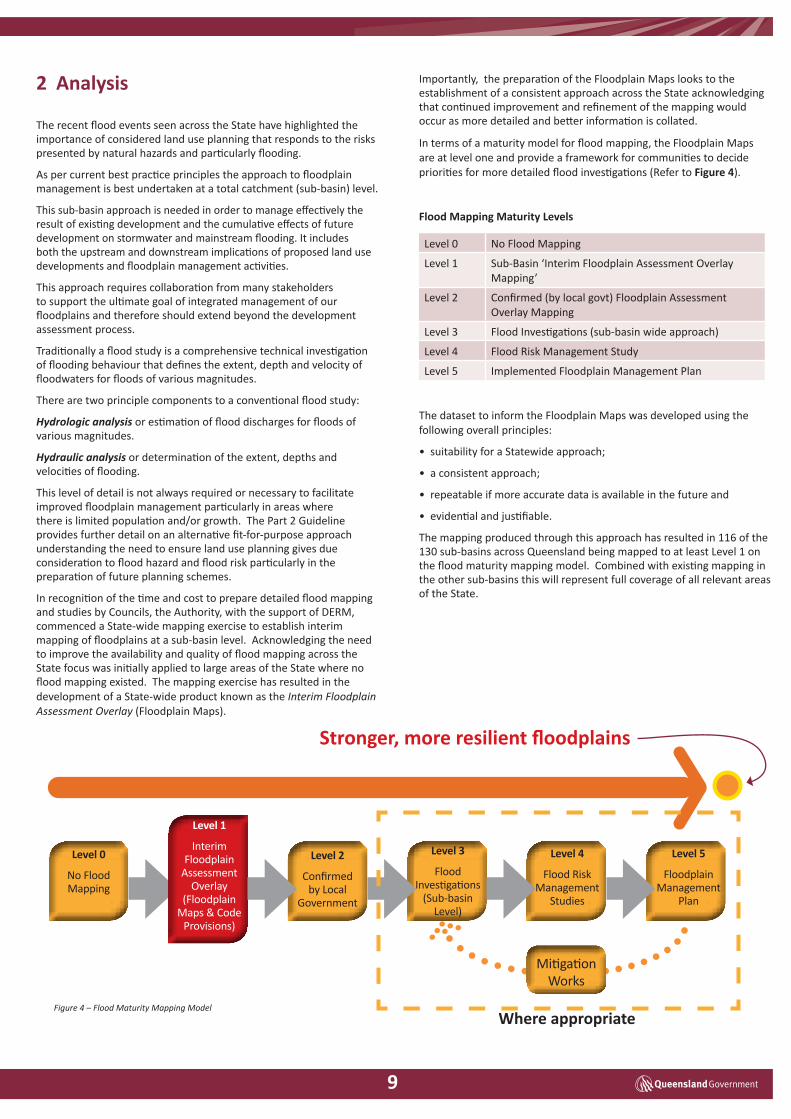
Importantly, the preparation of the Floodplain Maps looks to the establishment of a consistent approach across the State acknowledging that continued improvement and refinement of the mapping would occur as more detailed and better information is collated.
In terms of a maturity model for flood mapping, the Floodplain Maps are at level one and provide a framework for communities to decide priorities for more detailed flood investigations (Refer to Figure 4).
Flood Mapping Maturity levels
Level 0 No Flood Mapping
Level 1 Sub-Basin ‘Interim Floodplain Assessment Overlay Mapping’
Level 2 Confirmed (by local govt) Floodplain Assessment Overlay Mapping
Level 3 Flood Investigations (sub-basin wide approach)
Level 4 Flood Risk Management Study
Level 5 Implemented Floodplain Management Plan
The dataset to inform the Floodplain Maps was developed using the following overall principles:
• suitability for a Statewide approach;
• a consistent approach;
• repeatable if more accurate data is available in the future and
• evidential and justifiable.
The mapping produced through this approach has resulted in 116 of the 130 sub-basins across Queensland being mapped to at least Level 1 on the flood maturity mapping model. Combined with existing mapping in the other sub-basins this will represent full coverage of all relevant areas of the State.
Where appropriate
9
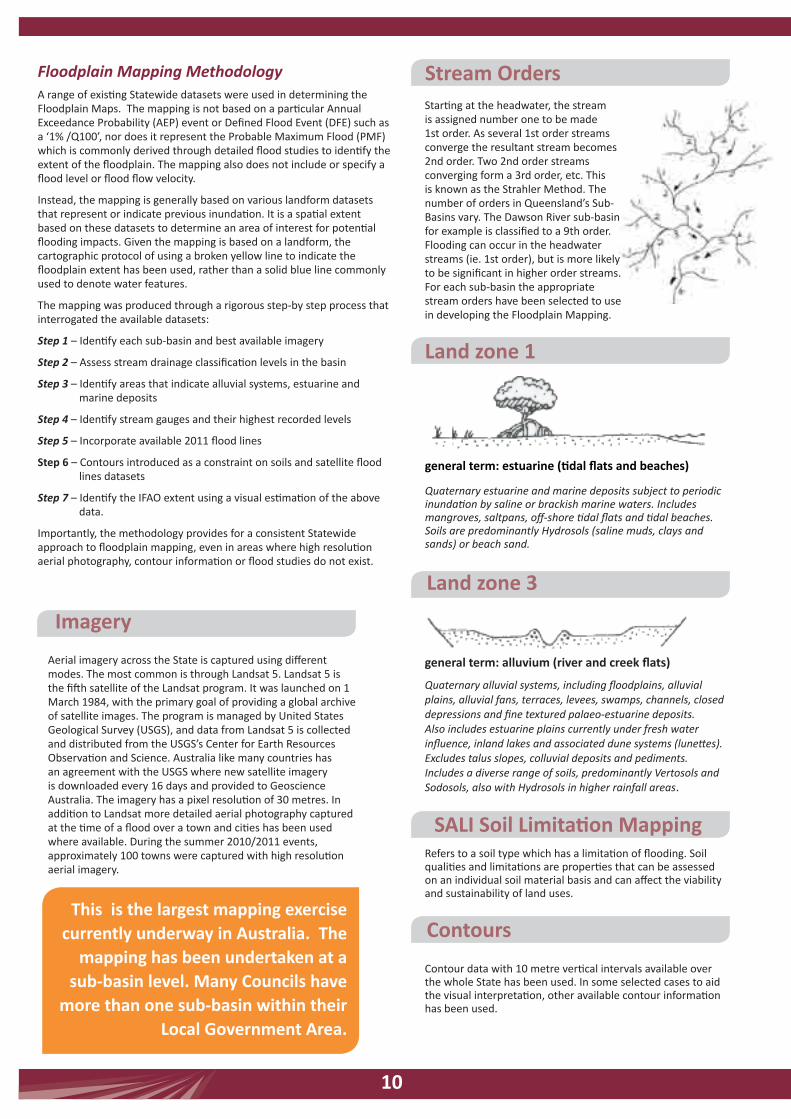
land zone 3
Contours
general term: alluvium (river and creek flats)
Quaternary alluvial systems, including floodplains, alluvial plains, alluvial fans, terraces, levees, swamps, channels, closed depressions and fine textured palaeo-estuarine deposits. Also includes estuarine plains currently under fresh water influence, inland lakes and associated dune systems (lunettes). Excludes talus slopes, colluvial deposits and pediments. Includes a diverse range of soils, predominantly Vertosols and Sodosols, also with Hydrosols in higher rainfall areas.
land zone 1
general term: estuarine (tidal flats and beaches)
Quaternary estuarine and marine deposits subject to periodic inundation by saline or brackish marine waters. Includes mangroves, saltpans, off-shore tidal flats and tidal beaches. Soils are predominantly Hydrosols (saline muds, clays and sands) or beach sand.
Refers to a soil type which has a limitation of flooding. Soil qualities and limitations are properties that can be assessed on an individual soil material basis and can affect the viability and sustainability of land uses.
Contour data with 10 metre vertical intervals available over the whole State has been used. In some selected cases to aid the visual interpretation, other available contour information has been used.
Floodplain Mapping Methodology A range of existing Statewide datasets were used in determining the Floodplain Maps. The mapping is not based on a particular Annual Exceedance Probability (AEP) event or Defined Flood Event (DFE) such as a ‘1% /Q100’, nor does it represent the Probable Maximum Flood (PMF) which is commonly derived through detailed flood studies to identify the extent of the floodplain. The mapping also does not include or specify a flood level or flood flow velocity.
Instead, the mapping is generally based on various landform datasets that represent or indicate previous inundation. It is a spatial extent based on these datasets to determine an area of interest for potential flooding impacts. Given the mapping is based on a landform, the cartographic protocol of using a broken yellow line to indicate the floodplain extent has been used, rather than a solid blue line commonly used to denote water features.
The mapping was produced through a rigorous step-by step process that interrogated the available datasets:
Step 1 – Identify each sub-basin and best available imagery
Step 2 – Assess stream drainage classification levels in the basin
Step 3 – Identify areas that indicate alluvial systems, estuarine and marine deposits
Step 4 – Identify stream gauges and their highest recorded levels
Step 5 – Incorporate available 2011 flood lines
Step 6 – Contours introduced as a constraint on soils and satellite flood lines datasets
Step 7 – Identify the IFAO extent using a visual estimation of the above data.
Importantly, the methodology provides for a consistent Statewide approach to floodplain mapping, even in areas where high resolution aerial photography, contour information or flood studies do not exist.
Stream orders
Imagery
Starting at the headwater, the stream is assigned number one to be made 1st order. As several 1st order streams converge the resultant stream becomes 2nd order. Two 2nd order streams converging form a 3rd order, etc. This is known as the Strahler Method. The number of orders in Queensland’s Sub-Basins vary. The Dawson River sub-basin for example is classified to a 9th order. Flooding can occur in the headwater streams (ie. 1st order), but is more likely to be significant in higher order streams. For each sub-basin the appropriate stream orders have been selected to use in developing the Floodplain Mapping.
Aerial imagery across the State is captured using different modes. The most common is through Landsat 5. Landsat 5 is the fifth satellite of the Landsat program. It was launched on 1 March 1984, with the primary goal of providing a global archive of satellite images. The program is managed by United States Geological Survey (USGS), and data from Landsat 5 is collected and distributed from the USGS’s Center for Earth Resources Observation and Science. Australia like many countries has an agreement with the USGS where new satellite imagery is downloaded every 16 days and provided to Geoscience Australia. The imagery has a pixel resolution of 30 metres. In addition to Landsat more detailed aerial photography captured at the time of a flood over a town and cities has been used where available. During the summer 2010/2011 events, approximately 100 towns were captured with high resolution aerial imagery.
SAlI Soil limitation Mapping
This is the largest mapping exercise currently underway in Australia. The
mapping has been undertaken at a sub-basin level. Many Councils have
more than one sub-basin within their local Government Area.
10
land zone 3
Contours
land zone 1
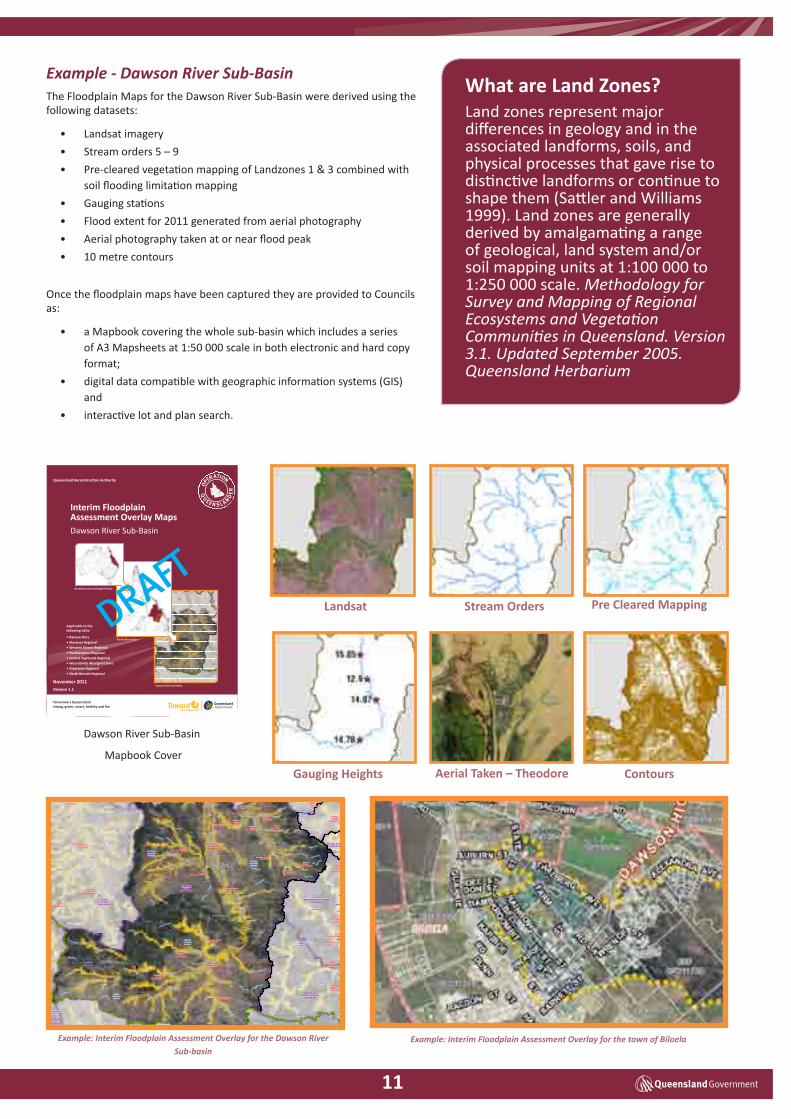
Example - Dawson River Sub-Basin The Floodplain Maps for the Dawson River Sub-Basin were derived using the following datasets:
• Landsat imagery
• Stream orders 5 – 9
• Pre-cleared vegetation mapping of Landzones 1 & 3 combined with soil flooding limitation mapping
• Gauging stations
• Flood extent for 2011 generated from aerial photography
• Aerial photography taken at or near flood peak
• 10 metre contours
Once the floodplain maps have been captured they are provided to Councils as:
• a Mapbook covering the whole sub-basin which includes a series of A3 Mapsheets at 1:50 000 scale in both electronic and hard copy format;
• digital data compatible with geographic information systems (GIS) and
• interactive lot and plan search.
Stream orders What are land Zones?Land zones represent major differences in geology and in the associated landforms, soils, and physical processes that gave rise to distinctive landforms or continue to shape them (Sattler and Williams 1999). Land zones are generally derived by amalgamating a range of geological, land system and/or soil mapping units at 1:100 000 to 1:250 000 scale. Methodology for Survey and Mapping of Regional Ecosystems and Vegetation Communities in Queensland. Version 3.1. Updated September 2005. Queensland Herbarium
CONDAMINERIVER
SUB-BASIN
WATERPARKCREEK
SUB-BASIN
SHOALWATERSUB-BASINISAAC RIVER
SUB-BASIN
BALONNERIVER
SUB-BASIN
NOGOARIVER
SUB-BASIN
MARANOARIVER
SUB-BASIN
BOYNE &AUBURN RIVERS
SUB-BASIN
UPPER BURNETT RIVERSUB-BASIN
COMETRIVER
SUB-BASIN
CURTISISLAND
SUB-BASIN
BOYNE RIVERSUB-BASIN
CALLIOPERIVER
SUB-BASIN
STYX RIVERSUB-BASIN
MACKENZIERIVER
SUB-BASIN
MISC OTHERISLANDS
SUB-BASIN
FITZROYRIVER
SUB-BASIN
DAWSONRIVER
SUB-BASIN
WAMBOPLANNINGSCHEME
BUNGILPLANNINGSCHEME
MURILLAPLANNINGSCHEME
BENDEMEREPLANNINGSCHEME
TAROOMPLANNINGSCHEME
WONDAIPLANNINGSCHEME
MUNDUBBERAPLANNINGSCHEME
EIDSVOLDPLANNINGSCHEME
BAUHINIAPLANNINGSCHEME
BANANAPLANNINGSCHEME
DUARINGAPLANNINGSCHEME
MONTOPLANNINGSCHEME
TARAPLANNINGSCHEME
WARROOPLANNINGSCHEME
FITZROYPLANNINGSCHEME
MOUNT MORGANPLANNINGSCHEME
BROADSOUNDPLANNINGSCHEME
PEAK DOWNSPLANNINGSCHEME
EMERALDPLANNINGSCHEME
BOORINGAPLANNINGSCHEME
CALLIOPEPLANNINGSCHEME
CHINCHILLAPLANNINGSCHEME
LIVINGSTONEPLANNINGSCHEME
Yaamba Taranganba
Princhester
Macalister
TheCaves
Wallumbilla
MountChalmers
Cawarral Emu Park
MulambinRosslyn
Tieri
Kogan
Stanwell
Condamine Warra
Brigalow
Jandowae
Muckadilla
Cracow
Yuleba TchanningJackson Dulacca Drillham
Miles Columboola
Amby
Hodgson Blythdale
Guluguba
Wandoan
Injune
Taroom
Redbank
Eidsvold
Cynthia
RawbelleKapaldo
Mulgildie
Theodore
Monto
Moonford
Bauhinia
RollestonBanana
Thangool
Jambin
Callide
Woorabinda
Baralaba
Goovigen
Wowan
Dululu
AmbroseMount
Larcom
Yarwun
Dingo
DuaringaBoolburra
Gogango
Westwood
Marmor
Bajool
Raglan
Comet Bluff
Kabra
Bouldercombe
Gracemere
KeppelSands
SouthYaamba
Roma
Moura
Biloela
MountMorgan
Emerald
Blackwater
Chinchilla
Yeppoon
Rockhampton
Con damin e Ri ver
Three Moon
Creek
Rop
er C
reek
Sandy
C re ek
Am
b
y C
reek
Humbo
ld t Creek
R uined Castl e C r eek
Ca l lid e C reek
Six Mile
Cree
k
Lorra
ine Cre
e k
Eu rombah Creek
Euro mb ah C re
ek
Concili ation Creek
Wa
m
bo Cre
ek
Banana
Creek
Sprin gton Creek
Oa ky C reek
Duck
worth Cre ek
Calli
de Cr
e
ek
In
june Creek
Pa
rker C
reek
Twel ve
Mi le
Creek
Mi m osa Cree k
M
i
mosa Cre ek
Rocky
Gully
No rth K
ar iboe C
ree k
Bell Cre ek
Wilkie
Cr eek
Moo layemb
er Cr
eek
Mucka
dilla
Cr
eek
Ca
stl e Cr ee k
Cameron Creek
Dawson River
Au
burn
River
A lligat or
Cr
ee
k
Yuleb a Creek
Wo le e
bee Cr
ee
k
North B unga
ban C reek
Spr ing sure Creek
C ocka too Cre ek
Gran
t Cre
ek
Dawson Ri v er
Con damin
e Riv er
Fitzroy River
Fitzroy R i ve
r
Mur il la Cr
eek
Bo
ne Cr eek
Un
dulla
Creek
Kroombi t Cree k
Z
amia Creek
Za mia Cre ek
The resa Creek
Mercu
rah Cr
eek
Lonesome Creek
Ca llio
pe Ri v er
Charley Creek
Marl
boroug
h Creek
Ro cky Creek
Mack enzie River
R agla
n Cree
k
Fitzroy
River
M
acken
zie River
M eteor
Creek
Y
ule
ba Cr
eek
Blackwater Creek
St John Creek
Juan
dah C
reek
Clema
tis Creek
Carnarvon Creek
Bu
r rabu
rri
Creek
Sa rdine Cre ek
Do n River
Bu ngaba
n Cre ek
De e Rive r
Cons
ue
l o Creek
Daws
on River
Tch
annin
g Creek
Bul lar oo Creek
C ooroo ra Cr eek
Dogwood Cre ek
Dogwoo d Creek
M inerva Creek
Horse
Cree
k
Bun
gewor g orai Creek
Cogoon River
Nogo
R iver
Baff le Creek
Spring Creek
Bun g i l C
r eek
Bu
ngil Creek
Darga l Creek
St ock
yard Creek
Fish
Cree
k
Char
lev
ue Creek
Ki
ang a Creek
Brow
n Ri
ve
r
Nogoa River
D
ulacca Creek
Bur
gagay
Creek
Com
et Ri
ver
San
dhurst Creek
Palm Tre e Cre
ek
Gre v illea Cree k
Plan
et C
reek
Catt
le Cre
ek
C
e ntr a l Cree k
Yalebo ne Creek
Blackboy C reek
Robinson Cr ee k
Ro bi nso
n Creek
Cad
arga
Cree
k
Nudley Creek
Ce
nt re Creek
Come t River
Dawso
n R
iver
Blyt
h Cr eek
Hu tt on Creek
Ba lonn
e R
ive
r
Cooranga C reek
Aubu
rn Rive
r
Charl ey s C reek
Dawson Riv
er
Jo
hns
on Cr
ee
k
ISAAC REGIONAL
MARANOAREGIONAL
WESTERN DOWNS REGIONAL
NORTH BURNETT REGIONAL
BANANA SHIRE
CENTRALHIGHLANDSREGIONAL
GLADSTONEREGIONAL
ROCKHAMPTONREGIONAL
GaugingStation No.130316A
Gauging StationNo.130317B
GaugingStation
No.130319A
Gauging StationNo.130322A
GaugingStation
No.130324A
GaugingStation
No.130327A
GaugingStationNo.130334A
Gauging StationNo.130335A
GaugingStation
No.130336A
Gauging StationNo.130344A
Gauging StationNo.130348A
GaugingStation
No.130349A
GaugingStation No.130363A
GaugingStationNo.130374A
GaugingStation
No.130375A
GaugingStation No.130502B
GaugingStation No.130504B
Gauging StationNo.130506A
Gauging StationNo.130302A
GaugingStation
No.130510A
GaugingStation
No.132001A
GaugingStation
No.136101C
GaugingStation No.136103B
Gauging StationNo.136106A
GaugingStation
No.136108A
GaugingStationNo.136305A
GaugingStationNo.136306A
Gauging StationNo.422202B
GaugingStation
No.422210A
GaugingStationNo.422219A
GaugingStation
No.422220A
GaugingStation
No.422308C
GaugingStation No.130003B
Gauging StationNo.422336A
Gauging StationNo.422343A
GaugingStationNo.422344A
Gauging StationNo.129001A
GaugingStationNo.130004A
GaugingStation
No.130005A
GaugingStation No.130509A
Gauging StationNo.130105A
GaugingStation
No.130113A
Gauging StationNo.130206A Gauging
Station No.130219A
GaugingStation
No.130306B
Gauging StationNo.130313A
GaugingStation
No.422325A
151°0'0"E
151°0'0"E
150°30'0"E
150°30'0"E
150°0'0"E
150°0'0"E
149°30'0"E
149°30'0"E
149°0'0"E
149°0'0"E
148°30'0"E
148°30'0"E
23°0
'0"S
23°0
'0"S
23°3
0'0"
S
23°3
0'0"
S
24°0
'0"S
24°0
'0"S
24°3
0'0"
S
24°3
0'0"
S
25°0
'0"S
25°0
'0"S
25°3
0'0"
S
25°3
0'0"
S
26°0
'0"S
26°0
'0"S
26°3
0'0"
S
26°3
0'0"
S
27°0
'0"S
27°0
'0"S
INTERIM FLOODPLAIN ASSESSMENT OVERLAYDAWSON RIVER SUB-BASIN
2011 V1.1
ESRI ArcGIS Online Imagery Basemap
Digital Cadastral Database (DCDB) is current at November 2011. Positional accuracy representing the 'maximum error' has been calculated at ± 57 metres.
For more information regarding the capture of this line please see the Foreword at the front of thesub-basin atlases.
The average accuracy of the data is plus or minus 25 metres in the horizontal position.
Dawson River
Fitzroy
North East Coast
Horizontal - Geocentric Datum of Australia 1994 (GDA94)
Horizontal - Geocentric Datum of Australia 1994 (GDA94)
Graticule lines are at 30 minute intervals
Imagery:
Cadastre:
Floodplain Assessment Overlay:
Watercourses:
Drainage Sub-Basin:
Drainage Basin:
Drainage Division:
Datum:
Projection:
Graticule:
MAP INFORMATION
0 5 10 15 20 25 30 35 401 2 3 4
Kilometers
LEGEND
Drainage Divisions
Drainage Basins
!\ Gauging Station
Planning Scheme Boundaries
Current Local Government Boundaries
Cadastre
Interim Floodplain Assessment Overlay
Major Watercourses
Original Size is A1
Map No.:
Technical enquiries:The ManagerGIS Mapping Services (Client Outcomes), Spatial Information GroupDepartment of Environment and Resource ManagementGPO Box 2454, Brisbane QLD 4001
While every care is taken to ensure the accuracy of this data, the Department of Environment and Resource Management, and/orcontributors to this publication, makes no representations or warranties about its accuracy, reliability, completeness or suitability for anyparticular purpose and disclaims all responsibility and all liability (including without limitation, liability in negligence) for all injuries,expenses, losses, damages (including indirect or consequential damage) and costs which might be incurred as a result of the databeing inaccurate or incomplete in any way or for any reason.
SCALE 1:600000
© The State of Queensland (Department of Environment and Resource Management) 2011. Imagery © ESRI 2009.
Produced for the Queensland Reconstruction Authority by the Department of Environment and Resource Management, November 2011.
OV1303.
ContoursGauging Heights
Pre Cleared Mapping landsat Stream orders
Aerial Taken – Theodore
Example: Interim Floodplain Assessment Overlay for the town of Biloela Example: Interim Floodplain Assessment Overlay for the Dawson River Sub-basin
SAlI Soil limitation Mapping
Queensland Reconstruction Authority
Tomorrow’s Queensland:strong, green, smart, healthy and fair
Interim Floodplain Assessment Overlay Maps
November 2011
Version 1.1
Dawson River Sub-Basin
CONDAMINERIVER
SUB-BASIN
WATERPARKCREEK
SUB-BASIN
SHOALWATERSUB-BASINISAAC RIVER
SUB-BASIN
BALONNERIVER
SUB-BASIN
NOGOARIVER
SUB-BASIN
MARANOARIVER
SUB-BASIN
BOYNE &AUBURN RIVERS
SUB-BASIN
UPPER BURNETT RIVERSUB-BASIN
COMETRIVER
SUB-BASIN
CURTISISLAND
SUB-BASIN
BOYNE RIVERSUB-BASIN
CALLIOPERIVER
SUB-BASIN
STYX RIVERSUB-BASIN
MACKENZIERIVER
SUB-BASIN
MISC OTHERISLANDS
SUB-BASIN
FITZROYRIVER
SUB-BASIN
DAWSONRIVER
SUB-BASIN
WAMBOPLANNINGSCHEME
BUNGILPLANNINGSCHEME
MURILLAPLANNINGSCHEME
BENDEMEREPLANNINGSCHEME
TAROOMPLANNINGSCHEME
WONDAIPLANNINGSCHEME
MUNDUBBERAPLANNINGSCHEME
EIDSVOLDPLANNINGSCHEME
BAUHINIAPLANNINGSCHEME
BANANAPLANNINGSCHEME
DUARINGAPLANNINGSCHEME
MONTOPLANNINGSCHEME
TARAPLANNINGSCHEME
WARROOPLANNINGSCHEME
FITZROYPLANNINGSCHEME
MOUNT MORGANPLANNINGSCHEME
BROADSOUNDPLANNINGSCHEME
PEAK DOWNSPLANNINGSCHEME
EMERALDPLANNINGSCHEME
BOORINGAPLANNINGSCHEME
CALLIOPEPLANNINGSCHEME
CHINCHILLAPLANNINGSCHEME
LIVINGSTONEPLANNINGSCHEME
Yaamba Taranganba
Princhester
Macalister
TheCaves
Wallumbilla
MountChalmers
Cawarral Emu Park
MulambinRosslyn
Tieri
Kogan
Stanwell
Condamine Warra
Brigalow
Jandowae
Muckadilla
Cracow
Yuleba TchanningJackson Dulacca Drillham
Miles Columboola
Amby
Hodgson Blythdale
Guluguba
Wandoan
Injune
Taroom
Redbank
Eidsvold
Cynthia
RawbelleKapaldo
Mulgildie
Theodore
Monto
Moonford
Bauhinia
RollestonBanana
Thangool
Jambin
Callide
Woorabinda
Baralaba
Goovigen
Wowan
Dululu
AmbroseMount
Larcom
Yarwun
Dingo
DuaringaBoolburra
Gogango
Westwood
Marmor
Bajool
Raglan
Comet Bluff
Kabra
Bouldercombe
Gracemere
KeppelSands
SouthYaamba
Roma
Moura
Biloela
MountMorgan
Emerald
Blackwater
Chinchilla
Yeppoon
Rockhampton
Con damin e Ri ver
Three Moo
n Cre
ek
Rop
er C
reek
Sand
y C re ek
Am
b
y C
reek
Humbo
ld t Creek
R uined Castl e C r e
ek
Ca l lid e C reek
Six M
ile Cr
ee
k
Lorra
ine Cre
e k
Eu rombah Creek
Euro mb ah Cre
ek
Concili ation Creek
Wa
m
bo Cre
ek
Banana
Creek
Sprin gton Creek
Oa ky C reek
Duck
worth Cre ek
Calli
de Cr
e
ek
In
june Creek
Par
ker C
reek
Twel ve
Mi le Creek
Mi m osa Cree k
M
i
mosa Creek
Ro
cky G
ully
No rth K
ar iboe
Cree k
Bell Cre ek
Wilk
ie
Cr eek
Moo layembe
r Cr
eek
Mu
ck
ad
illa
Cr
eek
Ca
stl e Cr ee k
Cameron Creek
Dawson R
iver
Au
burn
Rive
r
Allig
at or Cr
ee
k
Yuleb a Creek
Wo le e
bee Cr
ee
k
North B unga
ban C reek
Spr ing sure
Creek
C ocka too Cre ek
Gr a
nt C
reek
Dawson Ri v er
Con damin
e Riv er
Fitzroy Rive
r
Fitzroy R i ve
r
Mur il la Cr
eek
Bo
ne Cr eek
Un
dulla
Creek
Kroombi t Cree k
Z
amia Creek
Za mia Cre ek
The resa Creek
Mercu
rah C
reek
Lonesome Creek
Ca llio
pe Ri v er
Charley Creek
Mar
lbor
ough C
reek
Ro cky Creek
Mack enzie River
R agla
n Cre
ek
Fitzroy R
iver
M
acken
zie River
M eteor
Cr
eek
Y
ule
ba Cr
eek
Blackwater Creek
St John Creek
Juan
dah C
reek
Clema
tis Creek
Carnarvon Creek
Bu
r rab
u rri
Creek
Sa rdine Cre ek
Do n River
Bu nga
ba
n Cre ek
De e Rive r
Cons
ue
l o Creek
Daws
on River
Tch
annin
g Creek
Bul lar oo Cr
eek
C ooroo ra Creek
Dogwood Cre ek
Dogwoo d Creek
M inerva Creek
Ho
rse Cr
ee
k
Bun
gew
or g orai Creek
Cogoon River
Nogo
R ive
r
Baff le Creek
Sp
ring Creek
Bun g i l C
r eek
Bu
ngil Creek
Darga l Creek
St ock
yard C
reek
Fish
Cre
ek
Char
levue Cree
k
Ki
ang a Creek
Bro
wn
Riv
e
r
Nogoa River
D
ulacca
Creek
Bur
gagay
Creek
Com
et Ri
ver
San
dhurst Creek
Palm Tre e Cre
ek
Gre v illea Cree k
Planet C
reek
Cattle Cre
ek
C
e ntr a l Cree k
Yalebo ne Creek
Blackboy C reek
Robinson Cr ee k
Ro bi nso
n Creek
Cad
ar
ga
Cree
k
Nudley Creek
Ce
nt re Creek
Co
me t River
Dawso
n R
iver
Blyt
h Cree
k
Hu tt on Creek
Ba lonn
e R
ive
r
Cooranga C reek
Aubu
rn Rive
r
Charl ey s C reek
Dawson Riv
er
Jo
hns
on Cr
ee
k
ISAAC REGIONAL
MARANOAREGIONAL
WESTERN DOWNS REGIONAL
NORTH BURNETT REGIONAL
BANANA SHIRE
CENTRALHIGHLANDSREGIONAL
GLADSTONEREGIONAL
ROCKHAMPTONREGIONAL
GaugingStation No.130316A
Gauging StationNo.130317B
GaugingStation
No.130319A
Gauging StationNo.130322A
GaugingStation
No.130324A
GaugingStation
No.130327A
GaugingStationNo.130334A
Gauging StationNo.130335A
GaugingStation
No.130336A
Gauging StationNo.130344A
Gauging StationNo.130348A
GaugingStation
No.130349A
GaugingStation No.130363A
GaugingStationNo.130374A
GaugingStation
No.130375A
GaugingStation No.130502B
GaugingStation No.130504B
Gauging StationNo.130506A
Gauging StationNo.130302A
GaugingStation
No.130510A
GaugingStation
No.132001A
GaugingStation
No.136101C
GaugingStation No.136103B
Gauging StationNo.136106A
GaugingStation
No.136108A
GaugingStationNo.136305A
GaugingStationNo.136306A
Gauging StationNo.422202B
GaugingStation
No.422210A
GaugingStationNo.422219A
GaugingStation
No.422220A
GaugingStation
No.422308C
GaugingStation No.130003B
Gauging StationNo.422336A
Gauging StationNo.422343A
GaugingStationNo.422344A
Gauging StationNo.129001A
GaugingStationNo.130004A
GaugingStation
No.130005A
GaugingStation No.130509A
Gauging StationNo.130105A
GaugingStation
No.130113A
Gauging StationNo.130206A Gauging
Station No.130219A
GaugingStation
No.130306B
Gauging StationNo.130313A
GaugingStation
No.422325A
151°0'0"E
151°0'0"E
150°30'0"E
150°30'0"E
150°0'0"E
150°0'0"E
149°30'0"E
149°30'0"E
149°0'0"E
149°0'0"E
148°30'0"E
148°30'0"E
23°0
'0"S
23°0
'0"S
23°3
0'0"S
23°3
0'0"S
24°0
'0"S
24°0
'0"S
24°3
0'0"S
24°3
0'0"S
25°0
'0"S
25°0
'0"S
25°3
0'0"S
25°3
0'0"S
26°0
'0"S
26°0
'0"S
26°3
0'0"S
26°3
0'0"S
27°0
'0"S
27°0
'0"S
INTERIM FLOODPLAIN ASSESSMENT OVERLAYDAWSON RIVER SUB-BASIN
2011 V1.1
ESRI ArcGIS Online Imagery Basemap
Digital Cadastral Database (DCDB) is current at November 2011. Positional accuracy representing the 'maximum error' has been calculated at ± 57 metres.
For more information regarding the capture of this line please see the Foreword at the front of thesub-basin atlases.
The average accuracy of the data is plus or minus 25 metres in the horizontal position.
Dawson River
Fitzroy
North East Coast
Horizontal - Geocentric Datum of Australia 1994 (GDA94)
Horizontal - Geocentric Datum of Australia 1994 (GDA94)
Graticule lines are at 30 minute intervals
Imagery:
Cadastre:
Floodplain Assessment Overlay:
Watercourses:
Drainage Sub-Basin:
Drainage Basin:
Drainage Division:
Datum:
Projection:
Graticule:
MAP INFORMATION
0 5 10 15 20 25 30 35 401 2 3 4
Kilometers
LEGEND
Drainage Divisions
Drainage Basins
!\ Gauging Station
Planning Scheme Boundaries
Current Local Government Boundaries
Cadastre
Interim Floodplain Assessment Overlay
Major Watercourses
Original Size is A1
Map No.:
Technical enquiries:The ManagerGIS Mapping Services (Client Outcomes), Spatial Information GroupDepartment of Environment and Resource ManagementGPO Box 2454, Brisbane QLD 4001
While every care is taken to ensure the accuracy of this data, the Department of Environment and Resource Management, and/orcontributors to this publication, makes no representations or warranties about its accuracy, reliability, completeness or suitability for anyparticular purpose and disclaims all responsibility and all liability (including without limitation, liability in negligence) for all injuries,expenses, losses, damages (including indirect or consequential damage) and costs which might be incurred as a result of the databeing inaccurate or incomplete in any way or for any reason.
SCALE 1:600000
© The State of Queensland (Department of Environment and Resource Management) 2011. Imagery © ESRI 2009.
Produced for the Queensland Reconstruction Authority by the Department of Environment and Resource Management, November 2011.
OV1303.
Northeast Coast Drainage Division
Applicable to the following LGAs:
• Banana Shire• Maranoa Regional• Western Downs Regional • Rockhampton Regional• Central Highlands Regional• Woorabinda Aboriginal Shire • Gladstone Regional • North Burnett Regional
Fitzroy River Basin
Dawson River Sub-Basin
Dawson River Sub-Basin
Mapbook Cover
11
3 Implementation Planning for stronger, more resilient floodplains is a journey towards achieving better floodplain management through the land use planning process. Whilst not all Councils require assistance in achieving this objective, some do and may benefit from the use of this Guideline.
Floods are the most manageable of all natural disasters. Unlike other natural disasters, generally there is an understanding of where floods will occur and estimates of the likelihood of flooding, flood behaviour and the consequences of flooding in some cases. On the other hand the unpredictability of Severe Tropical Cyclone Yasi meant it was not known when and where it would make landfall until just hours before it crossed the coast. Therefore, through a combination of learning from the Yasi experience and analysing its aftermath, we can plan more efficiently for similar events and, at the same time, create more resilient communities.
New Construction Standards
The Australian Building Codes Board has developed a draft national Standard for Construction of Buildings in Flood Hazard Areas (draft Standard), which is scheduled to be introduced into the Building Code of Australia (BCA) in 2013, following appropriate consultation. The scope of the draft Standard is limited to class 1 (houses and townhouses), class 2 (units and flats), class 3 (hotels, motels and backpackers), class 4 (caretakers dwelling), class 9a (health care) and class 9c (aged care) buildings. It provides specific performance requirements and deemed-to-satisfy (DTS) provisions for the design and construction of new buildings in a flood hazard area, as designated by the relevant authority (ie. Local Government).
DLGP is proposing early adoption of the draft Standard as a new mandatory part of the Queensland Development Code (QDC). Additional non-mandatory provisions, which are currently outside the scope of the draft Standard, are also proposed to be included in the QDC to be adopted by Councils on a voluntary basis through a planning scheme, Temporary Local Planning Instrument, or by resolution. It is proposed that the new QDC will apply to new buildings and additions to existing buildings, but not generally to building alterations (for example, internal repairs such as adding a bathroom or removing a wall).
Temporary State Planning Policy The Authority partnered with DLGP to implement a new Temporary State Planning Policy 2/11 (TSPP) – Planning for stronger, more resilient floodplains – which creates the statutory mechanism by which a Council may look to adopt the Interim Floodplain Assessment Overlay as part of their existing planning scheme.
The TSPP suspends the effect of paragraphs A3.1 and A3.2 of Annex 3 of State Planning Policy 1/03 Mitigating the Adverse Impacts of Flood, Bushfire and Landslide, which identifies the process by which a Council may designate a Natural Hazard Management Area (Flood) (NHMA).
The effect of the TSPP is to allow amendments to an existing planning instrument under the SPA for a NHMA (Flood) to include:
• land inundated by a Defined Flood Event (DFE) and identified in a planning instrument; or
• the Interim Floodplain Assessment Overlay mapping and Model Code provided by the Queensland Reconstruction Authority; or
• the Interim Floodplain Assessment Overlay mapping and Model Code as amended by the relevant Local Government.
The TSPP therefore gives effect for a Council to designate a NHMA (Flood) through a minor planning scheme amendment process. The mapping may be adopted either in the current form provided by the Authority, or as amended by the Council following local verification of the mapping, provided that the amendment does not deviate from the intent of the interim provisions and the purpose as outlined in this Guideline and the TSPP. A Temporary Local Planning Instrument (TLPI) may also be an option for adoption of the mapping and code provisions however, the preference is for a minor scheme amendment process be followed.
The TSPP commenced on 14 November 2011 and remains in effect for a period of 12 months. It is expected that these amendments will be taken into consideration in the review of the SPP1/03 and an amendment of SPP1/03 will be undertaken prior to the expiry of the TSPP.
Interim Toolkit supporting the TSPP Part 1 of this Guideline provides a voluntary interim toolkit which includes:-
• Floodplain Maps prepared by the Authority in both digital and hard copy; and
• the Model Code.
It is acknowledged that not all local governments require this interim toolkit. Councils with adequate provisions and mapping will not need this Guideline. The response needs to be fit-for-purpose recognising the differing needs of each local government. However, even for those Councils who feel that there are adequate provisions within their existing scheme, the floodplain maps may help to:
• inform the strategic planning process for the preparation of their new QPP compliant planning scheme; and
• identify areas that may require more detailed flood investigations, particularly those areas where there is existing or proposed critical infrastructure, transport and communications linkages and other places of high economic importance.
For those Councils wishing to adopt the interim provisions, this can be done through incorporating a new section into the existing planning scheme, titled “Flood Hazard Overlay- Floodplain Assessment” and incorporating as a minor amendment to the planning scheme. Alternatively, a Council may use a TLPI however the minor amendment process is preferred.
It is also important to note the adoption of the Floodplain Maps is not intended to alter the level of assessment for development within the overlay area.
The adopted Floodplain Maps are proposed to be used as a trigger for already Assessable Development to be assessed against the Model Code. Any changes to the levels of assessment will require specific consideration by Council and DLGP as part of the amendment process.
Mapping As outline in Section 2 of this Guideline the floodplain maps have been derived from a state-wide methodology using state-wide datasets. The datasets are available to Councils via a secure FTP service from the Spatial Information Group within DERM. The data consists of a number of whole of state datasets and contour datasets specific to each sub-basin. There are staff members within each Council who currently have access to the DERM FTP service via a secure login and password. Please contact DERM at [email protected] to request access to the datasets via the FTP service.
12
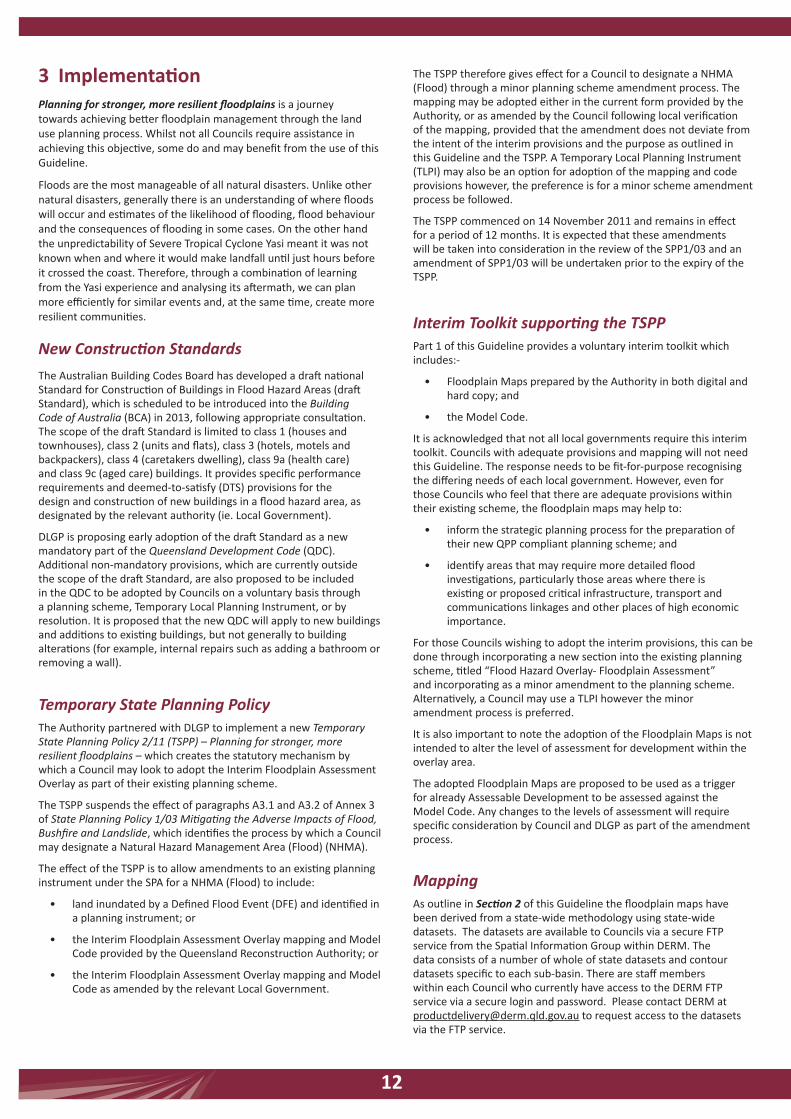
Planning scheme provisions – Model Code
To support the Floodplain Maps a Model Code has been prepared to support the assessment of development on land wholly or partially within the area shown on the Floodplain Maps.
The Model Code is provided in Schedule 1.
Councils may decide on the types of development to which the Model Code applies.
The purpose of the code is to manage built form outcomes in the floodplain so that risks to life and property during future flood events are minimised, and to ensure that future development does not increase the potential for flood damage on site or any other property.
For clarity and consistency, all development-related terms defined elsewhere in other Queensland legislation (such as the Sustainable Planning Act 2009, Dangerous Goods Safety Management Act 2001) have the same meaning in this Guideline and its Schedules.
To demonstrate the practical application of this toolkit (including the Floodplain Maps and the Model Code) in a development assessment context, a number of case studies are provided following Schedule 1 of this Guideline. These identify how certain types of assessable development may be assessed against the Model Code.
Minor Vs Major AmendmentThe TSPP allows for Councils to undertake a Planning Scheme amendment that can be considered as a Minor Amendment, in order to adopt the interim provisions as outlined in this Guideline.
The Honourable Paul Lucas MP, Attorney-General, Minister for Local Government and Special Minister of State has agreed that where a Council uses the TSPP and this Guideline that the amendments will be considered under the Minor Scheme Amendment process under Statutory Guideline 02/09. However, where a Council seeks to undertake further amendments to the Planning Scheme, beyond the scope of those outlined in this Guideline, the amendment may be classified as a “Major Amendment”.
Any change deemed to substantially deviate from the intent may need to undergo the Major Amendment process before being adopted into a Planning Scheme.
To provide clarity, the Authority advises that an example of where an amendment may not be considered as Minor would be a change to the Performance Outcomes identified in the Model Code. Councils can choose to amend the Acceptable Outcomes where it is necessary to deal with a localised issue.
The Authority has established an arrangement with DLGP to support those Councils wishing to utilise this toolkit and amend their existing planning schemes. DLGP will lead the proposed amendments and work closely with the Authority. The Authority and DERM will continue to provide support to Councils who are looking to refine the floodplain maps based on local verification. Guidance can also be provided to those Councils who are looking to further refine the Model Code provisions to suit their local circumstance.
Further advice on how Councils can utilise this toolkit is provided in Section 4 - Delivery.
Brisbane River in flood 1974 Source: Queensland State Archives
Brisbane River in flood 2011 Source: Queensland Reconstruction Authority
The Minister has agreed that where a
Council uses the TSPP and this Guideline that
the amendments will be considered under
the Minor Scheme Amendment process.
13
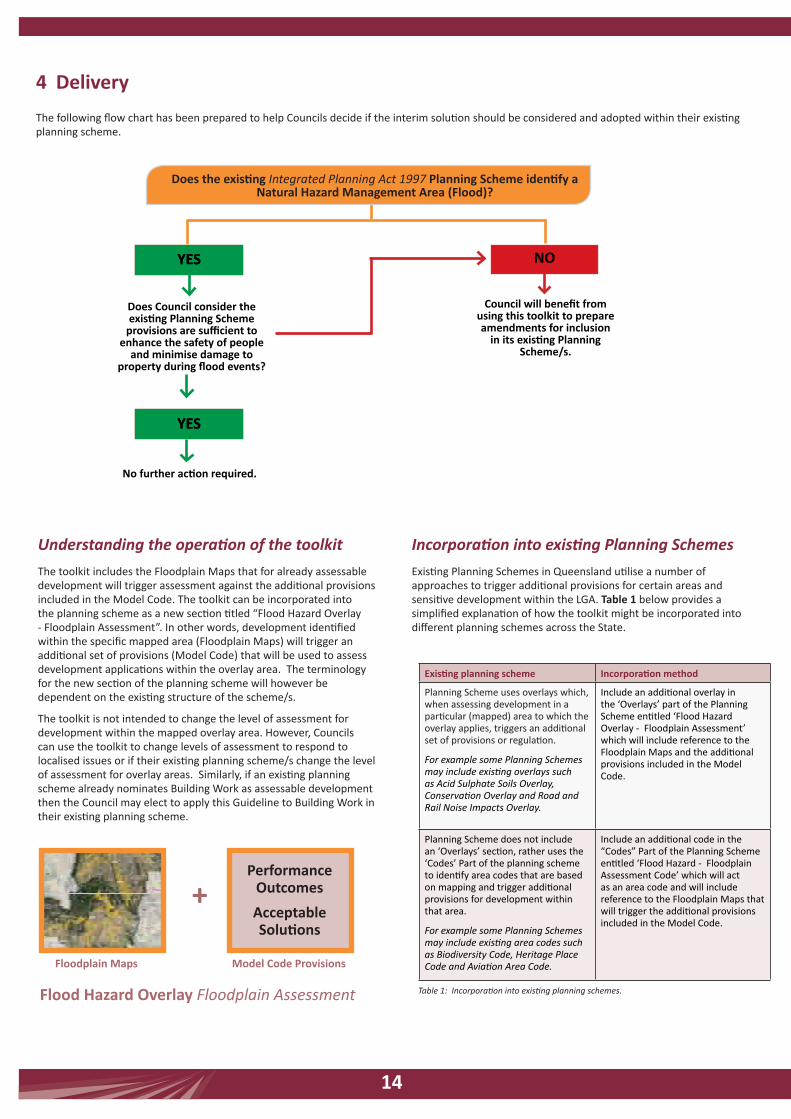
4 Delivery
Council will benefit from using this toolkit to prepare amendments for inclusion
in its existing Planning Scheme/s.
Does Council consider the existing Planning Scheme
provisions are sufficient to enhance the safety of people
and minimise damage to property during flood events?
No further action required.
yeS yeS
yeS yeS
nOnO
The following flow chart has been prepared to help Councils decide if the interim solution should be considered and adopted within their existing planning scheme.
Does the existing Integrated Planning Act 1997 Planning Scheme identify a Natural Hazard Management Area (Flood)?
Understanding the operation of the toolkit
The toolkit includes the Floodplain Maps that for already assessable development will trigger assessment against the additional provisions included in the Model Code. The toolkit can be incorporated into the planning scheme as a new section titled “Flood Hazard Overlay - Floodplain Assessment”. In other words, development identified within the specific mapped area (Floodplain Maps) will trigger an additional set of provisions (Model Code) that will be used to assess development applications within the overlay area. The terminology for the new section of the planning scheme will however be dependent on the existing structure of the scheme/s.
The toolkit is not intended to change the level of assessment for development within the mapped overlay area. However, Councils can use the toolkit to change levels of assessment to respond to localised issues or if their existing planning scheme/s change the level of assessment for overlay areas. Similarly, if an existing planning scheme already nominates Building Work as assessable development then the Council may elect to apply this Guideline to Building Work in their existing planning scheme.
BANANA
CENTRAL HIGHLANDS REGIONAL
MARANOA REGIONAL
WESTERN DOWNS REGIONAL
ROCKHAMPTON REGIONAL
NORTH BURNETT REGIONAL
GLADSTONE REGIONAL
ISAAC REGIONAL
Rockhampton
Moura
Biloela
Yeppoon
Blackwater
Chinchilla
Mount Morgan
CometBluff
Miles
Dingo
Wowan
Kabra
Injune
Cracow
Taroom
Bajool
Marmor
Raglan
Dululu
Rannes
Jambin
Banana
Redbank
Wandoan
Dulacca
Gogango
Ambrose
Callide
Rosslyn
Jandowae
Rawbelle
Guluguba
Drillham
Westwood
Duaringa
Goovigen
Baralaba
Thangool
Bauhinia
Moonford
Mulambin
Cawarral Emu Park
Stanwell
Rolleston
Boolburra
The Caves
Columboola
Woorabinda
Bouldercombe
Mount Larcom
South Yaamba
Keppel Sands
Mount Chalmers
TAROOM SHIRE(Pre-Amalgamtion)
DUARINGA SHIRE(Pre-Amalgamtion)
BANANA SHIRE(Pre-Amalgamtion)
BAUHINIA SHIRE(Pre-Amalgamtion)
BUNGIL SHIRE(Pre-Amalgamtion)
CHINCHILLA SHIRE(Pre-Amalgamtion)
FITZROY SHIRE(Pre-Amalgamtion)
EIDSVOLD SHIRE(Pre-Amalgamtion)
MURILLA SHIRE(Pre-Amalgamtion)
BENDEMERE SHIRE(Pre-Amalgamtion)
CALLIOPE SHIRE(Pre-Amalgamtion)
MONTO SHIRE(Pre-Amalgamtion)
EMERALD SHIRE(Pre-Amalgamtion)
LIVINGSTONE SHIRE(Pre-Amalgamtion)
BOORINGA SHIRE(Pre-Amalgamtion)
MUNDUBBERA SHIRE(Pre-Amalgamtion)
PEAK DOWNS SHIRE(Pre-Amalgamtion)
BROADSOUND SHIRE(Pre-Amalgamtion)
MOUNT MORGAN SHIRE(Pre-Amalgamtion)
Dawson R iver
Mim osa Creek
Come t River
Bung
ilC
re
ek
CallideCreek
DeeR
iver
Au burn River
Zam
ia Creek
Do n River
Eurombah Creek
Fitzroy River
Nogo River
Robinson C reek
P lanet Creek
B affle Creek
Blyt
hC
reek
DogwoodC
reek
Yuleb
aCr
eek
Hutto
n Creek
Kroombit Creek
Bell Creek
Macke
nzieRive
r
BananaCreek
Bungeworgorai Creek
Meteor
Cree
k
Castle Creek
Grevillea
Creek
Hor
seC
reek
Humbold t Creek
Conciliation Creek
PalmTree Creek
Charleys Creek
Cadarga Creek
Duc
kwort
h Creek
Nogoa River
Clematis CreekCarnarvon Creek
Blackwater Creek
Bungaban Creek
Cockatoo Creek
Minerva Creek
Loneso
me Creek
Charlevue Creek
FishC
reek
Sard ine Creek
Twelve
Mile
Creek
Sandhu
rst Creek
Ragla
n Creek
Ruined Castle Creek
St John Creek
Brow
n
River
Kianga Creek
Charley Creek
Sprin
gton Creek
Wole
ebee
Cre
ek
Kariboe Creek
Cons
uelo
Cree
k
Centre
Creek
Rocky Creek
Moolayember
Creek
Three
Moo
nC
re
ek
Springsure
Cr
eek
Bon
e C reek
StockyardC
reek
Burraburri
Cree
k
North Kariboe Creek
Central Creek
Gra
ntC
reek
Nud ley Creek
DulaccaCreek
Dargal Creek
Juandah Creek
Cattle Creek
Roc
kyGully
Spring Creek
Acacia Creek
Jo
hnson Creek
Blackboy Creek
Injune Creek
LorraineCreek
NorthBungaban Creek
Bullaroo Creek
Jimm
ie Gully
Pump Creek
Pearl Creek
Calliope River
Horse Creek (east Branch)
Raw
belle
Riv
er
Ah S
ee C
reek
Walangara Creek
Baxter Gully
JuandahC
reek
Fitzroy River
Injune Creek
Blackwater Creek
Kianga Creek
BrownRiver
MackenzieR
iver
Spring Creek
Injune Creek
COMET RIVERSUB-BASIN
BALONNE RIVERSUB-BASIN
FITZROY RIVERSUB-BASIN
MACKENZIE RIVERSUB-BASIN
BOYNE - AUBURN RIVERSSUB-BASIN
UPPER BURNETT RIVERSUB-BASIN
CONDAMINE RIVERSUB-BASIN
NOGOA RIVERSUB-BASIN
CALLIOPE RIVERSUB-BASIN
MARANOA RIVERSUB-BASIN
WATERPARK CREEKSUB-BASIN
BOYNE RIVERSUB-BASIN
CURTIS ISLANDSUB-BASIN
FITZROYBASIN
BURNETTBASIN
BALONNE-CONDAMINEBASIN
CALLIOPEBASIN
WATERPARKBASIN
North East CoastDivision
Murray DarlingDivision
625000
625000
650000
650000
675000
675000
700000
700000
725000
725000
750000
750000
775000
775000
800000
800000
825000
825000
850000
850000
875000
875000
900000
900000
7050
000
7050
000
7075
000
7075
000
7100
000
7100
000
7125
000
7125
000
7150
000
7150
000
7175
000
7175
000
7200
000
7200
000
7225
000
7225
000
7250
000
7250
000
7275
000
7275
000
7300
000
7300
000
7325
000
7325
000
7350
000
7350
000
7375
000
7375
000
7400
000
7400
000
7425
000
7425
000
All enquiries:The ManagerGIS Mapping Services (Client Outcomes)Department of Environment and Resource ManagementGPO Box 2454, Brisbane QLD 4001
While every care is taken to ensure the accuracy of this data, the Department ofEnvironment and Resource Management, and/or contributors to this publication, makes no representations or warranties about its accuracy, reliability, completeness orsuitability for any particular purpose and disclaims all responsibility and all liability (including without limitation, liability in negligence) for all injuries, expenses, losses, damages (including indirect or consequential damage) and costs which might be incurred as a result of the data being inaccurate or incomplete in any way or for any reason.
© The State of Queensland (Department of Environment and Resource Management) 2011.
© Microsoft Corp 2009.
Produced by the Department of Environment and Resource Management, July 2011.
DRAFT FLOOD HAZARD LINESDAWSON RIVER SUB-BASIN
Flying date of aerial photography: UnknownPhoto details: ESRI ArcGIS Online Imagery BasemapPixel Sample Distance: Unknown
Digital Cadastral Database (DCDB) is current at July 2011.Positional accuracy representing the 'maximum error' has been calculated at ± 57 metres.
Dawson River
Fitzroy
North East Coast
Horizontal - Geocentric Datum of Australia 1994 (GDA94)Vertical - Australian Height Datum (AHD) 1971
Horizontal - Map Grid of Australia (MGA94), which is a standard Universal TransverseMercator (UTM) projection in Zone 55 with Central Meridian 147° East
Grid lines are at 25 kilometres intervals
Imagery:
Cadastre:
Drainage Sub-Basin:
Drainage Basin:
Drainage Division:
Datum:
Projection:
Graticule:
MAP INFORMATION
SCALE 1:500000
0 5 10 15 20 25 30 35 40 451 2 3 4
Kilometres
LEGEND
Draft Flood Hazard Lines
Drainage Divisions
Drainage Basins
Drainage Sub-Basins
Cadastre
Pre-Amalgamation Local Government Boundaries
Current Local Government Boundaries
Major Watercourses
Original Size is A1
+
Flood Hazard overlay Floodplain Assessment
Performance outcomes
Acceptable Solutions
Floodplain Maps Model Code Provisions
Incorporation into existing Planning Schemes
Existing Planning Schemes in Queensland utilise a number of approaches to trigger additional provisions for certain areas and sensitive development within the LGA. Table 1 below provides a simplified explanation of how the toolkit might be incorporated into different planning schemes across the State.
existing planning scheme Incorporation method
Planning Scheme uses overlays which, when assessing development in a particular (mapped) area to which the overlay applies, triggers an additional set of provisions or regulation.
For example some Planning Schemes may include existing overlays such as Acid Sulphate Soils Overlay, Conservation Overlay and Road and Rail Noise Impacts Overlay.
Include an additional overlay in the ‘Overlays’ part of the Planning Scheme entitled ‘Flood Hazard Overlay - Floodplain Assessment’ which will include reference to the Floodplain Maps and the additional provisions included in the Model Code.
Planning Scheme does not include an ‘Overlays’ section, rather uses the ‘Codes’ Part of the planning scheme to identify area codes that are based on mapping and trigger additional provisions for development within that area.
For example some Planning Schemes may include existing area codes such as Biodiversity Code, Heritage Place Code and Aviation Area Code.
Include an additional code in the “Codes” Part of the Planning Scheme entitled ‘Flood Hazard - Floodplain Assessment Code’ which will act as an area code and will include reference to the Floodplain Maps that will trigger the additional provisions included in the Model Code.
Table 1: Incorporation into existing planning schemes.
14
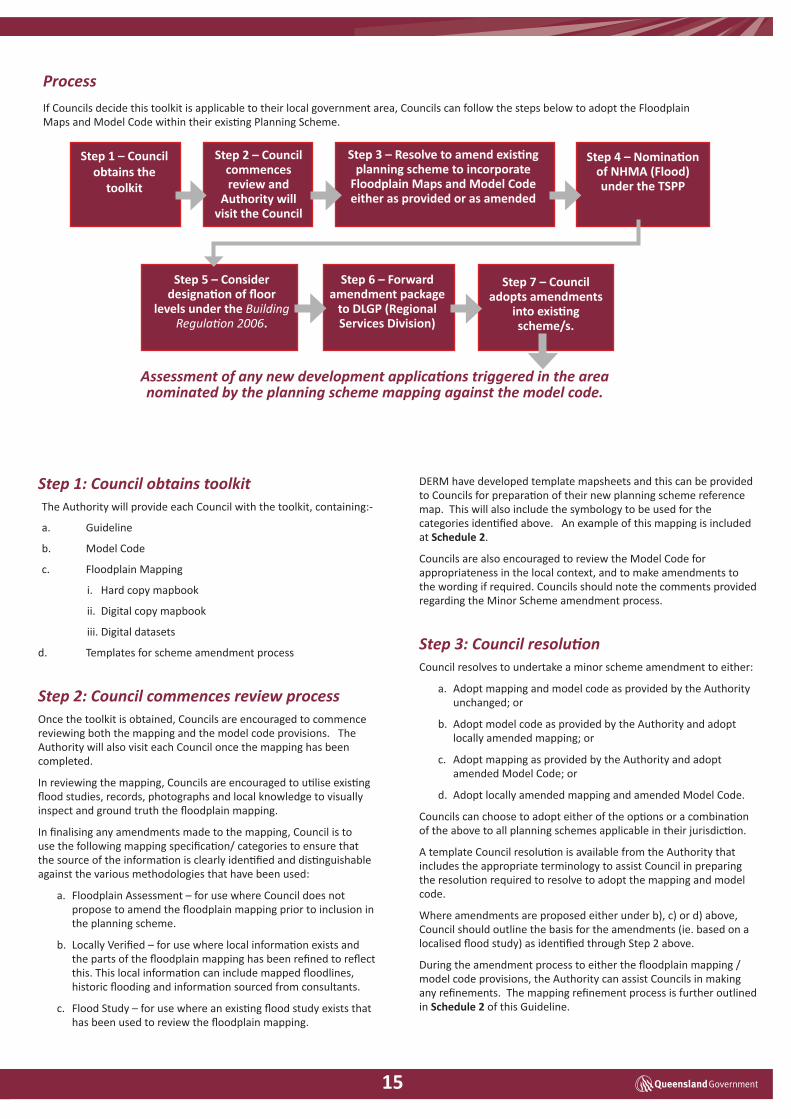
Step 1 – Council obtains the
toolkit
Step 2 – Council commences review and
Authority will visit the Council
Step 3 – Resolve to amend existing planning scheme to incorporate
Floodplain Maps and Model Code either as provided or as amended
Step 4 – Nomination of NHMA (Flood) under the TSPP
Step 5 – Consider designation of floor
levels under the Building Regulation 2006.
Step 6 – Forward amendment package
to DlGP (Regional Services Division)
Step 7 – Council adopts amendments
into existing scheme/s.
Step 1: Council obtains toolkitThe Authority will provide each Council with the toolkit, containing:-
a. Guideline
b. Model Code
c. Floodplain Mapping
i. Hard copy mapbook
ii. Digital copy mapbook
iii. Digital datasets
d. Templates for scheme amendment process
Step 2: Council commences review process Once the toolkit is obtained, Councils are encouraged to commence reviewing both the mapping and the model code provisions. The Authority will also visit each Council once the mapping has been completed.
In reviewing the mapping, Councils are encouraged to utilise existing flood studies, records, photographs and local knowledge to visually inspect and ground truth the floodplain mapping.
In finalising any amendments made to the mapping, Council is to use the following mapping specification/ categories to ensure that the source of the information is clearly identified and distinguishable against the various methodologies that have been used:
a. Floodplain Assessment – for use where Council does not propose to amend the floodplain mapping prior to inclusion in the planning scheme.
b. Locally Verified – for use where local information exists and the parts of the floodplain mapping has been refined to reflect this. This local information can include mapped floodlines, historic flooding and information sourced from consultants.
c. Flood Study – for use where an existing flood study exists that has been used to review the floodplain mapping.
Process
If Councils decide this toolkit is applicable to their local government area, Councils can follow the steps below to adopt the Floodplain Maps and Model Code within their existing Planning Scheme.
DERM have developed template mapsheets and this can be provided to Councils for preparation of their new planning scheme reference map. This will also include the symbology to be used for the categories identified above. An example of this mapping is included at Schedule 2.
Councils are also encouraged to review the Model Code for appropriateness in the local context, and to make amendments to the wording if required. Councils should note the comments provided regarding the Minor Scheme amendment process.
Step 3: Council resolution Council resolves to undertake a minor scheme amendment to either:
a. Adopt mapping and model code as provided by the Authority unchanged; or
b. Adopt model code as provided by the Authority and adopt locally amended mapping; or
c. Adopt mapping as provided by the Authority and adopt amended Model Code; or
d. Adopt locally amended mapping and amended Model Code.
Councils can choose to adopt either of the options or a combination of the above to all planning schemes applicable in their jurisdiction.
A template Council resolution is available from the Authority that includes the appropriate terminology to assist Council in preparing the resolution required to resolve to adopt the mapping and model code.
Where amendments are proposed either under b), c) or d) above, Council should outline the basis for the amendments (ie. based on a localised flood study) as identified through Step 2 above.
During the amendment process to either the floodplain mapping / model code provisions, the Authority can assist Councils in making any refinements. The mapping refinement process is further outlined in Schedule 2 of this Guideline.
Assessment of any new development applications triggered in the area nominated by the planning scheme mapping against the model code.
15
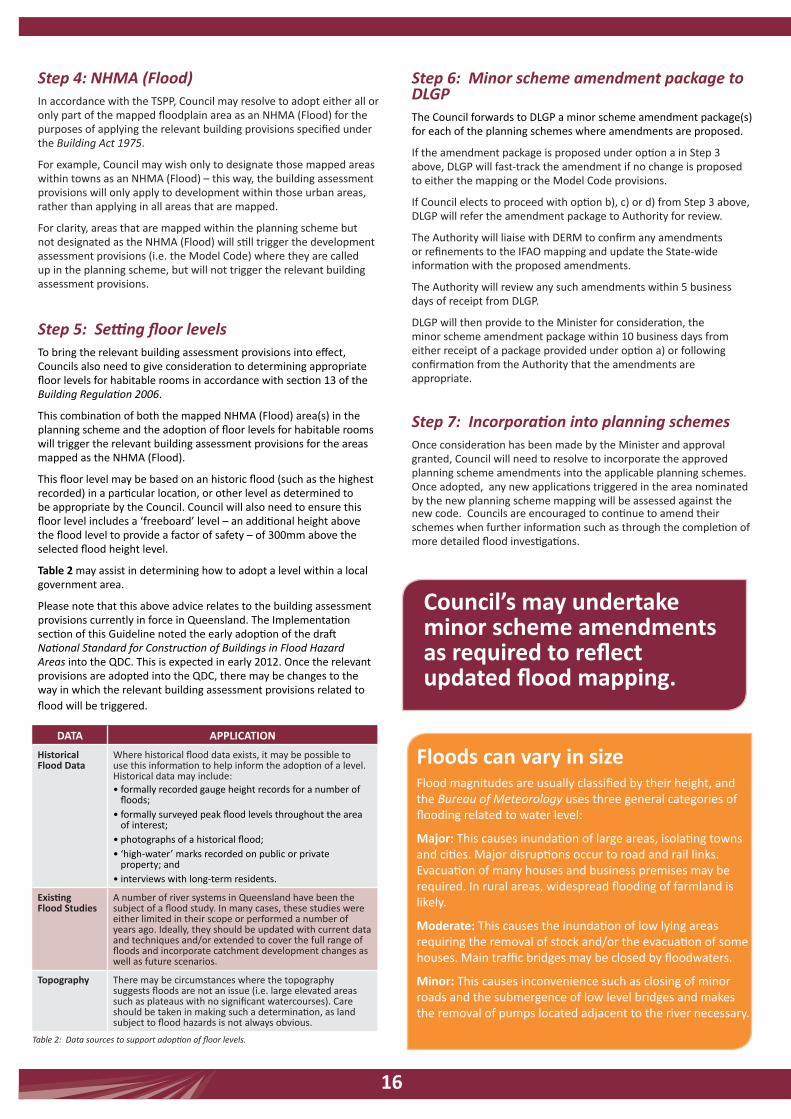
Floods can vary in size Flood magnitudes are usually classified by their height, and the Bureau of Meteorology uses three general categories of flooding related to water level:
Major: This causes inundation of large areas, isolating towns and cities. Major disruptions occur to road and rail links. Evacuation of many houses and business premises may be required. In rural areas, widespread flooding of farmland is likely.
Moderate: This causes the inundation of low lying areas requiring the removal of stock and/or the evacuation of some houses. Main traffic bridges may be closed by floodwaters.
Minor: This causes inconvenience such as closing of minor roads and the submergence of low level bridges and makes the removal of pumps located adjacent to the river necessary.
DATA APPlICATIoN
Historical Flood Data
Where historical flood data exists, it may be possible to use this information to help inform the adoption of a level. Historical data may include:
• formally recorded gauge height records for a number of floods; • formally surveyed peak flood levels throughout the area of interest; • photographs of a historical flood; • ‘high-water’ marks recorded on public or private property; and • interviews with long-term residents.
existing Flood Studies
A number of river systems in Queensland have been the subject of a flood study. In many cases, these studies were either limited in their scope or performed a number of years ago. Ideally, they should be updated with current data and techniques and/or extended to cover the full range of floods and incorporate catchment development changes as well as future scenarios.
Topography There may be circumstances where the topography suggests floods are not an issue (i.e. large elevated areas such as plateaus with no significant watercourses). Care should be taken in making such a determination, as land subject to flood hazards is not always obvious.
Step 4: NHMA (Flood) In accordance with the TSPP, Council may resolve to adopt either all or only part of the mapped floodplain area as an NHMA (Flood) for the purposes of applying the relevant building provisions specified under the Building Act 1975.
For example, Council may wish only to designate those mapped areas within towns as an NHMA (Flood) – this way, the building assessment provisions will only apply to development within those urban areas, rather than applying in all areas that are mapped.
For clarity, areas that are mapped within the planning scheme but not designated as the NHMA (Flood) will still trigger the development assessment provisions (i.e. the Model Code) where they are called up in the planning scheme, but will not trigger the relevant building assessment provisions.
Step 5: Setting floor levelsTo bring the relevant building assessment provisions into effect, Councils also need to give consideration to determining appropriate floor levels for habitable rooms in accordance with section 13 of the Building Regulation 2006.
This combination of both the mapped NHMA (Flood) area(s) in the planning scheme and the adoption of floor levels for habitable rooms will trigger the relevant building assessment provisions for the areas mapped as the NHMA (Flood).
This floor level may be based on an historic flood (such as the highest recorded) in a particular location, or other level as determined to be appropriate by the Council. Council will also need to ensure this floor level includes a ‘freeboard’ level – an additional height above the flood level to provide a factor of safety – of 300mm above the selected flood height level.
Table 2 may assist in determining how to adopt a level within a local government area.
Please note that this above advice relates to the building assessment provisions currently in force in Queensland. The Implementation section of this Guideline noted the early adoption of the draft National Standard for Construction of Buildings in Flood Hazard Areas into the QDC. This is expected in early 2012. Once the relevant provisions are adopted into the QDC, there may be changes to the way in which the relevant building assessment provisions related to flood will be triggered.
Step 6: Minor scheme amendment package to DLGP The Council forwards to DLGP a minor scheme amendment package(s) for each of the planning schemes where amendments are proposed.
If the amendment package is proposed under option a in Step 3 above, DLGP will fast-track the amendment if no change is proposed to either the mapping or the Model Code provisions.
If Council elects to proceed with option b), c) or d) from Step 3 above, DLGP will refer the amendment package to Authority for review.
The Authority will liaise with DERM to confirm any amendments or refinements to the IFAO mapping and update the State-wide information with the proposed amendments.
The Authority will review any such amendments within 5 business days of receipt from DLGP.
DLGP will then provide to the Minister for consideration, the minor scheme amendment package within 10 business days from either receipt of a package provided under option a) or following confirmation from the Authority that the amendments are appropriate.
Step 7: Incorporation into planning schemes Once consideration has been made by the Minister and approval granted, Council will need to resolve to incorporate the approved planning scheme amendments into the applicable planning schemes. Once adopted, any new applications triggered in the area nominated by the new planning scheme mapping will be assessed against the new code. Councils are encouraged to continue to amend their schemes when further information such as through the completion of more detailed flood investigations.
Table 2: Data sources to support adoption of floor levels.
Council’s may undertake minor scheme amendments as required to reflect updated flood mapping.
16
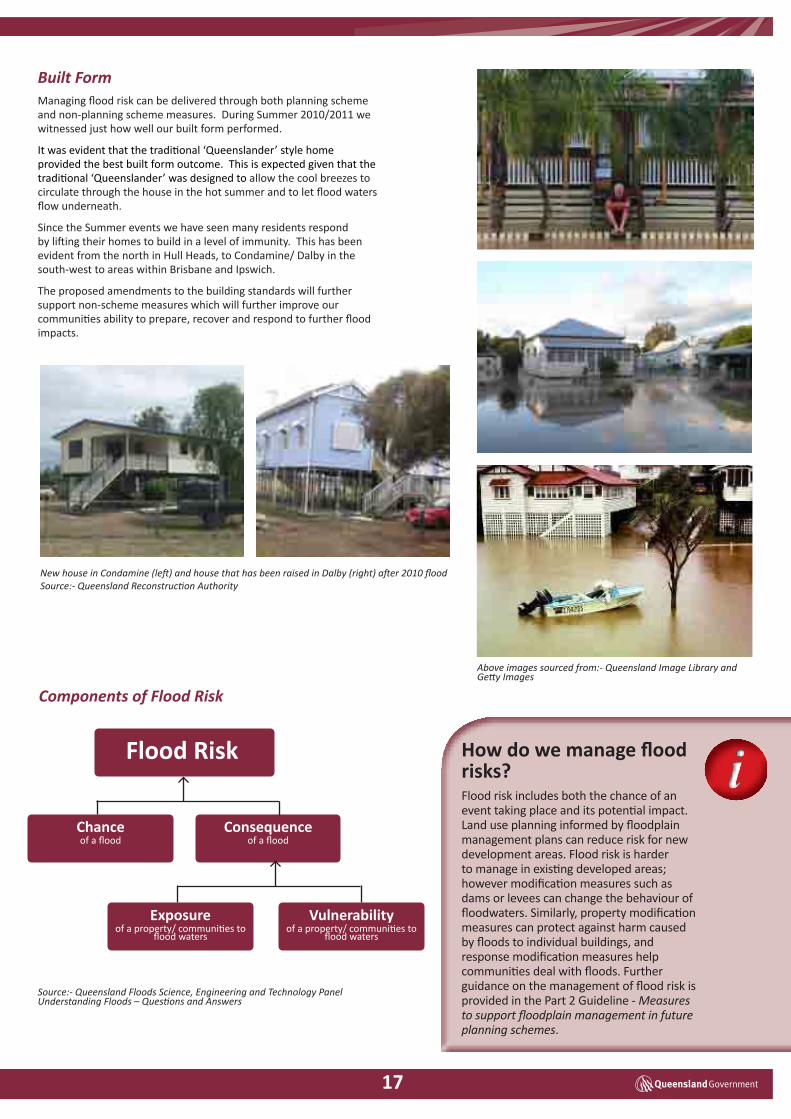
Built Form Managing flood risk can be delivered through both planning scheme and non-planning scheme measures. During Summer 2010/2011 we witnessed just how well our built form performed.
It was evident that the traditional ‘Queenslander’ style home provided the best built form outcome. This is expected given that the traditional ‘Queenslander’ was designed to allow the cool breezes to circulate through the house in the hot summer and to let flood waters flow underneath.
Since the Summer events we have seen many residents respond by lifting their homes to build in a level of immunity. This has been evident from the north in Hull Heads, to Condamine/ Dalby in the south-west to areas within Brisbane and Ipswich.
The proposed amendments to the building standards will further support non-scheme measures which will further improve our communities ability to prepare, recover and respond to further flood impacts.
Flood Risk
Chance of a flood
Consequenceof a flood
exposure of a property/ communities to
flood waters
Vulnerability of a property/ communities to
flood waters
Source:- Queensland Floods Science, Engineering and Technology Panel Understanding Floods – Questions and Answers
How do we manage flood risks? Flood risk includes both the chance of an event taking place and its potential impact. Land use planning informed by floodplain management plans can reduce risk for new development areas. Flood risk is harder to manage in existing developed areas; however modification measures such as dams or levees can change the behaviour of floodwaters. Similarly, property modification measures can protect against harm caused by floods to individual buildings, and response modification measures help communities deal with floods. Further guidance on the management of flood risk is provided in the Part 2 Guideline - Measures to support floodplain management in future planning schemes.
Above images sourced from:- Queensland Image Library and Getty Images
New house in Condamine (left) and house that has been raised in Dalby (right) after 2010 floodSource:- Queensland Reconstruction Authority
Components of Flood Risk
17

Schedule 1 – Model Code
1. Application
This Code is an applicable code for assessable development prescribed by a level of assessment table in a zone , overlay and/or local plan and involving land wholly or partially within the area identified in the Flood Hazard Overlay- Floodplain Assessment maps provided at xxxxxx.
This Code is a Queensland Planning Provision (QPP)-compliant Code. For the avoidance of doubt, the following QPP-specific terms in this Code have the following meanings under Integrated Planning Act 1997 (IPA)-compliant planning schemes:
QPP Compliant Term Corresponding IPA- compliant Term
Overall Outcome Overall Outcome
Performance Outcome Specific Outcome
Acceptable Outcome Acceptable Solution/Probable Solution
Zone Area, Precinct, Domain or District or other term commonly understood as a zoning mechanism
Compliance with the Acceptable Outcomes should not be regarded as satisfying all elements of the Performance Outcomes.
The Code must be considered together with other relevant Planning Scheme codes that are applicable to the subject development.
2. Purpose
The purpose of the Code is to manage development outcomes in the floodplain so that risk to life, property, community and the environment during future flood events is minimised, and to ensure that development does not increase the potential for flood damage on site or to other property.
3. overall outcomes
The purpose of the Code will be achieved through the following overall outcomes:
a) Development maintains the safety of people on the development site from flood events and minimises the potential damage from flooding to property.
b) Development does not result in adverse impacts on people’s safety, the environment or the capacity to use land within the floodplain.
4. Performance outcomes and Acceptable outcomes
Performance outcomes Acceptable outcomes
Po1. Development siting and layout responds to flooding potential and maintains personal safety at all times. 1
For Material Change of Use
Ao1.1 New buildings are:
• not located within the overlay area, or;
• located on the highest part of the site to minimise entrance of floodwaters; or
• elevated; and
• provided with clear and direct pedestrian and vehicle evacuation routes off the site.
Note: If part of the site is outside the Flood Hazard Overlay area, this is the preferred location for all buildings.
For Reconfiguring a lot
Ao1.2 New lots are:
• located outside the overlay area; or
• where possible, located on the highest part of the site to minimise entrance of floodwaters.
Note: If part of the site is outside the Flood Hazard Overlay area, this is the preferred location for all lots (excluding park or other relevant open space and recreation lots).
Note: Buildings subsequently developed on the lots created will need to comply with the relevant building assessment provisions under the Building Act 1975.
18
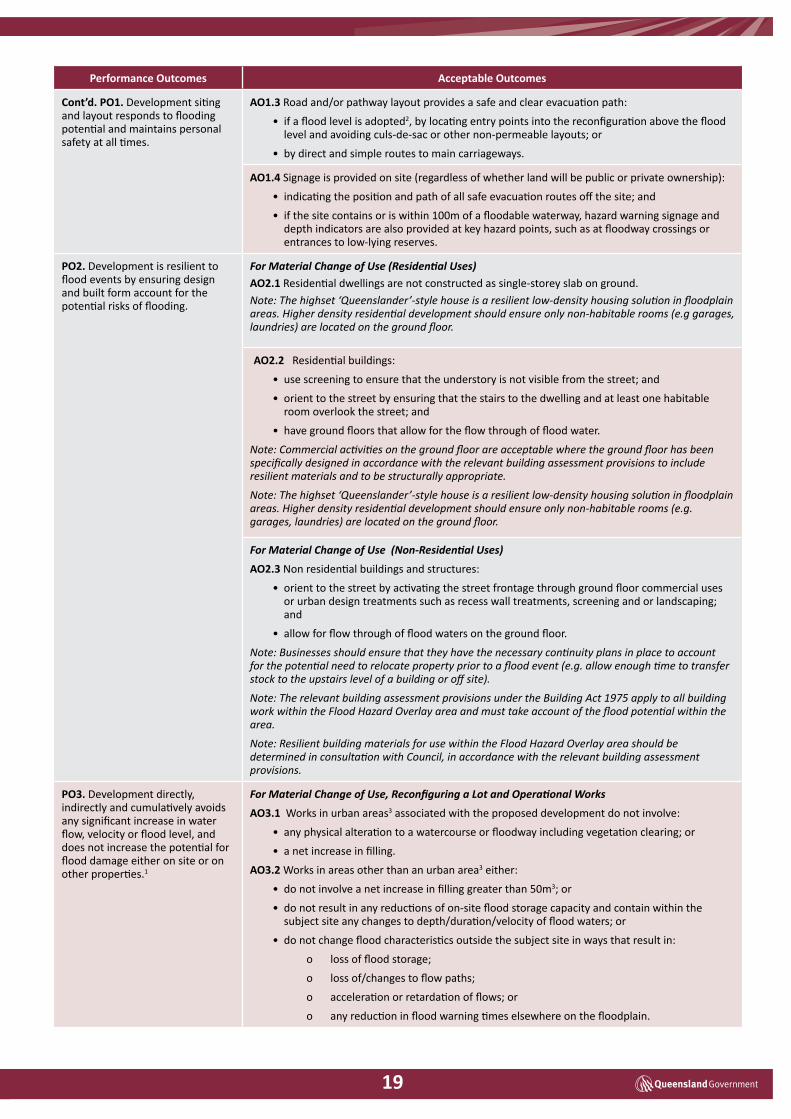
Performance outcomes Acceptable outcomes
Po1. Development siting and layout responds to flooding potential and maintains personal safety at all times. 1
For Material Change of Use
Ao1.1 New buildings are:
• not located within the overlay area, or;
• located on the highest part of the site to minimise entrance of floodwaters; or
• elevated; and
• provided with clear and direct pedestrian and vehicle evacuation routes off the site.
Note: If part of the site is outside the Flood Hazard Overlay area, this is the preferred location for all buildings.
For Reconfiguring a lot
Ao1.2 New lots are:
• located outside the overlay area; or
• where possible, located on the highest part of the site to minimise entrance of floodwaters.
Note: If part of the site is outside the Flood Hazard Overlay area, this is the preferred location for all lots (excluding park or other relevant open space and recreation lots).
Note: Buildings subsequently developed on the lots created will need to comply with the relevant building assessment provisions under the Building Act 1975.
Performance outcomes Acceptable outcomes
Cont’d. Po1. Development siting and layout responds to flooding potential and maintains personal safety at all times.
Ao1.3 Road and/or pathway layout provides a safe and clear evacuation path:
• if a flood level is adopted2, by locating entry points into the reconfiguration above the flood level and avoiding culs-de-sac or other non-permeable layouts; or
• by direct and simple routes to main carriageways.
Ao1.4 Signage is provided on site (regardless of whether land will be public or private ownership):
• indicating the position and path of all safe evacuation routes off the site; and
• if the site contains or is within 100m of a floodable waterway, hazard warning signage and depth indicators are also provided at key hazard points, such as at floodway crossings or entrances to low-lying reserves.
Po2. Development is resilient to flood events by ensuring design and built form account for the potential risks of flooding.
For Material Change of Use (Residential Uses)Ao2.1 Residential dwellings are not constructed as single-storey slab on ground. Note: The highset ‘Queenslander’-style house is a resilient low-density housing solution in floodplain areas. Higher density residential development should ensure only non-habitable rooms (e.g garages, laundries) are located on the ground floor.
Ao2.2 Residential buildings:
• use screening to ensure that the understory is not visible from the street; and
• orient to the street by ensuring that the stairs to the dwelling and at least one habitable room overlook the street; and
• have ground floors that allow for the flow through of flood water.
Note: Commercial activities on the ground floor are acceptable where the ground floor has been specifically designed in accordance with the relevant building assessment provisions to include resilient materials and to be structurally appropriate.
Note: The highset ‘Queenslander’-style house is a resilient low-density housing solution in floodplain areas. Higher density residential development should ensure only non-habitable rooms (e.g. garages, laundries) are located on the ground floor.
For Material Change of Use (Non-Residential Uses)
Ao2.3 Non residential buildings and structures:
• orient to the street by activating the street frontage through ground floor commercial uses or urban design treatments such as recess wall treatments, screening and or landscaping; and
• allow for flow through of flood waters on the ground floor.
Note: Businesses should ensure that they have the necessary continuity plans in place to account for the potential need to relocate property prior to a flood event (e.g. allow enough time to transfer stock to the upstairs level of a building or off site).
Note: The relevant building assessment provisions under the Building Act 1975 apply to all building work within the Flood Hazard Overlay area and must take account of the flood potential within the area.
Note: Resilient building materials for use within the Flood Hazard Overlay area should be determined in consultation with Council, in accordance with the relevant building assessment provisions.
Po3. Development directly, indirectly and cumulatively avoids any significant increase in water flow, velocity or flood level, and does not increase the potential for flood damage either on site or on other properties.1
For Material Change of Use, Reconfiguring a Lot and Operational Works
Ao3.1 Works in urban areas3 associated with the proposed development do not involve:
• any physical alteration to a watercourse or floodway including vegetation clearing; or
• a net increase in filling.
Ao3.2 Works in areas other than an urban area3 either:
• do not involve a net increase in filling greater than 50m3; or
• do not result in any reductions of on-site flood storage capacity and contain within the subject site any changes to depth/duration/velocity of flood waters; or
• do not change flood characteristics outside the subject site in ways that result in:
o loss of flood storage;
o loss of/changes to flow paths;
o acceleration or retardation of flows; or
o any reduction in flood warning times elsewhere on the floodplain.
19
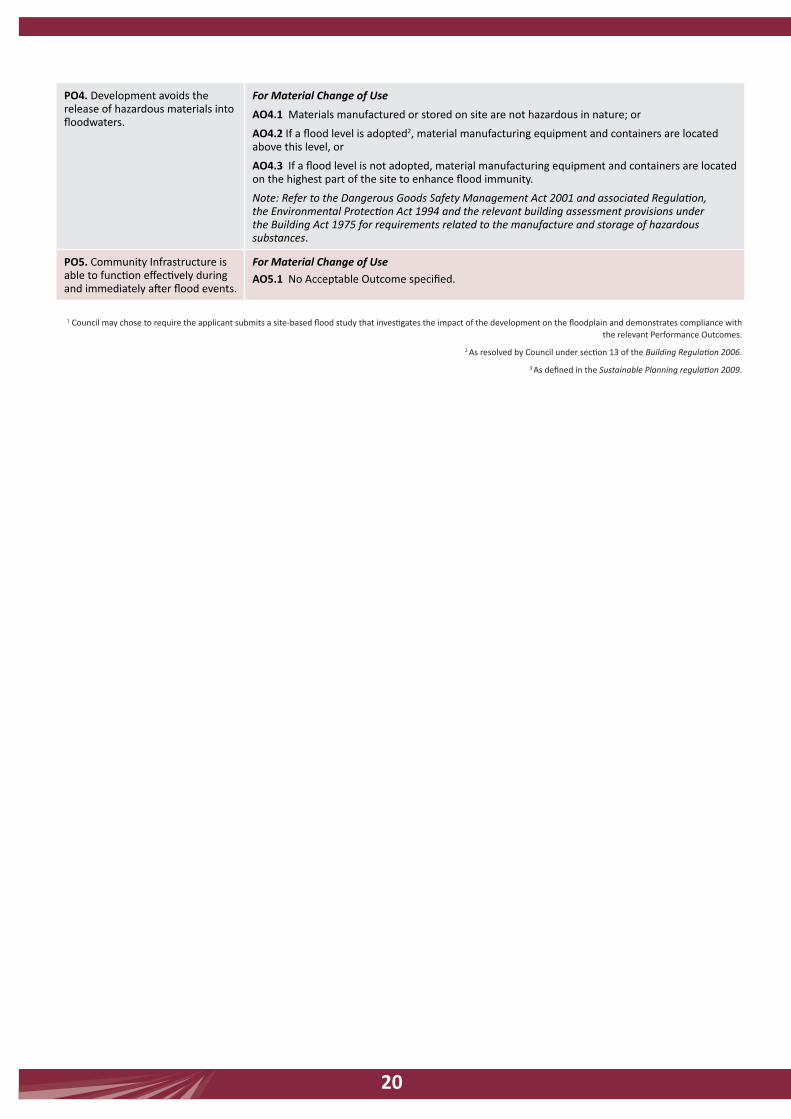
Po4. Development avoids the release of hazardous materials into floodwaters.
For Material Change of Use
Ao4.1 Materials manufactured or stored on site are not hazardous in nature; or
Ao4.2 If a flood level is adopted2, material manufacturing equipment and containers are located above this level, or
Ao4.3 If a flood level is not adopted, material manufacturing equipment and containers are located on the highest part of the site to enhance flood immunity.
Note: Refer to the Dangerous Goods Safety Management Act 2001 and associated Regulation, the Environmental Protection Act 1994 and the relevant building assessment provisions under the Building Act 1975 for requirements related to the manufacture and storage of hazardous substances.
Po5. Community Infrastructure is able to function effectively during and immediately after flood events.
For Material Change of Use Ao5.1 No Acceptable Outcome specified.
1 Council may chose to require the applicant submits a site-based flood study that investigates the impact of the development on the floodplain and demonstrates compliance with the relevant Performance Outcomes.
2 As resolved by Council under section 13 of the Building Regulation 2006.
3 As defined in the Sustainable Planning regulation 2009.
20

Case Study 1Material Change of Use – Residential (Six Townhouses)
Case Study 2Reconfiguring a lot – Residential (1 into 8)
Proposed Development: 6 x 3 storey townhouses with ground floor car accommodation
Assessment against IFAo Model Code:This proposed development complies with the Model Code, as:
• Council sought a flood/hydraulic study identifying a flood level for the site, which the applicant provided
• Buildings are elevated above this level and development has a simple direct evacuation route off site
• Dwellings are not single storey slab on ground – habitable rooms are elevated through ground floor used as car accommodation
• Site is in urban area and no alteration to watercourse or filling is proposed
• No hazardous materials to be stored on site
• Not a Community Infrastructure item
Application is supported by Council
Proposed Development: Residential Subdivision 1 into 8 lots
Assessment against IFAo Model Code:This proposed development complies with the Model Code, as:
• Council requested verification of flood level through flood/hydraulic study during application stage, which applicant provided
• All proposed new lots located outside of IFAO Floodplain Mapped Area, with a balance park within the overlay area – while not mandatory, this is the most appropriate design outcome to ensure house lots will not be inundated
• Road layout is direct and simple to allow for evacuation during flood
• Appropriate signage is provided indicating evacuation routes
• Site is in urban area and no alteration to watercourse or filling is proposed
Application is supported by Council
Site location: Substantially within IFAO Floodplain Mapped Area
other Planning Considerations: Within relevant Zone in Planning Scheme that envisages higher density residential development
Site location: Part of site within IFAO Floodplain Mapped Area
other Planning Considerations: Within relevant Zone in Planning Scheme that envisages residential subdivision
Po4. Development avoids the release of hazardous materials into floodwaters.
For Material Change of Use
Ao4.1 Materials manufactured or stored on site are not hazardous in nature; or
Ao4.2 If a flood level is adopted2, material manufacturing equipment and containers are located above this level, or
Ao4.3 If a flood level is not adopted, material manufacturing equipment and containers are located on the highest part of the site to enhance flood immunity.
Note: Refer to the Dangerous Goods Safety Management Act 2001 and associated Regulation, the Environmental Protection Act 1994 and the relevant building assessment provisions under the Building Act 1975 for requirements related to the manufacture and storage of hazardous substances.
Po5. Community Infrastructure is able to function effectively during and immediately after flood events.
For Material Change of Use Ao5.1 No Acceptable Outcome specified.
21
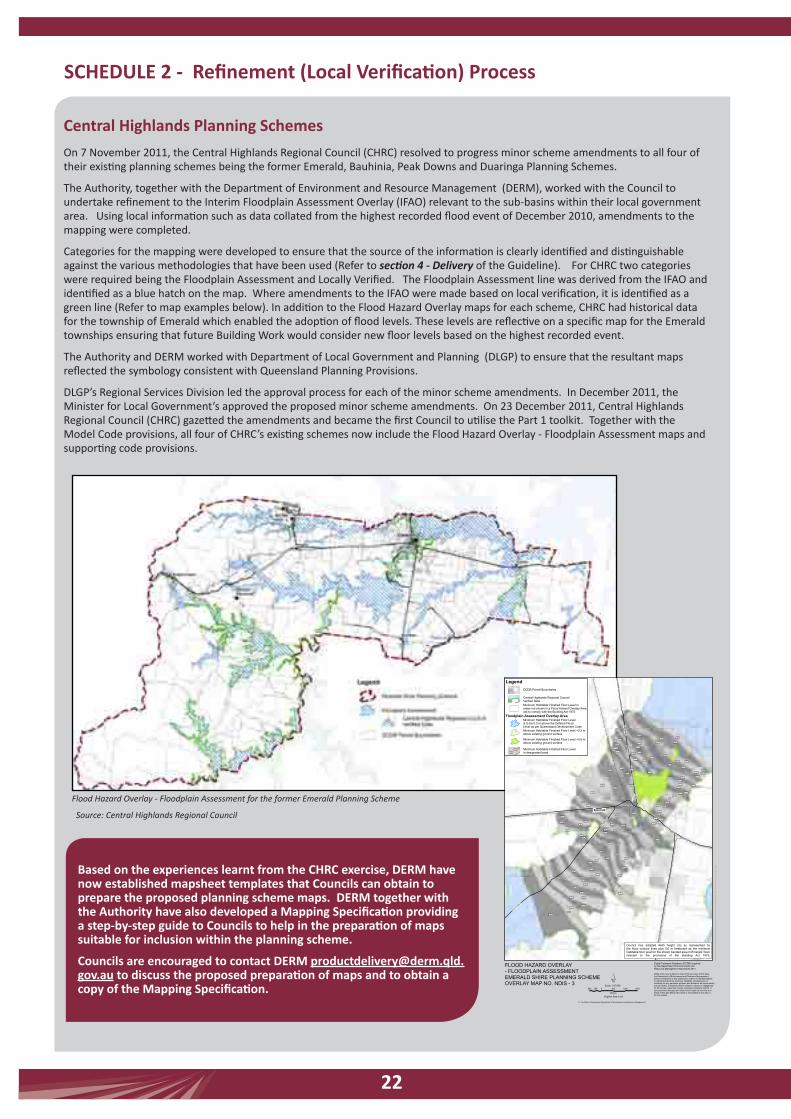
SCHeDUle 2 - Refinement (local Verification) Process
Central Highlands Planning Schemes
On 7 November 2011, the Central Highlands Regional Council (CHRC) resolved to progress minor scheme amendments to all four of their existing planning schemes being the former Emerald, Bauhinia, Peak Downs and Duaringa Planning Schemes.
The Authority, together with the Department of Environment and Resource Management (DERM), worked with the Council to undertake refinement to the Interim Floodplain Assessment Overlay (IFAO) relevant to the sub-basins within their local government area. Using local information such as data collated from the highest recorded flood event of December 2010, amendments to the mapping were completed.
Categories for the mapping were developed to ensure that the source of the information is clearly identified and distinguishable against the various methodologies that have been used (Refer to section 4 - Delivery of the Guideline). For CHRC two categories were required being the Floodplain Assessment and Locally Verified. The Floodplain Assessment line was derived from the IFAO and identified as a blue hatch on the map. Where amendments to the IFAO were made based on local verification, it is identified as a green line (Refer to map examples below). In addition to the Flood Hazard Overlay maps for each scheme, CHRC had historical data for the township of Emerald which enabled the adoption of flood levels. These levels are reflective on a specific map for the Emerald townships ensuring that future Building Work would consider new floor levels based on the highest recorded event.
The Authority and DERM worked with Department of Local Government and Planning (DLGP) to ensure that the resultant maps reflected the symbology consistent with Queensland Planning Provisions.
DLGP’s Regional Services Division led the approval process for each of the minor scheme amendments. In December 2011, the Minister for Local Government’s approved the proposed minor scheme amendments. On 23 December 2011, Central Highlands Regional Council (CHRC) gazetted the amendments and became the first Council to utilise the Part 1 toolkit. Together with the Model Code provisions, all four of CHRC’s existing schemes now include the Flood Hazard Overlay - Floodplain Assessment maps and supporting code provisions.
Flood Hazard Overlay - Floodplain Assessment for the former Emerald Planning Scheme
Source: Central Highlands Regional Council
SELMA
ROAD
SELMA
ROAD
CAPRICORN HIGHWAY
GR
EGO
RY
HIG
HW
AY
CAPRICORN
HIGHWAY
GR
EGO
RY H
IGH
WAY
CA
RIN
GA
L R
OAD
HOSPI TA
L RO
AD
179.2179.1
178.7180.5
180.4
178.6
180.3
178.5
180.2
180.1180
178.4
179.9
178.3
179.8
178.2
179.7
179.6
178.1179.5
178
179.4
177.9177.8
179.3
177.7
177.6
177.5
177.4
177.3
176.9
179.2
176.8
177.2
181.3
176.6
179.1
176.9
179
176.8
178.9
176.7
178.8
178.7
178.4178.6
178.3
178.2
178.1
178
178.5
177.9
177.8
177.7
177.6
177.5
177.4
177.3
177.2
177.1
177
176.6
176.5176.7
176.8
176.4
182.9
179.4
182.8
182.7182.6
182.5
182.3
182.2
182.1182
181.9
182.4
181.8
181.7
181.6
181.5
176.7
181.4
181.2
181.1
181
180.9
180.8
180.7
180.9
180.6
180.8
180.5
180.4
180.3
180.7
180.6
176.9
FLOOD HAZARD OVERLAY- FLOODPLAIN ASSESSMENTEMERALD SHIRE PLANNING SCHEMEOVERLAY MAP NO. NDIS - 3
Digital Cadastral Database (DCDB) suppliedby the Department of Environment andResource Management November 2011.
500 0 500 1,000 1,500250
Metres
Original Size is A3
While every care is taken to ensure the accuracy of this data,the Department of Environment and Resource Management,and/or contributors to this publication, makes no representationsor warranties about its accuracy, reliability, completeness orsuitability for any particular purpose and disclaims all responsibilityand all liability (including without limitation, liability in negligence)for all injuries, expenses, losses, damages (including indirect orconsequential damage) and costs which might be incurred as aresult of the data being inaccurate or incomplete in any way orfor any reason.
© The State of Queensland (Department of Environment and Resource Management)
´Scale 1:35,000
\\Mpi
mag
ery\
mps
\CLI
EN
T M
APP
ING
\Sta
te N
atur
al H
azar
d Fl
oodl
ine
Pro
ject
\MX
D's
\CH
RC
_Em
eral
d_IF
AO
_201
1120
7.m
xd
Emerald
Council has adopted AHD height (m) as represented bythe flood contour lines plus 0.6 m freeboard as the minimumhabitable floor level for the shown banded area in Emerald Townrelevant to the provisions of the Building Act 1975.
LegendDCDB Parcel Boundaries
Central Highlands Regional CouncilVerified Data
177.9
178
Minimum Habitable Finished Floor Levelin designated band
Minimum Habitable Finished Floor Level +0.3 mabove existing ground surface
Minimum Habitable Finished Floor Level +0.6 mabove existing ground surface
Minimum Habitable Finished Floor Levelis to be 0.3 m above the Defined FloodLevel as per Queensland Development Code
Floodplain Assessment Overlay Area
Minimum Habitable Finished Floor Level inareas not shown in a Flood Hazard Overlay Areaare to comply with the Building Act 1975
Based on the experiences learnt from the CHRC exercise, DeRM have now established mapsheet templates that Councils can obtain to prepare the proposed planning scheme maps. DeRM together with the Authority have also developed a Mapping Specification providing a step-by-step guide to Councils to help in the preparation of maps suitable for inclusion within the planning scheme.
Councils are encouraged to contact DeRM [email protected] to discuss the proposed preparation of maps and to obtain a copy of the Mapping Specification.
22
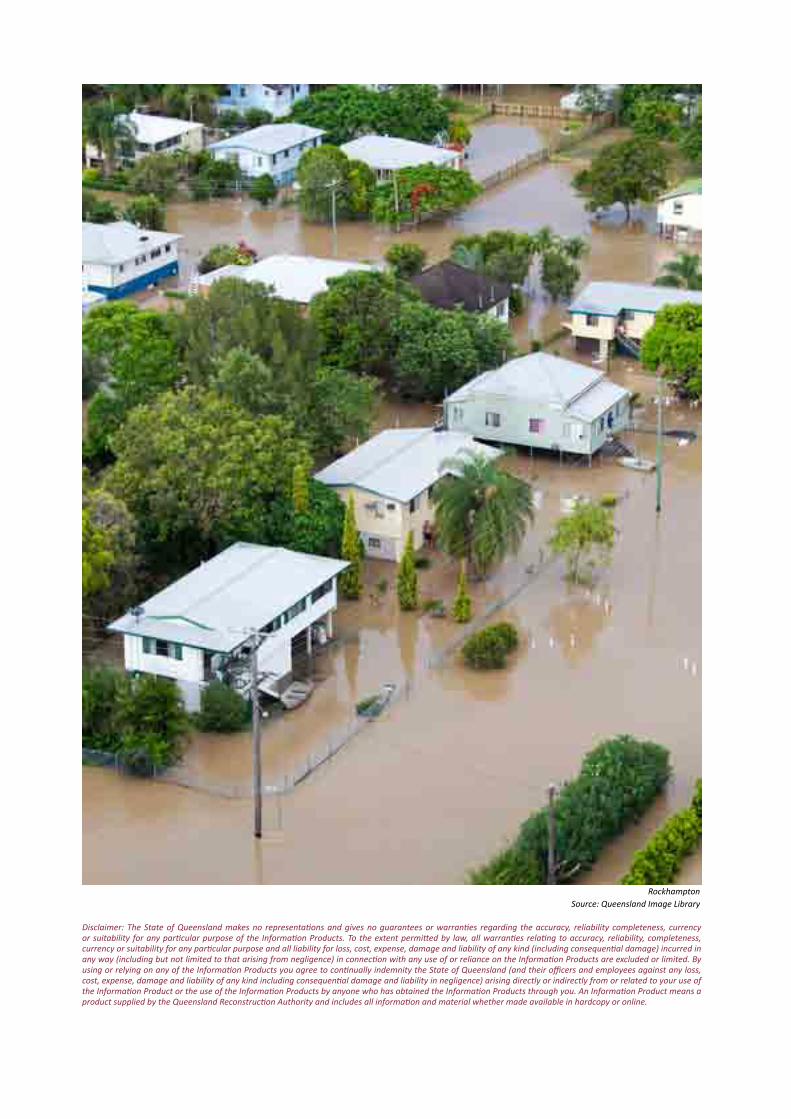
Disclaimer: The State of Queensland makes no representations and gives no guarantees or warranties regarding the accuracy, reliability completeness, currency or suitability for any particular purpose of the Information Products. To the extent permitted by law, all warranties relating to accuracy, reliability, completeness, currency or suitability for any particular purpose and all liability for loss, cost, expense, damage and liability of any kind (including consequential damage) incurred in any way (including but not limited to that arising from negligence) in connection with any use of or reliance on the Information Products are excluded or limited. By using or relying on any of the Information Products you agree to continually indemnity the State of Queensland (and their officers and employees against any loss, cost, expense, damage and liability of any kind including consequential damage and liability in negligence) arising directly or indirectly from or related to your use of the Information Product or the use of the Information Products by anyone who has obtained the Information Products through you. An Information Product means a product supplied by the Queensland Reconstruction Authority and includes all information and material whether made available in hardcopy or online.
Rockhampton Source: Queensland Image Library