Embed Size (px)
Citation preview

Planning For Retirement
Dr. Thomas E. BellMay 4, 2007
Press F5 for slide show.Backup slides are hidden in slide show but availablein normal view.

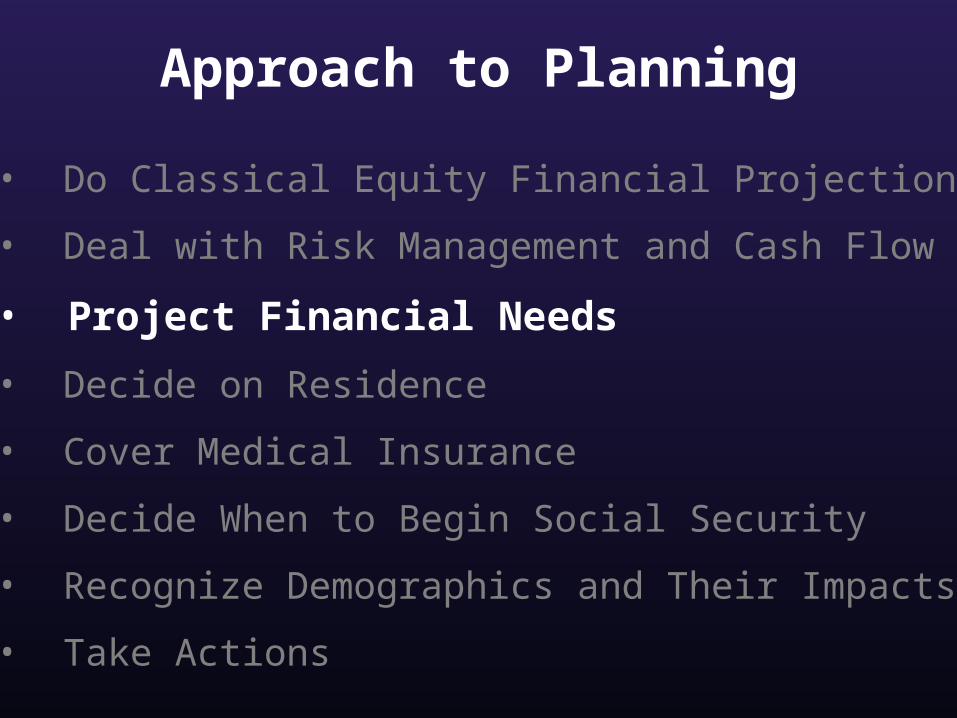
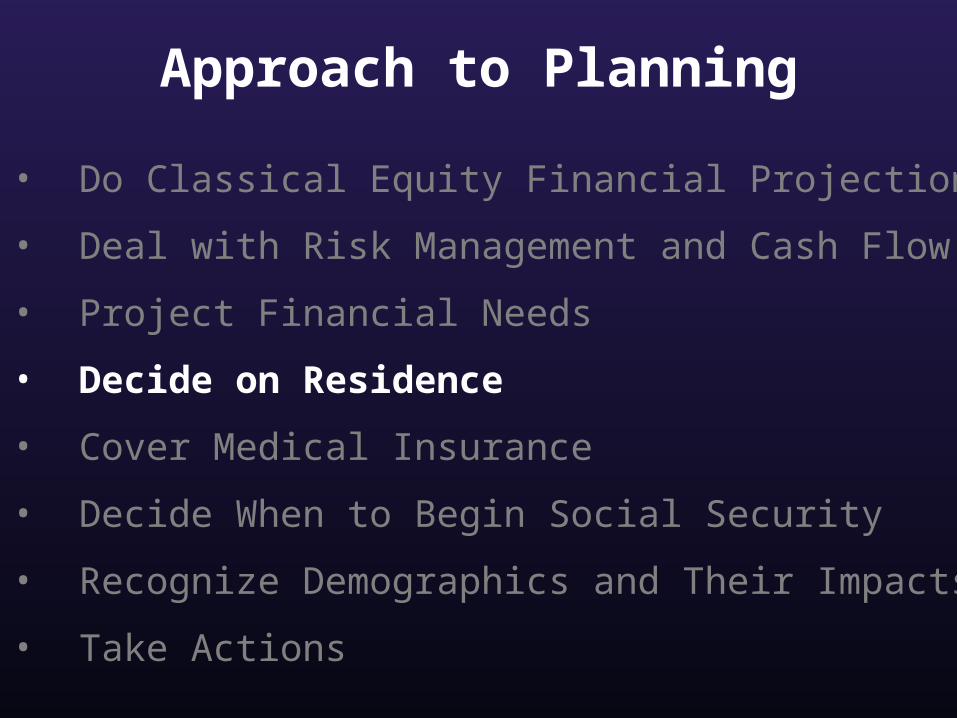
Approach to Planning
• Do Classical Equity Financial Projection
• Deal with Risk Management and Cash Flow
• Project Financial Needs
• Decide on Residence
• Cover Medical Insurance
• Decide When to Begin Social Security
• Recognize Demographics and Their Impacts
• Take Actions

Growth of Savings
0
500,000
1,000,000
1,500,000
2,000,000
2,500,000
3,000,000
2005 2010 2015 2020 2025 2030 2035 2040 2045 2050
9.0%
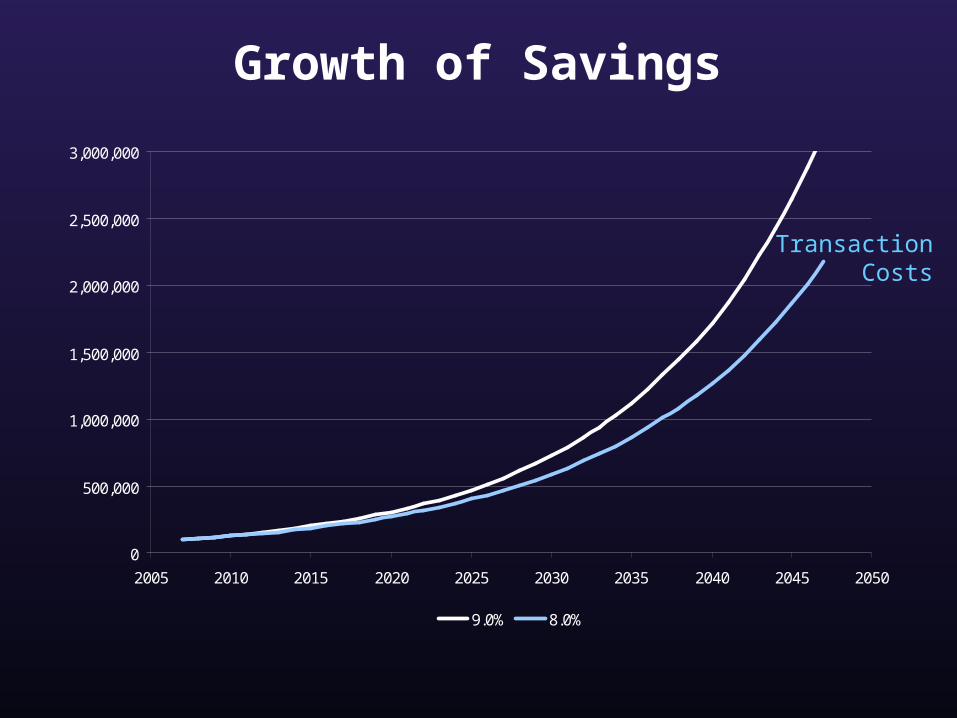
Growth of Savings
0
500,000
1,000,000
1,500,000
2,000,000
2,500,000
3,000,000
2005 2010 2015 2020 2025 2030 2035 2040 2045 2050
9.0% 8.0%
TransactionCosts

Growth of Savings
0
500,000
1,000,000
1,500,000
2,000,000
2,500,000
3,000,000
2005 2010 2015 2020 2025 2030 2035 2040 2045 2050
9.0% 8.0% 6.8%
TransactionCosts
ManagementFees

Growth of Savings
0
500,000
1,000,000
1,500,000
2,000,000
2,500,000
3,000,000
2005 2010 2015 2020 2025 2030 2035 2040 2045 2050
9.0% 8.0% 6.8% 4.8%
TransactionCosts
ManagementFees
Inflation
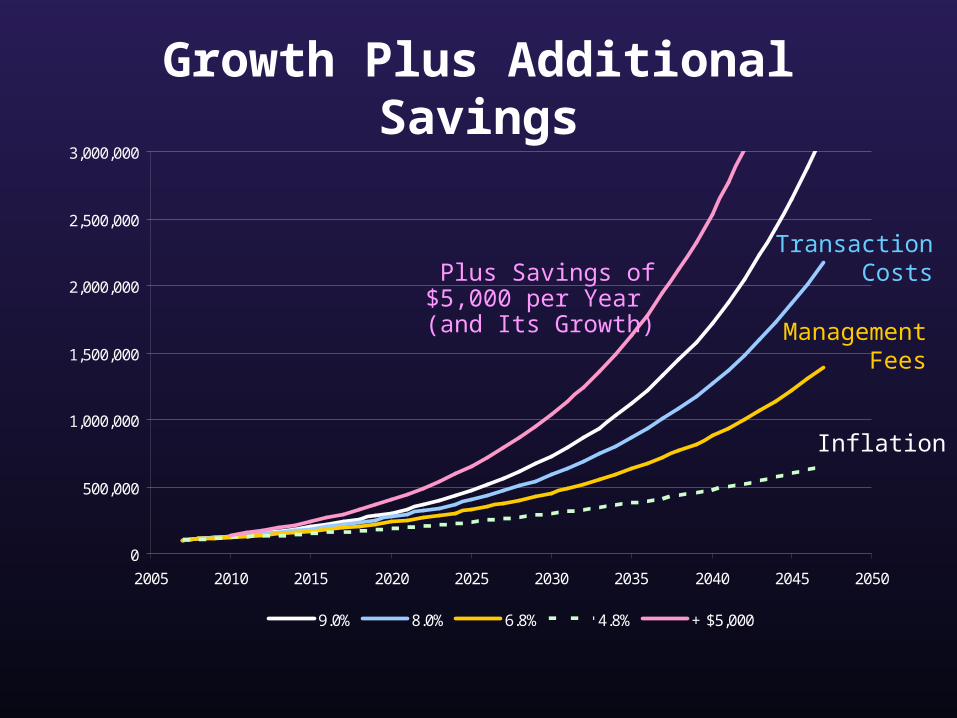
Growth Plus Additional Savings
0
500,000
1,000,000
1,500,000
2,000,000
2,500,000
3,000,000
2005 2010 2015 2020 2025 2030 2035 2040 2045 2050
9.0% 8.0% 6.8% 4.8% + $5,000
Plus Savings of$5,000 per Year (and Its Growth)
TransactionCosts
ManagementFees
Inflation

Approach to Planning
• Do Classical Equity Financial Projection
• Deal with Risk Management and Cash Flow
• Project Financial Needs
• Decide on Residence
• Cover Medical Insurance
• Decide When to Begin Social Security
• Recognize Demographics and Their Impacts
• Take Actions
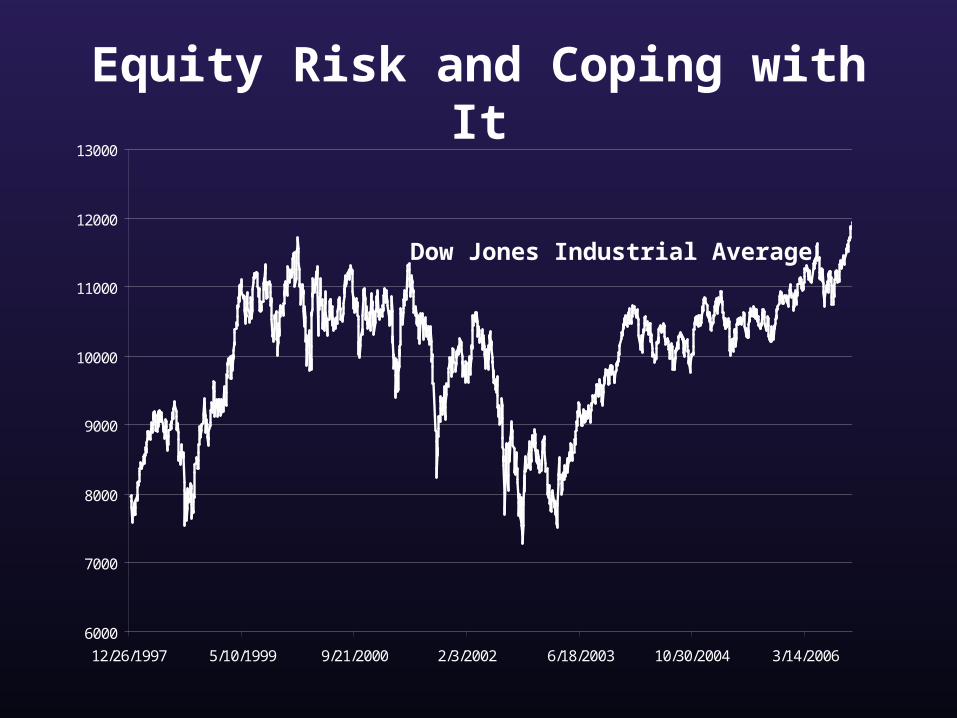
Equity Risk and Coping with It
6000
7000
8000
9000
10000
11000
12000
13000
12/26/1997 5/10/1999 9/21/2000 2/3/2002 6/18/2003 10/30/2004 3/14/2006
Dow Jones Industrial Average

Equity Risk and Coping with It
6000
7000
8000
9000
10000
11000
12000
13000
12/26/1997 5/10/1999 9/21/2000 2/3/2002 6/18/2003 10/30/2004 3/14/2006
Bad Time to Sell
Dow Jones Industrial Average

Bond Interest Rate Risk
$0
$200
$400
$600
$800
$1,000
$1,200
$1,400
$1,600
0% 2% 4% 6% 8% 10% 12%
Pre
sent
Val
ue
Prevailing Interest Rate
Coupon Rate = 5% Length 25 years Principal = $1,000

Risk Coping Strategy:Asset Allocation
Cash: Enough to pay expenses for 4 months + 3% for taking advantage of market opportunities
Bonds: Enough maturing each year to pay expenses for that year – for about 5 years; perhaps hold some value in bond fund(s)
Equities: Remainder, but probably not more than 65% of retirement assets. May include REITs
Real Estate: Probably not included in retirement assets unless beyond residence
Approach to Planning
• Do Classical Equity Financial Projection
• Deal with Risk Management and Cash Flow
• Project Financial Needs
• Decide on Residence
• Cover Medical Insurance
• Decide When to Begin Social Security
• Recognize Demographics and Their Impacts
• Take Actions

Example Minimum Computation
• Pre-retirement annual expenditure of $100,000• Post-retirement expenditures 80% of pre-
retirement expenditure • Social Security income of $15,000 per annum• To live off income for $80,000 per annum with
average yield of 6.8%, must have:
(80,000 – 15,000) = 65,000 = ~1,000,000 0.068 0.068
• For reserve of $100,000, need to have at least $1,100,000 prior to retiring
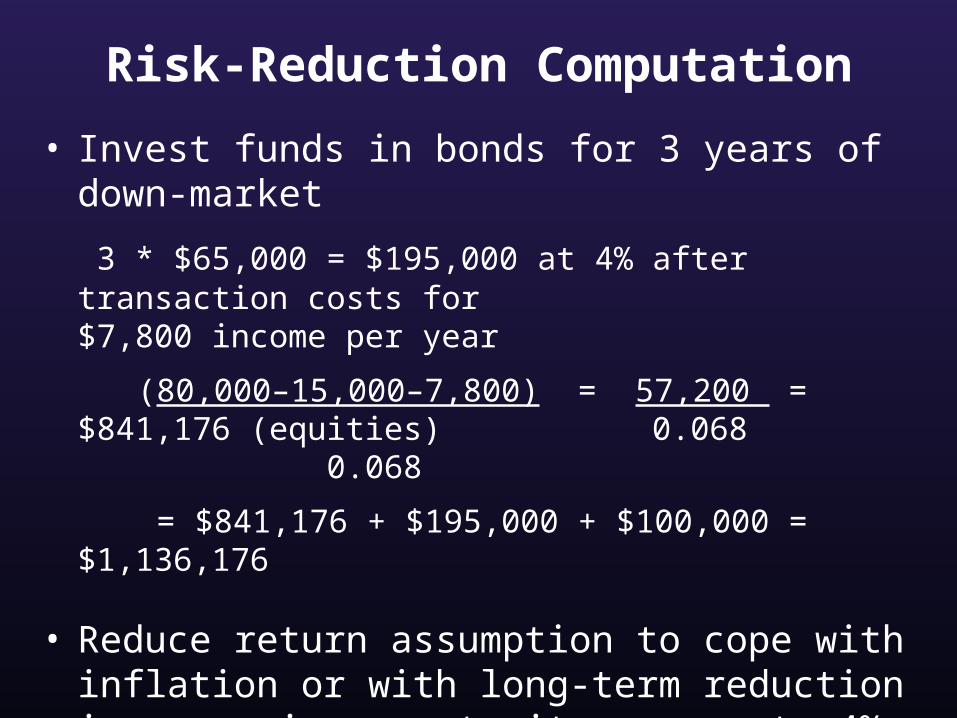
Risk-Reduction Computation
• Invest funds in bonds for 3 years of down-market
3 * $65,000 = $195,000 at 4% after transaction costs for $7,800 income per year
(80,000–15,000–7,800) = 57,200 = $841,176 (equities)0.068 0.068
= $841,176 + $195,000 + $100,000 = $1,136,176
• Reduce return assumption to cope with inflation or with long-term reduction in economic opportunity – say, to 4%
(80,000–15,000–7,800) + 195,000 + 100,000 = $1,725,000 0.04

More-Detailed Personal Analysis
Income Year 1 Year 2 Year 3 Year 4 Year 5 Year 6
Social Security 15,000 15,000 15,000 15,000
401(k) Equities 61,200 63,000 49,500 27,000 36,000 45,000
Pension (Annuity) 4,000 4,000 4,000 4,000 4,000 4,000
401(k) (Bonds) & Cash 1,600 1,600 1,400 1,200 1,400 1,600
Personal Equities 5,780 4,066 564 471 -5 -511
Rental Income 1,500 1,500 1,500 1,500 1,500 1,500
Teaching 4,000 2,000 2,000
Inheritance 55,000
Total Income 78,080 131,166 71,964 51,171 57,895 66,589
Expenses
Medical Insurance 21,000 14,000 6,500 7,000 7,000 7,500
Mortgage & Taxes 34,000 34,000 10,000 10,000 11,000 11,000
Living 35,000 35,000 35,000 35,000 35,000 35,000
Other 15,000 15,000 15,000 15,000 15,000 15,000
Total Expenses 105,000 98,000 66,500 67,000 68,000 68,500
Net -26,920 33,166 5,464 -15,829 -10,105 -1,911
Approach to Planning
• Do Classical Equity Financial Projection
• Deal with Risk Management and Cash Flow
• Project Financial Needs
• Decide on Residence
• Cover Medical Insurance
• Decide When to Begin Social Security
• Recognize Demographics and Their Impacts
• Take Actions

Criteria for New Residence
• Don’t buy on top of an earthquake fault (or within 200 feet of it)
• Don’t buy below sea level (or below 20 feet above it)
• Avoid hurricane areas. The 70-year hurricane cycle is approaching its peak, so the East Coast will likely experience real problems
• Don’t buy where taxes are high – income taxes, sales taxes, property taxes, personal property taxes
• Buy where you can be warm (at least inside)
• Buy near relatives (especially children)

Some Alternatives• Retirement community• Condominium in attractive area• Smaller house in less-expensive area• Recreational Vehicle• Moving from place to place
However• Ensure medical and other support services are
available• Consider cultural changes carefully • Be very, very careful about foreign residences

Approach to Planning
• Do Classical Equity Financial Projection
• Deal with Risk Management and Cash Flow
• Project Financial Needs
• Decide on Residence
• Cover Medical Insurance
• Decide When to Begin Social Security
• Recognize Demographics and Their Impacts
• Take Actions
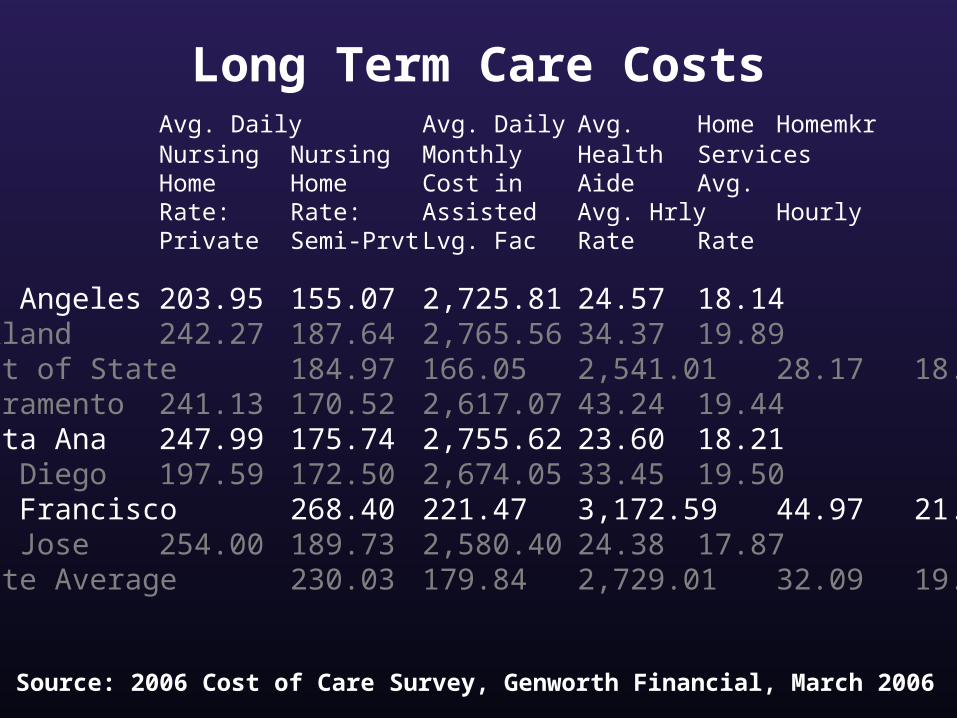
Long Term Care CostsAvg. Daily Avg. Daily Avg. Home HomemkrNursing Nursing Monthly Health ServicesHome Home Cost in Aide Avg. Rate: Rate: Assisted Avg. Hrly HourlyPrivate Semi-Prvt Lvg. Fac Rate Rate
Los Angeles 203.95 155.07 2,725.81 24.57 18.14Oakland 242.27 187.64 2,765.56 34.37 19.89Rest of State 184.97 166.05 2,541.01 28.17 18.51Sacramento 241.13 170.52 2,617.07 43.24 19.44Santa Ana 247.99 175.74 2,755.62 23.60 18.21San Diego 197.59 172.50 2,674.05 33.45 19.50San Francisco 268.40 221.47 3,172.59 44.97 21.37San Jose 254.00 189.73 2,580.40 24.38 17.87State Average 230.03 179.84 2,729.01 32.09 19.11
Source: 2006 Cost of Care Survey, Genworth Financial, March 2006

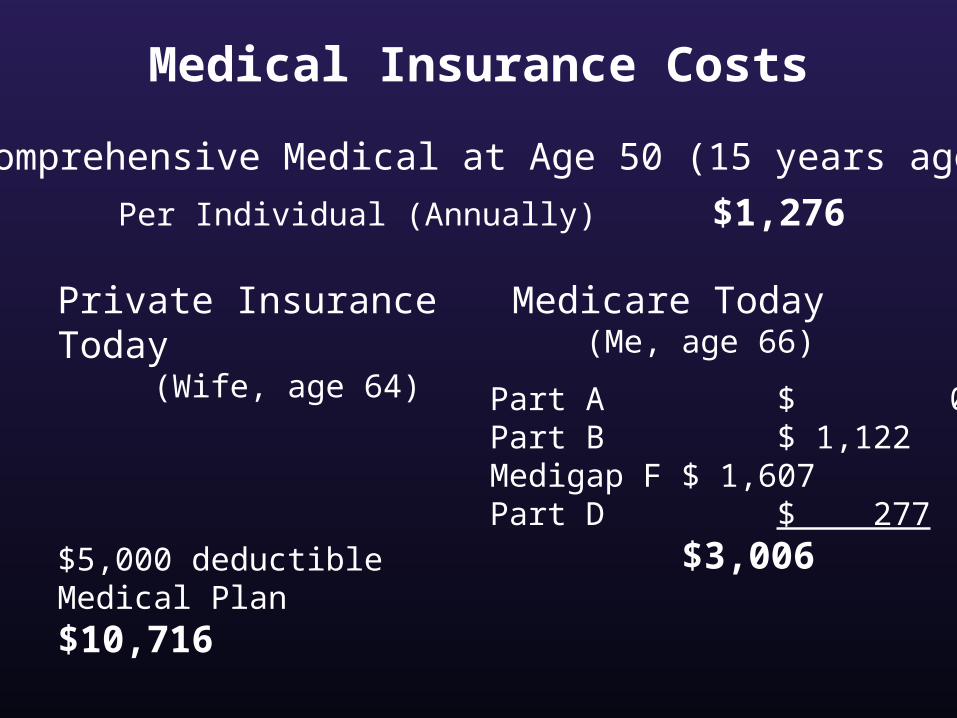
Medical Insurance Costs
Comprehensive Medical at Age 50 (15 years ago)
Per Individual (Annually) $1,276
Medical Insurance Costs
Private Insurance Today (Wife, age 64)
$5,000 deductibleMedical Plan $10,716
Medicare Today (Me, age 66)
Part A $ 0Part B $ 1,122Medigap F $ 1,607Part D $ 277
$3,006
Comprehensive Medical at Age 50 (15 years ago)
Per Individual (Annually) $1,276

Medical Insurance Costs
Private Insurance Today (Wife, age 64)
$5,000 deductibleMedical Plan $10,716
Medicare Today (Me, age 66)
Part A $ 0Part B $ 1,122Medigap F $ 1,607Part D $ 277
$3,006
Comprehensive Medical at Age 50 (15 years ago)
Per Individual (Annually) $1,276
Cost of medical insurance (e.g. $21,000 per couple plus cost for kids) discourages early retirement

Medicare Plans
Part A: Hospital Insurance with ~$1,000 deductible & limitsProbably already paid for by payroll deductions
Part B: Medical Insurance with deductibles, co-pays, limitsCurrent cost $93.50/mnth but higher for high earners
Part C: HMO/PPO-type alternatives (instead of parts B & D)Cost varies by provider and benefits
Part D: Drug coverage with plans defined by insurersCost and benefits vary greatly
Medigap: Covers “donut holes” and adds coveragesBenefits of each plan defined, varying costs
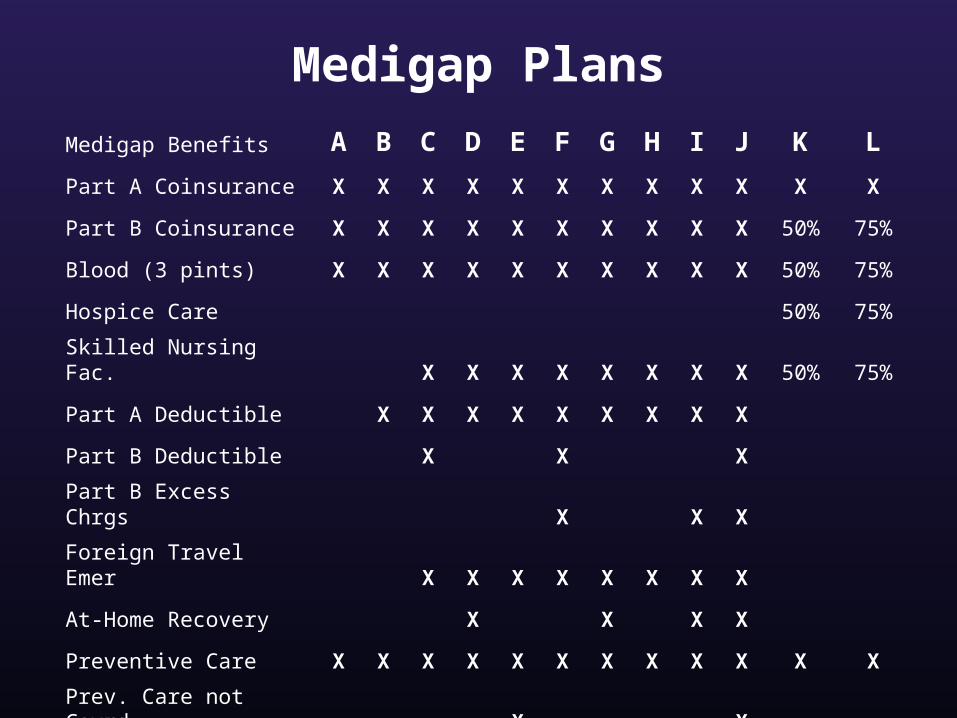
Medigap Plans
Medigap Benefits A B C D E F G H I J K L
Part A Coinsurance X X X X X X X X X X X X
Part B Coinsurance X X X X X X X X X X 50% 75%
Blood (3 pints) X X X X X X X X X X 50% 75%
Hospice Care 50% 75%
Skilled Nursing Fac. X X X X X X X X 50% 75%
Part A Deductible X X X X X X X X X
Part B Deductible X X X
Part B Excess Chrgs X X X
Foreign Travel Emer X X X X X X X X
At-Home Recovery X X X X
Preventive Care X X X X X X X X X X X X
Prev. Care not Covrd X X

Approach to Planning
• Do Classical Equity Financial Projection
• Deal with Risk Management and Cash Flow
• Project Financial Needs
• Decide on Residence
• Cover Medical Insurance
• Decide When to Begin Social Security
• Recognize Demographics and Their Impacts
• Take Actions

Social Security
• Benefits largely dependent on:
Income during working years When benefits are begun
• Age for full benefits increases over time
• Currently (as practical matter) 85% of benefits are taxed as normal income
• “Contributions” you make are actually used to pay current retirees
• Payments to you will come from the next generation’s “contributions”
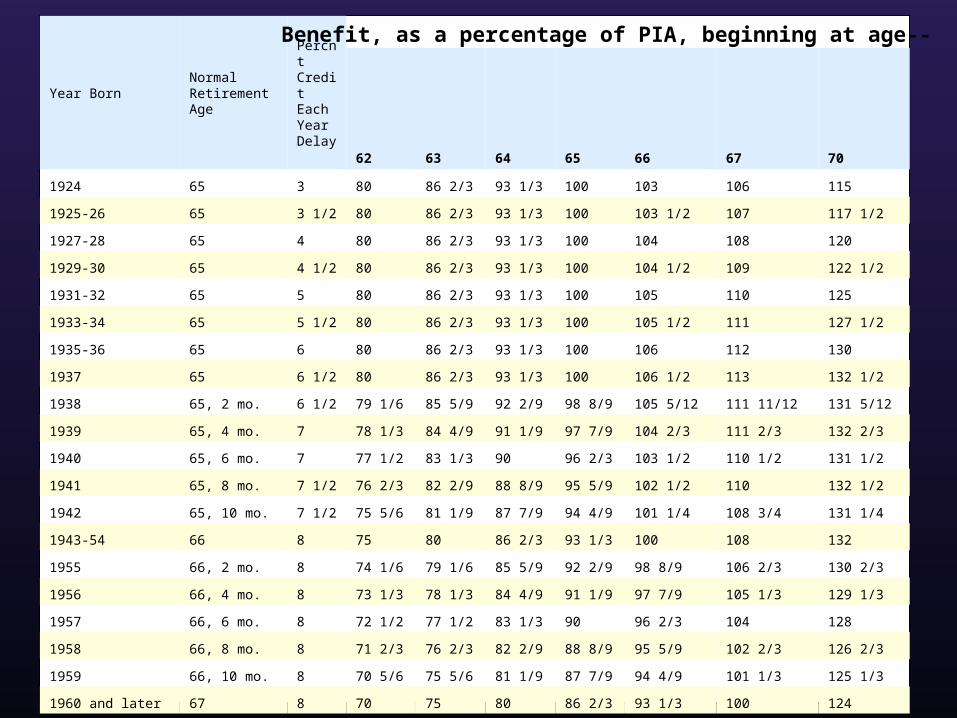
Full Retirement AgesYear BornNormal Retirement Age
Percnt CreditEach Year Delay
62 63 64 65 66 67 70
1924 65 3 80 86 2/3 93 1/3 100 103 106 115
1925-26 65 3 1/2 80 86 2/3 93 1/3 100 103 1/2 107 117 1/2
1927-28 65 4 80 86 2/3 93 1/3 100 104 108 120
1929-30 65 4 1/2 80 86 2/3 93 1/3 100 104 1/2 109 122 1/2
1931-32 65 5 80 86 2/3 93 1/3 100 105 110 125
1933-34 65 5 1/2 80 86 2/3 93 1/3 100 105 1/2 111 127 1/2
1935-36 65 6 80 86 2/3 93 1/3 100 106 112 130
1937 65 6 1/2 80 86 2/3 93 1/3 100 106 1/2 113 132 1/2
1938 65, 2 mo. 6 1/2 79 1/6 85 5/9 92 2/9 98 8/9 105 5/12 111 11/12 131 5/12
1939 65, 4 mo. 7 78 1/3 84 4/9 91 1/9 97 7/9 104 2/3 111 2/3 132 2/3
1940 65, 6 mo. 7 77 1/2 83 1/3 90 96 2/3 103 1/2 110 1/2 131 1/2
1941 65, 8 mo. 7 1/2 76 2/3 82 2/9 88 8/9 95 5/9 102 1/2 110 132 1/2
1942 65, 10 mo. 7 1/2 75 5/6 81 1/9 87 7/9 94 4/9 101 1/4 108 3/4 131 1/4
1943-54 66 8 75 80 86 2/3 93 1/3 100 108 132
1955 66, 2 mo. 8 74 1/6 79 1/6 85 5/9 92 2/9 98 8/9 106 2/3 130 2/3
1956 66, 4 mo. 8 73 1/3 78 1/3 84 4/9 91 1/9 97 7/9 105 1/3 129 1/3
1957 66, 6 mo. 8 72 1/2 77 1/2 83 1/3 90 96 2/3 104 128
1958 66, 8 mo. 8 71 2/3 76 2/3 82 2/9 88 8/9 95 5/9 102 2/3 126 2/3
1959 66, 10 mo. 8 70 5/6 75 5/6 81 1/9 87 7/9 94 4/9 101 1/3 125 1/3
1960 and later 67 8 70 75 80 86 2/3 93 1/3 100 124
Note: Persons born on January 1 of any year should refer to the previous year of birth.
Benefit, as a percentage of PIA, beginning at age--

Approach to Planning
• Do Classical Equity Financial Projection
• Deal with Risk Management and Cash Flow
• Project Financial Needs
• Decide on Residence
• Cover Medical Insurance
• Decide When to Begin Social Security
• Recognize Demographics and Their Impacts
• Take Actions
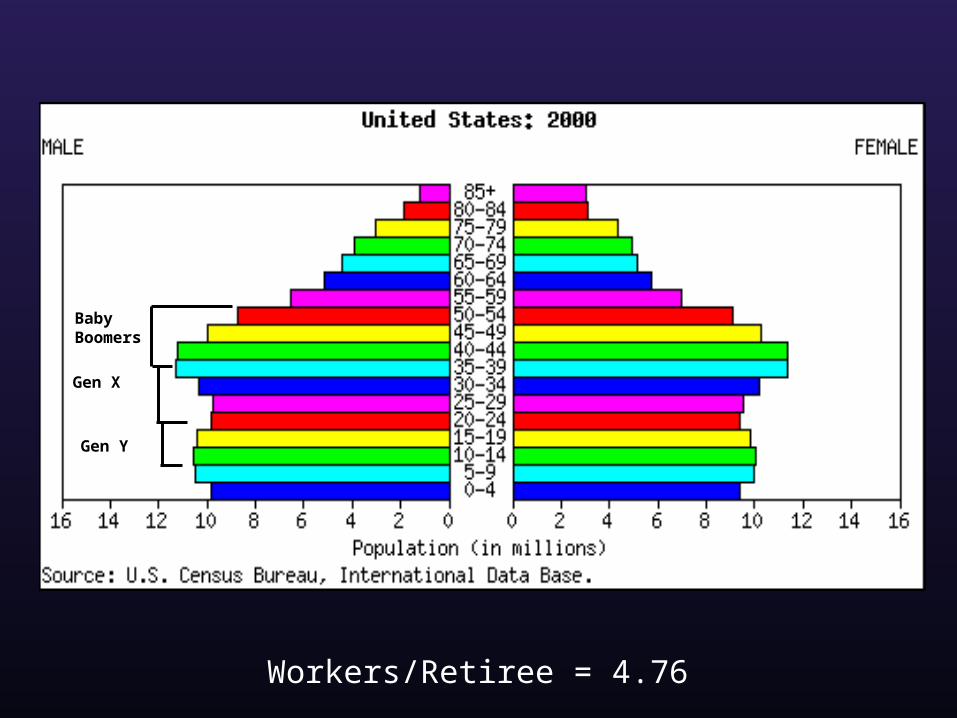
United States Demographics
Workers/Retiree = 4.76
BabyBoomers
Gen X
Gen Y

Workers/Retiree = 4.76
BabyBoomers
Gen X
Gen Y

Workers/Retiree = 3.08
BabyBoomers
Gen X
Gen Y
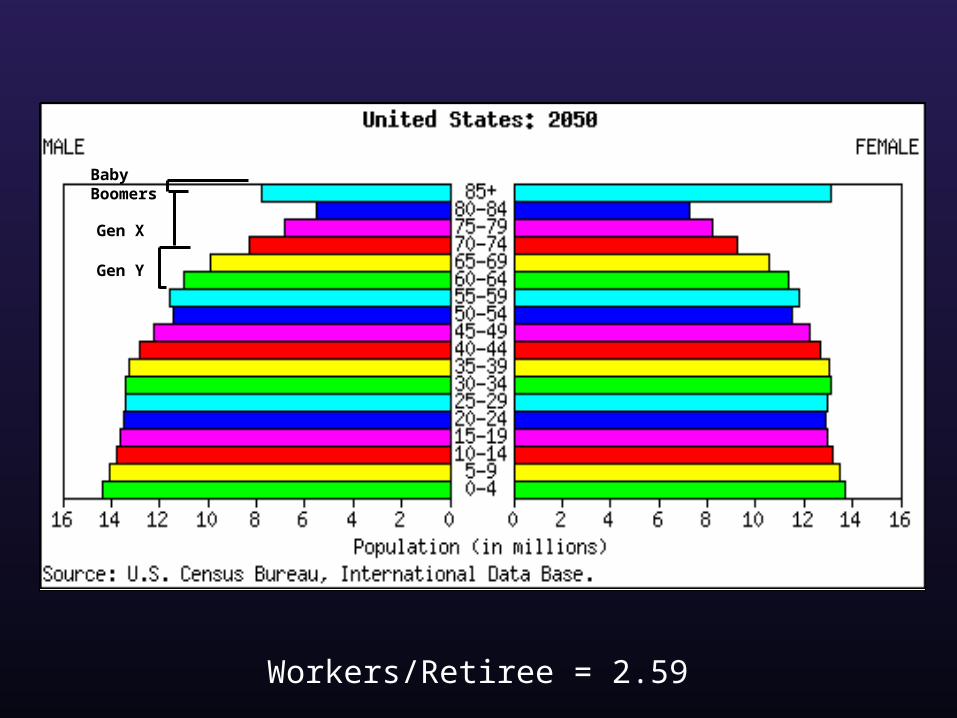
Workers/Retiree = 2.59
BabyBoomers
Gen X
Gen Y

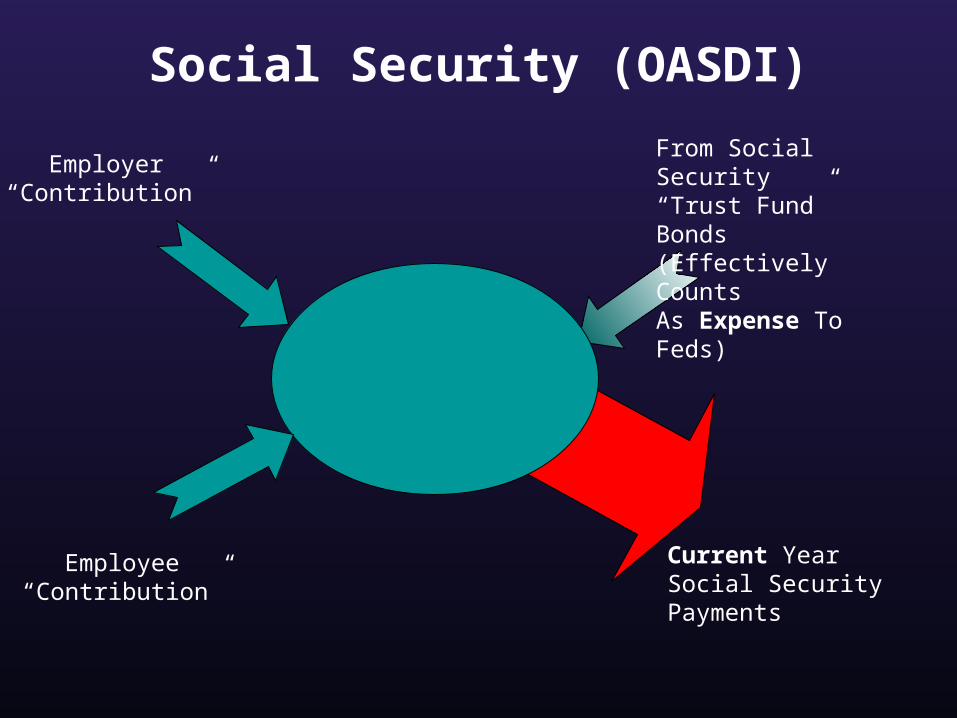
Social Security (OASDI)
Employer“Contribution”
Employee“Contribution”
Current YearSocial SecurityPayments
To Social Security“Trust Fund” Bonds (Effectively CountsAs Revenue To Feds)
Social Security (OASDI)
Employer“Contribution”
Employee“Contribution”
Current YearSocial SecurityPayments
From Social Security“Trust Fund” Bonds (Effectively CountsAs Expense To Feds)

Shortfall
Shortfall to Pay Scheduled Benefits plus75 Percent Revenue Contribution to SMI
Percentage of GDP
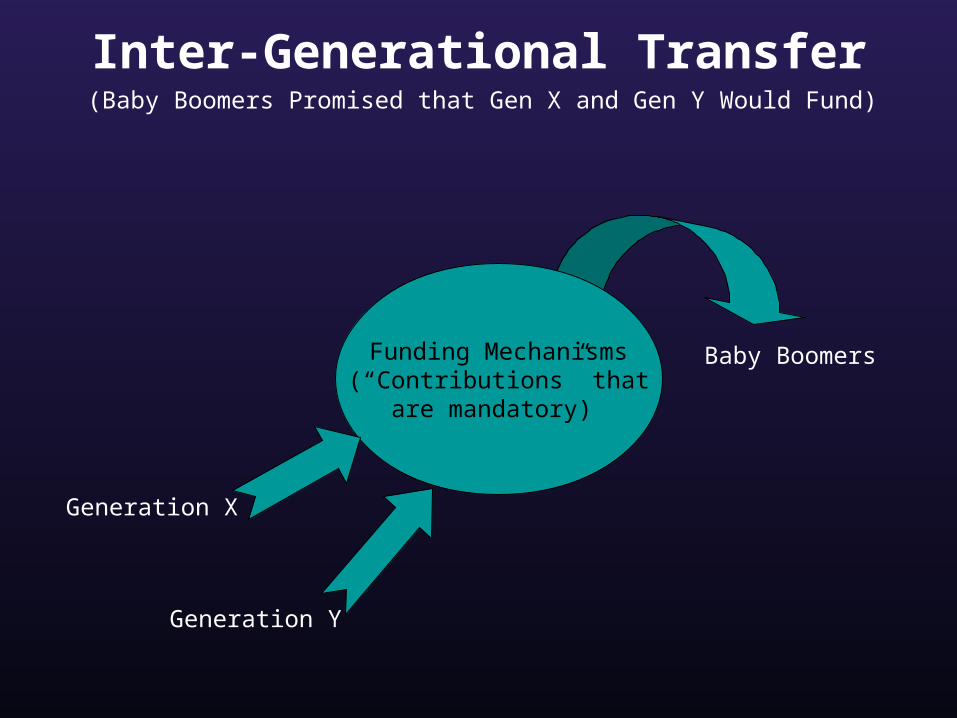
Inter-Generational Transfer
Funding Mechanisms(“Contributions” that
are mandatory)
Generation X
Baby Boomers
Generation Y
(Baby Boomers Promised that Gen X and Gen Y Would Fund)

Potential Federal/State Changes
• Change SS “full retirement age” matrix & COLA
• Accelerate “means test” on Social Security benefits
• Accelerate “means test” on Medicare coverage
• Cap medical payments and/or encourage inflation
• Reduce deductions in tax code (e.g., interest deduction on homes, Proposition 13, education deduction, etc.)
• Eliminate tax-exemption on bonds, capital gains rate, charitable deductions
• Ration medical care (as in Canada, UK)
• Tax Roth IRAs
• Introduce state/national Net Worth Tax
Approach to Planning
• Do Classical Equity Financial Projection
• Deal with Risk Management and Cash Flow
• Project Financial Needs
• Decide on Residence
• Cover Medical Insurance
• Decide When to Begin Social Security
• Recognize Demographics and Their Impacts
• Take Actions
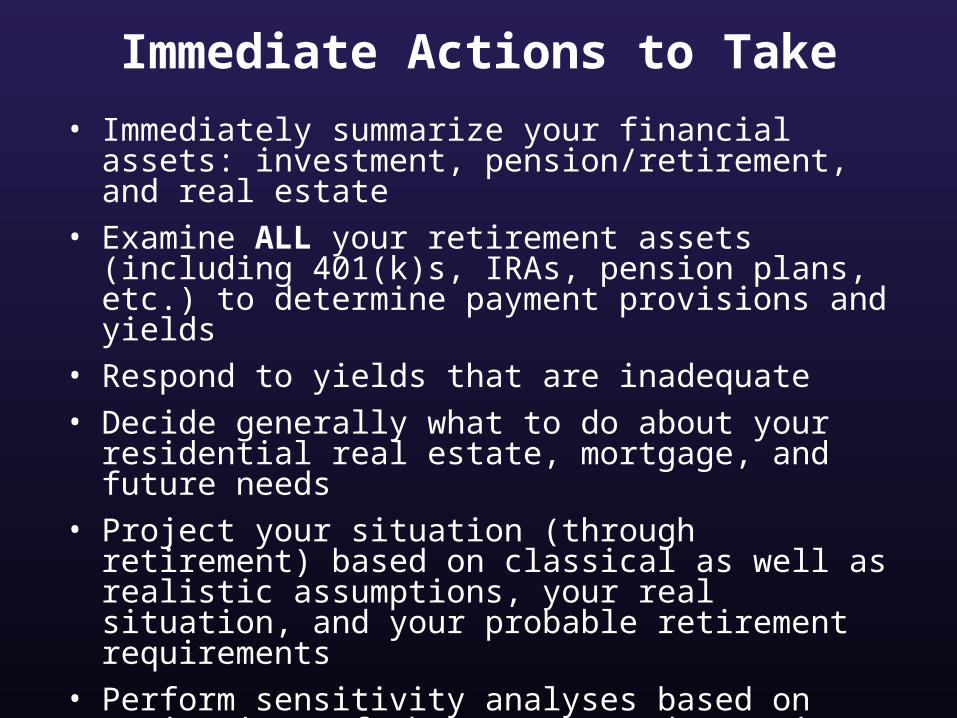
Immediate Actions to Take
• Immediately summarize your financial assets: investment, pension/retirement, and real estate
• Examine ALL your retirement assets (including 401(k)s, IRAs, pension plans, etc.) to determine payment provisions and yields
• Respond to yields that are inadequate
• Decide generally what to do about your residential real estate, mortgage, and future needs
• Project your situation (through retirement) based on classical as well as realistic assumptions, your real situation, and your probable retirement requirements
• Perform sensitivity analyses based on projections of the economy and taxation
• Plan your future based on projections

Future Actions to Take
50: start “catch-up contributions” to IRA/401(k)55: plan your mortgage; if you will want to relocate,
start planning how to do so59: put together an estate plan63: decide whether to roll-over 401(k)s; position your
investments to provide cash, income, and growth
64: ensure real estate is appropriate
64½: decide on medical insurance plan(s)
64¾: apply for Medicare (if that’s your plan)
65?: retire and start taking distributions (whenever)
65+: apply for Social Security (if not earlier)66: track your retirement investments and
pensions closely
72½: take required distributions from IRAs

Don’t be obsessive; enjoy life.

Remember:
In the end, we’re all dead
Don’t be obsessive; enjoy life.