Embed Size (px)
Citation preview

PLANNING FOR A COOLER FUTURE:
GREEN INFRASTRUCTURE TO
REDUCE URBAN HEAT
October 2013 Climate Adaptation for Decision-makers ISBN: 978 0 7340 4905 6
Authors: Briony Norton, Karyn Bosomworth, Andy Coutts, Nicholas Williams, Steve Livesley, Alexei Trundle, Richard Harris, Darryn McEvoy

2
Summary...........................................................................................................................3
Responding to the urban heat island project.......................................................................4
Introduction – Using green infrastructure to cool neighbourhoods...................................5
What is the urban heat island?................................................................................5
Why are high urban temperatures a concern?.......................................................6
Urban heat at different scales…………...................................................................7
What is green infrastructure?.................................................................................8
The role of GI in mitigating high urban temperatures............................................9
Purpose of this guide............................................................................................10
Key steps for GI implementation......................................................................................11
Identify priority ‘neighbourhoods’.......................................................................12
Maximise the cooling value of existing GI............................................................15
Prioritising streets………......................................................................................16
Analyse and select GI options..............................................................................19
Planning and Policy.........................................................................................................24
Further reading and References......................................................................................26
Further reading....................................................................................................26
References...........................................................................................................27
Acknowledgements.........................................................................................................29

3
Urban populations experience higher temperatures than people
in un-developed rural areas due to increased heat production and
retention by urban surfaces and structures
With a changing climate, urban populations will experience more
frequent extreme heat events, which can lead to increased rates of
mortality and morbidity
Green infrastructure (GI) can help mitigate high urban
temperatures
The key steps in mitigating urban surface temperatures to
minimise high daytime urban temperatures are
o Identify priority locations based on assessments of exposure
and vulnerability
o Maximise the effectiveness of existing GI by integrating water
sensitive urban design
o Identify priority streets for temperature reduction based on
street orientation and height:width ratio, which determine the
amount of sun exposure
o Select appropriate GI for different environmental conditions
A range of options are suggested for policies to leverage GI
implementation at local, state and federal levels.
SUMMARY

4
This guide synthesises research from the Victorian Centre for Climate
Change Adaptation (VCCCAR)-funded project Responding to the urban
heat island: Optimising the implementation of green infrastructure.
Detailed literature reviews of the international scientific and technical
literature as well as novel research undertaken during the project
underpin this implementation guide. The relevant reports are listed
below and are available at http://www.vcccar.org.au/responding-to-
urban-heat-island-optimising-implementation-green-infrastructure.
Literature reviews
Harris & Coutts (2011) “Airborne thermal remote sensing for analysis of
the urban heat island”.
Hunter Block, Livesley & Williams (2012) “Responding to the urban heat
island: A review of the potential of green infrastructure”.
Research reports
Bosomworth, Trundle & McEvoy (2013) “Responding to the urban heat
island: Optimising implementation of green infrastructure, A policy and
institutional analysis”.
Coutts & Harris (2012) “A multi-scale assessment of urban heating in
Melbourne during an extreme heat event and policy approaches for
adaptation”.
Norton, Coutts, Livesley & Williams (2013) “Decision principles for the
selection and placement of green infrastructure to mitigate urban
hotspots and heat waves”.
Policy brief
“Urban heat reduction through green infrastructure: Policy guidance for
State Government”
Responding to urban heat:
Optimising green infrastructure

5
What is the urban heat island?
The ‘Urban Heat Island’(UHI) is a phenomenon where urban areas show higher
temperatures than surrounding rural landscapes both during the day and in the evening.
The UHI has been characterised in many cities around the world [3, 4] including
Melbourne, which has a distinct UHI thermal profile on hot nights (Figure 1).
Figure 1: Spatial variability of the Melbourne urban heat island at 1 am, 23rd March 2006. [from 5].
Key drivers of UHI include [4, 6]:
Vegetation removal - reduces shading and evapotranspiration;
Increased impermeable surfaces e.g. asphalt and concrete - high stormwater runoff
that reduces soil moisture available for plants, which in turn reduces evaporative
cooling;
Construction materials with high heat capacity and low reflectance, e.g. terracotta
tiles, bricks, bitumen and concrete - these materials absorb, trap and re-radiate
heat;
Dense urban arrangements - absorbs and traps heat;
Heat production from machinery (cars, air conditioners etc);
Air pollution that creates a local ‘greenhouse’ effect.
INTRODUCTION – USING GREEN
INFRASTRUCTURE TO COOL
NEIGHBOURHOODS

6
Why are high urban temperatures a concern?
People living in urban areas are particularly at risk of heat-related disease and death
because they are already exposed to high temperatures. International research indicates
that localised temperature increases in urban areas due to urban development already
exceed temperature increases projected by climate change models [7, 8].
Heatwaves have been projected to become more frequent under global climate change
[9], placing more people at greater risk of heat-related disease and death. Heatwaves are
a major threat to human life globally. For example, between 35,000 and 50,000 people
died due to heat related illnesses in Europe during the heat wave of summer 2003 [10, 11].
Over the last two centuries , heatwaves have claim more Australian lives than any
other natural hazard [12]. In Victoria, a heatwave in January 2009 was linked to 374
excess deaths [13]. Urban residents must adapt to the compounding effects of elevated
temperatures from both high urban temperatures and climate change.
The issue of urban heat is important in Australia because this country has already hot
summers, and is one of the most highly urbanised nations in the world, with 80% of the
population living in major cities [14]. Victoria’s urban populations continue to grow.
For example, Melbourne is projected to grow to 6 to 8 million people by 2056 [15].
The increasing frequency of heat waves and the increase in urban development are
therefore urgent issues in Victoria [13, 16].
Areas that become particularly hot in Melbourne and other cities around the world are
not evenly distributed, and socially disadvantaged groups often experience greater
urban heat exposure. Certain sections of the community are also more vulnerable to heat
exposure, particularly the very young, the frail elderly and those with a pre-existing
physical or mental illness [17-19]. Appropriately targeting neighbourhoods for temperature
amelioration is therefore an important issue of social justice, as well as serving as an
important mental and physical preventative health measure [20].
Figure 2.Representation of current and projected extreme heat vulnerability in Melbourne. Green
Infrastructure is a cooling mechanism that does not create fossil fuel emissions.

7
Urban heat at different scales
The scale of heat production and retention in urban areas is important in understanding
the development of the UHI and strategies for UHI adaptation. The UHI is a city-wide
phenomenon and is most often described by comparing temperatures in the CBD to the
city’s rural surrounds, giving a maximum UHI intensity. Yet across an urban area
temperatures will vary with changing land use and land cover, creating street- and
neighbourhood-scale areas of excess heat, or ‘hot-spots’.
People’s experiences of the climate and high temperatures occur mostly at the micro-
scale, in the layer of air between the ground and the top of roofs or trees, which is known
as the ‘urban canopy layer’ (UCL). The climate experienced at the micro-scale is
influenced by the immediate surrounding environment (e.g. street environment), the
local-scale climate (e.g. neighbourhood environment) and the city-wide (meso-scale)
climate (e.g. synoptic influences and the UHI) (Figure 2).
The city-wide UHI is the combined result of heat production and/or retention at the
micro- and local scale. The focus of this document is on mitigating excess urban heat
at the micro-scale and local-scale through the use of vegetation. Modifications of the
environment at these scales will influence people’s experience of the climate within the
UCL and can have flow-on effects to larger-scale climatic processes including the
reduction of the UHI if implemented over large areas.
Figure 3: The different scales of urban heat retention and the urban heat island effects. RSL refers to
the Roughness Sub Layer, UCL is the Urban Canopy Layer, and UBL is the Urban Boundary Layer [21].

8
The UHI is not a single phenomenon. There are actually several types of UHI, which
describe different components of urban heat. The ‘classic’ UHI effect refers to changed
air temperatures within the UCL (Figure 2). This UHI is most pronounced on warm, still,
summer nights, when inner urban air temperatures can be 3.5 – 4.5 °C warmer than
surrounding rural areas [22]. It is particularly strong in areas of high building density, for
example the CBD (Figure 1).
A second UHI is the surface UHI. The surface UHI refers to the temperatures over the full
three-dimensional surface of a city, e.g. roofs, walls and street surfaces. The surface UHI
is affected by solar radiation and so the largest temperature differences are most
pronounced during the day [23], particularly in open areas exposed to direct sunlight.
Solar radiation has also been shown to be one of the key factors in determining human
thermal comfort under hot conditions.
This document focuses on reduction of high urban surface temperatures. Surface
temperatures generally change in the same direction as air temperatures but, during the
day, surface temperatures are much higher. They are a useful target for mitigation
because they are not influenced by wind as much as air temperature and so are easier to
compare accurately between areas. Surface temperatures can readily be measured at
multiple scales within the city (Figure 3). They also contribute to air temperatures and to
high urban temperatures overall. Consequently, reduction of surface temperatures
will contribute to reduced air temperatures during both day and night.
Figure 4: Urban surface temperatures measured at different scales (from left to right): Greater
Melbourne using satellite data [1]; at the neighbourhood scale using airborne thermal imagery; and at
the street-scale using a thermal camera [2]. Red indicates high temperatures, green and blue are
lower temperatures.[3]. Street scale (image from urban-climate-energy.com) Note temperature
colouration scale varies between images)
9
What is green infrastructure?
The role of GI in mitigating high urban temperatures
Without concerted actions and planning, our changing climate will further amplify the
serious impacts of high urban temperatures. Many cities are starting to address the
challenge of increased urban temperatures through a variety of approaches including
water sensitive urban design (WSUD), painting surfaces white or pale colours, strategic
urban design, and green infrastructure implementation. For optimal climate regulation in
urban areas a range of strategies will be necessary.
This guide focuses on the use of green infrastructure (GI) to mitigate urban heat. GI
is an effective means to minimise heat accumulation in the urban environment as it
shades hot surfaces, increases evapotranspirative cooling and modifies wind patterns
The guide provides advice on spatially strategic ways to reduce urban surface
temperatures across Greater Melbourne using increased cover of GI. Surface
temperatures are an excellent target for mitigation by GI because sun exposure is a key
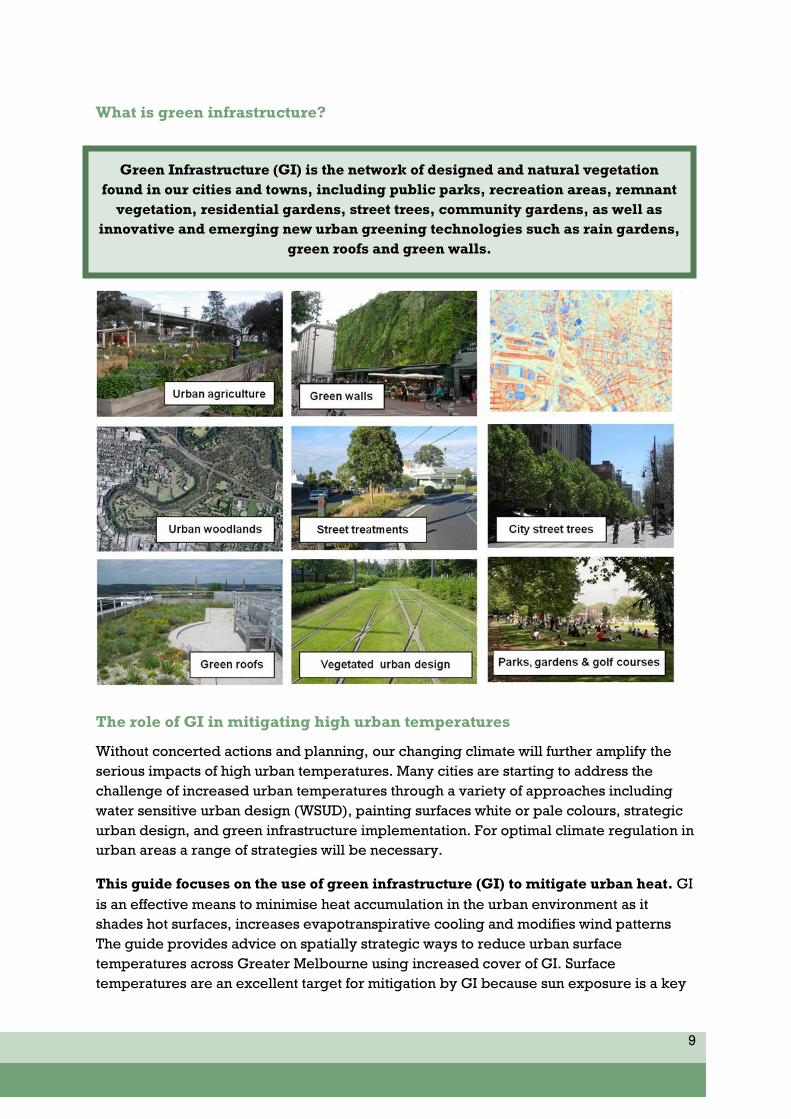
Green Infrastructure (GI) is the network of designed and natural vegetation
found in our cities and towns, including public parks, recreation areas, remnant
vegetation, residential gardens, street trees, community gardens, as well as
innovative and emerging new urban greening technologies such as rain gardens,
green roofs and green walls.

10
driver of increased urban surface temperatures, and GI reduces this exposure through
shading (e.g. trees) or covering these urban surfaces (e.g. green walls).
Green infrastructure is an effective and socially appealing means to minimise heat
accumulation in the urban environment. It maximises cooling by vegetation and delivers
numerous other environmental and social benefits, with significantly less energy use and
greenhouse gas emissions than alternatives such as air conditioning.
While the cooling effects of GI are the focus of this guide, GI has a multitude of
additional environmental and societal benefits. These benefits include: reduced
energy use, the provision of accessible green spaces for urban dwellers; improved
human health; storm water capture and retention; increased urban amenity and house
prices; the creation of biodiversity habitat; noise attenuation; and pollution reduction [24-
27]. While not explicitly addressed within this guide, these additional benefits can
contribute to the liveability of our urban areas and can help build a business case for GI
investment.
Purpose of this guide
This guide is for local governments and planning consultants who make decisions about
how to address the risk of high urban temperatures during summer months and are
considering the use of GI. It focuses on established urban areas. The principles
presented here could also be used to inform planning and design of greenfield sites.
There is also a greater potential in new urban developments to use a range of additional
approaches to reduce urban heat including using urban design such as street orientation
and width to moderate climatic conditions [28-30].
This document focuses on temperature reduction of public open space, as the authors
recognise that councils have greatest control over public rather than private domains.
There is likely to be flow-on temperature reductions to private spaces and the insides of
buildings from following this guidance.
The information provided here should provide an addition to the suite of tools used by
landscape management professionals (e.g. landscape architects, urban planners,
engineers) but it is not a comprehensive information pack. Further information can be
found in the research that informed this guide and the scientific literature listed in the
Reference and Further reading sections.

11
This guide presents a series of steps for informing a strategic plan to address urban heat
through the use of GI. More information about each of these steps can be found in Norton
et al. (2013, VCCCAR). While a strategic plan would address a whole Local Government
Area (LGA), the scale of implementation at which this guide is targeted is the local and
‘micro’ scales (Figure 4).
Figure 5: Steps for the selection and location of green infrastructure for cooling surface temperatures
contributing to high daytime urban surface temperatures.
LGA level and local scale
Micro scale (street level)
KEY STEPS FOR GI
IMPLEMENTATION

12
It is important to prioritise GI that reduces exposure of vulnerable sections of
communities to excess urban heat. Whether a heat-health outcome (e.g. morbidity or
mortality) occurs is dependent on a person’s ‘exposure’ to excess heat, and their
underlying ‘vulnerability’ to that heat [31]. Areas where both exposure and vulnerability
are high should be prioritised for GI implementation. To assess exposure, information
about temperature patterns during extreme heat events and locations of important
community infrastructure, is required (Figure 5). Councils and planners are advised to
work with their community development experts to identify groups or locales that may
be particularly vulnerable to urban heat.
Assess exposure
At the scale of the greater metropolitan area, there is significant temperature
variation across Melbourne’s urban areas; western and southeastern regions tend to
experience higher day time temperatures and lower night time temperatures in contrast
with the inner city and some suburbs in the east where the opposite pattern occurs [1, 20].
There is also significant temperature variation within each of these regions.
Assessing heat exposure requires the documentation of areas of excess heat or
‘hotspots’. It is difficult to collect detailed air temperature data across a large spatial area
as it requires expensive and laborious data collection. An alternative approach is the use
of remote sensing, which provides a snapshot in time of land surface temperature across
a large spatial area.
Determining particularly hot areas can be achieved quite cost-effectively using satellite
thermal remote sensing. Various products are available for free from the NASA website
including Landsat ETM+ (Enhanced Thematic Mapper) and ASTER at resolutions of 60 m
(re-sampled to 30 m) and 90 m respectively. These resolutions are suitable for
identifying hot-spots across a local council area which can then be targeted for GI
intervention.
Higher resolution (1-5m) thermal remote sensing data can be obtained via aircraft
mapping. However, the expense of these measurements and the long data processing
times required to obtain quality data make satellite remote sensing a more cost-effective
option. A detailed discussion of these issues can be found in Coutts and Harris (2012,
VCCCAR).
At local and neighbourhood scales (within an LGA) not only is it important to identify
areas of high temperature, but to identify areas within these neighbourhoods where
pedestrians will be active and exposed to direct sun during the day. Areas with high
pedestrian activity should be identified and prioritised. These areas include known
activity centres such as the CBD, central Dandenong or Footscray, shopping strips,
IDENTIFY PRIORITY ‘NEIGHBOURHOODS’

13
public transport interchanges, the location of aged care facilities, pedestrian
thoroughfares, schools and the streets around them and areas close to kindergartens.
Assess population vulnerability to heat
Some groups of people are particularly vulnerable to heat stress during extreme heat
events. Ascertaining where these groups might be, who they are, and what temperature
is considered a risk has become a major research area [e.g. 32, 33-36]. In Melbourne,
Loughnan et al. [1] identified five key indicators of vulnerability to urban heat. These
were areas with:
a high proportion of elderly and very young citizens,
large numbers of aged care facilities,
families speaking a language other than English at home,
where elderly people live alone,
suburban areas (in contrast to high-density inner suburbs).
Areas with high representation of these populations could be identified when selecting
priority neighbourhoods for GI implementation. Loughnan et al [20] have developed a
map of a Vulnerability Index for Melbourne at the scale of the census district based on
key factors that influence vulnerability. Maps of ambulance call-outs on hot days were
also developed [20]. Such maps can be used to identify priority areas for greening based
on population vulnerability. The maps are available online at
http://www.mappingvulnerabilityindex.com/. A similar approach to that used by
Loughnan et al. [20] could be followed at smaller scales to help identify vulnerable locales
using accessible data from the Australian Bureau of Statistics such as age and Index of
Relative Socio-Economic Disadvantage.
Finally, when planning urban greening to reduce risks associated with extreme heat
events, it is important to consider population projections and demographic changes as
well as the current population structure. Information about expected population growth
and demographic patterns to 2026 is available from the Department of Planning and
Community Development website [37]. Projections of future land use change of areas
should also be considered.

14
Figure 6: Venn diagram representing factors required to identify areas of high (A), medium (B) and
moderate (C) priority for GI implementation for surface temperature reduction. The key factors are daytime
surface temperatures (Heat) and areas of high activity (Activity), which combined indicate areas of high
exposure. In addition, areas with high concentrations of vulnerable population groups (Vulnerability) should
be identified.
B B
C
C C
A
B
A = Highest priority
B = Medium priority
C = Moderate priority
Exposure of the
population

15
An important first step in mitigating high urban temperatures is to maintain healthy GI
to provide the maximum possible temperature reduction. All GI reduces micro-scale
daytime temperatures most effectively when irrigated and indeed some forms,
particularly grass and green roof vegetation, are unlikely to survive or may go dormant
during hot, dry summers without additional water. For example, a study in Melbourne
found that non-irrigated grass was on average between 3.6°C and 5.2°C hotter than
watered grass (Coutts and Harris, 2012, VCCCAR). Sufficient irrigation contributes to
plants reaching their growth potential and, given other prevailing conditions, providing
the maximum amount of shade possible.
Urban vegetation can often be under water stress because large areas of impermeable
surfaces prevent rainfall infiltration. To ensure the cooling services of GI are maximised
at the time of year when they are most required, adequate water supply is critical. This
can be achieved through the use of alternative water supplies such as sewage recycled
water systems and grey water or storm water capture, storage and redistribution.
Increasing the cover of permeable surfaces, for example by using water sensitive urban
design, would also increase water availability to plant roots. Exemptions from water
restrictions could also be sought.
GI should be assessed for its water requirements particularly for extended periods of
high temperatures and low rainfall. Plants considered to have insufficient available water
should be irrigated. Implementation of any new GI should incorporate adequate water
access. Despite its importance, the water requirements of urban vegetation to maximise
cooling remains a knowledge gap and priority research issue. A mix of native and
deciduous vegetation types should be promoted, as this diversity can increase resilience
across a range of climatic futures. Creating xeric (desert) like landscapes with un-
irrigated, drought tolerant vegetation will not be as beneficial for heat mitigation.
Maximise the cooling value of existing GI

16
Once priority neighbourhoods have been determined, priority streets within those areas
need to be identified based on properties of the ‘street canyon’. This is a standard
measure of the urban environment, encompassing the width of the street (plus footpath,
front gardens etc) that is bounded by two buildings usually along the length of a block. It
is often conceived in cross-section. Street canyons are a useful unit for planning because
their geometry and orientation are very important determinants of surface temperatures
in urban areas [38, 39]. Key properties of urban canyons are:
Building height (H): This is the height of the buildings on one side of the street. In the
simplified canyon scenario buildings are the same height on both sides of the street
Canyon width (W): The distance between the front of the buildings on either side of
the street
Height to width ratio (H:W). Canyons with high H:W are tall and narrow, and those
with low H:W are short and wide. Consistent relationships can be developed based
on H:W that are not possible using the H and W measures separately
Sky view factor (svf): the amount of sky visible from the ground. This will be reduced
if H:W is high (tall, narrow canyon) or if there is a lot of vegetation in the canyon. Svf
affects how much heat can be released into the atmosphere, particularly overnight.
Orientation: direction of the street, e.g. north-south, east-west, diagonal
Length of the canyon: the length of the street along one block
Selection of green infrastructure should be based on two key features of street canyons:
1. Height and width
2. Orientation
PRIORITISING STREETS

17
Canyon height and width
Wide canyons receive more sunlight because they are less shaded by buildings and
therefore can have very high surface temperatures. Similarly because their surfaces are
more open to the sky, they cool relatively quickly at night. Wide canyons are therefore
targets for GI to increase shade and reduce their heat accumulation during the day
(Figure 6).
Narrow canyons with tall buildings are generally well-shaded because the sun can’t
reach the ground. At night, the tall buildings and narrow streets trap heat and don’t allow
the surface to cool down as quickly. This type of canyon structure is where the classic
urban heat island is most evident. Considering the aim of reducing high surface
temperatures, deep, narrow canyons are lower priorities for GI implementation for
cooling during the day because of the greater amount of self-shading (Figure 6). Deep,
narrow streets will still benefit from GI installation on the canyon floor and lower walls in
particular, especially if there is high pedestrian activity. Narrow canyons with low
buildings are also a priority for mitigation (Figure 6) because they are less shaded
than canyons with tall buildings and they can heat up depending on their orientation.
However, space restrictions in narrow canyons may mean green facades or hedges
might be selected over trees.
Street orientation
Streets orientated north-south (or close to) will experience the majority of their sun
exposure in the middle of the day. The west-facing (east) side of the street is likely to get
the hottest because it receives the afternoon sun. North-south orientated canyons are
lower priority targets than east-west canyons, unless they are very wide (Figure 6).
Streets orientated east-west (or close to) will experience direct sun throughout the
majority of the day. East-west oriented streets are therefore high priorities for GI to
mitigate high urban temperatures (Figure 6).The north-facing (south) side of the street is
likely to get the hottest because it receives direct sunshine throughout the day during
southern hemisphere summers.
Surface temperature is highly dependent on the time of day and length of time a street is
warmed by the sun. As a result, for streets on a diagonal, the further the street orientation
deviates from north-south, the less self-shading there will be from buildings. Even
relatively small changes from north-south can result in higher temperatures, but priority
diagonal streets should be those closest to an East-West orientation.

18
Figure 7: Classification of streets in priority areas for GI-based reduction of daytime surface temperatures at the summer equinox. Priority is based on the extent of self-
shading by buildings.
Canyon width Prioritisation Canyon orientation
Wide 40 m EW
NS
30 m EW
NS
Medium 20 m EW
NS
Narrow 10 m EW
NS
Key
Low Medium Tall
High priority 6 12 18 24 30 36 metres
Moderate priority 1 2 3 4 5 6 Storeys
Low priority Canyon height
Not a priority

19
Once priority locations have been identified, specific GI options need to be determined
for each of those locations. The overall goal for urban temperature reduction using GI is
to maximise green cover. To meet this goal at a city-wide or local government level,
green open spaces will be critical because of the significant contribution they make to
UGI cover. Within street canyons, the goal is to maximise green cover particularly in
highly solar exposed street. So the primary goal is to maximise ‘overhead’
vegetation canopy cover. Overhead vegetation cover reduces canyon surface
temperatures as well as providing shading and cooling. In most cases, tree canopies are
the optimal solution for providing overhead vegetation canopy cover because they
shade large areas if appropriate canopy structures are selected and well maintained. In
addition, they provide many other co-benefits such as aesthetic and cultural value or the
trapping of particulate pollutants [25, 40] (Table 1). Alternative overhead vegetation
options include vine-covered archways.
A secondary goal is to increase surface vegetation cover, which is vegetation that
covers either ground or wall surfaces. This reduces surface temperatures and increases
transpiration, but does not provide shading. GI options for surface vegetation cover
include vertical greening systems, green roofs and grassed surfaces (Table 1). These
options are desirable in areas where tree installation is not possible. Surface vegetation
cover provides additional benefits such as structural diversity, recreational space and
increased permeability of urban surfaces. When applied directly to building surfaces,
they can also provide significant benefits for building occupants and owners.
We focus here on five types of GI: green open spaces; street trees; green walls and
green facades, in line with available evidence. If there are opportunities for other GI
options, such as streetside plantings shrubs, these should also be considered to meet the
overall goal of increased vegetation cover.
Urban green open spaces
Urban green open spaces (GOS) are primarily grassed areas with a relatively sparse (or
absent) tree canopy, such as ornamental parks, sporting fields and golf courses, but also
include remnant vegetation and urban agriculture. These areas can provide ‘islands’ of
cool in hot urban areas. Depending on their size and the wind direction, they can also
cool the surrounding landscape. Increasing the total area of green open spaces across an
LGA or city leads to significant reductions in temperature at the meso-scale. As the
largest form of GI, green open spaces are therefore critical in maximising the extent of
green infrastructure at the city scale and innovative opportunities to create new GOS
ANALYSE AND SELECT GI OPTIONS

20
should be pursed. For example the City of Melbourne has recently created a new park in
North Melbourne by removing and reducing the width of roads.
GOS are most effective for cooling at the local scale if they contain scattered trees
and are irrigated. They also have lower interior temperatures if they are larger in size,
but a strategy of many, smaller GOS would provide benefits to a larger number of people
by providing accessible cooler spaces close to home. Larger GOS can provide cooling to
areas downwind, and should therefore be located upwind of priority areas (Table 1). In
Melbourne, extreme heat events are usually associated with high pressure systems East
of Victoria, which bring warm continental air from the North. Locating GOS to the north of
priority areas should increase their benefit e.g Royal Park for Melbourne’s CBD.
Trees
Trees reduce surface temperatures by reflecting and absorbing solar radiation, thereby
providing shade. Trees also cool the surrounding air at the micro scale through canopy
transpiration (Table 1). Increasing tree canopy coverage is one of the most cost-
effective strategies for cooling buildings and local neighbourhoods. However, urban
environments are often hostile environments for tree growth, with high levels of
impervious surface cover, low soil moisture, changed soil properties and high pollution
loads. As a result, the magnitude of cooling may not be as great for street trees as trees
in urban parklands or rural areas. Shade provision by trees depends on both their trunk
and branches, as well as the leafy canopy. Broad, wide and short trees are particularly
effective at shading pedestrians. Trees that retain a thick canopy with high leaf area
density provide particularly good shade, meaning that broadleaf trees are generally
more effective than needle-leaf trees. Deciduous trees should be considered where heat
gain in winter is also desired.
Not all tree species possess the same capacities for heat and drought tolerance. The City
of Melbourne’s Urban Forest Strategy 2012-2032 (City of Melbourne 2011) provides a
useful set of guidelines for tree species selection in different urban contexts, highlighting
the tradeoffs in service provision and survivorship of trees. Information relevant to the
drier, western suburbs can be found in the Hume City Council Street and Reserve Tree
Policy 2004 (Hume City Council 2004).
The arrangement of trees within the street canyon will influence how effectively
they reduce temperatures. Table 1 provides guidance on designing the most effective
arrangement. In some cases there is likely to be competing demands for trees with other
infrastructure such as overhead powerlines. Where existing infrastructure cannot be
changed, climbing plants can be trained on supporting structures to avoid other
infrastructure while still providing overhead shading.
A diversity of tree species can be important in moderating temperatures throughout
both the day and night. Trees that provide the greatest shade during hot summer days
can also trap heat under their canopy at night. To minimise the amount of heat trapped,
street trees should not form a continuous canopy, thereby allowing hot air to escape in
the spaces between trees. A mix of tree species with different canopy architectures could

21
be considered for the same reason. Aiming to create and sustain an urban forest with
species diversity can also increase climate change resilience and provide a diversity of
ecosystem services.
Green roofs
A green roof is a roof that uses vegetation to improve its appearance, environmental
performance or both. During the day, roofs are some of the hottest surfaces in urban
areas and green roofs can potentially play an important role in mitigating urban
temperatures at a meso-scale, as well as reducing temperatures inside buildings through
insulation.
There are two commonly used classifications of green roofs. Extensive green roofs have
thin growing media (2-20 cm) that can support a limited range of small plants, while
intensive roofs have a thicker layer of growth media that can support a wider range of
plants including large trees and shrubs, and can be considered as rooftop parks. Most
green roofs are ‘extensive’, because they are lighter and cheaper to install and can be
retrofitted to a wider range of buildings. They have been successfully used in northern
hemisphere cities for cooling roofs, but in the hot, dry summers in Australia, keeping
plants alive has been a greater challenge.
Green roofs have been found to provide the best reduction in surface temperatures
when they have high vegetation cover, with dense, green leaf cover, preferably with
large leaves and with a variety of different vegetation heights, and are irrigated.
Unfortunately, the more common extensive green roofs are generally only capable of
supporting small plants and groundcovers, with Sedums being the most popular choice
in the northern hemisphere. Achieving a balance between maximising the performance
of green roof vegetation for cooling during Australia’s hot summer conditions, while
keeping plants alive in shallow soils with minimal irrigation is an ongoing area of
research. Further information is being prepared on the requirements for green roofs in
southeastern Australia as part of the Growing Green Guide Melbourne (see
http://growinggreenguide.org/ ).
The extent of the cooling benefit of green roofs is not yet clear. Modelling studies
suggest that green roofs can play a role in UHI mitigation. This positive effect may only
come from extensive installation of irrigated green roofs – over many buildings and
particularly on large roofs. Their influence on cooling at street level will be low unless
the roof level is close to ground level. For urban cooling, we recommended them
primarily for large, low buildings, or for implementation in areas with little space
for ground level urban greening (Table 1).
22
Vertical greening systems
The term ‘vertical greening system’ (VGS) refers to vegetation that is growing on, or
very near, a wall. There are two main categories of vertical greening: green facades
and green (or living) walls. Green facades are climbing plants growing up a wall,
either directly onto the wall surface (direct green facades) or up a trellis or similar
structure set slightly away from the wall (double-skin green facades or green curtains).
Green facades can be planted in the ground or in planter boxes at any height up the
sides of a building. As well as preventing heat gain to buildings, green facades can
beautify urban areas and provide cooling through transpiration. Green or living walls
are comprised of plants grown in modular panels or hydroponic felt curtains attached to
the wall. However, these tend not to be a realistic option for wide spread implementation
because of their high installation, life-cycle and ongoing maintenance costs.
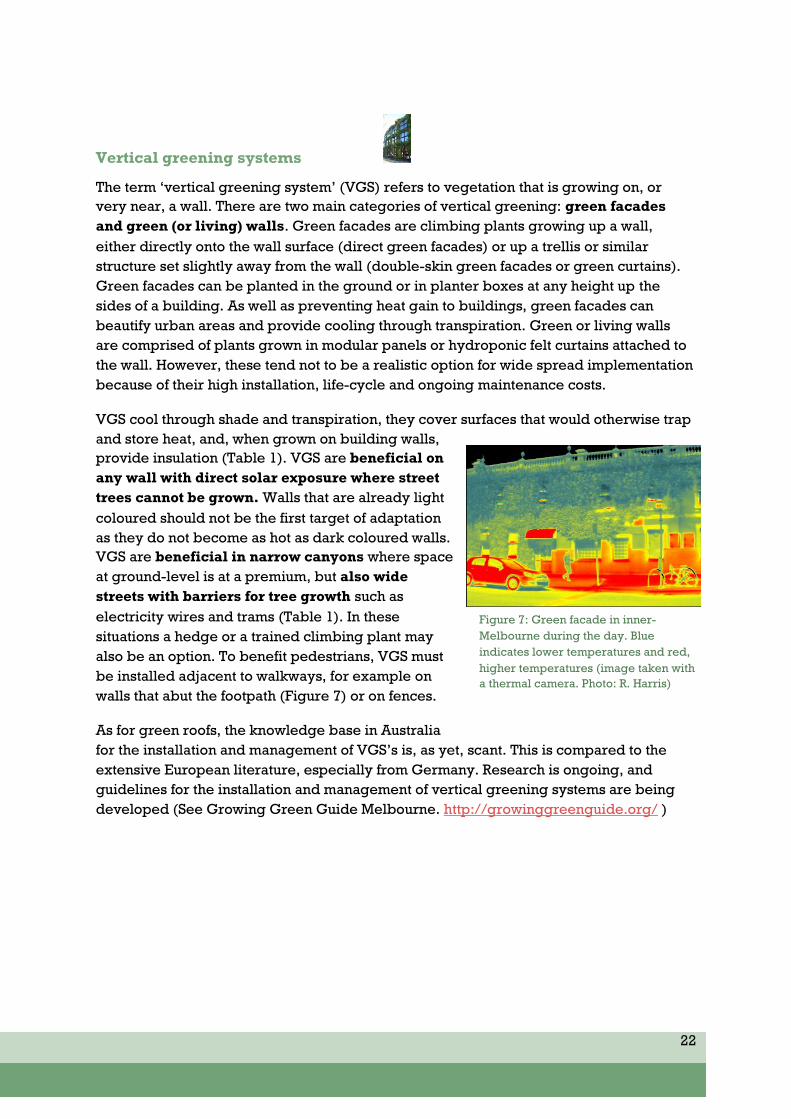
VGS cool through shade and transpiration, they cover surfaces that would otherwise trap
and store heat, and, when grown on building walls,
provide insulation (Table 1). VGS are beneficial on
any wall with direct solar exposure where street
trees cannot be grown. Walls that are already light
coloured should not be the first target of adaptation
as they do not become as hot as dark coloured walls.
VGS are beneficial in narrow canyons where space
at ground-level is at a premium, but also wide
streets with barriers for tree growth such as
electricity wires and trams (Table 1). In these
situations a hedge or a trained climbing plant may
also be an option. To benefit pedestrians, VGS must
be installed adjacent to walkways, for example on
walls that abut the footpath (Figure 7) or on fences.
As for green roofs, the knowledge base in Australia
for the installation and management of VGS’s is, as yet, scant. This is compared to the
extensive European literature, especially from Germany. Research is ongoing, and
guidelines for the installation and management of vertical greening systems are being
developed (See Growing Green Guide Melbourne. http://growinggreenguide.org/ )
Figure 7: Green facade in inner-
Melbourne during the day. Blue
indicates lower temperatures and red,
higher temperatures (image taken with
a thermal camera. Photo: R. Harris)
23
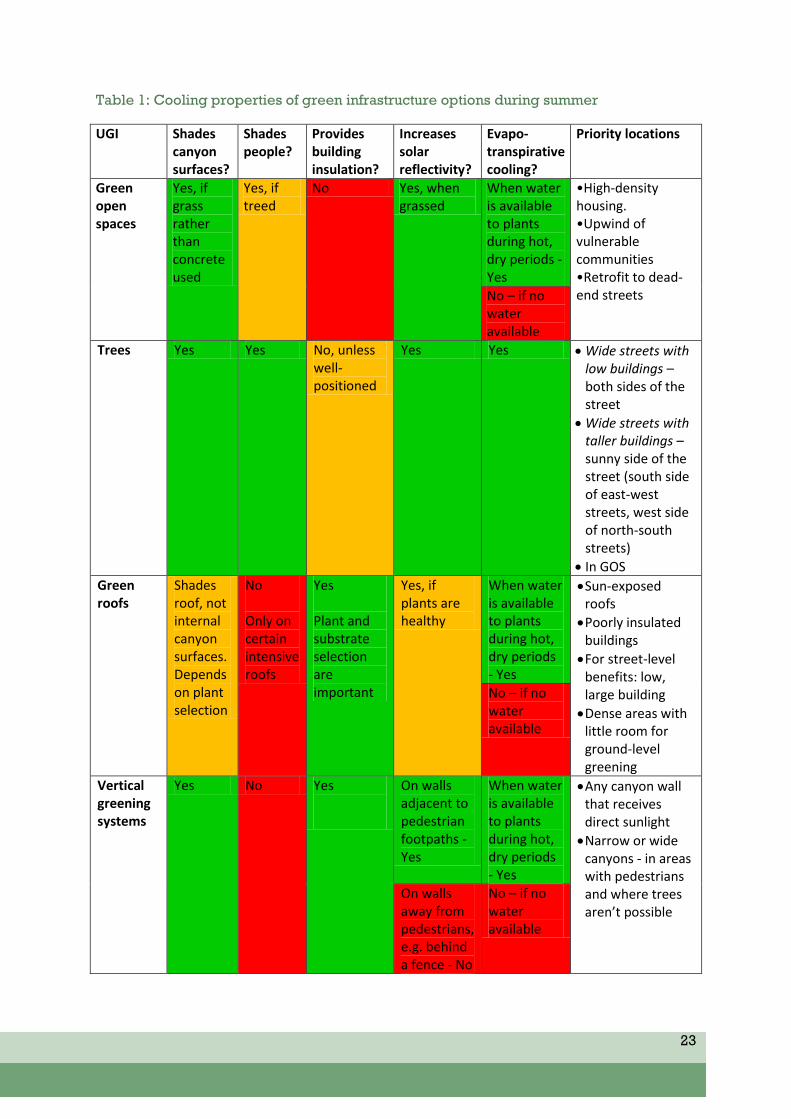
Table 1: Cooling properties of green infrastructure options during summer
UGI Shades canyon surfaces?
Shades people?
Provides building insulation?
Increases solar reflectivity?
Evapo-transpirative cooling?
Priority locations
Green open spaces
Yes, if grass rather than concrete used
Yes, if treed
No Yes, when grassed
When water is available to plants during hot, dry periods - Yes
•High-density housing. •Upwind of vulnerable communities •Retrofit to dead-end streets No – if no
water available
Trees Yes Yes No, unless well-positioned
Yes Yes Wide streets with low buildings – both sides of the street
Wide streets with taller buildings –sunny side of the street (south side of east-west streets, west side of north-south streets)
In GOS
Green roofs
Shades roof, not internal canyon surfaces. Depends on plant selection
No Only on certain intensive roofs
Yes Plant and substrate selection are important
Yes, if plants are healthy
When water is available to plants during hot, dry periods - Yes
Sun-exposed roofs
Poorly insulated buildings
For street-level benefits: low, large building
Dense areas with little room for ground-level greening
No – if no water available
Vertical greening systems
Yes No Yes
On walls adjacent to pedestrian footpaths - Yes
When water is available to plants during hot, dry periods - Yes
Any canyon wall that receives direct sunlight
Narrow or wide canyons - in areas with pedestrians and where trees aren’t possible
On walls away from pedestrians, e.g. behind a fence - No
No – if no water available

24
A sound policy framework is key to enabling strategic implementation of GI in urban
areas. New, or changes to existing policies, regulations, standards and guidelines should
be considered to encourage or mandate GI during land use planning, land acquisition
and development and urban design. It is also important to ensure that existing policies
and standards do not pose an unreasonable barrier to GI. Bosomworth et al. (2012,
VCCCAR) lists a range of example policies that could support council efforts to
implement a strategic GI plan.
Public Realm
Policies governing the management and sale of urban public land were reviewed as part
of the Victorian Environment Assessment Council’s Metropolitan Melbourne
Investigation [41] which explicitly recognised the value of public land for mitigating
excess urban heat and the community’s concerns regarding its loss and the impact of
Melbourne’s rapidly growing population. Implementation of many of the report’s
recommendations would positively influence the provision of GI in Melbourne and
should be pursued. These include a no-net-loss policy for public open space and
changes to the subdivision act to ensure developer open space contributions for inner
and middle ring local councils not just those on the urban fringe. One example, the City
of Melbourne have proposed a planning scheme amendment (C209) that would require
developer cash contributions of 5%, and 8% of the value of a site, land contributions in
areas with an identified open space shortage or both.
Government should also consider requirements for green infrastructure contributions
from developers where zoning changes allow multi-unit residential development without
subdivision. For example, planned development overlays along transport routes will
significantly increase building density and therefore heat retention. Green infrastructure
contributions could potentially be used to finance increased street tree plantings or
water sensitive urban design initiatives that increase the effectiveness of existing GI.
Other potential public realm policy changes supporting GI include:
Protection of existing GI through greater penalties for illegal destruction of trees;
Pursuing opportunities to create additional GI through the closure of streets to
create new or expanded local parks. Successful examples include Barkly Gardens
in Richmond and Errol Street in North Melbourne
http://www.victoriawalks.org.au/pocket_parks/ ;
Coordinate investment of limited resources by working with agencies such as
VicRoads, Public Transport Victoria and gas and water retailers to implement UGI
when they are doing works for other purposes. Having a dedicated budget for
opportunistic works could facilitate this as could utilising programs such as City
West Water’s co-funding model.
PLANNING AND POLICY

25
Encouraging public understanding of the value of GI for urban cooling should also be
explored as a means of developing community advocacy for increased GI. Providing
resources, such as open space and corresponding heat maps on council or state
government websites or in local newspapers, will enable people to determine the
amount of GI in their neighbourhood, and the environmental and economic benefits this
may bring relative to other areas. Residents who perceive their neighbourhoods to be
lacking GI may lobby for increased planting of local GI.
Private Realm
A supportive policy framework to provide commercial and residential GI could use
combinations of regulations and incentives, supported by provision of information and
advice. Regulations could include provisions to keep a percentage of stormwater runoff
on-site and tree protection laws. Bosomworth et al. (2012, VCCCAR) identified several
examples from the USA including:
Development incentives One of the most effective ways of implementing GI is through
integrated land development design, planning and policies, supported by incentives and
regulations. For example, incentives might be offered to developers during the process
of applying for development permits, such as: zoning upgrades, expedited permitting,
reduced stormwater management requirements and increases in floor area. In other
cases, GI might be mandated for particular types of development. These could be based
on systems such as the Green Building Council of Australia’s Greenstar rating, through
provisions of special privileges for developers who implement green infrastructure with
certification
Stormwater fee discounts For large new developments a stormwater management fee that
is based on impervious surface area could be considered. If property developers reduce
the need for stormwater infrastructure by reducing impervious area and the volume of
runoff discharged from the property, the municipality(or in our case water authority)
reduces the fee.
Grants, rebates and installation financing Provide direct funding, tax credits or
reimbursements to property owners and/or community groups for implementing a range
of green infrastructure projects and practices, including installation of specific practices
in identified ‘hotspots’.
Awards and recognition programs Provide marketing opportunities and public outreach
for exemplary projects, which may include monetary awards.

26
FURTHER READING
Baumüller, J., U. Hoffmann, et al. (2008). Climate Booklet for Urban Development Online.
Stuttgart, Ministry of Economy Baden-Wuerttemberg and Environmental Protection
Department: http://www.staedtebauliche-klimafibel.de/Climate_Booklet/index-1.htm.
de Roo, M. (2011). "The green city guidelines: Techniques for a healthy liveable city."
Holland. http://www.degroenestad.nl/Media/download/7074/Green+City+Guidelines.pdf.
Emmanuel, M. R. (2005). An urban approach to climate sensitive design: strategies for the
tropics. Abingdon, Oxon, Spon Press.
Hoverter, S. P. (2012). "Adapting to urban heat: A tool kit for local governments." Washington
D.C. http://www.georgetownclimate.org/adaptation-tool-kit-urban-heat.
James, S., A. Jaluzot, et al. (2012). "Trees in the townscape: a guide for decision makers."
Trees & Design Action Group, UK. http://www.tdag.org.uk/trees-in-the-townscape.html.
Kazmierczak, A. and J. Carter (2010). "Adaptation to climate change using green and blue
infrastructure: a database of case studies." http://www.grabs-
eu.org/membersArea/files/Database_Final_no_hyperlinks.pdf.
Milošovičová, J. (2010). “Climate-sensitive urban design in moderate climate zone:
Responding to future heat waves, case study Berlin – Heidestrasse/Europacity”. Masters
Thesis. http://jm-urbandesign.com/images/Thesis%20document.pdf.
O'Neill, M. S., R. Carter, et al. (2009). "Preventing heat-related morbidity and mortality: new
approaches in a changing climate." Maturitas 64: 98-103.
Sustainable Sites Initiative (SITES) (2009). "The sustainable sites intitiative: Guidelines and
performance benchmarks." American Society of Landscape Architects and Lady Bird Johnson
Wildflower Center at The University of Texas at Austin United States Botanic Garden.
http://www.sustainablesites.org/report/.
Growing Green Guide: Victoria’s Guide to Green Roofs, Walls and Facades (2013)
http://growinggreenguide.org/
United States Environmental Protection Agency (2008). "Reducing Urban Heat Islands:
compendium of strategies - cool pavements."
http://www.epa.gov/heatisld/resources/compendium.htm.
Wong, T. H. F. and Centre for Water Sensitive Cities (2011). Stormwater management in a
water sensitive city: blueprint 2011. Clayton, Victoria, Centre for Water Sensitive Cities.
http://www.clearwater.asn.au/content/blueprint-stormwater-management-water-sensitive-
city
FURTHER READING &
REFERENCES

27
REFERENCES
1. Loughnan, M., N. Nicholls, and N. Tapper. Hot spots project: A spatial vulnerability analysis of urban populations to extreme heat events. 2009 1 February 2013]; Available from: http://docs.health.vic.gov.au/docs/doc/2BE6722DD7C4874ACA257A360024E0DE/$FILE/heatwaves_hotspots_project.pdf.
2. Coutts, A. and R. Harris, A multi-scale assessment of urban heating in Melbourne during an extreme heat event and policy approaches for adaptation, 2012, School of Geography and Environmental Science, Monash University: Melbourne.
3. Oke, T., The energetic basis of the urban heat island. Quarterly Journal of the Royal Meteorological Society, 1982. 108: p. 1-24.
4. Oke, T.R., et al., Simulation of surface urban heat islands under 'ideal' conditions at night Part 2: Diagnosis of causation. Boundary-Layer Meteorology, 1991. 56: p. 339-358.
5. Coutts, A., J. Beringer, and N. Tapper, Changing Urban Climate and CO2 Emissions: Implications for the Development of Policies for Sustainable Cities. Urban Policy and Research, 2010. 28: p. 27-47.
6. Oke, T.R., Canyon geometry and the nocturnal urban heat island: Comparison of scale model and field observations. Journal of Climatology, 1981. 1: p. 237-254.
7. Grimm, N.B., et al., Global change and the ecology of cities. Science, 2008. 319(5864): p. 756-60.
8. McCarthy, M.P., M.J. Best, and R.A. Betts, Climate change in cities due to global warming and urban effects. Geophysical Research Letters, 2010. 37(9): p. n/a-n/a.
9. IPCC, Managing the risks of extreme events and disasters to advance climate change adaptation, in A Special Report of Working Groups I and II of the Intergovernmental Panel on Climate Change, C.B. Field, et al., Editors. 2012, Cambridge University Press: Cambridge, UK, and New York, NY, USA. p. 582.
10. Harlan, S.L., et al., Neighborhood microclimates and vulnerability to heat stress. Soc Sci Med, 2006. 63(11): p. 2847-63.
11. Mirzaei, P.A. and F. Haghighat, Approaches to study Urban Heat Island –
Abilities and limitations. Building and Environment, 2010. 45: p. 2192-2201.
12. Nicholls, N., et al., A simple heat alert system for Melbourne, Australia. International Journal of Biometeorology, 2008. 52(5): p. 375-384.
13. Department of Human Services, January 2009 heatwave in Victoria: An assessment of health impacts, in State of Victoria2009: Melbourne, Victoria.
14. Australian Bureau of Statistics. Main Features, 3218.0 - Regional Population Growth, Australia, 2011. 2011 13 March 2013]; Available from: http://www.abs.gov.au/ausstats/[email protected]/Products/3218.0~2011~Main+Features~Main+Features?OpenDocument.
15. Australian Bureau of Statistics. ABS 3222.0 Population projections, Australia 2006 to 2101. 2008 3 March 2012]; Available from: http://www.abs.gov.au/AUSSTATS/[email protected]/DetailsPage/3222.02006%20to%202101.
16. Queensland University of Technology. Impacts and adaptation response of infrastructure and communities to heatwaves: the southern Australian experience of 2009. 2010 21 March 2013]; Available from: http://www.isr.qut.edu.au/downloads/heatwave_case_study_2010_isr.pdf.
17. McMichael, A.J., et al., eds. Climate change and human health: Risks and responses. 2003, World Health Organization: Geneva.
18. Turner II, B.L., et al., A framework for vulnerability analysis in sustainability science. Proc Natl Acad Sci U S A, 2003. 100(14): p. 8074-9.
19. Victorian Department of Health, Heatwave plan for Victoria:Protecting health and reducing harm from heatwaves, 2011, Health Protection Branch, Victorian Department of Health: Melbourne.
20. Loughnan, M., et al. A spatial vulnerability analysis of urban populations during extreme heat events in Australian capital cities. 2013 31 January 2013]; Available from: http://www.nccarf.edu.au/publications/spatial-vulnerability-urban-extreme-heat-events.
21. Oke, T., The need to establish protocols in urban heat island work, in The seventh International Conference on Urban

28
Climate2009, 29 June - 3 July: Yokohama, Japan. p. https://ams.confex.com/ams/89annual/techprogram/pa.
22. Voogt, J., Urban heat island, in Encyclopedia of global environmental change, I. Douglas, Editor. 2002, John Wiley and Sons: New York. p. 660-666.
23. Roth, M., T. Oke, and W. Emery, Satellite-derived urban heat islands from three coastal cities and the utilization of such data in urban climatology. International Journal of Remote Sensing, 1989. 10: p. 1699-1720.
24. Bolund, P. and S. Hunhammar, Ecosystem services in urban areas. Ecological Economics, 1999. 29: p. 293-301.
25. Dobbs, C., F.J. Escobedo, and W.C. Zipperer, A framework for developing urban forest ecosystem services and goods indicators. Landscape and Urban Planning, 2011. 99(3-4): p. 196-206.
26. Tratalos, J., et al., Urban form, biodiversity potential and ecosystem services. Landscape and Urban Planning, 2007. 83: p. 308-317.
27. Tzoulas, K., et al., Promoting ecosystem and human health in urban areas using Green Infrastructure: A literature review. Landscape and Urban Planning, 2007. 81: p. 167-178.
28. Emmanuel, M.R., An urban approach to climate sensitive design: strategies for the tropics. 2005, Abingdon, Oxon: Spon Press.
29. Givoni, B., Climate considerations in building and urban design. 1998, New York City: John Wiley & Sons Ltd.
30. Golany, G.S., Design for arid regions. 1983, New York City: Van Nostrand Reinhold Company Inc.
31. Wong, T.H.F. and Centre for Water Sensitive Cities, Stormwater management in a water sensitive city : blueprint 2011, 2011, Centre for Water Sensitive Cities: Clayton, Victoria.
32. Cutter, S.L., J.T. Mitchell, and M.S. Scott, Revealing the vulnerability of people and places: A case study of Georgetown County, South Carolina. Annals of the
Association of American Geographers, 2000. 90(4): p. 713-737.
33. Huang, G., W. Zhou, and M.L. Cadenasso, Is everyone hot in the city? Spatial pattern of land surface temperatures, land cover and neighborhood socioeconomic characteristics in Baltimore, MD. J Environ Manage, 2011. 92(7): p. 1753-9.
34. Jenerette, G.D., et al., Regional relationships between surface temperature, vegetation, and human settlement in a rapidly urbanizing ecosystem. Landscape Ecology, 2007. 22: p. 353-365.
35. Jenerette, G.D., et al., Ecosystem services and urban heat riskscape moderation: Water, green spaces, and social inequality in Phoenix, USA. Ecological applications : a publication of the Ecological Society of America, 2011. 21: p. 2637-51.
36. O'Neill, M.S., et al., Preventing heat-related morbidity and mortality: New approaches in a changing climate. Maturitas, 2009. 64: p. 98-103.
37. Department of Planning and Community Development. Victoria in Future 2012. 2012 10 January 2013]; Available from: http://www.dpcd.vic.gov.au/home/publications-and-research/urban-and-regional-research/census-2011/victoria-in-future-2012.
38. Bourbia, F. and H.B. Awbi, Building cluster and shading in urban canyon for hot dry climate Part 2: Shading simulations. Renewable Energy, 2004. 29: p. 291-301.
39. Bourbia, F. and H.B. Awbi, Building cluster and shading in urban canyon for hot dry climate Part 1: Air and surface temperature measurements. Renewable Energy, 2004. 29: p. 249-262.
40. McPherson, G., et al., Municipal forest benefits and costs in five US cities. Journal of Forestry, 2005. 103(8): p. 411-416.
41. Victorian Environmental Assessment Council, Metropolitan Melbourne investigation: Final report, 2011: Melbourne.

29
A multi-disciplinary, multi-partner project funded by the Victorian Centre for Climate
Change Adaptation Research (VCCCAR), this research involved a formal partnership
between RMIT University, the University of Melbourne and Monash University. The
involvement of the City of Melbourne, the City of Port Phillip and the Department of
Planning and Community Development, especially in the thermal flyover processes, is
gratefully acknowledged.
In addition, development of this guide would not have been possible without the
generous, willing participation of a range of people, from Local and State government as
well as private industry in interviews and workshops. The authors would therefore like to
acknowledge participants from the following organisations: City of Melbourne, City of
Port Phillip, City of Yarra, City West Water , Department of Planning and Community
Development (DPCD), Department of Sustainability and Environment (DSE), Hobsons
Bay City Council, Hume City Council, Maribyrnong City Council, Monash City Council,
Moonee Valley City Council, Moreland City Council, Northern Alliance for Greenhouse
Action (NAGA), South East Councils Climate Change Alliance (SECCCA), Wyndham City
Council.
ACKNOWLEDGEMENTS