Embed Size (px)
Citation preview
Summary of Key Findings
Planning Considerations Related to the Organic Contamination of Martian Samples and Implications for the Mars 2020 Rover
Presented to NRC-CAPSSept. 4, 2014
©2014 California Institute of TechnologyGovernment sponsorship acknowledged
David Beatyon behalf of the Mars 2020 Organic Contamination Panel
Mars 2020 Organic Contamination Panel (2014), Committee members: Summons, R.E. and A.L. Sessions (co-chairs); A.C. Allwood, H. A. Barton, D.W. Beaty, B. Blakkolb, J. Canham, B. C. Clark, J. P. Dworkin, Y. Lin, R. Mathies, S. M. Milkovich, and A. Steele (2014): Planning Considerations Related to the Organic Contamination of Martian Samples and Implications for the Mars 2020 Rover, 118 pp., posted September, 2014, by the Mars Exploration Program Analysis Group (MEPAG) athttp://mepag.jpl.nasa.gov/reports.cfm?expand=smd.
The presentation summarizes this white paper:

10/15/2014 Mars 2020 Organic Contamination Study Panel Preliminary results for planning/discussion and review purposes only 2
The “Organic Contamination Panel” has been chartered with 4 primary technical tasks.
1. Based on current knowledge and capabilities, construct a list of measurements (and associated instruments/methods) anticipated to be made on the returned samples in support of objectives related to Martian organic geochemistry.
2. Determine the types and quantities of Earth-sourced organic contaminants of greatest concern, if they were on the samples. Also, specify a total organic carbon constraint.
3. Assess possible implementation approaches for recognizing and distinguishing Mars-sourced organic molecules in the samples from Earth-sourced organic molecular contamination.
4. Evaluate draft Mars 2020 mission sample organic contamination requirements and draft verification methodologies (to be provided by the Mars 2020 project).
Charge to the OCP
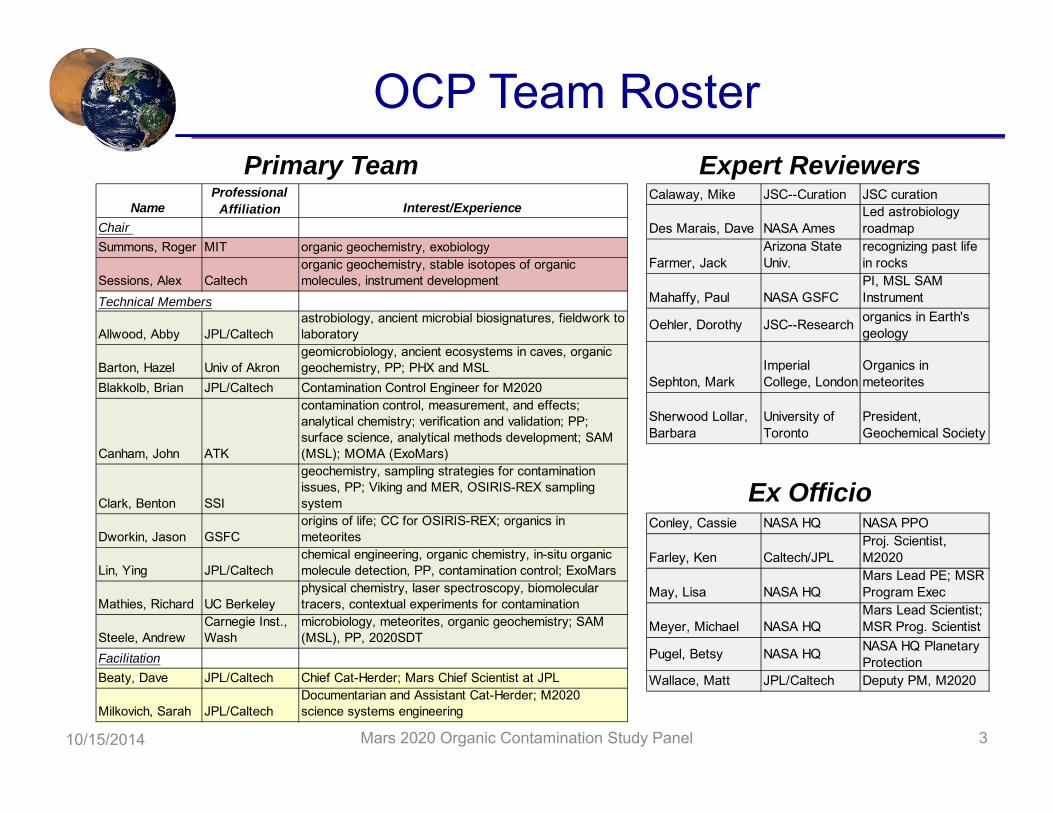
OCP Team Roster
10/15/2014 Mars 2020 Organic Contamination Study Panel 3
NameProfessional
Affiliation Interest/ExperienceChair Summons, Roger MIT organic geochemistry, exobiology
Sessions, Alex Caltechorganic geochemistry, stable isotopes of organic molecules, instrument development
Technical Members
Allwood, Abby JPL/Caltechastrobiology, ancient microbial biosignatures, fieldwork to laboratory
Barton, Hazel Univ of Akrongeomicrobiology, ancient ecosystems in caves, organic geochemistry, PP; PHX and MSL
Blakkolb, Brian JPL/Caltech Contamination Control Engineer for M2020
Canham, John ATK
contamination control, measurement, and effects; analytical chemistry; verification and validation; PP; surface science, analytical methods development; SAM (MSL); MOMA (ExoMars)
Clark, Benton SSI
geochemistry, sampling strategies for contamination issues, PP; Viking and MER, OSIRIS-REX sampling system
Dworkin, Jason GSFCorigins of life; CC for OSIRIS-REX; organics in meteorites
Lin, Ying JPL/Caltechchemical engineering, organic chemistry, in-situ organic molecule detection, PP, contamination control; ExoMars
Mathies, Richard UC Berkeleyphysical chemistry, laser spectroscopy, biomolecular tracers, contextual experiments for contamination
Steele, AndrewCarnegie Inst., Wash
microbiology, meteorites, organic geochemistry; SAM (MSL), PP, 2020SDT
FacilitationBeaty, Dave JPL/Caltech Chief Cat-Herder; Mars Chief Scientist at JPL
Milkovich, Sarah JPL/CaltechDocumentarian and Assistant Cat-Herder; M2020 science systems engineering
Primary Team Expert Reviewers
Ex OfficioConley, Cassie NASA HQ NASA PPO
Farley, Ken Caltech/JPLProj. Scientist, M2020
May, Lisa NASA HQMars Lead PE; MSR Program Exec
Meyer, Michael NASA HQMars Lead Scientist; MSR Prog. Scientist
Pugel, Betsy NASA HQ NASA HQ Planetary Protection
Wallace, Matt JPL/Caltech Deputy PM, M2020
Calaway, Mike JSC--Curation JSC curation
Des Marais, Dave NASA AmesLed astrobiology roadmap
Farmer, JackArizona State Univ.
recognizing past life in rocks
Mahaffy, Paul NASA GSFCPI, MSL SAM Instrument
Oehler, Dorothy JSC--Research organics in Earth's geology
Sephton, MarkImperial College, London
Organics in meteorites
Sherwood Lollar, Barbara
University of Toronto
President, Geochemical Society
Mars 2020 Organic Contamination Study PanelPreliminary results for planning/discussion and review purposes only
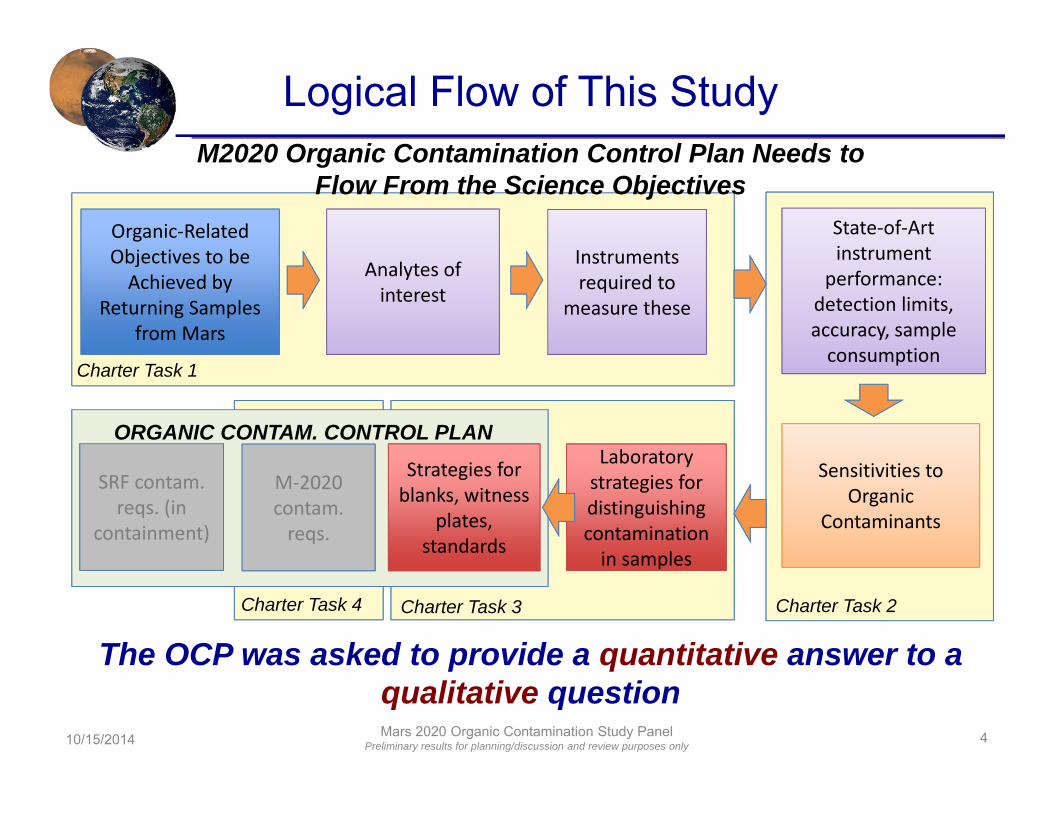
Logical Flow of This Study
10/15/2014 4
Organic‐Related Objectives to be Achieved by
Returning Samples from Mars
Analytes of interest
Sensitivities to Organic
Contaminants
Instruments required to
measure these
State‐of‐Art instrument
performance:detection limits, accuracy, sample consumption
ORGANIC CONTAM. CONTROL PLANStrategies for blanks, witness
plates, standards
Charter Task 1
Charter Task 2Charter Task 4 Charter Task 3
M2020 Organic Contamination Control Plan Needs to Flow From the Science Objectives
Laboratory strategies for distinguishing contamination in samples
The OCP was asked to provide a quantitative answer to a qualitative question
M‐2020 contam. reqs.
SRF contam. reqs. (in
containment)
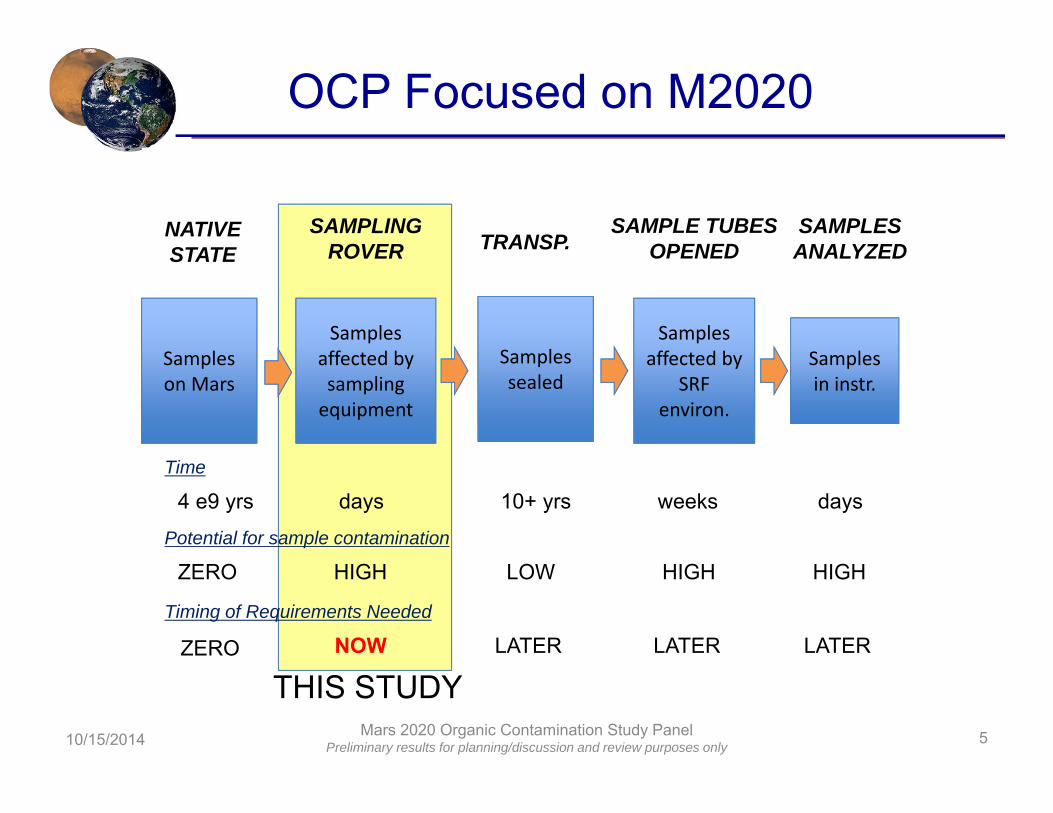
OCP Focused on M2020
10/15/2014 5
Samples affected by sampling equipment
Samples sealed
Samples affected by
SRF environ.
SAMPLING ROVER TRANSP.
SAMPLE TUBES OPENED
Samples in instr.
SAMPLES ANALYZED
Potential for sample contamination
HIGH LOW HIGH HIGH
Timing of Requirements Needed
NOW LATER LATER LATER
Samples on Mars
NATIVE STATE
ZERO
ZERO
Time
days 10+ yrs weeks days4 e9 yrs
THIS STUDYMars 2020 Organic Contamination Study Panel
Preliminary results for planning/discussion and review purposes only
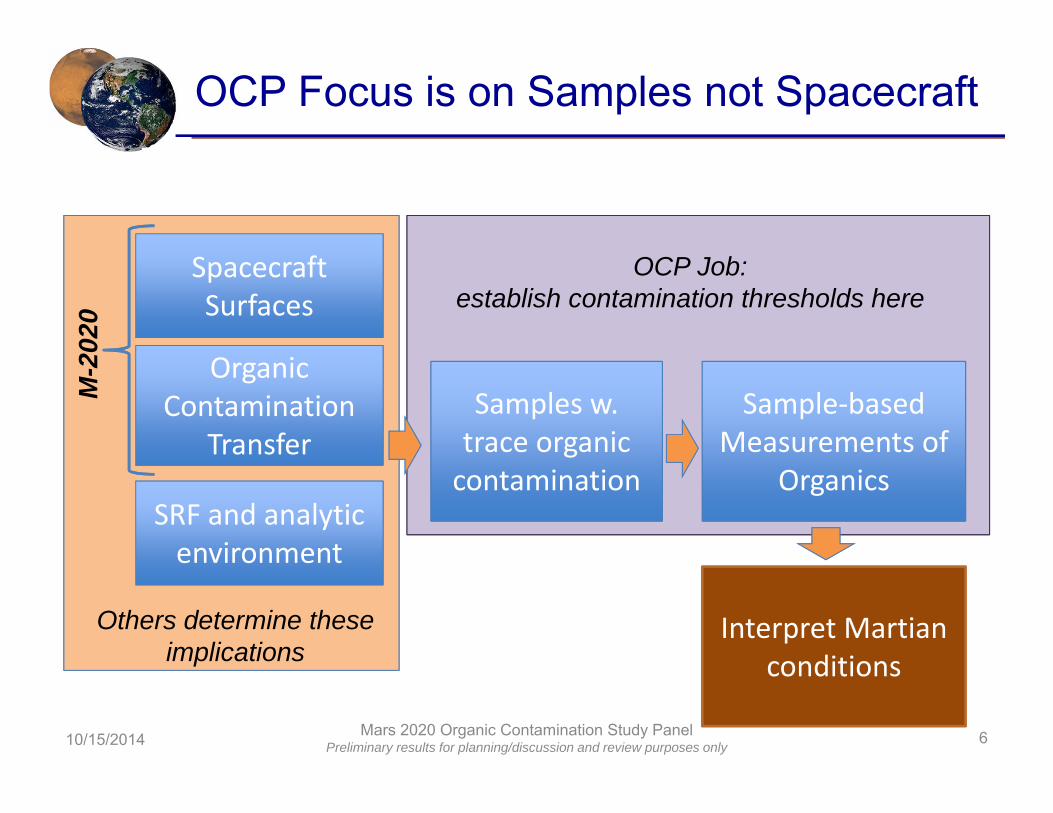
OCP Focus is on Samples not Spacecraft
10/15/2014 6
Spacecraft Surfaces
Samples w. trace organic contamination
Sample‐based Measurements of
Organics
Organic Contamination
Transfer
SRF and analytic environment
Interpret Martian conditions
M-2
020
Mars 2020 Organic Contamination Study PanelPreliminary results for planning/discussion and review purposes only
Others determine these implications
OCP Job: establish contamination thresholds here

Organic Contamination
10/15/2014 7Mars 2020 Organic Contamination Study Panel Preliminary results for planning/discussion and review purposes only
Any substance that significantly interferes with our ability to detect the presence of martian organic
compounds or prevents our confidently determining that an organic compound is of martian and not
terrestrial origin
as applied to the purposes of this committee
i.e., in addition to analytes of concern, we also consider organic and inorganic compounds that may interfere with measurements of organics.
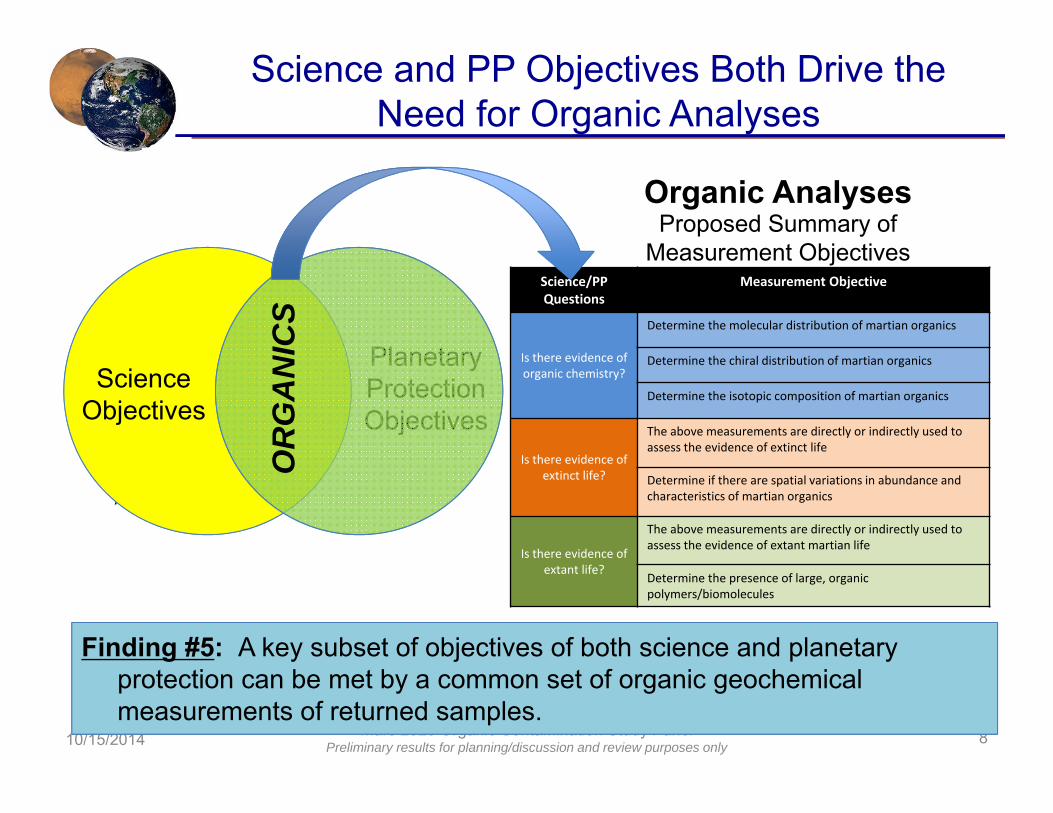
Science/PP Questions
Measurement Objective
Is there evidence of organic chemistry?
Determine the molecular distribution of martian organics
Determine the chiral distribution of martian organics
Determine the isotopic composition of martian organics
Is there evidence of extinct life?
The above measurements are directly or indirectly used to assess the evidence of extinct life
Determine if there are spatial variations in abundance and characteristics of martian organics
Is there evidence of extant life?
The above measurements are directly or indirectly used to assess the evidence of extant martian life
Determine the presence of large, organic polymers/biomolecules
Science and PP Objectives Both Drive the Need for Organic Analyses
10/15/2014 Mars 2020 Organic Contamination Study PanelPreliminary results for planning/discussion and review purposes only 8
PlanetaryProtectionObjectives
From E2E-iSAG
Proposed Summary of Measurement Objectives
Finding #5: A key subset of objectives of both science and planetary protection can be met by a common set of organic geochemical measurements of returned samples.
Organic Analyses
Science Objectives
OR
GA
NIC
S
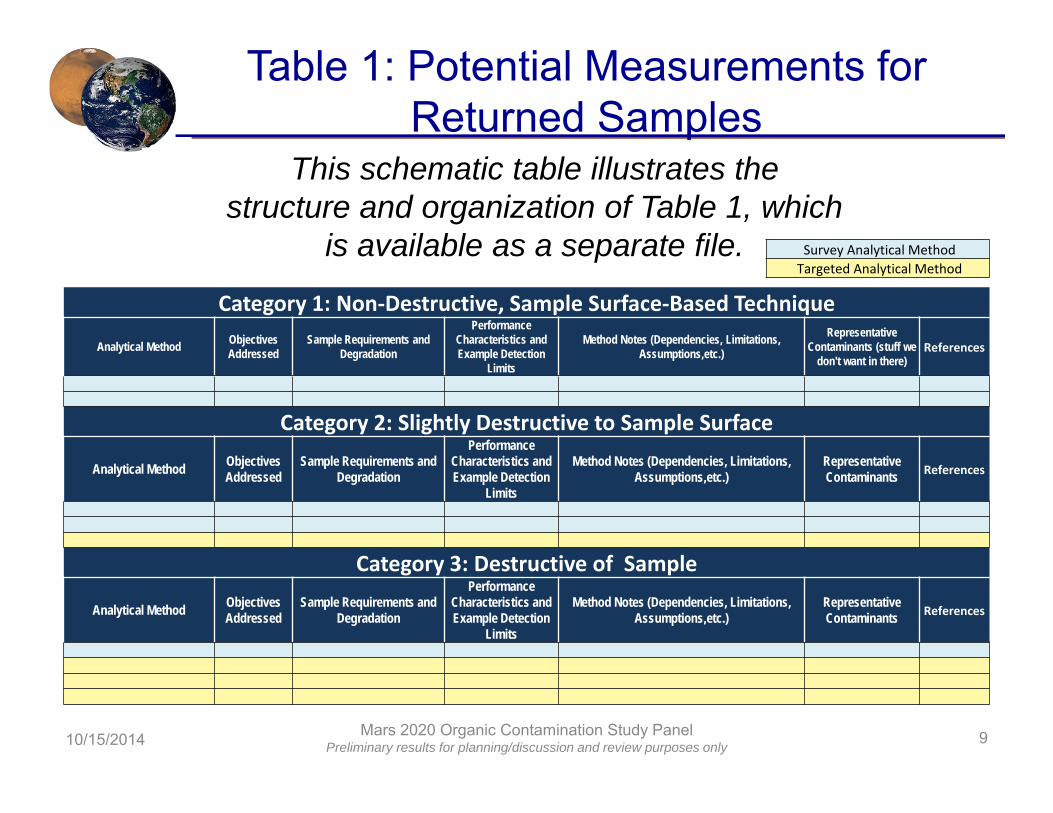
Table 1: Potential Measurements for Returned Samples
10/15/2014 Mars 2020 Organic Contamination Study PanelPreliminary results for planning/discussion and review purposes only 9
Category 1: Non‐Destructive, Sample Surface‐Based Technique
Analytical Method Objectives Addressed
Sample Requirements and Degradation
Performance Characteristics and Example Detection
Limits
Method Notes (Dependencies, Limitations, Assumptions,etc.)
Representative Contaminants (stuff we
don't want in there)References
Category 2: Slightly Destructive to Sample Surface
Analytical Method Objectives Addressed
Sample Requirements and Degradation
Performance Characteristics and Example Detection
Limits
Method Notes (Dependencies, Limitations, Assumptions,etc.)
Representative Contaminants References
Category 3: Destructive of Sample
Analytical Method Objectives Addressed
Sample Requirements and Degradation
Performance Characteristics and Example Detection
Limits
Method Notes (Dependencies, Limitations, Assumptions,etc.)
Representative Contaminants References
Survey Analytical MethodTargeted Analytical Method
This schematic table illustrates the structure and organization of Table 1, which
is available as a separate file.

Instruments and TechniquesWe can’t know which instruments will eventually be used, and it is technically impossible to protect the samples for all of them.
10/15/2014 Mars 2020 Organic Contamination Study Panel Preliminary results for planning/discussion and review purposes only 10
Finding: Because of the sensitivity of modern analytical instruments, we must accept that we will not be able to reduce all organic contaminants to non-detectable levels by all analytical techniques.
DEFINITE ANALYTICAL METHODS TO BE USED in LIGHT YELLOWCONTINGENT ANALYTICAL METHODS TO BE USED in LIGHT BLUECategory 1: Non-Destructive, Sample Surface-Based Technique
Analytical Method Objectives Addressed
Sample Requirements and Degradation1 Performance Characteristics and Detection Limits1 Method Notes (Dependencies, Limitations, Assumptions,etc.) References2
Deep UV Raman/Fluorescence Spectroscopy
1A, 2C Non-destructive. No surface preperation required.
Raman:Aromatics <10-4 w/w (<100 ppm)Aliphatics <10-4 w/w (<100 ppm)50 um/spot at 1 to 10s per spotFluorescence:Aromatics <10-6 w/w (<ppm)Single cell sensitivity (~2 pg carbon) [6]50 um/spot at 1s per spot
Performance can be enhanced with longer integration times.
Sensitivities depend on organic species and are matrix dependent.
Surface roughness can be handled based on optical system with hit against sensitivites or integration times.
Quantification is difficult
[1] Beegle, et. al., Lunar and Planetary Institute Science Conference Abstracts 45: 2835.[2] Ghosh, et. al, Applied Spectroscopy 66 (9): 1013–21. [3] Tuschel, David D, Aleksandr V Mikhonin, Brian E Lemoff, and Sanford A Asher. 2010. “Deep Ultraviolet Resonance Raman Excitation Enables Explosives Detection.” Applied Spectroscopy 64 (4), 425–32.[4] Bhartia, et.al., International Society for Optics and Photonics: 83581A–83581A–9.[5] Johnson, et.al, Astrobiology 11 (2): 151–56. [6] Bhartia et, al...,Applied and Environmental Microbiology, 2010, 76(21), p 7231-7237)
Confocal Raman Spectroscopy at up to 360nm micron spatial resolution
1A, 2C Non-destructive. Benefits from thin section, polished surface prep. Or can be fresh fracture surface with contour following confocal optics.
Lower limit from ~0.1 to 1 wt. % per spot analysis (30s) [1] with absolute detection limit correlated to number of analyzed spots.<50 ppm graphic carbon [1]Single cell detection sensitivity. [2]
Detection limits strongly dependent on laser wavelength, target species. 532 nm excitation provides non-quantitative detection of hematite, beta-carotene. Raman spectra are subject to organic and mineral background fluorescence, which can be mitigated by time-gating.Careful consideration for laser wavelength and power to avoid sample damage.Quantification is difficult
[1] Wang, et. al.Journal of Geophysical Research, 108(E1), 5005[2] Ref TBD
FT-IR Spectroscopy 1A, 2C Non-destructive. Benefits from thin section and polished surface prep, but can be used on unprepared surfaces. Ideally KBR pellets are made of samples.
Lower limit ~5 ppm for specific targets10 um/spot >200 min per spot [1]
Not sensitive to graphitic carbon.Samples are ideally crushed and made into KBR windows [2]Quantification is difficult
[1] Ref TBD [2] General approach for FTIR in literature. [2a] Bhaskar, Nature and Science, 2009;7(5), 45-51 (Dergoan H5 Chondrite) [2b] Matrajt, et. al., Astronomy & Astrophysics, 416(3), 2003, 983-990 (Tagish Lake Meteroirte) [3] Anderson, et. al., Review of Scientific Instruments, 76, 034101 (2005)
IR Reflectance Spectroscopy 1A, 2C Non-destructive. Lower limit typically ~0.5-1 wt. % per spot analysis, with absolute detection limit correlated to number of analyzed spots.
Sensitive to only specific organic species. Ideal for rapid mineral context.Quantification is difficult
[1] Not used actively for organics detection
Category 2: Slightly Destructive to Sample SurfaceAnalytical Method Objectives
Addressed Sample Requirements and Degradation Performance Characteristics and Detection Limits Method Notes (Dependencies, Limitations, Assumptions,etc.) References
Laser desorption-MS 1A, 2A, 2C Vacuum exposure, polished thin section or fresh fracture surface, laser beam damage
Semi-quantitative, wide range of sensitivies including sub-fmol. Specific to PAH or other large conjugated systems. No chromatography, so no distinction of isomers or enantiomers.
Time-of-Flight Secondary Ion Mass Spectroscopy (ToF-SIMS)
1A, 2A, 2B, 2C Vacuum exposure, polished thin section or fresh fracture surface, ionization damage
Non quantitative, low ppb sensitivity. Very sensitive to surface contamination. Maps organic and inorganic species. For isotopes: ppt sensitivity, 50nm spatial resolution 1 -5 per mil isotopic resolution dependent on instrument and isotope.
Provides context of isotopes. C, N, S, D/H
LAL Assay 2F Wipe, swap, extraction. Sample exposed to water/solvent, wipe/swab detritus.
Gram-negative microbes only. Insensitive to gram-positive microbes.
ATP luminometry 2F Wipe, swap, extraction. Sample exposed to water/solvent, wipe/swab detritus.
Proportional to microbial metabolic activity Insensitive to spores
Microbial plating assay 2F Wipe, swap, extraction. Sample exposed to water/solvent, wipe/swab detritus.
~0.01% maximum sensitivity to abundance of microbial flora
Category 3: Destructive of Whole Sample Analytical Method Objectives
Addressed Sample Requirements and Degradation Performance Characteristics and Detection Limits Method Notes (Dependencies, Limitations, Assumptions,etc.) References
Total inorganic carbon and total organic carbon
1B, weight % abundance of organic carbon
Both non acid and acid digestion used to separate inorganic from organic
~1-10 ppb in 1 ml of gas or about 1E-11 to 1E-12 g of CO2. Splitting to NPD detectors, nitrogen may be accessible.
Total inorganic carbon and total organic carbon
1B, weight % abundance of organic carbon
Both non acid and acid digestion used to separate inorganic from organic
~1-10 ppb in 1 ml of gas or about 1E-11 to 1E-12 g of CO2 (??) Probably similar detection limit to above (methanizer w/ flame ionization), depending upon MS capability. Back calculating the sensitivity dependent upon the background, detector noise, … kind of tough to say in general. Evolved compounds other than CO2 can be detected.Nitrogen can be done at the same time. Need nitrogen perhaps even D/H.
Microfluidic Capillary Electrophoresis
2A, 2D, 2F 1 to 10 ppb following extraction, derivatization Process blanks?
GC/MS FAME using cyanopropyl stationary phase
2A, 2E, 2F Detection down to below ~ 1 ng per compound Detection limits are potentially lower if GC does not have significant non-specific absorption, or other issues. Lower detectionlimits possible by radio GC or LC using radiolabeled derivatizing agent.
GC/MS using high temperature GC column, and ammonia chemical ionization
Probably similar detection limit to above (methanizer w/ flame ionization), depending upon MS capability. Back calculating the sensitivity dependent upon the background, detector noise, … kind of tough to say in general. Evolved compounds other than CO2
Tunable Laser Spectroscopy 2B Destructive via pyrolysis. Typical amount of sample required per analysis: x mg
Pyrolysis-MS, Pyrolysis-GC-MS Destructive via pyrolysis. Typical amount of sample required per analysis: x mg
Does not indicate compounds present, only their fragments.
Liquid extraction and derivatization followed by GC-MS
2A, 2D, 2E, 2F Extraction, destructive Detection limits are compound-specific, but as low as ~1 pmol; more like 100pmol for many hydrocarbons. Nominal mass accuracy in typical system.
Can use library mass spectra to suggest compound class. QqQ-MS can target specific compounds, ultrahigh resolution MS can deduce molecular formulae. Can target chirality (e.g. amino acids, amines, etc). Requires authentic standard for definitive identification.
LC-MS 2A, 2D, 2E, 2F Sample crushing followed by destructive solvent extraction, possibly hydrolysis, desalting, and more
Detection limits are compound-specific, but typically ~1 fmol 5 ppm to sub ppm mass accuracy possible
QqQ-MS can target specific compounds, ultrahigh resolution MS (e.g. ToF-MS, FT-MS) can deduce molecular formulae. Different ionization modes (ESI, APcI, APPI) can target different functionalities. Targets M+1 parent ion. Can target chirality(e.g. amino acids). nano-LC can improve sensitivity 10-100 fold. Can couple mass and optical (fluorsecence, absorbance) detections. Requires authentic standard for definitive identification. Cannot use library spectra.
high resolution MS (infusion or DART)
Sample crushing followed by destructive solvent extraction, possibly hydrolysis. Minimal other workup reqired
Semi-quantitaitve, wide range of sensitivies including sub-fmol, sub ppm mass accuracy possible
Ultrahigh resolution MS (e.g. ToF-MS, FT-MS) can deduce molecular formulae. Different ionization modes (ESI, APcI, APPI) can target different functionalities. Targets M+1 parent ion. DART required minimal preparation and has ~1 mm spot size. No chromatography, so no distinction of isomers or enantiomers.
liquid ICPMS destructive; sample oxidized to sulfate 5 nmol dissolved sulfate at 0.15‰ precision; targets any sulfur in solution as sulfate; can be used for organic compound-class analysis Paris G., Sessions A. L., Subhas A. V. and Adkins J. F. (2013) MC-ICP-MS measurement of δ34S and ∆33S in small amounts of dissolved sulfate. Chemical Geology 345, 1–12.
combustion EA-IRMS destructive 25 nmol N, 41 nmol C, both at ±1.0‰precision; relatively low sensitivity but high precision (0.1 permil) Polissar P. J., Fulton J. M., Junium C. K., Turich C. C. and Freeman K. H. (2009) Measurement of 13C and 15N Isotopic Composition on Nanomolar Quantities of C and N. Analytical Chemistry 81, 755–763.
pyrolysis EA-IRMS destructive 1 ug organic H or O precision of 2-4 permil for H; O??Tunable Laser Spectroscopy 2B Destructive via pyrolysis. Typical amount of
sample required per analysis: x mgGC-combustion-IRMS 2B Extraction, destructive 130 pmol CH4 at 0.1‰precision; Requires excellent separation of compounds and prior identification of structure. Merritt D., Hayes J. M. and Marais Des D. J. (1995) Carbon isotopic analysis of
atmospheric methane by isotope-ratio-monitoring gas chromatography-mass spectrometry. Journal of Geophysical Research 100, 1317–1326.
GC-pyrolysis-IRMS 2B Extraction, destructive 25 nmol H as heptadecanoic acid at 2.7‰ precision compound must be GC-amenable ; Hilkert A., Douthitt C., Schluter H. and Brand W. A. (1999) Isotope ratio monitoring GCMS of D/H by high temperature conversion isotope ratio mass spectrometry. Rapid Commun. Mass Spectrom. 13, 1226–1230.
GC-ICPMS 2B Extraction, destructive 20 pmol S as dimethylsulfide, at 0.3‰ precision; compound must be GC-amenable Amrani A., Sessions A. L. and Adkins J. F. (2009) Compound-Specific δ34S Analysis of Volatile Organics by Coupled GC/Multicollector-ICPMS. Analytical Chemistry 81, 9027–9034.
PCR 2FFISH -- Fluorescence imaging of fluorescently tagged compounds
2F only useful in very specific conditions for terrestrial contaminants
ELISA 2F only useful in very specific conditions for terrestrial contaminants
Category 3: Destructive of Whole Sample Analytical
MethodObjectives Addressed
Sample Requirements
and Degradation
Performance Characteristics and
Detection Limits
Method Notes (Dependencies, Limitations, Assumptions,etc.)
References
GC-ICPMS 2B Extraction, destructive
20 pmol S as dimethylsulfide, at 0.3‰ precision;
compound must be GC-amenable Amrani A., Sessions A. L. and Adkins J. F. (2009) Compound-Specific δ34S Analysis of Volatile Organics by Coupled GC/Multicollector-ICPMS. Analytical Chemistry 81, 9027–9034.
Finding: A huge diversity of techniques for organic analysis already exists. More will be invented. We can not predict which techniques will be used. Not all potential measurements will be possible on returned Mars samples given limited sample mass, nor will all be needed.
Finding: Because of the sensitivity of modern analytical instruments, we must accept that we will not be able to reduce all organic contaminants to non-detectable levels by all analytical techniques.
E X A M P L E

Elements of a Viable Contamination Management Strategy
• Contamination Reduction (#1 Below), Contamination Characterization (#2), and Avoidance of Recontamination (#3-4), are essential elements in the overall effort to achieve minimum acceptable sample quality.
11
Derived Lessons
STRATEGY #1Reduce contamination at start
0
Con
cent
ratio
n of
co
ntam
inan
t
STRATEGY #2Characterize residual contamination
STRATEGY #3Minimize recontamination
STRATEGY #4Monitor the changes over time
Time
Finding #4: Our ability to interpret data from partially contaminated samples correctly depends on: 1). Minimizing contamination at the start, 2). Characterizing residual contamination, and 3). Minimizing recontamination.
State of contamination at the time of sampling
STRATEGY #5Determine contamination at time of sampling

Organic Molecules of Interest
10/15/2014 Mars 2020 Organic Contamination Study PanelPreliminary results for planning/discussion and review purposes only 12
The history of the Mars surface environment is sufficiently obscure that essentially all organic molecules are of potential
interest to us. Even those molecules of undoubtedterrestrial origin have the potential to interfere with detection
of other analytes.
Finding: We need to be concerned at some level with essentially all organic molecules as potential contaminants.
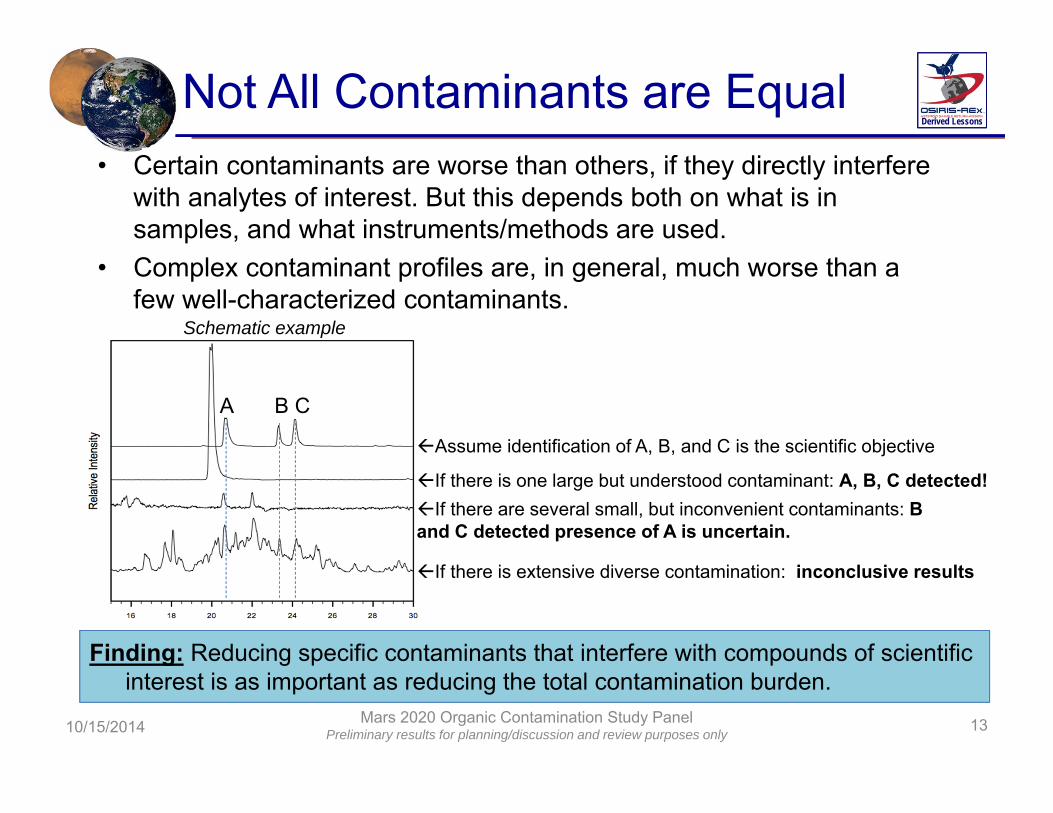
Not All Contaminants are Equal
10/15/2014 Mars 2020 Organic Contamination Study PanelPreliminary results for planning/discussion and review purposes only 13
• Certain contaminants are worse than others, if they directly interfere with analytes of interest. But this depends both on what is in samples, and what instruments/methods are used.
• Complex contaminant profiles are, in general, much worse than a few well-characterized contaminants.
A B C
Assume identification of A, B, and C is the scientific objective
If there is one large but understood contaminant: A, B, C detected!If there are several small, but inconvenient contaminants: B and C detected presence of A is uncertain.
If there is extensive diverse contamination: inconclusive results
Finding: Reducing specific contaminants that interfere with compounds of scientific interest is as important as reducing the total contamination burden.
Derived Lessons
Schematic example
Which Contaminants Matter?• Modern organic geochemistry:
– Has evolved to a focus on the significance of specific molecules• Certain molecules have a clear potential to be more problematic as
contaminants than others:– Molecules known to exist on Mars and/or in meteorites– Molecules that make up life as we know it
• We adopt a two-tiered strategy for ranking contaminants:– Tier I. Contaminants of highest concern, that would directly interfere with
our ability to assess the presence of extant or extinct life on Mars. Highest level of contaminant control and characterization.
– Tier II. All other organic molecules. Lower level of contaminant control.• Total Organic Carbon:
– Is less valuable as a measurement for scientific interpretation, but is useful as a summary for implementation purposes (blanket insurance policy)
10/15/2014 Mars 2020 Organic Contamination Study PanelPreliminary results for planning/discussion and review purposes only 14
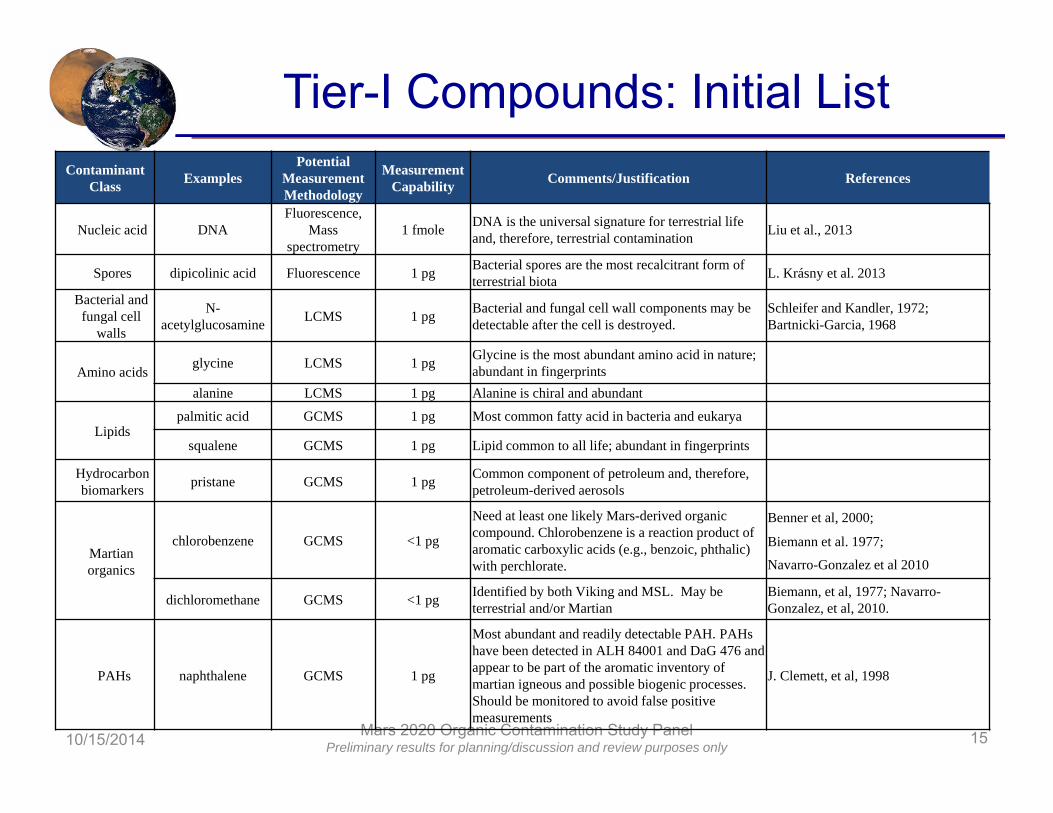
Tier-I Compounds: Initial List
10/15/2014 Mars 2020 Organic Contamination Study Panel Preliminary results for planning/discussion and review purposes only 15
Contaminant Class Examples
Potential Measurement Methodology
Measurement Capability Comments/Justification References
Nucleic acid DNAFluorescence,
Mass spectrometry
1 fmole DNA is the universal signature for terrestrial life and, therefore, terrestrial contamination Liu et al., 2013
Spores dipicolinic acid Fluorescence 1 pg Bacterial spores are the most recalcitrant form of terrestrial biota L. Krásny et al. 2013
Bacterial and fungal cell
walls
N-acetylglucosamine LCMS 1 pg Bacterial and fungal cell wall components may be
detectable after the cell is destroyed. Schleifer and Kandler, 1972;Bartnicki-Garcia, 1968
Amino acids glycine LCMS 1 pg Glycine is the most abundant amino acid in nature; abundant in fingerprints
alanine LCMS 1 pg Alanine is chiral and abundant
Lipidspalmitic acid GCMS 1 pg Most common fatty acid in bacteria and eukarya
squalene GCMS 1 pg Lipid common to all life; abundant in fingerprints
Hydrocarbon biomarkers pristane GCMS 1 pg Common component of petroleum and, therefore,
petroleum-derived aerosols
Martian organics
chlorobenzene GCMS <1 pg
Need at least one likely Mars-derived organic compound. Chlorobenzene is a reaction product of aromatic carboxylic acids (e.g., benzoic, phthalic) with perchlorate.
Benner et al, 2000;
Biemann et al. 1977;
Navarro-Gonzalez et al 2010
dichloromethane GCMS <1 pg Identified by both Viking and MSL. May be terrestrial and/or Martian
Biemann, et al, 1977; Navarro-Gonzalez, et al, 2010.
PAHs naphthalene GCMS 1 pg
Most abundant and readily detectable PAH. PAHs have been detected in ALH 84001 and DaG 476 and appear to be part of the aromatic inventory of martian igneous and possible biogenic processes. Should be monitored to avoid false positive measurements
J. Clemett, et al, 1998
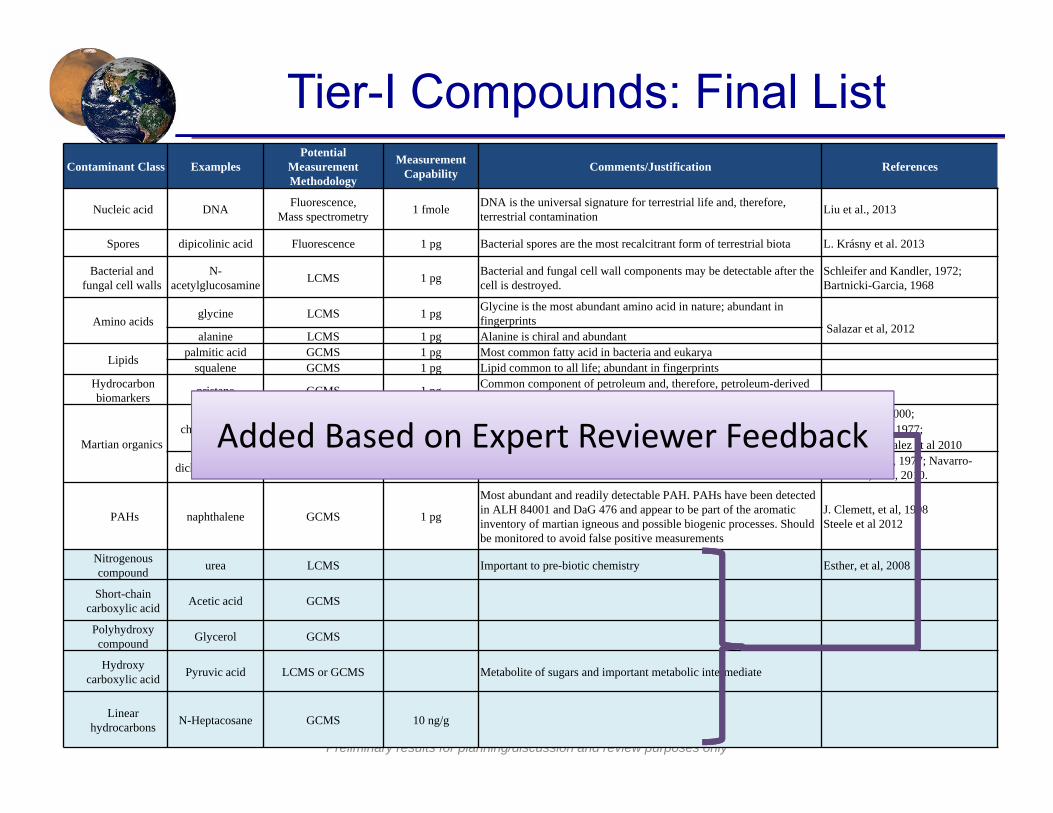
Tier-I Compounds: Final List
10/15/2014 Mars 2020 Organic Contamination Study Panel Preliminary results for planning/discussion and review purposes only 16
Contaminant Class ExamplesPotential
Measurement Methodology
Measurement Capability Comments/Justification References
Nucleic acid DNA Fluorescence,Mass spectrometry 1 fmole DNA is the universal signature for terrestrial life and, therefore,
terrestrial contamination Liu et al., 2013
Spores dipicolinic acid Fluorescence 1 pg Bacterial spores are the most recalcitrant form of terrestrial biota L. Krásny et al. 2013
Bacterial and fungal cell walls
N-acetylglucosamine LCMS 1 pg Bacterial and fungal cell wall components may be detectable after the
cell is destroyed. Schleifer and Kandler, 1972;Bartnicki-Garcia, 1968
Amino acidsglycine LCMS 1 pg Glycine is the most abundant amino acid in nature; abundant in
fingerprintsSalazar et al, 2012alanine LCMS 1 pg Alanine is chiral and abundant
Lipids palmitic acid GCMS 1 pg Most common fatty acid in bacteria and eukaryasqualene GCMS 1 pg Lipid common to all life; abundant in fingerprints
Hydrocarbon biomarkers pristane GCMS 1 pg Common component of petroleum and, therefore, petroleum-derived
aerosols
Martian organicschlorobenzene GCMS <1 pg
Need at least one likely Mars-derived organic compound. Chlorobenzene is a reaction product of aromatic carboxylic acids (e.g., benzoic, phthalic) with perchlorate.
Benner et al, 2000;Biemann et al. 1977;Navarro-Gonzalez et al 2010
dichloromethane GCMS <1 pg Identified by both Viking and MSL. May be terrestrial and/or Martian Biemann, et al, 1977; Navarro-Gonzalez, et al, 2010.
PAHs naphthalene GCMS 1 pg
Most abundant and readily detectable PAH. PAHs have been detected in ALH 84001 and DaG 476 and appear to be part of the aromatic inventory of martian igneous and possible biogenic processes. Should be monitored to avoid false positive measurements
J. Clemett, et al, 1998Steele et al 2012
Nitrogenouscompound urea LCMS Important to pre-biotic chemistry Esther, et al, 2008
Short-chain carboxylic acid Acetic acid GCMS
Polyhydroxycompound Glycerol GCMS
Hydroxycarboxylic acid Pyruvic acid LCMS or GCMS Metabolite of sugars and important metabolic intermediate
Linear hydrocarbons N-Heptacosane GCMS 10 ng/g
Added Based on Expert Reviewer Feedback
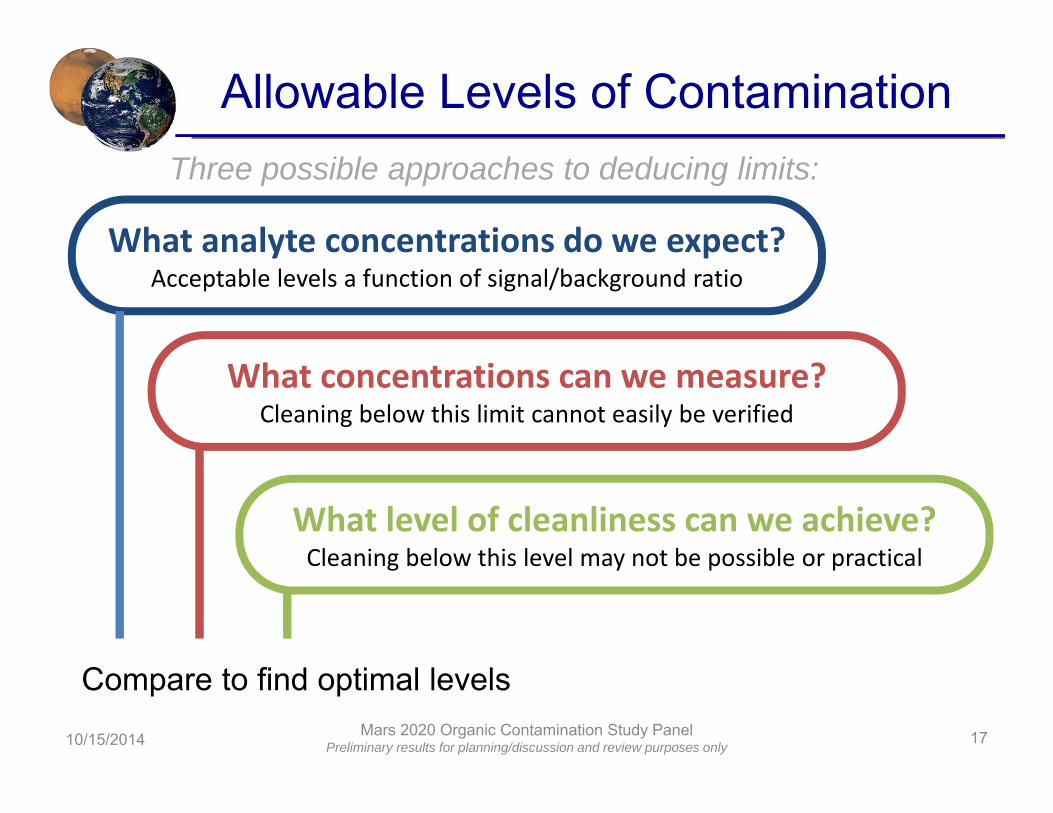
Allowable Levels of Contamination
10/15/2014 Mars 2020 Organic Contamination Study Panel Preliminary results for planning/discussion and review purposes only 17
What analyte concentrations do we expect?Acceptable levels a function of signal/background ratio
What concentrations can we measure?Cleaning below this limit cannot easily be verified
What level of cleanliness can we achieve?Cleaning below this level may not be possible or practical
Three possible approaches to deducing limits:
Compare to find optimal levels
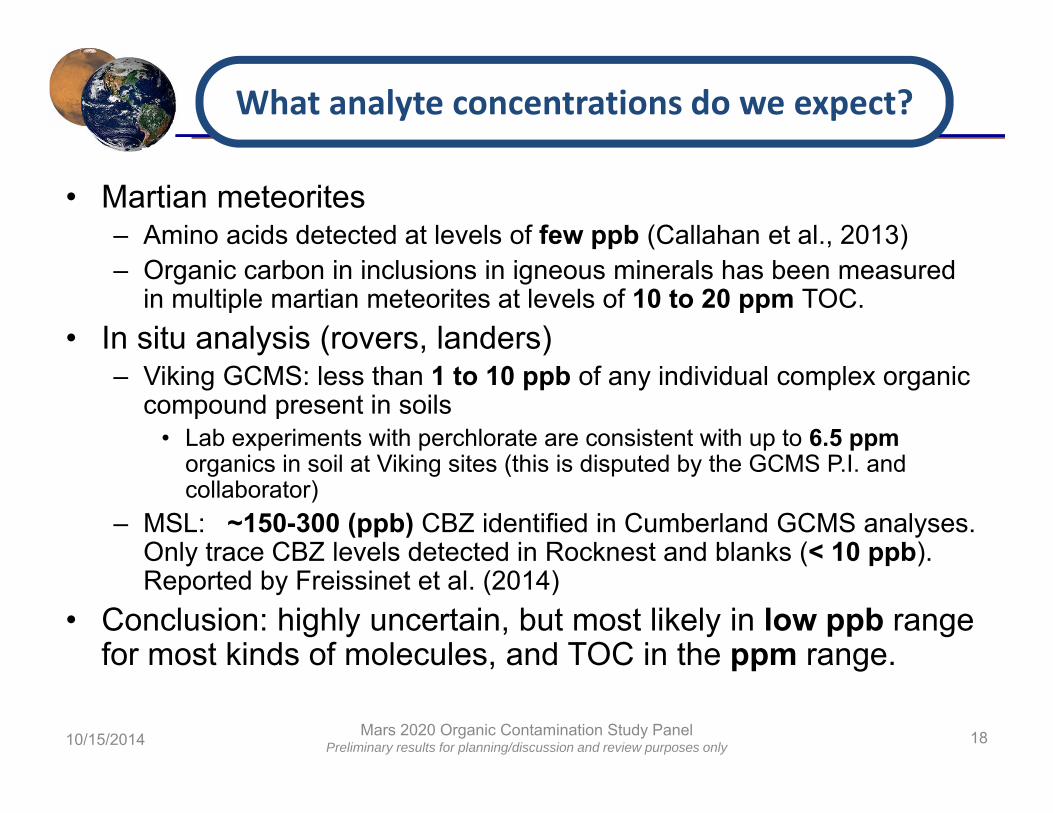
What levels do we expect?
• Martian meteorites– Amino acids detected at levels of few ppb (Callahan et al., 2013)– Organic carbon in inclusions in igneous minerals has been measured
in multiple martian meteorites at levels of 10 to 20 ppm TOC.• In situ analysis (rovers, landers)
– Viking GCMS: less than 1 to 10 ppb of any individual complex organic compound present in soils
• Lab experiments with perchlorate are consistent with up to 6.5 ppm organics in soil at Viking sites (this is disputed by the GCMS P.I. and collaborator)
– MSL: ~150-300 (ppb) CBZ identified in Cumberland GCMS analyses. Only trace CBZ levels detected in Rocknest and blanks (< 10 ppb). Reported by Freissinet et al. (2014)
• Conclusion: highly uncertain, but most likely in low ppb range for most kinds of molecules, and TOC in the ppm range.
10/15/2014 Mars 2020 Organic Contamination Study PanelPreliminary results for planning/discussion and review purposes only 18
What analyte concentrations do we expect?
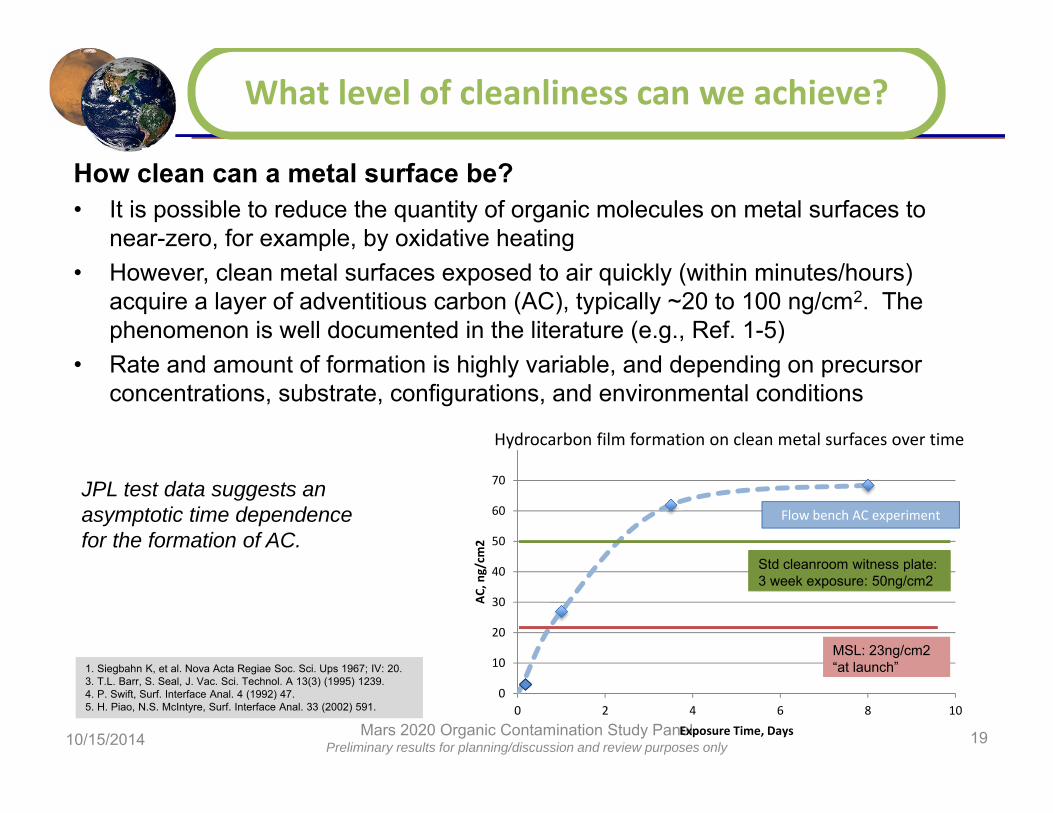
How clean can a metal surface be?• It is possible to reduce the quantity of organic molecules on metal surfaces to
near-zero, for example, by oxidative heating• However, clean metal surfaces exposed to air quickly (within minutes/hours)
acquire a layer of adventitious carbon (AC), typically ~20 to 100 ng/cm2. The phenomenon is well documented in the literature (e.g., Ref. 1-5)
• Rate and amount of formation is highly variable, and depending on precursor concentrations, substrate, configurations, and environmental conditions
10/15/2014 Mars 2020 Organic Contamination Study Panel Preliminary results for planning/discussion and review purposes only 19
1. Siegbahn K, et al. Nova Acta Regiae Soc. Sci. Ups 1967; IV: 20. 3. T.L. Barr, S. Seal, J. Vac. Sci. Technol. A 13(3) (1995) 1239. 4. P. Swift, Surf. Interface Anal. 4 (1992) 47. 5. H. Piao, N.S. McIntyre, Surf. Interface Anal. 33 (2002) 591.
0
10
20
30
40
50
60
70
0 2 4 6 8 10
AC, n
g/cm
2
Exposure Time, Days
MSL: 23ng/cm2“at launch”
Hydrocarbon film formation on clean metal surfaces over time
Std cleanroom witness plate: 3 week exposure: 50ng/cm2
Flow bench AC experiment
JPL test data suggests an asymptotic time dependence for the formation of AC.
What level of cleanliness can we achieve?

10/15/2014 Mars 2020 Organic Contamination Study PanelPreliminary results for planning/discussion and review purposes only 20
0.0
20.0
40.0
60.0
80.0
100.0
120.0
140.0
160.0
180.0
200.0
0 5 10 15 20 25 30 35 40 45
In‐Sam
ple Co
ntam
ination, ppb
Hardware Cleanliness, ng/cm2
• Assume sample mass = 16 g• Contaminant contact transfer
efficiency (%) is dependent on sample-hardware configuration.– A range of 10% to 100% is presented
to illustrate the proportional dependence of in-sample contamination to this parameter.
ppb h / w cleanliness level(ng / cm2) surface area of the sample that contacts h/w(cm2 ) transfer efficiencyMass of sample core(g)
100%
60%
10% Exa
mpl
e C
onfig
urat
ion:
30 c
m2
sam
ple
cont
act s
urfa
ces
Example Configuration:300 cm2 sample contact surfaces
40 ppb reference
Finding: In the case of a system with sample contact surfaces of 30 cm2, and contaminated with with 20 ng/cm2 organic carbon, collected samples would have a theoretical maximum of 40 ppb organic contaminants, and an expected concentration of an unknown amount less than 40 ppb, depending on transfer efficiency.
Translating Cleanliness Levels From Metal Surface Values to Rock/Soil Values
100% 60% Transfer efficiency
Bounding case
Expected value
Generic contaminant transfer models
?
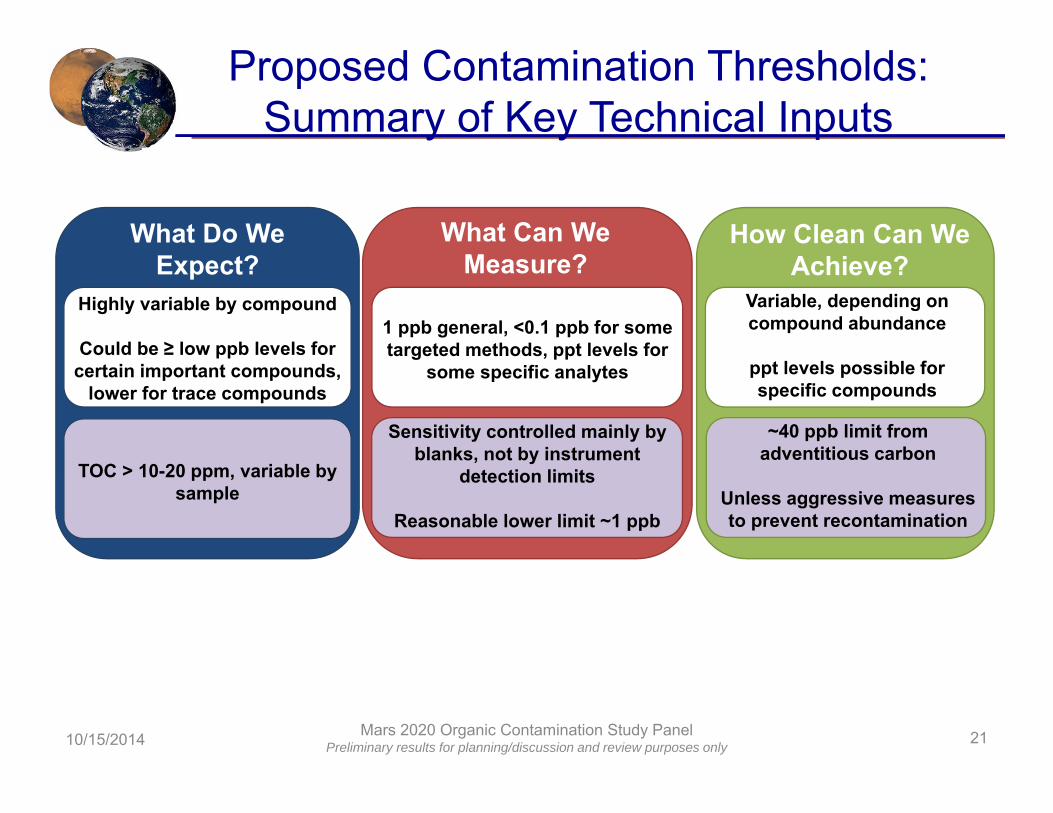
Proposed Contamination Thresholds: Summary of Key Technical Inputs
What Do We Expect?
What Can We Measure?
How Clean Can We Achieve?
10/15/2014 Mars 2020 Organic Contamination Study PanelPreliminary results for planning/discussion and review purposes only 21
Highly variable by compound
Could be ≥ low ppb levels for certain important compounds,
lower for trace compounds
1 ppb general, <0.1 ppb for some targeted methods, ppt levels for
some specific analytes
Variable, depending on compound abundance
ppt levels possible for specific compounds
TOC > 10-20 ppm, variable by sample
Sensitivity controlled mainly by blanks, not by instrument
detection limits
Reasonable lower limit ~1 ppb
~40 ppb limit from adventitious carbon
Unless aggressive measures to prevent recontamination
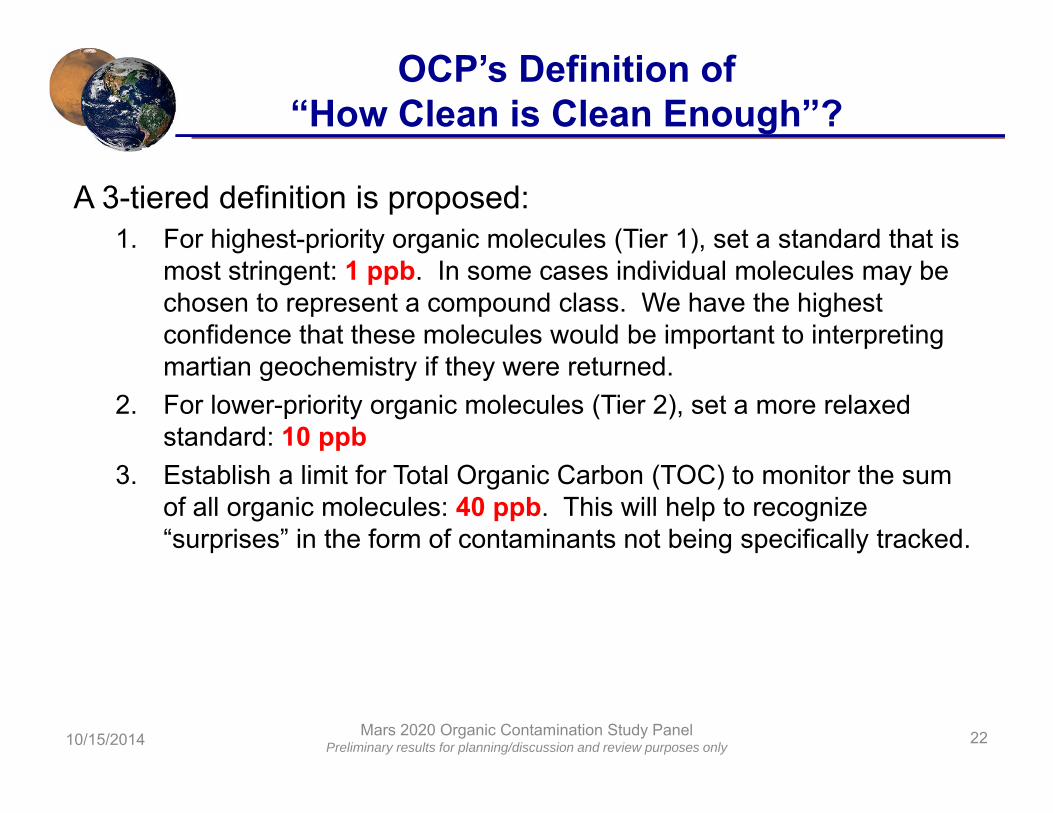
OCP’s Definition of“How Clean is Clean Enough”?
A 3-tiered definition is proposed:1. For highest-priority organic molecules (Tier 1), set a standard that is
most stringent: 1 ppb. In some cases individual molecules may be chosen to represent a compound class. We have the highest confidence that these molecules would be important to interpreting martian geochemistry if they were returned.
2. For lower-priority organic molecules (Tier 2), set a more relaxed standard: 10 ppb
3. Establish a limit for Total Organic Carbon (TOC) to monitor the sum of all organic molecules: 40 ppb. This will help to recognize “surprises” in the form of contaminants not being specifically tracked.
10/15/2014 Mars 2020 Organic Contamination Study Panel Preliminary results for planning/discussion and review purposes only 22
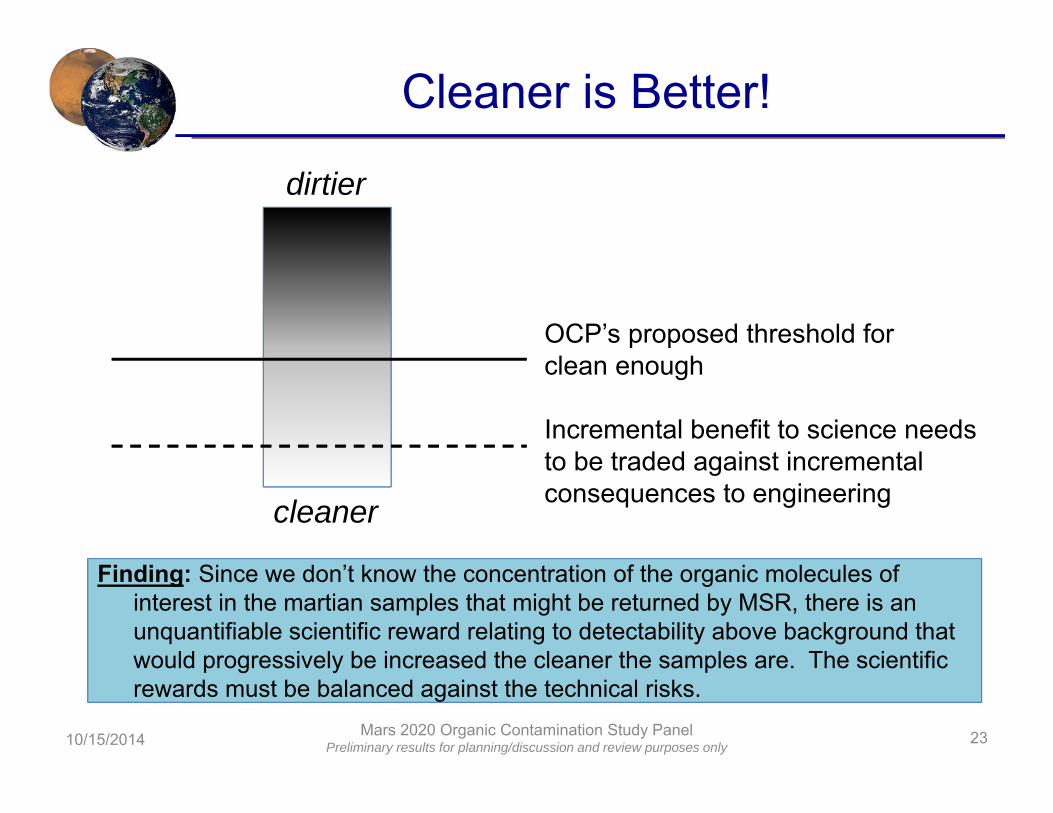
Cleaner is Better!
10/15/2014 Mars 2020 Organic Contamination Study Panel Preliminary results for planning/discussion and review purposes only 23
Finding: Since we don’t know the concentration of the organic molecules of interest in the martian samples that might be returned by MSR, there is an unquantifiable scientific reward relating to detectability above background that would progressively be increased the cleaner the samples are. The scientific rewards must be balanced against the technical risks.
dirtier
cleaner
OCP’s proposed threshold for clean enough
Incremental benefit to science needs to be traded against incremental consequences to engineering

The Importance of Witness Plate Planning
2410/15/2014 Mars 2020 Organic Contamination Study PanelPreliminary results for planning/discussion and review purposes only
Manufacture, Assembly, ATLO
Manufacture, Assembly, ATLO
Launch, Cruise, Landing
Launch, Cruise, Landing
Surface OperationsSurface
OperationsExtended
Mars StorageExtended
Mars StorageReturn to Earth
Return to Earth
Capture, Store SRVCapture, Store SRV
Science ProcessingScience
Processing
Cache, Drill, Subsystem & ATLO
Cache, Drill, Subsystem & ATLO
Through Mars OperationsThrough Mars Operations
Post‐MarsPost‐Mars
Entire MissionEntire Mission
Science OperationsScience Operations
Launch to Surface OpsLaunch to Surface Ops
Cache Interior ExposureCache Interior Exposure
2020 Mars Rover Mission Phases
Witness Plate Exposure Periods
EXAMPLEFinding: In order to track the introduction of contaminants, the witness plate
strategy would need active control over witness plate exposure during discrete mission phases. An example is shown here. The exposure timing is left to the M2020 science team.
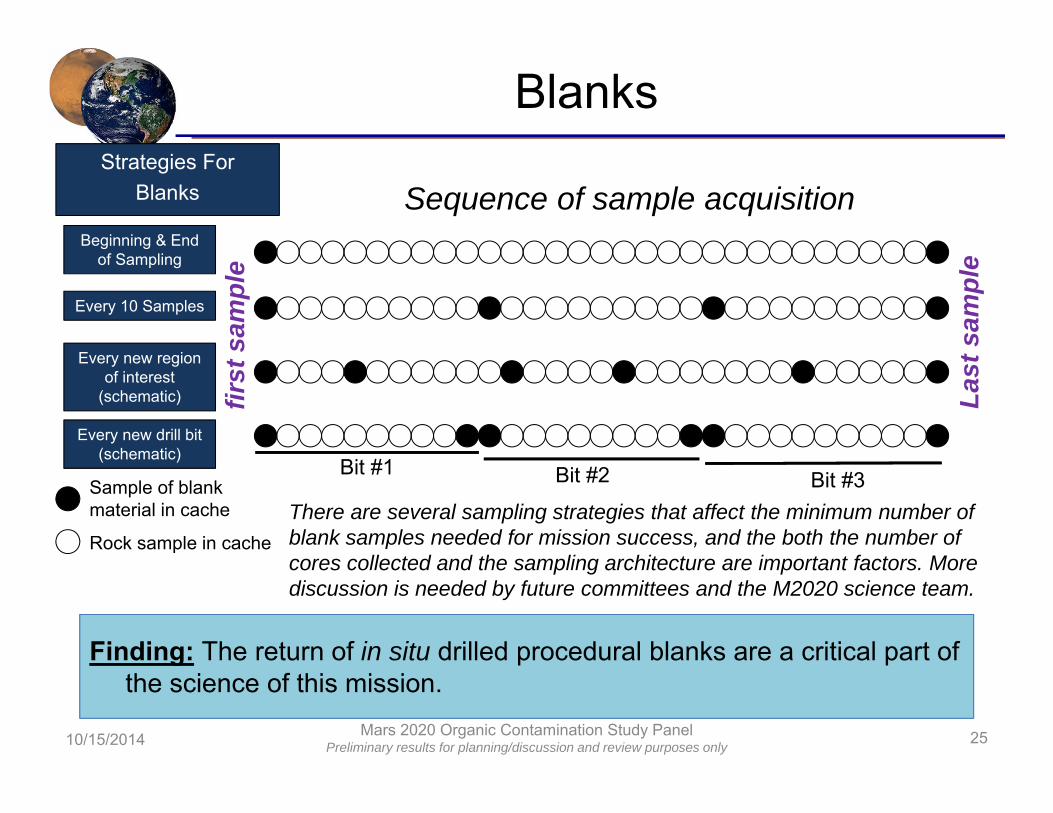
Blanks
10/15/2014 Mars 2020 Organic Contamination Study Panel Preliminary results for planning/discussion and review purposes only 25
Bit #1 Bit #2 Bit #3
Beginning & End of Sampling
Every 10 Samples
Every new region of interest
(schematic)
Every new drill bit(schematic)
Strategies For Blanks
Finding: The return of in situ drilled procedural blanks are a critical part of the science of this mission.
Rock sample in cache
Sample of blankmaterial in cache
first
sam
ple
Last
sam
ple
Sequence of sample acquisition
There are several sampling strategies that affect the minimum number of blank samples needed for mission success, and the both the number of cores collected and the sampling architecture are important factors. More discussion is needed by future committees and the M2020 science team.
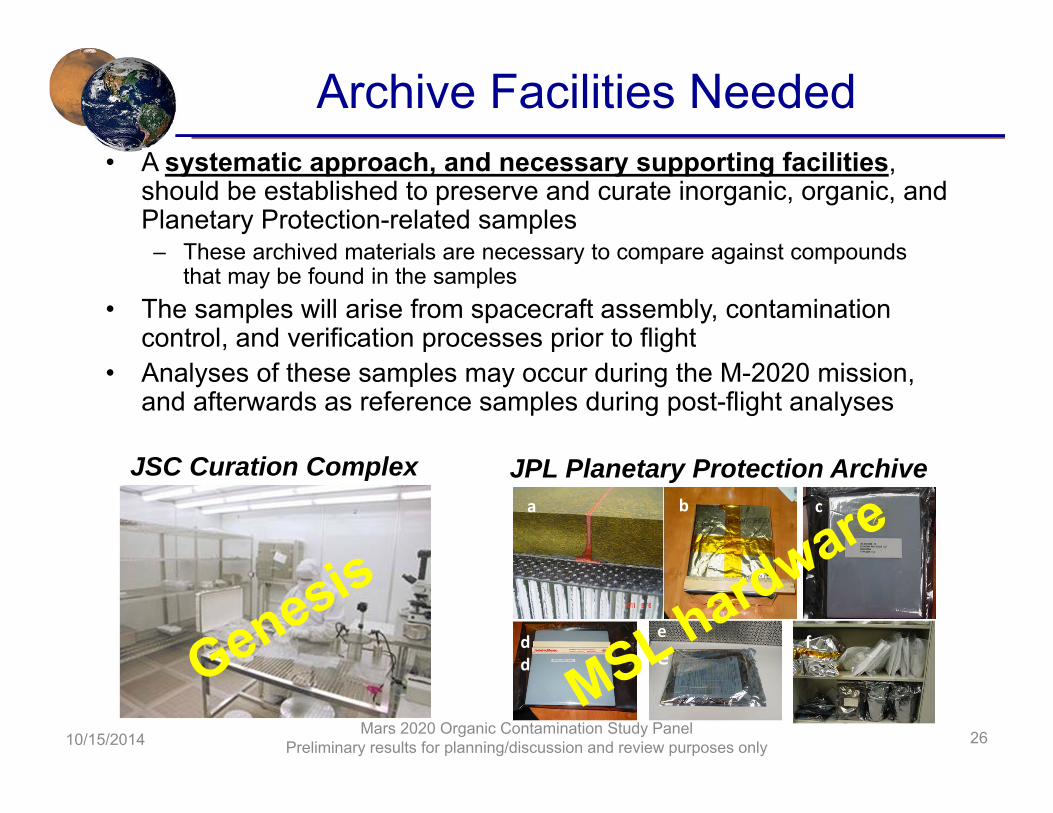
Archive Facilities Needed• A systematic approach, and necessary supporting facilities,
should be established to preserve and curate inorganic, organic, and Planetary Protection-related samples– These archived materials are necessary to compare against compounds
that may be found in the samples• The samples will arise from spacecraft assembly, contamination
control, and verification processes prior to flight• Analyses of these samples may occur during the M-2020 mission,
and afterwards as reference samples during post-flight analyses
10/15/2014Mars 2020 Organic Contamination Study Panel
Preliminary results for planning/discussion and review purposes only 26
JPL Planetary Protection ArchiveJSC Curation Complexa b c
dd
ee
f

Conclusions
10/15/2014 Mars 2020 Organic Contamination Study Panel Preliminary results for planning/discussion and review purposes only 27
1. We expect that returned Mars samples would have detectable amounts of Earth-sourced contaminants. These must be characterized. This characterization is the first step of the science to be performed on returned samples, and should be done to the same quality.
2. Organic analysis of samples contaminated to varying degrees is a standard practice. It is possible to measure molecules of interest in the presence of contamination. These strategies may be applied to returned martian samples.
3. OCP has proposed an estimate of the minimum acceptable amount/character of organic contamination on returned martian samples. However, cleaner would be better!
4. M-2020 should carry out systematic planning in the areas of witness plates, archive facilities, and blanks/standards.

BACKUP
10/15/2014 Mars 2020 Organic Contamination Study Panel Preliminary results for planning/discussion and review purposes only 28

Instruments and TechniquesWe can’t know which instruments will eventually be used, and it is technically impossible to protect the samples for all of them.
10/15/2014 Mars 2020 Organic Contamination Study Panel Preliminary results for planning/discussion and review purposes only 29
Finding: Because of the sensitivity of modern analytical instruments, we must accept that we will not be able to reduce all organic contaminants to non-detectable levels by all analytical techniques.
DEFINITE ANALYTICAL METHODS TO BE USED in LIGHT YELLOWCONTINGENT ANALYTICAL METHODS TO BE USED in LIGHT BLUECategory 1: Non-Destructive, Sample Surface-Based Technique
Analytical Method Objectives Addressed
Sample Requirements and Degradation1 Performance Characteristics and Detection Limits1 Method Notes (Dependencies, Limitations, Assumptions,etc.) References2
Deep UV Raman/Fluorescence Spectroscopy
1A, 2C Non-destructive. No surface preperation required.
Raman:Aromatics <10-4 w/w (<100 ppm)Aliphatics <10-4 w/w (<100 ppm)50 um/spot at 1 to 10s per spotFluorescence:Aromatics <10-6 w/w (<ppm)Single cell sensitivity (~2 pg carbon) [6]50 um/spot at 1s per spot
Performance can be enhanced with longer integration times.
Sensitivities depend on organic species and are matrix dependent.
Surface roughness can be handled based on optical system with hit against sensitivites or integration times.
Quantification is difficult
[1] Beegle, et. al., Lunar and Planetary Institute Science Conference Abstracts 45: 2835.[2] Ghosh, et. al, Applied Spectroscopy 66 (9): 1013–21. [3] Tuschel, David D, Aleksandr V Mikhonin, Brian E Lemoff, and Sanford A Asher. 2010. “Deep Ultraviolet Resonance Raman Excitation Enables Explosives Detection.” Applied Spectroscopy 64 (4), 425–32.[4] Bhartia, et.al., International Society for Optics and Photonics: 83581A–83581A–9.[5] Johnson, et.al, Astrobiology 11 (2): 151–56. [6] Bhartia et, al...,Applied and Environmental Microbiology, 2010, 76(21), p 7231-7237)
Confocal Raman Spectroscopy at up to 360nm micron spatial resolution
1A, 2C Non-destructive. Benefits from thin section, polished surface prep. Or can be fresh fracture surface with contour following confocal optics.
Lower limit from ~0.1 to 1 wt. % per spot analysis (30s) [1] with absolute detection limit correlated to number of analyzed spots.<50 ppm graphic carbon [1]Single cell detection sensitivity. [2]
Detection limits strongly dependent on laser wavelength, target species. 532 nm excitation provides non-quantitative detection of hematite, beta-carotene. Raman spectra are subject to organic and mineral background fluorescence, which can be mitigated by time-gating.Careful consideration for laser wavelength and power to avoid sample damage.Quantification is difficult
[1] Wang, et. al.Journal of Geophysical Research, 108(E1), 5005[2] Ref TBD
FT-IR Spectroscopy 1A, 2C Non-destructive. Benefits from thin section and polished surface prep, but can be used on unprepared surfaces. Ideally KBR pellets are made of samples.
Lower limit ~5 ppm for specific targets10 um/spot >200 min per spot [1]
Not sensitive to graphitic carbon.Samples are ideally crushed and made into KBR windows [2]Quantification is difficult
[1] Ref TBD [2] General approach for FTIR in literature. [2a] Bhaskar, Nature and Science, 2009;7(5), 45-51 (Dergoan H5 Chondrite) [2b] Matrajt, et. al., Astronomy & Astrophysics, 416(3), 2003, 983-990 (Tagish Lake Meteroirte) [3] Anderson, et. al., Review of Scientific Instruments, 76, 034101 (2005)
IR Reflectance Spectroscopy 1A, 2C Non-destructive. Lower limit typically ~0.5-1 wt. % per spot analysis, with absolute detection limit correlated to number of analyzed spots.
Sensitive to only specific organic species. Ideal for rapid mineral context.Quantification is difficult
[1] Not used actively for organics detection
Category 2: Slightly Destructive to Sample SurfaceAnalytical Method Objectives
Addressed Sample Requirements and Degradation Performance Characteristics and Detection Limits Method Notes (Dependencies, Limitations, Assumptions,etc.) References
Laser desorption-MS 1A, 2A, 2C Vacuum exposure, polished thin section or fresh fracture surface, laser beam damage
Semi-quantitative, wide range of sensitivies including sub-fmol. Specific to PAH or other large conjugated systems. No chromatography, so no distinction of isomers or enantiomers.
Time-of-Flight Secondary Ion Mass Spectroscopy (ToF-SIMS)
1A, 2A, 2B, 2C Vacuum exposure, polished thin section or fresh fracture surface, ionization damage
Non quantitative, low ppb sensitivity. Very sensitive to surface contamination. Maps organic and inorganic species. For isotopes: ppt sensitivity, 50nm spatial resolution 1 -5 per mil isotopic resolution dependent on instrument and isotope.
Provides context of isotopes. C, N, S, D/H
LAL Assay 2F Wipe, swap, extraction. Sample exposed to water/solvent, wipe/swab detritus.
Gram-negative microbes only. Insensitive to gram-positive microbes.
ATP luminometry 2F Wipe, swap, extraction. Sample exposed to water/solvent, wipe/swab detritus.
Proportional to microbial metabolic activity Insensitive to spores
Microbial plating assay 2F Wipe, swap, extraction. Sample exposed to water/solvent, wipe/swab detritus.
~0.01% maximum sensitivity to abundance of microbial flora
Category 3: Destructive of Whole Sample Analytical Method Objectives
Addressed Sample Requirements and Degradation Performance Characteristics and Detection Limits Method Notes (Dependencies, Limitations, Assumptions,etc.) References
Total inorganic carbon and total organic carbon
1B, weight % abundance of organic carbon
Both non acid and acid digestion used to separate inorganic from organic
~1-10 ppb in 1 ml of gas or about 1E-11 to 1E-12 g of CO2. Splitting to NPD detectors, nitrogen may be accessible.
Total inorganic carbon and total organic carbon
1B, weight % abundance of organic carbon
Both non acid and acid digestion used to separate inorganic from organic
~1-10 ppb in 1 ml of gas or about 1E-11 to 1E-12 g of CO2 (??) Probably similar detection limit to above (methanizer w/ flame ionization), depending upon MS capability. Back calculating the sensitivity dependent upon the background, detector noise, … kind of tough to say in general. Evolved compounds other than CO2 can be detected.Nitrogen can be done at the same time. Need nitrogen perhaps even D/H.
Microfluidic Capillary Electrophoresis
2A, 2D, 2F 1 to 10 ppb following extraction, derivatization Process blanks?
GC/MS FAME using cyanopropyl stationary phase
2A, 2E, 2F Detection down to below ~ 1 ng per compound Detection limits are potentially lower if GC does not have significant non-specific absorption, or other issues. Lower detectionlimits possible by radio GC or LC using radiolabeled derivatizing agent.
GC/MS using high temperature GC column, and ammonia chemical ionization
Probably similar detection limit to above (methanizer w/ flame ionization), depending upon MS capability. Back calculating the sensitivity dependent upon the background, detector noise, … kind of tough to say in general. Evolved compounds other than CO2
Tunable Laser Spectroscopy 2B Destructive via pyrolysis. Typical amount of sample required per analysis: x mg
Pyrolysis-MS, Pyrolysis-GC-MS Destructive via pyrolysis. Typical amount of sample required per analysis: x mg
Does not indicate compounds present, only their fragments.
Liquid extraction and derivatization followed by GC-MS
2A, 2D, 2E, 2F Extraction, destructive Detection limits are compound-specific, but as low as ~1 pmol; more like 100pmol for many hydrocarbons. Nominal mass accuracy in typical system.
Can use library mass spectra to suggest compound class. QqQ-MS can target specific compounds, ultrahigh resolution MS can deduce molecular formulae. Can target chirality (e.g. amino acids, amines, etc). Requires authentic standard for definitive identification.
LC-MS 2A, 2D, 2E, 2F Sample crushing followed by destructive solvent extraction, possibly hydrolysis, desalting, and more
Detection limits are compound-specific, but typically ~1 fmol 5 ppm to sub ppm mass accuracy possible
QqQ-MS can target specific compounds, ultrahigh resolution MS (e.g. ToF-MS, FT-MS) can deduce molecular formulae. Different ionization modes (ESI, APcI, APPI) can target different functionalities. Targets M+1 parent ion. Can target chirality(e.g. amino acids). nano-LC can improve sensitivity 10-100 fold. Can couple mass and optical (fluorsecence, absorbance) detections. Requires authentic standard for definitive identification. Cannot use library spectra.
high resolution MS (infusion or DART)
Sample crushing followed by destructive solvent extraction, possibly hydrolysis. Minimal other workup reqired
Semi-quantitaitve, wide range of sensitivies including sub-fmol, sub ppm mass accuracy possible
Ultrahigh resolution MS (e.g. ToF-MS, FT-MS) can deduce molecular formulae. Different ionization modes (ESI, APcI, APPI) can target different functionalities. Targets M+1 parent ion. DART required minimal preparation and has ~1 mm spot size. No chromatography, so no distinction of isomers or enantiomers.
liquid ICPMS destructive; sample oxidized to sulfate 5 nmol dissolved sulfate at 0.15‰ precision; targets any sulfur in solution as sulfate; can be used for organic compound-class analysis Paris G., Sessions A. L., Subhas A. V. and Adkins J. F. (2013) MC-ICP-MS measurement of δ34S and ∆33S in small amounts of dissolved sulfate. Chemical Geology 345, 1–12.
combustion EA-IRMS destructive 25 nmol N, 41 nmol C, both at ±1.0‰precision; relatively low sensitivity but high precision (0.1 permil) Polissar P. J., Fulton J. M., Junium C. K., Turich C. C. and Freeman K. H. (2009) Measurement of 13C and 15N Isotopic Composition on Nanomolar Quantities of C and N. Analytical Chemistry 81, 755–763.
pyrolysis EA-IRMS destructive 1 ug organic H or O precision of 2-4 permil for H; O??Tunable Laser Spectroscopy 2B Destructive via pyrolysis. Typical amount of
sample required per analysis: x mgGC-combustion-IRMS 2B Extraction, destructive 130 pmol CH4 at 0.1‰precision; Requires excellent separation of compounds and prior identification of structure. Merritt D., Hayes J. M. and Marais Des D. J. (1995) Carbon isotopic analysis of
atmospheric methane by isotope-ratio-monitoring gas chromatography-mass spectrometry. Journal of Geophysical Research 100, 1317–1326.
GC-pyrolysis-IRMS 2B Extraction, destructive 25 nmol H as heptadecanoic acid at 2.7‰ precision compound must be GC-amenable ; Hilkert A., Douthitt C., Schluter H. and Brand W. A. (1999) Isotope ratio monitoring GCMS of D/H by high temperature conversion isotope ratio mass spectrometry. Rapid Commun. Mass Spectrom. 13, 1226–1230.
GC-ICPMS 2B Extraction, destructive 20 pmol S as dimethylsulfide, at 0.3‰ precision; compound must be GC-amenable Amrani A., Sessions A. L. and Adkins J. F. (2009) Compound-Specific δ34S Analysis of Volatile Organics by Coupled GC/Multicollector-ICPMS. Analytical Chemistry 81, 9027–9034.
PCR 2FFISH -- Fluorescence imaging of fluorescently tagged compounds
2F only useful in very specific conditions for terrestrial contaminants
ELISA 2F only useful in very specific conditions for terrestrial contaminants

Contamination Transport
There are at least three pathways by which contaminants can be transported into samples: 1. Direct contact – microbial and molecular contaminants are transferred from the hardware surfaces to samples by direct
contact. 2. Particle transport – Microbes and molecular contaminant-containing particles are dislodged from spacecraft hardware
surfaces by wind or by mechanical forces and are then carried by wind to the sampling ground or into the sample tube.3. VOC transport – outgassed volatile organic compounds from nonmetallic parts will diffuse or be carried by wind to
condense on the sampling ground, sample contacting hardware, and samples.
12 3
Sam
ple
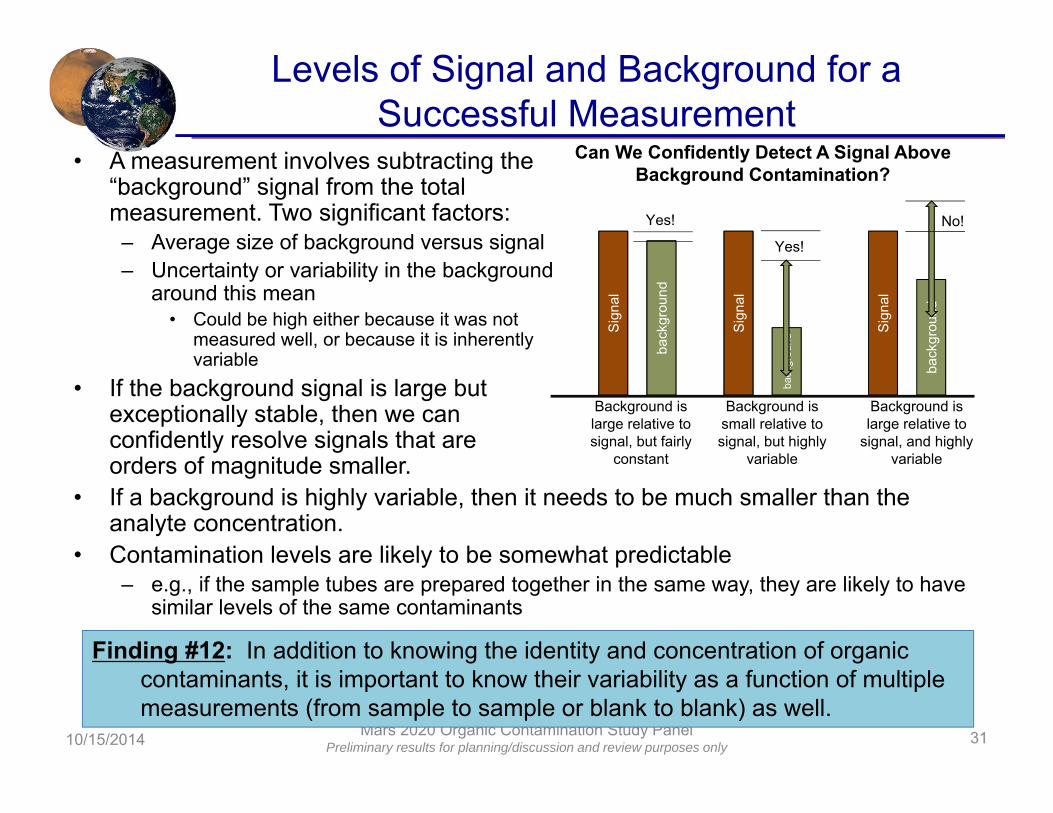
Levels of Signal and Background for a Successful Measurement
• A measurement involves subtracting the“background” signal from the total measurement. Two significant factors:
– Average size of background versus signal– Uncertainty or variability in the background
around this mean • Could be high either because it was not
measured well, or because it is inherently variable
• If the background signal is large but exceptionally stable, then we can confidently resolve signals that are orders of magnitude smaller.
• If a background is highly variable, then it needs to be much smaller than the analyte concentration.
• Contamination levels are likely to be somewhat predictable– e.g., if the sample tubes are prepared together in the same way, they are likely to have
similar levels of the same contaminants
10/15/2014 Mars 2020 Organic Contamination Study Panel Preliminary results for planning/discussion and review purposes only 31
Finding #12: In addition to knowing the identity and concentration of organic contaminants, it is important to know their variability as a function of multiple measurements (from sample to sample or blank to blank) as well.
Sig
nal
back
grou
nd
Sig
nal
back
grou
nd
Sig
nal
back
grou
nd
Background is large relative to signal, but fairly
constant
Background is small relative to signal, but highly
variable
Background is large relative to
signal, and highly variable
Yes!
Yes!
No!
Can We Confidently Detect A Signal Above Background Contamination?