Embed Size (px)
Citation preview
Planning and Conducting anExperiment or Study
Larry Ottman, (LarryO)CK12 Editor
Say Thanks to the AuthorsClick http://www.ck12.org/saythanks
(No sign in required)
To access a customizable version of this book, as well as otherinteractive content, visit www.ck12.org
CK-12 Foundation is a non-profit organization with a mission toreduce the cost of textbook materials for the K-12 market bothin the U.S. and worldwide. Using an open-content, web-basedcollaborative model termed the FlexBook®, CK-12 intends topioneer the generation and distribution of high-quality educationalcontent that will serve both as core text as well as provide anadaptive environment for learning, powered through the FlexBookPlatform®.
Copyright © 2012 CK-12 Foundation, www.ck12.org
The names “CK-12” and “CK12” and associated logos and theterms “FlexBook®” and “FlexBook Platform®” (collectively“CK-12 Marks”) are trademarks and service marks of CK-12Foundation and are protected by federal, state, and internationallaws.
Any form of reproduction of this book in any format or medium,in whole or in sections must include the referral attribution linkhttp://www.ck12.org/saythanks (placed in a visible location) inaddition to the following terms.
Except as otherwise noted, all CK-12 Content (includingCK-12 Curriculum Material) is made available to Usersin accordance with the Creative Commons Attribution/Non-Commercial/Share Alike 3.0 Unported (CC BY-NC-SA) License(http://creativecommons.org/licenses/by-nc-sa/3.0/), as amendedand updated by Creative Commons from time to time (the “CCLicense”), which is incorporated herein by this reference.
Complete terms can be found at http://www.ck12.org/terms.
Printed: August 26, 2012
AUTHORSLarry Ottman, (LarryO)CK12 Editor
www.ck12.org Chapter 1. Planning and Conducting an Experiment or Study
CHAPTER 1 Planning and Conductingan Experiment or Study
CHAPTER OUTLINE
1.1 Surveys and Sampling1.2 Experimental Design
1
1.1. Surveys and Sampling www.ck12.org
1.1 Surveys and Sampling
Learning Objectives
• Differentiate between a census and a survey or sample.• Distinguish between sampling error and bias.• Identify and name potential sources of bias from both real and hypothetical sampling situations.
Introduction
The New York Times/ CBS News Poll is a well-known regular polling organization that releases results of pollstaken to help clarify the opinions of Americans on current issues, such as election results, approval ratings of currentleaders, or opinions about economic or foreign policy issues. In an article that explains some of the details of arecent poll entitled “How the Poll Was Conducted” the following statements appear1:
“In theory, in 19 cases out of 20, overall results based on such samples will differ by no more than three percentagepoints in either direction from what would have been obtained by seeking to interview all American adults.”
“In addition to sampling error, the practical difficulties of conducting any survey of public opinion may introduceother sources of error into the poll. Variation in the wording and order of questions, for example, may lead tosomewhat different results.”
These statements illustrate the two different potential problems with opinion polls, surveys, observational studies,and experiments. In chapter 1, we identified some of the basic vocabulary of populations and sampling. In thislesson, we will review those ideas and investigate the sampling in more detail.
Census vs. Sample
In Chapter 1 we identified a population as the entire group that is being studied. A sample is a small, representativesubset of the population. If a statistician or other researcher really wants to know some information about apopulation, the only way to be truly sure is to conduct a census. In a census, every unit in the population beingstudied is measured or surveyed. In opinion polls like the New York Times poll mentioned above, a smaller sampleis used to generalize from. If we really wanted to know the true approval rating of the president, for example,we would have to ask every single American adult their opinion. There are some obvious reasons that a census isimpractical in this case, and in most situations.
First, it would be extremely expensive for the polling organization. They would need an extremely large workforceto try and collect the opinions of every American adult. How would you even be sure that you could find everyAmerican adult? It would take an army of such workers and many hours to organize, interpret, and display thisinformation. Even if all those problems could be overcome, how long do you think it would take? Being overlyoptimistic that it could be done in several months, by the time the results were published it would be very probablethat recent events had changed peoples’ opinions and the results would be obsolete.
2
www.ck12.org Chapter 1. Planning and Conducting an Experiment or Study
Another reason to avoid a census is when it is destructive to the population. For example, many manufacturingcompanies test their products for quality control. A padlock manufacturer might use a machine to see how muchforce it can apply to the lock before it breaks. If they did this with every lock, they would have none to sell! It wouldnot be a good idea for a biologist to find the number of fish in a lake by draining the lake and counting them all!
The US Census is probably the largest and longest running census. The Constitution mandates a complete countingof the population. The first U.S. Census was taken in 1790 and was done by U.S. Marshalls on horseback. Takenevery 10 years, a new Census is scheduled for 2010 and in a report by the Government Accountability Office in1994, was estimated to cost $11 billion2. This cost has recently increased as computer problems have forced theforms to be completed by hand3. You can find a great deal of information about the US Census as well as data frompast censuses on the Census Bureau’s website: http://www.census.gov/.
Due to all of the difficulties associated with a census, sampling is much more practical. However, it is importantto understand that even the most carefully planned sample will be subject to random variation between the sampleand population. As we learned in Chapter 1, these differences due to chance are called sampling error. We canuse the laws of probability to predict the level of accuracy in our sample. Opinion polls, like the New York Timespoll mentioned in the introduction tend to refer to this as margin of error. In later chapters, you will learn thestatistical theory behind these calculations. The second statement quoted from the New York Times article mentionsthe other problem with sampling. It is often difficult to obtain a sample that accurately reflects the total population.It is also possible to make mistakes in selecting the sample and collecting the information. These problems resultin a non-representative sample, or one in which our conclusions differ from what they would have been if we hadbeen able to conduct a census.
Flipping Coins
To help understand these ideas, let’s look at a more theoretical example. A coin is considered “fair” if the probability,p, of the coin landing on heads is the same as the probability of landing on tails (p = 0.5). The probability is definedas the proportion of each result obtained from flipping the coin infinitely. A census in this example would be aninfinite number of coin flips, which again is quite impractical. So instead, we might try a sample of 10 coin flips.Theoretically, you would expect the coin to land on heads 5 times. But it is very possible that, due to chance alone,we would experience results that differ from the actual probability. These differences are due to sampling error. Aswe will investigate in detail in later chapters, we can decrease the sampling error by increasing the sample size (orthe number of coin flips in this case). It is also possible that the results we obtain could differ from those expected ifwe were not careful about the way we flipped the coin or allowed it to land on different surfaces. This would be anexample of a non-representative sample.
At the following website you can see the results of a large number of coin flips - http://shazam.econ.ubc.ca/flip/.You can see the random variation among samples by asking for the site to flip 100 coins five times. Our results forthat experiment produced the following number of heads: 45,41,47,45, and 45, which seems quite strange, sincethe expected number is 50. How do your results compare?
3
1.1. Surveys and Sampling www.ck12.org
Bias in Samples and Surveys
The term most frequently applied to a non-representative sample is bias. Bias has many potential sources. It isimportant when selecting a sample or designing a survey that a statistician make every effort to eliminate potentialsources of bias. In this section we will discuss some of the most common types of bias. While these concepts areuniversal, the terms used to define them here may be different than those used in other sources.
Sampling Bias
Sampling bias refers in general to the methods used in selecting the sample for a survey, observational study, orexperiment. The sampling frame is the term we use to refer to the group or listing from which the sample is to bechosen. If we wanted to study the population of students in your school, you could obtain a list of all the studentsfrom the office and choose students from the list. This list would be the sampling frame. The following are some ofthe more common sources of potential sampling bias.
Incorrect Sampling Frame
If the list from which you choose your sample does not accurately reflect the characteristics of the population, thisis called incorrect sampling frame. A sampling frame error occurs when some group from the population doesnot have the opportunity to be represented in the sample. Surveys are often done over the telephone. You could usethe telephone book as a sampling frame by choosing numbers from the phonebook. In addition to the many otherpotential problems with telephone polls, some phone numbers are not listed in the telephone book. Also, if yourpopulation includes all adults, it is possible that you are leaving out important groups of that population. For example,many younger adults especially tend to only use their cell phones or computer based phone services and may noteven have traditional phone service. The sampling frame does not need to be an actual list. Even if you pickedphone numbers randomly, the sampling frame could be incorrect because there are also people, especially those whomay be economically disadvantaged, who have no phone. There is absolutely no chance for these individuals tobe represented in your sample. A term often used to describe the problems when a group of the population is notrepresented in a survey is undercoverage. Undercoverage can result from all of the different sampling bias.
One of the most famous examples of sampling frame error occurred during the 1936 U.S. presidential election.The Literary Digest, a popular magazine at the time, conducted a poll and predicted that Alf Landon would winthe election that, as it turned out, was won in a landslide by Franklin Delano Roosevelt. The magazine obtained a
4
www.ck12.org Chapter 1. Planning and Conducting an Experiment or Study
huge sample of ten million people, and from that pool 2 million replied. With these numbers, you would typicallyexpect very accurate results. However, the magazine used their subscription list as their sampling frame. During thedepression, these individuals would have been only the wealthiest Americans, who tended to vote Republican, andleft the majority of typical voters undercovered.
Convenience Sampling
Suppose your statistics teacher gave you an assignment to perform a survey of 20 individuals. You would mostlikely tend to ask your friends and family to participate because it would be easy and quick. This is an example ofconvenience sampling or convenience bias. While it is not always true, your friends are usually people that sharecommon values, interests, and opinions. This could cause those opinions to be over-represented in relation to thetrue population. Have you ever been approached by someone conducting a survey on the street or in a mall? If sucha person were just to ask the first 20 people they found, there is the potential that large groups representing variousopinions would not be included, resulting in under coverage.
Judgment Sampling
Judgment sampling occurs when an individual or organization, usually considered an expert in the field beingstudied, chooses the individuals or group of individuals to be used in the sample. Because it is based on a subjectivechoice, even someone considered an expert, it is very susceptible to bias. In some sense, this is what those responsiblefor the Literary Digest poll did. They incorrectly chose groups they believed would represent the population. If aperson wants to do a survey on middle class Americans, how would they decide who to include? It would be left totheir own judgment to create the criteria for those considered middle-class. This individual’s judgment might resultin a different view of the middle class that might include wealthier individuals that others would not consider part ofthe population. Related to judgment sampling, in quota sampling, an individual or organization attempts to includethe proper proportions of individuals of different subgroups in their sample. While it might sound like a good idea,it is subject to an individual’s prejudice and is therefore prone to bias.
Size Bias
If one particular subgroup in a population is likely to be more or less represented due to its size, this is sometimescalled size bias. If we chose a state at random from a map by closing our eyes and pointing to a particular place,larger states have a greater chance of being chosen than smaller ones. Suppose that we wanted to do a survey to findout the typical size of a student’s math class at this school. The chances are greater that you would choose someonefrom a larger class. To understand this, let’s use a very simplistic example. Say that you went to a very small schoolwhere there are only four math classes, one has 35 students, and the other three have only 8 students. If you simplychoose a student at random, there are more students in the larger class, so it is more likely you will select students inyour sample who will answer “35”.
For example, people driving on an interstate highway tend to say things like, “Wow, I was going the speed limitand everyone was just flying by me.” The conclusion this person is making about the population of all drivers onthis highway is that most of them are traveling faster than the speed limit. This may indeed most often be true!Let’s say though, that most people on the highway, along with our driver, really are abiding by the speed limit. In asense, the driver is collecting a sample. It could in fact be true that most of the people on the road at that time aregoing the same exact speed as our driver. Only those few who are close to our driver will be included in the sample.There will be a larger number of drivers going faster in our sample, so they will be overrepresented. As you mayalready see, these definitions are not absolute and often in a practical example, there are many types of overlappingbias that could be present and contribute to over or under coverage. We could also cite incorrect sampling frame orconvenience bias as potential problems in this example.
Response Bias
We will use the term response bias to refer in general terms to the types of problems that result from the ways inwhich the survey or poll is actually presented to the individuals in the sample.
5
1.1. Surveys and Sampling www.ck12.org
Voluntary Response Bias
Television and radio stations often ask viewers/listeners to call in with opinions about a particular issue they arecovering. The websites for these and other organizations also usually include some sort of online poll question ofthe day. Reality television shows and fan balloting in professional sports to choose “all star” players make use ofthese types of polls as well. All of these polls usually come with a disclaimer stating that, “This is not a scientificpoll.” While perhaps entertaining, these types of polls are very susceptible to voluntary response bias. The peoplewho respond to these types of surveys tend to feel very strongly one way or another about the issue in questionand the results might not reflect the overall population. Those who still have an opinion, but may not feel quite sopassionately about the issue, may not be motivated to respond to the poll. This is especially true for phone in or mailin surveys in which there is a cost to participate. The effort or cost required tends to weed out much of the populationin favor of those who hold extremely polarized views. A news channel might show a report about a child killed in adrive by shooting and then ask for people to call in and answer a question about tougher criminal sentencing laws.They would most likely receive responses from people who were very moved by the emotional nature of the storyand wanted anything to be done to improve the situation. An even bigger problem is present in those types of pollsin which there is no control over how many times an individual may respond.
Non-Response Bias
One of the biggest problems in polling is that most people just don’t want to be bothered taking the time to respondto a poll of any kind. When people hang up on a telephone survey, put a mail-in survey in the recycling bin, or walkquickly past the interviewer on the street. We just don’t know how those individuals beliefs and opinions reflectthose of the general population and therefore almost all surveys could be prone to non-response bias.
Questionnaire Bias
Questionnaire bias occurs when the way in which the question is asked influences the response given by theindividual. It is possible to ask the same question in two different ways that would lead individuals with the samebasic opinions to respond differently. Consider the following two questions about gun control.
Do you believe that it is reasonable for the government to impose some limits on purchases of certain types ofweapons in an effort to reduce gun violence in urban areas?
Do you believe that it is reasonable for the government to infringe on an individual’s constitutional right to beararms?
A gun rights activist might feel very strongly that the government should never be in the position of limiting gunsin any way and would answer no to both questions. Someone who is very strongly against gun ownership wouldsimilarly answer no to both questions. However, individuals with a more tempered, middle position on the issuemight believe in an individual’s right to own a gun under some circumstances while still feeling that there is a needfor regulation. These individuals would most likely answer these two questions differently.
You can see how easy it would be to manipulate the wording of a question to obtain a certain response to a pollquestion. Questionnaire bias is not necessarily always a deliberate action. If a question is poorly worded, confusing,or just plain hard to understand it could lead to non-representative results. When you ask people to choose betweentwo options, it is even possible that the order in which you list the choices may influence their response!
Incorrect Response Bias
A major problem with surveys is that you can never be sure that the person is actually responding truthfully. Whenan individually intentionally responds to a survey with an untruthful answer, this is called incorrect response bias.This can occur when asking questions about extremely sensitive or personal issues. For example, a survey conductedabout illegal drinking among teens might be prone to this type of bias. Even if guaranteed their responses areconfidential, some teenagers may not want to admit to engaging in such behavior at all. Others may want to appearmore rebellious than they really are, but in either case we cannot be sure of the truthfulness of the responses. As thedangers of donated blood being tainted with diseases carrying a negative social stereotype developed in the 1990’s,the Red Cross deals with this type of bias on a constant and especially urgent basis. Individuals who have engagedin behavior that puts them at risk for contracting AIDS or other diseases, have the potential to pass them on through
6
www.ck12.org Chapter 1. Planning and Conducting an Experiment or Study
donated blood4. Screening for these behaviors involves asking many personal questions that some find awkward orinsulting and may result in knowingly false answers. The Red Cross has gone to great lengths to devise a systemwith several opportunities for individuals giving blood to anonymously report the potential danger of their donation.
In using this example, we don’t want to give the impression that the blood supply is unsafe. According to the RedCross, “Like most medical procedures, blood transfusions have associated risk. In the more than fifteen years sinceMarch 1985, when the FDA first licensed a test to detect HIV antibodies in donated blood, the Centers for DiseaseControl and Prevention has reported only 41 cases of AIDS caused by transfusion of blood that tested negative for theAIDS virus. During this time, more than 216 million blood components were transfused in the United States. . . Thetests to detect HIV were designed specifically to screen blood donors. These tests have been regularly upgraded sincethey were introduced. Although the tests to detect HIV and other blood-borne diseases are extremely accurate, theycannot detect the presence of the virus in the "window period" of infection, the time before detectable antibodies orantigens are produced. That is why there is still a very slim chance of contracting HIV from blood that tests negative.Research continues to further reduce the very small risk.”4 Source: http://chapters.redcross.org/br/nypennregion/safety/mythsaid.htm
Reducing Bias: Randomization and other Techniques
Randomization
The best technique for reducing bias in sampling is randomization. A simple random sample (commonly referredto as an SRS) is a technique in which all units in the population have an equal probability of being selected for thesample. For example, if your statistics teacher wants to choose a student at random for a special prize, they couldsimply place the names of all the students in the class in a hat, mix them up, and choose one. More scientifically, wecould assign each student in the class a number from 1 to say 25 (assuming there are 25 students in the class) andthen use a computer or calculator to generate a random number to choose one student.
A note about “randomness”
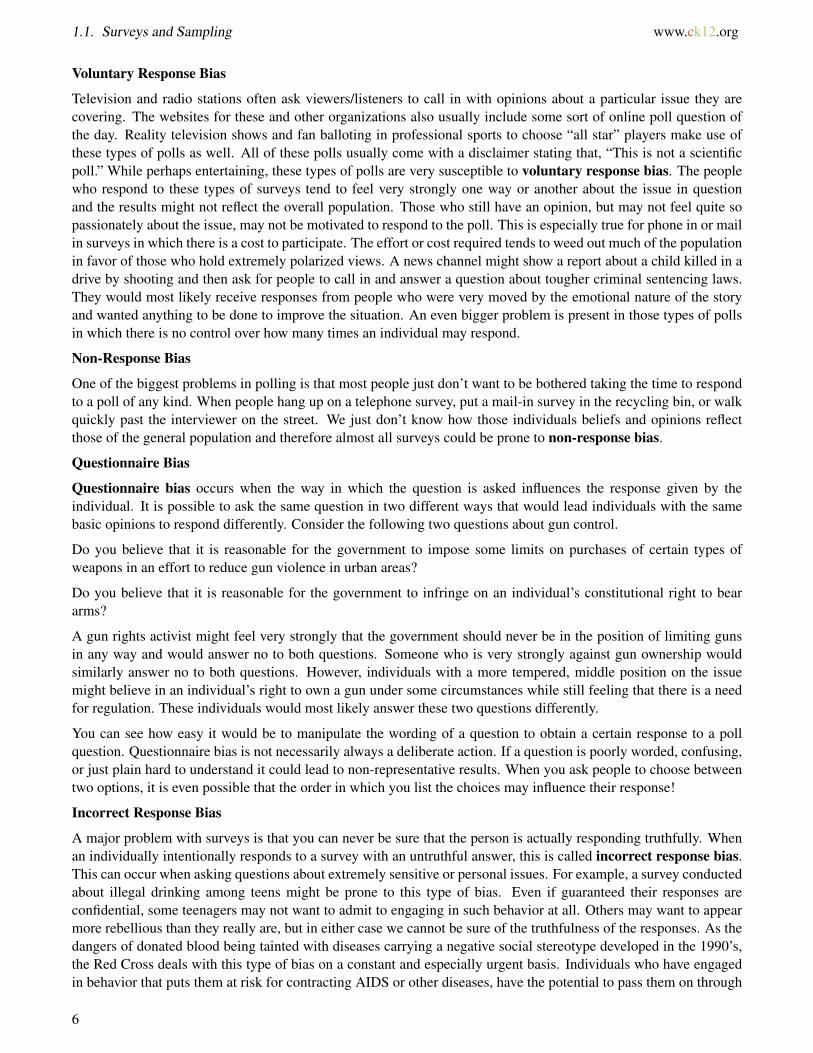
Your graphing calculator has a random number generator. Press [MATH] and move over to [PRB], which standsfor probability. (Note: instead of pressing the right arrow three times, you can just use the left once!). Choose randfor the random number generator and press [ENTER] twice to produce a random number between 0 and 1. Press[ENTER] a few more times to see more results.
It is important that you understand that there is no such thing as true “randomness”, especially on a calculator orcomputer. When you choose the rand function, the calculator has been programmed to return a ten digit decimalthat, using a very complicated mathematical formula, simulates randomness. Each digit, in theory, is equally likelyto occur in any of the individual decimal places. What this means in practice, is that if you had the patience (and thetime!) to generate a million of these on your calculator and keep track of the frequencies in a table, you would findthere would be an approximately equal number of each digit. Two brand new calculators will give the exact samesequence of random numbers! This is because the function that simulates randomness has to start at some number,called a seed value. All the calculators are programmed from the factory (or when the memory is reset) to use a seedvalue of zero. If you want to be sure that your sequence of “random” digits is different from someone else’s, youneed to seed your random number function using a number different from theirs. Type a unique sequence of digits
7
1.1. Surveys and Sampling www.ck12.org
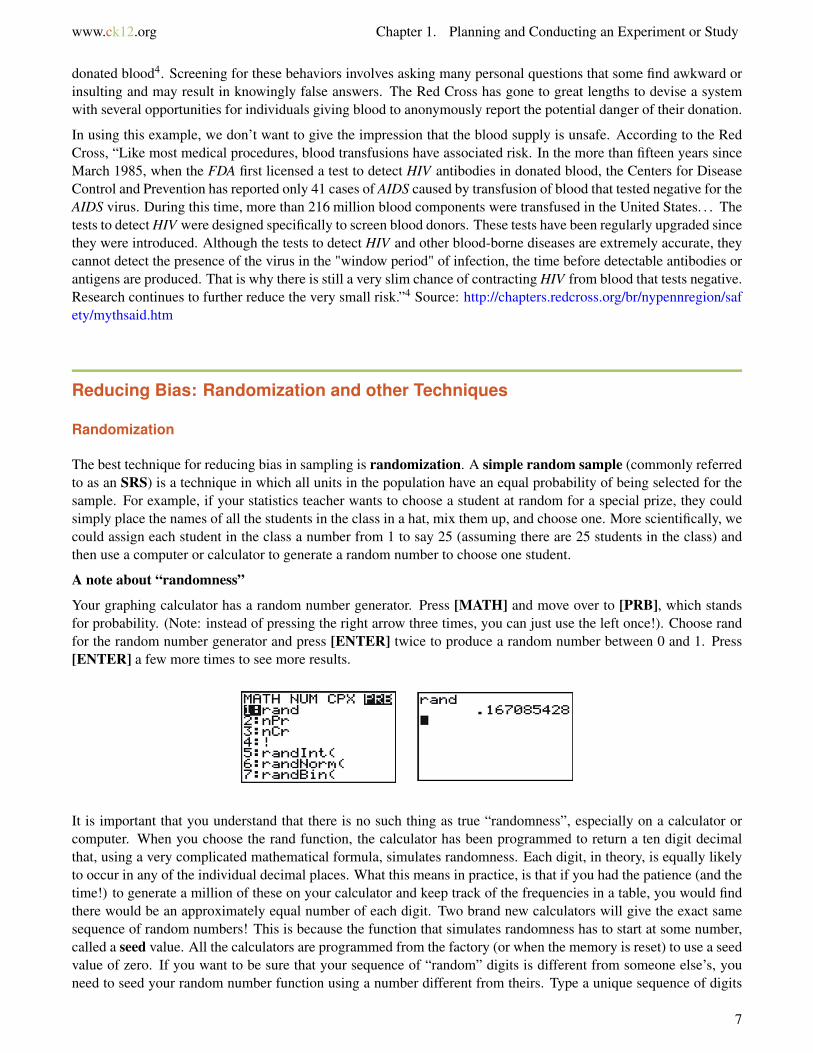
on the homescreen and then press [STO], enter the rand function, and press [ENTER]. As long as the number youchose to seed the function is different, you will get different results.
Now, back to our example, if we want to choose a student, at random, between 1 and 25, we need to generate arandom integer between 1 and 25. To do this, press [MATH], [PRB], and choose the random integer function.
The syntax for this command is as follows:
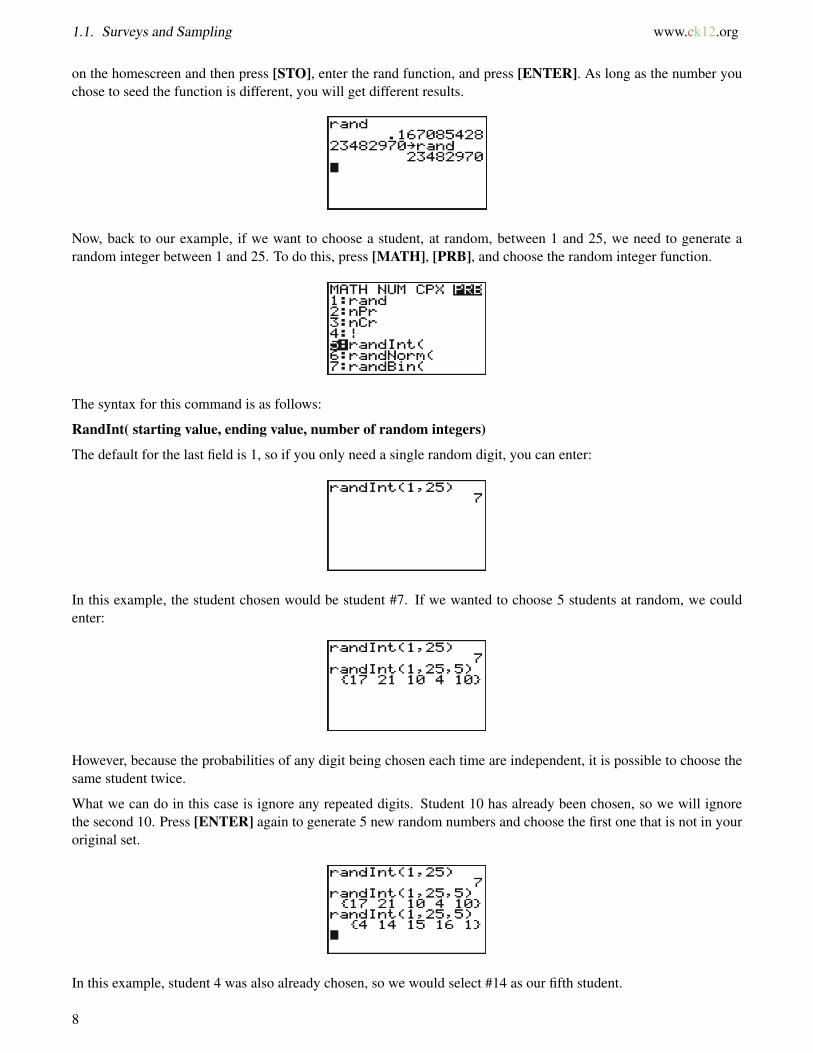
RandInt( starting value, ending value, number of random integers)
The default for the last field is 1, so if you only need a single random digit, you can enter:
In this example, the student chosen would be student #7. If we wanted to choose 5 students at random, we couldenter:
However, because the probabilities of any digit being chosen each time are independent, it is possible to choose thesame student twice.
What we can do in this case is ignore any repeated digits. Student 10 has already been chosen, so we will ignorethe second 10. Press [ENTER] again to generate 5 new random numbers and choose the first one that is not in youroriginal set.
In this example, student 4 was also already chosen, so we would select #14 as our fifth student.
8
www.ck12.org Chapter 1. Planning and Conducting an Experiment or Study
Systematic Sampling
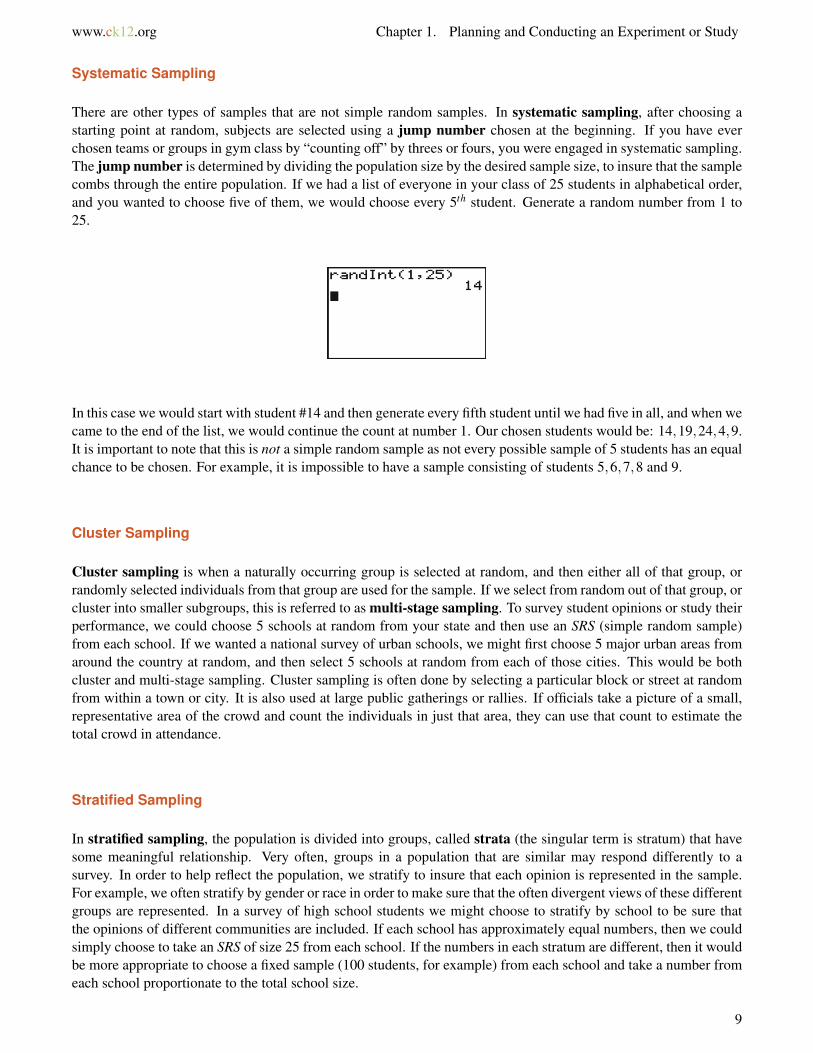
There are other types of samples that are not simple random samples. In systematic sampling, after choosing astarting point at random, subjects are selected using a jump number chosen at the beginning. If you have everchosen teams or groups in gym class by “counting off” by threes or fours, you were engaged in systematic sampling.The jump number is determined by dividing the population size by the desired sample size, to insure that the samplecombs through the entire population. If we had a list of everyone in your class of 25 students in alphabetical order,and you wanted to choose five of them, we would choose every 5th student. Generate a random number from 1 to25.
In this case we would start with student #14 and then generate every fifth student until we had five in all, and when wecame to the end of the list, we would continue the count at number 1. Our chosen students would be: 14,19,24,4,9.It is important to note that this is not a simple random sample as not every possible sample of 5 students has an equalchance to be chosen. For example, it is impossible to have a sample consisting of students 5,6,7,8 and 9.
Cluster Sampling
Cluster sampling is when a naturally occurring group is selected at random, and then either all of that group, orrandomly selected individuals from that group are used for the sample. If we select from random out of that group, orcluster into smaller subgroups, this is referred to as multi-stage sampling. To survey student opinions or study theirperformance, we could choose 5 schools at random from your state and then use an SRS (simple random sample)from each school. If we wanted a national survey of urban schools, we might first choose 5 major urban areas fromaround the country at random, and then select 5 schools at random from each of those cities. This would be bothcluster and multi-stage sampling. Cluster sampling is often done by selecting a particular block or street at randomfrom within a town or city. It is also used at large public gatherings or rallies. If officials take a picture of a small,representative area of the crowd and count the individuals in just that area, they can use that count to estimate thetotal crowd in attendance.
Stratified Sampling
In stratified sampling, the population is divided into groups, called strata (the singular term is stratum) that havesome meaningful relationship. Very often, groups in a population that are similar may respond differently to asurvey. In order to help reflect the population, we stratify to insure that each opinion is represented in the sample.For example, we often stratify by gender or race in order to make sure that the often divergent views of these differentgroups are represented. In a survey of high school students we might choose to stratify by school to be sure thatthe opinions of different communities are included. If each school has approximately equal numbers, then we couldsimply choose to take an SRS of size 25 from each school. If the numbers in each stratum are different, then it wouldbe more appropriate to choose a fixed sample (100 students, for example) from each school and take a number fromeach school proportionate to the total school size.
9
1.1. Surveys and Sampling www.ck12.org
Lesson Summary
If you collect information from every unit in a population, it is called a census. Because censuses are so difficult todo, we instead take a representative subset of the population, called a sample, to try and make conclusions about theentire population. The downside to sampling is that we can never be completely, 100% sure that we have capturedthe truth about the entire population due to random variation in our sample that is called sampling error. The listof the population from which the sample is chosen is called the sampling frame. Poor technique in choosing orsurveying a sample can also lead to incorrect conclusions about the population that are generally referred to as bias.Selection bias refers to choosing a sample that results in a sub group that is not representative of the population.Incorrect sampling frame occurs when the group from which you choose your sample does not include everyonein the population or at least units that reflect the full diversity of the population. Incorrect sampling frame errorsresult in undercoverage. This is where a segment of the population containing an important characteristic did nothave an opportunity to be chosen for the sample and will be marginalized, or even left out altogether.
Points to Consider
a. How is the margin of error for a survey calculated?b. What are the effects of sample size on sampling error?c. Is the plural of census censuses, or censi?
Review Questions
1. Brandy wanted to know which brand of soccer shoe high school soccer players prefer. She decided to ask thegirls on her team which brand they liked.
a. What is the population in this example?b. What are the units?c. If she asked ALL high school soccer players this question, what is the statistical term we would use to
describe the situation?d. Which group(s) from the population is/are going to be underrepresented?e. What type of bias best describes the error in her sample? Why?f. Brandy got a list of all the soccer players in the colonial conference from her athletic director, Mr. Sprain.
This list is called the:g. If she grouped the list by boys and girls, and chose 40 boys at random, and 40 girls at random, what type
of sampling best describes her method?
2. Your doorbell rings and you open the door to find a 6 foot tall boa constrictor wearing a trench coat andholding a pen and a clip board. He says to you, “I am conducting a survey for a local clothing store, do youown any boots, purses, or other items made from snake skin?” After recovering from the initial shock of atalking snake being at the door you quickly and nervously answer, “Of course not.” As the wallet you boughton vacation last summer at Reptile World weighs heavily in your pocket. What type of bias best describes thisridiculous situation? Explain why.
In each of the next two examples, identify the type of sampling that is most evident and explain why you think itapplies.
3. In order to estimate the population of moose in a wilderness area, a biologist familiar with that area selects
10
www.ck12.org Chapter 1. Planning and Conducting an Experiment or Study
a particular marsh area and spends the month of September, during mating season, cataloging sightings ofmoose. What two types of sampling are evident in this example?
4. The local sporting goods store has a promotion where every 1000th customer gets a $10 gift card.
For questions 5-9, an amusement park wants to know if its new ride, The Pukeinator, is too scary. Explain the type(s)of bias most evident in each sampling technique and/or what sampling method is most evident. Be sure to justifyyour choice.
5. The first 30 riders on a particular day are asked their opinions of the ride.6. The name of a color is selected at random and only riders wearing that particular color are asked their opinion
of the ride.7. A flier is passed out inviting interested riders to complete a survey about the ride at 5 pm that evening.8. Every 12th teenager exiting the ride is asked in front of his friends: “You didn’t think that ride was scary, did
you?”9. Five riders are selected at random during each hour of the day, from 9 am until closing at 5 pm.
10. There are 35 students taking statistics in your school and you want to choose 10 of them for a survey abouttheir impressions of the course. Use your calculator to select a SRS of 10 students. (Seed your random numbergenerator with the number 10 before starting). Assuming the students are assigned numbers from 1 to 35,which students are chosen for the sample?
Review Answers
1. (a) All high school soccer players. (b) Each individual high school soccer player. (c) A census. (d) Boys,students from other areas of the country of different socio-economic or cultural backgrounds, if she is on avarsity team, perhps JV or freshman soccer players might have different preferences. (e) There are multipleanswers, which is why the explanation is very important. The two most obvious sources are: Conveniencebias, she asked the group that was most easily accessible to her, her own teammates. Incorrect Samplingframe, boys or some of the other undercovered groups mentioned in d, have no chance of being included inthe sample. (f) The sampling frame. (g) Stratification.
2. This is incorrect response bias. You are intentionally answering the question incorrectly so as to not antagonizethe giant talking snake!
3. The biologist is using her knowledge of moose behavior to choose an area and a time in which to estimate thepopulation, this is judgment sampling. She has also selected one particular lake to estimate the entire region,which could be considered a form of cluster sampling.
4. Systematic sampling. The customer is selected based on a fixed interval.5. Convenience bias. The first 30 riders is an easy group to access. Incorrect Sampling Frame. The first riders of
the day are likely to be those who are most excited by high-thrill rides and may not have the same opinions asthose who are less enthusiastic about riding.
6. Cluster sampling. A group is chosen because of a natural relationship that does not necessarily have anysimilarity of response, i.e. we have no reason to believe that people wearing a certain color would respondsimilarly, or differently, from anyone else in the population.
7. Voluntary response bias. Participants will self-select. Non-response bias. A large percentage of potentialparticipants are not going to want to be bothered participating in a survey at the end of a long day at anamusement park.
8. There are several potential answers. Incorrect Response Bias. The chosen participants might not want toadmit to being scared in front of the young lady. Questionnaire bias. The question is definitely worded ina manner that would encourage participants to answer in a particular way. This is also systematic samplingand someone used their judgment that only boys should be surveyed. A case could also be made for incorrectsampling frame as no girls or other age groups have a chance of being represented. All of these examples alsoeliminate the opinions of those in the park who do not choose to ride.
11
1.1. Surveys and Sampling www.ck12.org
9. Stratification. It could be that people who ride at different times during the day have different opinions aboutthrill rides or are from different age groups. In this case, each hour is a stratum. For example, it could be thatthose riding early in the morning are more of the thrill seeker types, and the more hesitant folks might takesome time to muster the courage to ride.
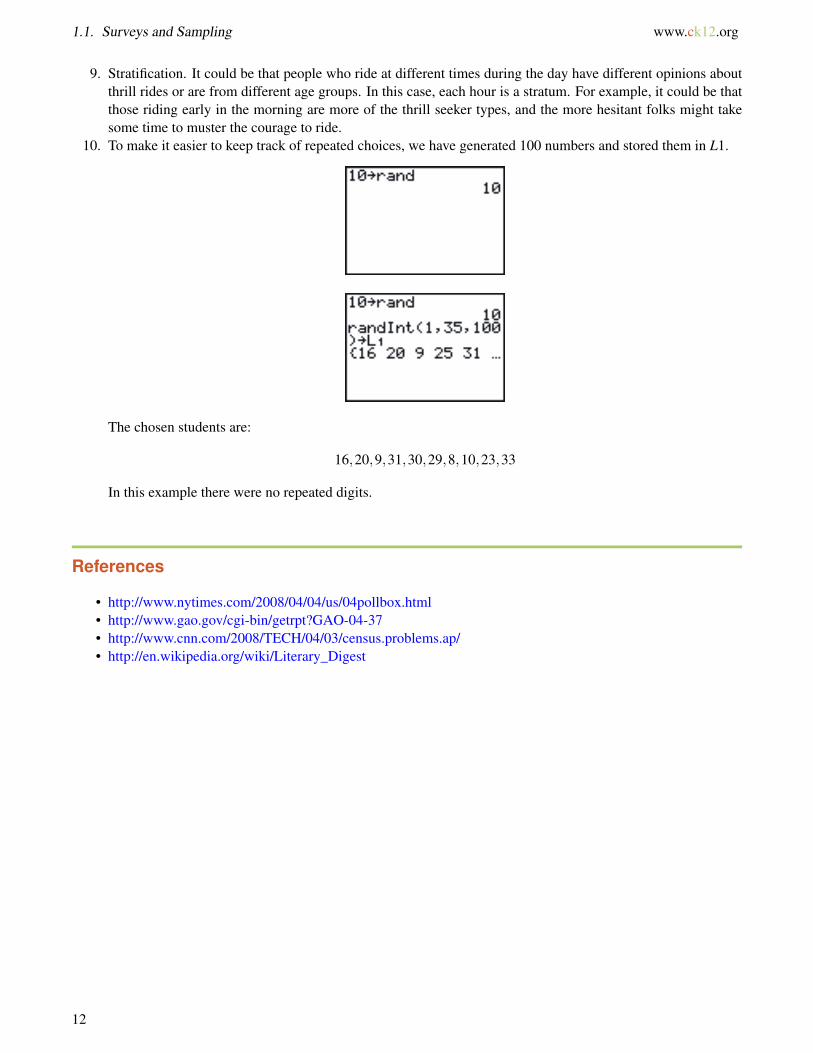
10. To make it easier to keep track of repeated choices, we have generated 100 numbers and stored them in L1.
The chosen students are:
16,20,9,31,30,29,8,10,23,33
In this example there were no repeated digits.
References
• http://www.nytimes.com/2008/04/04/us/04pollbox.html• http://www.gao.gov/cgi-bin/getrpt?GAO-04-37• http://www.cnn.com/2008/TECH/04/03/census.problems.ap/• http://en.wikipedia.org/wiki/Literary_Digest
12
www.ck12.org Chapter 1. Planning and Conducting an Experiment or Study
1.2 Experimental Design
Learning Objectives
• Identify the important characteristics of an experiment.
• Distinguish between confounding and lurking variables.
• Use a random number generator to randomly assign experimental units to treatment groups.
• Identify experimental situations in which blocking is necessary or appropriate and create a blocking schemefor such experiments.
• Identify experimental situations in which a matched pairs design is necessary or appropriate and explain howsuch a design could be implemented.
• Identify the reasons for and the advantages of blind experiments.
• Distinguish between correlation and causation.
Introduction
A recent study published by the Royal Society of Britain1 concluded that there is a relationship between thenutritional habits of mothers around the time of conception and the gender of their child. The study found thatwomen who ate more calories and had a higher intake of essential nutrients and vitamins were more likely toconceive sons. As we learned in the first chapter, this study provides useful evidence of an association betweenthese two variables, but it is an observational study. It is possible that there is another variable that is actuallyresponsible for the gender differences observed. In order to be able to convincingly conclude that there is a causeand effect relationship between a mother’s diet and the gender of her child, we must perform a controlled statisticalexperiment. This lesson will cover the basic elements of designing a proper statistical experiment.
Confounding and Lurking Variables
In an observational study such as the Royal Society’s connecting gender and a mother’s diet, it is possible that thereis a third variable that was not observed that is causing a change in both the explanatory and response variables.A variable that is not included in a study but may still have an effect on the other variables involved is called alurking variable. For example, perhaps the mother’s exercise habits caused both her increased consumption ofcalories and her increased likelihood of having a male child. A slightly different type of additional variable is calleda confounding variable. Confounding variables are those that are observed but it cannot be distinguished which
13
1.2. Experimental Design www.ck12.org
one is actually causing the change in the response variable. This study also mentions the habit of skipping breakfastcould possibly depress glucose levels and lead to a decreased chance of sustaining a viable male embryo. In anobservational study, it is impossible to determine if it is nutritional habits in general, or the act of skipping breakfastthat causes a change in ender birth rates. A well-designed statistical experiment has the potential to isolate the effectsof these intertwined variables, but there is still no guarantee that we will ever be able to determine if one of thesevariables or some other factor causes a change in gender birth rate.
Observational studies, and the public’s appetite for finding simplified cause and effect relationships between easilyobservable factors are especially prone to confounding. The phrase often used by statisticians is that “Correlation(association) does not imply causation.” For example, another recent study published by the Norwegian Institute ofPublic Health2 found that first time mothers who had a Caesarian section were less likely to have a second child.While the trauma associated with the procedure may cause some women to be more reluctant to have a second child,there is no medical consequence of a Caesarian section that directly causes a woman to be less able to have a child.The 600,000 first time births over a 30 year time span that were examined are so diverse and unique that there couldbe a number of underlying causes that might be contributing to this result.
Experiments: Treatments, Randomization, and Replication
There are three elements that are essential to any statistical experiment that can earn the title of a randomizedclinical trial. The first is that a treatment must be imposed on the subjects of the experiment. In the example ofthe British study on gender, we would have to prescribe different diets to different women who were attemptingto become pregnant, rather than simply observing or having them record the details of their diets during this time,as was done for the study. The next element is that the treatments imposed must be randomly assigned. Randomassignment helps to eliminate other confounding variables. Just as randomization helps to create a representativesample in a survey, if we randomly assign treatments to the subjects we can increase the likelihood that the treatmentgroups are equally representative of the population. The other essential element of an experiment is replication.The conditions of a well-designed experiment will be able to be replicated by other researchers so the results can beindependently confirmed.
To design an experiment similar to the British study, we would need to use valid sampling techniques to selecta representative sample of women who were attempting to conceive (this might be difficult to accomplish!) Thewomen might then be randomly assigned to one of three groups in which their diets would be strictly controlled.The first group would be required to skip breakfast and the second group would be put on a high calorie, nutrition-rich diet, and the third group would be put on a low calorie, low nutrition diet. This brings up some ethical concerns.An experiment that imposes a treatment which could cause direct harm to the subjects is morally objectionable, andshould be avoided. Since skipping breakfast could actually harm the development of the child, it should not be partof an experiment.
It would be important to closely monitor the women for successful conception to be sure that once a viable embryois established, the mother returns to a properly nutritious pre-natal diet. The gender of the child would eventually bedetermined and the results between the three groups would be compared for differences.
Control
Let’s say that your statistics teacher read somewhere that classical music has a positive effect on learning. To imposea treatment in this scenario, she decides to have students listen to an MP3 layer very softly playing Mozart stringquartets while they slept for a week prior to administering a unit test. To help minimize the possibility that someother unknown factor might influence student performance on the test, she randomly assigns the class into twogroups of students. One group will listen to the music, the other group will not. When one of the treatment groups is
14
www.ck12.org Chapter 1. Planning and Conducting an Experiment or Study
actually withholding the treatment of interest, it is usually referred to as the control group. By randomly assigningsubjects to these two groups, we can help improve the chances that each group is representative of the class as awhole.
Placebos and Blind Experiments
In medical studies, the treatment group is usually receiving some experimental medication or treatment that has thepotential to offer a new cure or improvement for some medical condition. This would mean that the control groupwould not receive the treatment or medication. Many studies and experiments have shown that the expectations ofparticipants can influence the outcomes. This is especially true in clinical medication studies in which participantswho believe they are receiving a potentially promising new treatment tend to improve. To help minimize theseexpectations researchers usually will not tell participants in a medical study if they are receiving a new treatment. Inorder to help isolate the effects of personal expectations the control group is typically given a placebo (pronouncePluh-see-bo). The placebo group would think they are receiving the new medication, but they would in fact be givenmedication with no active ingredient in it. Because neither group would know if they are receiving the treatmentor the placebo, any change that might result from the expectation of treatment (this is called the placebo effect)should theoretically occur equally in both groups (provided they are randomly assigned). When the subjects in anexperiment do not know which treatment they are receiving, it is called a blind experiment. For example, if youwanted to do an experiment to see if people preferred a brand name bottled water to a generic brand, you wouldmost likely need to conceal the identity of the type of water. A participant might expect the brand name water totaste better than a generic brand, which would alter the results. Sometimes the expectations or prejudices of theresearchers conducting the study could affect their ability to objectively report the results, or could cause them tounknowingly give clues to the subjects that would affect the results. To avoid this problem, it is possible to designthe experiment so the researcher also does not know which individuals have been given the treatment or placebo.This is called a double-blind experiment. Because drug trials are often conducted, or funded by the companies thathave a financial interest in the success of the drug, in an effort to avoid any appearance of influencing the results,double-blind experiments are considered the “gold standard” of medical research.
Blocking
Blocking in an experiment serves a similar purpose to stratification in a survey. If we believe men and women mighthave different opinions about an issue, we must be sure those opinions are properly represented in the sample. Theterminology comes from agriculture. In testing different yields for different varieties of crops, researchers wouldneed to plant crops in large fields, or blocks, that could contain variations in conditions such as soil quality, sunlightexposure, and drainage. It is even possible that a crop’s position within a block could affect its yield. If there is asub-group in the population that might respond differently to an imposed treatment, our results could be confounded.Let’s say we want to study the effects of listening to classical music on student success in statistics class. It is possiblethat boys and girls respond differently to the treatment. So if we were to design an experiment to investigate the effectof listening to classical music, we want to be sure that boys and girls were assigned equally to the treatment (listeningto classical music) and the control group (not listening to classical music). This procedure would be referred to asblocking on gender. In this manner, any differences that may occur in boys and girls would occur equally underboth conditions, and we would be more likely to be able to conclude that differences in student performance weredue to the imposed treatment. In blocking, you should attempt to create blocks that are homogenous (the same) forthe trait on which you are blocking.
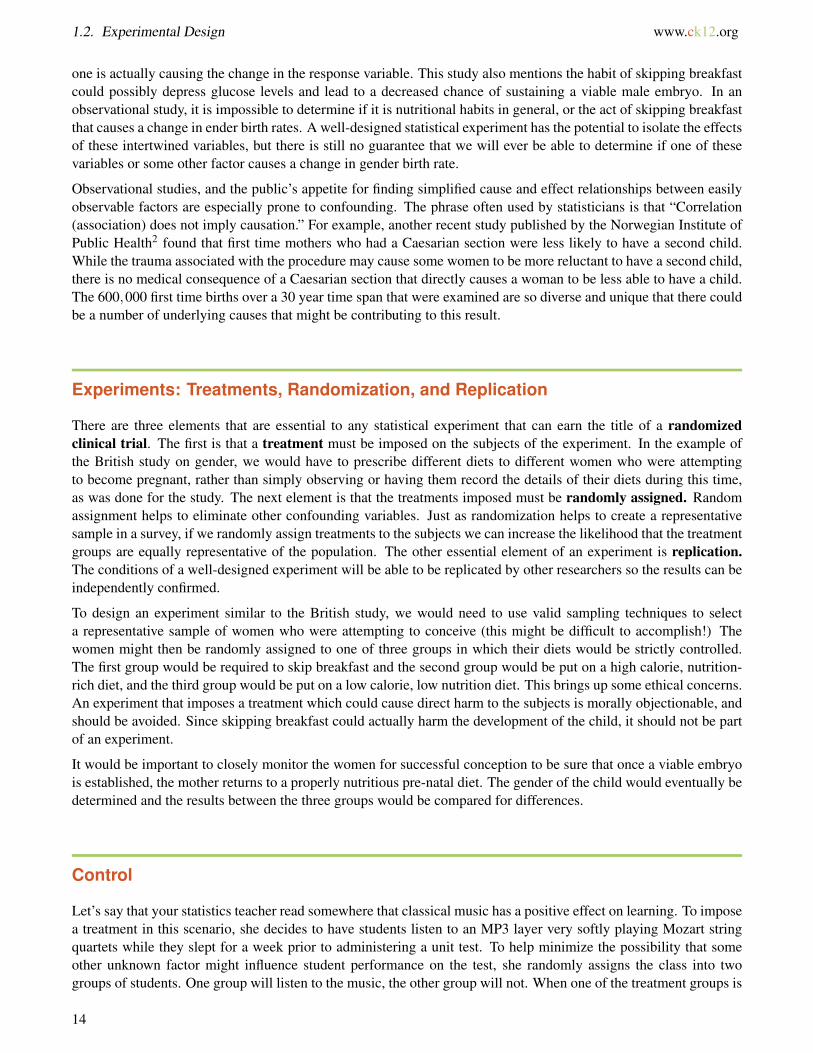
For example, in your garden, you would like to know which of two varieties of tomato plants will have the best yield.There is room in your garden to plant four plants, two of each variety. Because the sun is coming predominately
15
1.2. Experimental Design www.ck12.org
from one direction, it is possible that plants closer to the sun would perform better and shade the other plants. So itwould be a good idea to block on sun exposure by creating two blocks, one sunny and one not.
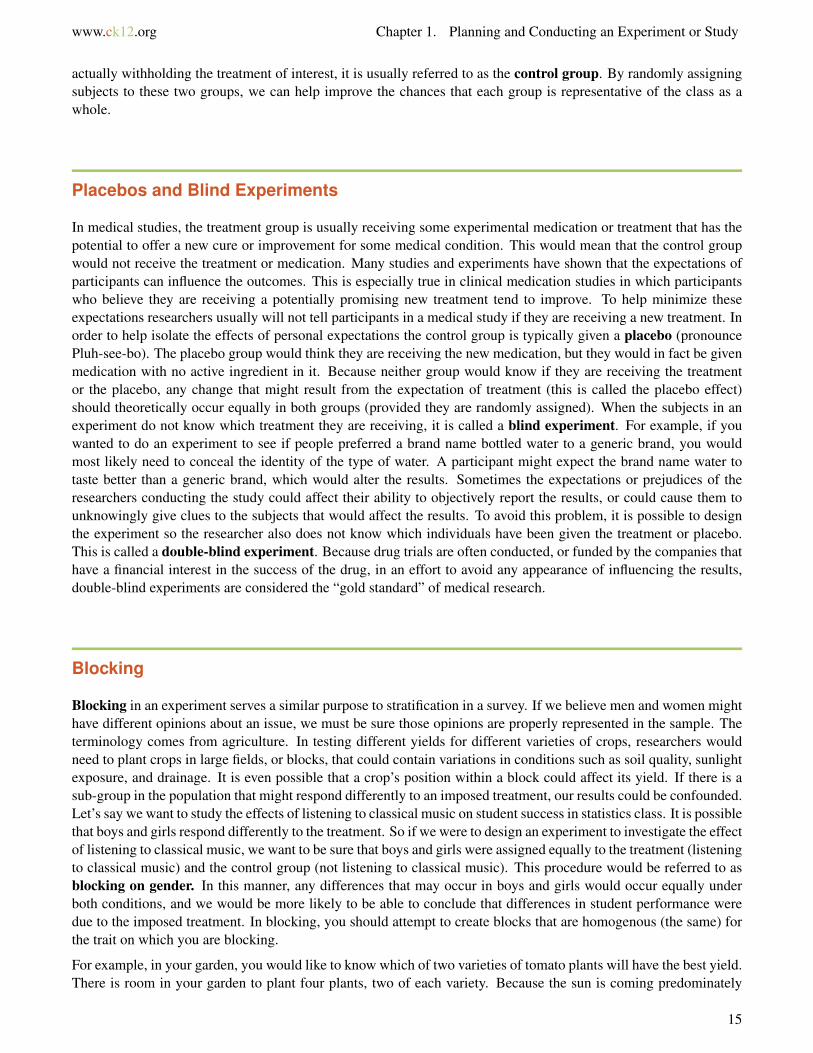
You would randomly assign one plant from each variety to each block. Then within each block, randomly assign thevariety to one of the two positions.
This type of design is called randomized block design.
Matched Pairs Design
A matched pairs design is a type of randomized block design in which there are two treatments to apply. Forexample, let’s say we were interested in the effectiveness of two different types of running shoes. We might searchfor volunteers among regular runners using the database of registered participants in a local distance run. Afterpersonal interviews, a sample of 50 runners who run a similar distance and pace (average speed) on roadways ona regular basis is chosen. Because you feel that the weight of the runners will directly affect the life of the shoe,you decided to block on weight. In a matched pairs design, you could list the weights of all 50 runners in order andthen create 25 matched pairs by grouping the weights two at a time. One runner would be randomly assigned shoeA and the other would be given shoe B. After a sufficient length of time, the amount of wear on the shoes would becompared.
In the previous example, there may be some potential confounding influences. Things such as running style, footshape, height, or gender may also cause shoes to wear out too quickly or more slowly. It would be more effectiveto compare the wear of each shoe on each runner. This is a special type of matched pairs design in which eachexperimental unit becomes their own matched pair. Because the matched pair is in fact two different observations
16
www.ck12.org Chapter 1. Planning and Conducting an Experiment or Study
of the same subject, it is called a repeated measures design. Each runner would use shoe A and shoe B for equalperiods of time and then the wear of the shoes for each individual would be compared. Randomization still couldbe important. Let’s say that we have each runner use each shoe type for a period of 3 months. It is possible that theweather during those three months could influence that amount of wear on the shoe. To minimize this, we wouldrandomly assign half the subjects shoe A, with the other half receiving shoe B and then switch after the first 3 months.
Lesson Summary
The important elements of a statistical experiment are randomness, imposed treatments, and replication. Theseelements are the only effective method for establishing meaningful cause and effect relationships. An experimentattempts to isolate, or control other potential variables to may contribute to changes in the response variable. Ifthese other variables are known quantities but are difficult, or impossible, to distinguish from the other explanatoryvariables, they are called confounding variables. If there is an additional explanatory variable affecting the responsevariable that was not considered in an experiment, it is called a lurking variable. A treatment is the term used torefer to a condition imposed on the subjects in an experiment. An experiment will have at least two treatments. Whentrying to test the effectiveness of a particular treatment, it is often effective to withhold applying that treatment toa group of randomly chosen subjects. This is called a control group. If the subjects are aware of the conditionsof their treatment, they may have preconceived expectations that could affect the outcome. Especially in medicalexperiments, the psychological effect of believing you are receiving a potentially effective treatment can lead todifferent results. This phenomenon is called the placebo effect. When the participants in a clinical trial are led tobelieve they are receiving the new treatment, when in fact they are not, it is called a placebo. If the participants arenot aware of the treatment they are receiving, it is called a blind experiment. When neither the participant nor theresearcher are aware of which subjects are receiving the treatment and which subjects are receiving a placebo, it iscalled a double-blind experiment.
Blocking is a technique used to control the potential confounding of variables. It is similar to the idea of stratificationin sampling. In a randomized block design, the researcher creates blocks of subjects that exhibit similar traitswhich might cause different responses to the treatment and then randomly assigns the different treatments withineach block. A matched pairs design is a special type of design when there are two treatments. The researchercreates blocks of size two on some similar characteristic and then randomly assigns one subject from each pair toeach treatment. Repeated measures designs are a special matched pairs experiment in which each subject becomesit’s own matched pair by applying both treatments and comparing the results.
Points to Consider
a. What are some other ways that researchers design more complicated experiments?b. When one treatment seems to result in a notable difference, how do we know if that difference is statistically
significant?c. How can the selection of samples for an experiment affect the validity of the conclusions?
Review Questions
1. As part of an effort to study the effect of intelligence on survival mechanisms, scientists recently compared agroup of fruit flies intentionally bred for intelligence along with the same species of ordinary flies. When re-leased together in an environment with high competition for food, the ordinary flies survived by a significantly
17
1.2. Experimental Design www.ck12.org
higher percentage than the intelligent flies.
a. Identify the population of interest and the treatments.b. Based on the information given, is this an observational study or an experiment?c. Based on the information given in this problem, can you conclude definitively that intelligence decreases
survival among animals?
2. In order to find out which brand of cola students in your school prefer, you set up an experiment where eachperson will taste the two brands of cola and you will record their preference.
a. How would you characterize the design of this study?b. If you poured each student a small cup from the original bottles, what threat might that pose to your
results? Explain what you would do to avoid this problem and identify the statistical term for yoursolution.
c. Let’s say that one of the two colas leaves a bitter after taste. What threat might this pose to your results?Explain how you could use randomness to solve this problem.
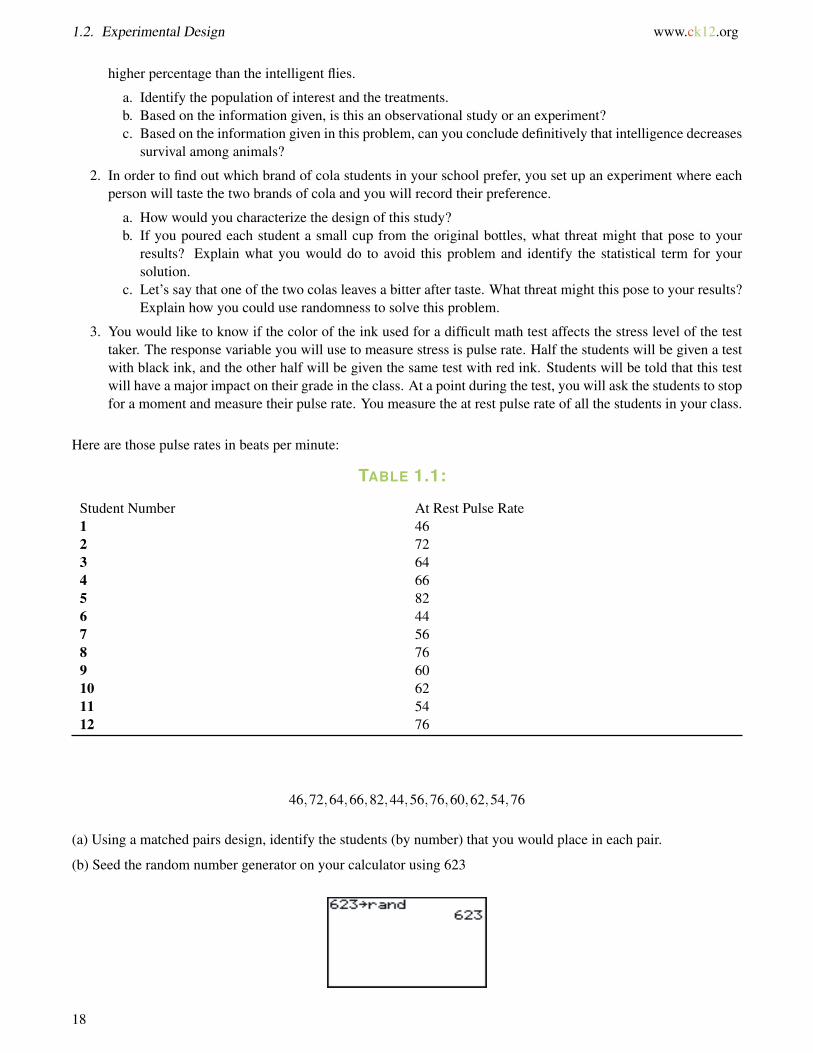
3. You would like to know if the color of the ink used for a difficult math test affects the stress level of the testtaker. The response variable you will use to measure stress is pulse rate. Half the students will be given a testwith black ink, and the other half will be given the same test with red ink. Students will be told that this testwill have a major impact on their grade in the class. At a point during the test, you will ask the students to stopfor a moment and measure their pulse rate. You measure the at rest pulse rate of all the students in your class.
Here are those pulse rates in beats per minute:
TABLE 1.1:
Student Number At Rest Pulse Rate1 462 723 644 665 826 447 568 769 6010 6211 5412 76
46,72,64,66,82,44,56,76,60,62,54,76
(a) Using a matched pairs design, identify the students (by number) that you would place in each pair.
(b) Seed the random number generator on your calculator using 623
18
www.ck12.org Chapter 1. Planning and Conducting an Experiment or Study
Use your calculator to randomly assign each student to a treatment. Explain how you made your assignments.
(c) Identify any potential lurking variables in this experiment.
(d) Explain how you could redesign this experiment as a repeated measures design?
4. A recent British study was attempting to show that a high fat diet was effective in treating epilepsy in children.According to the New York Times, this involved, " . . .145 children ages 2 to 16 who had never tried the diet,who were having at least seven seizures a week and who had failed to respond to at least two anticonvulsantdrugs."1
a. What is the population in this example?b. One group began the diet right away, another group waited three months to start it. In the first group,
38% of the children experienced a 50% reduction in seizure rates, and in the second group, only 6 percentsaw a similar reduction. What information would you need to be able to conclude that this was a validexperiment?
c. Identify the treatment and control groups in this experiment.d. What conclusion could you make from the reported results of this experiment.
5. Researchers want to know how chemically fertilized and treated grass compares to grass using only organicfertilizer. They also believe that the height at which the grass is cut will affect the growth of the lawn. To testthis, grass will be cut at three different heights, 1 inch, 2 inches, and 4 inches. A lawn area of existing healthygrass will be divided up into plots for the experiment. Assume that the soil, sun, and drainage for the testareas is uniform. Explain how you would implement a randomized block design to test the different effects offertilizer and grass height. Draw a diagram that shows the plots and the assigned treatments.
Review Answers
1. a. The population is all fruit flies of this species. The treatment is breeding for intelligence. The othertreatment is really a control group. The second group of flies were not bred for any special quality.
b. By the strict definition, this is an observational study as the subjects (fruit flies) are not randomly assignedto the treatment. A group of fruit flies was selectively bred for intelligence.
c. Because the treatments were not randomly assigned the results are susceptible to lurking variables. It ispossible that some other trait not observed in the population of intelligent fruit flies led to their lowersurvival rate. It is also questionable to generalize the behavior of fruit flies to the larger population of allanimals. We have no guarantee that other animals will not behave differently than fruit flies. Withoutreading the study completely, it is difficult to determine how many of these concerns were addressed bythe scientists performing the study. You can read more at:
http://www.nytimes.com/2008/05/06/science/06dumb.html?ref=science
a. This is a repeated measures design. Each student becomes their own matched pair as they are samplingboth colas.
b. Students may have a preconceived idea of which cola they prefer for many possible reasons. You couldhave the colas already poured into identical unmarked cups, or hide the label of the bottle. This wouldbe an example of a blind experiment.
c. It is possible that the taste of the first cola might affect the taste of the second. In general, the orderin which they taste the colas could affect their perception in a number of ways. To control for this, wecould randomly assign the order in which the colas are sampled. Assign one of the colas to be 1 and theother to be 2, then use your calculator to choose 1 or 2 randomly for each subject. If the student is giventhe two cups and given the option of choosing which one to drink first, we could randomly assign theposition of each cup (right or left).
19
1.2. Experimental Design www.ck12.org
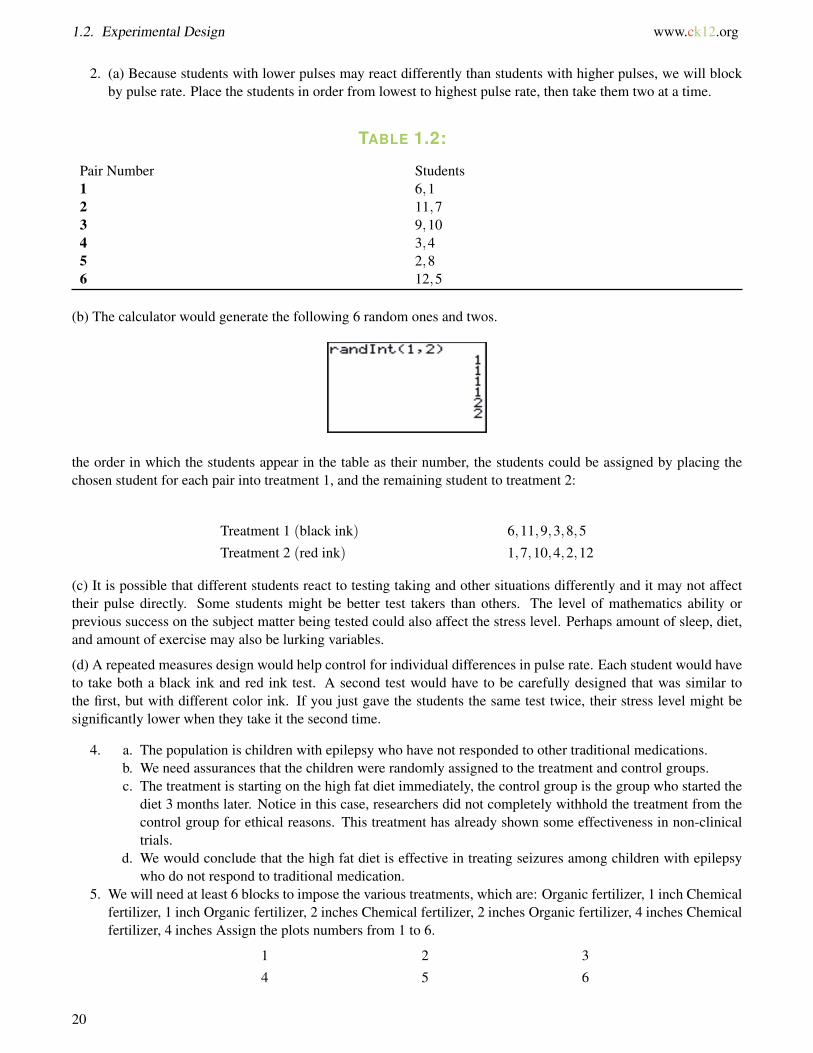
2. (a) Because students with lower pulses may react differently than students with higher pulses, we will blockby pulse rate. Place the students in order from lowest to highest pulse rate, then take them two at a time.
TABLE 1.2:
Pair Number Students1 6,12 11,73 9,104 3,45 2,86 12,5
(b) The calculator would generate the following 6 random ones and twos.
the order in which the students appear in the table as their number, the students could be assigned by placing thechosen student for each pair into treatment 1, and the remaining student to treatment 2:
Treatment 1 (black ink) 6,11,9,3,8,5Treatment 2 (red ink) 1,7,10,4,2,12
(c) It is possible that different students react to testing taking and other situations differently and it may not affecttheir pulse directly. Some students might be better test takers than others. The level of mathematics ability orprevious success on the subject matter being tested could also affect the stress level. Perhaps amount of sleep, diet,and amount of exercise may also be lurking variables.
(d) A repeated measures design would help control for individual differences in pulse rate. Each student would haveto take both a black ink and red ink test. A second test would have to be carefully designed that was similar tothe first, but with different color ink. If you just gave the students the same test twice, their stress level might besignificantly lower when they take it the second time.
4. a. The population is children with epilepsy who have not responded to other traditional medications.b. We need assurances that the children were randomly assigned to the treatment and control groups.c. The treatment is starting on the high fat diet immediately, the control group is the group who started the
diet 3 months later. Notice in this case, researchers did not completely withhold the treatment from thecontrol group for ethical reasons. This treatment has already shown some effectiveness in non-clinicaltrials.
d. We would conclude that the high fat diet is effective in treating seizures among children with epilepsywho do not respond to traditional medication.
5. We will need at least 6 blocks to impose the various treatments, which are: Organic fertilizer, 1 inch Chemicalfertilizer, 1 inch Organic fertilizer, 2 inches Chemical fertilizer, 2 inches Organic fertilizer, 4 inches Chemicalfertilizer, 4 inches Assign the plots numbers from 1 to 6.
1 2 34 5 6
20
www.ck12.org Chapter 1. Planning and Conducting an Experiment or Study
Then randomly generate a number from 1 to 6, without replacement, until all six treatments are assigned toa plot. In this example, the random number generator was seeded with 625, repeated digits were ignored,and the assignments were as follows: fertilizer, 1 inch PLOT 6 Chemical fertilizer, 1 inch PLOT 2 Organicfertilizer, 2 inches PLOT 1 Chemical fertilizer, 2 inches PLOT 5 Organic fertilizer, 4 inches PLOT 4 Chemicalfertilizer, 4 inches PLOT 3
Further reading:
• http://www.nytimes.com/2008/05/06/health/research/06epil.html?ref=health
References
• http://journals.royalsociety.org/content/w260687441pp64w5/• http://www.fhi.no/eway/default.aspx?pid=238&trg=Area_5954&MainLeft_5812=5954:0:&Area_5954=5825:6
8516::0:5956:1:::0:0
Questions
Multiple Choice:
1. A researcher performs an experiment to see if mice can learn their way through a maze better when givena high protein diet and vitamin supplements. She carefully designs and implements a study with randomassignment of the mice into treatment groups and observes that the mice on the special diet and supplementshave significantly lower maze times than those on normal diets. She obtains a second group of mice andperforms the experiment again. This is most appropriately called:
a. Matched pairs designb. Repeated measuresc. Replicationd. Randomized block designe. Double blind experiment
2. Which of the following terms does not apply to experimental design?
a. Randomizationb. Stratificationc. Blockingd. Cause and effect relationshipse. Placebo
3. An exit pollster is given training on how to spot the different types of voters who would typically represent agood cross-section of opinions and political preferences for the population of all voters. This type of samplingis called:
a. Cluster Samplingb. Stratified Samplingc. Judgment Samplingd. Systematic Samplinge. Quota Sampling
21
1.2. Experimental Design www.ck12.org
Use the following scenario to answer questions 4 and 5. A school performs the following procedure to gaininformation about the effectiveness of an agenda book in improving student performance. In September, 100students are selected at random from the school’s roster. The interviewer then asks the selected students ifthey intend to use their agenda book regularly to keep track of their assignments. Once the interviewer has 10students who will use their book, and 10 students who will not, the rest of the students are dismissed. Thosestudents current averages are recorded. At the end of the year. the grades for each group are compared and theagenda book group overall has higher grades than the non-agenda group. The school concludes that using anagenda book increases student performance.
4. Which of the following is true about this situation. The response variable is using an agenda book
a. The explanatory variable is grades.b. This is an experiment because the participants were chosen randomly.c. The school should have stratified by gender.d. This is an observational study because no treatment is imposed.
5. Which of the following is not true about this situation.
a. The school cannot conclude a cause and effect relationship because there is most likely a lurking variablethat is responsible for the differences in grades.
b. This is not an example of a matched pairs design.c. The school can safely conclude that the grade improvement is due to the use of an agenda book.d. Blocking on previous grade performance would help isolate the effects of potential confounding vari-
ables.e. Incorrect response bias could affect the selection of the sample.
Open-Ended Questions
1. During the 2004 presidential election, early exit polling indicated that Democratic candidate John Kerry wasdoing better than expected in some eastern states against incumbent George W. Bush, causing some to evenpredict that he might win the overall election. These results proved to be incorrect. Again in the 2008 NewHampshire Democratic primary, pre-election polling showed Senator Barack Obama winning the primary. Itwas in fact Senator Hillary Clinton who comfortably won the contest. These problems with exit polling leadto many reactions ranging from misunderstanding the science of polling, to mistrust of all statistical data, tovast conspiracy theories. The Daily Show from Comedy Central did a parody of problems with polling. Watchthe clip online at the following link. Please note that while “bleeped out,” there is language in this clip thatsome may consider inappropriate or offensive. http://www.thedailyshow.com/video/index.jhtml?videoId=156231&title=team-daily-polls What type of bias is the primary focus of this non-scientific, yet humorous lookat polling?
2. Environmental Sex Determination is a scientific phenomenon observed in many reptiles in which air tempera-ture when the eggs are growing tends to affect the proportion of eggs that develop into male or female animals.This has implications for attempts to breed endangered species as an increased number of females can lead tohigher birth rates when attempting to repopulate certain areas. Researchers in the Galapagos wanted to see ifthe Galapagos Giant Tortoise eggs were also prone to this effect. The original study incubated eggs at threedifferent temperatures, 25.50 C, 29.50 C and 33.50 C. Let’s say you had 9 female tortoises and there was noreason to believe that there was a significant difference in eggs from these tortoises.
a. Explain how you would use a randomized design to assign the treatments and carry out the experiment.b. If the nine tortoises were composed of three tortoises each of three different species, how would you
design the experiment differently if you thought that there might be variations in response to the treat-ments?
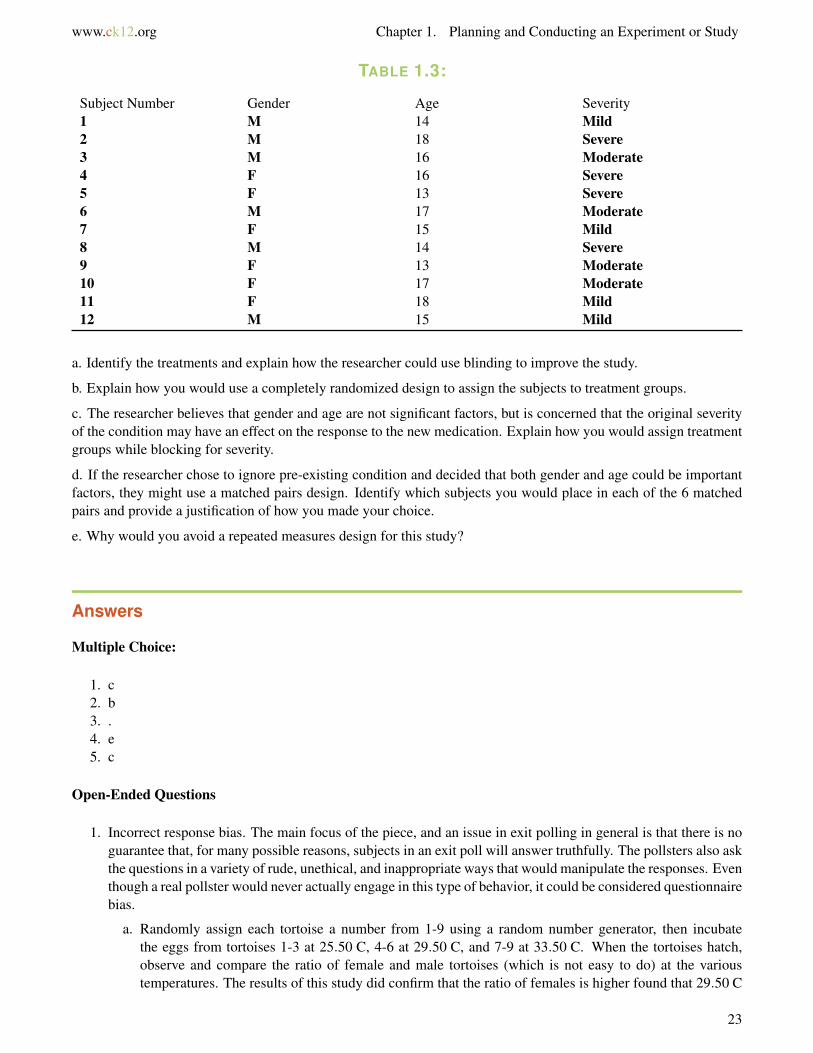
3. A researcher who wants to test a new acne medication obtains a group of volunteers who are teenagerstaking the same acne medication to participate in a study comparing the new medication with the standardprescription. There are 12 participants in the study. Data on their gender, age and the severity of their conditionis given in the following table:
22
www.ck12.org Chapter 1. Planning and Conducting an Experiment or Study
TABLE 1.3:
Subject Number Gender Age Severity1 M 14 Mild2 M 18 Severe3 M 16 Moderate4 F 16 Severe5 F 13 Severe6 M 17 Moderate7 F 15 Mild8 M 14 Severe9 F 13 Moderate10 F 17 Moderate11 F 18 Mild12 M 15 Mild
a. Identify the treatments and explain how the researcher could use blinding to improve the study.
b. Explain how you would use a completely randomized design to assign the subjects to treatment groups.
c. The researcher believes that gender and age are not significant factors, but is concerned that the original severityof the condition may have an effect on the response to the new medication. Explain how you would assign treatmentgroups while blocking for severity.
d. If the researcher chose to ignore pre-existing condition and decided that both gender and age could be importantfactors, they might use a matched pairs design. Identify which subjects you would place in each of the 6 matchedpairs and provide a justification of how you made your choice.
e. Why would you avoid a repeated measures design for this study?
Answers
Multiple Choice:
1. c2. b3. .4. e5. c
Open-Ended Questions
1. Incorrect response bias. The main focus of the piece, and an issue in exit polling in general is that there is noguarantee that, for many possible reasons, subjects in an exit poll will answer truthfully. The pollsters also askthe questions in a variety of rude, unethical, and inappropriate ways that would manipulate the responses. Eventhough a real pollster would never actually engage in this type of behavior, it could be considered questionnairebias.
a. Randomly assign each tortoise a number from 1-9 using a random number generator, then incubatethe eggs from tortoises 1-3 at 25.50 C, 4-6 at 29.50 C, and 7-9 at 33.50 C. When the tortoises hatch,observe and compare the ratio of female and male tortoises (which is not easy to do) at the varioustemperatures. The results of this study did confirm that the ratio of females is higher found that 29.50 C
23

1.2. Experimental Design www.ck12.org
is the optimum temperature for a higher female ratio and good survival rate, and 280 C is the besttemperature to insure more males (source: Restoring the Tortoise Dynasty, Godfrey Merlin, CharlesDarwin Foundation, 1999.)
b. This would be a blocking design. We would block on species and temperature, so there would be 9blocks, 3 of each species, and three at each incubation temperature. There really would not be anyrandomization in this design.
2. (a) There are two treatments, the new medication, and the existing medication. All the subjects could be toldthat they were receiving a new treatment, and then only some would be given the new treatment and the restwould be given their original medication. The resulting differences in skin condition between the two groupswould be compared. (b) You could assign the subjects a different numbering from 1 to 12, but this timegenerating the assignments at random. Then subjects 1-6 would be given the new treatment, and subjects 7-12would be given the original medication. Compare the results. (c) In blocking for condition, each block shouldbe homogeneous for that trait. So, you would create three blocks: all 4 mild subjects, all 4 moderate subjects,and all 4 severe subjects. Then, within each block, randomly assign two subjects to receive the new treatment,and two to receive the original. Compare the results.
TABLE 1.4:
Pair Number Gender Age1 F 131 F 132 F 152 F 163 F 173 F 184 M 144 M 145 M 155 M 166 M 176 M 18
Place the females in chronological order, then group the two youngest, the next two, and the last two. Repeat thesame procedure with the males. This way we have pairs that are similar in both age and gender. One of the subjectswould be chosen at random for the new treatment and the other would receive the traditional medication.
(d) Repeated measures are not a good idea with medication studies as it would be hard to distinguish if the effectsfrom the repeated treatment are not in fact from still occurring from the presence of the first medication that wasgiven.
24