Embed Size (px)
Citation preview
Planetary Boundary Layer (PBL) Retrieval
from Space: Challenges and Imperatives
Joseph A. Santanello, Jr.
NASA-GSFC
Hydrological Sciences Laboratory
Earth Observation for Water Cycle Science 2015 ESA-ESRIN, Italy 20 October 2015
Outline
L-A Coupling
PBL Role in Water/Energy Cycle Science
Ground-based PBL Observing Systems
Satellite PBL Retrieval: Status and Outlook
Motivation
The Planetary Boundary Layer (PBL) is a critical component of Earth System Science:
• There is an established and growing need for routine PBL measurements over land for a range of applications:
– Hydrology
– Clouds & Convection
– Pollution & Chemistry
– Land-Atmosphere Interactions & Coupling
– PBL & LES Model Development
• Each is modulated by PBL structure, growth, and feedback processes such as entrainment.
3
Weather & Climate and Support of Extremes
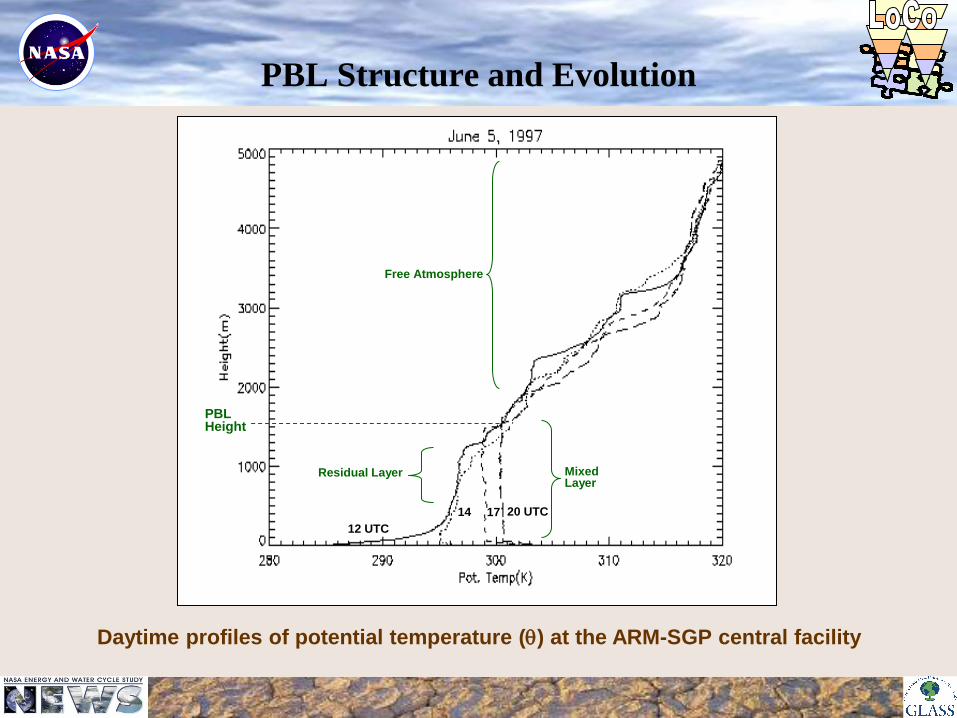
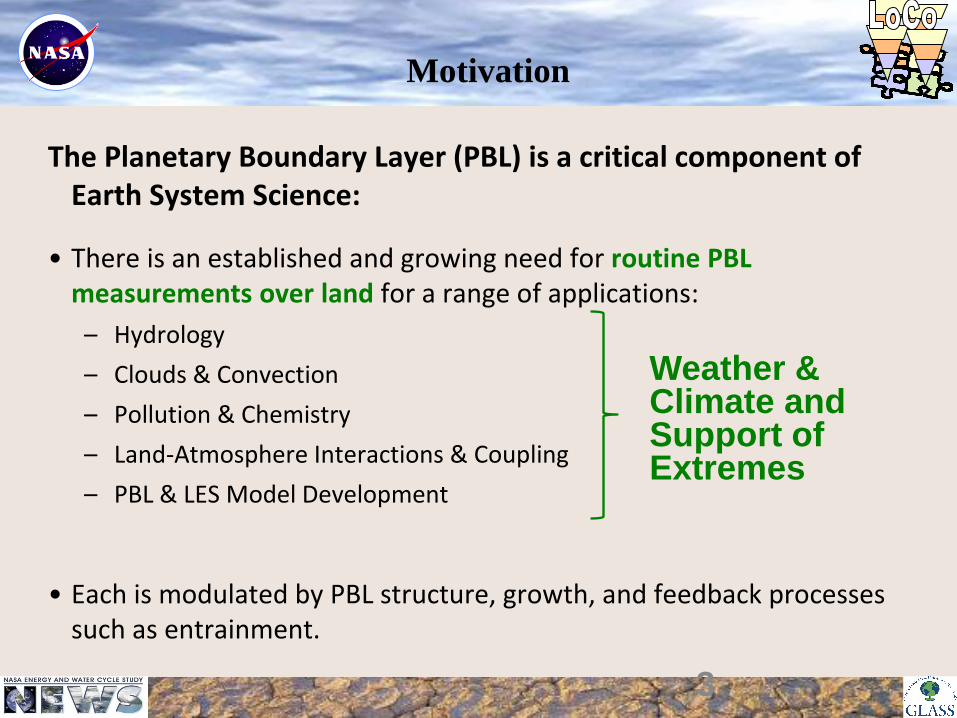
PBL Structure and Evolution
PBL Height
12 UTC
20 UTC
Mixed Layer
Free Atmosphere
Residual Layer
17 14
Daytime profiles of potential temperature (q) at the ARM-SGP central facility
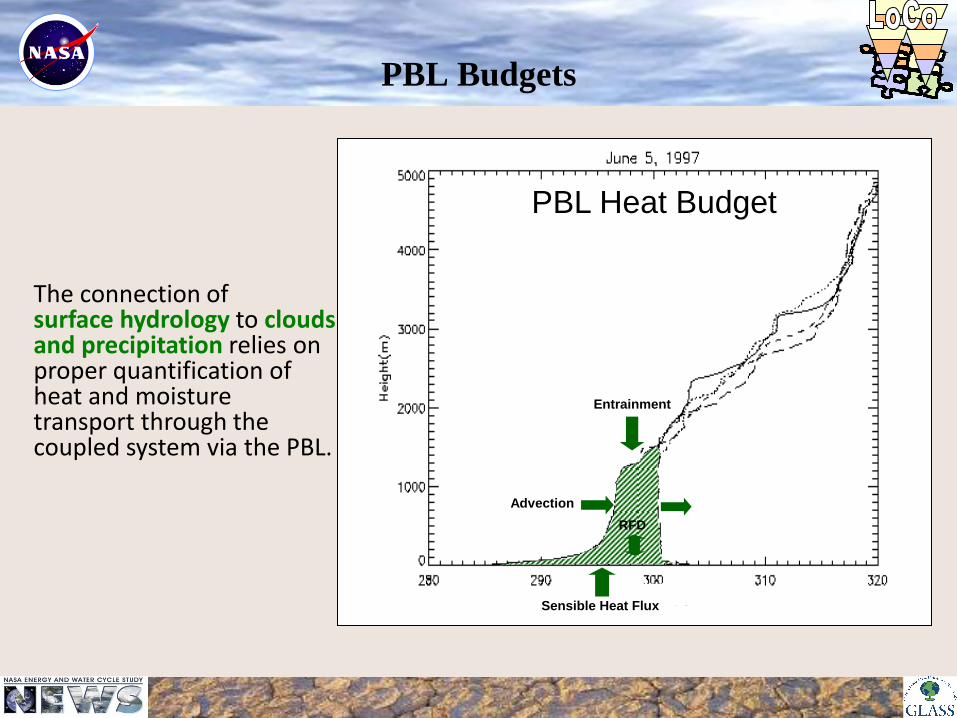
PBL Budgets
20
17 14
Entrainment
Advection
RFD
The connection of surface hydrology to clouds and precipitation relies on proper quantification of heat and moisture transport through the coupled system via the PBL.
PBL Heat Budget
Sensible Heat Flux
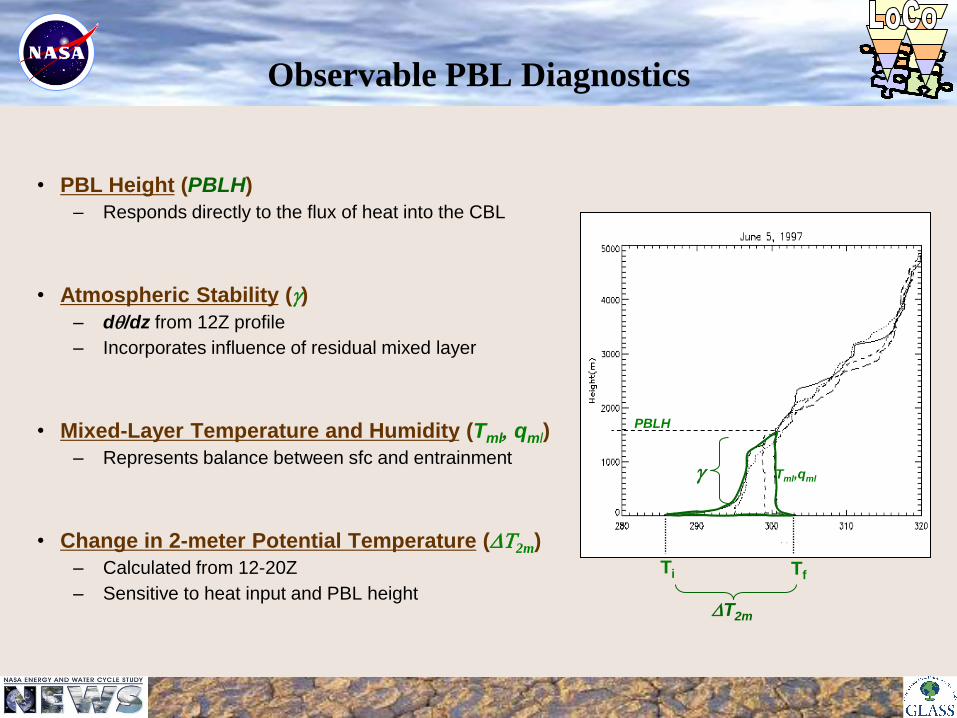
Observable PBL Diagnostics
• PBL Height (PBLH)
– Responds directly to the flux of heat into the CBL
• Atmospheric Stability (g)
– dq/dz from 12Z profile
– Incorporates influence of residual mixed layer
• Mixed-Layer Temperature and Humidity (Tml, qml)
– Represents balance between sfc and entrainment
• Change in 2-meter Potential Temperature (DT2m)
– Calculated from 12-20Z
– Sensitive to heat input and PBL height
g
PBLH
Ti Tf
DT2m
Tml,qml
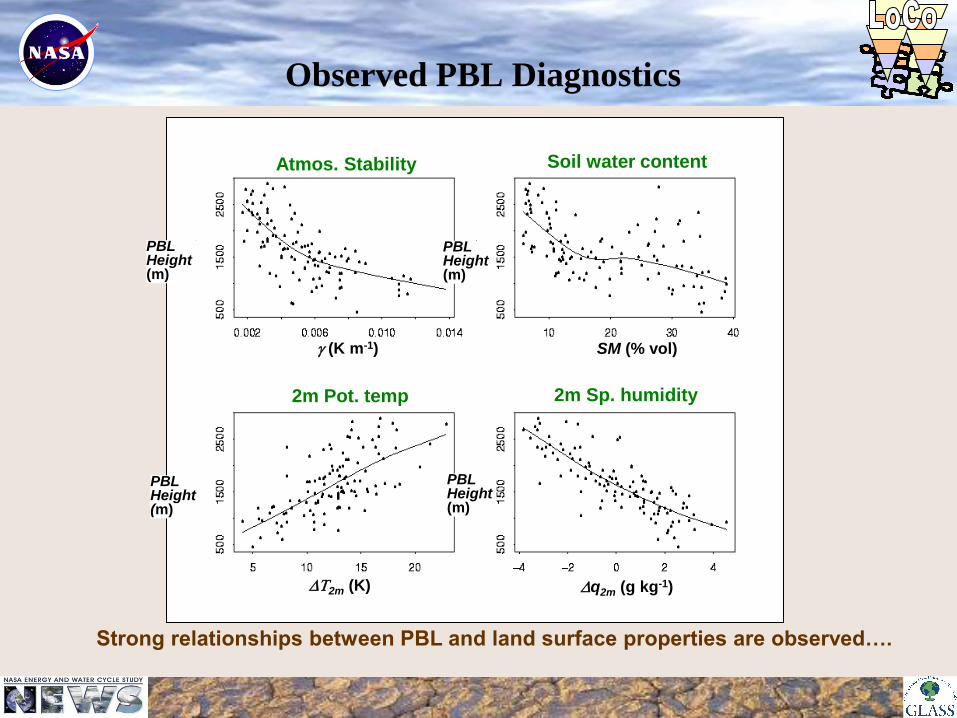
SM (% vol) g (K m-1)
DT2m (K) Dq2m (g kg-1)
PBL Height (m)
PBL Height (m)
PBL Height (m)
PBL Height (m)
Atmos. Stability Soil water content
2m Pot. temp 2m Sp. humidity
Observed PBL Diagnostics
Strong relationships between PBL and land surface properties are observed….
Outline
L-A Coupling
PBL Role in Water Cycle Science
Ground-based PBL Observing Systems
Satellite PBL Retrieval: Status and Outlook
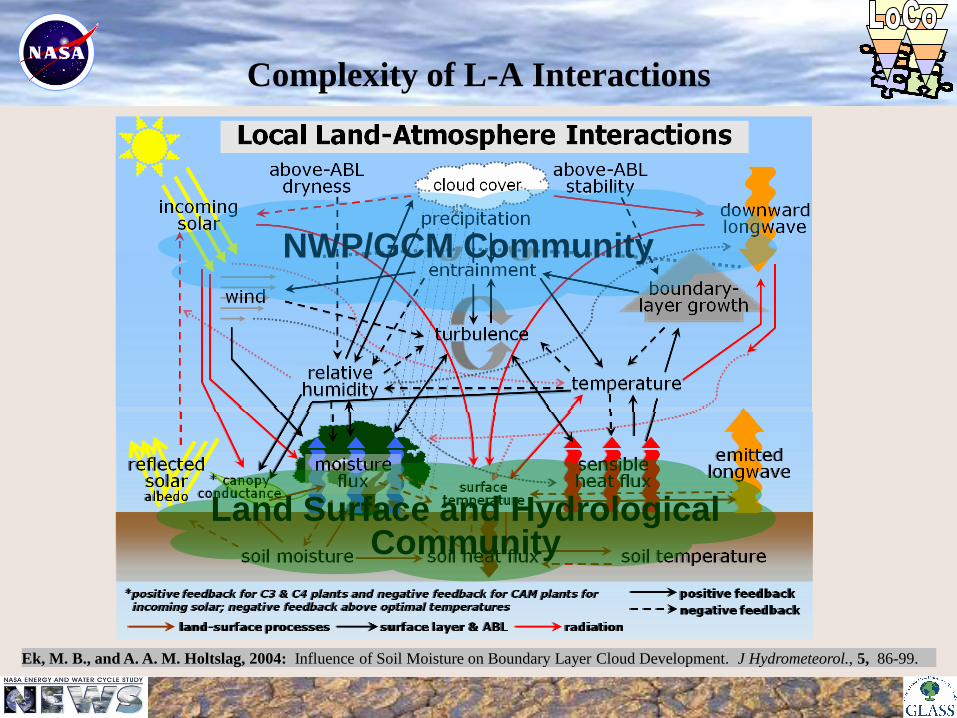
Complexity of L-A Interactions
Ek, M. B., and A. A. M. Holtslag, 2004: Influence of Soil Moisture on Boundary Layer Cloud Development. J Hydrometeorol., 5, 86-99.
Land Surface and Hydrological Community
NWP/GCM Community
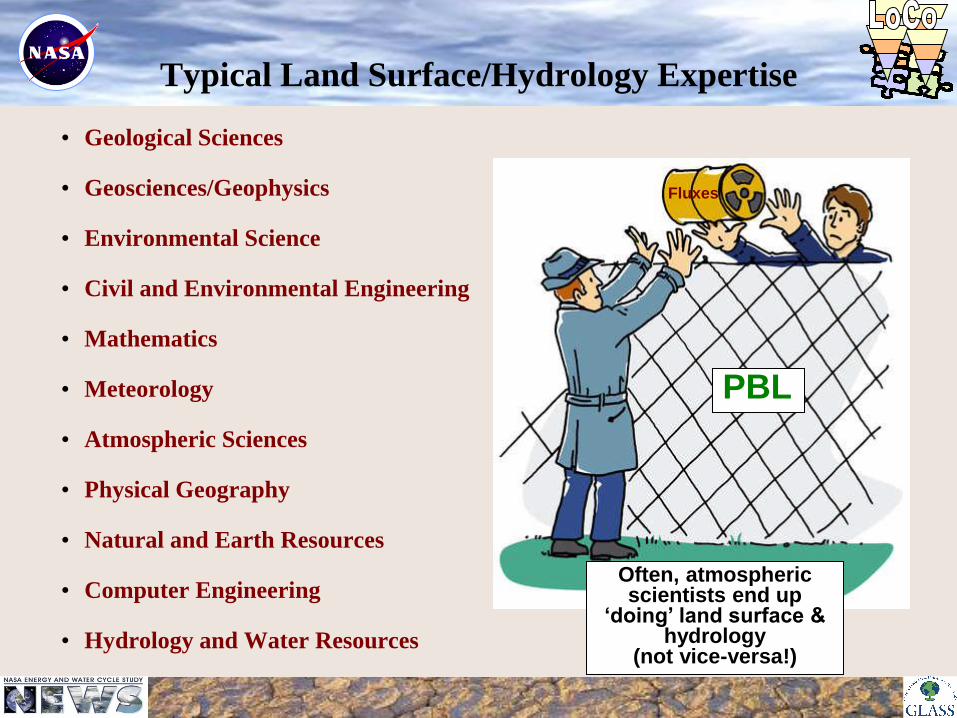
Typical Land Surface/Hydrology Expertise
• Geological Sciences
• Geosciences/Geophysics
• Environmental Science
• Civil and Environmental Engineering
• Mathematics
• Meteorology
• Atmospheric Sciences
• Physical Geography
• Natural and Earth Resources
• Computer Engineering
• Hydrology and Water Resources
Fluxes
Often, atmospheric scientists end up
‘doing’ land surface & hydrology
(not vice-versa!)
PBL
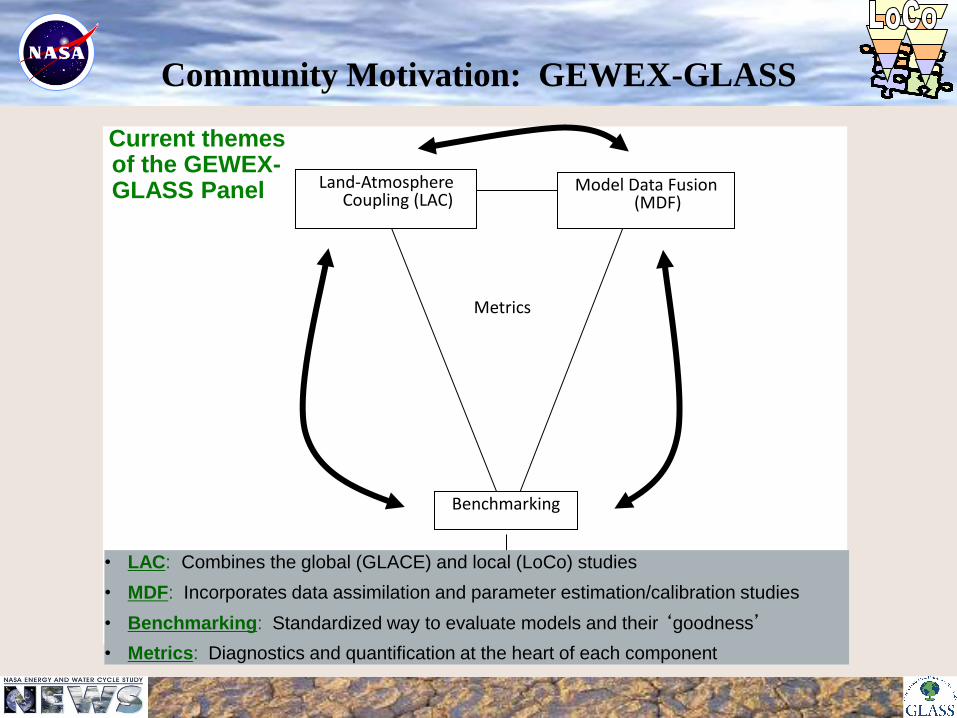
Community Motivation: GEWEX-GLASS
GLACE
LoCo
Benchmarking
Land-Atmosphere Coupling (LAC)
Model Data Fusion (MDF)
Metrics
• LAC: Combines the global (GLACE) and local (LoCo) studies
• MDF: Incorporates data assimilation and parameter estimation/calibration studies
• Benchmarking: Standardized way to evaluate models and their ‘goodness’
• Metrics: Diagnostics and quantification at the heart of each component
Current themes of the GEWEX- GLASS Panel
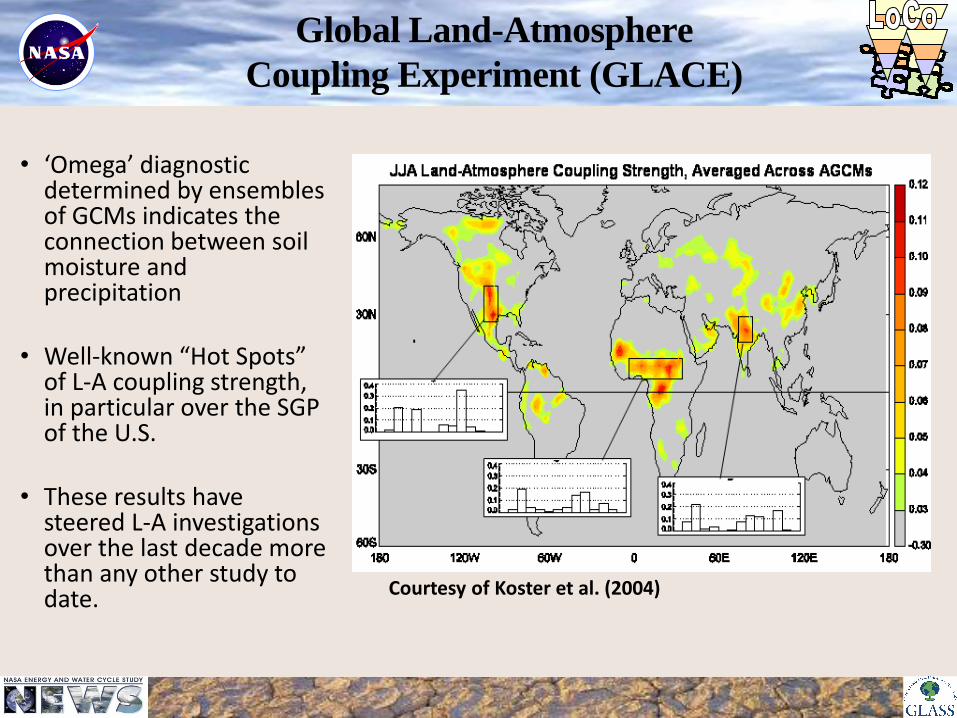
Global Land-Atmosphere
Coupling Experiment (GLACE)
• ‘Omega’ diagnostic determined by ensembles of GCMs indicates the connection between soil moisture and precipitation
• Well-known “Hot Spots” of L-A coupling strength, in particular over the SGP of the U.S.
• These results have steered L-A investigations over the last decade more than any other study to date.
Courtesy of Koster et al. (2004)
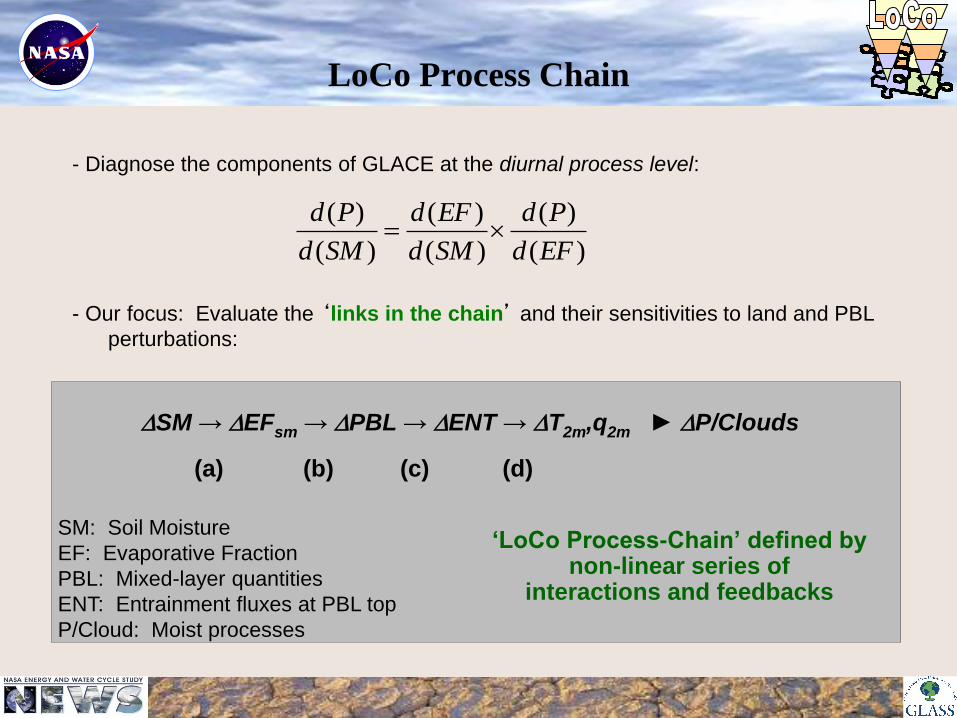
LoCo Process Chain
- Diagnose the components of GLACE at the diurnal process level:
- Our focus: Evaluate the ‘links in the chain’ and their sensitivities to land and PBL
perturbations:
)(
)(
)(
)(
)(
)(
EFd
Pd
SMd
EFd
SMd
Pd
DSM → DEFsm → DPBL → DENT → DT2m,q2m ► DP/Clouds
(a) (b) (c) (d)
SM: Soil Moisture
EF: Evaporative Fraction
PBL: Mixed-layer quantities
ENT: Entrainment fluxes at PBL top
P/Cloud: Moist processes
‘LoCo Process-Chain’ defined by non-linear series of
interactions and feedbacks
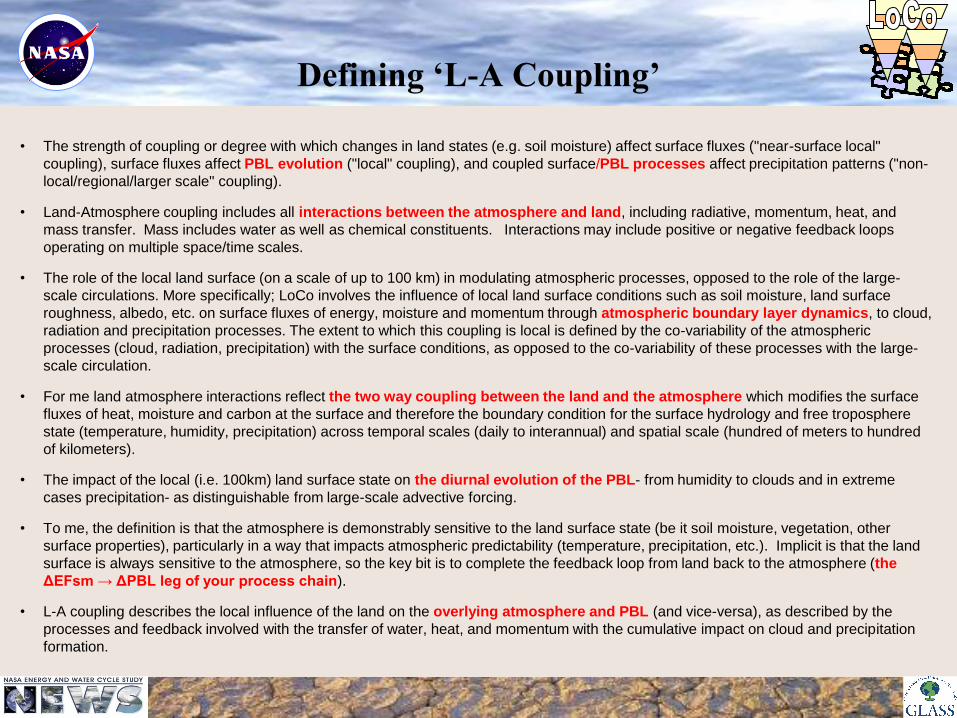
Defining ‘L-A Coupling’
• The strength of coupling or degree with which changes in land states (e.g. soil moisture) affect surface fluxes ("near-surface local"
coupling), surface fluxes affect PBL evolution ("local" coupling), and coupled surface/PBL processes affect precipitation patterns ("non-
local/regional/larger scale" coupling).
• Land-Atmosphere coupling includes all interactions between the atmosphere and land, including radiative, momentum, heat, and
mass transfer. Mass includes water as well as chemical constituents. Interactions may include positive or negative feedback loops
operating on multiple space/time scales.
• The role of the local land surface (on a scale of up to 100 km) in modulating atmospheric processes, opposed to the role of the large-
scale circulations. More specifically; LoCo involves the influence of local land surface conditions such as soil moisture, land surface
roughness, albedo, etc. on surface fluxes of energy, moisture and momentum through atmospheric boundary layer dynamics, to cloud,
radiation and precipitation processes. The extent to which this coupling is local is defined by the co-variability of the atmospheric
processes (cloud, radiation, precipitation) with the surface conditions, as opposed to the co-variability of these processes with the large-
scale circulation.
• For me land atmosphere interactions reflect the two way coupling between the land and the atmosphere which modifies the surface
fluxes of heat, moisture and carbon at the surface and therefore the boundary condition for the surface hydrology and free troposphere
state (temperature, humidity, precipitation) across temporal scales (daily to interannual) and spatial scale (hundred of meters to hundred
of kilometers).
• The impact of the local (i.e. 100km) land surface state on the diurnal evolution of the PBL- from humidity to clouds and in extreme
cases precipitation- as distinguishable from large-scale advective forcing.
• To me, the definition is that the atmosphere is demonstrably sensitive to the land surface state (be it soil moisture, vegetation, other
surface properties), particularly in a way that impacts atmospheric predictability (temperature, precipitation, etc.). Implicit is that the land
surface is always sensitive to the atmosphere, so the key bit is to complete the feedback loop from land back to the atmosphere (the
ΔEFsm → ΔPBL leg of your process chain).
• L-A coupling describes the local influence of the land on the overlying atmosphere and PBL (and vice-versa), as described by the
processes and feedback involved with the transfer of water, heat, and momentum with the cumulative impact on cloud and precipitation
formation.
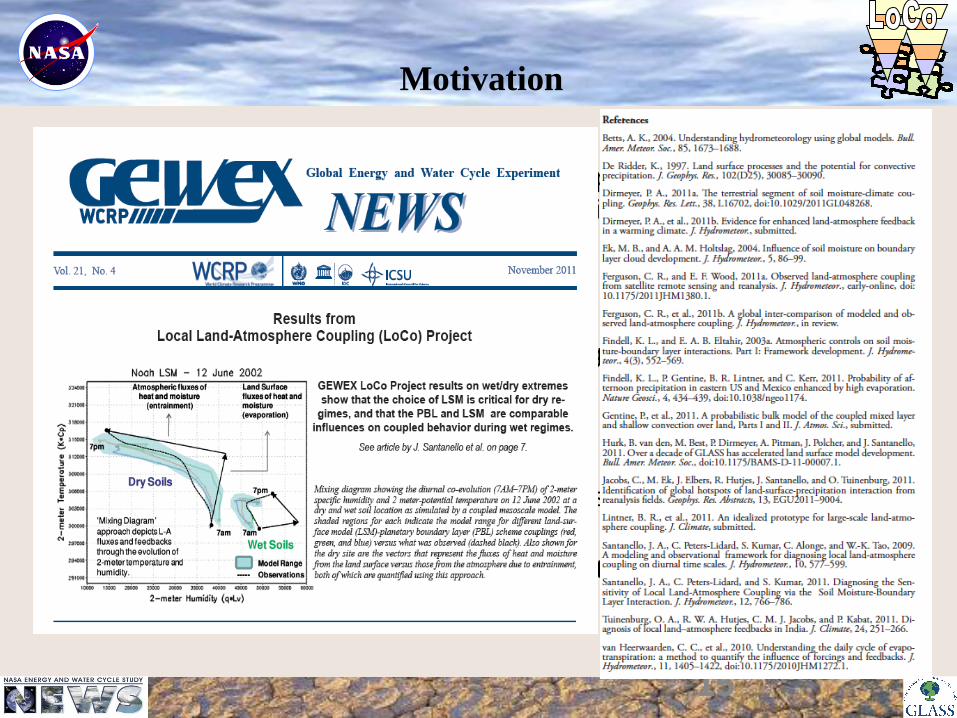
Motivation
•The GLASS LoCo WG has made substantial progress in developing
specific diagnostic approaches to quantify L-A interactions in coupled
models.
•GEWEX Newsletter (Nov. 2011): contributing parties, papers, models,
and diagnostics.
•We now have a substantial collection of assets to bring to bear to study
LoCo in terms of:
a) LoCo diagnostics and model applications
b) Dataset needs and production
15
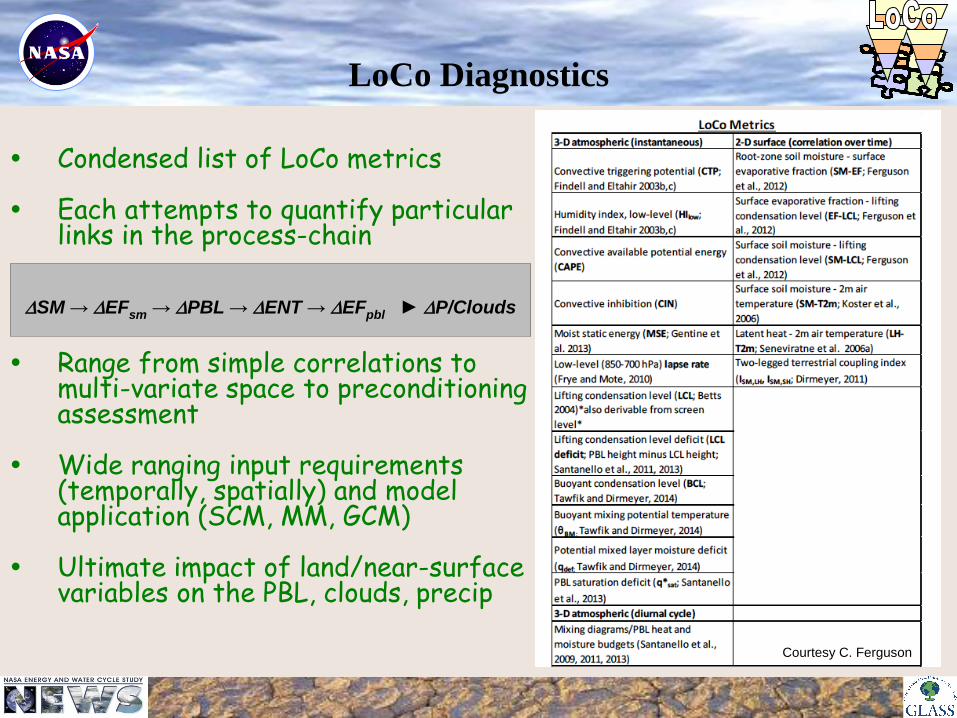
LoCo Diagnostics
DSM → DEFsm → DPBL → DENT → DEFpbl ► DP/Clouds
Condensed list of LoCo metrics
Each attempts to quantify particular links in the process-chain
Range from simple correlations to multi-variate space to preconditioning assessment
Wide ranging input requirements (temporally, spatially) and model application (SCM, MM, GCM)
Ultimate impact of land/near-surface variables on the PBL, clouds, precip Courtesy C. Ferguson
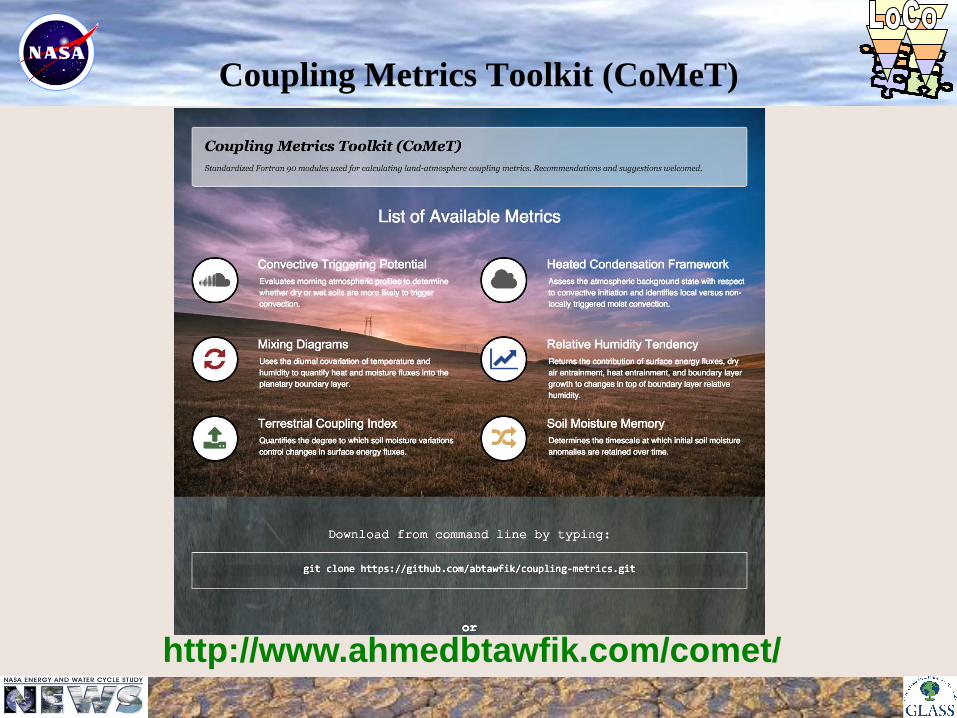
Coupling Metrics Toolkit (CoMeT)
http://www.ahmedbtawfik.com/comet/
Outline
L-A Coupling
PBL Role in Water Cycle Science
Ground-based PBL Observing Systems
Satellite PBL Retrieval: Status and Outlook
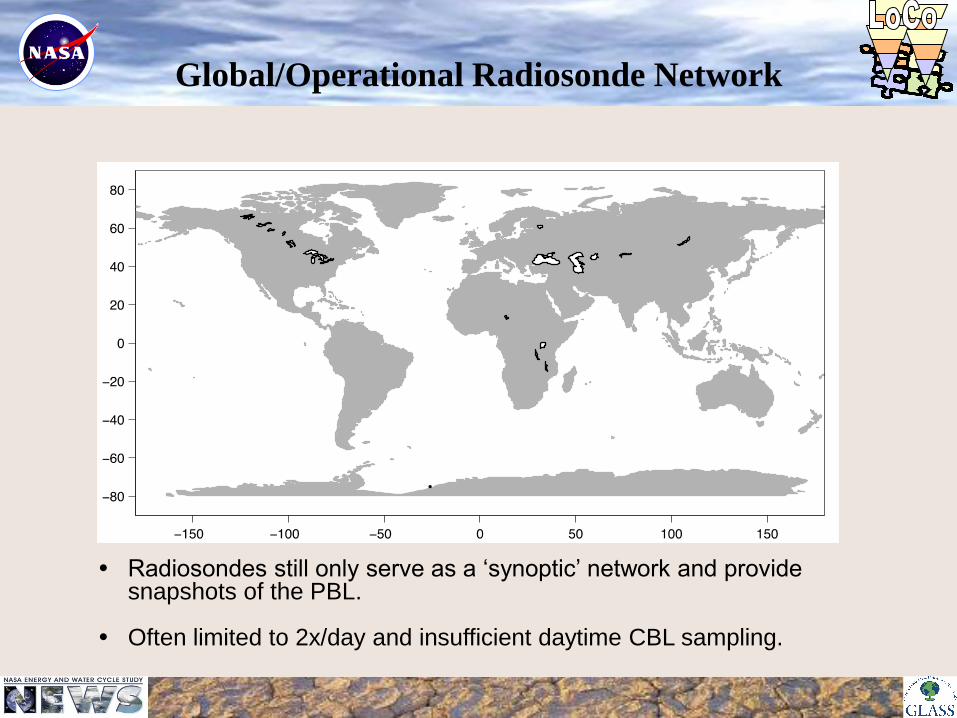
Global/Operational Radiosonde Network
Radiosondes still only serve as a ‘synoptic’ network and provide snapshots of the PBL.
Often limited to 2x/day and insufficient daytime CBL sampling.
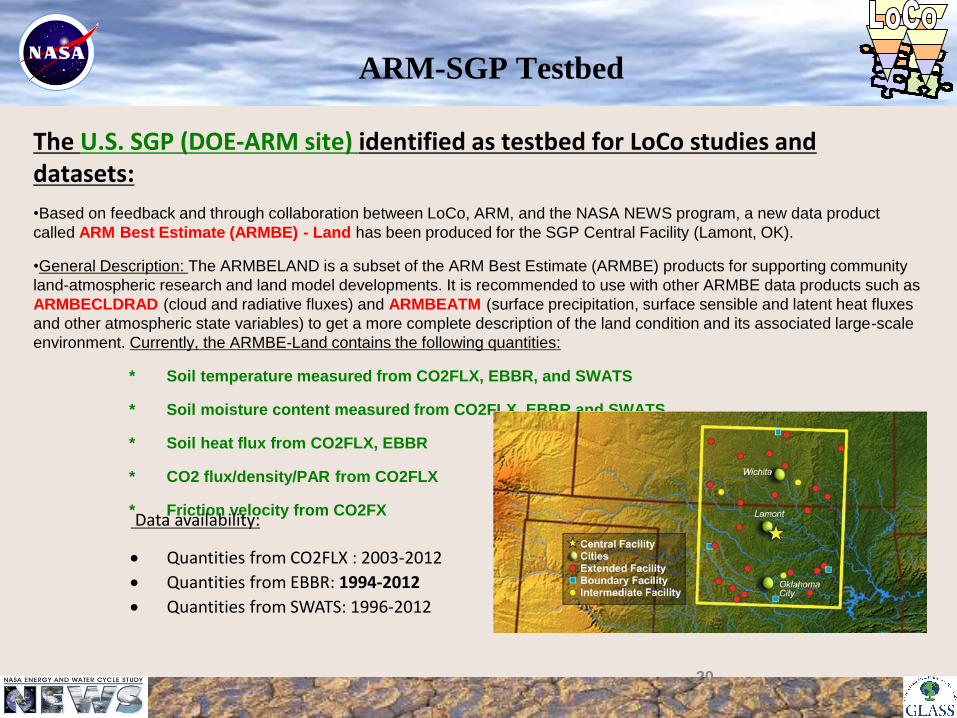
The U.S. SGP (DOE-ARM site) identified as testbed for LoCo studies and datasets:
•Based on feedback and through collaboration between LoCo, ARM, and the NASA NEWS program, a new data product
called ARM Best Estimate (ARMBE) - Land has been produced for the SGP Central Facility (Lamont, OK).
•General Description: The ARMBELAND is a subset of the ARM Best Estimate (ARMBE) products for supporting community
land-atmospheric research and land model developments. It is recommended to use with other ARMBE data products such as
ARMBECLDRAD (cloud and radiative fluxes) and ARMBEATM (surface precipitation, surface sensible and latent heat fluxes
and other atmospheric state variables) to get a more complete description of the land condition and its associated large-scale
environment. Currently, the ARMBE-Land contains the following quantities:
* Soil temperature measured from CO2FLX, EBBR, and SWATS
* Soil moisture content measured from CO2FLX, EBBR and SWATS
* Soil heat flux from CO2FLX, EBBR
* CO2 flux/density/PAR from CO2FLX
* Friction velocity from CO2FX
20
Data availability:
Quantities from CO2FLX : 2003-2012
Quantities from EBBR: 1994-2012
Quantities from SWATS: 1996-2012
ARM-SGP Testbed
Ground-based PBL Retrieval
21
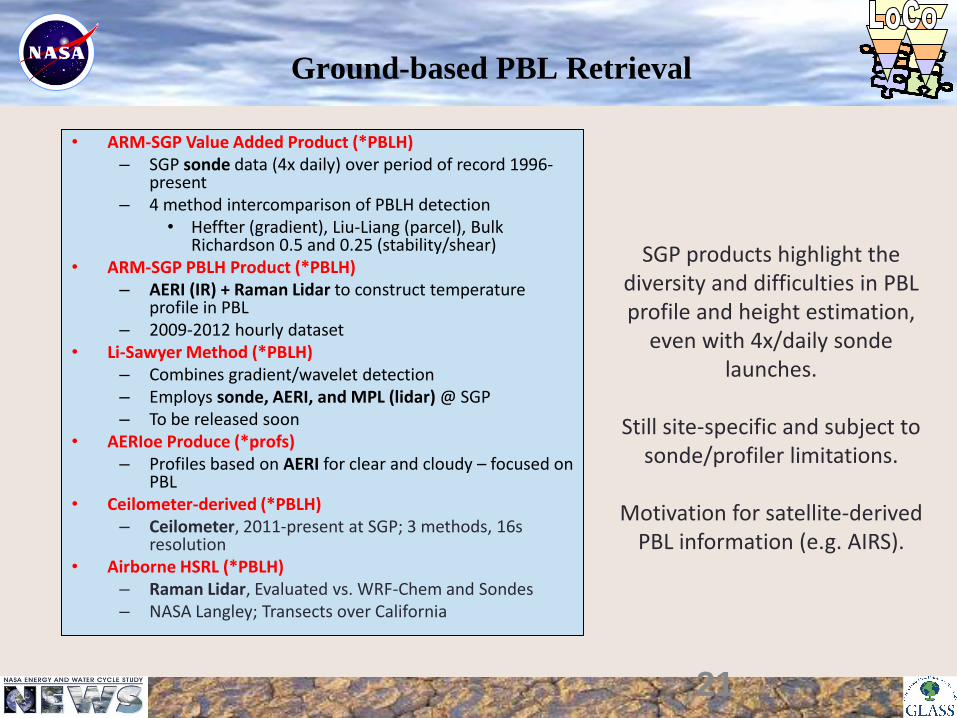
• ARM-SGP Value Added Product (*PBLH) – SGP sonde data (4x daily) over period of record 1996-
present – 4 method intercomparison of PBLH detection
• Heffter (gradient), Liu-Liang (parcel), Bulk Richardson 0.5 and 0.25 (stability/shear)
• ARM-SGP PBLH Product (*PBLH) – AERI (IR) + Raman Lidar to construct temperature
profile in PBL – 2009-2012 hourly dataset
• Li-Sawyer Method (*PBLH) – Combines gradient/wavelet detection – Employs sonde, AERI, and MPL (lidar) @ SGP – To be released soon
• AERIoe Produce (*profs) – Profiles based on AERI for clear and cloudy – focused on
PBL • Ceilometer-derived (*PBLH)
– Ceilometer, 2011-present at SGP; 3 methods, 16s resolution
• Airborne HSRL (*PBLH) – Raman Lidar, Evaluated vs. WRF-Chem and Sondes – NASA Langley; Transects over California
SGP products highlight the diversity and difficulties in PBL profile and height estimation,
even with 4x/daily sonde launches.
Still site-specific and subject to
sonde/profiler limitations.
Motivation for satellite-derived PBL information (e.g. AIRS).
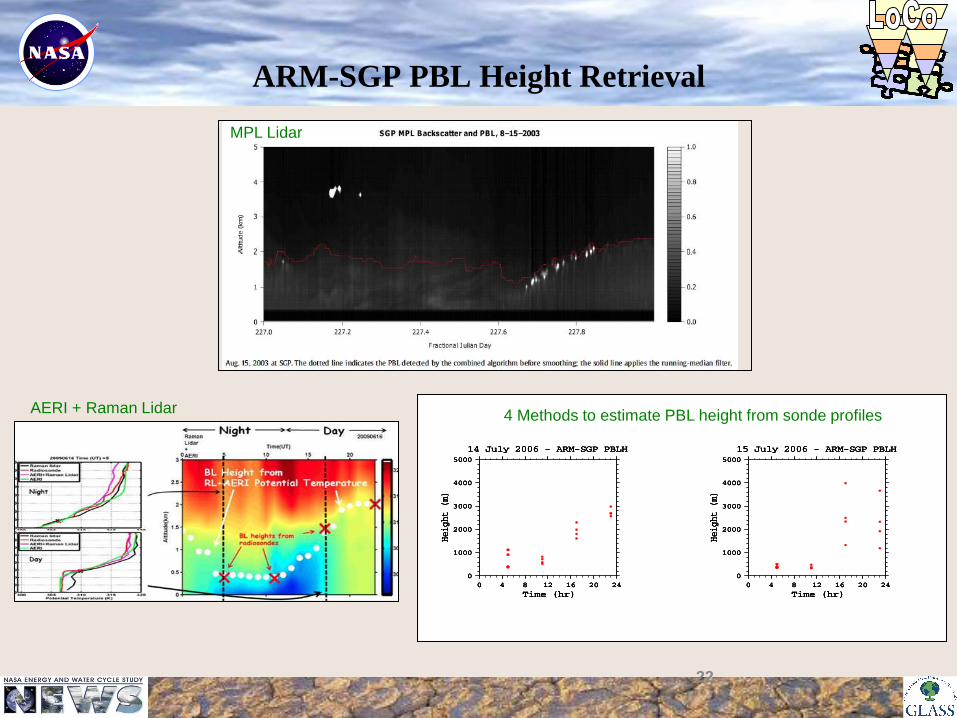
ARM-SGP PBL Height Retrieval
22
4 Methods to estimate PBL height from sonde profiles AERI + Raman Lidar
MPL Lidar
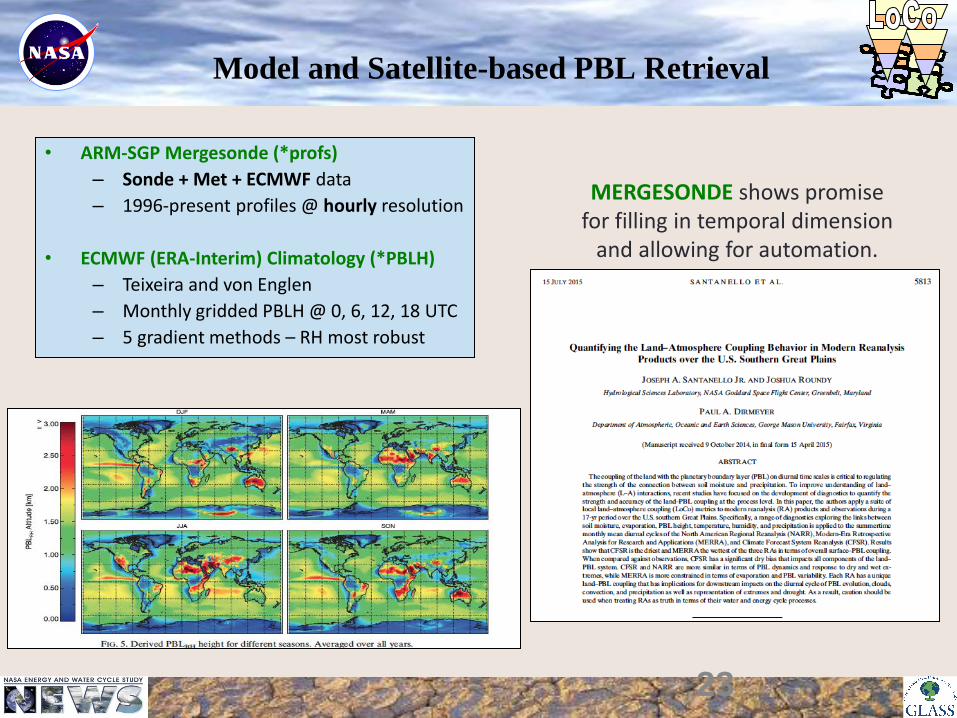
Model and Satellite-based PBL Retrieval
23
• ARM-SGP Mergesonde (*profs)
– Sonde + Met + ECMWF data
– 1996-present profiles @ hourly resolution
• ECMWF (ERA-Interim) Climatology (*PBLH)
– Teixeira and von Englen
– Monthly gridded PBLH @ 0, 6, 12, 18 UTC
– 5 gradient methods – RH most robust
MERGESONDE shows promise
for filling in temporal dimension and allowing for automation.
Outline
L-A Coupling
PBL Role in Water Cycle Science
Ground-based PBL Observing Systems
Satellite PBL Retrieval: Status and Outlook
Satellite Monitoring of Earth System
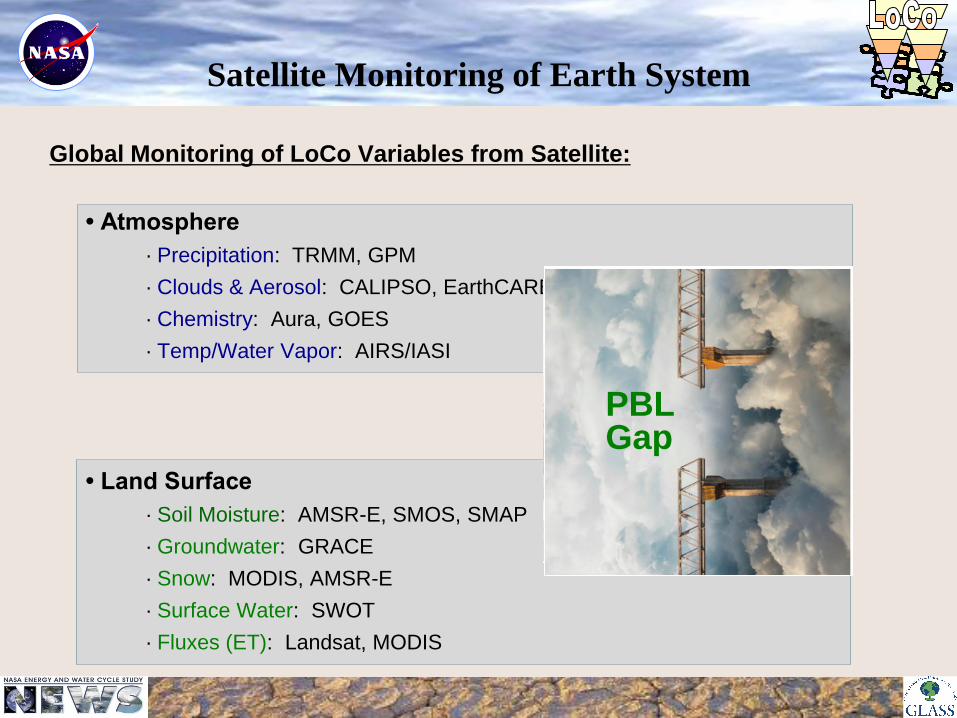
Global Monitoring of LoCo Variables from Satellite:
• Atmosphere
· Precipitation: TRMM, GPM
· Clouds & Aerosol: CALIPSO, EarthCARE
· Chemistry: Aura, GOES
· Temp/Water Vapor: AIRS/IASI
• Land Surface
· Soil Moisture: AMSR-E, SMOS, SMAP
· Groundwater: GRACE
· Snow: MODIS, AMSR-E
· Surface Water: SWOT
· Fluxes (ET): Landsat, MODIS
PBL Gap
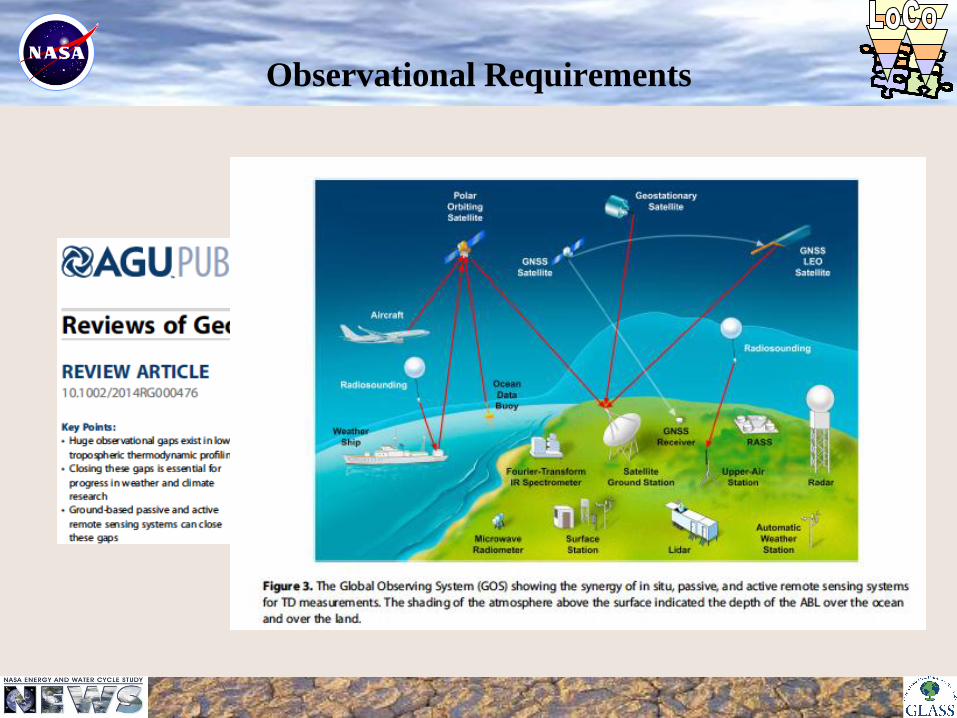
Observational Requirements
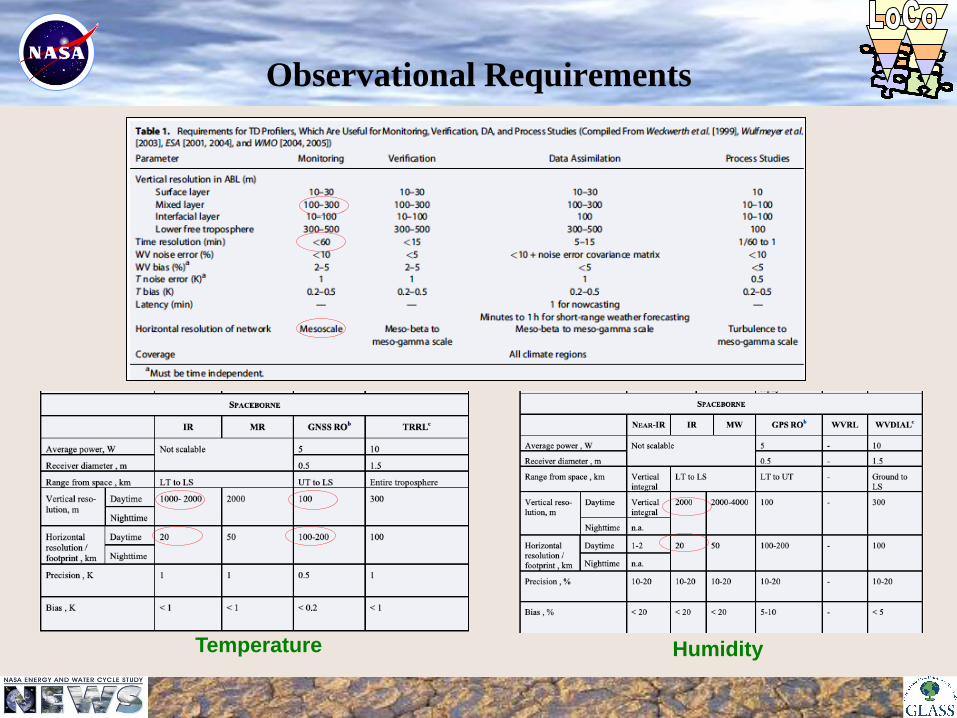
Observational Requirements
Temperature Humidity
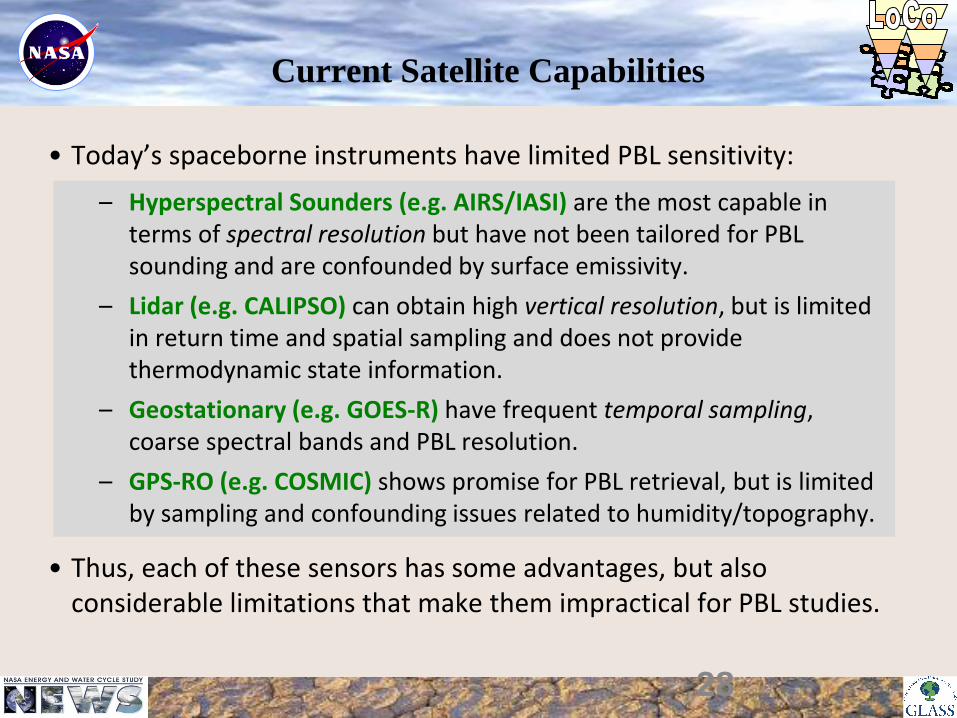
Current Satellite Capabilities
• Today’s spaceborne instruments have limited PBL sensitivity:
– Hyperspectral Sounders (e.g. AIRS/IASI) are the most capable in term spectral resolution but have not been tailored for PBL sounding and are confounded by surface emissivity.
– Lidar (e.g. CALIPSO) can obtain high vertical resolution, but is limited in return time and spatial sampling and does not provide thermodynamic state information.
– Geostationary (e.g. GOES-R) have frequent temporal sampling, coarse spectral bands and PBL resolution.
– GPS-RO (e.g. COSMIC) shows promise for PBL retrieval, but is limited by sampling and confounding issues related to humidity/topography.
• Thus, each of these sensors has some advantages, but also considerable limitations that make them impractical for PBL studies.
28
– Hyperspectral Sounders (e.g. AIRS/IASI) are the most capable in terms of spectral resolution but have not been tailored for PBL sounding and are confounded by surface emissivity.
– Lidar (e.g. CALIPSO) can obtain high vertical resolution, but is limited in return time and spatial sampling and does not provide thermodynamic state information.
– Geostationary (e.g. GOES-R) have frequent temporal sampling, coarse spectral bands and PBL resolution.
– GPS-RO (e.g. COSMIC) shows promise for PBL retrieval, but is limited by sampling and confounding issues related to humidity/topography.
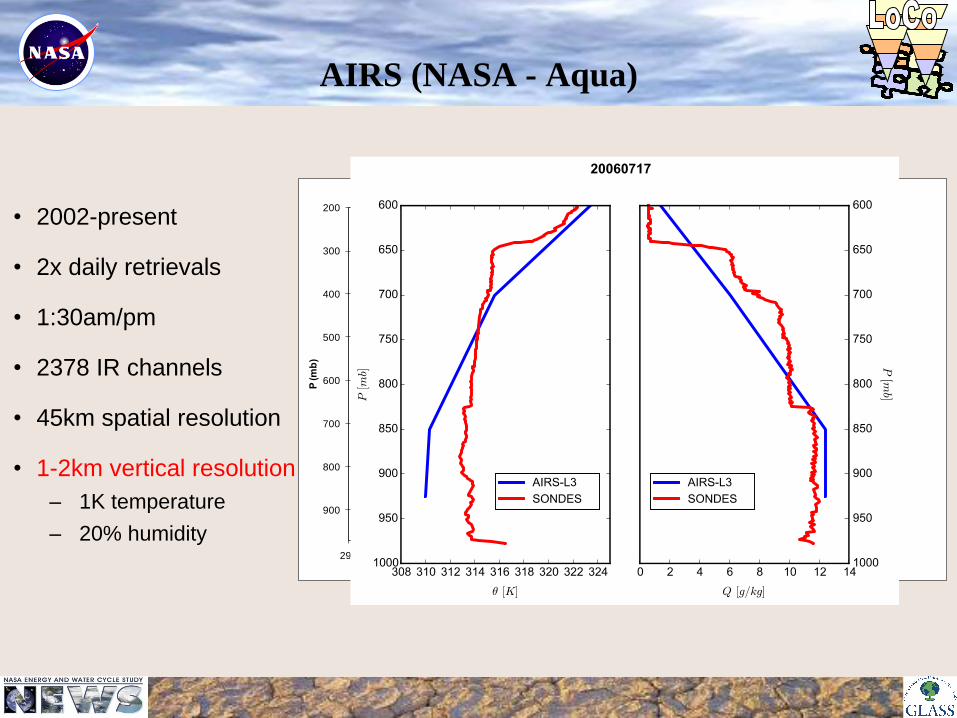
AIRS (NASA - Aqua)
• 2002-present
• 2x daily retrievals
• 1:30am/pm
• 2378 IR channels
• 45km spatial resolution
• 1-2km vertical resolution
– 1K temperature
– 20% humidity
200
300
400
500
600
700
800
900
290 300 310 320 330 340 350
P (m
b)
Pot. Temp (K)
28 Jul 2003
OBSV5.20-DayV5.20-Night
Mixed
Layer
PBL Ht.
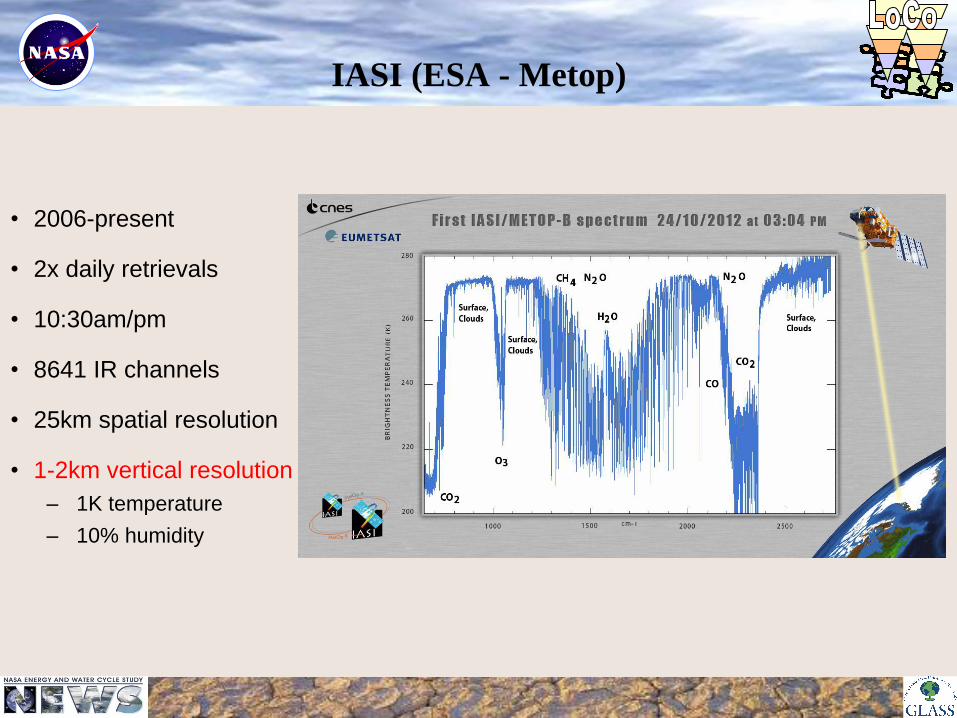
IASI (ESA - Metop)
• 2006-present
• 2x daily retrievals
• 10:30am/pm
• 8641 IR channels
• 25km spatial resolution
• 1-2km vertical resolution
– 1K temperature
– 10% humidity
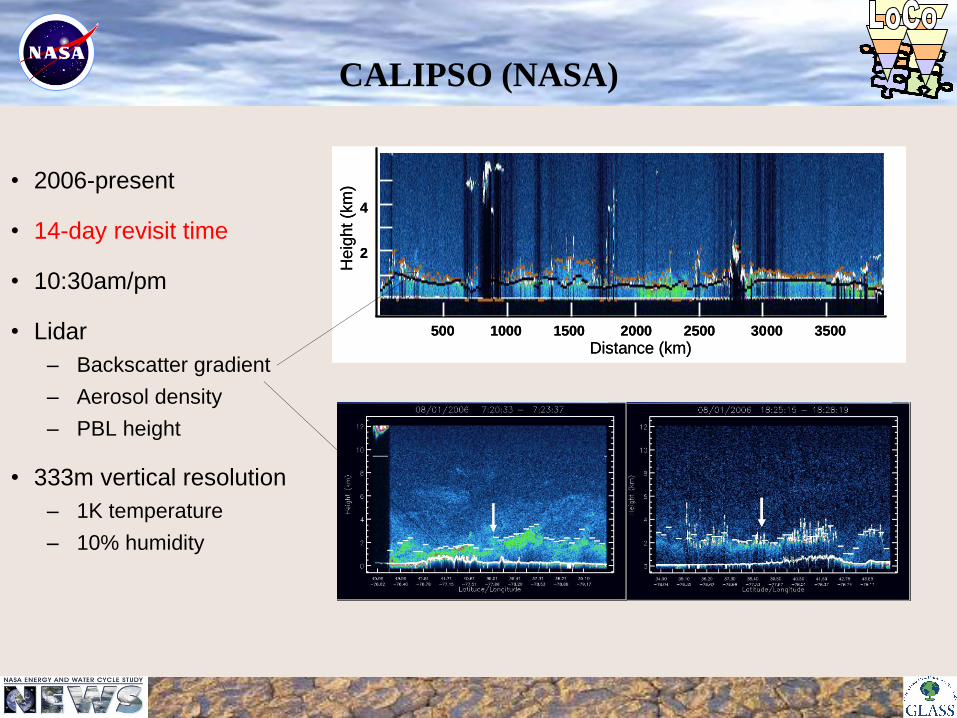
CALIPSO (NASA)
• 2006-present
• 14-day revisit time
• 10:30am/pm
• Lidar
– Backscatter gradient
– Aerosol density
– PBL height
• 333m vertical resolution
– 1K temperature
– 10% humidity
5
2 km
km5
2 km
km
2
4
He
ight (k
m)
Distance (km)500 1000 1500 2000 2500 3000 3500
5
2 km
km5
2 km
km
2
4
He
ight (k
m)
Distance (km)500 1000 1500 2000 2500 3000 3500
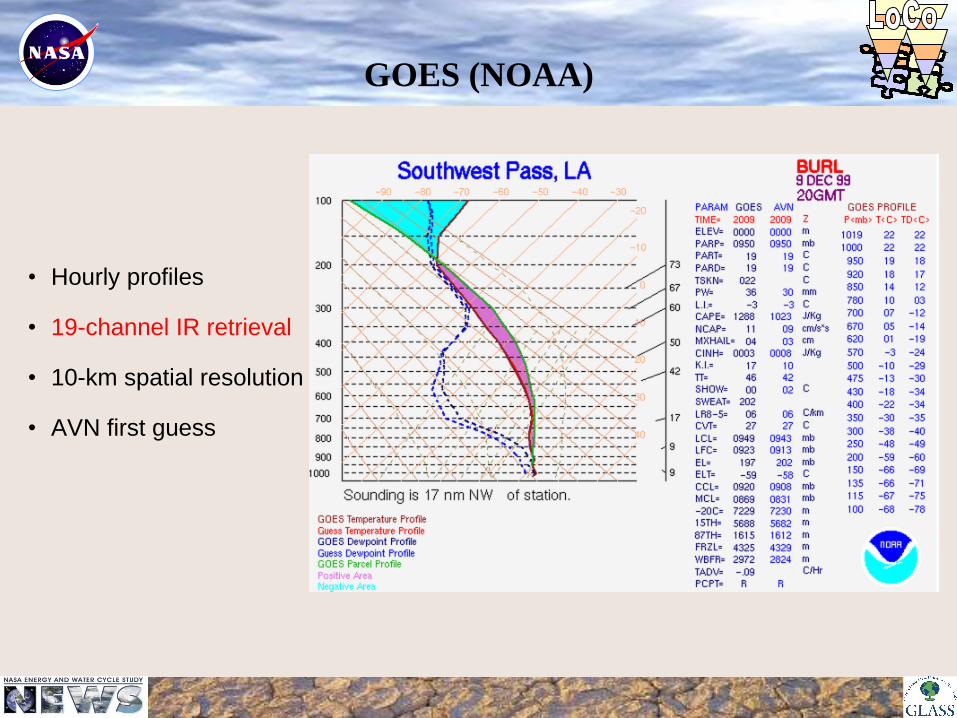
GOES (NOAA)
• Hourly profiles
• 19-channel IR retrieval
• 10-km spatial resolution
• AVN first guess
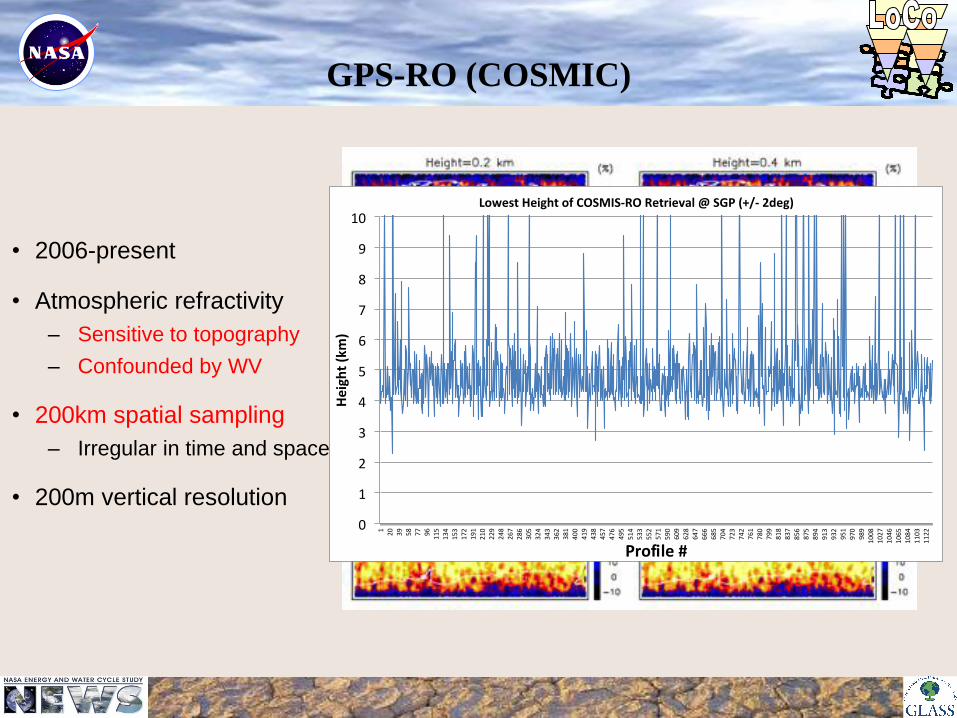
GPS-RO (COSMIC)
• 2006-present
• Atmospheric refractivity
– Sensitive to topography
– Confounded by WV
• 200km spatial sampling
– Irregular in time and space
• 200m vertical resolution
0
1
2
3
4
5
6
7
8
9
10
1
20
39
58
77
96
115
134
153
172
191
210
229
248
267
286
305
324
343
362
381
400
419
438
457
476
495
514
533
552
571
590
609
628
647
666
685
704
723
742
761
780
799
818
837
856
875
894
913
932
951
970
989
1008
1027
1046
1065
1084
1103
1122
Height(km)
Profile#
LowestHeightofCOSMIS-RORetrieval@SGP(+/-2deg)
Outline
L-A Coupling
PBL Role in Water Cycle Science
Ground-based PBL Observing Systems
Satellite PBL Retrieval: Making the Best of it
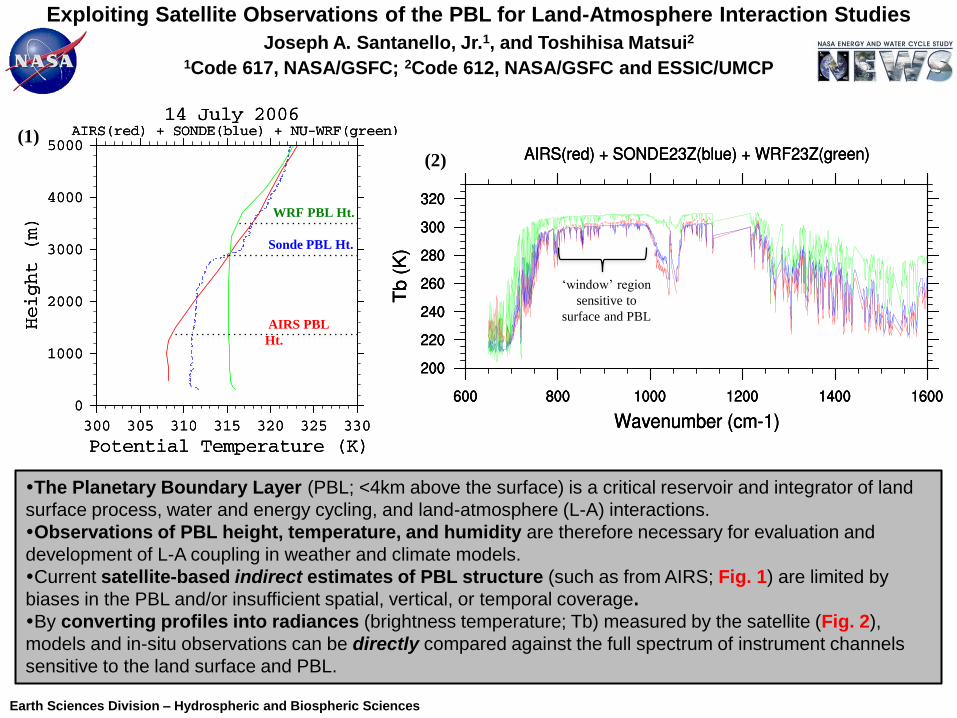
Exploiting Satellite Observations of the PBL for Land-Atmosphere Interaction Studies
Joseph A. Santanello, Jr.1, and Toshihisa Matsui2
1Code 617, NASA/GSFC; 2Code 612, NASA/GSFC and ESSIC/UMCP
The Planetary Boundary Layer (PBL; <4km above the surface) is a critical reservoir and integrator of land
surface process, water and energy cycling, and land-atmosphere (L-A) interactions.
Observations of PBL height, temperature, and humidity are therefore necessary for evaluation and
development of L-A coupling in weather and climate models.
Current satellite-based indirect estimates of PBL structure (such as from AIRS; Fig. 1) are limited by
biases in the PBL and/or insufficient spatial, vertical, or temporal coverage.
By converting profiles into radiances (brightness temperature; Tb) measured by the satellite (Fig. 2),
models and in-situ observations can be directly compared against the full spectrum of instrument channels
sensitive to the land surface and PBL.
Earth Sciences Division – Hydrospheric and Biospheric Sciences
(1)
(2)
‘window’ region
sensitive to
surface and PBL
WRF PBL Ht.
Sonde PBL Ht.
AIRS PBL
Ht.
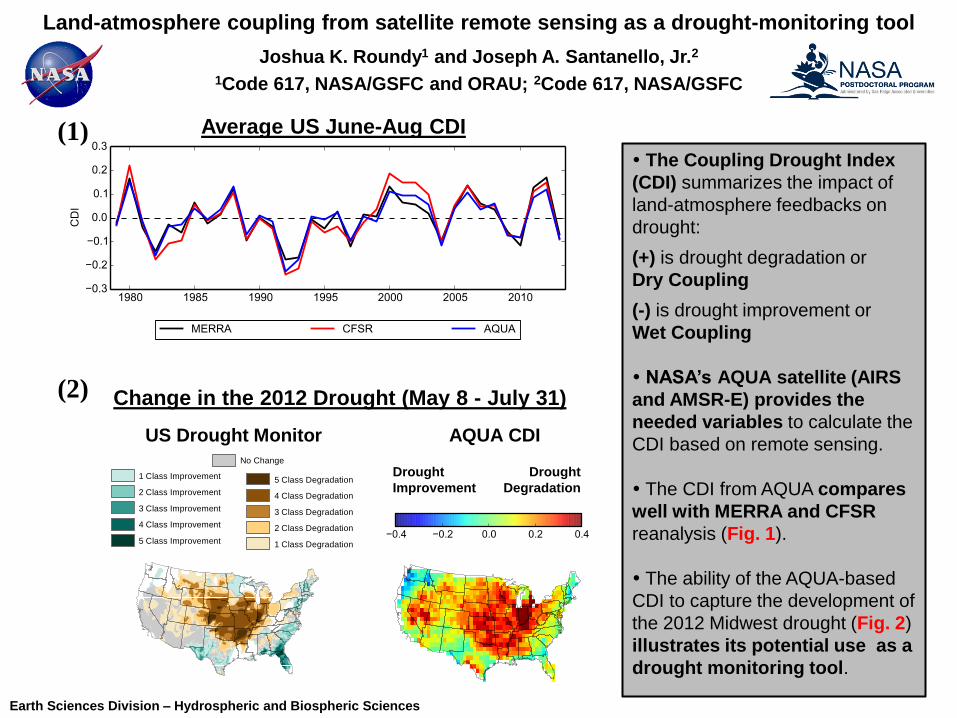
Land-atmosphere coupling from satellite remote sensing as a drought-monitoring tool
Joshua K. Roundy1 and Joseph A. Santanello, Jr.2
1Code 617, NASA/GSFC and ORAU; 2Code 617, NASA/GSFC
The Coupling Drought Index
(CDI) summarizes the impact of
land-atmosphere feedbacks on
drought:
(+) is drought degradation or
Dry Coupling
(-) is drought improvement or
Wet Coupling
NASA’s AQUA satellite (AIRS
and AMSR-E) provides the
needed variables to calculate the
CDI based on remote sensing.
The CDI from AQUA compares
well with MERRA and CFSR
reanalysis (Fig. 1).
The ability of the AQUA-based
CDI to capture the development of
the 2012 Midwest drought (Fig. 2)
illustrates its potential use as a
drought monitoring tool.
Earth Sciences Division – Hydrospheric and Biospheric Sciences
Change in the 2012 Drought (May 8 - July 31)
US Drought Monitor
U.S. Drought Monitor Class Change
5 Class Degradation
4 Class Degradation
3 Class Degradation
2 Class Degradation
1 Class Degradation
No Change
1 Class Improvement
2 Class Improvement
3 Class Improvement
4 Class Improvement
5 Class Improvement
July 31, 2012
July 3, 2012
compared to
http://droughtmonitor.unl.edu
1 Month
U.S. Drought Monitor Class Change
5 Class Degradation
4 Class Degradation
3 Class Degradation
2 Class Degradation
1 Class Degradation
No Change
1 Class Improvement
2 Class Improvement
3 Class Improvement
4 Class Improvement
5 Class Improvement
July 31, 2012
July 3, 2012
compared to
http://droughtmonitor.unl.edu
1 MonthU.S. Drought Monitor Class Change
5 Class Degradation
4 Class Degradation
3 Class Degradation
2 Class Degradation
1 Class Degradation
No Change
1 Class Improvement
2 Class Improvement
3 Class Improvement
4 Class Improvement
5 Class Improvement
July 31, 2012
July 3, 2012
compared to
http://droughtmonitor.unl.edu
1 Month
U.S. Drought Monitor Class Change
5 Class Degradation
4 Class Degradation
3 Class Degradation
2 Class Degradation
1 Class Degradation
No Change
1 Class Improvement
2 Class Improvement
3 Class Improvement
4 Class Improvement
5 Class Improvement
July 31, 2012
May 8, 2012
compared to
http://droughtmonitor.unl.edu
3 Months
AQUA CDI
Drought
Improvement
Drought
Degradation
Average US June-Aug CDI (1)
(2)
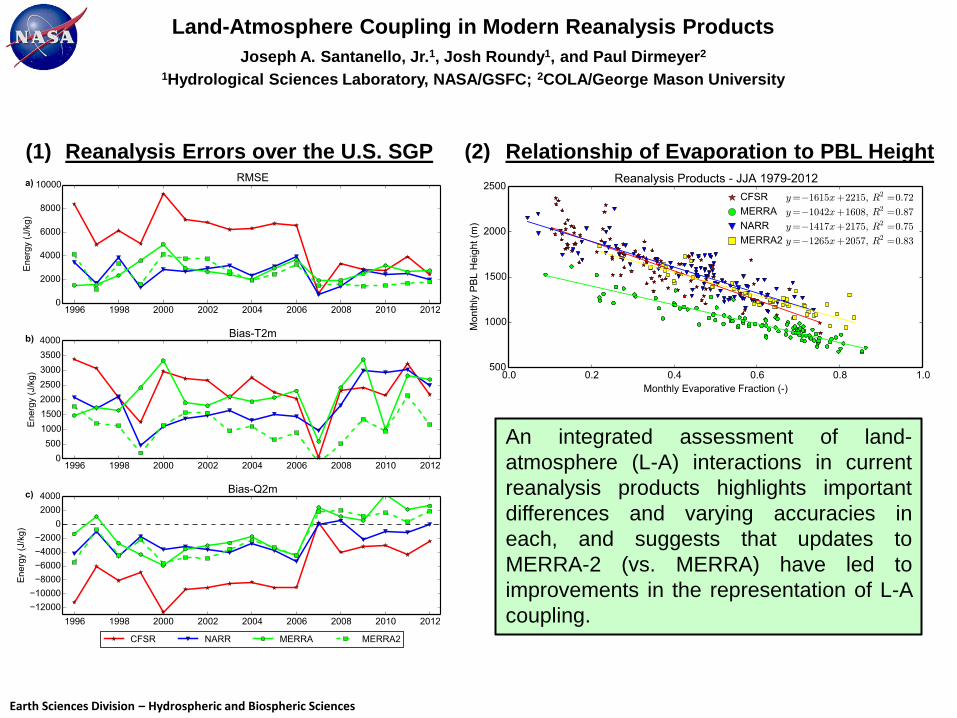
Land-Atmosphere Coupling in Modern Reanalysis Products
Joseph A. Santanello, Jr.1, Josh Roundy1, and Paul Dirmeyer2
1Hydrological Sciences Laboratory, NASA/GSFC; 2COLA/George Mason University
An integrated assessment of land-
atmosphere (L-A) interactions in current
reanalysis products highlights important
differences and varying accuracies in
each, and suggests that updates to
MERRA-2 (vs. MERRA) have led to
improvements in the representation of L-A
coupling.
Relationship of Evaporation to PBL Height Reanalysis Errors over the U.S. SGP (1) (2)
Earth Sciences Division – Hydrospheric and Biospheric Sciences
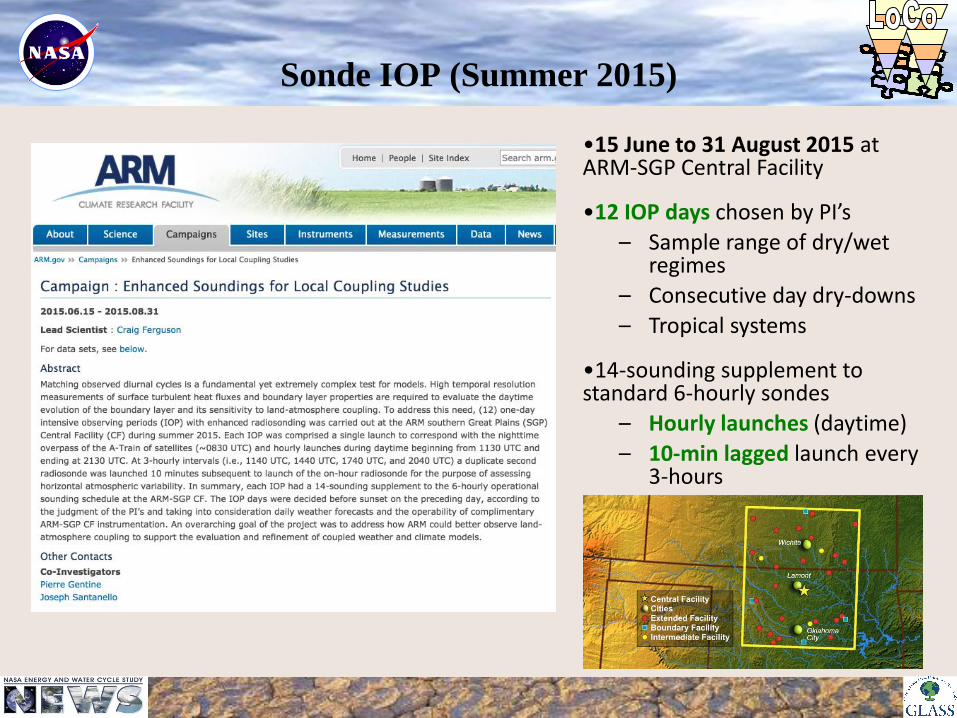
Sonde IOP (Summer 2015)
•15 June to 31 August 2015 at ARM-SGP Central Facility
•12 IOP days chosen by PI’s
– Sample range of dry/wet regimes
– Consecutive day dry-downs
– Tropical systems
•14-sounding supplement to standard 6-hourly sondes
– Hourly launches (daytime)
– 10-min lagged launch every 3-hours
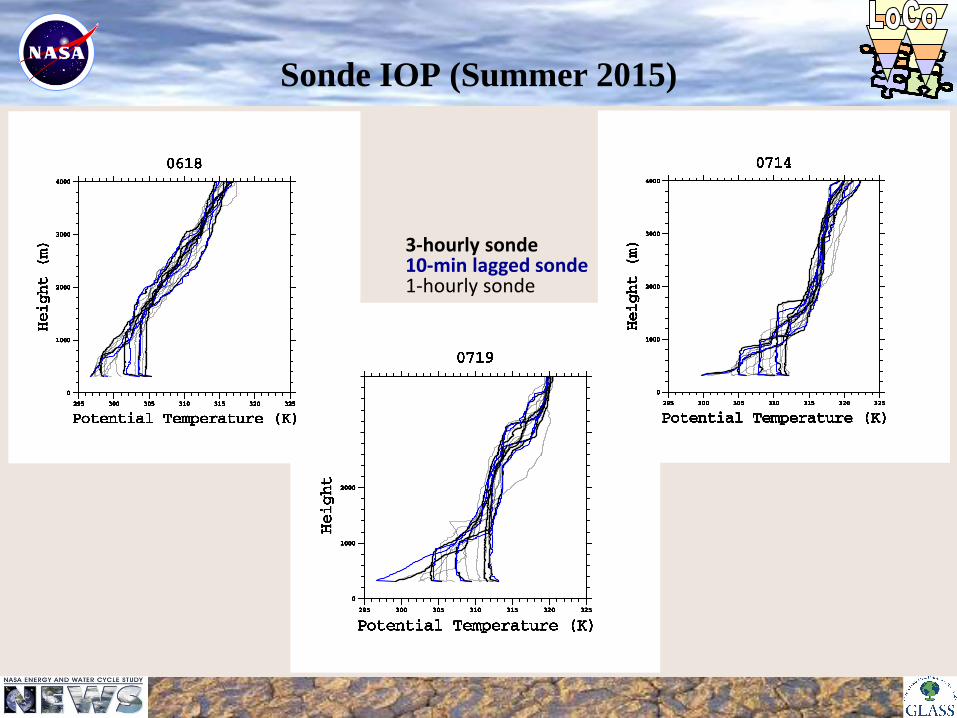
Sonde IOP (Summer 2015)
3-hourly sonde 10-min lagged sonde 1-hourly sonde
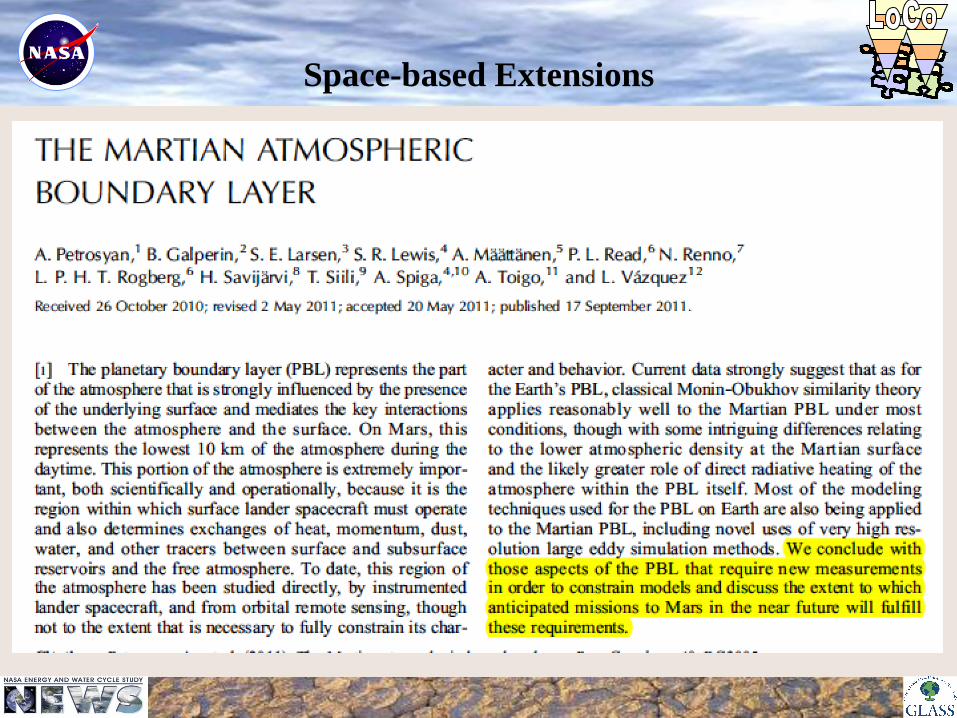
Space-based Extensions
Closing Comments on PBL Retrieval from Space
Are there Challenges? Yes, but..
Is this an Imperative? Let’s see..