Embed Size (px)
Citation preview
sensors
Article
Planar Position Sensor Based on Mono SensingElectrode and Hybrid-Frequency Excitation
Hongxiang Yu *, Yu Zhang, Mengfeng Shen, Hongli Zhang, Zhao Gao and Dongyun Wang
College of Engineering, ZheJiang Normal University, Jinhua 321004, China; [email protected] (Y.Z.);[email protected] (M.S.); [email protected] (H.Z.); [email protected] (Z.G.); [email protected] (D.W.)* Correspondence: [email protected]; Tel.: +86-579-8228-6191
Academic Editor: Vittorio M. N. PassaroReceived: 6 March 2016; Accepted: 9 May 2016; Published: 13 May 2016
Abstract: A new way of measuring planar position for micrometric and sub-micrometric applicationsis presented with a mono sensing electrode and hybrid-frequency excitation. The sensing theoryand operation principle are described and summarized, and a printed circuit board (PCB) sensorprototype is built and tested. It is shown by the experimental results that a very simple structure andgeometric relationship are achieved. Meanwhile, displacement sensitivity on an order of 1.50 mV permicron and measurement repeatability better than 0.002 mm are easily fulfilled for a square zone of256 mm2, making it a valuable alternative measurement device candidate for flexible and low-costplanar position detection.
Keywords: planar position; capacitive sensor; mono-electrode; hybrid-frequency
1. Introduction
Micrometric and sub-micrometric positioning measurement plays an important role in precisionmetrology and manufacturing applications [1,2]. Their uses include linear positioning measurement,planar positioning measurement, and space positioning measurement, etc. [3,4]. Hence manytypes of sensor devices have emerged, such as laser interferometers, grating scales, and capacitivetransducers [5–7]. However, most of them were originally designed for single dimension measurement,for instance, in a linear positioning mechanism or in a rotary servo motor. To perform an inspectionin the 2D plane, the accumulation of single dimension sensors is inevitable in most cases, whichleads to complicated structures and cumbersome size. Particularly, due to the orthogonal deviationof assembly, such combined apparatus can easily introduce Abbe and cumulative errors into themeasurement results [8], so alternative methods of measuring planar position continue to be an openfield of research of high interest [9]. Among these methods, planar gratings, optical image processing,and capacitive coupling strategies can serve as a relevant options, both for theoretical research and fortechnological applications. For example, in [10], two planar gratings were diagonally mounted on aplanar moving stage for detecting planar position and deflection on the nanoscale. In [11,12], laserspeckle patterns and diffuse-reflectivity images are analyzed for measuring 2D displacement withhigh dynamics, and in [13], a capacitive transducer utilizing eight sensing electrodes was developedfor the detection of planar displacements. However, most planar grating devices involve high costs,despite their high resolution, and the existing capacitive coupling methods generally need to solvecomplex capacitance signals generated by multiple sensing electrodes. For the growing demand ofabsolute position measurement in the 2D plane, sensor devices of micrometric and sub-micrometricresolution with simple structures and low-cost have not been experimentally demonstrated.
This paper introduces a new approach to absolute planar position detection by employing amono sensing electrode and a hybrid-frequency excitation scheme. The physical theory and operation
Sensors 2016, 16, 691; doi:10.3390/s16050691 www.mdpi.com/journal/sensors
Sensors 2016, 16, 691 2 of 9
principle are described and summarized. In addition, experiments are carried out with a PCB sensorprototype, to verify the feasibility and to demonstrate the advantages.
2. Theory and Principle
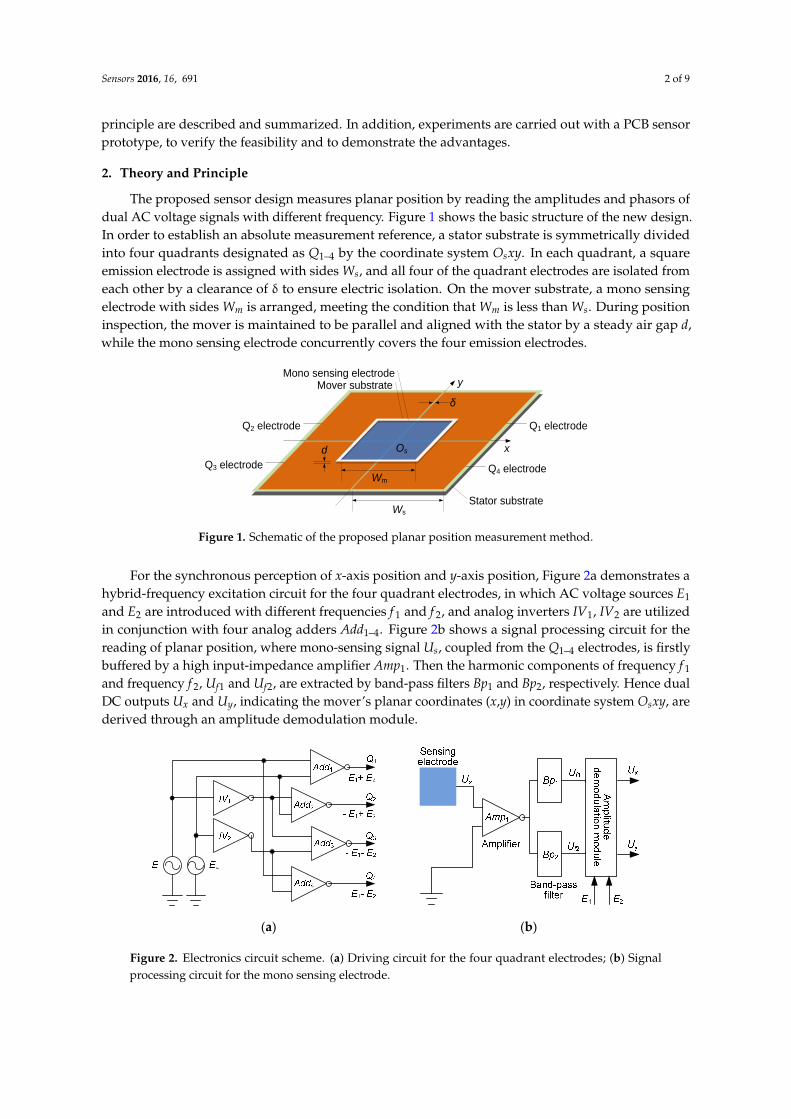
The proposed sensor design measures planar position by reading the amplitudes and phasors ofdual AC voltage signals with different frequency. Figure 1 shows the basic structure of the new design.In order to establish an absolute measurement reference, a stator substrate is symmetrically dividedinto four quadrants designated as Q1–4 by the coordinate system Osxy. In each quadrant, a squareemission electrode is assigned with sides Ws, and all four of the quadrant electrodes are isolated fromeach other by a clearance of δ to ensure electric isolation. On the mover substrate, a mono sensingelectrode with sides Wm is arranged, meeting the condition that Wm is less than Ws. During positioninspection, the mover is maintained to be parallel and aligned with the stator by a steady air gap d,while the mono sensing electrode concurrently covers the four emission electrodes.
Sensors 2016, 16, 691 2 of 9
principle are described and summarized. In addition, experiments are carried out with a PCB sensor
prototype, to verify the feasibility and to demonstrate the advantages.
2. Theory and Principle
The proposed sensor design measures planar position by reading the amplitudes and phasors
of dual AC voltage signals with different frequency. Figure 1 shows the basic structure of the new
design. In order to establish an absolute measurement reference, a stator substrate is symmetrically
divided into four quadrants designated as Q1–4 by the coordinate system Osxy. In each quadrant, a
square emission electrode is assigned with sides Ws, and all four of the quadrant electrodes are
isolated from each other by a clearance of δ to ensure electric isolation. On the mover substrate, a
mono sensing electrode with sides Wm is arranged, meeting the condition that Wm is less than Ws.
During position inspection, the mover is maintained to be parallel and aligned with the stator by a
steady air gap d, while the mono sensing electrode concurrently covers the four emission electrodes.
x
y
Stator substrate
Mover substrate
Q1 electrode
Q4 electrode
Q2 electrode
Q3 electrode
Mono sensing electrode
δ
Wm
Ws
d Os
Figure 1. Schematic of the proposed planar position measurement method.
For the synchronous perception of x-axis position and y-axis position, Figure 2a demonstrates a
hybrid-frequency excitation circuit for the four quadrant electrodes, in which AC voltage sources E1
and E2 are introduced with different frequencies f1 and f2, and analog inverters IV1, IV2 are utilized in
conjunction with four analog adders Add1–4. Figure 2b shows a signal processing circuit for the
reading of planar position, where mono-sensing signal Us, coupled from the Q1–4 electrodes, is firstly
buffered by a high input-impedance amplifier Amp1. Then the harmonic components of frequency f1
and frequency f2, Uf1 and Uf2, are extracted by band-pass filters Bp1 and Bp2, respectively. Hence dual
DC outputs Ux and Uy, indicating the mover’s planar coordinates (x,y) in coordinate system Osxy, are
derived through an amplitude demodulation module.
E2
IV1
IV2
Q1
E1+ E2
- E1+ E2
- E1- E2
E1- E2
E1
Q3
Q4
Q2 Add2
Add1
Add4
Add3
Amp1
Bp1
Bp2
Am
plitu
de
de
mo
du
latio
n m
od
ule
E2E1
Ux
Uy
Uf1
Uf2
Sensing electrode
Band-passfilter
Amplifier
Us
(a) (b)
Figure 2. Electronics circuit scheme. (a) Driving circuit for the four quadrant electrodes; (b) Signal
processing circuit for the mono sensing electrode.
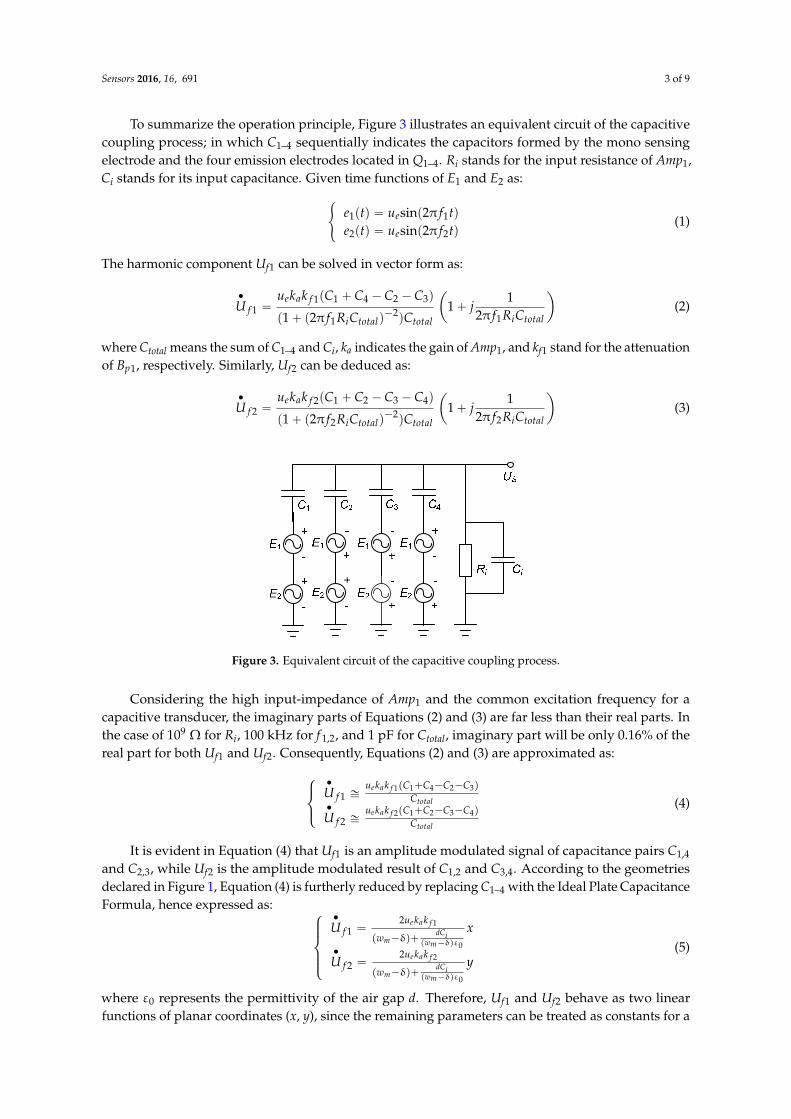
To summarize the operation principle, Figure 3 illustrates an equivalent circuit of the capacitive
coupling process; in which C1–4 sequentially indicates the capacitors formed by the mono sensing
electrode and the four emission electrodes located in Q1–4. Ri stands for the input resistance of Amp1,
Ci stands for its input capacitance. Given time functions of E1 and E2 as:
Figure 1. Schematic of the proposed planar position measurement method.
For the synchronous perception of x-axis position and y-axis position, Figure 2a demonstrates ahybrid-frequency excitation circuit for the four quadrant electrodes, in which AC voltage sources E1
and E2 are introduced with different frequencies f 1 and f 2, and analog inverters IV1, IV2 are utilizedin conjunction with four analog adders Add1–4. Figure 2b shows a signal processing circuit for thereading of planar position, where mono-sensing signal Us, coupled from the Q1–4 electrodes, is firstlybuffered by a high input-impedance amplifier Amp1. Then the harmonic components of frequency f 1
and frequency f 2, Uf1 and Uf2, are extracted by band-pass filters Bp1 and Bp2, respectively. Hence dualDC outputs Ux and Uy, indicating the mover’s planar coordinates (x,y) in coordinate system Osxy, arederived through an amplitude demodulation module.
Sensors 2016, 16, 691 2 of 9
operation principle are described and summarized. In addition, experiments are carried out with a PCB sensor prototype, to verify the feasibility and to demonstrate the advantages.
2. Theory and Principle
The proposed sensor design measures planar position by reading the amplitudes and phasors of dual AC voltage signals with different frequency. Figure 1 shows the basic structure of the new design. In order to establish an absolute measurement reference, a stator substrate is symmetrically divided into four quadrants designated as Q1–4 by the coordinate system Osxy. In each quadrant, a square emission electrode is assigned with sides Ws, and all four of the quadrant electrodes are isolated from each other by a clearance of δ to ensure electric isolation. On the mover substrate, a mono sensing electrode with sides Wm is arranged, meeting the condition that Wm is less than Ws. During position inspection, the mover is maintained to be parallel and aligned with the stator by a steady air gap d, while the mono sensing electrode concurrently covers the four emission electrodes.
Figure 1. Schematic of the proposed planar position measurement method.
For the synchronous perception of x-axis position and y-axis position, Figure 2a demonstrates a hybrid-frequency excitation circuit for the four quadrant electrodes, in which AC voltage sources E1 and E2 are introduced with different frequencies f1 and f2, and analog inverters IV1, IV2 are utilized in conjunction with four analog adders Add1–4. Figure 2b shows a signal processing circuit for the reading of planar position, where mono-sensing signal Us, coupled from the Q1–4 electrodes, is firstly buffered by a high input-impedance amplifier Amp1. Then the harmonic components of frequency f1 and frequency f2, Uf1 and Uf2, are extracted by band-pass filters Bp1 and Bp2, respectively. Hence dual DC outputs Ux and Uy, indicating the mover’s planar coordinates (x,y) in coordinate system Osxy, are derived through an amplitude demodulation module.
(a) (b)
Figure 2. Electronics circuit scheme. (a) Driving circuit for the four quadrant electrodes; (b) Signal processing circuit for the mono sensing electrode.
To summarize the operation principle, Figure 3 illustrates an equivalent circuit of the capacitive coupling process; in which C1–4 sequentially indicates the capacitors formed by the mono sensing electrode and the four emission electrodes located in Q1–4. Ri stands for the input resistance of Amp1, Ci stands for its input capacitance. Given time functions of E1 and E2 as:
Figure 2. Electronics circuit scheme. (a) Driving circuit for the four quadrant electrodes; (b) Signalprocessing circuit for the mono sensing electrode.
Sensors 2016, 16, 691 3 of 9
To summarize the operation principle, Figure 3 illustrates an equivalent circuit of the capacitivecoupling process; in which C1–4 sequentially indicates the capacitors formed by the mono sensingelectrode and the four emission electrodes located in Q1–4. Ri stands for the input resistance of Amp1,Ci stands for its input capacitance. Given time functions of E1 and E2 as:
#
e1ptq “ uesinp2π f1tqe2ptq “ uesinp2π f2tq
(1)
The harmonic component Uf1 can be solved in vector form as:
‚
U f 1 “uekak f 1pC1 ` C4 ´ C2 ´ C3q
p1` p2π f1RiCtotalq´2qCtotal
ˆ
1` j1
2π f1RiCtotal
˙
(2)
where Ctotal means the sum of C1–4 and Ci, ka indicates the gain of Amp1, and kf1 stand for the attenuationof Bp1, respectively. Similarly, Uf2 can be deduced as:
‚
U f 2 “uekak f 2pC1 ` C2 ´ C3 ´ C4q
p1` p2π f2RiCtotalq´2qCtotal
ˆ
1` j1
2π f2RiCtotal
˙
(3)
Sensors 2016, 16, 691 3 of 9
1 1
2 2
( ) sin(2 )( ) sin(2 )
e
e
e t u f te t u f t
(1)
The harmonic component Uf1 can be solved in vector form as:
1 1 4 2 321
1 1
( ) 11(1 (2 ) ) 2e a f
fi total total i total
u k k C C C Cj
f R C C f R CU
(2)
where Ctotal means the sum of C1–4 and Ci, ka indicates the gain of Amp1, and kf1 stand for the attenuation of Bp1, respectively. Similarly, Uf2 can be deduced as:
2 1 2 3 422
2 2
( ) 11(1 (2 ) ) 2e a f
fi total total i total
u k k C C C Cj
f R C C f R CU
(3)
Considering the high input-impedance of Amp1 and the common excitation frequency for a capacitive transducer, the imaginary parts of Equations (2) and (3) are far less than their real parts. In the case of 109 Ω for Ri, 100 kHz for f1,2, and 1 pF for Ctotal, imaginary part will be only 0.16% of the real part for both Uf1 and Uf2. Consequently, Equations (2) and (3) are approximated as:
1 1 4 2 31
2 1 2 3 42
e a ff
total
e a ff
total
u k k C C C CC
u k k C C C CC
U
U
(4)
Figure 3. Equivalent circuit of the capacitive coupling process.
It is evident in Equation (4) that Uf1 is an amplitude modulated signal of capacitance pairs C1,4 and C2,3, while Uf2 is the amplitude modulated result of C1,2 and C3,4. According to the geometries declared in Figure 1, Equation (4) is furtherly reduced by replacing C1–4 with the Ideal Plate Capacitance Formula, hence expressed as:
11
0
22
0
2
2
e a ff
im
m
e a ff
im
m
u k kU xdCw
wu k k
U ydCww
(5)
where ε0 represents the permittivity of the air gap d. Therefore, Uf1 and Uf2 behave as two linear functions of planar coordinates (x, y), since the remaining parameters can be treated as constants for a specific sensor device. Accordingly, the planar positon of the mover can be determined by deriving the amplitudes of Uf1 and Uf2 and by judging their in-phase or reversed-phase status versus E1 and E2,
Figure 3. Equivalent circuit of the capacitive coupling process.
Considering the high input-impedance of Amp1 and the common excitation frequency for acapacitive transducer, the imaginary parts of Equations (2) and (3) are far less than their real parts. Inthe case of 109 Ω for Ri, 100 kHz for f 1,2, and 1 pF for Ctotal, imaginary part will be only 0.16% of thereal part for both Uf1 and Uf2. Consequently, Equations (2) and (3) are approximated as:
$
&
%
‚
U f 1 –uekak f 1pC1`C4´C2´C3q
Ctotal‚
U f 2 –uekak f 2pC1`C2´C3´C4q
Ctotal
(4)
It is evident in Equation (4) that Uf1 is an amplitude modulated signal of capacitance pairs C1,4
and C2,3, while Uf2 is the amplitude modulated result of C1,2 and C3,4. According to the geometriesdeclared in Figure 1, Equation (4) is furtherly reduced by replacing C1–4 with the Ideal Plate CapacitanceFormula, hence expressed as:
$
’
’
&
’
’
%
‚
U f 1 “2uekak f 1
pwm´δq`dCi
pwm´δqε0
x
‚
U f 2 “2uekak f 2
pwm´δq`dCi
pwm´δqε0
y(5)
where ε0 represents the permittivity of the air gap d. Therefore, Uf1 and Uf2 behave as two linearfunctions of planar coordinates (x, y), since the remaining parameters can be treated as constants for a
Sensors 2016, 16, 691 4 of 9
specific sensor device. Accordingly, the planar positon of the mover can be determined by deriving theamplitudes of Uf1 and Uf2 and by judging their in-phase or reversed-phase status versus E1 and E2,respectively. Such a function is performed by an amplitude demodulated module, which belongs tothe previously mentioned signal processing circuit, as shown in Figure 2b.
To sum up, we can synthesize the expressions of amplitude demodulated outputs Uf1 and Uf2as follows:
$
’
’
&
’
’
%
Ux “2uekak f 1kd
pwm´δq`dCi
pwm´δqε0
x
Uy “2uekak f 2kd
pwm´δq`dCi
pwm´δqε0
y(6)
where kd indicates the gain of amplitude demodulated module.As for the effective measurement range, it is determined by the basic theory of capacitive coupling,
of which the mono sensing electrode must cover the four quadrants’ electrodes concurrently. It impliesthat the transition of mono sensing electrode is restricted by:
#
|x| ď wm´δ2
|y| ď wm´δ2
(7)
In fact, to reduce fringing effects, a smaller measurement range is much preferred in practicecompared with the maximum margin as defined in Equation (7).
3. Prototype and Experimental Setup
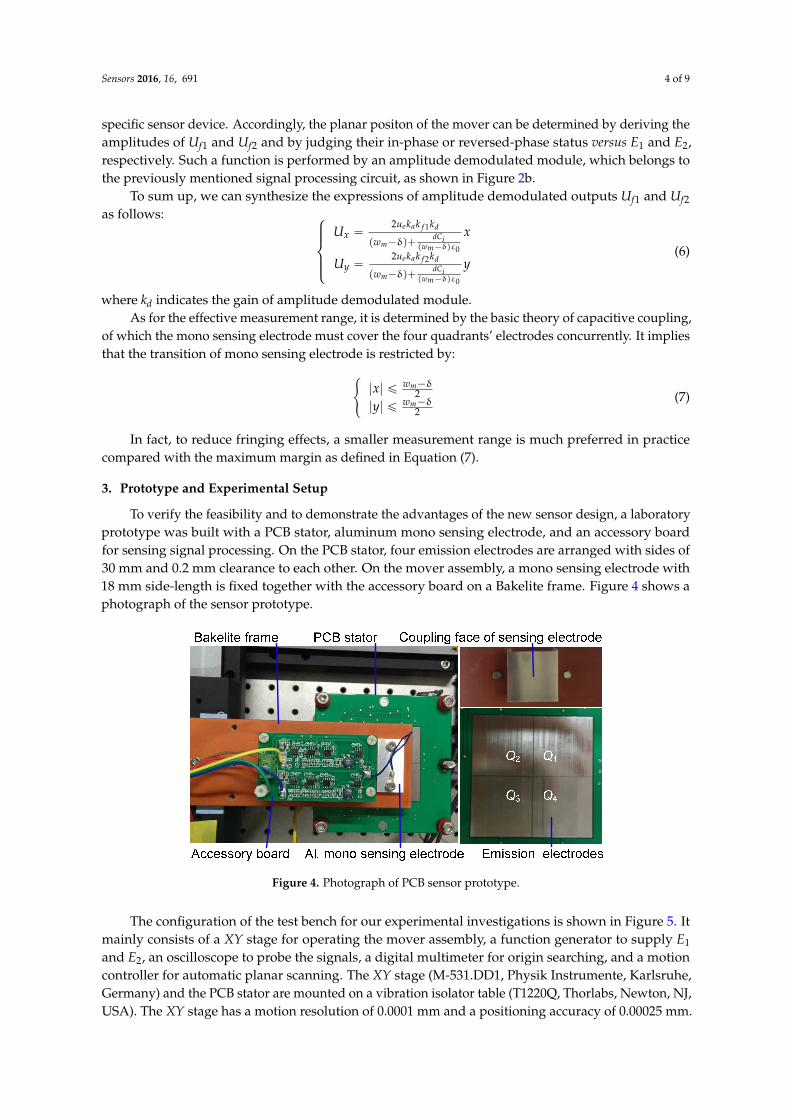
To verify the feasibility and to demonstrate the advantages of the new sensor design, a laboratoryprototype was built with a PCB stator, aluminum mono sensing electrode, and an accessory boardfor sensing signal processing. On the PCB stator, four emission electrodes are arranged with sides of30 mm and 0.2 mm clearance to each other. On the mover assembly, a mono sensing electrode with18 mm side-length is fixed together with the accessory board on a Bakelite frame. Figure 4 shows aphotograph of the sensor prototype.
Sensors 2016, 16, 691 4 of 9
respectively. Such a function is performed by an amplitude demodulated module, which belongs to the previously mentioned signal processing circuit, as shown in Figure 2b.
To sum up, we can synthesize the expressions of amplitude demodulated outputs Uf1 and Uf2 as follows:
1
0
2
0
2
2
e a f dx
im
m
e a f dy
im
m
u k k kU xdCw
wu k k k
U ydCww
(6)
where kd indicates the gain of amplitude demodulated module. As for the effective measurement range, it is determined by the basic theory of capacitive
coupling, of which the mono sensing electrode must cover the four quadrants’ electrodes concurrently. It implies that the transition of mono sensing electrode is restricted by:
2
2
m
m
wx
wy
(7)
In fact, to reduce fringing effects, a smaller measurement range is much preferred in practice compared with the maximum margin as defined in Equation (7).
3. Prototype and Experimental Setup
To verify the feasibility and to demonstrate the advantages of the new sensor design, a laboratory prototype was built with a PCB stator, aluminum mono sensing electrode, and an accessory board for sensing signal processing. On the PCB stator, four emission electrodes are arranged with sides of 30 mm and 0.2 mm clearance to each other. On the mover assembly, a mono sensing electrode with 18 mm side-length is fixed together with the accessory board on a Bakelite frame. Figure 4 shows a photograph of the sensor prototype.
Figure 4. Photograph of PCB sensor prototype.
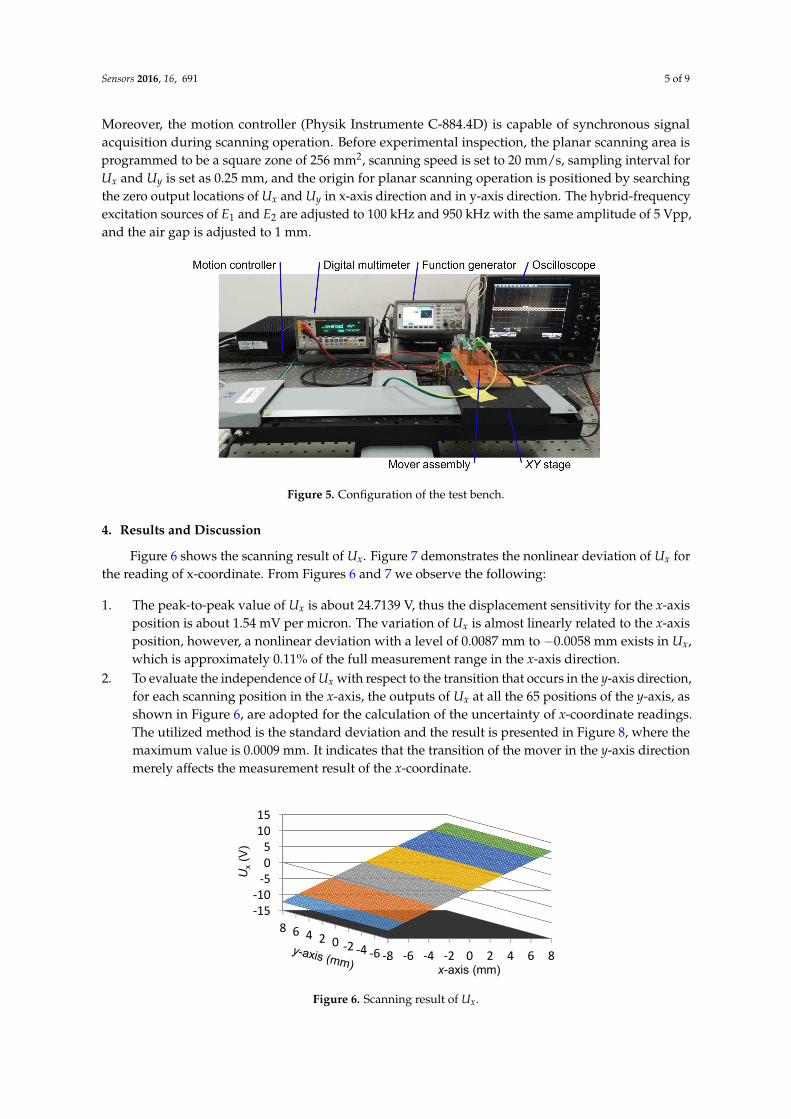
The configuration of the test bench for our experimental investigations is shown in Figure 5. It mainly consists of a XY stage for operating the mover assembly, a function generator to supply E1 and E2, an oscilloscope to probe the signals, a digital multimeter for origin searching, and a motion controller for automatic planar scanning. The XY stage (M-531.DD1, Physik Instrumente, Karlsruhe, Germany) and the PCB stator are mounted on a vibration isolator table (T1220Q, Thorlabs, Newton,
Figure 4. Photograph of PCB sensor prototype.
The configuration of the test bench for our experimental investigations is shown in Figure 5. Itmainly consists of a XY stage for operating the mover assembly, a function generator to supply E1
and E2, an oscilloscope to probe the signals, a digital multimeter for origin searching, and a motioncontroller for automatic planar scanning. The XY stage (M-531.DD1, Physik Instrumente, Karlsruhe,Germany) and the PCB stator are mounted on a vibration isolator table (T1220Q, Thorlabs, Newton, NJ,USA). The XY stage has a motion resolution of 0.0001 mm and a positioning accuracy of 0.00025 mm.
Sensors 2016, 16, 691 5 of 9
Moreover, the motion controller (Physik Instrumente C-884.4D) is capable of synchronous signalacquisition during scanning operation. Before experimental inspection, the planar scanning area isprogrammed to be a square zone of 256 mm2, scanning speed is set to 20 mm/s, sampling interval forUx and Uy is set as 0.25 mm, and the origin for planar scanning operation is positioned by searchingthe zero output locations of Ux and Uy in x-axis direction and in y-axis direction. The hybrid-frequencyexcitation sources of E1 and E2 are adjusted to 100 kHz and 950 kHz with the same amplitude of 5 Vpp,and the air gap is adjusted to 1 mm.
Sensors 2016, 16, 691 5 of 9
NJ, USA). The XY stage has a motion resolution of 0.0001 mm and a positioning accuracy of 0.00025 mm. Moreover, the motion controller (Physik Instrumente C-884.4D) is capable of synchronous signal acquisition during scanning operation. Before experimental inspection, the planar scanning area is programmed to be a square zone of 256 mm2, scanning speed is set to 20 mm/s, sampling interval for Ux and Uy is set as 0.25 mm, and the origin for planar scanning operation is positioned by searching the zero output locations of Ux and Uy in x-axis direction and in y-axis direction. The hybrid-frequency excitation sources of E1 and E2 are adjusted to 100 kHz and 950 kHz with the same amplitude of 5 Vpp, and the air gap is adjusted to 1 mm.
Figure 5. Configuration of the test bench.
4. Results and Discussion
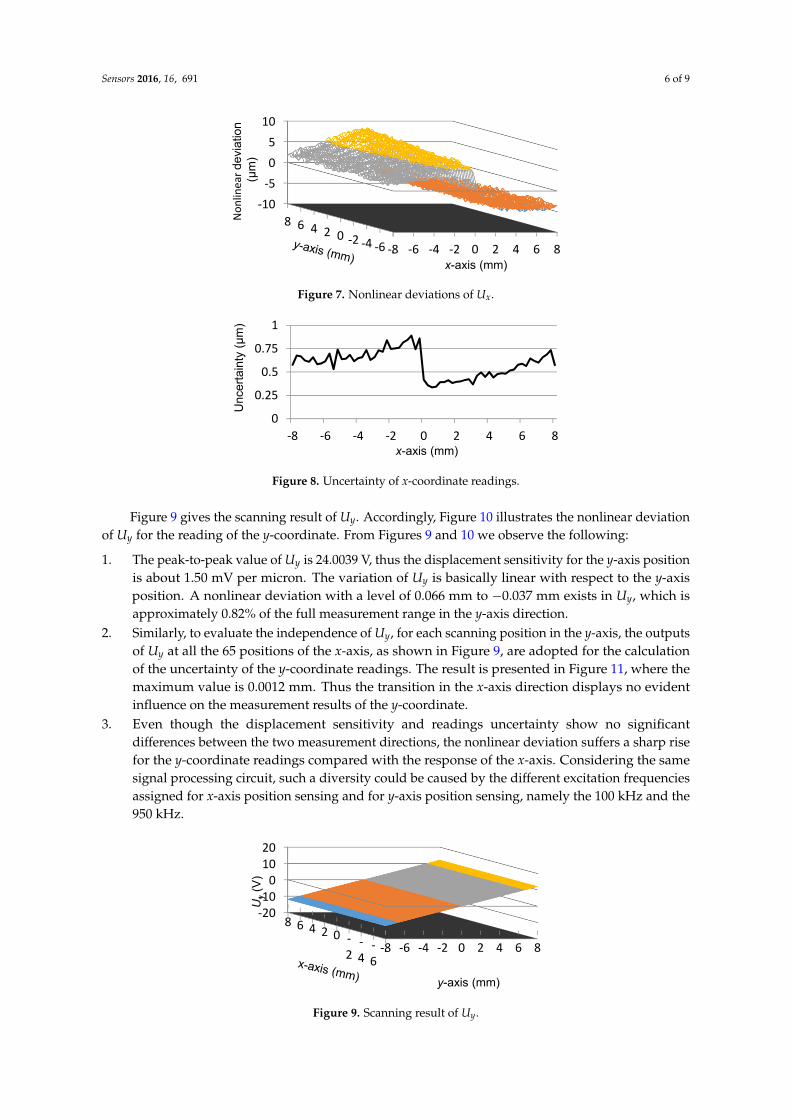
Figure 6 shows the scanning result of Ux. Figure 7 demonstrates the nonlinear deviation of Ux for the reading of x-coordinate. From Figures 6 and 7, we observe the following:
1. The peak-to-peak value of Ux is about 24.7139 V, thus the displacement sensitivity for the x-axis position is about 1.54 mV per micron. The variation of Ux is almost linearly related to the x-axis position, however, a nonlinear deviation with a level of 0.0087 mm to −0.0058 mm exists in Ux, which is approximately 0.11% of the full measurement range in the x-axis direction.
2. To evaluate the independence of Ux with respect to the transition that occurs in the y-axis direction, for each scanning position in the x-axis, the outputs of Ux at all the 65 positions of the y-axis, as shown in Figure 6, are adopted for the calculation of the uncertainty of x-coordinate readings. The utilized method is the standard deviation and the result is presented in Figure 8, where the maximum value is 0.0009 mm. It indicates that the transition of the mover in the y-axis direction merely affects the measurement result of the x-coordinate.
Figure 6. Scanning result of Ux.
.-6-4-202468-15-10
-505
1015
-8 -6 -4 -2 0 2 4 6 8x-axis (mm)
Ux
(V)
Figure 5. Configuration of the test bench.
4. Results and Discussion
Figure 6 shows the scanning result of Ux. Figure 7 demonstrates the nonlinear deviation of Ux forthe reading of x-coordinate. From Figures 6 and 7 we observe the following:
1. The peak-to-peak value of Ux is about 24.7139 V, thus the displacement sensitivity for the x-axisposition is about 1.54 mV per micron. The variation of Ux is almost linearly related to the x-axisposition, however, a nonlinear deviation with a level of 0.0087 mm to ´0.0058 mm exists in Ux,which is approximately 0.11% of the full measurement range in the x-axis direction.
2. To evaluate the independence of Ux with respect to the transition that occurs in the y-axis direction,for each scanning position in the x-axis, the outputs of Ux at all the 65 positions of the y-axis, asshown in Figure 6, are adopted for the calculation of the uncertainty of x-coordinate readings.The utilized method is the standard deviation and the result is presented in Figure 8, where themaximum value is 0.0009 mm. It indicates that the transition of the mover in the y-axis directionmerely affects the measurement result of the x-coordinate.
Sensors 2016, 16, 691 5 of 9
NJ, USA). The XY stage has a motion resolution of 0.0001 mm and a positioning accuracy of 0.00025 mm. Moreover, the motion controller (Physik Instrumente C-884.4D) is capable of synchronous signal acquisition during scanning operation. Before experimental inspection, the planar scanning area is programmed to be a square zone of 256 mm2, scanning speed is set to 20 mm/s, sampling interval for Ux and Uy is set as 0.25 mm, and the origin for planar scanning operation is positioned by searching the zero output locations of Ux and Uy in x-axis direction and in y-axis direction. The hybrid-frequency excitation sources of E1 and E2 are adjusted to 100 kHz and 950 kHz with the same amplitude of 5 Vpp, and the air gap is adjusted to 1 mm.
Figure 5. Configuration of the test bench.
4. Results and Discussion
Figure 6 shows the scanning result of Ux. Figure 7 demonstrates the nonlinear deviation of Ux for the reading of x-coordinate. From Figures 6 and 7, we observe the following:
1. The peak-to-peak value of Ux is about 24.7139 V, thus the displacement sensitivity for the x-axis position is about 1.54 mV per micron. The variation of Ux is almost linearly related to the x-axis position, however, a nonlinear deviation with a level of 0.0087 mm to −0.0058 mm exists in Ux, which is approximately 0.11% of the full measurement range in the x-axis direction.
2. To evaluate the independence of Ux with respect to the transition that occurs in the y-axis direction, for each scanning position in the x-axis, the outputs of Ux at all the 65 positions of the y-axis, as shown in Figure 6, are adopted for the calculation of the uncertainty of x-coordinate readings. The utilized method is the standard deviation and the result is presented in Figure 8, where the maximum value is 0.0009 mm. It indicates that the transition of the mover in the y-axis direction merely affects the measurement result of the x-coordinate.
Figure 6. Scanning result of Ux.
.-6-4-202468-15-10
-505
1015
-8 -6 -4 -2 0 2 4 6 8x-axis (mm)
Ux
(V)
Figure 6. Scanning result of Ux.
Sensors 2016, 16, 691 6 of 9Sensors 2016, 16, 691 6 of 9
Figure 7. Nonlinear deviations of Ux.
Figure 8. Uncertainty of x-coordinate readings.
Figure 9 gives the scanning result of Uy. Accordingly, Figure 10 illustrates the nonlinear deviation of Uy for the reading of the y-coordinate. From Figures 9 and 10, we observe the following:
1. The peak-to-peak value of Uy is 24.0039 V, thus the displacement sensitivity for the y-axis position is about 1.50 mV per micron. The variation of Uy is basically linear with respect to the y-axis position. A nonlinear deviation with a level of 0.066 mm to −0.037 mm exists in Uy, which is approximately 0.82% of the full measurement range in the y-axis direction.
2. Similarly, to evaluate the independence of Uy, for each scanning position in the y-axis, the outputs of Uy at all the 65 positions of the x-axis, as shown in Figure 9, are adopted for the calculation of the uncertainty of the y-coordinate readings. The result is presented in Figure 11, where the maximum value is 0.0012 mm. Thus the transition in the x-axis direction displays no evident influence on the measurement results of the y-coordinate.
3. Even though the displacement sensitivity and readings uncertainty show no significant differences between the two measurement directions, the nonlinear deviation suffers a sharp rise for the y-coordinate readings compared with the response of the x-axis. Considering the same signal processing circuit, such a diversity could be caused by the different excitation frequencies assigned for x-axis position sensing and for y-axis position sensing, namely the 100 kHz and the 950 kHz.
Figure 9. Scanning result of Uy.
.-6-4-202468-10
-505
10
-8 -6 -4 -2 0 2 4 6 8x-axis (mm)
Non
linea
r dev
iatio
n(μ
m)
0
0.25
0.5
0.75
1
-8 -6 -4 -2 0 2 4 6 8
Unc
erta
inty
(μm
)
x-axis (mm)
.-6
-4
-2
02468-20-10
01020
-8 -6 -4 -2 0 2 4 6 8
Uy
(V)
y-axis (mm)
Figure 7. Nonlinear deviations of Ux.
Sensors 2016, 16, 691 6 of 9
Figure 7. Nonlinear deviations of Ux.
Figure 8. Uncertainty of x-coordinate readings.
Figure 9 gives the scanning result of Uy. Accordingly, Figure 10 illustrates the nonlinear deviation of Uy for the reading of the y-coordinate. From Figures 9 and 10, we observe the following:
1. The peak-to-peak value of Uy is 24.0039 V, thus the displacement sensitivity for the y-axis position is about 1.50 mV per micron. The variation of Uy is basically linear with respect to the y-axis position. A nonlinear deviation with a level of 0.066 mm to −0.037 mm exists in Uy, which is approximately 0.82% of the full measurement range in the y-axis direction.
2. Similarly, to evaluate the independence of Uy, for each scanning position in the y-axis, the outputs of Uy at all the 65 positions of the x-axis, as shown in Figure 9, are adopted for the calculation of the uncertainty of the y-coordinate readings. The result is presented in Figure 11, where the maximum value is 0.0012 mm. Thus the transition in the x-axis direction displays no evident influence on the measurement results of the y-coordinate.
3. Even though the displacement sensitivity and readings uncertainty show no significant differences between the two measurement directions, the nonlinear deviation suffers a sharp rise for the y-coordinate readings compared with the response of the x-axis. Considering the same signal processing circuit, such a diversity could be caused by the different excitation frequencies assigned for x-axis position sensing and for y-axis position sensing, namely the 100 kHz and the 950 kHz.
Figure 9. Scanning result of Uy.
.-6-4-202468-10
-505
10
-8 -6 -4 -2 0 2 4 6 8x-axis (mm)
Non
linea
r dev
iatio
n(μ
m)
0
0.25
0.5
0.75
1
-8 -6 -4 -2 0 2 4 6 8
Unc
erta
inty
(μm
)
x-axis (mm)
.-6
-4
-2
02468-20-10
01020
-8 -6 -4 -2 0 2 4 6 8
Uy
(V)
y-axis (mm)
Figure 8. Uncertainty of x-coordinate readings.
Figure 9 gives the scanning result of Uy. Accordingly, Figure 10 illustrates the nonlinear deviationof Uy for the reading of the y-coordinate. From Figures 9 and 10 we observe the following:
1. The peak-to-peak value of Uy is 24.0039 V, thus the displacement sensitivity for the y-axis positionis about 1.50 mV per micron. The variation of Uy is basically linear with respect to the y-axisposition. A nonlinear deviation with a level of 0.066 mm to ´0.037 mm exists in Uy, which isapproximately 0.82% of the full measurement range in the y-axis direction.
2. Similarly, to evaluate the independence of Uy, for each scanning position in the y-axis, the outputsof Uy at all the 65 positions of the x-axis, as shown in Figure 9, are adopted for the calculationof the uncertainty of the y-coordinate readings. The result is presented in Figure 11, where themaximum value is 0.0012 mm. Thus the transition in the x-axis direction displays no evidentinfluence on the measurement results of the y-coordinate.
3. Even though the displacement sensitivity and readings uncertainty show no significantdifferences between the two measurement directions, the nonlinear deviation suffers a sharp risefor the y-coordinate readings compared with the response of the x-axis. Considering the samesignal processing circuit, such a diversity could be caused by the different excitation frequenciesassigned for x-axis position sensing and for y-axis position sensing, namely the 100 kHz and the950 kHz.
Sensors 2016, 16, 691 6 of 9
Figure 7. Nonlinear deviations of Ux.
Figure 8. Uncertainty of x-coordinate readings.
Figure 9 gives the scanning result of Uy. Accordingly, Figure 10 illustrates the nonlinear deviation of Uy for the reading of the y-coordinate. From Figures 9 and 10, we observe the following:
1. The peak-to-peak value of Uy is 24.0039 V, thus the displacement sensitivity for the y-axis position is about 1.50 mV per micron. The variation of Uy is basically linear with respect to the y-axis position. A nonlinear deviation with a level of 0.066 mm to −0.037 mm exists in Uy, which is approximately 0.82% of the full measurement range in the y-axis direction.
2. Similarly, to evaluate the independence of Uy, for each scanning position in the y-axis, the outputs of Uy at all the 65 positions of the x-axis, as shown in Figure 9, are adopted for the calculation of the uncertainty of the y-coordinate readings. The result is presented in Figure 11, where the maximum value is 0.0012 mm. Thus the transition in the x-axis direction displays no evident influence on the measurement results of the y-coordinate.
3. Even though the displacement sensitivity and readings uncertainty show no significant differences between the two measurement directions, the nonlinear deviation suffers a sharp rise for the y-coordinate readings compared with the response of the x-axis. Considering the same signal processing circuit, such a diversity could be caused by the different excitation frequencies assigned for x-axis position sensing and for y-axis position sensing, namely the 100 kHz and the 950 kHz.
Figure 9. Scanning result of Uy.
.-6-4-202468-10
-505
10
-8 -6 -4 -2 0 2 4 6 8x-axis (mm)
Non
linea
r dev
iatio
n(μ
m)
0
0.25
0.5
0.75
1
-8 -6 -4 -2 0 2 4 6 8
Unc
erta
inty
(μm
)
x-axis (mm)
.-6
-4
-2
02468-20-10
01020
-8 -6 -4 -2 0 2 4 6 8
Uy
(V)
y-axis (mm)
Figure 9. Scanning result of Uy.
Sensors 2016, 16, 691 7 of 9Sensors 2016, 16, 691 7 of 9
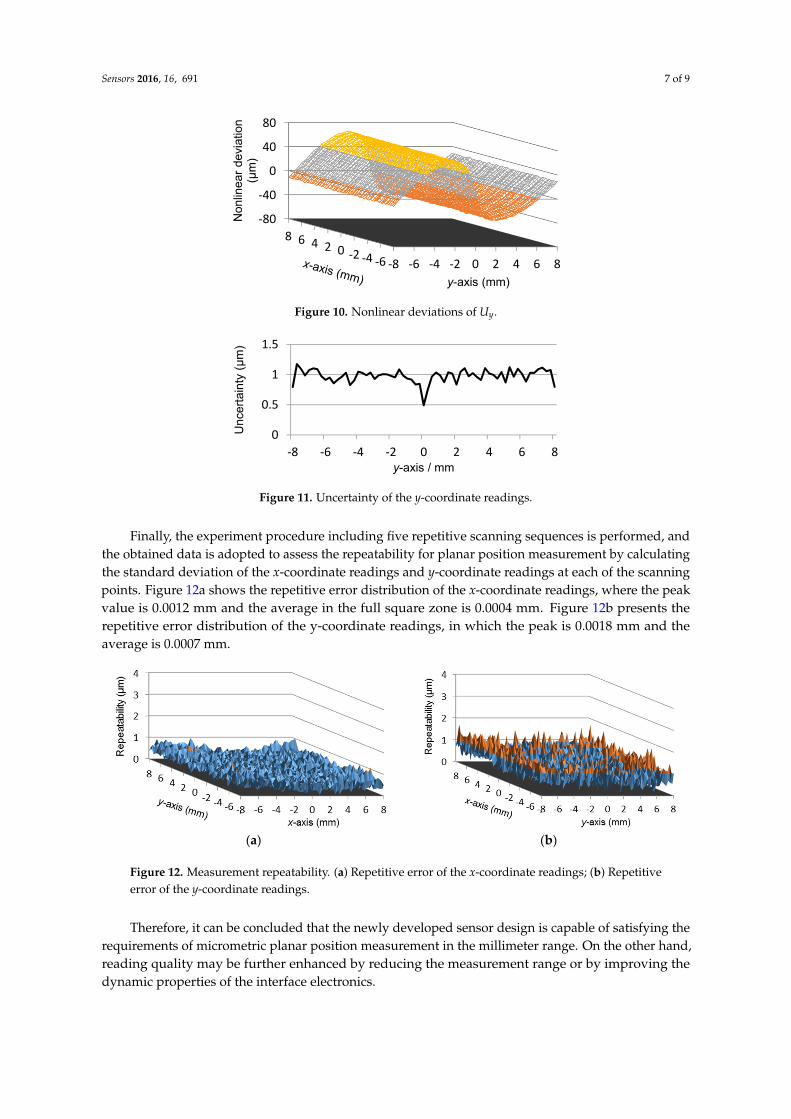
Figure 10. Nonlinear deviations of Uy.
Figure 11. Uncertainty of the y-coordinate readings.
Finally, the experiment procedure including five repetitive scanning sequences is performed, and the obtained data is adopted to assess the repeatability for planar position measurement by calculating the standard deviation of the x-coordinate readings and y-coordinate readings at each of the scanning points. Figure 12a shows the repetitive error distribution of the x-coordinate readings, where the peak value is 0.0012 mm and the average in the full square zone is 0.0004 mm. Figure 12b presents the repetitive error distribution of the y-coordinate readings, in which the peak is 0.0018 mm and the average is 0.0007 mm.
Therefore, it can be concluded that the newly developed sensor design is capable of satisfying the requirements of micrometric planar position measurement in the millimeter range. On the other hand, reading quality may be further enhanced by reducing the measurement range or by improving the dynamic properties of the interface electronics.
(a) (b)
Figure 12. Measurement repeatability. (a) Repetitive error of the x-coordinate readings; (b) Repetitive error of the y-coordinate readings.
5. Conclusions
In conclusion, a new capacitive planar position sensor design is proposed. Its operation principle is summarized, and the general performance is investigated using a laboratory built PCB
.-6-4-202468-80
-40
0
40
80
-8 -6 -4 -2 0 2 4 6 8
Non
linea
r dev
iatio
n (μ
m)
y-axis (mm)
0
0.5
1
1.5
-8 -6 -4 -2 0 2 4 6 8
Unc
erta
inty
(μm
)
y-axis / mm
Figure 10. Nonlinear deviations of Uy.
Sensors 2016, 16, 691 7 of 9
Figure 10. Nonlinear deviations of Uy.
Figure 11. Uncertainty of the y-coordinate readings.
Finally, the experiment procedure including five repetitive scanning sequences is performed, and the obtained data is adopted to assess the repeatability for planar position measurement by calculating the standard deviation of the x-coordinate readings and y-coordinate readings at each of the scanning points. Figure 12a shows the repetitive error distribution of the x-coordinate readings, where the peak value is 0.0012 mm and the average in the full square zone is 0.0004 mm. Figure 12b presents the repetitive error distribution of the y-coordinate readings, in which the peak is 0.0018 mm and the average is 0.0007 mm.
Therefore, it can be concluded that the newly developed sensor design is capable of satisfying the requirements of micrometric planar position measurement in the millimeter range. On the other hand, reading quality may be further enhanced by reducing the measurement range or by improving the dynamic properties of the interface electronics.
(a) (b)
Figure 12. Measurement repeatability. (a) Repetitive error of the x-coordinate readings; (b) Repetitive error of the y-coordinate readings.
5. Conclusions
In conclusion, a new capacitive planar position sensor design is proposed. Its operation principle is summarized, and the general performance is investigated using a laboratory built PCB
.-6-4-202468-80
-40
0
40
80
-8 -6 -4 -2 0 2 4 6 8
Non
linea
r dev
iatio
n (μ
m)
y-axis (mm)
0
0.5
1
1.5
-8 -6 -4 -2 0 2 4 6 8
Unc
erta
inty
(μm
)
y-axis / mm
Figure 11. Uncertainty of the y-coordinate readings.
Finally, the experiment procedure including five repetitive scanning sequences is performed, andthe obtained data is adopted to assess the repeatability for planar position measurement by calculatingthe standard deviation of the x-coordinate readings and y-coordinate readings at each of the scanningpoints. Figure 12a shows the repetitive error distribution of the x-coordinate readings, where the peakvalue is 0.0012 mm and the average in the full square zone is 0.0004 mm. Figure 12b presents therepetitive error distribution of the y-coordinate readings, in which the peak is 0.0018 mm and theaverage is 0.0007 mm.
Sensors 2016, 16, 691 7 of 9
Figure 10. Nonlinear deviations of Uy.
Figure 11. Uncertainty of the y-coordinate readings.
Finally, the experiment procedure including five repetitive scanning sequences is performed, and the obtained data is adopted to assess the repeatability for planar position measurement by calculating the standard deviation of the x-coordinate readings and y-coordinate readings at each of the scanning points. Figure 12a shows the repetitive error distribution of the x-coordinate readings, where the peak value is 0.0012 mm and the average in the full square zone is 0.0004 mm. Figure 12b presents the repetitive error distribution of the y-coordinate readings, in which the peak is 0.0018 mm and the average is 0.0007 mm.
Therefore, it can be concluded that the newly developed sensor design is capable of satisfying the requirements of micrometric planar position measurement in the millimeter range. On the other hand, reading quality may be further enhanced by reducing the measurement range or by improving the dynamic properties of the interface electronics.
(a) (b)
Figure 12. Measurement repeatability. (a) Repetitive error of the x-coordinate readings; (b) Repetitive error of the y-coordinate readings.
5. Conclusions
In conclusion, a new capacitive planar position sensor design is proposed. Its operation principle is summarized, and the general performance is investigated using a laboratory built PCB
.-6-4-202468-80
-40
0
40
80
-8 -6 -4 -2 0 2 4 6 8
Non
linea
r dev
iatio
n (μ
m)
y-axis (mm)
0
0.5
1
1.5
-8 -6 -4 -2 0 2 4 6 8
Unc
erta
inty
(μm
)
y-axis / mm
Figure 12. Measurement repeatability. (a) Repetitive error of the x-coordinate readings; (b) Repetitiveerror of the y-coordinate readings.
Therefore, it can be concluded that the newly developed sensor design is capable of satisfying therequirements of micrometric planar position measurement in the millimeter range. On the other hand,reading quality may be further enhanced by reducing the measurement range or by improving thedynamic properties of the interface electronics.
Sensors 2016, 16, 691 8 of 9
5. Conclusions
In conclusion, a new capacitive planar position sensor design is proposed. Its operation principleis summarized, and the general performance is investigated using a laboratory built PCB prototype.Based on the experimental results, the implemented mono sensing electrode and the hybrid-frequencyexcitation strategy are proved to be an effective method for the simplification of sensor structure andfor the suppression of cross interference in 2D position measurement. Within a square zone of 256 mm2,the prototype achieves a displacement sensitivity of about 1.50 mV per micron and measurementrepeatability better than 0.002 mm. In addition, due to the large dimensions and the strong couplingsignal; the mono sensing electrode can be mounted separately from the accessory board. Thus wesuggest that this research provides a valuable alternative solution for flexible and low-cost planarposition detection applications on the micrometric and sub-micrometric scale.
Acknowledgments: This work is supported in part by the National Natural Science Foundation of Chinaunder Grant 51105343, and in part by the Natural Science Foundation of Zhejiang Province, China underGrant LQ12E05004.
Author Contributions: Hongxiang Yu wrote the paper and designed the idea; Yu Zhang designed the experiments;Mengfeng Shen performed the experiments; Hongli Zhang and Zhao Gao analyzed the data; Dongyun Wangcontributed to the proof reading.
Conflicts of Interest: The authors declare no conflict of interest.
Abbreviations
The following abbreviations are used in this manuscript:
PCB Printed circuit board2D Two dimensionAC Alternative currentDC Direct current
References
1. Gao, W.; Kim, S.W.; Bosse, H.; Haitjema, H.; Chen, Y.L.; Lu, X.D.; Knapp, W.; Weckenmann, A.; Estler, W.T.;Kunzmann, H. Measurement technologies for precision positioning. CIRP Ann. Manuf. Technol. 2015, 64,773–796. [CrossRef]
2. Yang, P.; Takamura, T.; Takahashi, S.; Takamasu, K.; Sato, O.; Osawa, S.; Takatsuji, T. Development ofhigh-precision micro-coordinate measuring machine: Multi-probe measurement system for measuring yawand straightness motion error of XY linear stage. Precis. Eng. 2011, 35, 424–430. [CrossRef]
3. Mariko, K.; Kaoru, M. Calibration of linear encoders with sub-nanometer uncertainty using anoptical-zooming laser interferometer. Precis. Eng. 2014, 38, 769–774.
4. Huang, W.S.; Liu, C.W.; Hsu, P.L.; Yeh, S.S. Precision Control and Compensation of Servomotors and MachineTools via the Disturbance Observer. IEEE Trans. Ind. Electr. 2010, 57, 420–429. [CrossRef]
5. Shirinzadeh, B.; Teoh, P.L.; Tian, Y.; Dalvand, M.M.; Zhong, Y.; Liaw, H.C. Laser interferometry-basedguidance methodology for high precision positioning of mechanisms and robots. Robot. Comsput. Integr.Manuf. 2010, 26, 74–82. [CrossRef]
6. Brown, D.; Friedrich, D.; Bruckner, F.; Carbone, L.; Schnabel, R.; Freise, A. Invariance of waveguide gratingmirrors to lateral displacement phase Shifts. Opt. Lett. 2013, 38, 1844–1846. [CrossRef] [PubMed]
7. Smith, P.T.; Vallance, R.R.; Marsh, E. Correcting capacitive displacement measurement in metrologyapplications with cylindrical artefacts. Precis. Eng. 2005, 29, 324–335. [CrossRef]
8. Meyer, H.U. An integrated capacitive position sensor. IEEE Trans. Instrum. Meas. 1996, 45, 521–525.[CrossRef]
9. Liu, C.H.; Cheng, C.H. Development of a grating based multi-degree-of freedom laser linear encoder usingdiffracted light. Sens. Actuators A Phys. 2012, 181, 87–93. [CrossRef]
10. Liu, Y.M.; Yuan, M.Q.; Cao, J.R.; Cui, J.W.; Tan, J.B. Use of Two Planar Gratings to Measure 3-DOFDisplacements of Planar Moving Stage. IEEE Trans. Instrum. Meas. 2015, 64, 163–169.

Sensors 2016, 16, 691 9 of 9
11. Thurner, T.; Zechner, C. Phase-based algorithm for 2D displacement estimation of laser speckle patterns. InProceedings of the IEEE Instrumentation and Measurement Technology Conference Proceedings, Victoria,BC, Canada, 12–15 May 2008; pp. 2173–2178.
12. Ioan, A.I.; Mihai, A.; Guillaume, J.L. High Dynamics and Precision Optical Measurement Using a PositionSensitive Detector (PSD) in Reflection-Mode: Application to 2D Object Tracking over a Smart Surface. Sensors2012, 12, 16771–16784. [CrossRef] [PubMed]
13. Yu, J.P.; Wang, W.; Lu, K.Q.; Mei, D.Q.; Chen, Z.C. A planar capacitive sensor for 2D long-range displacementmeasurement. J. Zhejiang Univ. Sci. C 2013, 14, 252–257. [CrossRef]
© 2016 by the authors; licensee MDPI, Basel, Switzerland. This article is an open accessarticle distributed under the terms and conditions of the Creative Commons Attribution(CC-BY) license (http://creativecommons.org/licenses/by/4.0/).


![excitation Zijun Yu and Elliot R. Bernstein Decomposition ... · THE JOURNAL OF CHEMICAL PHYSICS 135, 154305 (2011) Decomposition of pentaerythritol tetranitrate [C(CH 2ONO 2) 4]](https://img.pdfslide.us/doc/110x75/5e787db4b732f263ad767ab0/excitation-zijun-yu-and-elliot-r-bernstein-decomposition-the-journal-of-chemical.jpg)