Embed Size (px)
Citation preview

PJM©2013www.pjm.com
Economic DR participation in energy market
ERCOT
April 14, 2014
Pete Langbein

PJM©20132www.pjm.com
PJM Opportunity by Wholesale Service
Wholesale Service
Demand Side Response
Energy Efficiency
Price Responsive Demand*
Capacity Yes Yes yes
Energy Yes
Day Ahead Scheduling Reserves (30 min)
Yes
Synchronized Reserves (10 min)
Yes
Regulation Yes
Customer may participate as Emergency and Economic DSR and as EE
*PRD recently approved by FERC

PJM©20133www.pjm.com
Electric Distribution Company (EDC):
Distribution assets used to distribute the electricity to the customer.
Curtailment Service Provider (CSP):Demand side response activity by the customer.
Load Serving Entity (LSE):
Electricity supply to the customer.
Market Structure – who does what?
End Use
Customer
Energy Efficiency Provider (EERP):
Energy efficiency activity by the customer.

PJM©20134www.pjm.com
Current (2013) DSR capability ~ 6% of System Peak Load
Represents over 1 million end use customers (~14,000 C&I) across PJM
EE679 MW
Emergency DR(Capacity)8,976 MW
Economic DR Capability(Energy)
2,616 MW~900 MW offered
into energy market on peak day

PJM©20135www.pjm.com
Evolution of DR in Energy Market
~ 10 Years
Purely voluntary –
any that shows up can only
help
Help balance
power flow and set prices

PJM©20136www.pjm.com
G&T compensation structure process
• Define LSE, retail contract type, and default G&T rate on registration– RT index (only participate in RT market and receive make
whole payment)
– DA index (only participate in RT market)
– “Fixed” Price (participate in either market)
– Registration default G&T rate applied to hourly settlement
• Registration sent to LSE to review & approve
• Each settlement sent to LSE to review and approve– Ensure G&T is accurate.

PJM©20137www.pjm.com
Economic DR resources offer into energy market
Market offer ($)
Market offer ($)
Market offer ($)
Small site participation
through aggregation
Generation & small demand resources
in PJM market

PJM©20138www.pjm.com
Summary of Economic DR offer rules
• DR must have valid registration– Market offers are by Registration or by Dispatch Group
• Dispatch Group = multiple registrations at same price point with one offer curve
• DR energy market participation options– Offer in Day-Ahead market
• if cleared must respond– Dispatch in Real-Time market
• Ability to adjust hourly MW available up to 3 hours prior to operating hour.
– LMP => Net Benefits Test (~$30 mwh) to receive compensation• Actual load reduction must be +/-20% of hourly cleared
or dispatched MW otherwise:– No “make whole” payment up to Offer price– Balancing Operating Charges are applied

PJM©20139www.pjm.com
Day Ahead Energy Market
• If actual load reductions are less than cleared amount then must buy back at real-time LMP
• If actual load reduction are more than cleared amount then compensated at real-time LMP
• PJM puts in sell offer (negative dec bid) against LSE of record’s account– Intention is to help ensure LSE is not accidently long
to market because of DR load reductions.
PJM©201310www.pjm.com
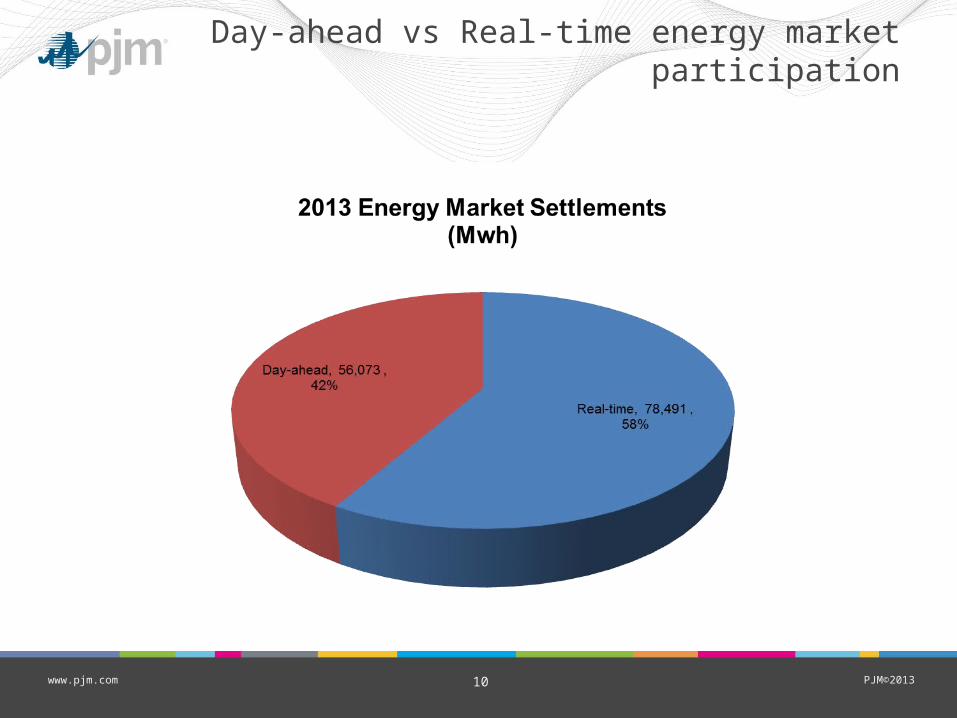
Day-ahead vs Real-time energy market participation

PJM©201311www.pjm.com
Economic Demand Response Dispatched vs SettledReal-Time Energy Market Summary (2013)
Year Month CSP RegistrationsDispatched
(MWh)Settled (MWh) %
Settled Hours Avg MW
2013 1 6 43 1,951 2,054 105% 699 32013 2 2 10 452 733 162% 295 22013 3 3 15 597 962 161% 480 2
2013 4 4 13 685 678 99% 472 1
2013 5 5 31 2,416 3,051 126% 718 4
2013 6 4 38 8,694 8,053 93% 1,068 8
2013 7 11 151 20,445 16,504 81% 3,613 5
2013 8 7 37 11,576 12,445 108% 2,054 6
2013 9 7 61 11,084 10,191 92% 1,329 8
2013 10 3 18 7,860 8,689 111% 1,252 7
2013 11 4 40 6,114 6,662 109% 789 8
2013 12 3 23 6,617 7,197 109% 1,264 6
YTD Totals 78,491 77,218 98% 14,033 6
Average hourly settlement per registration = 6 MW

PJM©201312www.pjm.com
Economic Demand Response Dispatched vs SettledDay-Ahead Energy Market Summary (2013)
Year Month CSP RegistrationsCleared (MWh)
Settled (MWh) %
Settled Hours Avg MW
2013 1 4 6 5,387 5,233 97% 172 302013 2 4 5 5,403 5,508 102% 183 302013 3 4 5 6,349 6,558 103% 212 312013 4 3 4 5,463 5,410 99% 109 502013 5 3 4 4,569 4,638 102% 157 302013 6 8 19 5,472 5,833 107% 399 152013 7 10 73 10,174 10,352 102% 1,477 72013 8 8 35 3,282 2,669 81% 616 42013 9 9 36 4,677 4,427 95% 512 92013 10 3 6 1,841 2,123 115% 225 92013 11 4 5 1,399 1,676 120% 204 82013 12 6 9 2,056 2,165 105% 284 8
YTD Totals 56,073 56,593 101% 4,550 12
Average hourly settlement per registration = 12 MW

PJM©201313www.pjm.com
Appendix
• Net Benefits Test

PJM©201314www.pjm.com
Net Benefits Test
FERC final rule stipulates that DR be compensated full LMP when two conditions are met:1. DR has the capability to balance supply and demand; and2. Payment of LMP to DR is cost effective.
Cleared or dispatched DSR resources balance supply and demand. Payment of LMP to DR is cost effective when the LMP of the cleared or dispatched DSR is greater than or equal to the Net Benefits Price.
The net benefits test to define a threshold point on the PJM Supply curve where the net benefit exceeds the cost to load. The net benefit is the point where elasticity is equal to 1.
• Supply elasticity is defined as the percentage change in quantity supplied divided by the percentage change in price. When the elasticity is less than or equal to one, supply is considered inelastic.
• Generally, an "elastic" variable is one which responds "a lot" to small changes in other parameters. Similarly, an "inelastic" variable describes one which does not change much in response to changes in other parameters.

PJM©201315www.pjm.com
Net Benefits Test – Supply Curve
To create the curve:
• Use a Supply Curve representative of the study month using the prior year’s curve
• Adjust for resource availability
• Adjust for fuel prices
• Smooth the curve using numerical methods• PJM staff has developed a methodology that results in a curve fit that it believes correlates well to the general shape of the PJM supply curve.
• 𝐿𝑀𝑃= ( − )+ 𝑎 𝑏∗𝑚𝑤 𝑐 𝑑The constants a, b, c, and d vary for each month’s solution.

PJM©201316www.pjm.com
Net Benefits Test

PJM©201317www.pjm.com
Net Benefits Test Results
The Net Benefits Test results are calculated monthly and published by the 15th of the prior month, per FERC Order.
The Net Benefits Test results can be found on the PJM website by selecting:markets & operations / Demand Response / Net Benefits Test Results