Embed Size (px)
Citation preview
Pivotal Research Group 853 Broadway, Suite 1406 New York, NY 10003
Important Disclosures Are Located In The Appendix
PIVOTAL Pivotal Research Group
U.S. Equity Research Advertising
Advertising Agency Holding Companies Initiating Sector Coverage; WPP is Our Top Pick
January 27, 2012
BOTTOM LINE: We are initiating coverage on global agency holding companies with a BUY rating on IPG and WPP and a HOLD rating on OMC. SECTOR DURABILITY UNDER-APPRECIATED; AGENCIES ARE PRIMARY BENEFICIARIES OF DIGITAL MEDIA. Investor concern about the threat of disintermediation by the likes of Google is generally unwarranted. Agencies offer unique services to their clients, namely “service” itself in helping navigate ideas through marketers’ organizations. This competency is not typically developed by media technology companies. While agencies are unlikely to ever see operating margins like those of the media owners given the fragmented and highly competitive nature of the industry, their ability to adapt should not be underestimated. Digital media is increasing the importance of agencies and service providers as filters and navigators of ideas. As such, the agency sector is literally a “digital dividend” on the application of technology to marketing. TOP PICK: WPP, DARING TO DREAM. We like the company’s long-term exposure to China – possibly the most significant of any western media-related company – its independent digital platform and its dominant media services business. We have a BUY rating and a target price of 960p for the U.K. listed shares (or $75 for the American Depository Receipts, which trade as WPPGY and represent five ordinary shares each). This represents a 28% premium to the current stock price. At target, the company would be trading at a 13.4x P/E multiple, with a 2.6% dividend yield, and sustained growth to that dividend and earnings more broadly. IPG: A STRONG STORY STOCK. We believe there is also significant upside in Interpublic, as the company continues to build confidence with the investor community about its ability to bring operating margins up to peer levels and sustain competitive organic revenue growth. Our experience with the company’s senior management gives us conviction about the company’s ability to execute against the goals it has set for itself. Generation of cash flow from improved working capital policies should be a meaningful – and, we believe, under-appreciated – source of value as well. However, as the company improves operating margins and reduces perceived risk, investors will look for IPG to produce more international exposure. We have a BUY rating and target price of $13.00 for IPG, or 27% upside. OMC: A BELLWETHER APPROACHING FAIR VALUE. While we - and much of the agency industry – have long been impressed by Omnicom the holding company and its component business units, the stock is closer to “fair value” than either of IPG and WPP. As a stable bellwether on the sector, investors can still gain low near-term risk-adjusted exposure to agencies through OMC. However, as with IPG the company needs sustained efforts in Asia Pacific and other faster growing markets to out-perform in the long-term. As well, when compared against its best peer example, WPP, the company’s focus on “culture” rather than strategy means that OMC is not as well future-proofed as WPP and thus faces incrementally higher long-term risks. We have a HOLD rating and target price for OMC is $51, or 9% upside.
Brian Wieser, CFA 212-514-4682 [email protected]
WPP (WPP.L / WPPGY)
RATING: BUY (Previous: N/A)
Target Price: 960p / $75.00 (Previous: N/A)
Price (1/26/12): 751.5p / $59.04
IPG (IPG)
RATING: BUY (Previous: N/A)
Target Price: $13.00 (Previous: N/A)
Price (1/26/12): $10.25
OMNICOM (OMC)
RATING: HOLD (Previous: N/A)
Target Price: $51.00 (Previous: N/A)
Price (1/26/12): $46.74
- 2 - Brian Wieser 212-514-4682 Pivotal Research Group
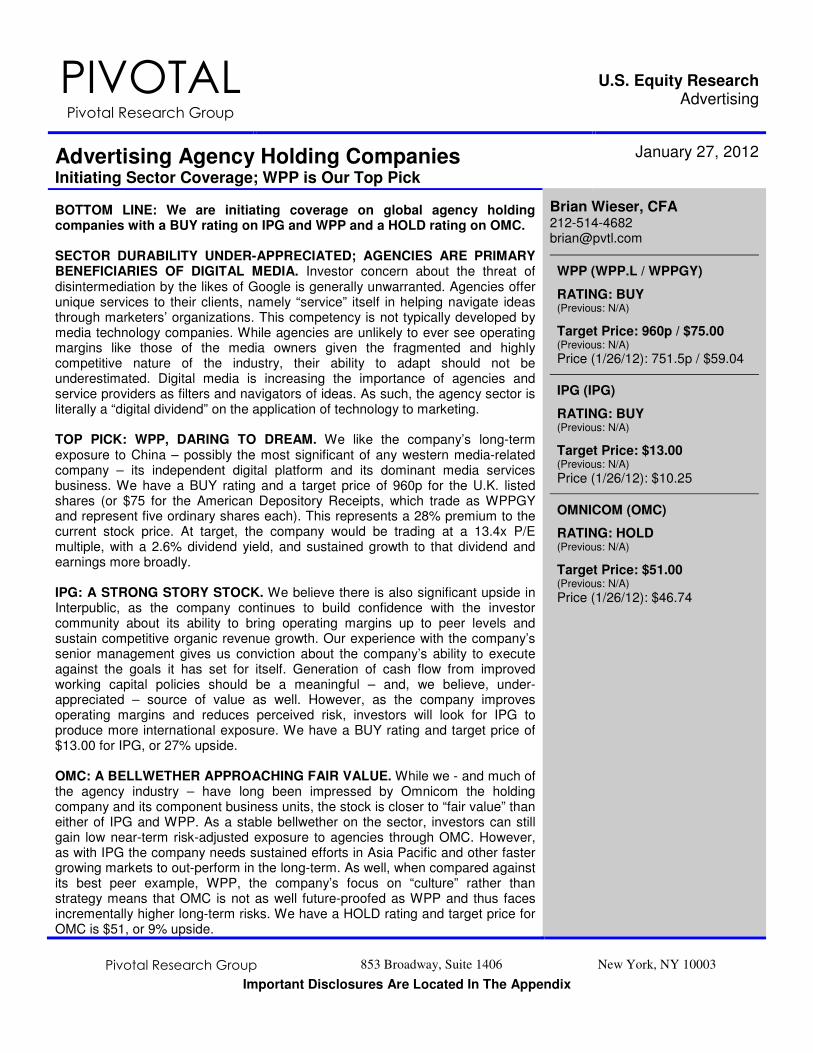
INITIATING ON ADVERTISING AGENCY HOLDING COMPANIES WITH BUY RATING ON WPP/WPPGY AND IPG, HOLD ON OMC DIGITAL MEDIA IMPACT UNDER-APPRECIATED; AGENCIES ARE PRIMARY BENEFICIARIES. Advertising agencies are primary beneficiaries of the rise of digital, as increasing fragmentation of consumer media choices significantly expands the range of ways in which marketers can allocate budgets. This makes an external filter increasingly important, and agencies are uniquely positioned to serve as this role. Further, the need to “socialize” ideas and new ways of marketing through large companies is increasingly crucial. In any given company there are many stakeholders who influence and are affected by marketing choices. They may work in a product development unit, a trade sales function or other areas. It is the responsibility of a CMO and their team to ensure buy-in for the marketing activities the company undertakes. Regardless of type of agency, marketing services companies’ unique competency is supporting clients’ efforts to perform this socialization function. SIGNIFICANT INTERNATIONAL EXPOSURE; UNIQUE CHINA OPPORTNITY. The holding companies are disproportionately exposed to markets outside of the United States, which under normalized macro-economic circumstances should contribute to higher growth (through participation in faster economic growth generated by emerging markets) and lower risk (by virtue of diversifying country exposure). While WPP generates fully two thirds of its revenues outside of North America, even the nominally American holding companies Interpublic and Omnicom generate approximately half of their revenues outside of the United States. Slower growing western continental European markets account for a significant share of this international exposure, but still only account for 25% of WPP revenues, and less for IPG and OMC. For point of comparison, among the global media conglomerates only News Corp. comes close to this level of international focus, with less than half of revenues coming from abroad, and much of this from Europe and Australia. CBS, Disney, Time Warner, Viacom and Discovery only generate 15-33% of their revenues outside of the United States. More importantly, the agency business appears to be one of few western media-related industries capable of capturing a significant foothold in China. Content production and distribution businesses are highly restricted from operating in the country; paid search from foreign providers (via Google) have mostly been pushed out; domestic social media and other online publishers are already well-entrenched. By contrast, agencies are mostly unencumbered to compete in their industry, which is generating revenues of $4bn annually on double digit growth rates. While Omnicom and Interpublic generate only modest revenues in that market today, WPP is already approaching $1bn in annual revenue from China. DURABLE LONG-TERM OPERATING MARGINS. Although the “standard” 15% commission is a thing of the past, the standard 15% operating margin is alive and well. In the world of marketing services, there is an implicit (and sometimes explicit) understanding between marketers and their agencies that the agencies should make a “reasonable” profit if their businesses are well run. Conventionally, many services (such as those offered by creative and media agencies) are organized to generate a 15% operating margin. This holds even when marketers’ procurement teams involve themselves in designing an agency’s processes for servicing an account, and even when clients aim to reduce total fees they pay agencies for like-for-like services every year. In this context, it becomes evident why well-run agencies need to constantly deploy new higher margin services (which today include Corporate Barter or Trading Desks) and look for savings in other areas (such as by outsourcing creative production to countries with lower costs). The development of new businesses and cost-saving initiatives are a steady-state feature of the business, and do not by themselves lead to higher margins for the companies as a whole.
- 3 - Brian Wieser 212-514-4682 Pivotal Research Group
Risks Investors will also need to consider the following among the industry’s risks: SQUEEZING FEES. As we described it above, marketers are typically squeezing their agencies for operational efficiencies on an ongoing basis. Agencies have historically proven resilient in finding cost saving opportunities to perform like-for-like services. However at some point such efforts may no longer yield incremental benefits, and as long as agencies operate in a competitive manner they will suffer. In a similar light, high margin services offered today are typically likely to become standard-margin services in the future, as the more a service becomes standardized, the more that marketers’ procurement teams seek to standardize processes and drive agency margin out of the activity. COMPETITION FROM ADJACENT INDUSTRIES. We remain skeptical that today’s digital media companies such as Google or Microsoft will ever actively compete with agencies. This should hold not least because digital media companies will want to retain their margins (significantly higher than those for agency services) but also because clients generally want some perceived independence from advisors making marketing budget recommendations. However, agencies are increasingly placed up against IT services firms. This type of competition is likely to increase in the future, although not across all marketing-related disciplines. Companies such as Accenture and IBM are positioning parts of their businesses adjacent to agencies as they seek to build platforms which can manage the execution of media campaigns, monitor the impact of those campaigns and integrate those efforts with an array of marketing data within a company’s ERP (enterprise resource planning) system. Sapient’s business lines represent the strongest balance between these functions today, although they have not yet materially impacted the holding companies. Further, media suppliers (such as Hearst and Meredith) and software developers (such as Adobe) have also established competitive positions in some fields previously reserved for agencies, such as in search engine marketing. Given the extremely long selling cycles and the duration of agency-marketer contracts (usually several years in length) as well as the operational considerations for marketers in changing their own processes, no upstart can transform the agency industry overnight. The bigger issue is whether or not agencies are able to sufficiently adapt their own offerings in the time they have before a new service becomes a standard expectation. REDUCED COMPETITION BETWEEN MARKETERS. We have previously identified that advertising spending – and marketing in general – is primarily driven by the competitive intensity that is present within a given category. To the extent that industries evolve to feature reduced levels of competitive intensity, marketing services would generally suffer.
- 4 - Brian Wieser 212-514-4682 Pivotal Research Group
An Existential Question: Why Do Agencies Exist? As media and marketing platforms have become increasingly pervasive and fragmented, the imperative for marketers to rely upon intermediaries for marketing advisory services and executions has grown. Marketers could choose to do almost anything an agency does (including media buying, as occurs today at some companies such as InBev’s Anheuser-Busch in the United States). But the scale at which even the world’s largest marketers operate is usually insufficient to manage many marketing services as well or as inexpensively as the agencies. Consequently, they tend to perform functions themselves which are either highly strategic or which require deep integration with brand/product or sales functions. In general, marketers usually outsource:
• The aggregation of data and development of consumer insights which inform marketing choices
• The translation of branding ideas into advertising campaigns, including the production of creative assets
• The filtering of sales pitches from owners of media assets for thousands of potential executions into perhaps dozens or fewer
• The cost-effective execution of advertising campaigns through media owners Other functions frequently outsourced in whole or in part to agencies include:
• Design of customer-facing elements (stores, websites or the look-and-feel of the underlying products occasionally)
• Management of internet-related assets (such as a brand’s website) • Management of marketing events • Search engine marketing and website design (except when these functions are highly
strategic to a business, as with an e-commerce site) • Brand development • Public relations management • CRM (customer relationship management) strategy, data management and program
execution
- 5 - Brian Wieser 212-514-4682 Pivotal Research Group
Agencies And the Risk of Dis-intermediation The most critical element supporting the durability of the marketing services industry relates to the complexity of the marketers’ own organizations. In recent decades, as marketers became bigger and bigger, they pursued more efficient structures for their operating divisions. Often this meant separating common functions where economies of scale might be realized, or where best practices might best be established. As a result, large marketers typically established centralized marketing groups. These groups were usually headed by a CMO who had no responsibility for business units, indirect responsibility for revenue or share growth and complete responsibility for marketing costs. From the outset these centralized marketing groups needed to interact with other centralized functions, including IT and finance, in addition to business unit functions more directly related to marketing. But as marketers have come to face more and more choices for their marketing strategies, they increasingly rely upon external and ostensibly neutral partners – such as agencies – to both filter ideas and support the socialization of initiatives or process changes across the broader organization. This factor is the most critical one which explains why agencies face no credible threat of disintermediation from technology-driven marketing or media platforms. However, there are some areas impacted by the rise of digital media that increasingly places agencies up against today’s IT services firm. Companies such as Accenture and IBM have become increasingly adjacent to agencies as they seek to build platforms which can both manage the execution of media campaigns and monitor the impact of those campaigns, both by measuring external media exposures and by integrating an array of marketing data within the company’s ERP (enterprise resource planning) systems. Sapient’s business lines are the strongest balance between these functions today, although their impact on the broader industry has not yet been material to the holding companies. Further, media suppliers (such as Hearst and Meredith) and software developers (such as Adobe) have also established competitive positions in some fields previously reserved for agencies, such as search engine marketing. Given the extremely long selling cycles and the duration of agency-marketer contracts (usually several years in length), no IT services firm can transform the agency industry overnight. The bigger threat is whether or not over the extended period of time it takes for this blending of services to become mainstream agencies are able to sufficiently adapt their own offerings.
- 6 - Brian Wieser 212-514-4682 Pivotal Research Group
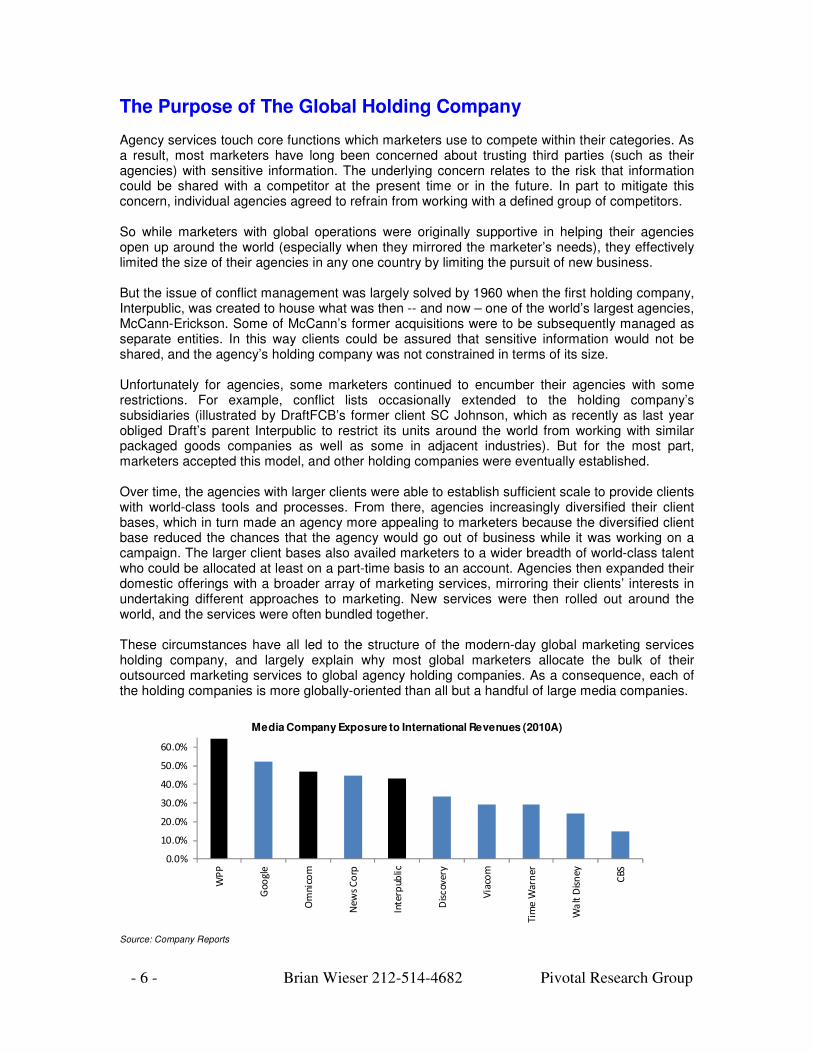
The Purpose of The Global Holding Company Agency services touch core functions which marketers use to compete within their categories. As a result, most marketers have long been concerned about trusting third parties (such as their agencies) with sensitive information. The underlying concern relates to the risk that information could be shared with a competitor at the present time or in the future. In part to mitigate this concern, individual agencies agreed to refrain from working with a defined group of competitors. So while marketers with global operations were originally supportive in helping their agencies open up around the world (especially when they mirrored the marketer’s needs), they effectively limited the size of their agencies in any one country by limiting the pursuit of new business. But the issue of conflict management was largely solved by 1960 when the first holding company, Interpublic, was created to house what was then -- and now – one of the world’s largest agencies, McCann-Erickson. Some of McCann’s former acquisitions were to be subsequently managed as separate entities. In this way clients could be assured that sensitive information would not be shared, and the agency’s holding company was not constrained in terms of its size. Unfortunately for agencies, some marketers continued to encumber their agencies with some restrictions. For example, conflict lists occasionally extended to the holding company’s subsidiaries (illustrated by DraftFCB’s former client SC Johnson, which as recently as last year obliged Draft’s parent Interpublic to restrict its units around the world from working with similar packaged goods companies as well as some in adjacent industries). But for the most part, marketers accepted this model, and other holding companies were eventually established. Over time, the agencies with larger clients were able to establish sufficient scale to provide clients with world-class tools and processes. From there, agencies increasingly diversified their client bases, which in turn made an agency more appealing to marketers because the diversified client base reduced the chances that the agency would go out of business while it was working on a campaign. The larger client bases also availed marketers to a wider breadth of world-class talent who could be allocated at least on a part-time basis to an account. Agencies then expanded their domestic offerings with a broader array of marketing services, mirroring their clients’ interests in undertaking different approaches to marketing. New services were then rolled out around the world, and the services were often bundled together. These circumstances have all led to the structure of the modern-day global marketing services holding company, and largely explain why most global marketers allocate the bulk of their outsourced marketing services to global agency holding companies. As a consequence, each of the holding companies is more globally-oriented than all but a handful of large media companies.
0.0%
10.0%
20.0%
30.0%
40.0%
50.0%
60.0%
70.0%
WP
P
Goo
gle
Om
nic
om
Ne
ws
Co
rp
Inte
rpub
lic
Dis
covery
Via
com
Tim
e W
arn
er
Wa
lt D
isn
ey
CBS
Media Company Exposure to International Revenues (2010A)
Source: Company Reports
- 7 - Brian Wieser 212-514-4682 Pivotal Research Group
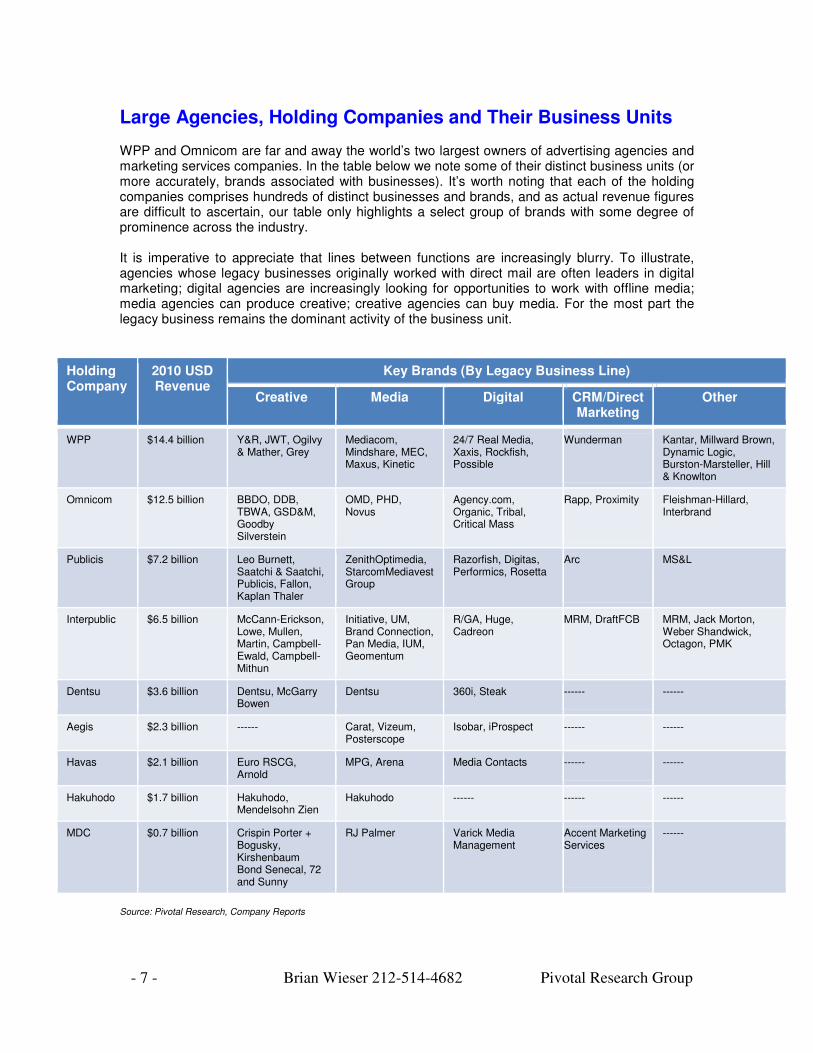
Large Agencies, Holding Companies and Their Business Units WPP and Omnicom are far and away the world’s two largest owners of advertising agencies and marketing services companies. In the table below we note some of their distinct business units (or more accurately, brands associated with businesses). It’s worth noting that each of the holding companies comprises hundreds of distinct businesses and brands, and as actual revenue figures are difficult to ascertain, our table only highlights a select group of brands with some degree of prominence across the industry. It is imperative to appreciate that lines between functions are increasingly blurry. To illustrate, agencies whose legacy businesses originally worked with direct mail are often leaders in digital marketing; digital agencies are increasingly looking for opportunities to work with offline media; media agencies can produce creative; creative agencies can buy media. For the most part the legacy business remains the dominant activity of the business unit.
Holding Company
2010 USD Revenue
Key Brands (By Legacy Business Line)
Creative Media Digital CRM/Direct Marketing
Other
WPP $14.4 billion Y&R, JWT, Ogilvy & Mather, Grey
Mediacom, Mindshare, MEC, Maxus, Kinetic
24/7 Real Media, Xaxis, Rockfish, Possible
Wunderman Kantar, Millward Brown, Dynamic Logic, Burston-Marsteller, Hill & Knowlton
Omnicom $12.5 billion BBDO, DDB, TBWA, GSD&M, Goodby Silverstein
OMD, PHD, Novus
Agency.com, Organic, Tribal, Critical Mass
Rapp, Proximity Fleishman-Hillard, Interbrand
Publicis $7.2 billion Leo Burnett, Saatchi & Saatchi, Publicis, Fallon, Kaplan Thaler
ZenithOptimedia, StarcomMediavest Group
Razorfish, Digitas, Performics, Rosetta
Arc MS&L
Interpublic $6.5 billion McCann-Erickson, Lowe, Mullen, Martin, Campbell-Ewald, Campbell-Mithun
Initiative, UM, Brand Connection, Pan Media, IUM, Geomentum
R/GA, Huge, Cadreon
MRM, DraftFCB MRM, Jack Morton, Weber Shandwick, Octagon, PMK
Dentsu $3.6 billion Dentsu, McGarry Bowen
Dentsu 360i, Steak ------ ------
Aegis $2.3 billion ------ Carat, Vizeum, Posterscope
Isobar, iProspect ------ ------
Havas $2.1 billion Euro RSCG, Arnold
MPG, Arena Media Contacts ------ ------
Hakuhodo $1.7 billion Hakuhodo, Mendelsohn Zien
Hakuhodo ------ ------ ------
MDC $0.7 billion Crispin Porter + Bogusky, Kirshenbaum Bond Senecal, 72 and Sunny
RJ Palmer Varick Media Management
Accent Marketing Services
------
Source: Pivotal Research, Company Reports
- 8 - Brian Wieser 212-514-4682 Pivotal Research Group
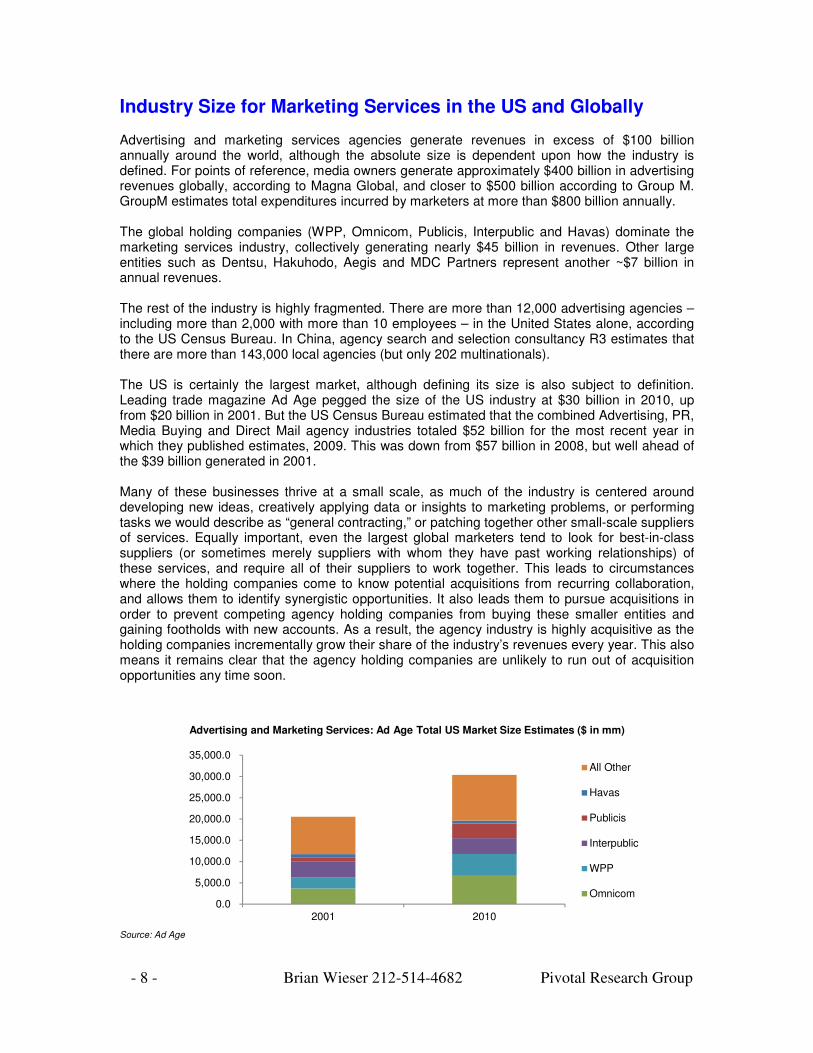
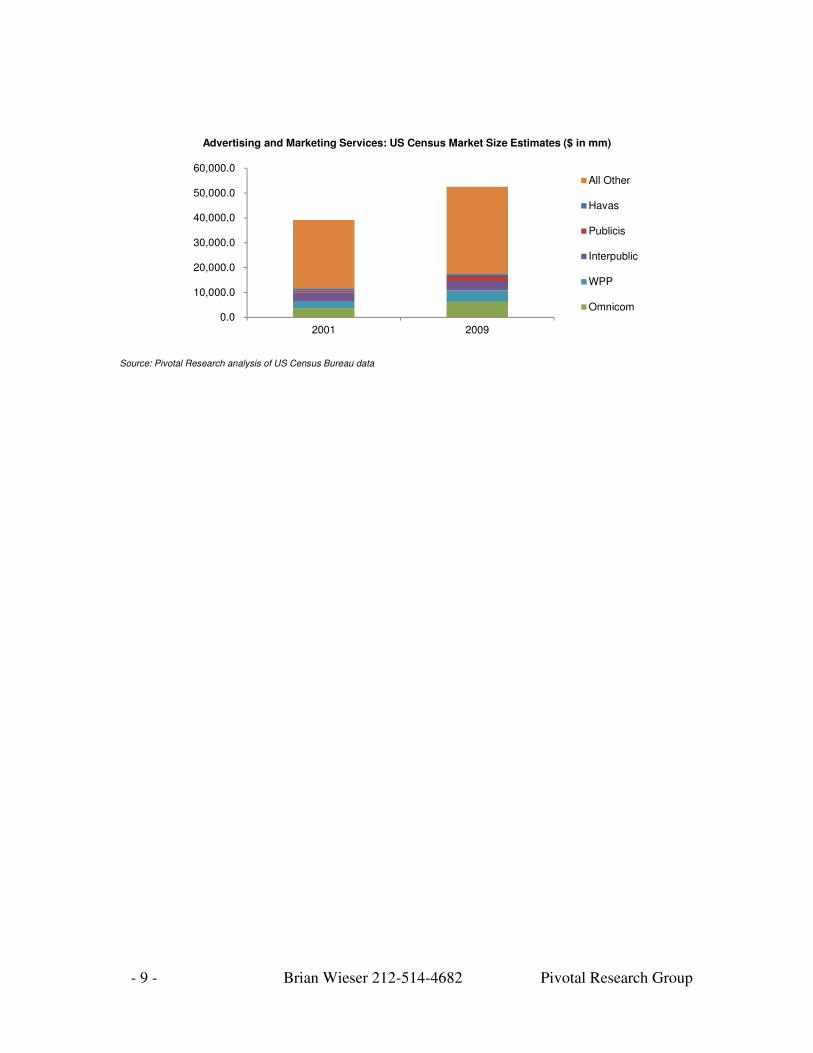
Industry Size for Marketing Services in the US and Globally Advertising and marketing services agencies generate revenues in excess of $100 billion annually around the world, although the absolute size is dependent upon how the industry is defined. For points of reference, media owners generate approximately $400 billion in advertising revenues globally, according to Magna Global, and closer to $500 billion according to Group M. GroupM estimates total expenditures incurred by marketers at more than $800 billion annually. The global holding companies (WPP, Omnicom, Publicis, Interpublic and Havas) dominate the marketing services industry, collectively generating nearly $45 billion in revenues. Other large entities such as Dentsu, Hakuhodo, Aegis and MDC Partners represent another ~$7 billion in annual revenues. The rest of the industry is highly fragmented. There are more than 12,000 advertising agencies – including more than 2,000 with more than 10 employees – in the United States alone, according to the US Census Bureau. In China, agency search and selection consultancy R3 estimates that there are more than 143,000 local agencies (but only 202 multinationals). The US is certainly the largest market, although defining its size is also subject to definition. Leading trade magazine Ad Age pegged the size of the US industry at $30 billion in 2010, up from $20 billion in 2001. But the US Census Bureau estimated that the combined Advertising, PR, Media Buying and Direct Mail agency industries totaled $52 billion for the most recent year in which they published estimates, 2009. This was down from $57 billion in 2008, but well ahead of the $39 billion generated in 2001. Many of these businesses thrive at a small scale, as much of the industry is centered around developing new ideas, creatively applying data or insights to marketing problems, or performing tasks we would describe as “general contracting,” or patching together other small-scale suppliers of services. Equally important, even the largest global marketers tend to look for best-in-class suppliers (or sometimes merely suppliers with whom they have past working relationships) of these services, and require all of their suppliers to work together. This leads to circumstances where the holding companies come to know potential acquisitions from recurring collaboration, and allows them to identify synergistic opportunities. It also leads them to pursue acquisitions in order to prevent competing agency holding companies from buying these smaller entities and gaining footholds with new accounts. As a result, the agency industry is highly acquisitive as the holding companies incrementally grow their share of the industry’s revenues every year. This also means it remains clear that the agency holding companies are unlikely to run out of acquisition opportunities any time soon.
0.0
5,000.0
10,000.0
15,000.0
20,000.0
25,000.0
30,000.0
35,000.0
2001 2010
All Other
Havas
Publicis
Interpublic
WPP
Omnicom
Advertising and Marketing Services: Ad Age Total US Market Size Estimates ($ in mm)
Source: Ad Age
- 9 - Brian Wieser 212-514-4682 Pivotal Research Group
0.0
10,000.0
20,000.0
30,000.0
40,000.0
50,000.0
60,000.0
2001 2009
All Other
Havas
Publicis
Interpublic
WPP
Omnicom
Advertising and Marketing Services: US Census Market Size Estimates ($ in mm)
Source: Pivotal Research analysis of US Census Bureau data
- 10 - Brian Wieser 212-514-4682 Pivotal Research Group
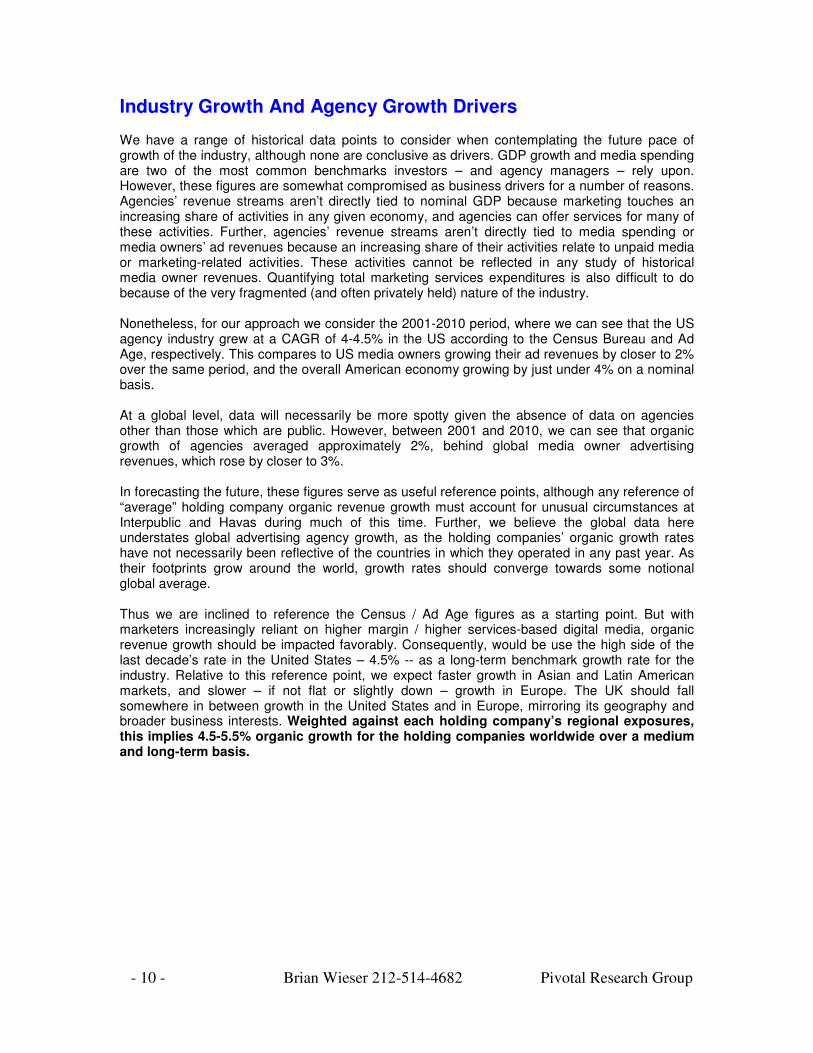
Industry Growth And Agency Growth Drivers We have a range of historical data points to consider when contemplating the future pace of growth of the industry, although none are conclusive as drivers. GDP growth and media spending are two of the most common benchmarks investors – and agency managers – rely upon. However, these figures are somewhat compromised as business drivers for a number of reasons. Agencies’ revenue streams aren’t directly tied to nominal GDP because marketing touches an increasing share of activities in any given economy, and agencies can offer services for many of these activities. Further, agencies’ revenue streams aren’t directly tied to media spending or media owners’ ad revenues because an increasing share of their activities relate to unpaid media or marketing-related activities. These activities cannot be reflected in any study of historical media owner revenues. Quantifying total marketing services expenditures is also difficult to do because of the very fragmented (and often privately held) nature of the industry.
Nonetheless, for our approach we consider the 2001-2010 period, where we can see that the US agency industry grew at a CAGR of 4-4.5% in the US according to the Census Bureau and Ad Age, respectively. This compares to US media owners growing their ad revenues by closer to 2% over the same period, and the overall American economy growing by just under 4% on a nominal basis. At a global level, data will necessarily be more spotty given the absence of data on agencies other than those which are public. However, between 2001 and 2010, we can see that organic growth of agencies averaged approximately 2%, behind global media owner advertising revenues, which rose by closer to 3%.
In forecasting the future, these figures serve as useful reference points, although any reference of “average” holding company organic revenue growth must account for unusual circumstances at Interpublic and Havas during much of this time. Further, we believe the global data here understates global advertising agency growth, as the holding companies’ organic growth rates have not necessarily been reflective of the countries in which they operated in any past year. As their footprints grow around the world, growth rates should converge towards some notional global average. Thus we are inclined to reference the Census / Ad Age figures as a starting point. But with marketers increasingly reliant on higher margin / higher services-based digital media, organic revenue growth should be impacted favorably. Consequently, would be use the high side of the last decade’s rate in the United States – 4.5% -- as a long-term benchmark growth rate for the industry. Relative to this reference point, we expect faster growth in Asian and Latin American markets, and slower – if not flat or slightly down – growth in Europe. The UK should fall somewhere in between growth in the United States and in Europe, mirroring its geography and broader business interests. Weighted against each holding company’s regional exposures, this implies 4.5-5.5% organic growth for the holding companies worldwide over a medium and long-term basis.
- 11 - Brian Wieser 212-514-4682 Pivotal Research Group
Top-line organic growth trends at agencies are generally driven by factors including:
• Account growth. A primary focus for agencies involves the selling-in of new services from a current agency or from a sibling under the same holding company umbrella. This kind of growth should have disproportionate impact on agency margins, not least to fight ongoing compression of pricing for legacy services. Consequently, the new services that are particularly high margin – especially anything related to social media, trading desks or barter – are increasingly important components of account growth.
• Net new business. Many clients churn through agencies with regularity, and as a result,
a strong department focused on new business is critical to standing still. For example, General Motors this week expanded its relationship with Aegis for media services, adding markets including the United States at Publicis’ expense. While this is of course favorable for Aegis and unfavorable for Publicis, it bears noting that Aegis is now the third agency group to represent GM’s media interests in the US in the past decade.
• International expansion. International growth can be viewed through the lens of
following existing accounts as they expand their operations or by establishing new operations in new markets and seeking local accounts. The former approach is typically lower risk and more synergistic, but ultimately provides lower rewards as marketers are likely to cap the margin upside that their agency could receive from the additional business. The latter approach is higher risk and at least initially less synergistic, but offers tremendous reward potential as local – and frequently higher margin – business is secured.
-20.0%
-15.0%
-10.0%
-5.0%
0.0%
5.0%
10.0%
15.0%
2002
2003
2004
2005
2006
2007
2008
2009
2010
Holding Companies:Organic Revenue
Ad Age: Agency IndustryRevenue
Census: Agency IndustryRevenue
US National Media AdRevenue
US All Media Ad Revenue
US Nominal GDP
US Advertising Industry Revenue Growth and Potential Drivers
-15.0%
-10.0%
-5.0%
0.0%
5.0%
10.0%
Media Owner AdvertisingRevenues - Global ConstantCurrency
Weighted Average OrganicRevenue Growth for HoldingCompanies
Global Advertising Industry and Media Owner Ad Revenue Growth
Source: Pivotal Research, Company Reports, Ad Age, US Census Bureau, Magna Global
- 12 - Brian Wieser 212-514-4682 Pivotal Research Group
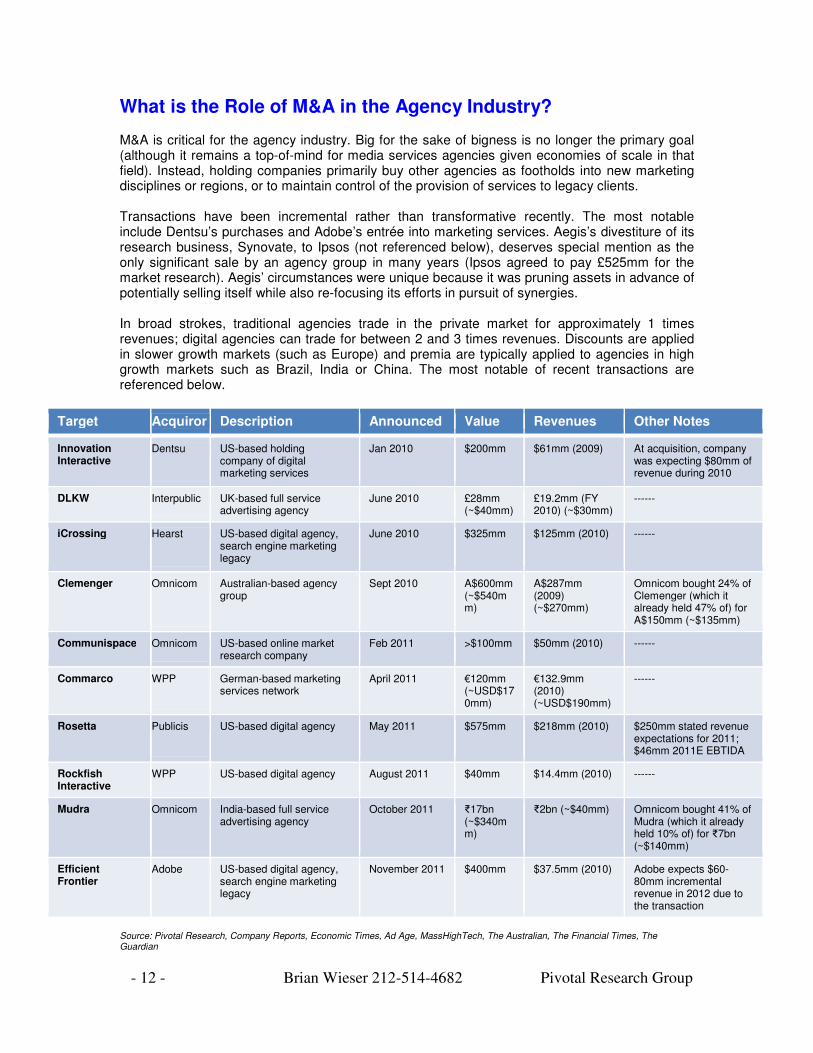
What is the Role of M&A in the Agency Industry? M&A is critical for the agency industry. Big for the sake of bigness is no longer the primary goal (although it remains a top-of-mind for media services agencies given economies of scale in that field). Instead, holding companies primarily buy other agencies as footholds into new marketing disciplines or regions, or to maintain control of the provision of services to legacy clients. Transactions have been incremental rather than transformative recently. The most notable include Dentsu’s purchases and Adobe’s entrée into marketing services. Aegis’s divestiture of its research business, Synovate, to Ipsos (not referenced below), deserves special mention as the only significant sale by an agency group in many years (Ipsos agreed to pay £525mm for the market research). Aegis’ circumstances were unique because it was pruning assets in advance of potentially selling itself while also re-focusing its efforts in pursuit of synergies. In broad strokes, traditional agencies trade in the private market for approximately 1 times revenues; digital agencies can trade for between 2 and 3 times revenues. Discounts are applied in slower growth markets (such as Europe) and premia are typically applied to agencies in high growth markets such as Brazil, India or China. The most notable of recent transactions are referenced below.
Target Acquiror Description Announced Value Revenues Other Notes
Innovation Interactive
Dentsu US-based holding company of digital marketing services
Jan 2010 $200mm $61mm (2009) At acquisition, company was expecting $80mm of revenue during 2010
DLKW Interpublic UK-based full service advertising agency
June 2010 £28mm (~$40mm)
£19.2mm (FY 2010) (~$30mm)
------
iCrossing Hearst US-based digital agency, search engine marketing legacy
June 2010 $325mm $125mm (2010) ------
Clemenger Omnicom Australian-based agency group
Sept 2010 A$600mm (~$540mm)
A$287mm (2009) (~$270mm)
Omnicom bought 24% of Clemenger (which it already held 47% of) for A$150mm (~$135mm)
Communispace Omnicom US-based online market research company
Feb 2011 >$100mm $50mm (2010) ------
Commarco WPP German-based marketing services network
April 2011 €120mm (~USD$170mm)
€132.9mm (2010) (~USD$190mm)
------
Rosetta Publicis US-based digital agency May 2011 $575mm $218mm (2010) $250mm stated revenue expectations for 2011; $46mm 2011E EBTIDA
Rockfish Interactive
WPP US-based digital agency August 2011 $40mm $14.4mm (2010) ------
Mudra Omnicom India-based full service advertising agency
October 2011 ₹17bn (~$340mm)
₹2bn (~$40mm) Omnicom bought 41% of Mudra (which it already held 10% of) for ₹7bn (~$140mm)
Efficient Frontier
Adobe US-based digital agency, search engine marketing legacy
November 2011 $400mm $37.5mm (2010) Adobe expects $60-80mm incremental revenue in 2012 due to the transaction
Source: Pivotal Research, Company Reports, Economic Times, Ad Age, MassHighTech, The Australian, The Financial Times, The Guardian
- 13 - Brian Wieser 212-514-4682 Pivotal Research Group
Future Consolidation The topic of consolidation is periodically an issue for the industry, and sometimes emerges as a topic of intense focus. This is unsurprising given the nature of today’s holding companies as the products of past roll-ups. Aegis and Havas are typically referenced in the context of further consolidation given a perceived lack of commitment to independence by the companies’ boards of directors. The catalyst for this uncertainty usually resolves back to French investor Vincent Bollore, who owns a plurality of shares in both companies (although Aegis has blocked Bollore’s operational involvement with Aegis on several occasions). Many scenarios have been contemplated in the past, including a merger between Havas and Aegis, or a sale of one or both, most likely involving Interpublic and Publicis (although WPP and Omnicom’s involvement should not be ruled out if an active sale process for either company were ever undertaken). However, with Aegis’ divestiture of its research division Synovate last year and subsequent statements by the company’s CEO, Jerry Buhlmann, the company reaffirmed its status as an independent entity…unless the price is right to make a transaction happen. Further consolidation would be favorable to the holding companies, if only because it may contribute to a reduced degree of competition when services are priced for clients. When pitches for new business occur one or two holding companies are inevitably ruled out because of insurmountable conflict issues, leaving (often) three or four competitors for every pitch. This contributes to highly competitive pricing, especially in servicing the world’s largest clients (which are often serviced at or below cost in order to secure a basic level of operating scale in some markets). To the extent that future pitches involved only two competitors, it is more likely that pricing discipline would be exercised. However, antitrust concerns may limit consolidation without some divestitures, as concentration levels in some countries – especially with respect to media buying on certain key media, such as television – would be very high.
- 14 - Brian Wieser 212-514-4682 Pivotal Research Group
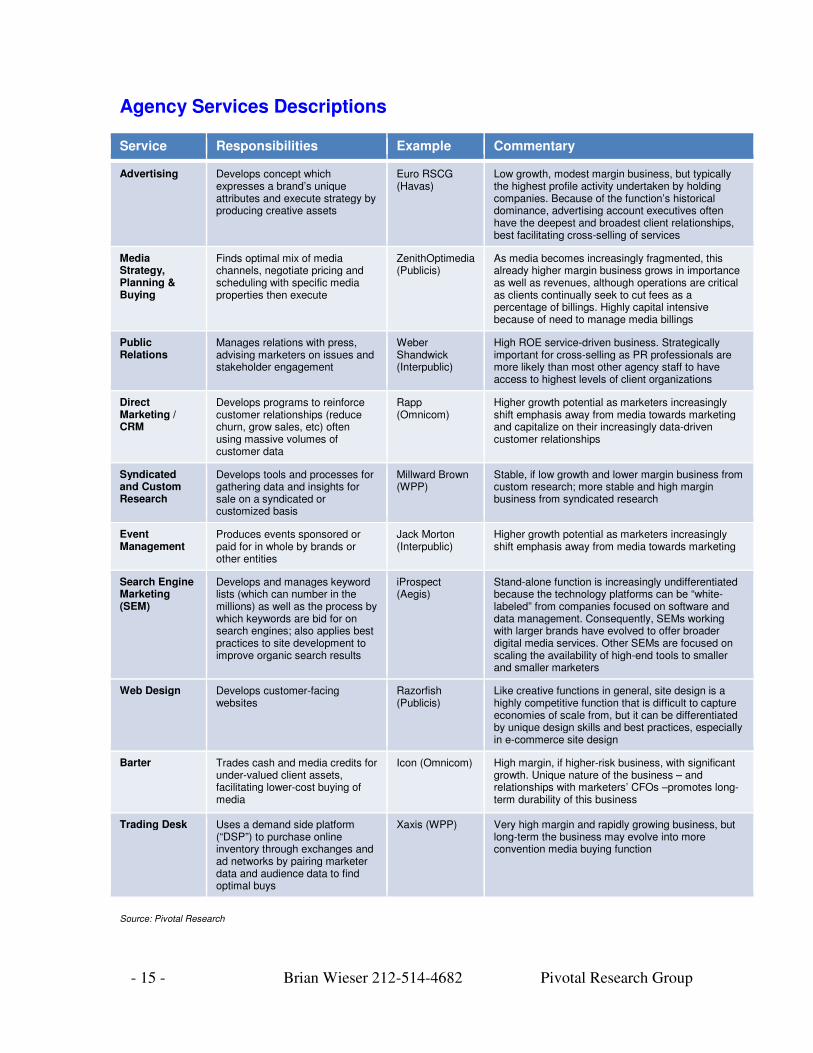
How Do Agencies Generate Revenue? What do marketing services agencies actually do to generate revenue? The industry has evolved substantially from the time when they provided ad sales representation for newspaper publishers in the 1860s. However, some aspects of the business remain constant: the industry remains highly entrepreneurial, and primarily services-driven. Just as the process of finding advertisers to fill newspaper pages begat the copy-writing business, and copy-writing begat art direction, creative strategy and media buying across multiple platforms, practitioners are constantly looking for ways to extend their client relationships in new ways. Consequently, while the global creative agency remains the archetypical business unit of the holding companies, these entities are increasingly diminishing in importance. At Interpublic, McCann-Erickson, Lowe and DraftFCB represents less than half of Interpublic’s revenues; at Publicis, Leo Burnett, Saatchi & Saatchi and the eponymous Publicis agency account for a similar share of their parent company’s activities. The figures are much lower, below a third, at WPP (whose global agencies include JWT, Y&R, Grey and Ogilvy & Mather) and Omnicom (which includes BBDO, DDB and TBWA). Agent-based activities now undertaken by distinct business types include “advertising” (referring to the overall brand development and related creative services), media strategy, planning & buying (often described in short-hand as “media buying”), public relations, direct marketing/customer relationship management (“CRM”), syndicated & custom research, event management, search engine marketing and web design. Barter and the concept of the Trading Desk represent modern-day returns to the original role of agencies, whereby these entities typically take principal positions in media inventory and re-sell it at a mark-up to (primarily) their parent company’s clients. Notably, these business models are not new in returning to agencies’ origins on the sell-side of the media industry: Publicis still operates a traditional newspaper and outdoor advertising representation unit called Medias et Regies, and Japanese agencies typically perform sales/representation tasks across most Japanese media. At a functional level, there remain many similarities across these otherwise diverse business units. Almost every agent-based function in marketing services firms features the following:
• The account manager has responsibility for services for specific clients. These individuals are critical to agencies as they are charged with managing – and growing -- the P&L attached to their clients. Their primary value is in helping clients to navigate their own organizations, and socializing new ideas that generate an agency more revenue.
• As a right-hand to account management, “strategy” roles focus upon tying any given activity to brand goals, or at least upon developing clever themes around which an execution is designed. This strategy function would in other industries be referred to as “product” development. Varying names may be used for this function, including “account planning” at advertising agencies or “communications planning” at media agencies, a role which is distinct from “media planning”
• Every discipline also involves some capacity to perform research, which in turn informs strategy and assess the impact of the executions.
Every discipline pursues activities associated with broadly-defined “digital” activities because every discipline can find new opportunities to grow through digital communications platforms. In part because of the novelty of digital media and myriad ways in which new platforms can serve as marketing vehicles, roles and responsibilities can get blurry, and are not necessarily provided for otherwise comparable marketers in similar ways. While this fragmentation of responsibilities strikes many observers as inefficient, it is a reaction to a continuous evolution of the industry. It is also reaction by holding companies’ agencies to the ongoing creation of independent agencies which continue to find new and often profitable niches.
- 15 - Brian Wieser 212-514-4682 Pivotal Research Group
Agency Services Descriptions
Service Responsibilities Example Commentary
Advertising Develops concept which expresses a brand’s unique attributes and execute strategy by producing creative assets
Euro RSCG (Havas)
Low growth, modest margin business, but typically the highest profile activity undertaken by holding companies. Because of the function’s historical dominance, advertising account executives often have the deepest and broadest client relationships, best facilitating cross-selling of services
Media Strategy, Planning & Buying
Finds optimal mix of media channels, negotiate pricing and scheduling with specific media properties then execute
ZenithOptimedia (Publicis)
As media becomes increasingly fragmented, this already higher margin business grows in importance as well as revenues, although operations are critical as clients continually seek to cut fees as a percentage of billings. Highly capital intensive because of need to manage media billings
Public Relations
Manages relations with press, advising marketers on issues and stakeholder engagement
Weber Shandwick (Interpublic)
High ROE service-driven business. Strategically important for cross-selling as PR professionals are more likely than most other agency staff to have access to highest levels of client organizations
Direct Marketing / CRM
Develops programs to reinforce customer relationships (reduce churn, grow sales, etc) often using massive volumes of customer data
Rapp (Omnicom)
Higher growth potential as marketers increasingly shift emphasis away from media towards marketing and capitalize on their increasingly data-driven customer relationships
Syndicated and Custom Research
Develops tools and processes for gathering data and insights for sale on a syndicated or customized basis
Millward Brown (WPP)
Stable, if low growth and lower margin business from custom research; more stable and high margin business from syndicated research
Event Management
Produces events sponsored or paid for in whole by brands or other entities
Jack Morton (Interpublic)
Higher growth potential as marketers increasingly shift emphasis away from media towards marketing
Search Engine Marketing (SEM)
Develops and manages keyword lists (which can number in the millions) as well as the process by which keywords are bid for on search engines; also applies best practices to site development to improve organic search results
iProspect (Aegis)
Stand-alone function is increasingly undifferentiated because the technology platforms can be “white-labeled” from companies focused on software and data management. Consequently, SEMs working with larger brands have evolved to offer broader digital media services. Other SEMs are focused on scaling the availability of high-end tools to smaller and smaller marketers
Web Design Develops customer-facing websites
Razorfish (Publicis)
Like creative functions in general, site design is a highly competitive function that is difficult to capture economies of scale from, but it can be differentiated by unique design skills and best practices, especially in e-commerce site design
Barter Trades cash and media credits for under-valued client assets, facilitating lower-cost buying of media
Icon (Omnicom) High margin, if higher-risk business, with significant growth. Unique nature of the business – and relationships with marketers’ CFOs –promotes long-term durability of this business
Trading Desk Uses a demand side platform (“DSP”) to purchase online inventory through exchanges and ad networks by pairing marketer data and audience data to find optimal buys
Xaxis (WPP) Very high margin and rapidly growing business, but long-term the business may evolve into more convention media buying function
Source: Pivotal Research
- 16 - Brian Wieser 212-514-4682 Pivotal Research Group
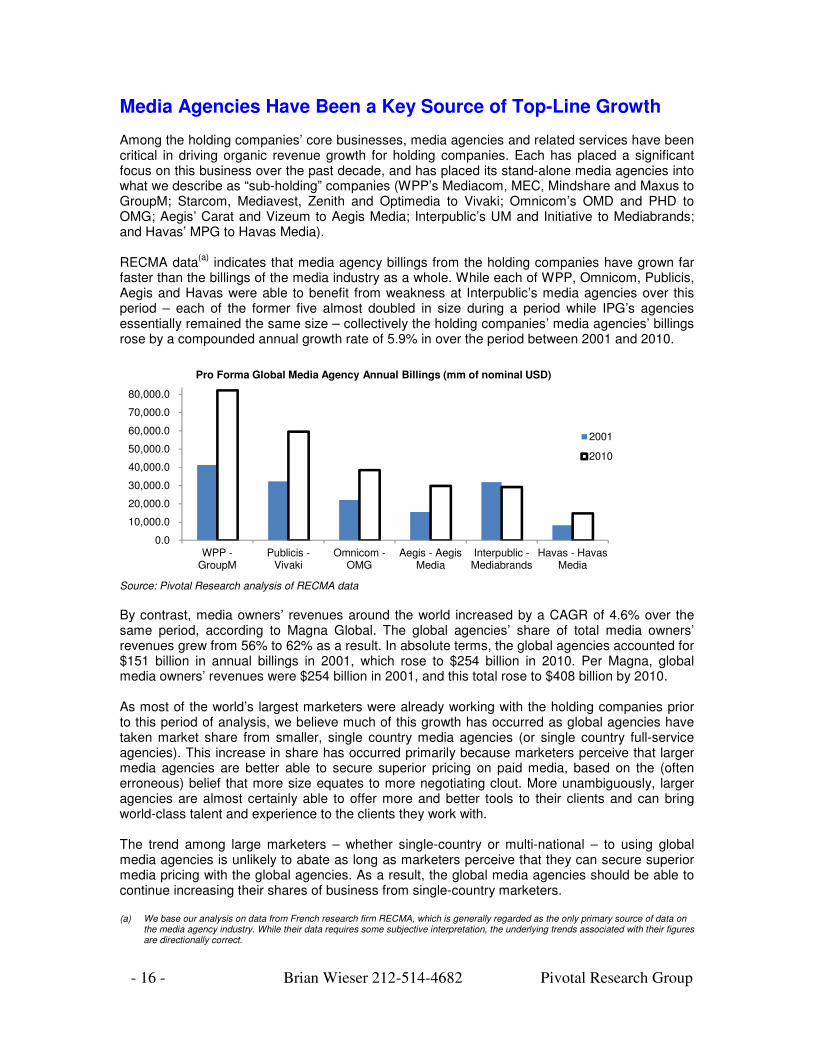
Media Agencies Have Been a Key Source of Top-Line Growth Among the holding companies’ core businesses, media agencies and related services have been critical in driving organic revenue growth for holding companies. Each has placed a significant focus on this business over the past decade, and has placed its stand-alone media agencies into what we describe as “sub-holding” companies (WPP’s Mediacom, MEC, Mindshare and Maxus to GroupM; Starcom, Mediavest, Zenith and Optimedia to Vivaki; Omnicom’s OMD and PHD to OMG; Aegis’ Carat and Vizeum to Aegis Media; Interpublic’s UM and Initiative to Mediabrands; and Havas’ MPG to Havas Media). RECMA data
(a) indicates that media agency billings from the holding companies have grown far
faster than the billings of the media industry as a whole. While each of WPP, Omnicom, Publicis, Aegis and Havas were able to benefit from weakness at Interpublic’s media agencies over this period – each of the former five almost doubled in size during a period while IPG’s agencies essentially remained the same size – collectively the holding companies’ media agencies’ billings rose by a compounded annual growth rate of 5.9% in over the period between 2001 and 2010.
0.0
10,000.0
20,000.0
30,000.0
40,000.0
50,000.0
60,000.0
70,000.0
80,000.0
90,000.0
WPP -GroupM
Publicis -Vivaki
Omnicom -OMG
Aegis - AegisMedia
Interpublic -Mediabrands
Havas - HavasMedia
2001
2010
Pro Forma Global Media Agency Annual Billings (mm of nominal USD)
Source: Pivotal Research analysis of RECMA data
By contrast, media owners’ revenues around the world increased by a CAGR of 4.6% over the same period, according to Magna Global. The global agencies’ share of total media owners’ revenues grew from 56% to 62% as a result. In absolute terms, the global agencies accounted for $151 billion in annual billings in 2001, which rose to $254 billion in 2010. Per Magna, global media owners’ revenues were $254 billion in 2001, and this total rose to $408 billion by 2010. As most of the world’s largest marketers were already working with the holding companies prior to this period of analysis, we believe much of this growth has occurred as global agencies have taken market share from smaller, single country media agencies (or single country full-service agencies). This increase in share has occurred primarily because marketers perceive that larger media agencies are better able to secure superior pricing on paid media, based on the (often erroneous) belief that more size equates to more negotiating clout. More unambiguously, larger agencies are almost certainly able to offer more and better tools to their clients and can bring world-class talent and experience to the clients they work with. The trend among large marketers – whether single-country or multi-national – to using global media agencies is unlikely to abate as long as marketers perceive that they can secure superior media pricing with the global agencies. As a result, the global media agencies should be able to continue increasing their shares of business from single-country marketers. (a) We base our analysis on data from French research firm RECMA, which is generally regarded as the only primary source of data on
the media agency industry. While their data requires some subjective interpretation, the underlying trends associated with their figures are directionally correct.
- 17 - Brian Wieser 212-514-4682 Pivotal Research Group
Compensation Structures Agency compensation models reflected their historical origins for many years: commissions, as a percentage of media billed. For one flat rate, often 15% of billings, agencies provided traditional creative and media services, and focused on managing their costs. However, less opaque – and typically lower – pricing for media services was prompted by the rise of the independent media agency beginning in the 1980s. As pricing fell, and the procurement function came into vogue for marketers, many clients replaced commissions with fee structures designed to ensure that agencies earned a mutually agreed upon operating margin, subject to pre-defined operating choices. Under these structures, as long as the account is well-managed, pre-defined margins are all but certain. Fees are far and away the dominant form of compensating agencies. A 2010 study for the ANA (the trade association for marketers) conducted by Jones Lundin Beals (a consultancy specializing in agency search and selection) indicated that commissions accounted for only 3% of compensation plans at advertising agencies that year, down from 16% in 2007. Sales commissions – whereby the agency is paid in part or in whole depending upon how the marketer’s business performs – accounted for 15% of compensation models. The consequences of compensation structures can be significant across the broader advertising industry. Marketing choices and spending on specific media platforms for many marketers can be effectively pre-determined in large part because of the contracts they agree to with their agencies. Importantly, conventions around fees may vary by country and by medium. In many markets around the world, clients expect their agencies to generate revenue through the volume-based rebates – also known as AVBs, or “Agency Volume Bonnifications” – they are encouraged to seek out from media owners. However, in many instances these AVBs are rebated back to clients (often in a contractually pre-determined manner) and the agency is then paid conventionally through fees. Media agencies may also be able to earn income from interest generated by effective management of the money they use for media billings. In all cases, these compensation structures are tacitly or – at least for Sarbanes-Oxley compliant companies – actively agreed to by the clients themselves, who typically account for these alternative compensation structures by reducing how much they pay the agency in commissions or other fees. One trend which has gained some prominence in recent periods relates to incentive fees. Many marketers have come to the conclusion that a utility-like fee structure may produce utility-like results, which may or may not be desirable. As a consequence, enterprising account executives and their finance teams often seek to incorporate fee structures which establish some mutually agreed-upon activity as a primary goal, and to ensure bonus payments to the agency in exchange for meeting or beating goals.
- 18 - Brian Wieser 212-514-4682 Pivotal Research Group
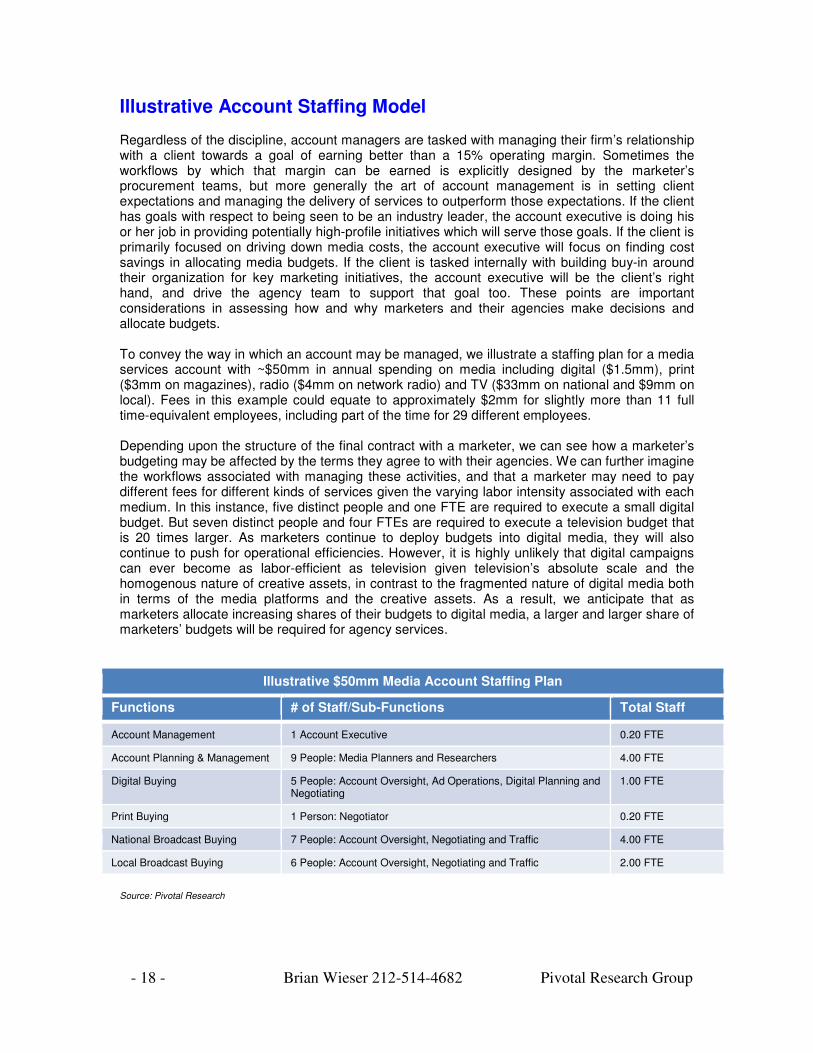
Illustrative Account Staffing Model Regardless of the discipline, account managers are tasked with managing their firm’s relationship with a client towards a goal of earning better than a 15% operating margin. Sometimes the workflows by which that margin can be earned is explicitly designed by the marketer’s procurement teams, but more generally the art of account management is in setting client expectations and managing the delivery of services to outperform those expectations. If the client has goals with respect to being seen to be an industry leader, the account executive is doing his or her job in providing potentially high-profile initiatives which will serve those goals. If the client is primarily focused on driving down media costs, the account executive will focus on finding cost savings in allocating media budgets. If the client is tasked internally with building buy-in around their organization for key marketing initiatives, the account executive will be the client’s right hand, and drive the agency team to support that goal too. These points are important considerations in assessing how and why marketers and their agencies make decisions and allocate budgets. To convey the way in which an account may be managed, we illustrate a staffing plan for a media services account with ~$50mm in annual spending on media including digital ($1.5mm), print ($3mm on magazines), radio ($4mm on network radio) and TV ($33mm on national and $9mm on local). Fees in this example could equate to approximately $2mm for slightly more than 11 full time-equivalent employees, including part of the time for 29 different employees. Depending upon the structure of the final contract with a marketer, we can see how a marketer’s budgeting may be affected by the terms they agree to with their agencies. We can further imagine the workflows associated with managing these activities, and that a marketer may need to pay different fees for different kinds of services given the varying labor intensity associated with each medium. In this instance, five distinct people and one FTE are required to execute a small digital budget. But seven distinct people and four FTEs are required to execute a television budget that is 20 times larger. As marketers continue to deploy budgets into digital media, they will also continue to push for operational efficiencies. However, it is highly unlikely that digital campaigns can ever become as labor-efficient as television given television’s absolute scale and the homogenous nature of creative assets, in contrast to the fragmented nature of digital media both in terms of the media platforms and the creative assets. As a result, we anticipate that as marketers allocate increasing shares of their budgets to digital media, a larger and larger share of marketers’ budgets will be required for agency services.
Illustrative $50mm Media Account Staffing Plan
Functions # of Staff/Sub-Functions Total Staff
Account Management 1 Account Executive 0.20 FTE
Account Planning & Management 9 People: Media Planners and Researchers 4.00 FTE
Digital Buying 5 People: Account Oversight, Ad Operations, Digital Planning and Negotiating
1.00 FTE
Print Buying 1 Person: Negotiator 0.20 FTE
National Broadcast Buying 7 People: Account Oversight, Negotiating and Traffic 4.00 FTE
Local Broadcast Buying 6 People: Account Oversight, Negotiating and Traffic 2.00 FTE
Source: Pivotal Research
- 19 - Brian Wieser 212-514-4682 Pivotal Research Group
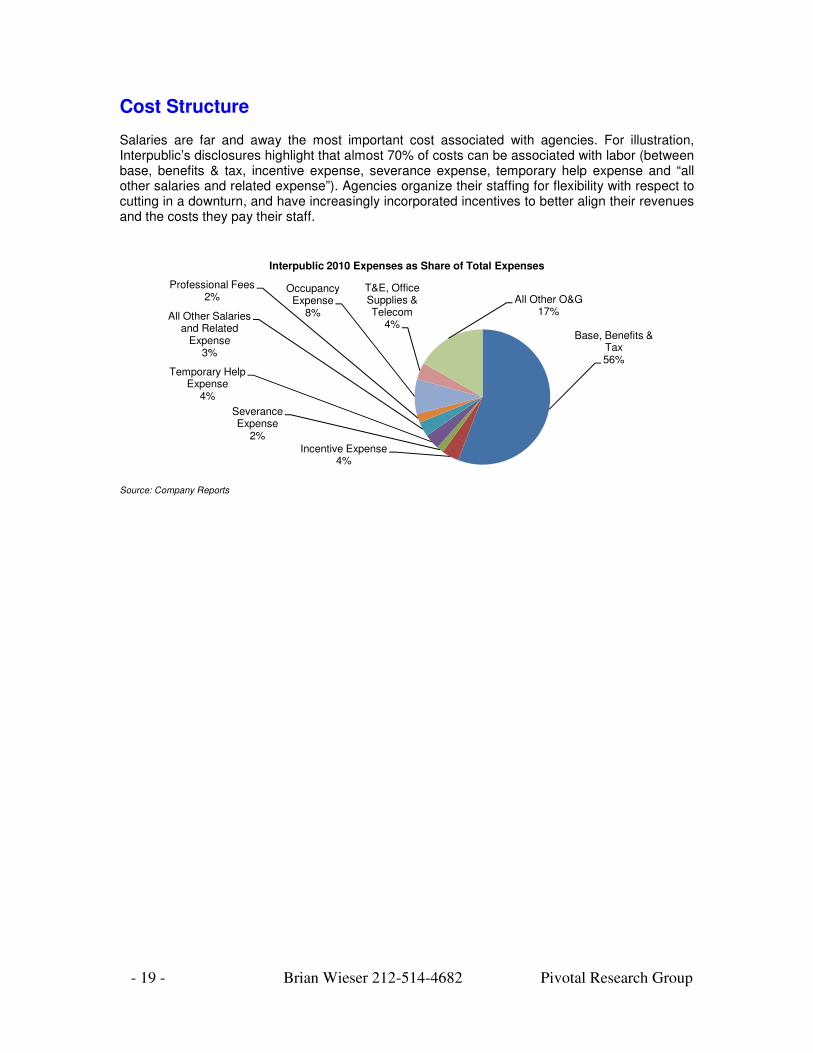
Cost Structure Salaries are far and away the most important cost associated with agencies. For illustration, Interpublic’s disclosures highlight that almost 70% of costs can be associated with labor (between base, benefits & tax, incentive expense, severance expense, temporary help expense and “all other salaries and related expense”). Agencies organize their staffing for flexibility with respect to cutting in a downturn, and have increasingly incorporated incentives to better align their revenues and the costs they pay their staff.
Base, Benefits & Tax56%
Incentive Expense4%
Severance Expense
2%
Temporary Help Expense
4%
All Other Salaries and Related
Expense3%
Professional Fees2%
Occupancy Expense
8%
T&E, Office Supplies & Telecom
4%
All Other O&G17%
Interpublic 2010 Expenses as Share of Total Expenses
Source: Company Reports
- 20 - Brian Wieser 212-514-4682 Pivotal Research Group
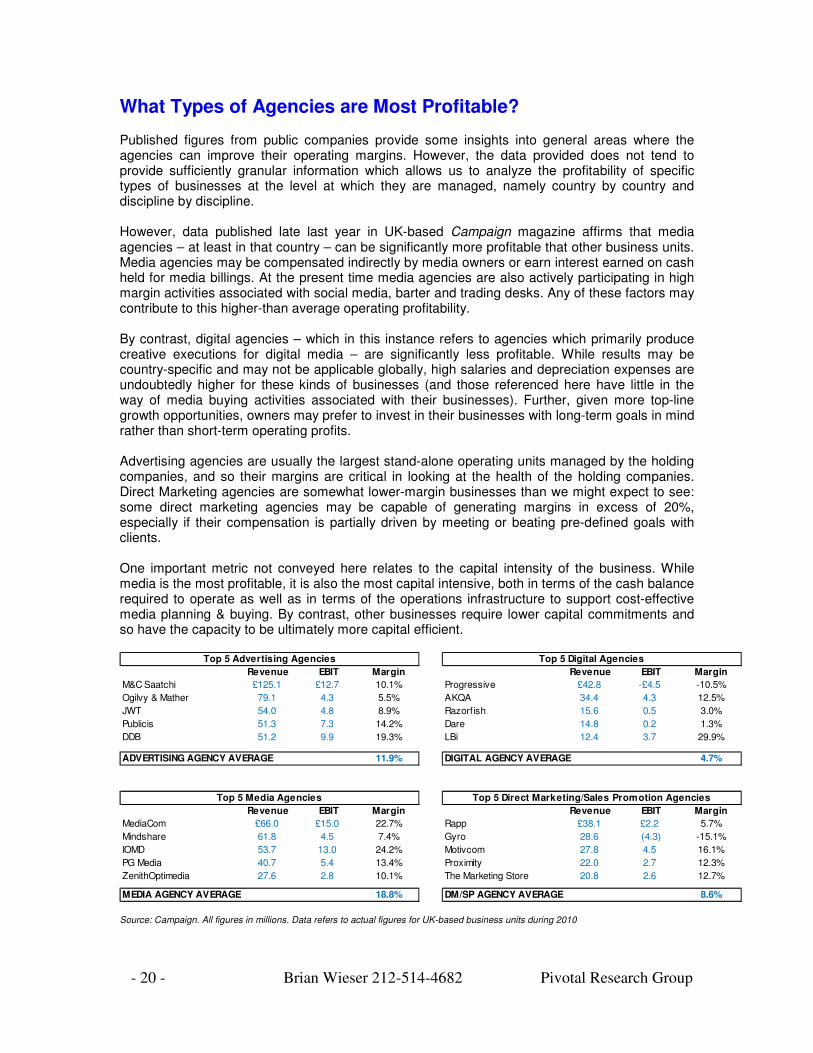
What Types of Agencies are Most Profitable? Published figures from public companies provide some insights into general areas where the agencies can improve their operating margins. However, the data provided does not tend to provide sufficiently granular information which allows us to analyze the profitability of specific types of businesses at the level at which they are managed, namely country by country and discipline by discipline. However, data published late last year in UK-based Campaign magazine affirms that media agencies – at least in that country – can be significantly more profitable that other business units. Media agencies may be compensated indirectly by media owners or earn interest earned on cash held for media billings. At the present time media agencies are also actively participating in high margin activities associated with social media, barter and trading desks. Any of these factors may contribute to this higher-than average operating profitability. By contrast, digital agencies – which in this instance refers to agencies which primarily produce creative executions for digital media – are significantly less profitable. While results may be country-specific and may not be applicable globally, high salaries and depreciation expenses are undoubtedly higher for these kinds of businesses (and those referenced here have little in the way of media buying activities associated with their businesses). Further, given more top-line growth opportunities, owners may prefer to invest in their businesses with long-term goals in mind rather than short-term operating profits. Advertising agencies are usually the largest stand-alone operating units managed by the holding companies, and so their margins are critical in looking at the health of the holding companies. Direct Marketing agencies are somewhat lower-margin businesses than we might expect to see: some direct marketing agencies may be capable of generating margins in excess of 20%, especially if their compensation is partially driven by meeting or beating pre-defined goals with clients. One important metric not conveyed here relates to the capital intensity of the business. While media is the most profitable, it is also the most capital intensive, both in terms of the cash balance required to operate as well as in terms of the operations infrastructure to support cost-effective media planning & buying. By contrast, other businesses require lower capital commitments and so have the capacity to be ultimately more capital efficient.
Top 5 Advertising Agencies Top 5 Digital Agencies
Revenue EBIT Margin Revenue EBIT Margin
M&C Saatchi £125.1 £12.7 10.1% Progressive £42.8 -£4.5 -10.5%
Ogilvy & Mather 79.1 4.3 5.5% AKQA 34.4 4.3 12.5%
JWT 54.0 4.8 8.9% Razorfish 15.6 0.5 3.0%
Publicis 51.3 7.3 14.2% Dare 14.8 0.2 1.3%
DDB 51.2 9.9 19.3% LBi 12.4 3.7 29.9%
ADVERTISING AGENCY AVERAGE 11.9% DIGITAL AGENCY AVERAGE 4.7%
Top 5 Media Agencies Top 5 Direct Marketing/Sales Promotion Agencies
Revenue EBIT Margin Revenue EBIT Margin
MediaCom £66.0 £15.0 22.7% Rapp £38.1 £2.2 5.7%
Mindshare 61.8 4.5 7.4% Gyro 28.6 (4.3) -15.1%
IOMD 53.7 13.0 24.2% Motivcom 27.8 4.5 16.1%
PG Media 40.7 5.4 13.4% Proximity 22.0 2.7 12.3%
ZenithOptimedia 27.6 2.8 10.1% The Marketing Store 20.8 2.6 12.7%
MEDIA AGENCY AVERAGE 18.8% DM/SP AGENCY AVERAGE 8.6% Source: Campaign. All figures in millions. Data refers to actual figures for UK-based business units during 2010
- 21 - Brian Wieser 212-514-4682 Pivotal Research Group
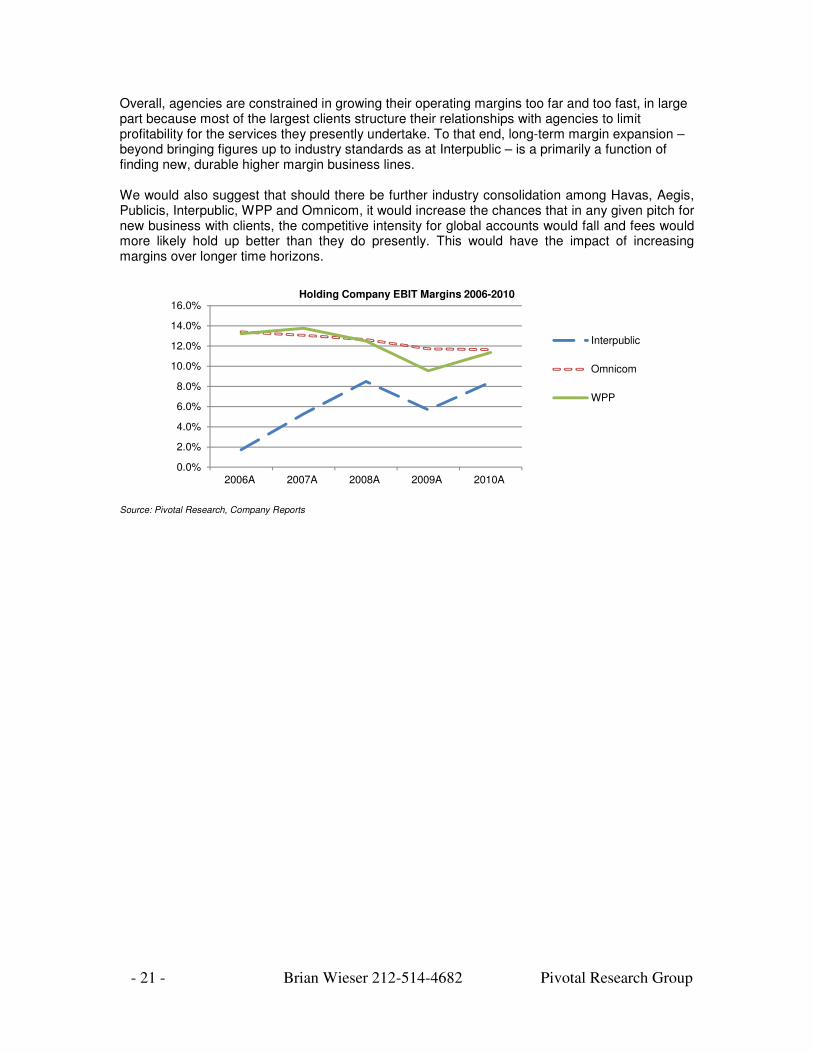
Overall, agencies are constrained in growing their operating margins too far and too fast, in large part because most of the largest clients structure their relationships with agencies to limit profitability for the services they presently undertake. To that end, long-term margin expansion – beyond bringing figures up to industry standards as at Interpublic – is a primarily a function of finding new, durable higher margin business lines. We would also suggest that should there be further industry consolidation among Havas, Aegis, Publicis, Interpublic, WPP and Omnicom, it would increase the chances that in any given pitch for new business with clients, the competitive intensity for global accounts would fall and fees would more likely hold up better than they do presently. This would have the impact of increasing margins over longer time horizons.
0.0%
2.0%
4.0%
6.0%
8.0%
10.0%
12.0%
14.0%
16.0%
2006A 2007A 2008A 2009A 2010A
Interpublic
Omnicom
WPP
Holding Company EBIT Margins 2006-2010
Source: Pivotal Research, Company Reports
- 22 - Brian Wieser 212-514-4682 Pivotal Research Group
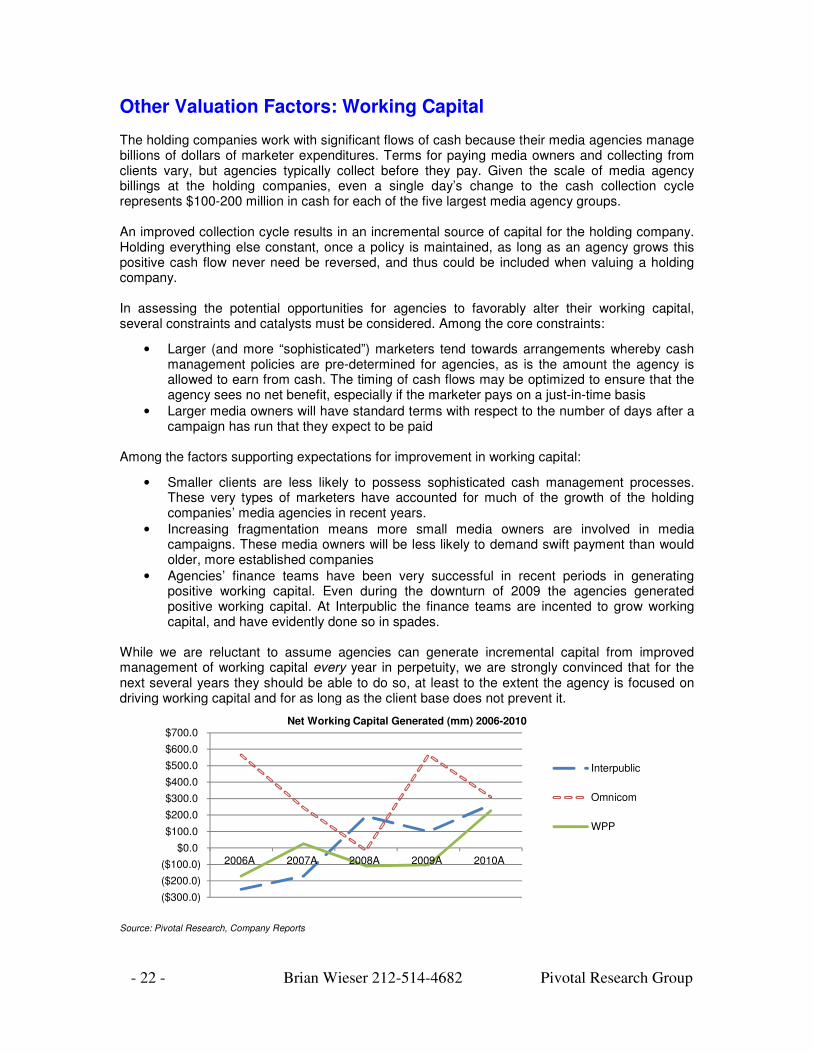
Other Valuation Factors: Working Capital The holding companies work with significant flows of cash because their media agencies manage billions of dollars of marketer expenditures. Terms for paying media owners and collecting from clients vary, but agencies typically collect before they pay. Given the scale of media agency billings at the holding companies, even a single day’s change to the cash collection cycle represents $100-200 million in cash for each of the five largest media agency groups. An improved collection cycle results in an incremental source of capital for the holding company. Holding everything else constant, once a policy is maintained, as long as an agency grows this positive cash flow never need be reversed, and thus could be included when valuing a holding company. In assessing the potential opportunities for agencies to favorably alter their working capital, several constraints and catalysts must be considered. Among the core constraints:
• Larger (and more “sophisticated”) marketers tend towards arrangements whereby cash management policies are pre-determined for agencies, as is the amount the agency is allowed to earn from cash. The timing of cash flows may be optimized to ensure that the agency sees no net benefit, especially if the marketer pays on a just-in-time basis
• Larger media owners will have standard terms with respect to the number of days after a campaign has run that they expect to be paid
Among the factors supporting expectations for improvement in working capital:
• Smaller clients are less likely to possess sophisticated cash management processes. These very types of marketers have accounted for much of the growth of the holding companies’ media agencies in recent years.
• Increasing fragmentation means more small media owners are involved in media campaigns. These media owners will be less likely to demand swift payment than would older, more established companies
• Agencies’ finance teams have been very successful in recent periods in generating positive working capital. Even during the downturn of 2009 the agencies generated positive working capital. At Interpublic the finance teams are incented to grow working capital, and have evidently done so in spades.
While we are reluctant to assume agencies can generate incremental capital from improved management of working capital every year in perpetuity, we are strongly convinced that for the next several years they should be able to do so, at least to the extent the agency is focused on driving working capital and for as long as the client base does not prevent it.
($300.0)
($200.0)
($100.0)
$0.0
$100.0
$200.0
$300.0
$400.0
$500.0
$600.0
$700.0
2006A 2007A 2008A 2009A 2010A
Interpublic
Omnicom
WPP
Net Working Capital Generated (mm) 2006-2010
Source: Pivotal Research, Company Reports
- 23 - Brian Wieser 212-514-4682 Pivotal Research Group
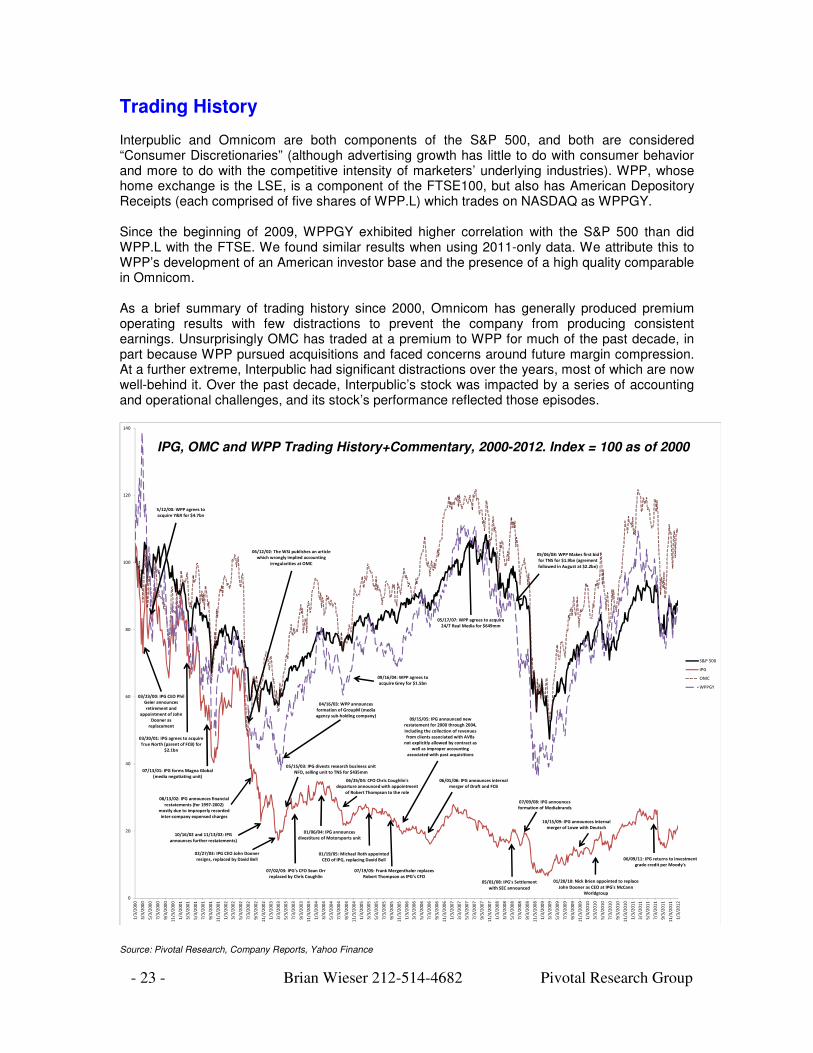
Trading History Interpublic and Omnicom are both components of the S&P 500, and both are considered “Consumer Discretionaries” (although advertising growth has little to do with consumer behavior and more to do with the competitive intensity of marketers’ underlying industries). WPP, whose home exchange is the LSE, is a component of the FTSE100, but also has American Depository Receipts (each comprised of five shares of WPP.L) which trades on NASDAQ as WPPGY. Since the beginning of 2009, WPPGY exhibited higher correlation with the S&P 500 than did WPP.L with the FTSE. We found similar results when using 2011-only data. We attribute this to WPP’s development of an American investor base and the presence of a high quality comparable in Omnicom. As a brief summary of trading history since 2000, Omnicom has generally produced premium operating results with few distractions to prevent the company from producing consistent earnings. Unsurprisingly OMC has traded at a premium to WPP for much of the past decade, in part because WPP pursued acquisitions and faced concerns around future margin compression. At a further extreme, Interpublic had significant distractions over the years, most of which are now well-behind it. Over the past decade, Interpublic’s stock was impacted by a series of accounting and operational challenges, and its stock’s performance reflected those episodes.
0
20
40
60
80
100
120
140
1/3
/20
00
3/3
/20
00
5/3
/20
00
7/3
/20
00
9/3
/20
00
11
/3/2
00
0
1/3
/20
01
3/3
/20
01
5/3
/20
01
7/3
/20
01
9/3
/20
01
11
/3/2
00
1
1/3
/20
02
3/3
/20
02
5/3
/20
02
7/3
/20
02
9/3
/20
02
11
/3/2
00
2
1/3
/20
03
3/3
/20
03
5/3
/20
03
7/3
/20
03
9/3
/20
03
11
/3/2
00
3
1/3
/20
04
3/3
/20
04
5/3
/20
04
7/3
/20
04
9/3
/20
04
11
/3/2
00
4
1/3
/20
05
3/3
/20
05
5/3
/20
05
7/3
/20
05
9/3
/20
05
11
/3/2
00
5
1/3
/20
06
3/3
/20
06
5/3
/20
06
7/3
/20
06
9/3
/20
06
11
/3/2
00
6
1/3
/20
07
3/3
/20
07
5/3
/20
07
7/3
/20
07
9/3
/20
07
11
/3/2
00
7
1/3
/20
08
3/3
/20
08
5/3
/20
08
7/3
/20
08
9/3
/20
08
11
/3/2
00
8
1/3
/20
09
3/3
/20
09
5/3
/20
09
7/3
/20
09
9/3
/20
09
11
/3/2
00
9
1/3
/20
10
3/3
/20
10
5/3
/20
10
7/3
/20
10
9/3
/20
10
11
/3/2
01
0
1/3
/20
11
3/3
/20
11
5/3
/20
11
7/3
/20
11
9/3
/20
11
11
/3/2
01
1
1/3
/20
12
S&P 500
IPG
OMC
WPPGY
5/12/00: WPP agrees to
acquire Y&R for $4.7bn
04/16/03: WPP announces
formation of GroupM (media
agency sub-holding company)
09/16/04: WPP agrees to
acquire Grey for $1.5bn
05/06/08: WPP Makes first bid
for TNS for $1.9bn (agrement
followed in August at $2.2bn)
05/17/07: WPP agrees to acquire
24/7 Real Media for $649mm
06/12/02: The WSJ publishes an article
which wrongly implied accounting
irregularities at OMC
07/13/01: IPG forms Magna Global
(media negotiating unit)
08/13/02: IPG announces financial
restatements (for 1997-2002)
mostly due to improperly recorded
inter-company expensed charges
01/19/05: Michael Roth appointed
CEO of IPG, replacing David Bell
10/15/09: IPG announces internal
merger of Lowe with Deutsch
07/09/08: IPG announces
formation of Mediabrands
03/20/01: IPG agrees to acquire
True North (parent of FCB) for
$2.1bn
02/27/03: IPG CEO John Dooner
resigns, replaced by David Bell
07/02/03: IPG's CFO Sean Orr
replaced by Chris Coughlin
07/19/05: Frank Mergenthaler replaces
Robert Thompson as IPG's CFO05/01/08: IPG's Settlement
with SEC announced
06/09/11: IPG returns to investment
grade credit per Moody's
05/15/03: IPG divests research business unit
NFO, selling unit to TNS for $435mm
01/06/04: IPG announces
divestiture of Motorsports unit
06/01/06: IPG announces internal
merger of Draft and FCB
03/23/00: IPG CEO Phil
Geier announces
retirement and
appointment of John
Dooner as
replacement
01/20/10: Nick Brien appointed to replace
John Dooner as CEO at IPG's McCann
Worldgroup
10/16/02 and 11/13/02: IPG
announces further restatements)
09/15/05: IPG announced new
restatement for 2000 through 2004,
including the collection of revenues
from clients associated with AVBs
not explicitly allowed by contract as
well as improper accounting
associated with past acquisitions
06/25/04: CFO Chris Coughlin's
departure announced with appointment
of Robert Thompson to the role
Source: Pivotal Research, Company Reports, Yahoo Finance
IPG, OMC and WPP Trading History+Commentary, 2000-2012. Index = 100 as of 2000
- 24 - Brian Wieser 212-514-4682 Pivotal Research Group
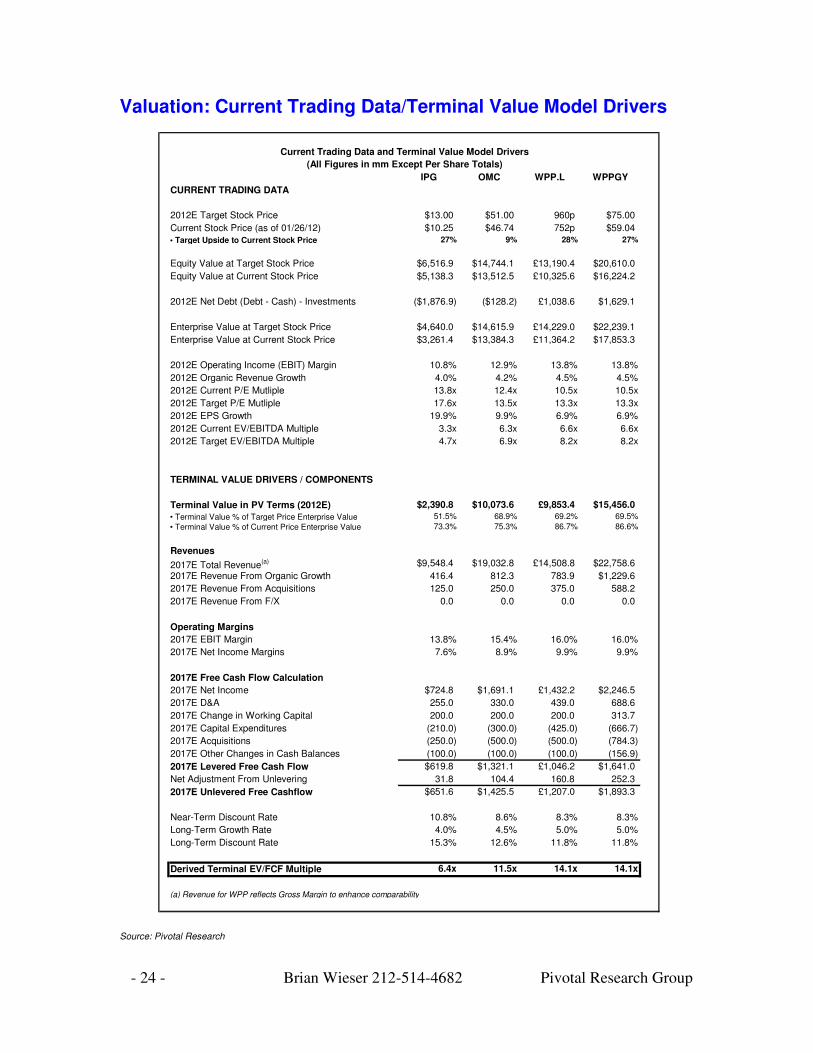
Valuation: Current Trading Data/Terminal Value Model Drivers
Current Trading Data and Terminal Value Model Drivers
(All Figures in mm Except Per Share Totals)
IPG OMC WPP.L WPPGY
CURRENT TRADING DATA
2012E Target Stock Price $13.00 $51.00 960p $75.00
Current Stock Price (as of 01/26/12) $10.25 $46.74 752p $59.04
• Target Upside to Current Stock Price 27% 9% 28% 27%
Equity Value at Target Stock Price $6,516.9 $14,744.1 £13,190.4 $20,610.0
Equity Value at Current Stock Price $5,138.3 $13,512.5 £10,325.6 $16,224.2
2012E Net Debt (Debt - Cash) - Investments ($1,876.9) ($128.2) £1,038.6 $1,629.1
Enterprise Value at Target Stock Price $4,640.0 $14,615.9 £14,229.0 $22,239.1
Enterprise Value at Current Stock Price $3,261.4 $13,384.3 £11,364.2 $17,853.3
2012E Operating Income (EBIT) Margin 10.8% 12.9% 13.8% 13.8%
2012E Organic Revenue Growth 4.0% 4.2% 4.5% 4.5%
2012E Current P/E Mutliple 13.8x 12.4x 10.5x 10.5x
2012E Target P/E Mutliple 17.6x 13.5x 13.3x 13.3x
2012E EPS Growth 19.9% 9.9% 6.9% 6.9%
2012E Current EV/EBITDA Multiple 3.3x 6.3x 6.6x 6.6x
2012E Target EV/EBITDA Multiple 4.7x 6.9x 8.2x 8.2x
TERMINAL VALUE DRIVERS / COMPONENTS
Terminal Value in PV Terms (2012E) $2,390.8 $10,073.6 £9,853.4 $15,456.0
• Terminal Value % of Target Price Enterprise Value 51.5% 68.9% 69.2% 69.5%
• Terminal Value % of Current Price Enterprise Value 73.3% 75.3% 86.7% 86.6%
Revenues
2017E Total Revenue(a) $9,548.4 $19,032.8 £14,508.8 $22,758.6
2017E Revenue From Organic Growth 416.4 812.3 783.9 $1,229.6
2017E Revenue From Acquisitions 125.0 250.0 375.0 588.2
2017E Revenue From F/X 0.0 0.0 0.0 0.0
Operating Margins
2017E EBIT Margin 13.8% 15.4% 16.0% 16.0%
2017E Net Income Margins 7.6% 8.9% 9.9% 9.9%
2017E Free Cash Flow Calculation
2017E Net Income $724.8 $1,691.1 £1,432.2 $2,246.5
2017E D&A 255.0 330.0 439.0 688.6
2017E Change in Working Capital 200.0 200.0 200.0 313.7
2017E Capital Expenditures (210.0) (300.0) (425.0) (666.7)
2017E Acquisitions (250.0) (500.0) (500.0) (784.3)
2017E Other Changes in Cash Balances (100.0) (100.0) (100.0) (156.9)
2017E Levered Free Cash Flow $619.8 $1,321.1 £1,046.2 $1,641.0
Net Adjustment From Unlevering 31.8 104.4 160.8 252.3
2017E Unlevered Free Cashflow $651.6 $1,425.5 £1,207.0 $1,893.3
Near-Term Discount Rate 10.8% 8.6% 8.3% 8.3%
Long-Term Growth Rate 4.0% 4.5% 5.0% 5.0%
Long-Term Discount Rate 15.3% 12.6% 11.8% 11.8%
Derived Terminal EV/FCF Multiple 6.4x 11.5x 14.1x 14.1x
(a) Revenue for WPP reflects Gross Margin to enhance comparability
Source: Pivotal Research
Pivotal Research Group 853 Broadway, Suite 1406 New York, NY 10003
Important Disclosures Are Located In The Appendix
PIVOTAL Pivotal Research Group
U.S. Equity Research Advertising
WPP (WPPGY) Initiating Coverage With BUY Rating and Our Top Pick: Dare to Dream
January 27, 2012
960p 2012E TARGET PRICE ON WPP.L ($75.00 FOR ADR TRADING AS WPPGY). WPP is the world’s largest agency holding company. Because of its historically acquisitive nature and operating weakness in parts of its research business, investors have approached WPP cautiously, but we think the company is best-in-class. Our target 2012E target price of 960p equates to a 28% premium over its current price. At our target, WPP would trade at 13x earnings, up from a current multiple of 10x, and in line with Omnicom. BEST UPSIDE OPPORTUNITY FOR WESTERN MEDIA FROM CHINESE EXPOSURE. WPP is among the only media companies generating revenues in excess of $1 billion per year in greater China. At 4x the size of its nearest competitor, WPP is best positioned to capture outsized growth in what would already be the world’s fastest-growing large market. Even beyond China, among global agency holding companies, WPP has the highest exposure to countries outside of the mature US and western European markets. INDUSTRY-LEADING DEFENSIVE POSITIONING THROUGH DIGITAL PLATFORM. WPP is unique among the holding companies for its ownership of a digital media advertising technology company, 24/7 Real Media. Today, WPP’s competitors are not prevented from procuring services from independent technology providers or from digital media owners such as Google. However, WPP is best positioned in the event that technology providers extract economic “rents” from agencies given the potential for consolidation (and reduced competition) in the ad-tech industry in the future. GLOBAL DOMINANCE IN HIGH MARGIN MEDIA AGENCY BUSINESS. WPP’s GroupM is by far the largest media agency holding company. As the largest media services company in the world ($80bn in billings) WPP has can uniquely capitalize on economies of scale. Further, in a business that faces sustained pressure from clients to reduce fees, GroupM can afford to be smart in picking and choosing the clients it seeks to retain when accounts are up for review. BEATING PEER-LEVEL ORGANIC GROWTH LEVELS WILL CATALYSE SHIFT TO PREMIUM VALUE. The market tends to apply a discount vs. OMC because of higher perceived risks. As the company mitigates those perceptions, outperformance vs. OMC should occur. We believe the company’s country exposure paired with the absence of meaningful headwinds (beyond those of the macro-economy) should allow WPP to re-rate among investors. VALUATION: We value WPP using a DCF methodology (including a near-term discount rate of 8.3% and a terminal value equating to 14x EV/FCF in 2017). RISKS: 1) Failure to improve profitability at the company’s research division 2) Failure to sustain revenue or margin trends, 3) competition from adjacent industries (especially IT services firms), 4) continuing squeeze on like-for-like fees from legacy clients; 5) absence of competition among marketers.
Brian Wieser, CFA 212-514-4682 [email protected]
WPP (WPP.L / WPPGY)
RATING: BUY (Previous: N/A)
Target Price: 960p / $75.00 (Previous: N/A)
Price (1/26/12): 751.5p / $59.04
MARKET DATA
52 Wk Hi - Low 864p-561p
Market Cap. (MM) £10013
Avg. Daily Vol (000) 4641
EPS 2010A Prior 2011E Prior
1H £0.120 £0.181A
2H £0.346 £0.460
FY £0.459 £0.640
P/E NM 14.1
Sales 2010A Prior 2011E Prior
1H £4441 £4713A
2H £4890 £5308
FY £9331 £10021
BALANCE SHEET DATA(9/30/11)
Cash ($) £1,770
Debt ($) £4,650
Debt/Equity 67%
Book Value/Share £5.38
Source: Pivotal Research Group and Company Documents
- 26 - Brian Wieser 212-514-4682 Pivotal Research Group
RISKS Investors will also need to consider the following among the company’s and industry’s risks: FAILURE TO IMPROVE PROFITABILITY AT THE COMPANY’S RESEARCH DIVISION. The company’s Kantar division acquired researcher TNS in 2008. The unit’s custom research activities have generally disappointed. To the extent the company does not turn around this business line, it would represent a continuing drag on overall operating margins. FAILURE TO MEET REVENUE OR MARGIN EXPECTATIONS. Client losses or the failure to improve operations could lead to shortfalls of revenue or margin expectations. SQUEEZING FEES. Marketers are typically squeezing their agencies for operational efficiencies on an ongoing basis. Agencies have historically proven resilient in finding cost saving opportunities to perform like-for-like services. However at some point such efforts may no longer yield incremental benefits, and as long as agencies operate in a competitive manner they will suffer. In a similar light, high margin services offered today are typically likely to become standard-margin services in the future, as the more a service becomes standardized, the more that marketers’ procurement teams seek to standardize processes and drive agency margin out of the activity. COMPETITION FROM ADJACENT INDUSTRIES. We remain skeptical that today’s digital media companies such as Google or Microsoft will ever actively compete with agencies. This should hold not least because digital media companies will want to retain their margins (significantly higher than those for agency services) but also because clients generally want some perceived independence from advisors making marketing budget recommendations. Relative to its competitors, WPP is less prone to this risk factor because of its ownership in comparable digital technology platforms. However, agencies are increasingly placed up against today’s IT services firm in providing some services today. This type competition is more likely to increase in the future, although not across all marketing-related disciplines. Companies such as Accenture and IBM are increasingly positioning parts of their businesses adjacent to agencies as they seek to build platforms which can manage the execution of media campaigns, monitor the impact of those campaigns and integrate those efforts with an array of marketing data within a company’s ERP (enterprise resource planning) system. Sapient’s business lines represent the strongest balance between these functions today, although their impact on the broader industry has not yet been significant. Further, media suppliers (such as Hearst and Meredith) and software developers (such as Adobe) have also established competitive positions in some fields previously reserved for agencies, such as in search engine marketing. Given the extremely long selling cycles and the duration of agency-marketer contracts (usually several years in length) as well as the operational considerations for marketers in changing their own processes, no upstart can transform the agency industry overnight. The bigger issue is whether or not agencies are able to sufficiently adapt their own offerings in the time they have before a new service becomes a standard expectation. REDUCED COMPETITION BETWEEN MARKETERS. We have previously identified that advertising spending – and marketing in general – is primarily driven by the competitive intensity that is present within a given category. To the extent that industries evolve to feature reduced levels of competitive intensity, marketing services would generally suffer.
- 27 - Brian Wieser 212-514-4682 Pivotal Research Group
WPP’s Current State in Historical Context “Geography is destiny” is a phrase attributed to the French leader Napoleon. By that standard, no agency holding company is better positioned for a bright future than the nominally English – or is that Irish? Or American? – WPP. Established by former Saatchi & Saatchi CFO Sir Martin Sorrell in 1985 through his acquisition of a controlling stake in what was then called Wire and Plastic Products. WPP has continuously grown through acquisition and organic efforts, although the acquisitions have certainly been more prominent. Key transactions and the years in which they occurred include: • 1987: J. Walter Thompson • 1989: Ogilvy Group (parent of Ogilvy & Mather) • 1998: Minority stake in Asatsu (third largest Japanese advertising agency) • 2000: Y&R Group (parent of Y&R) • 2001: Tempus Group (parent of media agency CIA) • 2003: Cordiant (parent of agency networks including Bates) • 2005: Grey Group (parent of Grey) • 2007: 24/7 Real Media • 2008: TNS With so many large acquisitions, the role of integration has proven to be more critical than for any of the other holding companies. As such, the presence of its CEO looms far larger in the operating units of the company than in any of the other holding companies. For the most part Sorrell’s efforts have created a far more cohesive company than should be expected for one with more than 100,000 employees and hundreds of distinct businesses. But more than acquisitions, WPP’s commitment to globalization in general – and China in particular – should not be under-estimated. WPP can lay claim to holding its own first board meeting in China in 1989. Also at the board level, more recently, the company appointed Ruigang Li, President of Shanghai Media Group (an important state-controlled media company in China) as a Director. The culmination of these efforts should result in China serving as WPP’s second largest market within a few years. Its operations there will likely dwarf those of its competitors for far longer. While geography will, by itself, account for a significant share of the company’s growth, WPP has also gone to some effort to “future-proof” itself by buying unique digital assets – specifically, 24/7 Real Media – and establishing one of the leading positions globally in the market research business. With the former segment, the company has gone beyond buying digital agencies, which are primarily services firms. Instead, it purchased a technology platform and related businesses which capitalize on digital media. More importantly, it ensures some degree of independence from today’s digital media owner / digital infrastructure providers, such as Google. The latter segment is the only area of significant concern, financially speaking, at the present time. Although syndicated research can be a lucrative – and non-cyclical – business, custom research has generally proven to generally be a lower margin sector. Unfortunately, much of the legacy TNS businesses were focused on this custom research segment. Consequently, WPP’s Kantar business unit (in which TNS is contained) has proven to be a drag on the overall company. However, presuming that the company is successful in improving the division even marginally, the underlying drivers of growth for the research industry should be sufficiently diverse from the rest of WPP’s activities that WPP’s overall risk-profile is reduced when compared with its global peers.
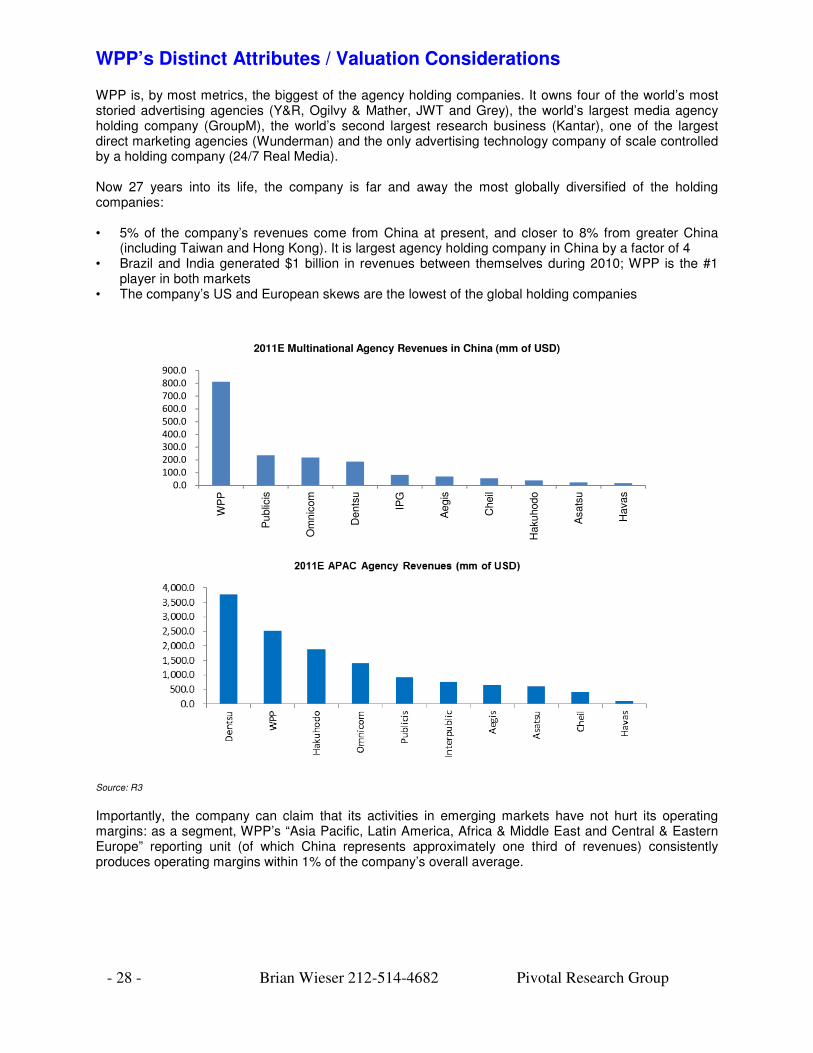
- 28 - Brian Wieser 212-514-4682 Pivotal Research Group
WPP’s Distinct Attributes / Valuation Considerations WPP is, by most metrics, the biggest of the agency holding companies. It owns four of the world’s most storied advertising agencies (Y&R, Ogilvy & Mather, JWT and Grey), the world’s largest media agency holding company (GroupM), the world’s second largest research business (Kantar), one of the largest direct marketing agencies (Wunderman) and the only advertising technology company of scale controlled by a holding company (24/7 Real Media). Now 27 years into its life, the company is far and away the most globally diversified of the holding companies: • 5% of the company’s revenues come from China at present, and closer to 8% from greater China
(including Taiwan and Hong Kong). It is largest agency holding company in China by a factor of 4 • Brazil and India generated $1 billion in revenues between themselves during 2010; WPP is the #1
player in both markets • The company’s US and European skews are the lowest of the global holding companies
0.0
100.0
200.0
300.0
400.0
500.0
600.0
700.0
800.0
900.0
WP
P
Pu
blic
is
Om
nic
om
Dents
u
IPG
Ae
gis
Cheil
Hakuhodo
Asats
u
Hava
s
2011E Multinational Agency Revenues in China (mm of USD)
Source: R3
Importantly, the company can claim that its activities in emerging markets have not hurt its operating margins: as a segment, WPP’s “Asia Pacific, Latin America, Africa & Middle East and Central & Eastern Europe” reporting unit (of which China represents approximately one third of revenues) consistently produces operating margins within 1% of the company’s overall average.
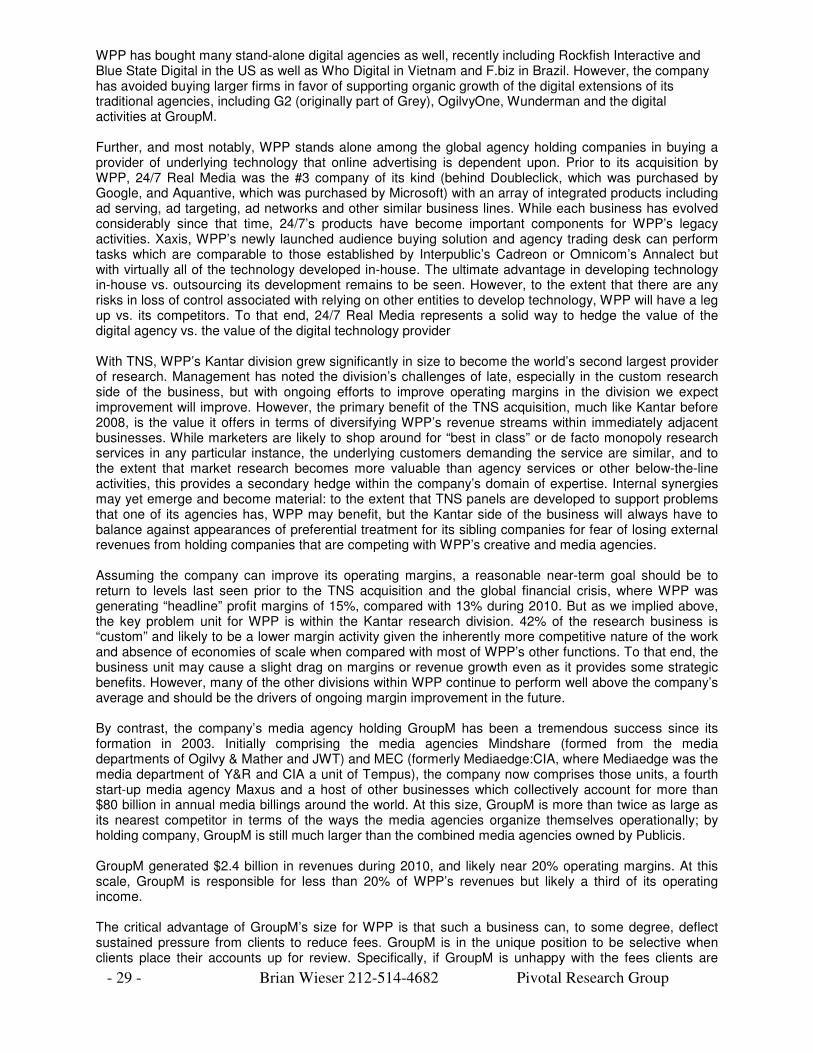
- 29 - Brian Wieser 212-514-4682 Pivotal Research Group
WPP has bought many stand-alone digital agencies as well, recently including Rockfish Interactive and Blue State Digital in the US as well as Who Digital in Vietnam and F.biz in Brazil. However, the company has avoided buying larger firms in favor of supporting organic growth of the digital extensions of its traditional agencies, including G2 (originally part of Grey), OgilvyOne, Wunderman and the digital activities at GroupM. Further, and most notably, WPP stands alone among the global agency holding companies in buying a provider of underlying technology that online advertising is dependent upon. Prior to its acquisition by WPP, 24/7 Real Media was the #3 company of its kind (behind Doubleclick, which was purchased by Google, and Aquantive, which was purchased by Microsoft) with an array of integrated products including ad serving, ad targeting, ad networks and other similar business lines. While each business has evolved considerably since that time, 24/7’s products have become important components for WPP’s legacy activities. Xaxis, WPP’s newly launched audience buying solution and agency trading desk can perform tasks which are comparable to those established by Interpublic’s Cadreon or Omnicom’s Annalect but with virtually all of the technology developed in-house. The ultimate advantage in developing technology in-house vs. outsourcing its development remains to be seen. However, to the extent that there are any risks in loss of control associated with relying on other entities to develop technology, WPP will have a leg up vs. its competitors. To that end, 24/7 Real Media represents a solid way to hedge the value of the digital agency vs. the value of the digital technology provider With TNS, WPP’s Kantar division grew significantly in size to become the world’s second largest provider of research. Management has noted the division’s challenges of late, especially in the custom research side of the business, but with ongoing efforts to improve operating margins in the division we expect improvement will improve. However, the primary benefit of the TNS acquisition, much like Kantar before 2008, is the value it offers in terms of diversifying WPP’s revenue streams within immediately adjacent businesses. While marketers are likely to shop around for “best in class” or de facto monopoly research services in any particular instance, the underlying customers demanding the service are similar, and to the extent that market research becomes more valuable than agency services or other below-the-line activities, this provides a secondary hedge within the company’s domain of expertise. Internal synergies may yet emerge and become material: to the extent that TNS panels are developed to support problems that one of its agencies has, WPP may benefit, but the Kantar side of the business will always have to balance against appearances of preferential treatment for its sibling companies for fear of losing external revenues from holding companies that are competing with WPP’s creative and media agencies. Assuming the company can improve its operating margins, a reasonable near-term goal should be to return to levels last seen prior to the TNS acquisition and the global financial crisis, where WPP was generating “headline” profit margins of 15%, compared with 13% during 2010. But as we implied above, the key problem unit for WPP is within the Kantar research division. 42% of the research business is “custom” and likely to be a lower margin activity given the inherently more competitive nature of the work and absence of economies of scale when compared with most of WPP’s other functions. To that end, the business unit may cause a slight drag on margins or revenue growth even as it provides some strategic benefits. However, many of the other divisions within WPP continue to perform well above the company’s average and should be the drivers of ongoing margin improvement in the future.
By contrast, the company’s media agency holding GroupM has been a tremendous success since its formation in 2003. Initially comprising the media agencies Mindshare (formed from the media departments of Ogilvy & Mather and JWT) and MEC (formerly Mediaedge:CIA, where Mediaedge was the media department of Y&R and CIA a unit of Tempus), the company now comprises those units, a fourth start-up media agency Maxus and a host of other businesses which collectively account for more than $80 billion in annual media billings around the world. At this size, GroupM is more than twice as large as its nearest competitor in terms of the ways the media agencies organize themselves operationally; by holding company, GroupM is still much larger than the combined media agencies owned by Publicis. GroupM generated $2.4 billion in revenues during 2010, and likely near 20% operating margins. At this scale, GroupM is responsible for less than 20% of WPP’s revenues but likely a third of its operating income. The critical advantage of GroupM’s size for WPP is that such a business can, to some degree, deflect sustained pressure from clients to reduce fees. GroupM is in the unique position to be selective when clients place their accounts up for review. Specifically, if GroupM is unhappy with the fees clients are
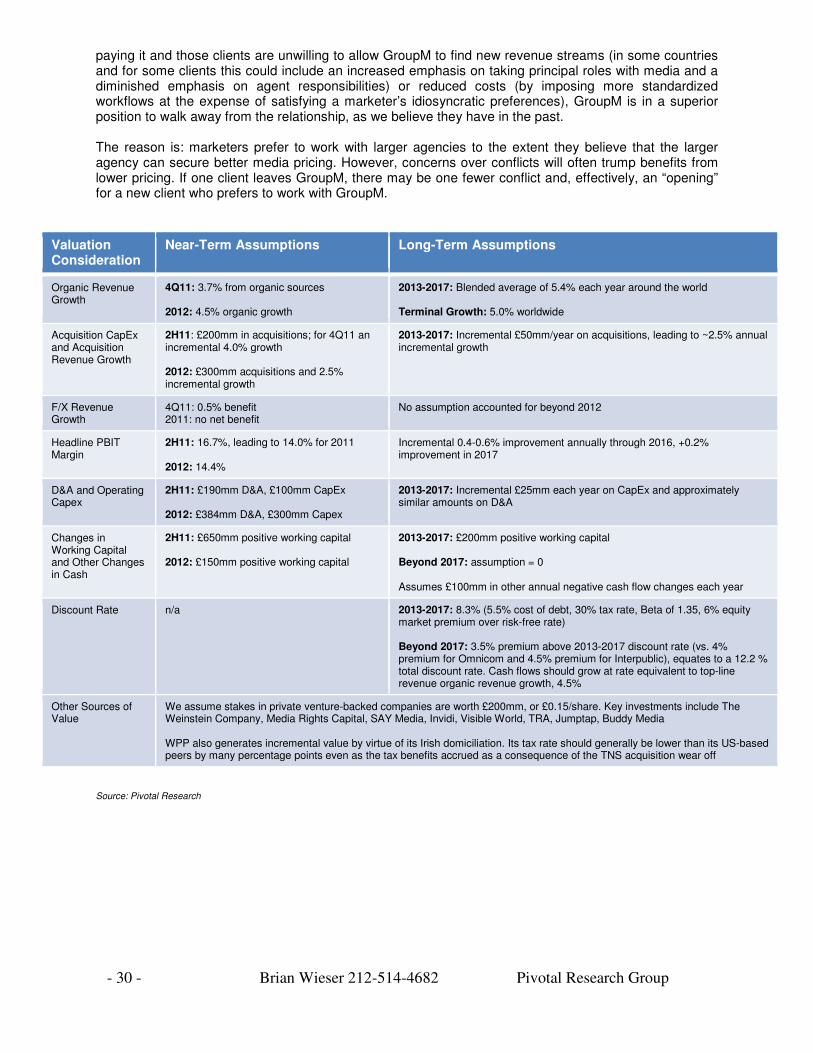
- 30 - Brian Wieser 212-514-4682 Pivotal Research Group
paying it and those clients are unwilling to allow GroupM to find new revenue streams (in some countries and for some clients this could include an increased emphasis on taking principal roles with media and a diminished emphasis on agent responsibilities) or reduced costs (by imposing more standardized workflows at the expense of satisfying a marketer’s idiosyncratic preferences), GroupM is in a superior position to walk away from the relationship, as we believe they have in the past. The reason is: marketers prefer to work with larger agencies to the extent they believe that the larger agency can secure better media pricing. However, concerns over conflicts will often trump benefits from lower pricing. If one client leaves GroupM, there may be one fewer conflict and, effectively, an “opening” for a new client who prefers to work with GroupM.
Valuation Consideration
Near-Term Assumptions Long-Term Assumptions
Organic Revenue Growth
4Q11: 3.7% from organic sources 2012: 4.5% organic growth
2013-2017: Blended average of 5.4% each year around the world Terminal Growth: 5.0% worldwide
Acquisition CapEx and Acquisition Revenue Growth
2H11: £200mm in acquisitions; for 4Q11 an incremental 4.0% growth 2012: £300mm acquisitions and 2.5% incremental growth
2013-2017: Incremental £50mm/year on acquisitions, leading to ~2.5% annual incremental growth
F/X Revenue Growth
4Q11: 0.5% benefit 2011: no net benefit
No assumption accounted for beyond 2012
Headline PBIT Margin
2H11: 16.7%, leading to 14.0% for 2011 2012: 14.4%
Incremental 0.4-0.6% improvement annually through 2016, +0.2% improvement in 2017
D&A and Operating Capex
2H11: £190mm D&A, £100mm CapEx 2012: £384mm D&A, £300mm Capex
2013-2017: Incremental £25mm each year on CapEx and approximately similar amounts on D&A
Changes in Working Capital and Other Changes in Cash
2H11: £650mm positive working capital 2012: £150mm positive working capital
2013-2017: £200mm positive working capital Beyond 2017: assumption = 0 Assumes £100mm in other annual negative cash flow changes each year
Discount Rate n/a 2013-2017: 8.3% (5.5% cost of debt, 30% tax rate, Beta of 1.35, 6% equity market premium over risk-free rate) Beyond 2017: 3.5% premium above 2013-2017 discount rate (vs. 4% premium for Omnicom and 4.5% premium for Interpublic), equates to a 12.2 % total discount rate. Cash flows should grow at rate equivalent to top-line revenue organic revenue growth, 4.5%
Other Sources of Value
We assume stakes in private venture-backed companies are worth £200mm, or £0.15/share. Key investments include The Weinstein Company, Media Rights Capital, SAY Media, Invidi, Visible World, TRA, Jumptap, Buddy Media WPP also generates incremental value by virtue of its Irish domiciliation. Its tax rate should generally be lower than its US-based peers by many percentage points even as the tax benefits accrued as a consequence of the TNS acquisition wear off
Source: Pivotal Research
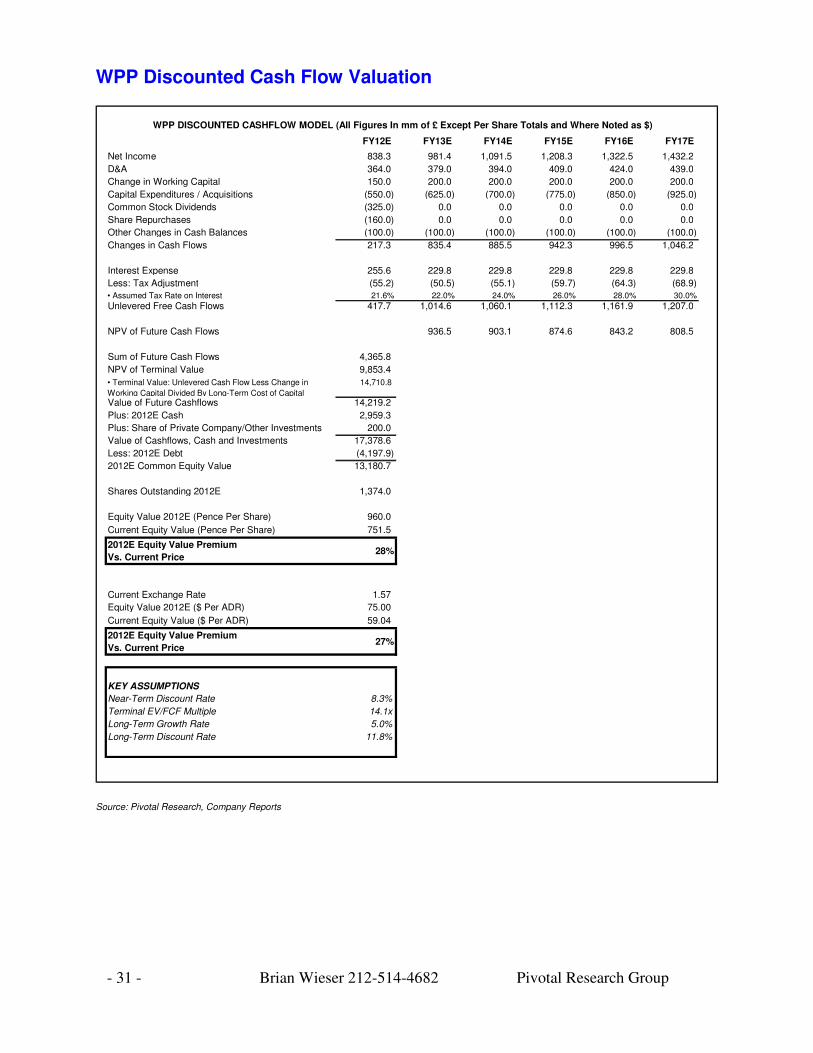
- 31 - Brian Wieser 212-514-4682 Pivotal Research Group
WPP Discounted Cash Flow Valuation
WPP DISCOUNTED CASHFLOW MODEL (All Figures In mm of £ Except Per Share Totals and Where Noted as $)
FY12E FY13E FY14E FY15E FY16E FY17E Year 1 1 2 3 4 5
Net Income 838.3 981.4 1,091.5 1,208.3 1,322.5 1,432.2
D&A 364.0 379.0 394.0 409.0 424.0 439.0
Change in Working Capital 150.0 200.0 200.0 200.0 200.0 200.0
Capital Expenditures / Acquisitions (550.0) (625.0) (700.0) (775.0) (850.0) (925.0)
Common Stock Dividends (325.0) 0.0 0.0 0.0 0.0 0.0
Share Repurchases (160.0) 0.0 0.0 0.0 0.0 0.0
Other Changes in Cash Balances (100.0) (100.0) (100.0) (100.0) (100.0) (100.0)
Changes in Cash Flows 217.3 835.4 885.5 942.3 996.5 1,046.2
Interest Expense 255.6 229.8 229.8 229.8 229.8 229.8
Less: Tax Adjustment (55.2) (50.5) (55.1) (59.7) (64.3) (68.9)
• Assumed Tax Rate on Interest 21.6% 22.0% 24.0% 26.0% 28.0% 30.0%
Unlevered Free Cash Flows 417.7 1,014.6 1,060.1 1,112.3 1,161.9 1,207.0
NPV of Future Cash Flows 936.5 903.1 874.6 843.2 808.5
Sum of Future Cash Flows 4,365.8
NPV of Terminal Value 9,853.4
• Terminal Value: Unlevered Cash Flow Less Change in
Working Capital Divided By Long-Term Cost of Capital
14,710.8
Value of Future Cashflows 14,219.2
Plus: 2012E Cash 2,959.3
Plus: Share of Private Company/Other Investments 200.0
Value of Cashflows, Cash and Investments 17,378.6
Less: 2012E Debt (4,197.9)
2012E Common Equity Value 13,180.7
Shares Outstanding 2012E 1,374.0
Equity Value 2012E (Pence Per Share) 960.0
Current Equity Value (Pence Per Share) 751.5
2012E Equity Value Premium
Vs. Current Price28%
Current Exchange Rate 1.57
Equity Value 2012E ($ Per ADR) 75.00
Current Equity Value ($ Per ADR) 59.04
2012E Equity Value Premium
Vs. Current Price27%
KEY ASSUMPTIONS
Near-Term Discount Rate 8.3%
Terminal EV/FCF Multiple 14.1x
Long-Term Growth Rate 5.0%
Long-Term Discount Rate 11.8%
Source: Pivotal Research, Company Reports
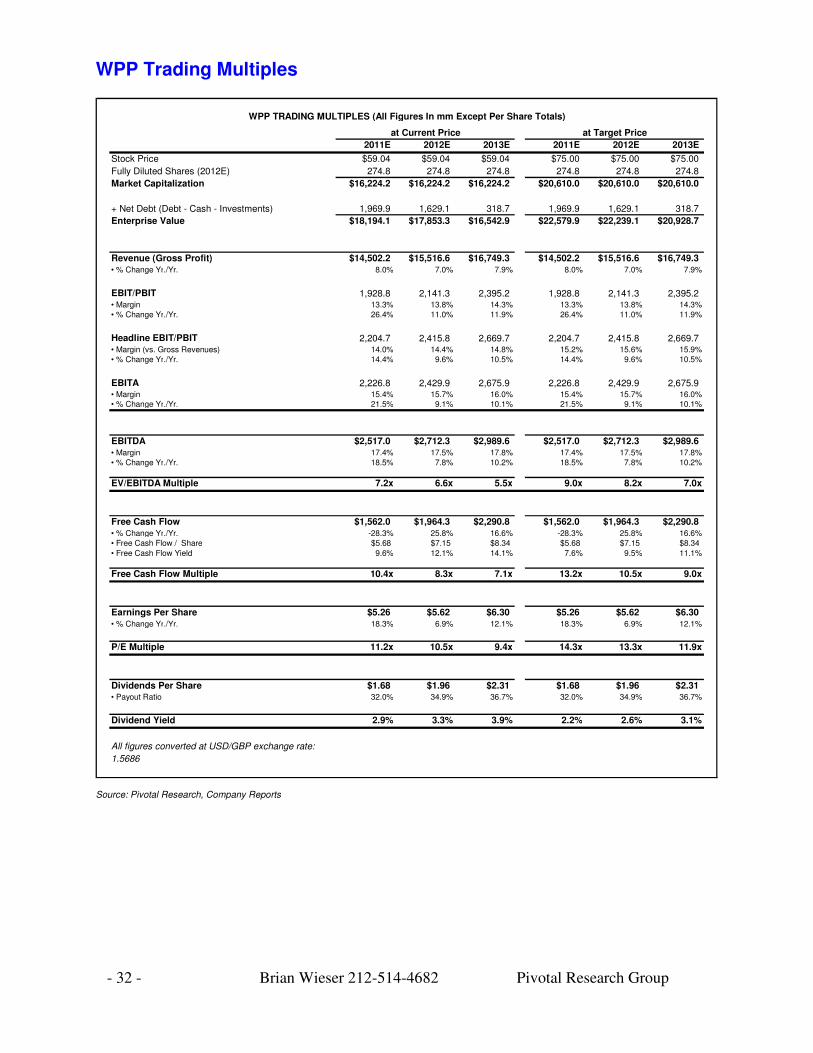
- 32 - Brian Wieser 212-514-4682 Pivotal Research Group
WPP Trading Multiples
WPP TRADING MULTIPLES (All Figures In mm Except Per Share Totals)
at Current Price at Target Price
2011E 2012E 2013E 2011E 2012E 2013E
Stock Price $59.04 $59.04 $59.04 $75.00 $75.00 $75.00
Fully Diluted Shares (2012E) 274.8 274.8 274.8 274.8 274.8 274.8
Market Capitalization $16,224.2 $16,224.2 $16,224.2 $20,610.0 $20,610.0 $20,610.0
+ Net Debt (Debt - Cash - Investments) 1,969.9 1,629.1 318.7 1,969.9 1,629.1 318.7
Enterprise Value $18,194.1 $17,853.3 $16,542.9 $22,579.9 $22,239.1 $20,928.7
Revenue (Gross Profit) $14,502.2 $15,516.6 $16,749.3 $14,502.2 $15,516.6 $16,749.3• % Change Yr./Yr. 8.0% 7.0% 7.9% 8.0% 7.0% 7.9%
EBIT/PBIT 1,928.8 2,141.3 2,395.2 1,928.8 2,141.3 2,395.2• Margin 13.3% 13.8% 14.3% 13.3% 13.8% 14.3%• % Change Yr./Yr. 26.4% 11.0% 11.9% 26.4% 11.0% 11.9%
Headline EBIT/PBIT 2,204.7 2,415.8 2,669.7 2,204.7 2,415.8 2,669.7• Margin (vs. Gross Revenues) 14.0% 14.4% 14.8% 15.2% 15.6% 15.9%• % Change Yr./Yr. 14.4% 9.6% 10.5% 14.4% 9.6% 10.5%
EBITA 2,226.8 2,429.9 2,675.9 2,226.8 2,429.9 2,675.9• Margin 15.4% 15.7% 16.0% 15.4% 15.7% 16.0%• % Change Yr./Yr. 21.5% 9.1% 10.1% 21.5% 9.1% 10.1%
EBITDA $2,517.0 $2,712.3 $2,989.6 $2,517.0 $2,712.3 $2,989.6• Margin 17.4% 17.5% 17.8% 17.4% 17.5% 17.8%• % Change Yr./Yr. 18.5% 7.8% 10.2% 18.5% 7.8% 10.2%
EV/EBITDA Multiple 7.2x 6.6x 5.5x 9.0x 8.2x 7.0x
Free Cash Flow $1,562.0 $1,964.3 $2,290.8 $1,562.0 $1,964.3 $2,290.8• % Change Yr./Yr. -28.3% 25.8% 16.6% -28.3% 25.8% 16.6%• Free Cash Flow / Share $5.68 $7.15 $8.34 $5.68 $7.15 $8.34
• Free Cash Flow Yield 9.6% 12.1% 14.1% 7.6% 9.5% 11.1%
Free Cash Flow Multiple 10.4x 8.3x 7.1x 13.2x 10.5x 9.0x
Earnings Per Share $5.26 $5.62 $6.30 $5.26 $5.62 $6.30• % Change Yr./Yr. 18.3% 6.9% 12.1% 18.3% 6.9% 12.1%
P/E Multiple 11.2x 10.5x 9.4x 14.3x 13.3x 11.9x
Dividends Per Share $1.68 $1.96 $2.31 $1.68 $1.96 $2.31• Payout Ratio 32.0% 34.9% 36.7% 32.0% 34.9% 36.7%
Dividend Yield 2.9% 3.3% 3.9% 2.2% 2.6% 3.1%
All figures converted at USD/GBP exchange rate:
1.5686
Source: Pivotal Research, Company Reports
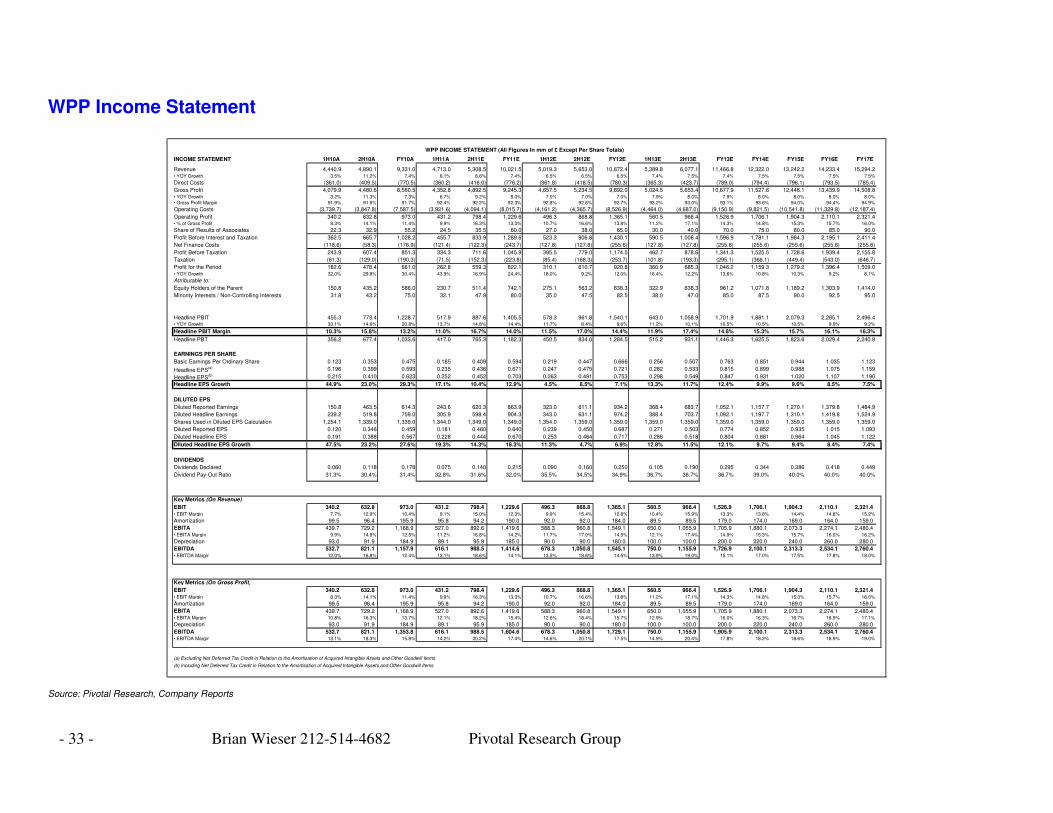
- 33 - Brian Wieser 212-514-4682 Pivotal Research Group
WPP Income Statement
WPP INCOME STATEMENT (All Figures In mm of £ Except Per Share Totals)
INCOME STATEMENT 1H10A 2H10A FY10A 1H11A 2H11E FY11E 1H12E 2H12E FY12E 1H13E 2H13E FY13E FY14E FY15E FY16E FY17E
Revenue 4,440.9 4,890.1 9,331.0 4,713.0 5,308.5 10,021.5 5,019.3 5,653.0 10,672.4 5,389.8 6,077.1 11,466.8 12,322.0 13,242.2 14,233.4 15,294.2 • YOY Growth 3.5% 11.2% 7.4% 6.1% 8.6% 7.4% 6.5% 6.5% 6.5% 7.4% 7.5% 7.4% 7.5% 7.5% 7.5% 7.5%
Direct Costs (361.0) (409.5) (770.5) (360.2) (416.0) (776.2) (361.8) (418.5) (780.3) (365.3) (423.7) (789.0) (794.4) (796.1) (793.5) (785.4)
Gross Profit 4,079.9 4,480.6 8,560.5 4,352.8 4,892.5 9,245.3 4,657.5 5,234.5 9,892.0 5,024.5 5,653.4 10,677.9 11,527.6 12,446.1 13,439.9 14,508.8 • YOY Growth 3.2% 11.3% 7.3% 6.7% 9.2% 8.0% 7.0% 7.0% 7.0% 7.9% 8.0% 7.9% 8.0% 8.0% 8.0% 8.0%
• Gross Profit Margin 91.9% 91.6% 91.7% 92.4% 92.2% 92.3% 92.8% 92.6% 92.7% 93.2% 93.0% 93.1% 93.6% 94.0% 94.4% 94.9%
Operating Costs (3,739.7) (3,847.8) (7,587.5) (3,921.6) (4,094.1) (8,015.7) (4,161.2) (4,365.7) (8,526.9) (4,464.0) (4,687.0) (9,150.9) (9,821.5) (10,541.8) (11,329.8) (12,187.4)
Operating Profit 340.2 632.8 973.0 431.2 798.4 1,229.6 496.3 868.8 1,365.1 560.5 966.4 1,526.9 1,706.1 1,904.3 2,110.1 2,321.4 • % of Gross Profit 8.3% 14.1% 11.4% 9.9% 16.3% 13.3% 10.7% 16.6% 13.8% 11.2% 17.1% 14.3% 14.8% 15.3% 15.7% 16.0%
Share of Results of Associates 22.3 32.9 55.2 24.5 35.5 60.0 27.0 38.0 65.0 30.0 40.0 70.0 75.0 80.0 85.0 90.0
Profit Before Interest and Taxation 362.5 665.7 1,028.2 455.7 833.9 1,289.6 523.3 906.8 1,430.1 590.5 1,006.4 1,596.9 1,781.1 1,984.3 2,195.1 2,411.4
Net Finance Costs (118.6) (58.3) (176.9) (121.4) (122.3) (243.7) (127.8) (127.8) (255.6) (127.8) (127.8) (255.6) (255.6) (255.6) (255.6) (255.6)
Profit Before Taxation 243.9 607.4 851.3 334.3 711.6 1,045.9 395.5 779.0 1,174.5 462.7 878.6 1,341.3 1,525.5 1,728.6 1,939.4 2,155.8
Taxation (61.3) (129.0) (190.3) (71.5) (152.3) (223.8) (85.4) (168.3) (253.7) (101.8) (193.3) (295.1) (366.1) (449.4) (543.0) (646.7)
Profit for the Period 182.6 478.4 661.0 262.8 559.3 822.1 310.1 610.7 920.8 360.9 685.3 1,046.2 1,159.3 1,279.2 1,396.4 1,509.0 • YOY Growth 32.0% 29.8% 30.4% 43.9% 16.9% 24.4% 18.0% 9.2% 12.0% 16.4% 12.2% 13.6% 10.8% 10.3% 9.2% 8.1%
Attributable to:
Equity Holders of the Parent 150.8 435.2 586.0 230.7 511.4 742.1 275.1 563.2 838.3 322.9 638.3 961.2 1,071.8 1,189.2 1,303.9 1,414.0
Minority Interests / Non-Controlling Interests 31.8 43.2 75.0 32.1 47.9 80.0 35.0 47.5 82.5 38.0 47.0 85.0 87.5 90.0 92.5 95.0
Headline PBIT 455.3 773.4 1,228.7 517.9 887.6 1,405.5 578.3 961.8 1,540.1 643.0 1,058.9 1,701.9 1,881.1 2,079.3 2,285.1 2,496.4 • YOY Growth 33.1% 14.6% 20.8% 13.7% 14.8% 14.4% 11.7% 8.4% 9.6% 11.2% 10.1% 10.5% 10.5% 10.5% 9.9% 9.2%
Headline PBIT Margin 10.3% 15.8% 13.2% 11.0% 16.7% 14.0% 11.5% 17.0% 14.4% 11.9% 17.4% 14.8% 15.3% 15.7% 16.1% 16.3%
Headline PBT 356.2 677.4 1,033.6 417.0 765.3 1,182.3 450.5 834.0 1,284.5 515.2 931.1 1,446.3 1,625.5 1,823.6 2,029.4 2,240.8
EARNINGS PER SHARE
Basic Earnings Per Ordinary Share 0.123 0.353 0.475 0.185 0.409 0.594 0.219 0.447 0.666 0.256 0.507 0.763 0.851 0.944 1.035 1.123
Headline EPS(a) 0.196 0.399 0.593 0.235 0.436 0.671 0.247 0.475 0.721 0.282 0.533 0.815 0.899 0.988 1.075 1.159
Headline EPS(b) 0.215 0.410 0.623 0.252 0.452 0.703 0.263 0.491 0.753 0.298 0.549 0.847 0.931 1.020 1.107 1.190
Headline EPS Growth 44.9% 23.0% 29.3% 17.1% 10.4% 12.9% 4.5% 8.5% 7.1% 13.3% 11.7% 12.4% 9.9% 9.6% 8.5% 7.5%
DILUTED EPS
Diluted Reported Earnings 150.8 463.5 614.3 243.6 620.3 863.9 323.0 611.1 934.2 368.4 683.7 1,052.1 1,157.7 1,270.1 1,379.8 1,484.9
Diluted Headline Earnings 239.2 519.8 759.0 305.9 598.4 904.3 343.0 631.1 974.2 388.4 703.7 1,092.1 1,197.7 1,310.1 1,419.8 1,524.9
Shares Used in Diluted EPS Calculation 1,254.1 1,339.0 1,339.0 1,344.0 1,349.0 1,349.0 1,354.0 1,359.0 1,359.0 1,359.0 1,359.0 1,359.0 1,359.0 1,359.0 1,359.0 1,359.0
Diluted Reported EPS 0.120 0.346 0.459 0.181 0.460 0.640 0.239 0.450 0.687 0.271 0.503 0.774 0.852 0.935 1.015 1.093
Diluted Headline EPS 0.191 0.388 0.567 0.228 0.444 0.670 0.253 0.464 0.717 0.286 0.518 0.804 0.881 0.964 1.045 1.122
Diluted Headline EPS Growth 47.5% 23.2% 27.6% 19.3% 14.3% 18.3% 11.3% 4.7% 6.9% 12.8% 11.5% 12.1% 9.7% 9.4% 8.4% 7.4%
DIVIDENDS
Dividends Declared 0.060 0.118 0.178 0.075 0.140 0.215 0.090 0.160 0.250 0.105 0.190 0.295 0.344 0.386 0.418 0.449
Dividend Pay-Out Ratio 31.3% 30.4% 31.4% 32.8% 31.6% 32.0% 35.5% 34.5% 34.9% 36.7% 36.7% 36.7% 39.0% 40.0% 40.0% 40.0%
Key Metrics (On Revenue)
EBIT 340.2 632.8 973.0 431.2 798.4 1,229.6 496.3 868.8 1,365.1 560.5 966.4 1,526.9 1,706.1 1,904.3 2,110.1 2,321.4• EBIT Margin 7.7% 12.9% 10.4% 9.1% 15.0% 12.3% 9.9% 15.4% 12.8% 10.4% 15.9% 13.3% 13.8% 14.4% 14.8% 15.2%
Amortization 99.5 96.4 195.9 95.8 94.2 190.0 92.0 92.0 184.0 89.5 89.5 179.0 174.0 169.0 164.0 159.0
EBITA 439.7 729.2 1,168.9 527.0 892.6 1,419.6 588.3 960.8 1,549.1 650.0 1,055.9 1,705.9 1,880.1 2,073.3 2,274.1 2,480.4• EBITA Margin 9.9% 14.9% 12.5% 11.2% 16.8% 14.2% 11.7% 17.0% 14.5% 12.1% 17.4% 14.9% 15.3% 15.7% 16.0% 16.2%
Depreciation 93.0 91.9 184.9 89.1 95.9 185.0 90.0 90.0 180.0 100.0 100.0 200.0 220.0 240.0 260.0 280.0
EBITDA 532.7 821.1 1,157.9 616.1 988.5 1,414.6 678.3 1,050.8 1,545.1 750.0 1,155.9 1,726.9 2,100.1 2,313.3 2,534.1 2,760.4• EBITDA Margin 12.0% 16.8% 12.4% 13.1% 18.6% 14.1% 13.5% 18.6% 14.5% 13.9% 19.0% 15.1% 17.0% 17.5% 17.8% 18.0%
Key Metrics (On Gross Profit)
EBIT 340.2 632.8 973.0 431.2 798.4 1,229.6 496.3 868.8 1,365.1 560.5 966.4 1,526.9 1,706.1 1,904.3 2,110.1 2,321.4• EBIT Margin 8.3% 14.1% 11.4% 9.9% 16.3% 13.3% 10.7% 16.6% 13.8% 11.2% 17.1% 14.3% 14.8% 15.3% 15.7% 16.0%
Amortization 99.5 96.4 195.9 95.8 94.2 190.0 92.0 92.0 184.0 89.5 89.5 179.0 174.0 169.0 164.0 159.0
EBITA 439.7 729.2 1,168.9 527.0 892.6 1,419.6 588.3 960.8 1,549.1 650.0 1,055.9 1,705.9 1,880.1 2,073.3 2,274.1 2,480.4• EBITA Margin 10.8% 16.3% 13.7% 12.1% 18.2% 15.4% 12.6% 18.4% 15.7% 12.9% 18.7% 16.0% 16.3% 16.7% 16.9% 17.1%
Depreciation 93.0 91.9 184.9 89.1 95.9 185.0 90.0 90.0 180.0 100.0 100.0 200.0 220.0 240.0 260.0 280.0
EBITDA 532.7 821.1 1,353.8 616.1 988.5 1,604.6 678.3 1,050.8 1,729.1 750.0 1,155.9 1,905.9 2,100.1 2,313.3 2,534.1 2,760.4• EBITDA Margin 13.1% 18.3% 15.8% 14.2% 20.2% 17.4% 14.6% 20.1% 17.5% 14.9% 20.4% 17.8% 18.2% 18.6% 18.9% 19.0%
(a) Excluding Net Deferred Tax Credit in Relation to the Amortisation of Acquired Intangible Assets and Other Goodwill Items
(b) Including Net Deferred Tax Credit in Relation to the Amortisation of Acquired Intangible Assets and Other Goodwill Items
Source: Pivotal Research, Company Reports
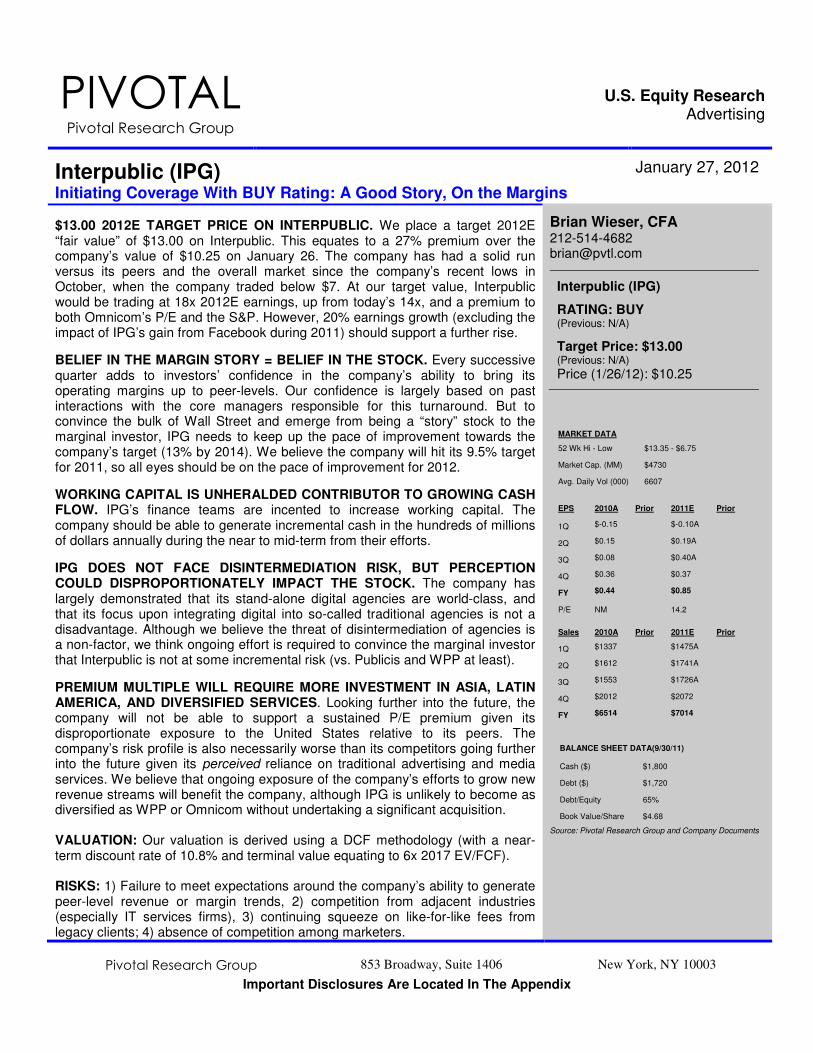
Pivotal Research Group 853 Broadway, Suite 1406 New York, NY 10003
Important Disclosures Are Located In The Appendix
PIVOTAL Pivotal Research Group
U.S. Equity Research Advertising
Interpublic (IPG) Initiating Coverage With BUY Rating: A Good Story, On the Margins
January 27, 2012
$13.00 2012E TARGET PRICE ON INTERPUBLIC. We place a target 2012E “fair value” of $13.00 on Interpublic. This equates to a 27% premium over the company’s value of $10.25 on January 26. The company has had a solid run versus its peers and the overall market since the company’s recent lows in October, when the company traded below $7. At our target value, Interpublic would be trading at 18x 2012E earnings, up from today’s 14x, and a premium to both Omnicom’s P/E and the S&P. However, 20% earnings growth (excluding the impact of IPG’s gain from Facebook during 2011) should support a further rise.
BELIEF IN THE MARGIN STORY = BELIEF IN THE STOCK. Every successive quarter adds to investors’ confidence in the company’s ability to bring its operating margins up to peer-levels. Our confidence is largely based on past interactions with the core managers responsible for this turnaround. But to convince the bulk of Wall Street and emerge from being a “story” stock to the marginal investor, IPG needs to keep up the pace of improvement towards the company’s target (13% by 2014). We believe the company will hit its 9.5% target for 2011, so all eyes should be on the pace of improvement for 2012.
WORKING CAPITAL IS UNHERALDED CONTRIBUTOR TO GROWING CASH FLOW. IPG’s finance teams are incented to increase working capital. The company should be able to generate incremental cash in the hundreds of millions of dollars annually during the near to mid-term from their efforts.
IPG DOES NOT FACE DISINTERMEDIATION RISK, BUT PERCEPTION COULD DISPROPORTIONATELY IMPACT THE STOCK. The company has largely demonstrated that its stand-alone digital agencies are world-class, and that its focus upon integrating digital into so-called traditional agencies is not a disadvantage. Although we believe the threat of disintermediation of agencies is a non-factor, we think ongoing effort is required to convince the marginal investor that Interpublic is not at some incremental risk (vs. Publicis and WPP at least).
PREMIUM MULTIPLE WILL REQUIRE MORE INVESTMENT IN ASIA, LATIN AMERICA, AND DIVERSIFIED SERVICES. Looking further into the future, the company will not be able to support a sustained P/E premium given its disproportionate exposure to the United States relative to its peers. The company’s risk profile is also necessarily worse than its competitors going further into the future given its perceived reliance on traditional advertising and media services. We believe that ongoing exposure of the company’s efforts to grow new revenue streams will benefit the company, although IPG is unlikely to become as diversified as WPP or Omnicom without undertaking a significant acquisition. VALUATION: Our valuation is derived using a DCF methodology (with a near-term discount rate of 10.8% and terminal value equating to 6x 2017 EV/FCF). RISKS: 1) Failure to meet expectations around the company’s ability to generate peer-level revenue or margin trends, 2) competition from adjacent industries (especially IT services firms), 3) continuing squeeze on like-for-like fees from legacy clients; 4) absence of competition among marketers.
Brian Wieser, CFA 212-514-4682 [email protected]
Interpublic (IPG)
RATING: BUY (Previous: N/A)
Target Price: $13.00 (Previous: N/A)
Price (1/26/12): $10.25
MARKET DATA
52 Wk Hi - Low $13.35 - $6.75
Market Cap. (MM) $4730
Avg. Daily Vol (000) 6607
EPS 2010A Prior 2011E Prior
1Q $-0.15 $-0.10A
2Q $0.15 $0.19A
3Q $0.08 $0.40A
4Q $0.36 $0.37
FY $0.44 $0.85
P/E NM 14.2
Sales 2010A Prior 2011E Prior
1Q $1337 $1475A
2Q $1612 $1741A
3Q $1553 $1726A
4Q $2012 $2072
FY $6514 $7014
BALANCE SHEET DATA(9/30/11)
Cash ($) $1,800
Debt ($) $1,720
Debt/Equity 65%
Book Value/Share $4.68
Source: Pivotal Research Group and Company Documents

- 35 - Brian Wieser 212-514-4682 Pivotal Research Group
RISKS Investors will also need to consider the following among the company’s and industry’s risks: FAILURE TO MEET REVENUE OR MARGIN EXPECTATIONS. Client losses or the failure to improve operations could lead to shortfalls of revenue or margin expectations. SQUEEZING FEES. Marketers are typically squeezing their agencies for operational efficiencies on an ongoing basis. Agencies have historically proven resilient in finding cost saving opportunities to perform like-for-like services. However at some point such efforts may no longer yield incremental benefits, and as long as agencies operate in a competitive manner they will suffer. In a similar light, high margin services offered today are typically likely to become standard-margin services in the future, as the more a service becomes standardized, the more that marketers’ procurement teams seek to standardize processes and drive agency margin out of the activity. COMPETITION FROM ADJACENT INDUSTRIES. We remain skeptical that today’s digital media companies such as Google or Microsoft will ever actively compete with agencies. This should hold not least because digital media companies will want to retain their margins (significantly higher than those for agency services) but also because clients generally want some perceived independence from advisors making marketing budget recommendations. However, agencies are increasingly placed up against today’s IT services firm in providing some services today. This type competition is more likely to increase in the future, although not across all marketing-related disciplines. Companies such as Accenture and IBM are increasingly positioning parts of their businesses adjacent to agencies as they seek to build platforms which can manage the execution of media campaigns, monitor the impact of those campaigns and integrate those efforts with an array of marketing data within a company’s ERP (enterprise resource planning) system. Sapient’s business lines represent the strongest balance between these functions today, although their impact on the broader industry has not yet been significant. Further, media suppliers (such as Hearst and Meredith) and software developers (such as Adobe) have also established competitive positions in some fields previously reserved for agencies, such as in search engine marketing. Given the extremely long selling cycles and the duration of agency-marketer contracts (usually several years in length) as well as the operational considerations for marketers in changing their own processes, no upstart can transform the agency industry overnight. The bigger issue is whether or not agencies are able to sufficiently adapt their own offerings in the time they have before a new service becomes a standard expectation. REDUCED COMPETITION BETWEEN MARKETERS. We have previously identified that advertising spending – and marketing in general – is primarily driven by the competitive intensity that is present within a given category. To the extent that industries evolve to feature reduced levels of competitive intensity, marketing services would generally suffer.
- 36 - Brian Wieser 212-514-4682 Pivotal Research Group
Interpublic’s Current State in Historical Context Interpublic was the original holding company, founded as an extension of McCann-Erickson in 1960, which was then (and remains now) one of the world’s largest stand-alone advertising agencies. In the aftermath of an extensive series of acquisitions, the company struggled during the early ‘00s on several levels: • Managerially, the company underwent significant change at the top, with four different CEOs and
CFOs between 2000 and 2005. • Around the same time, the company was late to separate the P&Ls of its media operations from its
creative agencies when the bulk of its competition had done so, leading to a less competitive media offering. Other flagship global agencies – including Lowe and Foot Cone Belding (or FCB) – were performing poorly. Further, several of the company’s acquisitions (such as motorsports raceways) were simply ill-advised for an agency holding company.
• The operational challenges were exacerbated because of what were described as “ineffective financial controls” which led to an SEC investigation and restatements of earnings.
However, by early 2008, the motorways had been divested, the media operations restructured, FCB was merged with another IPG agency (Draft) into DraftFCB, managerial stability had mostly been established under the steady CEO, Michael Roth, and the SEC investigation was resolved. The company was making significant progress towards its goals of improving organic revenue growth and operating margins to industry norms when the global financial crisis hit later that year. As the global financial crisis subsided, the company was at last benefiting from several years of managerial stability. Organic revenue growth appeared, and at last IPG found itself growing in line (or faster than) the rest of the industry. Concurrently, operating margins continued to improve, although they remain well-below industry norms. Management is targeting “peer-level” operating margins of 13% by 2014, up from guidance of “at least” 9.5% during 2011. Challenges and risks can are primarily at McCann WorldGroup, the “sub-holding” company which houses McCann-Erickson, MRM and Momentum among other agencies. McCann-Erickson struggled in recent years, and installed Nick Brien as CEO in 2010 after his successful effort leading a turnaround of the media operations (by now under a sub-holding company of its own, Mediabrands). While IPG does not break out McCann’s operating margins, by simple deduction we can see the opportunity for IPG associated with a successful outcome there. If we assume that at the time of Brien’s installation McCann was significantly underperforming the margins produced by the rest of Interpublic, it would be reasonable to assume there was room for at least a 500bps operating margin improvement (i.e. an improvement from operating margins from 5% to 10%). Placed against the ~40% of IPG revenues that McCann accounts for, we can see how a turnaround on this scale would by itself contribute to a 2% margin improvement for the holding company. If the scale of the intended turnaround is even greater, the impact of success would be even more significant. Consequently, we believe a successful turnaround for McCann is ultimately important for investors to monitor in assessing when and how Interpublic will achieve peer-level margins. From our experience with Mr. Brien and members of his financial team, we remain confident in their ability to see through the challenges they face, although the process is unlikely to prove easy any time soon.
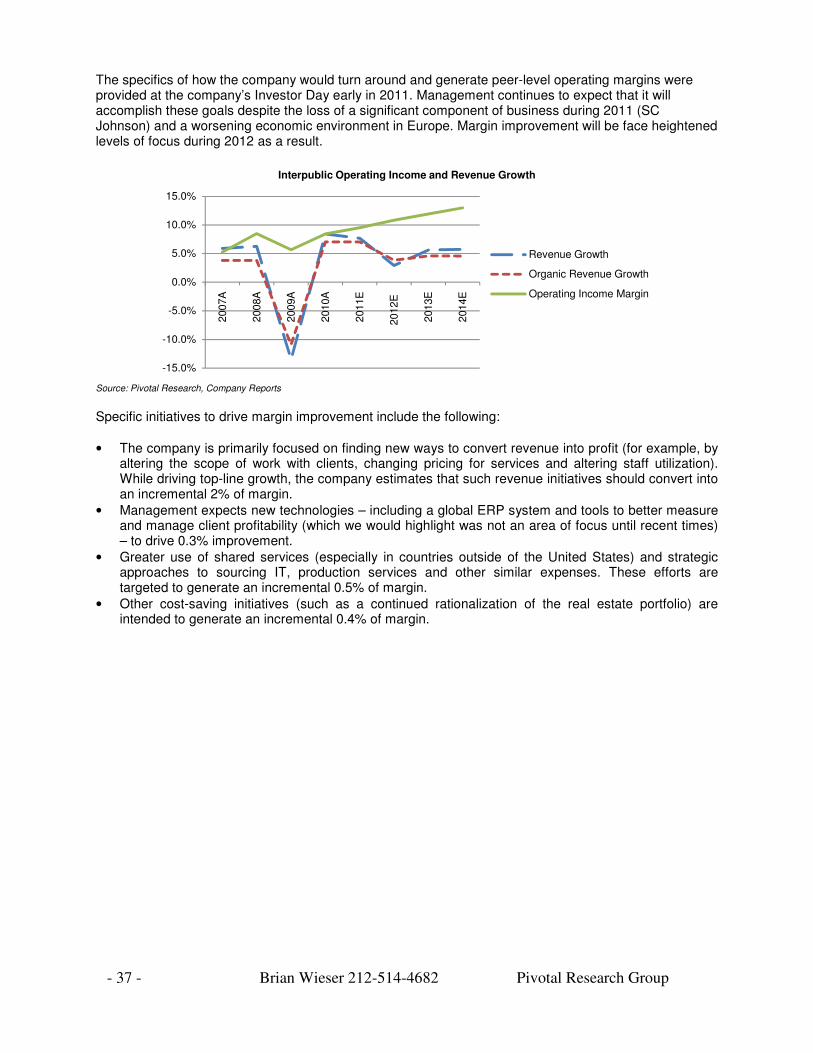
- 37 - Brian Wieser 212-514-4682 Pivotal Research Group
The specifics of how the company would turn around and generate peer-level operating margins were provided at the company’s Investor Day early in 2011. Management continues to expect that it will accomplish these goals despite the loss of a significant component of business during 2011 (SC Johnson) and a worsening economic environment in Europe. Margin improvement will be face heightened levels of focus during 2012 as a result.
-15.0%
-10.0%
-5.0%
0.0%
5.0%
10.0%
15.0%
2007A
2008A
2009A
2010A
2011E
2012E
2013E
2014E
Revenue Growth
Organic Revenue Growth
Operating Income Margin
Interpublic Operating Income and Revenue Growth
Source: Pivotal Research, Company Reports Specific initiatives to drive margin improvement include the following: • The company is primarily focused on finding new ways to convert revenue into profit (for example, by
altering the scope of work with clients, changing pricing for services and altering staff utilization). While driving top-line growth, the company estimates that such revenue initiatives should convert into an incremental 2% of margin.
• Management expects new technologies – including a global ERP system and tools to better measure and manage client profitability (which we would highlight was not an area of focus until recent times) – to drive 0.3% improvement.
• Greater use of shared services (especially in countries outside of the United States) and strategic approaches to sourcing IT, production services and other similar expenses. These efforts are targeted to generate an incremental 0.5% of margin.
• Other cost-saving initiatives (such as a continued rationalization of the real estate portfolio) are intended to generate an incremental 0.4% of margin.
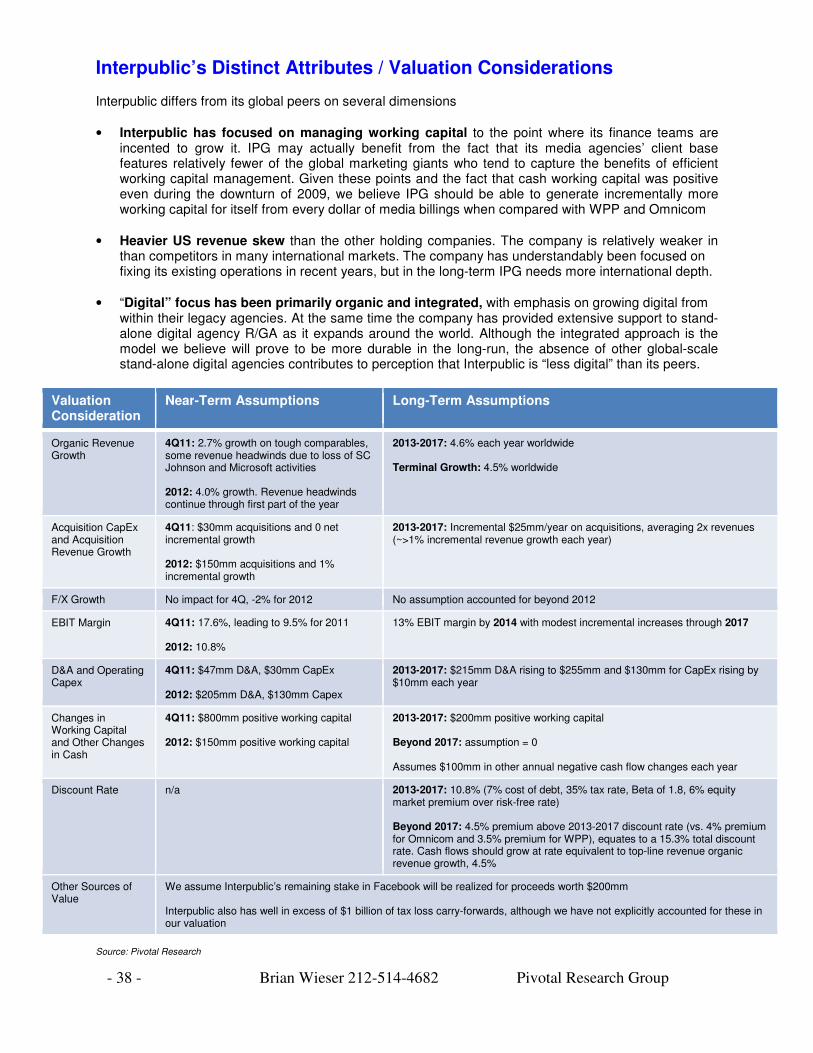
- 38 - Brian Wieser 212-514-4682 Pivotal Research Group
Interpublic’s Distinct Attributes / Valuation Considerations Interpublic differs from its global peers on several dimensions • Interpublic has focused on managing working capital to the point where its finance teams are
incented to grow it. IPG may actually benefit from the fact that its media agencies’ client base features relatively fewer of the global marketing giants who tend to capture the benefits of efficient working capital management. Given these points and the fact that cash working capital was positive even during the downturn of 2009, we believe IPG should be able to generate incrementally more working capital for itself from every dollar of media billings when compared with WPP and Omnicom
• Heavier US revenue skew than the other holding companies. The company is relatively weaker in than competitors in many international markets. The company has understandably been focused on fixing its existing operations in recent years, but in the long-term IPG needs more international depth.
• “Digital” focus has been primarily organic and integrated, with emphasis on growing digital from within their legacy agencies. At the same time the company has provided extensive support to stand-alone digital agency R/GA as it expands around the world. Although the integrated approach is the model we believe will prove to be more durable in the long-run, the absence of other global-scale stand-alone digital agencies contributes to perception that Interpublic is “less digital” than its peers.
Valuation Consideration
Near-Term Assumptions Long-Term Assumptions
Organic Revenue Growth
4Q11: 2.7% growth on tough comparables, some revenue headwinds due to loss of SC Johnson and Microsoft activities 2012: 4.0% growth. Revenue headwinds continue through first part of the year
2013-2017: 4.6% each year worldwide Terminal Growth: 4.5% worldwide
Acquisition CapEx and Acquisition Revenue Growth
4Q11: $30mm acquisitions and 0 net incremental growth 2012: $150mm acquisitions and 1% incremental growth
2013-2017: Incremental $25mm/year on acquisitions, averaging 2x revenues (~>1% incremental revenue growth each year)
F/X Growth No impact for 4Q, -2% for 2012 No assumption accounted for beyond 2012
EBIT Margin 4Q11: 17.6%, leading to 9.5% for 2011 2012: 10.8%
13% EBIT margin by 2014 with modest incremental increases through 2017
D&A and Operating Capex
4Q11: $47mm D&A, $30mm CapEx 2012: $205mm D&A, $130mm Capex
2013-2017: $215mm D&A rising to $255mm and $130mm for CapEx rising by $10mm each year
Changes in Working Capital and Other Changes in Cash
4Q11: $800mm positive working capital 2012: $150mm positive working capital
2013-2017: $200mm positive working capital Beyond 2017: assumption = 0 Assumes $100mm in other annual negative cash flow changes each year
Discount Rate n/a 2013-2017: 10.8% (7% cost of debt, 35% tax rate, Beta of 1.8, 6% equity market premium over risk-free rate) Beyond 2017: 4.5% premium above 2013-2017 discount rate (vs. 4% premium for Omnicom and 3.5% premium for WPP), equates to a 15.3% total discount rate. Cash flows should grow at rate equivalent to top-line revenue organic revenue growth, 4.5%
Other Sources of Value
We assume Interpublic’s remaining stake in Facebook will be realized for proceeds worth $200mm Interpublic also has well in excess of $1 billion of tax loss carry-forwards, although we have not explicitly accounted for these in our valuation
Source: Pivotal Research
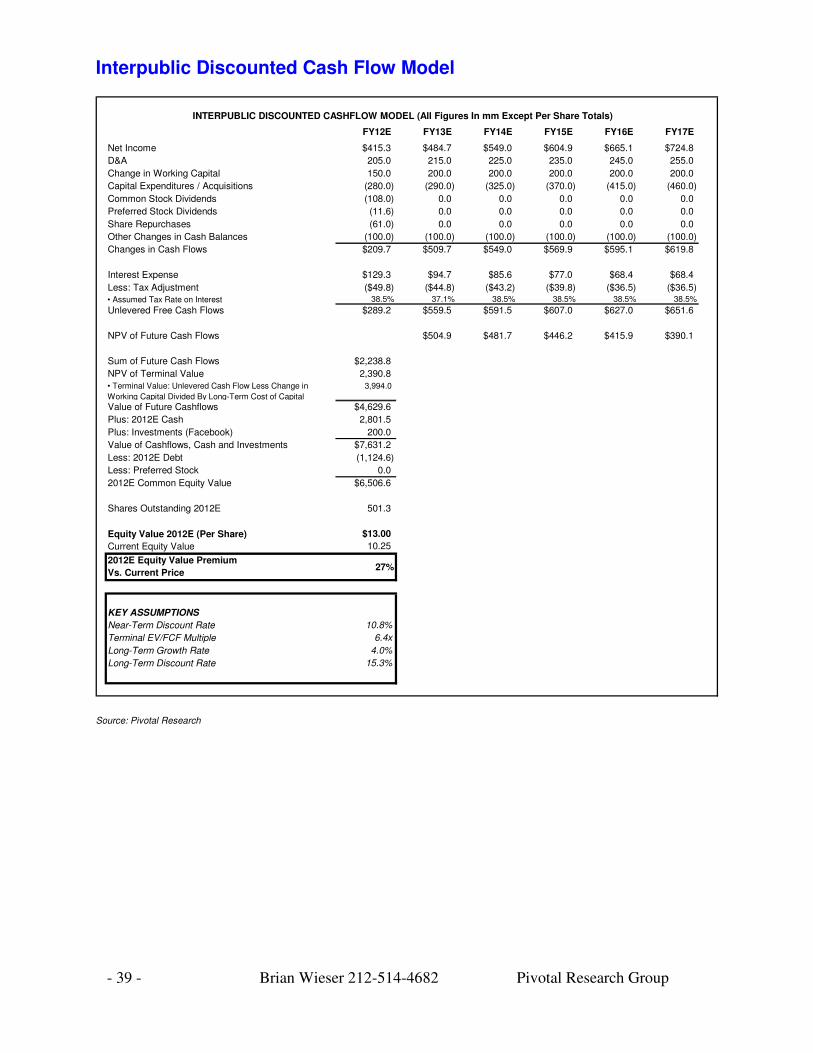
- 39 - Brian Wieser 212-514-4682 Pivotal Research Group
Interpublic Discounted Cash Flow Model
INTERPUBLIC DISCOUNTED CASHFLOW MODEL (All Figures In mm Except Per Share Totals)
FY12E FY13E FY14E FY15E FY16E FY17E Year 1 1 2 3 4 5
Net Income $415.3 $484.7 $549.0 $604.9 $665.1 $724.8
D&A 205.0 215.0 225.0 235.0 245.0 255.0
Change in Working Capital 150.0 200.0 200.0 200.0 200.0 200.0
Capital Expenditures / Acquisitions (280.0) (290.0) (325.0) (370.0) (415.0) (460.0)
Common Stock Dividends (108.0) 0.0 0.0 0.0 0.0 0.0
Preferred Stock Dividends (11.6) 0.0 0.0 0.0 0.0 0.0
Share Repurchases (61.0) 0.0 0.0 0.0 0.0 0.0
Other Changes in Cash Balances (100.0) (100.0) (100.0) (100.0) (100.0) (100.0)
Changes in Cash Flows $209.7 $509.7 $549.0 $569.9 $595.1 $619.8
Interest Expense $129.3 $94.7 $85.6 $77.0 $68.4 $68.4
Less: Tax Adjustment ($49.8) ($44.8) ($43.2) ($39.8) ($36.5) ($36.5)• Assumed Tax Rate on Interest 38.5% 37.1% 38.5% 38.5% 38.5% 38.5%
Unlevered Free Cash Flows $289.2 $559.5 $591.5 $607.0 $627.0 $651.6
NPV of Future Cash Flows $504.9 $481.7 $446.2 $415.9 $390.1
Sum of Future Cash Flows $2,238.8
NPV of Terminal Value 2,390.8
• Terminal Value: Unlevered Cash Flow Less Change in
Working Capital Divided By Long-Term Cost of Capital
3,994.0
Value of Future Cashflows $4,629.6
Plus: 2012E Cash 2,801.5
Plus: Investments (Facebook) 200.0
Value of Cashflows, Cash and Investments $7,631.2
Less: 2012E Debt (1,124.6)
Less: Preferred Stock 0.0
2012E Common Equity Value $6,506.6
Shares Outstanding 2012E 501.3
Equity Value 2012E (Per Share) $13.00
Current Equity Value 10.25
2012E Equity Value Premium
Vs. Current Price27%
KEY ASSUMPTIONS
Near-Term Discount Rate 10.8%
Terminal EV/FCF Multiple 6.4x
Long-Term Growth Rate 4.0%
Long-Term Discount Rate 15.3%
Source: Pivotal Research
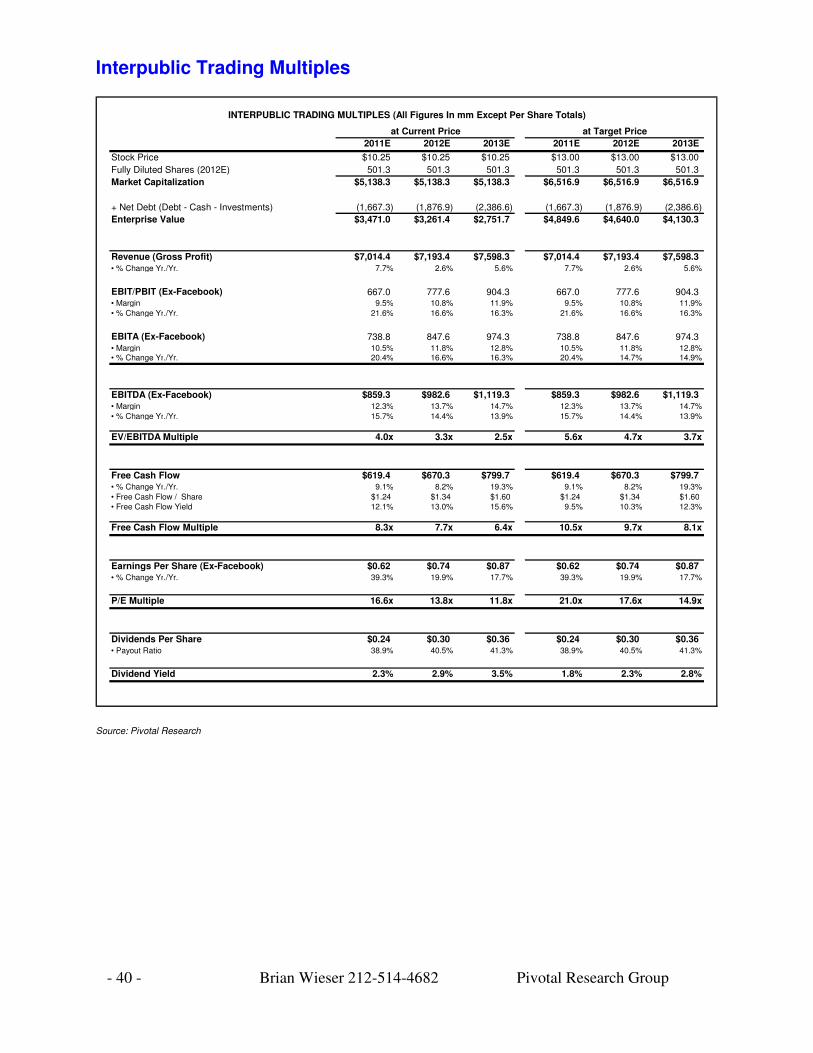
- 40 - Brian Wieser 212-514-4682 Pivotal Research Group
Interpublic Trading Multiples
INTERPUBLIC TRADING MULTIPLES (All Figures In mm Except Per Share Totals)
at Current Price at Target Price
2011E 2012E 2013E 2011E 2012E 2013E
Stock Price $10.25 $10.25 $10.25 $13.00 $13.00 $13.00
Fully Diluted Shares (2012E) 501.3 501.3 501.3 501.3 501.3 501.3
Market Capitalization $5,138.3 $5,138.3 $5,138.3 $6,516.9 $6,516.9 $6,516.9
+ Net Debt (Debt - Cash - Investments) (1,667.3) (1,876.9) (2,386.6) (1,667.3) (1,876.9) (2,386.6)
Enterprise Value $3,471.0 $3,261.4 $2,751.7 $4,849.6 $4,640.0 $4,130.3
Revenue (Gross Profit) $7,014.4 $7,193.4 $7,598.3 $7,014.4 $7,193.4 $7,598.3• % Change Yr./Yr. 7.7% 2.6% 5.6% 7.7% 2.6% 5.6%
EBIT/PBIT (Ex-Facebook) 667.0 777.6 904.3 667.0 777.6 904.3• Margin 9.5% 10.8% 11.9% 9.5% 10.8% 11.9%
• % Change Yr./Yr. 21.6% 16.6% 16.3% 21.6% 16.6% 16.3%
EBITA (Ex-Facebook) 738.8 847.6 974.3 738.8 847.6 974.3• Margin 10.5% 11.8% 12.8% 10.5% 11.8% 12.8%• % Change Yr./Yr. 20.4% 16.6% 16.3% 20.4% 14.7% 14.9%
EBITDA (Ex-Facebook) $859.3 $982.6 $1,119.3 $859.3 $982.6 $1,119.3• Margin 12.3% 13.7% 14.7% 12.3% 13.7% 14.7%
• % Change Yr./Yr. 15.7% 14.4% 13.9% 15.7% 14.4% 13.9%
EV/EBITDA Multiple 4.0x 3.3x 2.5x 5.6x 4.7x 3.7x
Free Cash Flow $619.4 $670.3 $799.7 $619.4 $670.3 $799.7• % Change Yr./Yr. 9.1% 8.2% 19.3% 9.1% 8.2% 19.3%
• Free Cash Flow / Share $1.24 $1.34 $1.60 $1.24 $1.34 $1.60• Free Cash Flow Yield 12.1% 13.0% 15.6% 9.5% 10.3% 12.3%
Free Cash Flow Multiple 8.3x 7.7x 6.4x 10.5x 9.7x 8.1x
Earnings Per Share (Ex-Facebook) $0.62 $0.74 $0.87 $0.62 $0.74 $0.87• % Change Yr./Yr. 39.3% 19.9% 17.7% 39.3% 19.9% 17.7%
P/E Multiple 16.6x 13.8x 11.8x 21.0x 17.6x 14.9x
Dividends Per Share $0.24 $0.30 $0.36 $0.24 $0.30 $0.36• Payout Ratio 38.9% 40.5% 41.3% 38.9% 40.5% 41.3%
Dividend Yield 2.3% 2.9% 3.5% 1.8% 2.3% 2.8%
Source: Pivotal Research
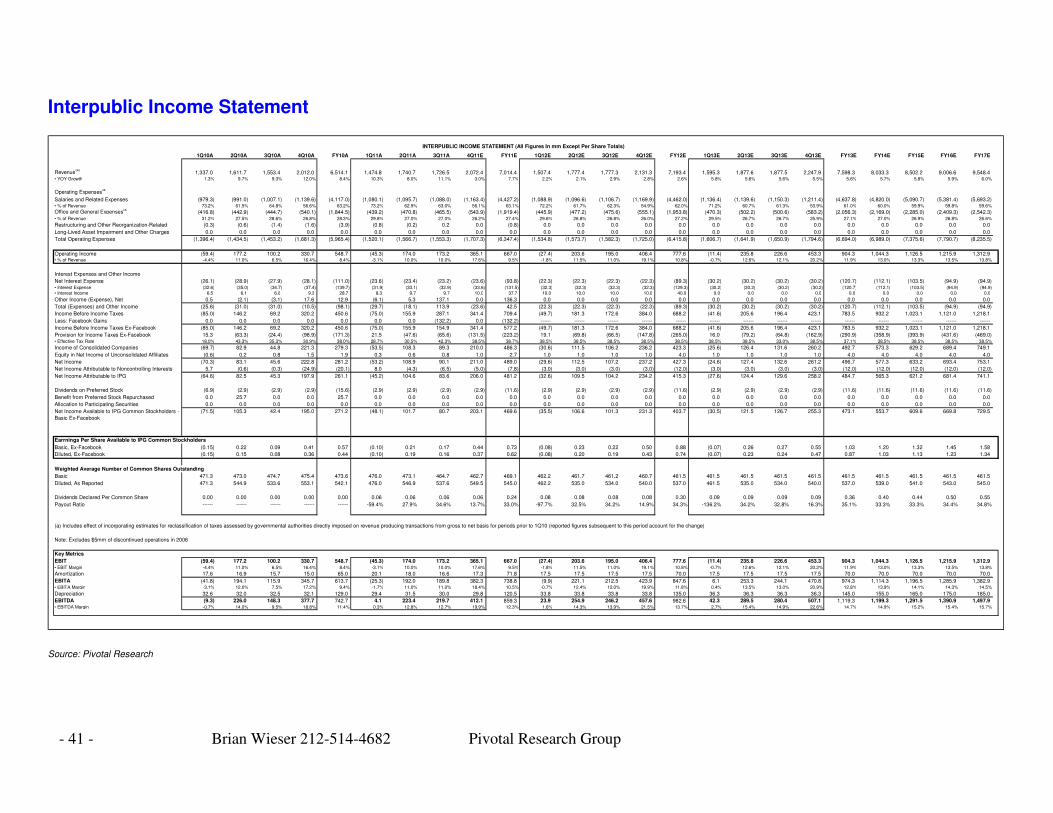
- 41 - Brian Wieser 212-514-4682 Pivotal Research Group
Interpublic Income Statement
INTERPUBLIC INCOME STATEMENT (All Figures In mm Except Per Share Totals)
1Q10A 2Q10A 3Q10A 4Q10A FY10A 1Q11A 2Q11A 3Q11A 4Q11E FY11E 1Q12E 2Q12E 3Q12E 4Q12E FY12E 1Q13E 2Q13E 3Q13E 4Q13E FY13E FY14E FY15E FY16E FY17E
Revenue(a)
1,337.0 1,611.7 1,553.4 2,012.0 6,514.1 1,474.8 1,740.7 1,726.5 2,072.4 7,014.4 1,507.4 1,777.4 1,777.3 2,131.3 7,193.4 1,595.3 1,877.6 1,877.5 2,247.9 7,598.3 8,033.3 8,502.2 9,006.6 9,548.4• YOY Growth 1.3% 9.7% 9.3% 12.0% 8.4% 10.3% 8.0% 11.1% 3.0% 7.7% 2.2% 2.1% 2.9% 2.8% 2.6% 5.8% 5.6% 5.6% 5.5% 5.6% 5.7% 5.8% 5.9% 6.0%
Operating Expenses(a)
Salaries and Related Expenses (979.3) (991.0) (1,007.1) (1,139.6) (4,117.0) (1,080.1) (1,095.7) (1,088.0) (1,163.4) (4,427.2) (1,088.9) (1,096.6) (1,106.7) (1,169.9) (4,462.0) (1,136.4) (1,139.6) (1,150.3) (1,211.4) (4,637.8) (4,820.0) (5,090.7) (5,381.4) (5,693.2)• % of Revenue 73.2% 61.5% 64.8% 56.6% 63.2% 73.2% 62.9% 63.0% 56.1% 63.1% 72.2% 61.7% 62.3% 54.9% 62.0% 71.2% 60.7% 61.3% 53.9% 61.0% 60.0% 59.9% 59.8% 59.6%
Office and General Expenses(a)
(416.8) (442.9) (444.7) (540.1) (1,844.5) (439.2) (470.8) (465.5) (543.9) (1,919.4) (445.9) (477.2) (475.6) (555.1) (1,953.8) (470.3) (502.2) (500.6) (583.2) (2,056.3) (2,169.0) (2,285.0) (2,409.3) (2,542.3)• % of Revenue 31.2% 27.5% 28.6% 26.8% 28.3% 29.8% 27.0% 27.0% 26.2% 27.4% 29.6% 26.8% 26.8% 26.0% 27.2% 29.5% 26.7% 26.7% 25.9% 27.1% 27.0% 26.9% 26.8% 26.6%
Restructuring and Other Reorganization-Related (0.3) (0.6) (1.4) (1.6) (3.9) (0.8) (0.2) 0.2 0.0 (0.8) 0.0 0.0 0.0 0.0 0.0 0.0 0.0 0.0 0.0 0.0 0.0 0.0 0.0 0.0
Long-Lived Asset Impairment and Other Charges 0.0 0.0 0.0 0.0 0.0 0.0 0.0 0.0 0.0 0.0 0.0 0.0 0.0 0.0 0.0 0.0 0.0 0.0 0.0 0.0 0.0 0.0 0.0 0.0
Total Operating Expenses (1,396.4) (1,434.5) (1,453.2) (1,681.3) (5,965.4) (1,520.1) (1,566.7) (1,553.3) (1,707.3) (6,347.4) (1,534.8) (1,573.7) (1,582.3) (1,725.0) (6,415.8) (1,606.7) (1,641.9) (1,650.9) (1,794.6) (6,694.0) (6,989.0) (7,375.6) (7,790.7) (8,235.5)
Operating Income (59.4) 177.2 100.2 330.7 548.7 (45.3) 174.0 173.2 365.1 667.0 (27.4) 203.6 195.0 406.4 777.6 (11.4) 235.8 226.6 453.3 904.3 1,044.3 1,126.5 1,215.9 1,312.9• % of Revenue -4.4% 11.0% 6.5% 16.4% 8.4% -3.1% 10.0% 10.0% 17.6% 9.5% -1.8% 11.5% 11.0% 19.1% 10.8% -0.7% 12.6% 12.1% 20.2% 11.9% 13.0% 13.3% 13.5% 13.8%
Interest Expenses and Other Income
Net Interest Expense (26.1) (28.9) (27.9) (28.1) (111.0) (23.6) (23.4) (23.2) (23.6) (93.8) (22.3) (22.3) (22.3) (22.3) (89.3) (30.2) (30.2) (30.2) (30.2) (120.7) (112.1) (103.5) (94.9) (94.9)• Interest Expense (32.6) (35.0) (34.7) (37.4) (139.7) (31.9) (33.1) (32.9) (33.6) (131.5) (32.3) (32.3) (32.3) (32.3) (129.3) (30.2) (30.2) (30.2) (30.2) (120.7) (112.1) (103.5) (94.9) (94.9)• Interest Income 6.5 6.1 6.8 9.3 28.7 8.3 9.7 9.7 10.0 37.7 10.0 10.0 10.0 10.0 40.0 0.0 0.0 0.0 0.0 0.0 0.0 0.0 0.0 0.0
Other Income (Expense), Net 0.5 (2.1) (3.1) 17.6 12.9 (6.1) 5.3 137.1 0.0 136.3 0.0 0.0 0.0 0.0 0.0 0.0 0.0 0.0 0.0 0.0 0.0 0.0 0.0 0.0
Total (Expenses) and Other Income (25.6) (31.0) (31.0) (10.5) (98.1) (29.7) (18.1) 113.9 (23.6) 42.5 (22.3) (22.3) (22.3) (22.3) (89.3) (30.2) (30.2) (30.2) (30.2) (120.7) (112.1) (103.5) (94.9) (94.9)
Income Before Income Taxes (85.0) 146.2 69.2 320.2 450.6 (75.0) 155.9 287.1 341.4 709.4 (49.7) 181.3 172.6 384.0 688.2 (41.6) 205.6 196.4 423.1 783.5 932.2 1,023.1 1,121.0 1,218.1
Less: Facebook Gains 0.0 0.0 0.0 0.0 0.0 0.0 0.0 (132.2) 0.0 (132.2) ------ ------ ------ ------ ------ ------ ------ ------ ------ ------ ------ ------ ------ ------
Income Before Income Taxes Ex-Facebook (85.0) 146.2 69.2 320.2 450.6 (75.0) 155.9 154.9 341.4 577.2 (49.7) 181.3 172.6 384.0 688.2 (41.6) 205.6 196.4 423.1 783.5 932.2 1,023.1 1,121.0 1,218.1
Provision for Income Taxes Ex-Facebook 15.3 (63.3) (24.4) (98.9) (171.3) 21.5 (47.6) (65.6) (131.5) (223.2) 19.1 (69.8) (66.5) (147.8) (265.0) 16.0 (79.2) (64.8) (162.9) (290.9) (358.9) (393.9) (431.6) (469.0)• Effective Tax Rate 18.0% 43.3% 35.3% 30.9% 38.0% 28.7% 30.5% 42.3% 38.5% 38.7% 38.5% 38.5% 38.5% 38.5% 38.5% 38.5% 38.5% 33.0% 38.5% 37.1% 38.5% 38.5% 38.5% 38.5%
Income of Consolidated Companies (69.7) 82.9 44.8 221.3 279.3 (53.5) 108.3 89.3 210.0 486.3 (30.6) 111.5 106.2 236.2 423.3 (25.6) 126.4 131.6 260.2 492.7 573.3 629.2 689.4 749.1
Equity in Net Income of Unconsolidated Affiliates (0.6) 0.2 0.8 1.5 1.9 0.3 0.6 0.8 1.0 2.7 1.0 1.0 1.0 1.0 4.0 1.0 1.0 1.0 1.0 4.0 4.0 4.0 4.0 4.0
Net Income (70.3) 83.1 45.6 222.8 281.2 (53.2) 108.9 90.1 211.0 489.0 (29.6) 112.5 107.2 237.2 427.3 (24.6) 127.4 132.6 261.2 496.7 577.3 633.2 693.4 753.1
Net Income Attributable to Noncontrolling Interests 5.7 (0.6) (0.3) (24.9) (20.1) 8.0 (4.3) (6.5) (5.0) (7.8) (3.0) (3.0) (3.0) (3.0) (12.0) (3.0) (3.0) (3.0) (3.0) (12.0) (12.0) (12.0) (12.0) (12.0)
Net Income Attributable to IPG (64.6) 82.5 45.3 197.9 261.1 (45.2) 104.6 83.6 206.0 481.2 (32.6) 109.5 104.2 234.2 415.3 (27.6) 124.4 129.6 258.2 484.7 565.3 621.2 681.4 741.1
Dividends on Preferred Stock (6.9) (2.9) (2.9) (2.9) (15.6) (2.9) (2.9) (2.9) (2.9) (11.6) (2.9) (2.9) (2.9) (2.9) (11.6) (2.9) (2.9) (2.9) (2.9) (11.6) (11.6) (11.6) (11.6) (11.6)
Benefit from Preferred Stock Repurchased 0.0 25.7 0.0 0.0 25.7 0.0 0.0 0.0 0.0 0.0 0.0 0.0 0.0 0.0 0.0 0.0 0.0 0.0 0.0 0.0 0.0 0.0 0.0 0.0
Allocation to Participating Securities 0.0 0.0 0.0 0.0 0.0 0.0 0.0 0.0 0.0 0.0 0.0 0.0 0.0 0.0 0.0 0.0 0.0 0.0 0.0 0.0 0.0 0.0 0.0 0.0
Net Income Available to IPG Common Stockholders -
Basic Ex-Facebook
(71.5) 105.3 42.4 195.0 271.2 (48.1) 101.7 80.7 203.1 469.6 (35.5) 106.6 101.3 231.3 403.7 (30.5) 121.5 126.7 255.3 473.1 553.7 609.6 669.8 729.5
Earrnings Per Share Available to IPG Common Stockholders
Basic, Ex-Facebook (0.15) 0.22 0.09 0.41 0.57 (0.10) 0.21 0.17 0.44 0.73 (0.08) 0.23 0.22 0.50 0.88 (0.07) 0.26 0.27 0.55 1.03 1.20 1.32 1.45 1.58
Diluted, Ex-Facebook (0.15) 0.15 0.08 0.36 0.44 (0.10) 0.19 0.16 0.37 0.62 (0.08) 0.20 0.19 0.43 0.74 (0.07) 0.23 0.24 0.47 0.87 1.03 1.13 1.23 1.34
Weighted Average Number of Common Shares Outstanding
Basic 471.3 473.0 474.7 475.4 473.6 476.0 473.1 464.7 462.7 469.1 462.2 461.7 461.2 460.7 461.5 461.5 461.5 461.5 461.5 461.5 461.5 461.5 461.5 461.5
Diluted, As Reported 471.3 544.9 533.6 553.1 542.1 476.0 546.9 537.6 549.5 545.0 462.2 535.0 534.0 540.0 537.0 461.5 535.0 534.0 540.0 537.0 539.0 541.0 543.0 545.0
Dividends Declared Per Common Share 0.00 0.00 0.00 0.00 0.00 0.06 0.06 0.06 0.06 0.24 0.08 0.08 0.08 0.08 0.30 0.09 0.09 0.09 0.09 0.36 0.40 0.44 0.50 0.55
Payout Ratio ------ ------ ------ ------ ------ -59.4% 27.9% 34.6% 13.7% 33.0% -97.7% 32.5% 34.2% 14.9% 34.3% -136.2% 34.2% 32.8% 16.3% 35.1% 33.3% 33.3% 34.4% 34.8%
(a) Includes effect of incorporating estimates for reclassification of taxes assessed by governmental authorities directly imposed on revenue producing transactions from gross to net basis for periods prior to 1Q10 (reported figures subsequent to this period account for the change)
Note: Excludes $5mm of discontinued operations in 2006
Key Metrics
EBIT (59.4) 177.2 100.2 330.7 548.7 (45.3) 174.0 173.2 365.1 667.0 (27.4) 203.6 195.0 406.4 777.6 (11.4) 235.8 226.6 453.3 904.3 1,044.3 1,126.5 1,215.9 1,312.9• EBIT Margin -4.4% 11.0% 6.5% 16.4% 8.4% -3.1% 10.0% 10.0% 17.6% 9.5% -1.8% 11.5% 11.0% 19.1% 10.8% -0.7% 12.6% 12.1% 20.2% 11.9% 13.0% 13.3% 13.5% 13.8%
Amortization 17.6 16.9 15.7 15.0 65.0 20.1 18.0 16.6 17.3 71.8 17.5 17.5 17.5 17.5 70.0 17.5 17.5 17.5 17.5 70.0 70.0 70.0 70.0 70.0
EBITA (41.8) 194.1 115.9 345.7 613.7 (25.3) 192.0 189.8 382.3 738.8 (9.9) 221.1 212.5 423.9 847.6 6.1 253.3 244.1 470.8 974.3 1,114.3 1,196.5 1,285.9 1,382.9• EBITA Margin -3.1% 12.0% 7.5% 17.2% 9.4% -1.7% 11.0% 11.0% 18.4% 10.5% -0.7% 12.4% 12.0% 19.9% 11.8% 0.4% 13.5% 13.0% 20.9% 12.8% 13.9% 14.1% 14.3% 14.5%
Depreciation 32.6 32.0 32.5 32.1 129.0 29.4 31.5 30.0 29.8 120.5 33.8 33.8 33.8 33.8 135.0 36.3 36.3 36.3 36.3 145.0 155.0 165.0 175.0 185.0
EBITDA (9.3) 226.0 148.3 377.7 742.7 4.1 223.4 219.7 412.1 859.3 23.9 254.9 246.2 457.6 982.6 42.3 289.5 280.4 507.1 1,119.3 1,199.3 1,291.5 1,390.9 1,497.9• EBITDA Margin -0.7% 14.0% 9.5% 18.8% 11.4% 0.3% 12.8% 12.7% 19.9% 12.3% 1.6% 14.3% 13.9% 21.5% 13.7% 2.7% 15.4% 14.9% 22.6% 14.7% 14.9% 15.2% 15.4% 15.7%
Source: Pivotal Research
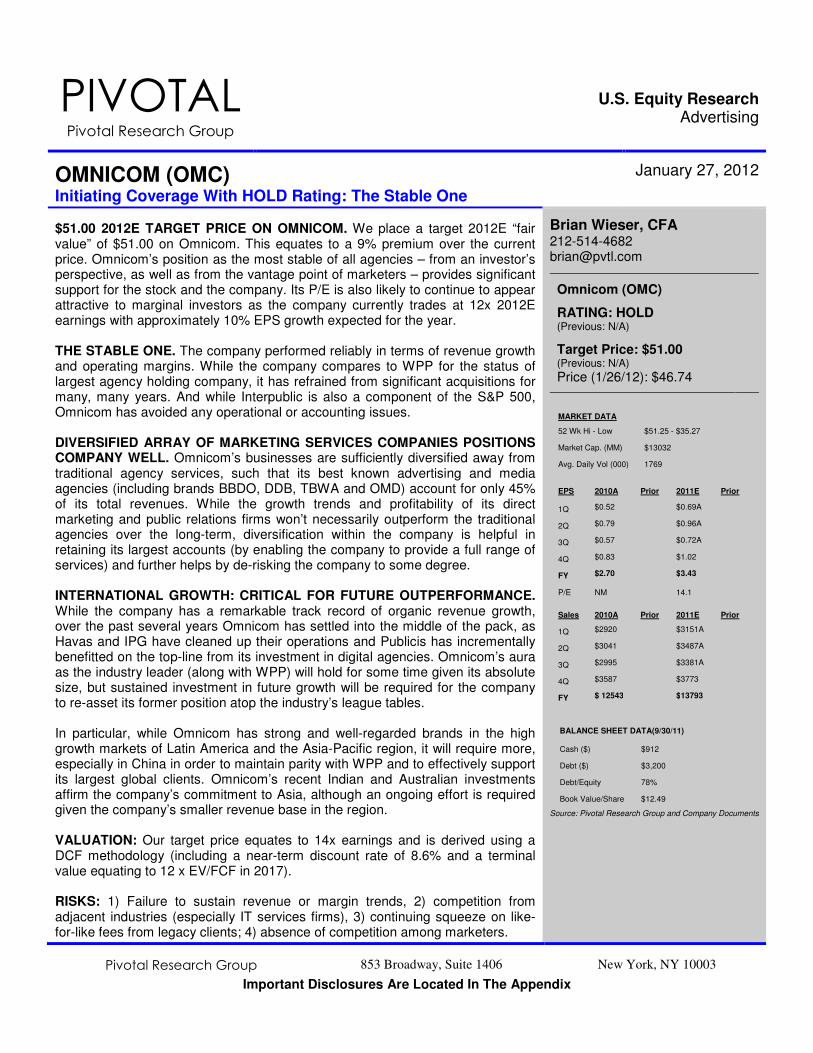
Pivotal Research Group 853 Broadway, Suite 1406 New York, NY 10003
Important Disclosures Are Located In The Appendix
PIVOTAL Pivotal Research Group
U.S. Equity Research Advertising
OMNICOM (OMC) Initiating Coverage With HOLD Rating: The Stable One
January 27, 2012
$51.00 2012E TARGET PRICE ON OMNICOM. We place a target 2012E “fair value” of $51.00 on Omnicom. This equates to a 9% premium over the current price. Omnicom’s position as the most stable of all agencies – from an investor’s perspective, as well as from the vantage point of marketers – provides significant support for the stock and the company. Its P/E is also likely to continue to appear attractive to marginal investors as the company currently trades at 12x 2012E earnings with approximately 10% EPS growth expected for the year. THE STABLE ONE. The company performed reliably in terms of revenue growth and operating margins. While the company compares to WPP for the status of largest agency holding company, it has refrained from significant acquisitions for many, many years. And while Interpublic is also a component of the S&P 500, Omnicom has avoided any operational or accounting issues. DIVERSIFIED ARRAY OF MARKETING SERVICES COMPANIES POSITIONS COMPANY WELL. Omnicom’s businesses are sufficiently diversified away from traditional agency services, such that its best known advertising and media agencies (including brands BBDO, DDB, TBWA and OMD) account for only 45% of its total revenues. While the growth trends and profitability of its direct marketing and public relations firms won’t necessarily outperform the traditional agencies over the long-term, diversification within the company is helpful in retaining its largest accounts (by enabling the company to provide a full range of services) and further helps by de-risking the company to some degree. INTERNATIONAL GROWTH: CRITICAL FOR FUTURE OUTPERFORMANCE. While the company has a remarkable track record of organic revenue growth, over the past several years Omnicom has settled into the middle of the pack, as Havas and IPG have cleaned up their operations and Publicis has incrementally benefitted on the top-line from its investment in digital agencies. Omnicom’s aura as the industry leader (along with WPP) will hold for some time given its absolute size, but sustained investment in future growth will be required for the company to re-asset its former position atop the industry’s league tables. In particular, while Omnicom has strong and well-regarded brands in the high growth markets of Latin America and the Asia-Pacific region, it will require more, especially in China in order to maintain parity with WPP and to effectively support its largest global clients. Omnicom’s recent Indian and Australian investments affirm the company’s commitment to Asia, although an ongoing effort is required given the company’s smaller revenue base in the region. VALUATION: Our target price equates to 14x earnings and is derived using a DCF methodology (including a near-term discount rate of 8.6% and a terminal value equating to 12 x EV/FCF in 2017). RISKS: 1) Failure to sustain revenue or margin trends, 2) competition from adjacent industries (especially IT services firms), 3) continuing squeeze on like-for-like fees from legacy clients; 4) absence of competition among marketers.
Brian Wieser, CFA 212-514-4682 [email protected]
Omnicom (OMC)
RATING: HOLD (Previous: N/A)
Target Price: $51.00 (Previous: N/A)
Price (1/26/12): $46.74
MARKET DATA
52 Wk Hi - Low $51.25 - $35.27
Market Cap. (MM) $13032
Avg. Daily Vol (000) 1769
EPS 2010A Prior 2011E Prior
1Q $0.52 $0.69A
2Q $0.79 $0.96A
3Q $0.57 $0.72A
4Q $0.83 $1.02
FY $2.70 $3.43
P/E NM 14.1
Sales 2010A Prior 2011E Prior
1Q $2920 $3151A
2Q $3041 $3487A
3Q $2995 $3381A
4Q $3587 $3773
FY $ 12543 $13793
BALANCE SHEET DATA(9/30/11)
Cash ($) $912
Debt ($) $3,200
Debt/Equity 78%
Book Value/Share $12.49
Source: Pivotal Research Group and Company Documents
- 43 - Brian Wieser 212-514-4682 Pivotal Research Group
RISKS Investors will also need to consider the following among the company’s and industry’s risks: FAILURE TO MEET REVENUE OR MARGIN EXPECTATIONS. Client losses or the failure to improve operations could lead to shortfalls of revenue or margin expectations. SQUEEZING FEES. Marketers are typically squeezing their agencies for operational efficiencies on an ongoing basis. Agencies have historically proven resilient in finding cost saving opportunities to perform like-for-like services. However at some point such efforts may no longer yield incremental benefits, and as long as agencies operate in a competitive manner they will suffer. In a similar light, high margin services offered today are typically likely to become standard-margin services in the future, as the more a service becomes standardized, the more that marketers’ procurement teams seek to standardize processes and drive agency margin out of the activity. COMPETITION FROM ADJACENT INDUSTRIES. We remain skeptical that today’s digital media companies such as Google or Microsoft will ever actively compete with agencies. This should hold not least because digital media companies will want to retain their margins (significantly higher than those for agency services) but also because clients generally want some perceived independence from advisors making marketing budget recommendations. However, agencies are increasingly placed up against today’s IT services firm in providing some services today. This type competition is more likely to increase in the future, although not across all marketing-related disciplines. Companies such as Accenture and IBM are increasingly positioning parts of their businesses adjacent to agencies as they seek to build platforms which can manage the execution of media campaigns, monitor the impact of those campaigns and integrate those efforts with an array of marketing data within a company’s ERP (enterprise resource planning) system. Sapient’s business lines represent the strongest balance between these functions today, although their impact on the broader industry has not yet been significant. Further, media suppliers (such as Hearst and Meredith) and software developers (such as Adobe) have also established competitive positions in some fields previously reserved for agencies, such as in search engine marketing. Given the extremely long selling cycles and the duration of agency-marketer contracts (usually several years in length) as well as the operational considerations for marketers in changing their own processes, no upstart can transform the agency industry overnight. The bigger issue is whether or not agencies are able to sufficiently adapt their own offerings in the time they have before a new service becomes a standard expectation. REDUCED COMPETITION BETWEEN MARKETERS. We have previously identified that advertising spending – and marketing in general – is primarily driven by the competitive intensity that is present within a given category. To the extent that industries evolve to feature reduced levels of competitive intensity, marketing services would generally suffer.
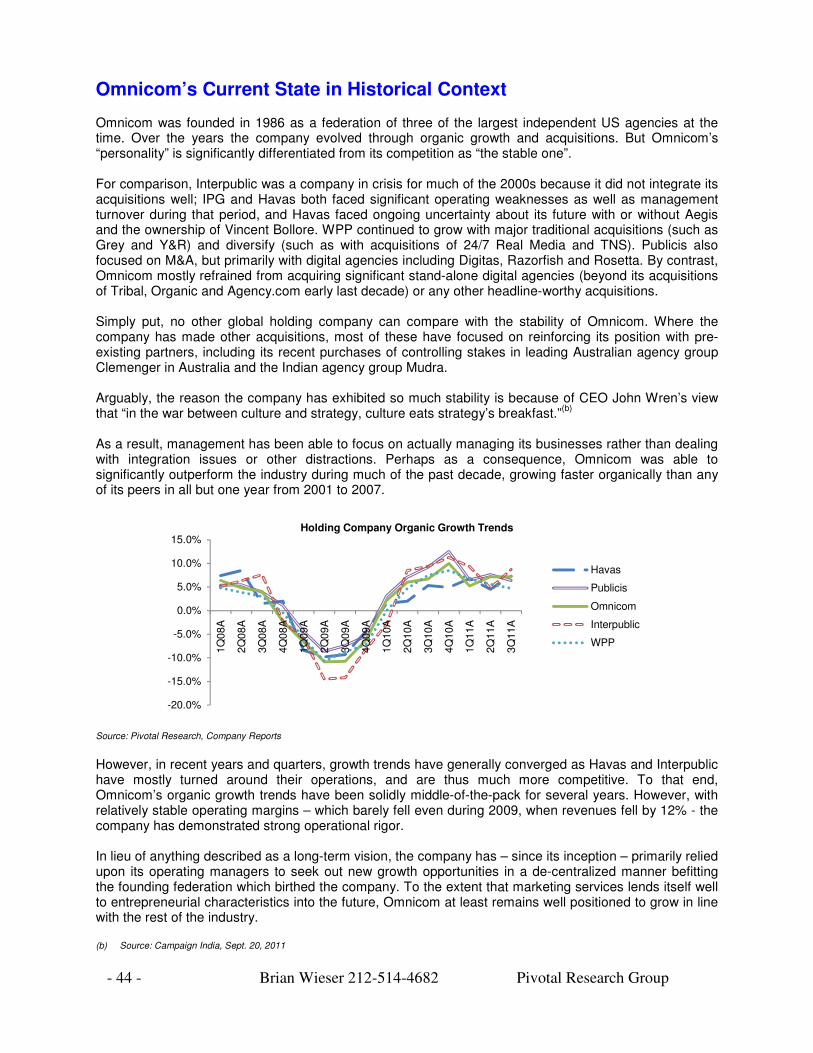
- 44 - Brian Wieser 212-514-4682 Pivotal Research Group
Omnicom’s Current State in Historical Context
Omnicom was founded in 1986 as a federation of three of the largest independent US agencies at the time. Over the years the company evolved through organic growth and acquisitions. But Omnicom’s “personality” is significantly differentiated from its competition as “the stable one”. For comparison, Interpublic was a company in crisis for much of the 2000s because it did not integrate its acquisitions well; IPG and Havas both faced significant operating weaknesses as well as management turnover during that period, and Havas faced ongoing uncertainty about its future with or without Aegis and the ownership of Vincent Bollore. WPP continued to grow with major traditional acquisitions (such as Grey and Y&R) and diversify (such as with acquisitions of 24/7 Real Media and TNS). Publicis also focused on M&A, but primarily with digital agencies including Digitas, Razorfish and Rosetta. By contrast, Omnicom mostly refrained from acquiring significant stand-alone digital agencies (beyond its acquisitions of Tribal, Organic and Agency.com early last decade) or any other headline-worthy acquisitions. Simply put, no other global holding company can compare with the stability of Omnicom. Where the company has made other acquisitions, most of these have focused on reinforcing its position with pre-existing partners, including its recent purchases of controlling stakes in leading Australian agency group Clemenger in Australia and the Indian agency group Mudra. Arguably, the reason the company has exhibited so much stability is because of CEO John Wren’s view that “in the war between culture and strategy, culture eats strategy’s breakfast.”
(b)
As a result, management has been able to focus on actually managing its businesses rather than dealing with integration issues or other distractions. Perhaps as a consequence, Omnicom was able to significantly outperform the industry during much of the past decade, growing faster organically than any of its peers in all but one year from 2001 to 2007.
-20.0%
-15.0%
-10.0%
-5.0%
0.0%
5.0%
10.0%
15.0%
1Q
08A
2Q
08A
3Q
08A
4Q
08A
1Q
09A
2Q
09A
3Q
09A
4Q
09A
1Q
10A
2Q
10A
3Q
10A
4Q
10A
1Q
11A
2Q
11A
3Q
11A
Havas
Publicis
Omnicom
Interpublic
WPP
Holding Company Organic Growth Trends
Source: Pivotal Research, Company Reports However, in recent years and quarters, growth trends have generally converged as Havas and Interpublic have mostly turned around their operations, and are thus much more competitive. To that end, Omnicom’s organic growth trends have been solidly middle-of-the-pack for several years. However, with relatively stable operating margins – which barely fell even during 2009, when revenues fell by 12% - the company has demonstrated strong operational rigor. In lieu of anything described as a long-term vision, the company has – since its inception – primarily relied upon its operating managers to seek out new growth opportunities in a de-centralized manner befitting the founding federation which birthed the company. To the extent that marketing services lends itself well to entrepreneurial characteristics into the future, Omnicom at least remains well positioned to grow in line with the rest of the industry. (b) Source: Campaign India, Sept. 20, 2011
- 45 - Brian Wieser 212-514-4682 Pivotal Research Group
Omnicom’s Distinct Attributes / Valuation Considerations While Omnicom is best known for its global creative agency networks DDB, BBDO, TBWA and its global media agencies OMD and PHD, Omnicom actually generates more than half of its revenue attributed to “below-the-line” marketing. Its public relations companies, which include Fleishman-Hillard, Ketchum and Porter Novelli are each among the world’s largest (and collectively comprise the biggest collection of PR agencies in one holding company) and represent about 10% of the company’s revenues. Two of its legacy CRM agencies, Rapp and Proximity, are also world-beaters, also accounting for about 10% of the company’s revenues. Combined with an array of smaller cross-functional marketing agencies, Omnicom’s diversified revenue mix should be favorable over the long-term, especially as larger, more mature marketers the holding companies tend to serve extend their outsourced marketing activities beyond traditional creative and media services. To that end, Omnicom is a relatively balanced play on marketing services within the countries they operate, and its growth rates and multiples have generally reflected this. To grow faster than the industry, Omnicom will need to push harder into faster-growing markets, if not faster-growing business lines. While international exposure (nearly half of revenues come from abroad with only 20% from continental Europe) is favorable compared to other S&P 500 component stocks, by the benchmark of its best comparable agency holding company, WPP, Omnicom appears relatively provincial. For example, Omnicom generates only around 10% of its revenues, by our estimates, from the entire Asia Pacific region, with less than 2% of its revenues coming from China. This compares unfavorably with WPP, which generates 16% of its revenues from APAC and more than 5% of revenues from China alone. These levels are also below Interpublic’s, which should generate 11% of revenues from APAC in 2011. As a result, Omnicom’s recent acquisition of a controlling stake in the Indian agency Mudra was important in ensuring a strong foothold in that market. As the Asia region outside of Australia and Japan should grow by 15% per annum (in constant currency terms) through 2016, per Magna Global, deep exposure to those markets will be essential if the company is to return to outperforming the industry. As the notion of making significant acquisitions is generally anathema to the company, organic growth is the most likely path forward. Omnicom is well positioned to grow in the region, especially as it wins more business from global multinationals based in its more mature markets. Further, its media agencies OMD and PHD are among the largest media agencies in China, and as they are among the leading global agencies (with OMD the world’s largest stand-alone media brand) bring world-class tools and processes to local marketers and multi-nationals alike. However, the process of becoming large enough to move the needle on the company’s top-line remains some time off given the company’s present position. Nonetheless, Omnicom is a bellwether for the sector. As goes marketing services, so will go OMC. Further, the company has demonstrated that it will find a way to the operating margin line within a fairly narrow range, regardless of the economic climate. But the biggest risk to the company may be one of perception, on a relative basis. For so many of the years that Omnicom was significantly outperforming the industry, two of its four major peers were not competing on an equal footing given internal distractions (at IPG and Havas). Its two other competitors expended significant managerial resources towards integrating acquisitions (at WPP and Publicis). Now that most of these issues are in the past, the industry is – effectively – more competitive at least by the benchmarks that Wall Street looks at (certainly in terms of the organic revenue growth and operating margins produced by Omnicom’s peers). To that end, Omnicom’s greatest threat is of merely looking “average” when in the past it has been seen as superior.
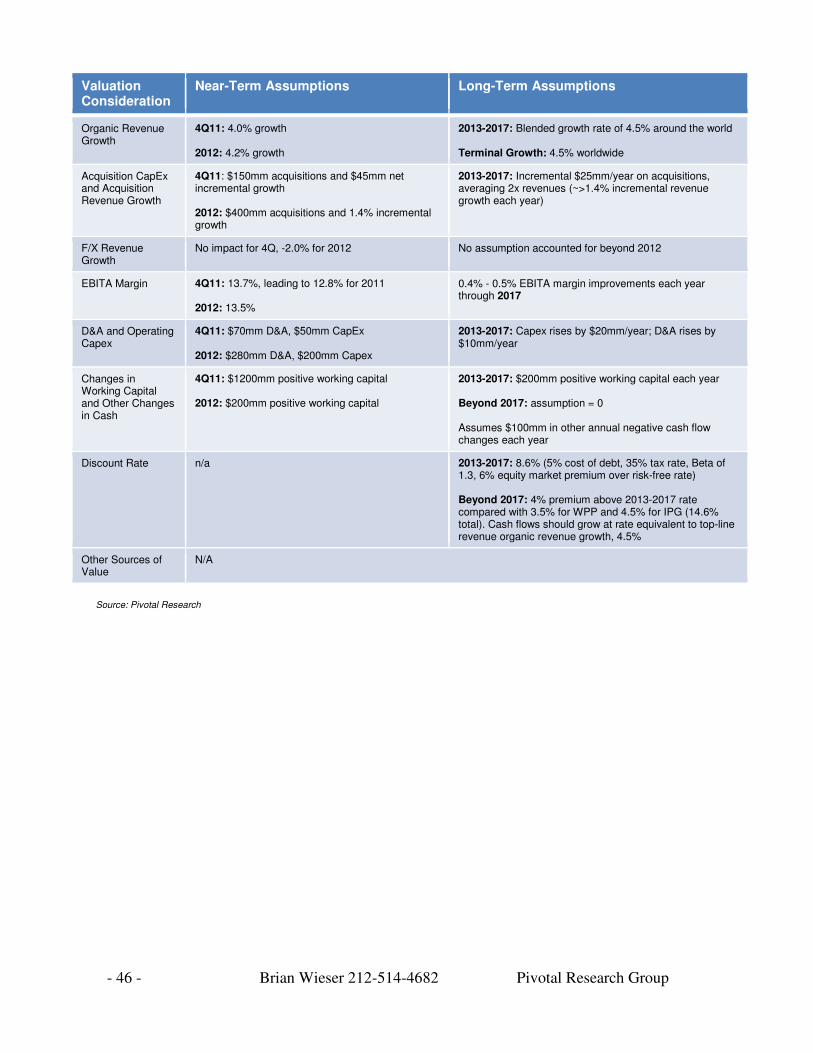
- 46 - Brian Wieser 212-514-4682 Pivotal Research Group
Valuation Consideration
Near-Term Assumptions Long-Term Assumptions
Organic Revenue Growth
4Q11: 4.0% growth 2012: 4.2% growth
2013-2017: Blended growth rate of 4.5% around the world Terminal Growth: 4.5% worldwide
Acquisition CapEx and Acquisition Revenue Growth
4Q11: $150mm acquisitions and $45mm net incremental growth 2012: $400mm acquisitions and 1.4% incremental growth
2013-2017: Incremental $25mm/year on acquisitions, averaging 2x revenues (~>1.4% incremental revenue growth each year)
F/X Revenue Growth
No impact for 4Q, -2.0% for 2012 No assumption accounted for beyond 2012
EBITA Margin 4Q11: 13.7%, leading to 12.8% for 2011 2012: 13.5%
0.4% - 0.5% EBITA margin improvements each year through 2017
D&A and Operating Capex
4Q11: $70mm D&A, $50mm CapEx 2012: $280mm D&A, $200mm Capex
2013-2017: Capex rises by $20mm/year; D&A rises by $10mm/year
Changes in Working Capital and Other Changes in Cash
4Q11: $1200mm positive working capital 2012: $200mm positive working capital
2013-2017: $200mm positive working capital each year Beyond 2017: assumption = 0 Assumes $100mm in other annual negative cash flow changes each year
Discount Rate n/a 2013-2017: 8.6% (5% cost of debt, 35% tax rate, Beta of 1.3, 6% equity market premium over risk-free rate) Beyond 2017: 4% premium above 2013-2017 rate compared with 3.5% for WPP and 4.5% for IPG (14.6% total). Cash flows should grow at rate equivalent to top-line revenue organic revenue growth, 4.5%
Other Sources of Value
N/A
Source: Pivotal Research
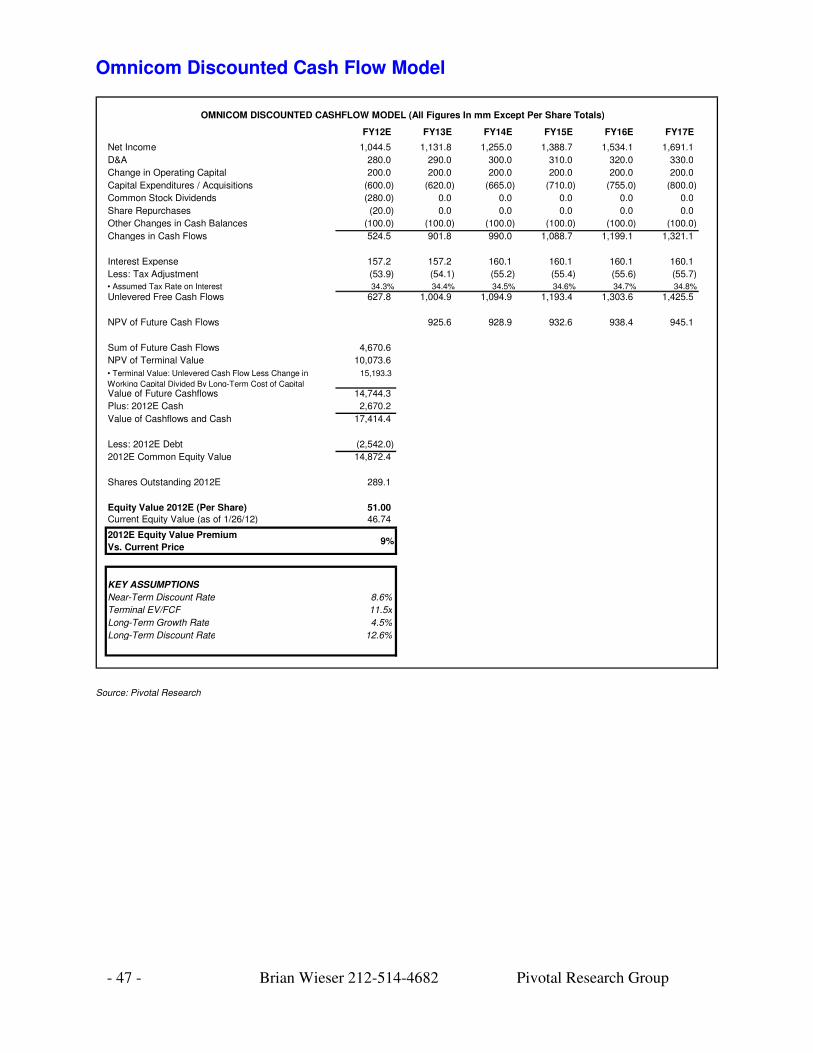
- 47 - Brian Wieser 212-514-4682 Pivotal Research Group
Omnicom Discounted Cash Flow Model
OMNICOM DISCOUNTED CASHFLOW MODEL (All Figures In mm Except Per Share Totals)
FY12E FY13E FY14E FY15E FY16E FY17E Year 1 1 2 3 4 5
Net Income 1,044.5 1,131.8 1,255.0 1,388.7 1,534.1 1,691.1
D&A 280.0 290.0 300.0 310.0 320.0 330.0
Change in Operating Capital 200.0 200.0 200.0 200.0 200.0 200.0
Capital Expenditures / Acquisitions (600.0) (620.0) (665.0) (710.0) (755.0) (800.0)
Common Stock Dividends (280.0) 0.0 0.0 0.0 0.0 0.0
Share Repurchases (20.0) 0.0 0.0 0.0 0.0 0.0
Other Changes in Cash Balances (100.0) (100.0) (100.0) (100.0) (100.0) (100.0)
Changes in Cash Flows 524.5 901.8 990.0 1,088.7 1,199.1 1,321.1
Interest Expense 157.2 157.2 160.1 160.1 160.1 160.1
Less: Tax Adjustment (53.9) (54.1) (55.2) (55.4) (55.6) (55.7)
• Assumed Tax Rate on Interest 34.3% 34.4% 34.5% 34.6% 34.7% 34.8%
Unlevered Free Cash Flows 627.8 1,004.9 1,094.9 1,193.4 1,303.6 1,425.5
NPV of Future Cash Flows 925.6 928.9 932.6 938.4 945.1
Sum of Future Cash Flows 4,670.6
NPV of Terminal Value 10,073.6
• Terminal Value: Unlevered Cash Flow Less Change in
Working Capital Divided By Long-Term Cost of Capital
15,193.3
Value of Future Cashflows 14,744.3
Plus: 2012E Cash 2,670.2
Value of Cashflows and Cash 17,414.4
Less: 2012E Debt (2,542.0)
2012E Common Equity Value 14,872.4
Shares Outstanding 2012E 289.1
Equity Value 2012E (Per Share) 51.00
Current Equity Value (as of 1/26/12) 46.74
2012E Equity Value Premium
Vs. Current Price9%
KEY ASSUMPTIONS
Near-Term Discount Rate 8.6%
Terminal EV/FCF 11.5x
Long-Term Growth Rate 4.5%
Long-Term Discount Rate 12.6%
Source: Pivotal Research
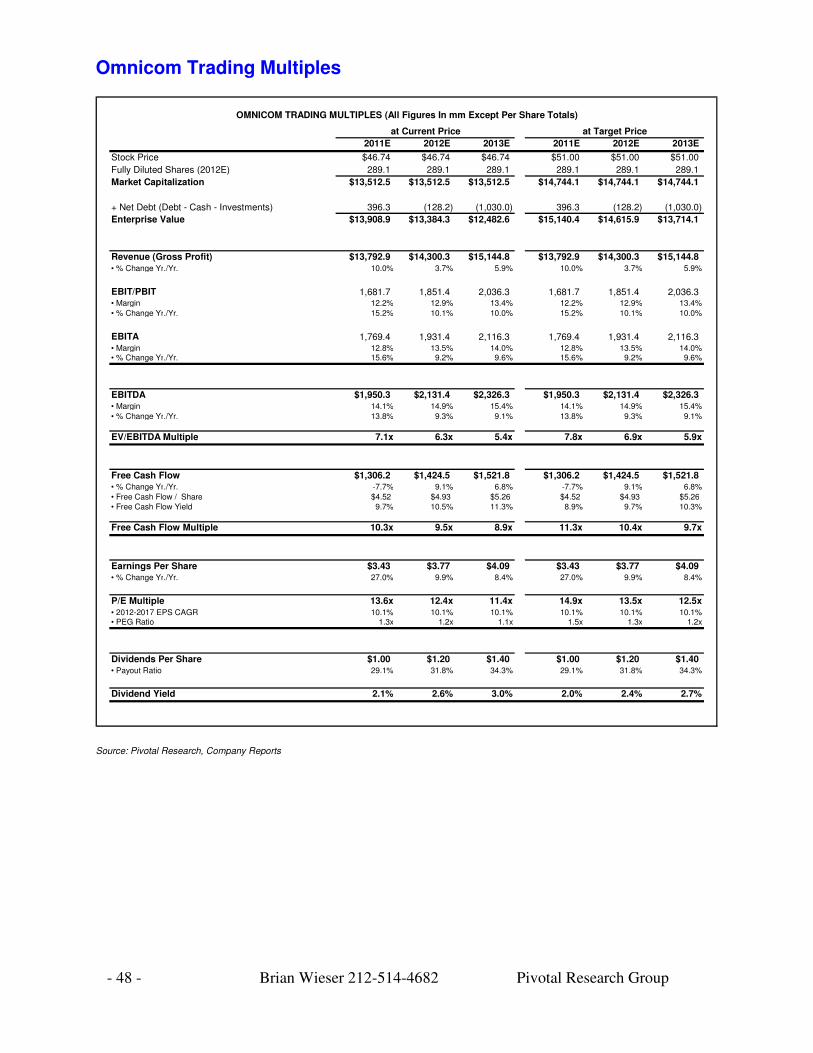
- 48 - Brian Wieser 212-514-4682 Pivotal Research Group
Omnicom Trading Multiples
OMNICOM TRADING MULTIPLES (All Figures In mm Except Per Share Totals)
at Current Price at Target Price
2011E 2012E 2013E 2011E 2012E 2013E
Stock Price $46.74 $46.74 $46.74 $51.00 $51.00 $51.00
Fully Diluted Shares (2012E) 289.1 289.1 289.1 289.1 289.1 289.1
Market Capitalization $13,512.5 $13,512.5 $13,512.5 $14,744.1 $14,744.1 $14,744.1
+ Net Debt (Debt - Cash - Investments) 396.3 (128.2) (1,030.0) 396.3 (128.2) (1,030.0)
Enterprise Value $13,908.9 $13,384.3 $12,482.6 $15,140.4 $14,615.9 $13,714.1
Revenue (Gross Profit) $13,792.9 $14,300.3 $15,144.8 $13,792.9 $14,300.3 $15,144.8• % Change Yr./Yr. 10.0% 3.7% 5.9% 10.0% 3.7% 5.9%
EBIT/PBIT 1,681.7 1,851.4 2,036.3 1,681.7 1,851.4 2,036.3• Margin 12.2% 12.9% 13.4% 12.2% 12.9% 13.4%
• % Change Yr./Yr. 15.2% 10.1% 10.0% 15.2% 10.1% 10.0%
EBITA 1,769.4 1,931.4 2,116.3 1,769.4 1,931.4 2,116.3• Margin 12.8% 13.5% 14.0% 12.8% 13.5% 14.0%• % Change Yr./Yr. 15.6% 9.2% 9.6% 15.6% 9.2% 9.6%
EBITDA $1,950.3 $2,131.4 $2,326.3 $1,950.3 $2,131.4 $2,326.3• Margin 14.1% 14.9% 15.4% 14.1% 14.9% 15.4%
• % Change Yr./Yr. 13.8% 9.3% 9.1% 13.8% 9.3% 9.1%
EV/EBITDA Multiple 7.1x 6.3x 5.4x 7.8x 6.9x 5.9x
Free Cash Flow $1,306.2 $1,424.5 $1,521.8 $1,306.2 $1,424.5 $1,521.8• % Change Yr./Yr. -7.7% 9.1% 6.8% -7.7% 9.1% 6.8%
• Free Cash Flow / Share $4.52 $4.93 $5.26 $4.52 $4.93 $5.26• Free Cash Flow Yield 9.7% 10.5% 11.3% 8.9% 9.7% 10.3%
Free Cash Flow Multiple 10.3x 9.5x 8.9x 11.3x 10.4x 9.7x
Earnings Per Share $3.43 $3.77 $4.09 $3.43 $3.77 $4.09• % Change Yr./Yr. 27.0% 9.9% 8.4% 27.0% 9.9% 8.4%
P/E Multiple 13.6x 12.4x 11.4x 14.9x 13.5x 12.5x• 2012-2017 EPS CAGR 10.1% 10.1% 10.1% 10.1% 10.1% 10.1%• PEG Ratio 1.3x 1.2x 1.1x 1.5x 1.3x 1.2x
Dividends Per Share $1.00 $1.20 $1.40 $1.00 $1.20 $1.40• Payout Ratio 29.1% 31.8% 34.3% 29.1% 31.8% 34.3%
Dividend Yield 2.1% 2.6% 3.0% 2.0% 2.4% 2.7%
Source: Pivotal Research, Company Reports
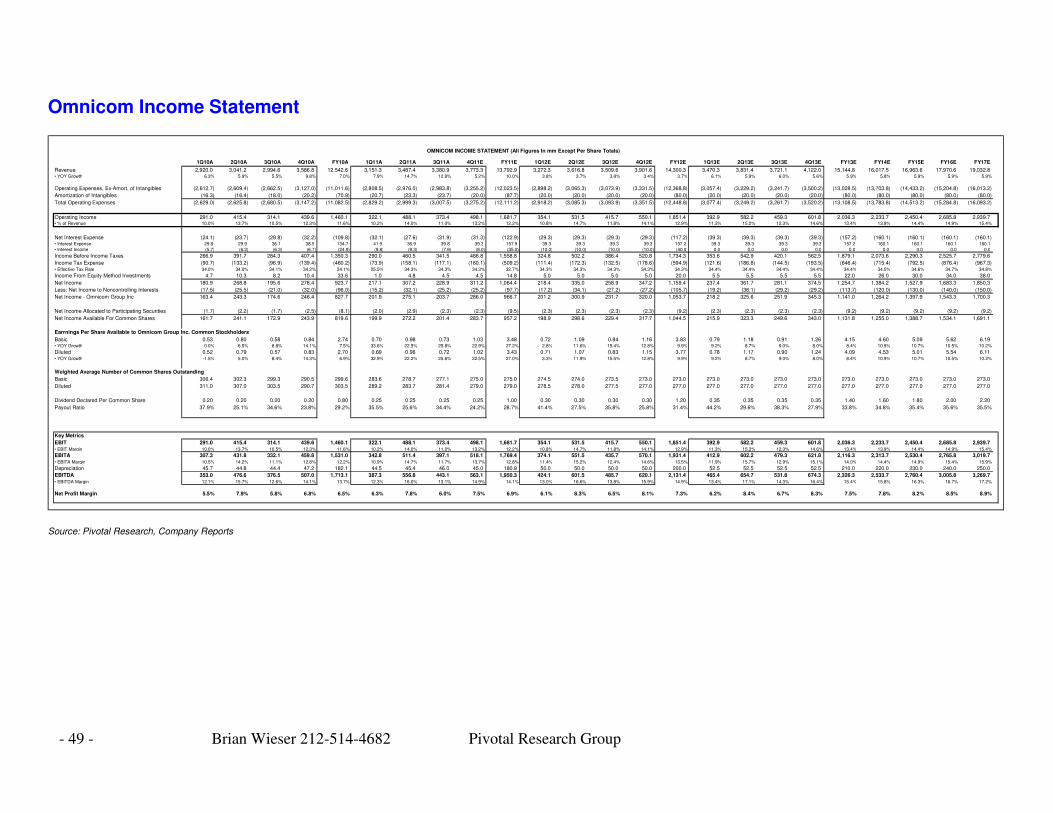
- 49 - Brian Wieser 212-514-4682 Pivotal Research Group
Omnicom Income Statement
OMNICOM INCOME STATEMENT (All Figures In mm Except Per Share Totals)
1Q10A 2Q10A 3Q10A 4Q10A FY10A 1Q11A 2Q11A 3Q11A 4Q11E FY11E 1Q12E 2Q12E 3Q12E 4Q12E FY12E 1Q13E 2Q13E 3Q13E 4Q13E FY13E FY14E FY15E FY16E FY17E
Revenue 2,920.0 3,041.2 2,994.6 3,586.8 12,542.6 3,151.3 3,487.4 3,380.9 3,773.3 13,792.9 3,272.3 3,616.8 3,509.6 3,901.6 14,300.3 3,470.3 3,831.4 3,721.1 4,122.0 15,144.8 16,017.5 16,963.6 17,970.6 19,032.8• YOY Growth 6.3% 5.9% 5.5% 9.8% 7.0% 7.9% 14.7% 12.9% 5.2% 10.0% 3.8% 3.7% 3.8% 3.4% 3.7% 6.1% 5.9% 6.0% 5.6% 5.9% 5.8% 5.9% 5.9% 5.9%
Operating Expenses, Ex-Amort. of Intangibles (2,612.7) (2,609.4) (2,662.5) (3,127.0) (11,011.6) (2,808.5) (2,976.0) (2,983.8) (3,255.2) (12,023.5) (2,898.2) (3,065.3) (3,073.9) (3,331.5) (12,368.8) (3,057.4) (3,229.2) (3,241.7) (3,500.2) (13,028.5) (13,703.8) (14,433.2) (15,204.8) (16,013.2)
Amortization of Intangibles (16.3) (16.4) (18.0) (20.2) (70.9) (20.7) (23.3) (23.7) (20.0) (87.7) (20.0) (20.0) (20.0) (20.0) (80.0) (20.0) (20.0) (20.0) (20.0) (80.0) (80.0) (80.0) (80.0) (80.0)
Total Operating Expenses (2,629.0) (2,625.8) (2,680.5) (3,147.2) (11,082.5) (2,829.2) (2,999.3) (3,007.5) (3,275.2) (12,111.2) (2,918.2) (3,085.3) (3,093.9) (3,351.5) (12,448.8) (3,077.4) (3,249.2) (3,261.7) (3,520.2) (13,108.5) (13,783.8) (14,513.2) (15,284.8) (16,093.2)
Operating Income 291.0 415.4 314.1 439.6 1,460.1 322.1 488.1 373.4 498.1 1,681.7 354.1 531.5 415.7 550.1 1,851.4 392.9 582.2 459.3 601.8 2,036.3 2,233.7 2,450.4 2,685.8 2,939.7• % of Revenue 10.0% 13.7% 10.5% 12.3% 11.6% 10.2% 14.0% 11.0% 13.2% 12.2% 10.8% 14.7% 11.8% 14.1% 12.9% 11.3% 15.2% 12.3% 14.6% 13.4% 13.9% 14.4% 14.9% 15.4%
Net Interest Expense (24.1) (23.7) (29.8) (32.2) (109.8) (32.1) (27.6) (31.9) (31.3) (122.9) (29.3) (29.3) (29.3) (29.3) (117.2) (39.3) (39.3) (39.3) (39.3) (157.2) (160.1) (160.1) (160.1) (160.1)• Interest Expense 29.8 29.9 36.1 38.9 134.7 41.9 36.9 39.8 39.3 157.9 39.3 39.3 39.3 39.3 157.2 39.3 39.3 39.3 39.3 157.2 160.1 160.1 160.1 160.1
• Interest Income (5.7) (6.2) (6.3) (6.7) (24.9) (9.8) (9.3) (7.9) (8.0) (35.0) (10.0) (10.0) (10.0) (10.0) (40.0) 0.0 0.0 0.0 0.0 0.0 0.0 0.0 0.0 0.0
Income Before Income Taxes 266.9 391.7 284.3 407.4 1,350.3 290.0 460.5 341.5 466.8 1,558.8 324.8 502.2 386.4 520.8 1,734.3 353.6 542.9 420.1 562.5 1,879.1 2,073.6 2,290.3 2,525.7 2,779.6
Income Tax Expense (90.7) (133.2) (96.9) (139.4) (460.2) (73.9) (158.1) (117.1) (160.1) (509.2) (111.4) (172.3) (132.5) (178.6) (594.9) (121.6) (186.8) (144.5) (193.5) (646.4) (715.4) (792.5) (876.4) (967.3)• Effective Tax Rate 34.0% 34.0% 34.1% 34.2% 34.1% 25.5% 34.3% 34.3% 34.3% 32.7% 34.3% 34.3% 34.3% 34.3% 34.3% 34.4% 34.4% 34.4% 34.4% 34.4% 34.5% 34.6% 34.7% 34.8%
Income From Equity Method Investments 4.7 10.3 8.2 10.4 33.6 1.0 4.8 4.5 4.5 14.8 5.0 5.0 5.0 5.0 20.0 5.5 5.5 5.5 5.5 22.0 26.0 30.0 34.0 38.0
Net Income 180.9 268.8 195.6 278.4 923.7 217.1 307.2 228.9 311.2 1,064.4 218.4 335.0 258.9 347.2 1,159.4 237.4 361.7 281.1 374.5 1,254.7 1,384.2 1,527.9 1,683.3 1,850.3
Less: Net Income to Noncontrolling Interests (17.5) (25.5) (21.0) (32.0) (96.0) (15.2) (32.1) (25.2) (25.2) (97.7) (17.2) (34.1) (27.2) (27.2) (105.7) (19.2) (36.1) (29.2) (29.2) (113.7) (120.0) (130.0) (140.0) (150.0)
Net Income - Omnicom Group Inc 163.4 243.3 174.6 246.4 827.7 201.9 275.1 203.7 286.0 966.7 201.2 300.9 231.7 320.0 1,053.7 218.2 325.6 251.9 345.3 1,141.0 1,264.2 1,397.9 1,543.3 1,700.3
Net Income Allocated to Participating Securities (1.7) (2.2) (1.7) (2.5) (8.1) (2.0) (2.9) (2.3) (2.3) (9.5) (2.3) (2.3) (2.3) (2.3) (9.2) (2.3) (2.3) (2.3) (2.3) (9.2) (9.2) (9.2) (9.2) (9.2)
Net Income Available For Common Shares 161.7 241.1 172.9 243.9 819.6 199.9 272.2 201.4 283.7 957.2 198.9 298.6 229.4 317.7 1,044.5 215.9 323.3 249.6 343.0 1,131.8 1,255.0 1,388.7 1,534.1 1,691.1
Earrnings Per Share Available to Omnicom Group Inc. Common Stockholders
Basic 0.53 0.80 0.58 0.84 2.74 0.70 0.98 0.73 1.03 3.48 0.72 1.09 0.84 1.16 3.83 0.79 1.18 0.91 1.26 4.15 4.60 5.09 5.62 6.19• YOY Growth 0.0% 6.5% 8.8% 14.1% 7.5% 33.6% 22.5% 25.8% 22.9% 27.2% 2.8% 11.6% 15.4% 12.8% 9.9% 9.2% 8.7% 9.0% 8.0% 8.4% 10.9% 10.7% 10.5% 10.2%
Diluted 0.52 0.79 0.57 0.83 2.70 0.69 0.96 0.72 1.02 3.43 0.71 1.07 0.83 1.15 3.77 0.78 1.17 0.90 1.24 4.09 4.53 5.01 5.54 6.11• YOY Growth -1.5% 5.0% 8.4% 14.3% 6.9% 32.9% 22.2% 25.6% 22.5% 27.0% 3.3% 11.9% 15.5% 12.8% 9.9% 9.2% 8.7% 9.0% 8.0% 8.4% 10.9% 10.7% 10.5% 10.2%
Weighted Average Number of Common Shares Outstanding
Basic 306.4 302.3 299.3 290.5 299.6 283.6 278.7 277.1 275.0 275.0 274.5 274.0 273.5 273.0 273.0 273.0 273.0 273.0 273.0 273.0 273.0 273.0 273.0 273.0
Diluted 311.0 307.0 303.5 290.7 303.5 289.2 283.7 281.4 279.0 279.0 278.5 278.0 277.5 277.0 277.0 277.0 277.0 277.0 277.0 277.0 277.0 277.0 277.0 277.0
Dividend Declared Per Common Share 0.20 0.20 0.20 0.20 0.80 0.25 0.25 0.25 0.25 1.00 0.30 0.30 0.30 0.30 1.20 0.35 0.35 0.35 0.35 1.40 1.60 1.80 2.00 2.20
Payout Ratio 37.9% 25.1% 34.6% 23.8% 29.2% 35.5% 25.6% 34.4% 24.2% 28.7% 41.4% 27.5% 35.8% 25.8% 31.4% 44.2% 29.6% 38.3% 27.9% 33.8% 34.8% 35.4% 35.6% 35.5%
Key Metrics
EBIT 291.0 415.4 314.1 439.6 1,460.1 322.1 488.1 373.4 498.1 1,681.7 354.1 531.5 415.7 550.1 1,851.4 392.9 582.2 459.3 601.8 2,036.3 2,233.7 2,450.4 2,685.8 2,939.7• EBIT Margin 10.0% 13.7% 10.5% 12.3% 11.6% 10.2% 14.0% 11.0% 13.2% 12.2% 10.8% 14.7% 11.8% 14.1% 12.9% 11.3% 15.2% 12.3% 14.6% 13.4% 13.9% 14.4% 14.9% 15.4%
EBITA 307.3 431.8 332.1 459.8 1,531.0 342.8 511.4 397.1 518.1 1,769.4 374.1 551.5 435.7 570.1 1,931.4 412.9 602.2 479.3 621.8 2,116.3 2,313.7 2,530.4 2,765.8 3,019.7• EBITA Margin 10.5% 14.2% 11.1% 12.8% 12.2% 10.9% 14.7% 11.7% 13.7% 12.8% 11.4% 15.2% 12.4% 14.6% 13.5% 11.9% 15.7% 12.9% 15.1% 14.0% 14.4% 14.9% 15.4% 15.9%
Depreciation 45.7 44.8 44.4 47.2 182.1 44.5 45.4 46.0 45.0 180.9 50.0 50.0 50.0 50.0 200.0 52.5 52.5 52.5 52.5 210.0 220.0 230.0 240.0 250.0
EBITDA 353.0 476.6 376.5 507.0 1,713.1 387.3 556.8 443.1 563.1 1,950.3 424.1 601.5 485.7 620.1 2,131.4 465.4 654.7 531.8 674.3 2,326.3 2,533.7 2,760.4 3,005.8 3,269.7• EBITDA Margin 12.1% 15.7% 12.6% 14.1% 13.7% 12.3% 16.0% 13.1% 14.9% 14.1% 13.0% 16.6% 13.8% 15.9% 14.9% 13.4% 17.1% 14.3% 16.4% 15.4% 15.8% 16.3% 16.7% 17.2%
Net Profit Margin 5.5% 7.9% 5.8% 6.8% 6.5% 6.3% 7.8% 6.0% 7.5% 6.9% 6.1% 8.3% 6.5% 8.1% 7.3% 6.2% 8.4% 6.7% 8.3% 7.5% 7.8% 8.2% 8.5% 8.9%
Source: Pivotal Research, Company Reports
- 50 - Brian Wieser 212-514-4682 Pivotal Research Group
Public Companies Mentioned (1/26/12) Accenture (ACN, N/R $56.92) Adobe (ADBE, N/R, $31.18) Aegis (AGS.L, N/R, 160.0p) CBS (CBS, N/R, $28.72) Dentsu (4324:Tokyo, N/R, ¥2,493) Discovery (DISCA, N/R, $44.34) Disney (DIS, N/R, $39.35) Google (GOOG, N/R, $568.10) Hakuhodo (2433:Tokyo, N/R, ¥4620) Havas (HAV.PA, N/R, €3.55) IBM (IBM, N/R, $190.98) InBev (BUD, N/R, $61.89) Ipsos (IPS.PA, N/R, €24.76) General Motors (GM, N/R, $24.72) MDC (MDCA, N/R, $13.22) Meredith (MDP, N/R, $31.07) Microsoft (MSFT, N/R, $29.50) Sapient (SAPE, N/R, $13.20) Time Warner (TWX, N/R, $37.97) Viacom (VIAB, N/R, $48.01)
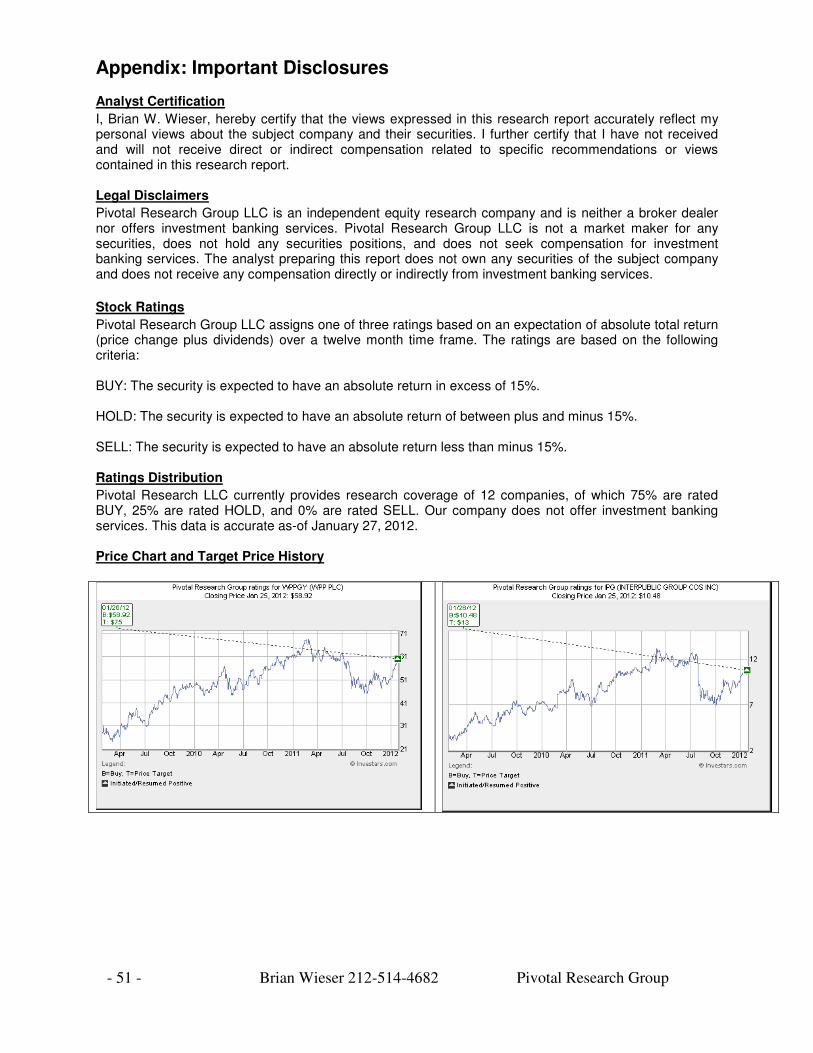
- 51 - Brian Wieser 212-514-4682 Pivotal Research Group
Appendix: Important Disclosures Analyst Certification
I, Brian W. Wieser, hereby certify that the views expressed in this research report accurately reflect my personal views about the subject company and their securities. I further certify that I have not received and will not receive direct or indirect compensation related to specific recommendations or views contained in this research report. Legal Disclaimers
Pivotal Research Group LLC is an independent equity research company and is neither a broker dealer nor offers investment banking services. Pivotal Research Group LLC is not a market maker for any securities, does not hold any securities positions, and does not seek compensation for investment banking services. The analyst preparing this report does not own any securities of the subject company and does not receive any compensation directly or indirectly from investment banking services.
Stock Ratings
Pivotal Research Group LLC assigns one of three ratings based on an expectation of absolute total return (price change plus dividends) over a twelve month time frame. The ratings are based on the following criteria: BUY: The security is expected to have an absolute return in excess of 15%. HOLD: The security is expected to have an absolute return of between plus and minus 15%. SELL: The security is expected to have an absolute return less than minus 15%. Ratings Distribution
Pivotal Research LLC currently provides research coverage of 12 companies, of which 75% are rated BUY, 25% are rated HOLD, and 0% are rated SELL. Our company does not offer investment banking services. This data is accurate as-of January 27, 2012. Price Chart and Target Price History
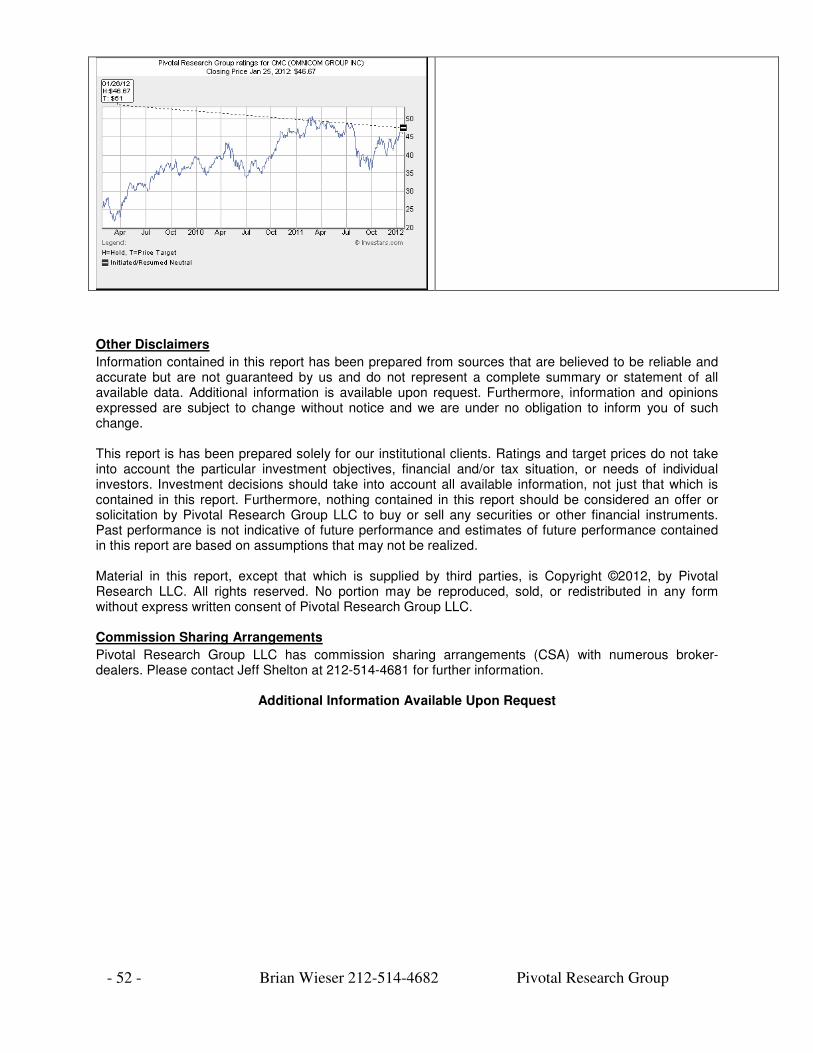
- 52 - Brian Wieser 212-514-4682 Pivotal Research Group
Other Disclaimers
Information contained in this report has been prepared from sources that are believed to be reliable and accurate but are not guaranteed by us and do not represent a complete summary or statement of all available data. Additional information is available upon request. Furthermore, information and opinions expressed are subject to change without notice and we are under no obligation to inform you of such change. This report is has been prepared solely for our institutional clients. Ratings and target prices do not take into account the particular investment objectives, financial and/or tax situation, or needs of individual investors. Investment decisions should take into account all available information, not just that which is contained in this report. Furthermore, nothing contained in this report should be considered an offer or solicitation by Pivotal Research Group LLC to buy or sell any securities or other financial instruments. Past performance is not indicative of future performance and estimates of future performance contained in this report are based on assumptions that may not be realized. Material in this report, except that which is supplied by third parties, is Copyright ©2012, by Pivotal Research LLC. All rights reserved. No portion may be reproduced, sold, or redistributed in any form without express written consent of Pivotal Research Group LLC. Commission Sharing Arrangements
Pivotal Research Group LLC has commission sharing arrangements (CSA) with numerous broker-dealers. Please contact Jeff Shelton at 212-514-4681 for further information.
Additional Information Available Upon Request