Embed Size (px)
Citation preview

PIRELLI FY 2013 RESULTS MILANO – MARCH 27, 2014
FY13 RESULTS 1
FY 2013 RESULTS
2013 TYRE OVERVIEW
APPENDIX
AGENDA
2014 OUTLOOK & TARGETS
KEY MESSAGES
FY13 RESULTS
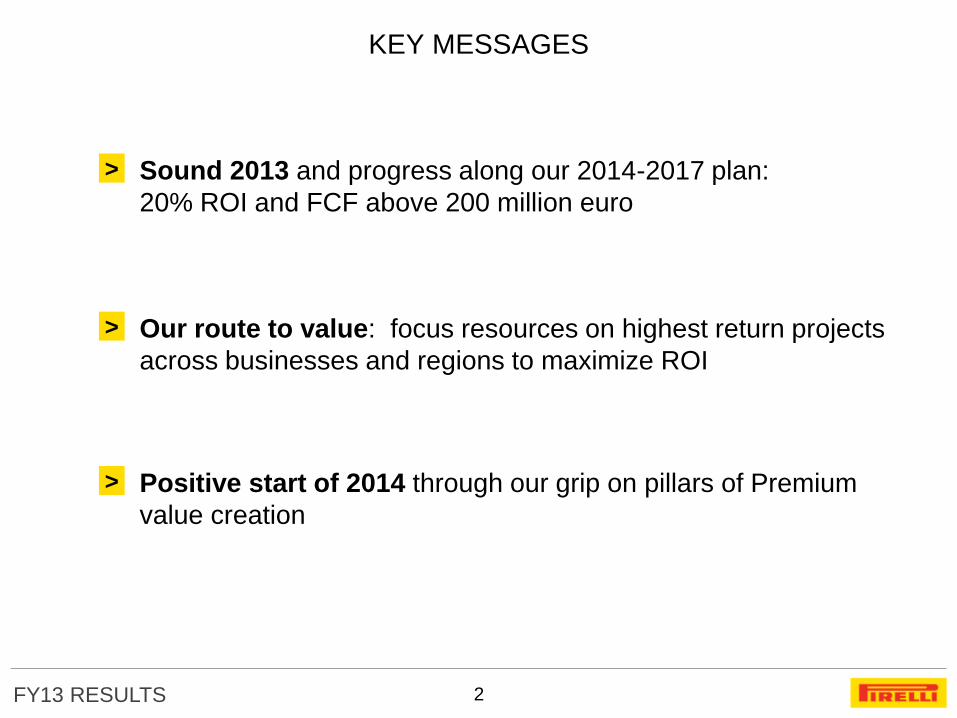
KEY MESSAGES
2
> Sound 2013 and progress along our 2014-2017 plan:
20% ROI and FCF above 200 million euro
> Our route to value: focus resources on highest return projects
across businesses and regions to maximize ROI
> Positive start of 2014 through our grip on pillars of Premium
value creation
FY13 RESULTS 3
FY 2013 RESULTS
2013 TYRE OVERVIEW
APPENDIX
AGENDA
2014 OUTLOOK & TARGETS
KEY MESSAGES
FY13 RESULTS
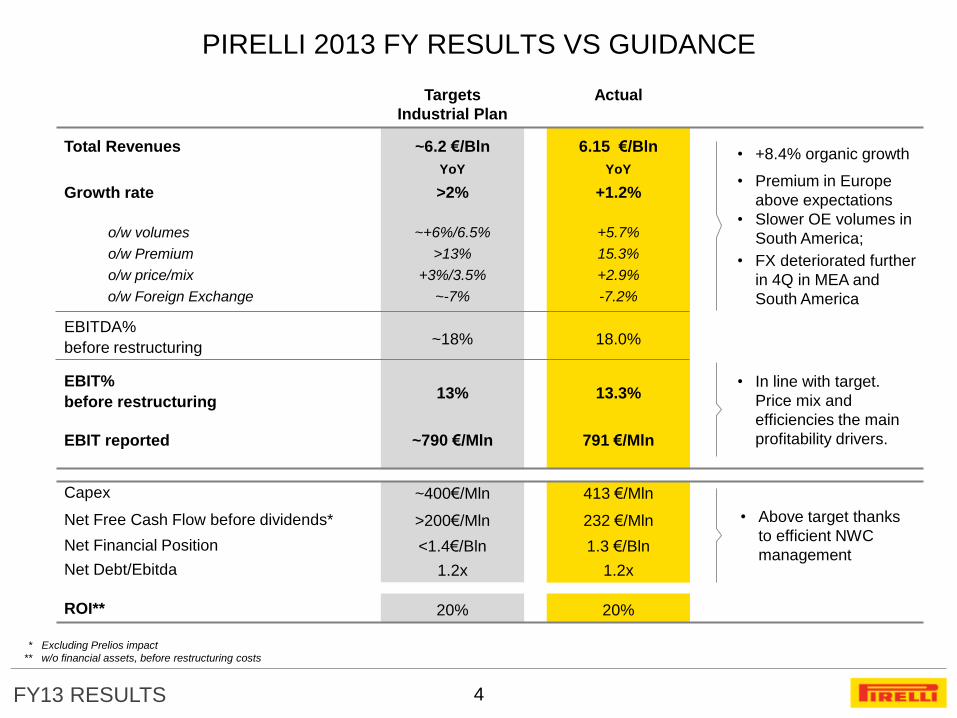
PIRELLI 2013 FY RESULTS VS GUIDANCE
4
Capex ~400€/Mln
Net Free Cash Flow before dividends* >200€/Mln
Net Financial Position <1.4€/Bln
Net Debt/Ebitda 1.2x
Total Revenues ~6.2 €/Bln
Growth rate
o/w volumes
o/w price/mix
EBITDA%
before restructuring
13%
~18%
o/w Premium >13%
~+6%/6.5%
+3%/3.5%
>2%
o/w Foreign Exchange ~-7%
EBIT%
before restructuring
YoY
413 €/Mln
232 €/Mln
1.3 €/Bln
1.2x
Targets
Industrial Plan
Actual
6.15 €/Bln
13.3%
18.0%
15.3%
+5.7%
+2.9%
+1.2%
-7.2%
YoY
~790 €/Mln EBIT reported 791 €/Mln
ROI** 20% 20%
* Excluding Prelios impact
** w/o financial assets, before restructuring costs
• In line with target.
Price mix and
efficiencies the main
profitability drivers.
• Above target thanks
to efficient NWC
management
• +8.4% organic growth
• Premium in Europe
above expectations
• Slower OE volumes in
South America;
• FX deteriorated further
in 4Q in MEA and
South America
FY13 RESULTS
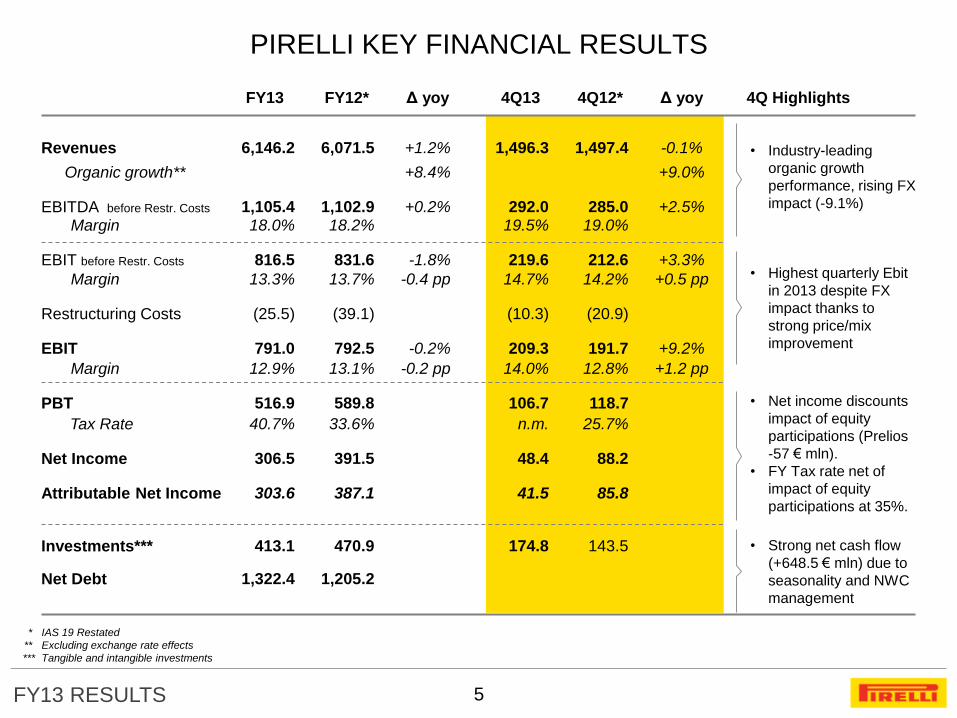
PIRELLI KEY FINANCIAL RESULTS
5
4Q Highlights
Net Debt
Restructuring Costs
PBT
Tax Rate
Net Income
Attributable Net Income
Organic growth**
Revenues
EBITDA before Restr. Costs
Margin
EBIT before Restr. Costs
Margin
EBIT
Margin
Δ yoy
387.1
+1.2%
+8.4%
+0.2%
-1.8%
-0.4 pp
-0.2%
-0.2 pp
Δ yoy
-0.1%
+9.0%
+2.5%
+3.3%
+0.5 pp
+9.2%
+1.2 pp
Investments***
FY13
1,322.4
(25.5)
516.9
40.7%
306.5
303.6
6,146.2
18.0% 1,105.4
816.5
13.3%
791.0
12.9%
413.1
4Q13
(10.3)
106.7
n.m.
48.4
41.5
1,496.3
19.5% 292.0
219.6
14.7%
209.3
14.0%
174.8
4Q12*
(20.9)
118.7
25.7%
88.2
85.8
1,497.4
19.0% 285.0
212.6
14.2%
191.7
12.8%
143.5
FY12*
1,205.2
(39.1)
589.8
33.6%
391.5
6,071.5
18.2% 1,102.9
831.6
13.7%
792.5
13.1%
470.9
• Industry-leading
organic growth
performance, rising FX
impact (-9.1%)
* IAS 19 Restated
** Excluding exchange rate effects
*** Tangible and intangible investments
• Highest quarterly Ebit
in 2013 despite FX
impact thanks to
strong price/mix
improvement
• Net income discounts
impact of equity
participations (Prelios
-57 € mln).
• FY Tax rate net of
impact of equity
participations at 35%.
• Strong net cash flow
(+648.5 € mln) due to
seasonality and NWC
management
FY13 RESULTS
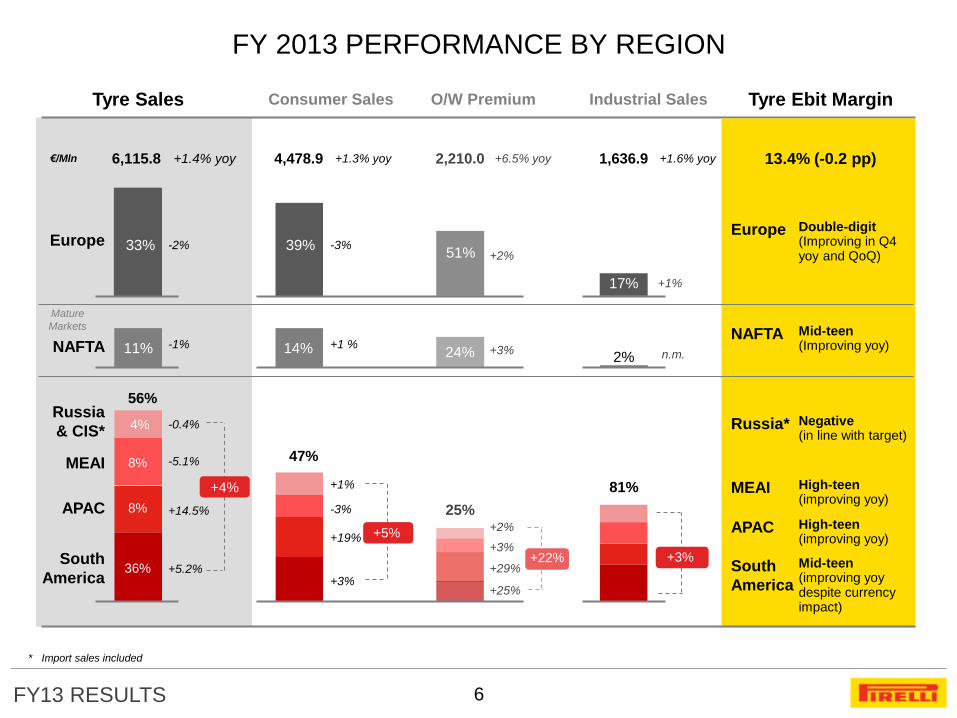
FY 2013 PERFORMANCE BY REGION
6
Tyre Sales Tyre Ebit Margin Consumer Sales O/W Premium Industrial Sales
6,115.8 +1.4% yoy €/Mln
Mature
Markets
33%
11% -1%
-2%
-0.4%
+5.2%
-5.1%
+14.5%
36%
8%
8%
4%
56%
13.4% (-0.2 pp)
High-teen (improving yoy)
High-teen (improving yoy)
Mid-teen (improving yoy despite currency impact)
Mid-teen (Improving yoy)
Double-digit (Improving in Q4 yoy and QoQ)
MEAI
APAC
South
America
Russia*
Europe
NAFTA
Negative (in line with target)
4,478.9 +1.3% yoy
47%
39%
14% +1 %
-3%
+1%
+3%
-3%
+19% +5%
2,210.0 +6.5% yoy
25% +2%
+25%
+3%
+29% +22%
+3%
51%
24%
+2%
1,636.9 +1.6% yoy
+1% 17%
2% n.m.
81%
+3%
* Import sales included
+4%
Europe
NAFTA
Russia
& CIS*
MEAI
APAC
South
America
FY13 RESULTS
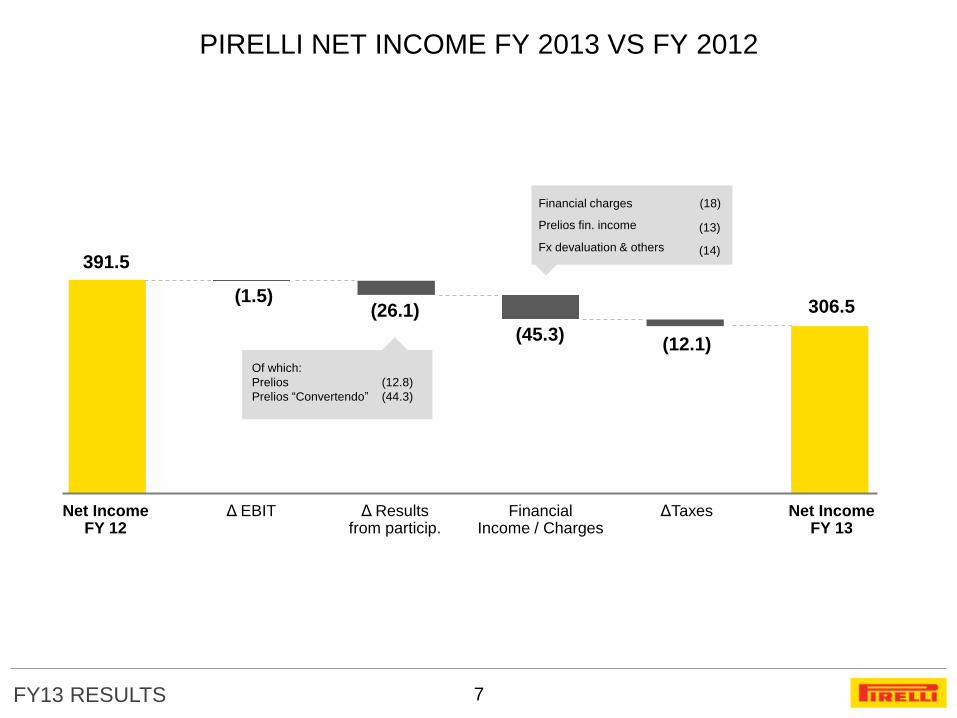
PIRELLI NET INCOME FY 2013 VS FY 2012
7
Net Income FY 13
Financial Income / Charges
Net Income FY 12
Δ EBIT Δ Results from particip.
ΔTaxes
391.5
Financial charges
(1.5) (26.1)
(45.3) (12.1)
306.5
Of which:
Prelios
Prelios “Convertendo”
(12.8)
(44.3)
(18)
Prelios fin. income (13)
Fx devaluation & others (14)
FY13 RESULTS
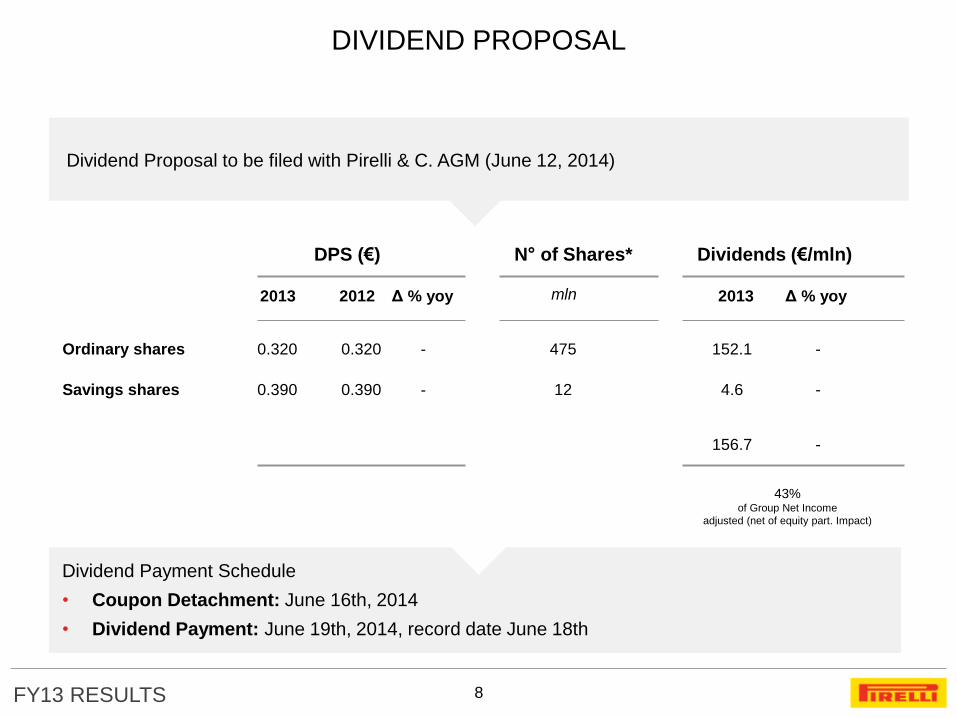
DIVIDEND PROPOSAL
8
Ordinary shares
Savings shares
0.320
12 4.6
152.1 475
43% of Group Net Income
adjusted (net of equity part. Impact)
156.7
0.390
DPS (€) N° of Shares* Dividends (€/mln)
2013 2012 mln 2013 Δ % yoy
-
0.320
0.390
Δ % yoy
-
- -
-
Dividend Proposal to be filed with Pirelli & C. AGM (June 12, 2014)
Dividend Payment Schedule
• Coupon Detachment: June 16th, 2014
• Dividend Payment: June 19th, 2014, record date June 18th
FY13 RESULTS
PIRELLI DEBT STRUCTURE AS OF DECEMBER 31, 2013
9
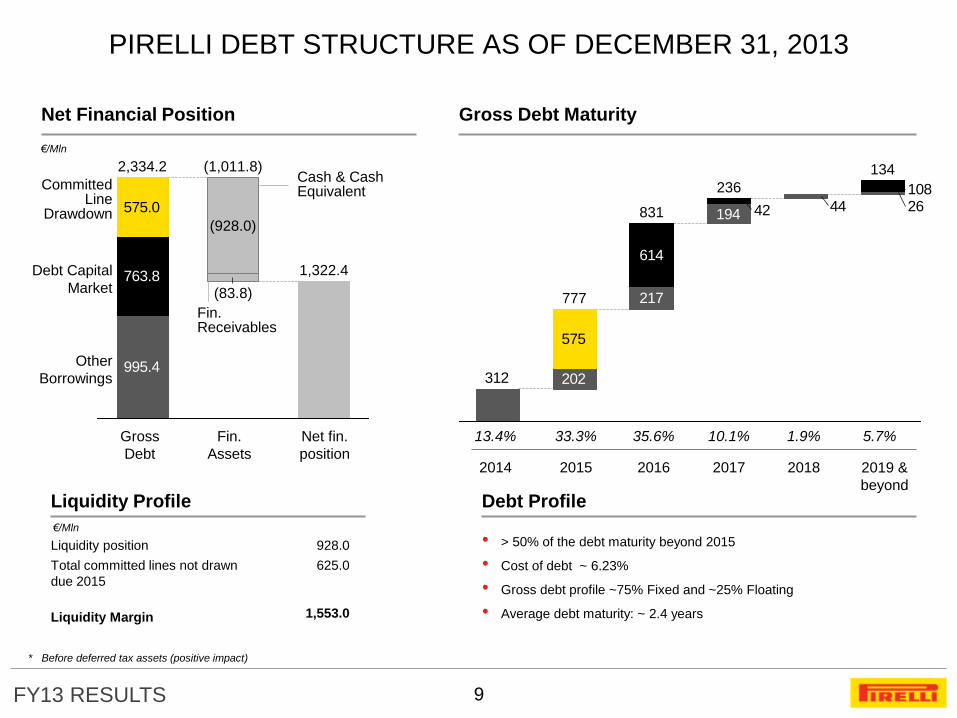
Net Financial Position
995.4
763.8
575.0
1,322.4
(1,011.8)
(83.8)
(928.0)
2,334.2
Committed Line
Drawdown
Other
Borrowings
Debt Capital
Market
575
2644
312
194
217
202
42
614
108
831
236
777
134
13.4% 33.3% Gross
Debt
Fin.
Assets
Net fin.
position
35.6% 10.1% 1.9%
Debt Profile
• > 50% of the debt maturity beyond 2015
• Cost of debt ~ 6.23%
• Gross debt profile ~75% Fixed and ~25% Floating
• Average debt maturity: ~ 2.4 years
Liquidity Profile
€/Mln
928.0
625.0
1,553.0
Gross Debt Maturity
2014 2015 2016 2017 2018 2019 &
beyond
Liquidity position
Total committed lines not drawn
due 2015
Liquidity Margin
Cash & Cash Equivalent
Fin. Receivables
* Before deferred tax assets (positive impact)
€/Mln
5.7%
FY13 RESULTS
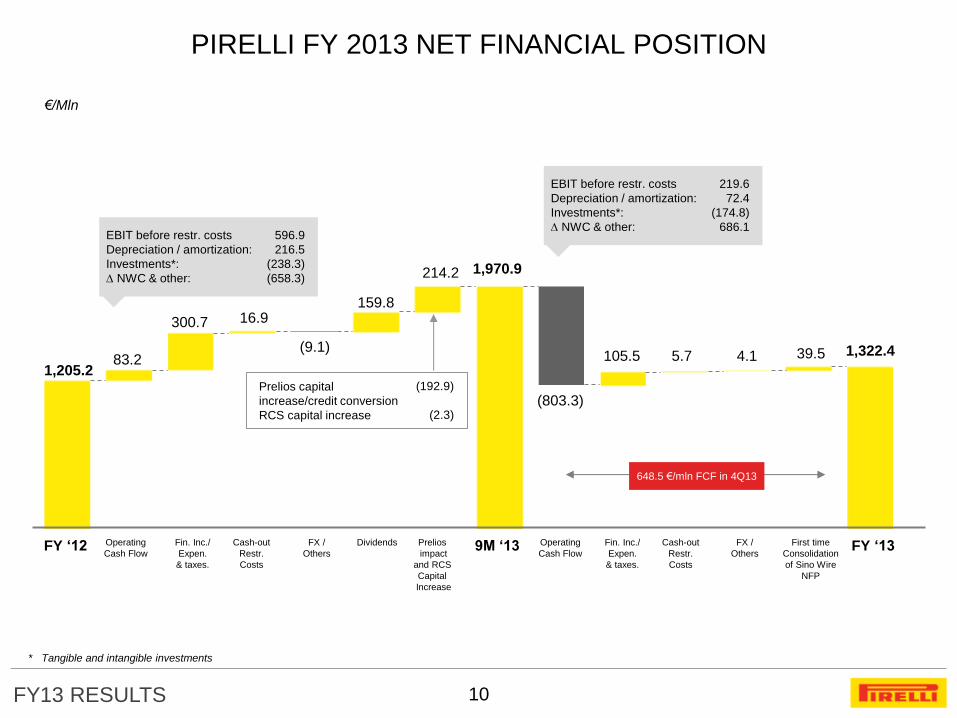
€/Mln
9M ‘13 FY ‘12 Operating
Cash Flow
Fin. Inc./
Expen.
& taxes.
Cash-out
Restr.
Costs
FX /
Others
Dividends Prelios
impact
and RCS
Capital
Increase
EBIT before restr. costs
Depreciation / amortization:
Investments*:
NWC & other:
596.9
216.5
(238.3)
(658.3)
EBIT before restr. costs
Depreciation / amortization:
Investments*:
NWC & other:
219.6
72.4
(174.8)
686.1
648.5 €/mln FCF in 4Q13
1,205.2 83.2
300.7 16.9
(9.1)
159.8
(803.3)
105.5
1,970.9
PIRELLI FY 2013 NET FINANCIAL POSITION
10
FY ‘13
214.2
1,322.4
Operating
Cash Flow
Fin. Inc./
Expen.
& taxes.
Cash-out
Restr.
Costs
FX /
Others
First time
Consolidation
of Sino Wire
NFP
5.7 4.1 39.5
* Tangible and intangible investments
Prelios capital
increase/credit conversion
RCS capital increase
(192.9)
(2.3)
FY13 RESULTS 11
FY 2013 RESULTS
2013 TYRE OVERVIEW
APPENDIX
AGENDA
2014 OUTLOOK & TARGETS
KEY MESSAGES
FY13 RESULTS
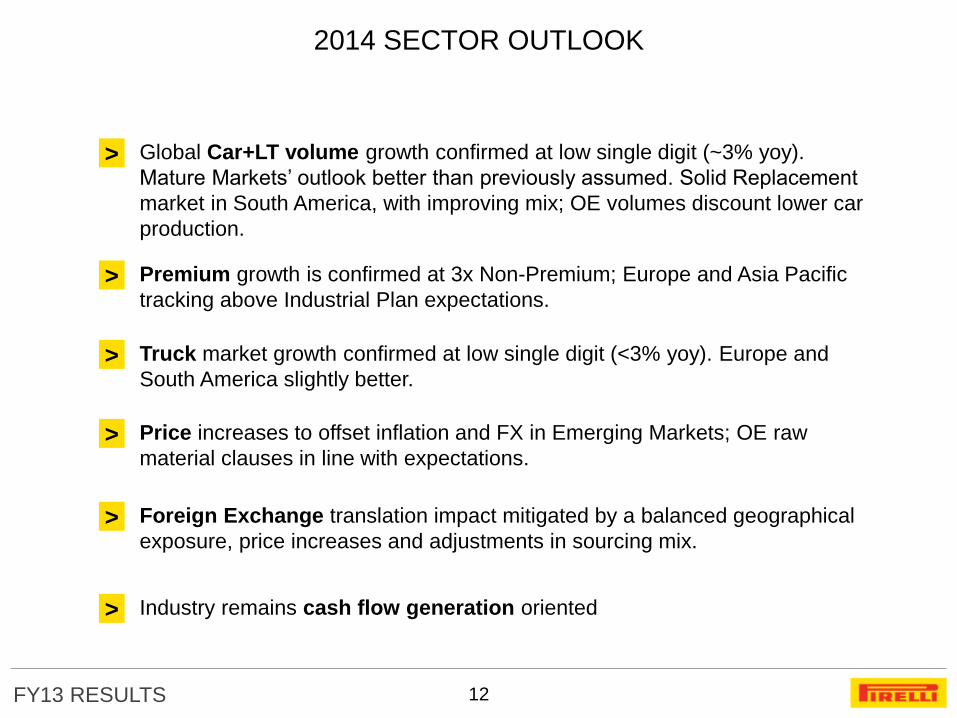
2014 SECTOR OUTLOOK
12
> Global Car+LT volume growth confirmed at low single digit (~3% yoy).
Mature Markets’ outlook better than previously assumed. Solid Replacement
market in South America, with improving mix; OE volumes discount lower car
production.
> Premium growth is confirmed at 3x Non-Premium; Europe and Asia Pacific
tracking above Industrial Plan expectations.
> Truck market growth confirmed at low single digit (<3% yoy). Europe and
South America slightly better.
> Price increases to offset inflation and FX in Emerging Markets; OE raw
material clauses in line with expectations.
> Foreign Exchange translation impact mitigated by a balanced geographical
exposure, price increases and adjustments in sourcing mix.
> Industry remains cash flow generation oriented
FY13 RESULTS
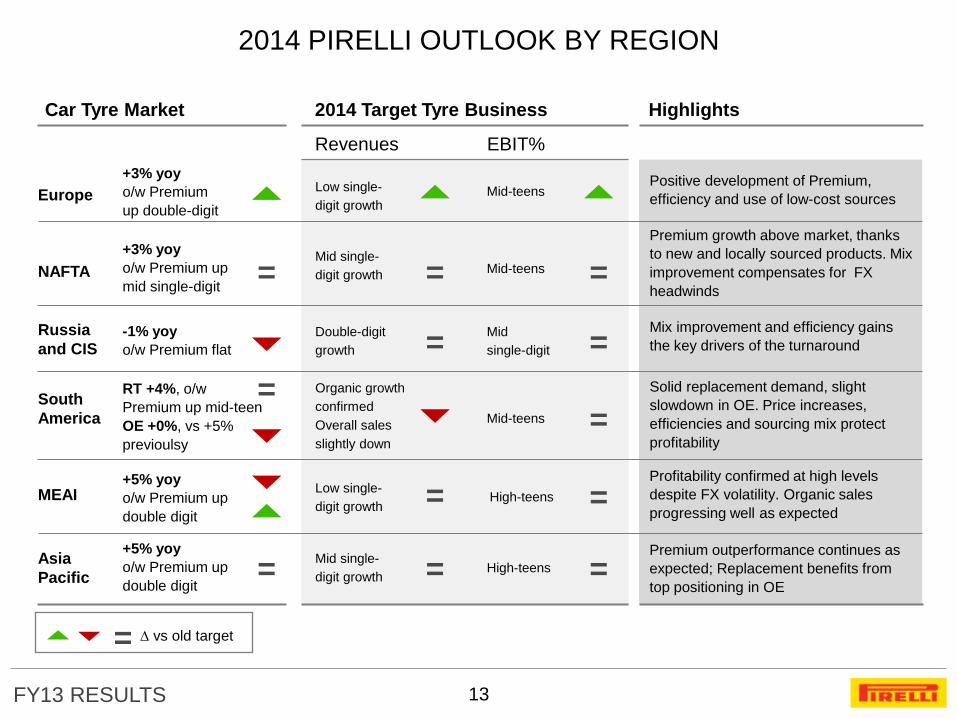
2014 PIRELLI OUTLOOK BY REGION
13
Europe
NAFTA
MEAI
Asia
Pacific
South
America
Russia
and CIS
Revenues EBIT%
Low single-
digit growth Mid-teens
Double-digit
growth
Mid
single-digit
Organic growth
confirmed
Overall sales
slightly down
Mid-teens
High-teens
High-teens Mid single-
digit growth
Highlights
Positive development of Premium,
efficiency and use of low-cost sources
2014 Target Tyre Business Highlights
+3% yoy
o/w Premium
up double-digit
= Mid single-
digit growth = +3% yoy
o/w Premium up
mid single-digit
Mid-teens =
Premium growth above market, thanks
to new and locally sourced products. Mix
improvement compensates for FX
headwinds
-1% yoy
o/w Premium flat = = Mix improvement and efficiency gains
the key drivers of the turnaround
RT +4%, o/w
Premium up mid-teen
OE +0%, vs +5%
previoulsy
= =
Solid replacement demand, slight
slowdown in OE. Price increases,
efficiencies and sourcing mix protect
profitability
+5% yoy
o/w Premium up
double digit
Low single-
digit growth =
+5% yoy
o/w Premium up
double digit = = =
= vs old target
Car Tyre Market
Profitability confirmed at high levels
despite FX volatility. Organic sales
progressing well as expected
Premium outperformance continues as
expected; Replacement benefits from
top positioning in OE
=
FY13 RESULTS 14
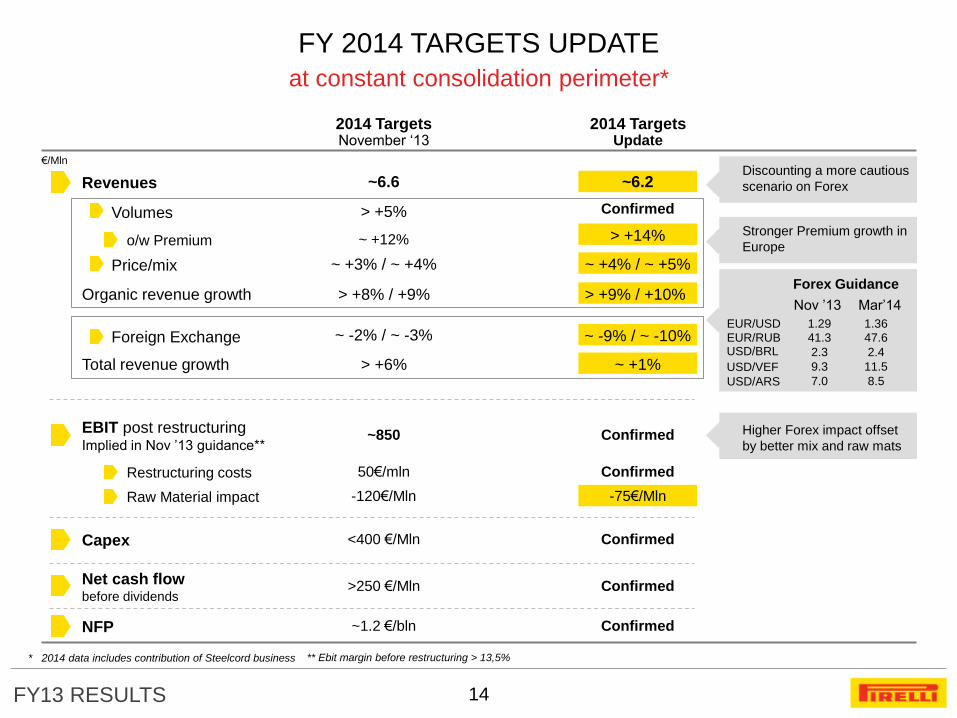
Revenues
€/Mln
Volumes
Price/mix
Foreign Exchange
Raw Material impact
2014 Targets November ‘13
~6.6
> +5%
~ +3% / ~ +4%
-120€/Mln
> +6%
2014 Targets Update
~6.2
~ +4% / ~ +5%
o/w Premium ~ +12%
-75€/Mln
Capex <400 €/Mln Confirmed
Net cash flow before dividends
>250 €/Mln Confirmed
NFP ~1.2 €/bln Confirmed
~ +1%
~ -2% / ~ -3%
Restructuring costs 50€/mln
Confirmed
> +14%
~ -9% / ~ -10%
Confirmed
Organic revenue growth
Total revenue growth
> +8% / +9% > +9% / +10%
Stronger Premium growth in
Europe
EBIT post restructuring Implied in Nov ’13 guidance**
~850 Confirmed Higher Forex impact offset
by better mix and raw mats
Discounting a more cautious
scenario on Forex
Forex Guidance
Nov ’13 Mar’14
EUR/USD
USD/BRL
USD/VEF
USD/ARS
1.29 1.36
2.3 2.4
9.3 11.5
7.0 8.5
* 2014 data includes contribution of Steelcord business
EUR/RUB 41.3 47.6
FY 2014 TARGETS UPDATE
at constant consolidation perimeter*
** Ebit margin before restructuring > 13,5%
FY13 RESULTS 15
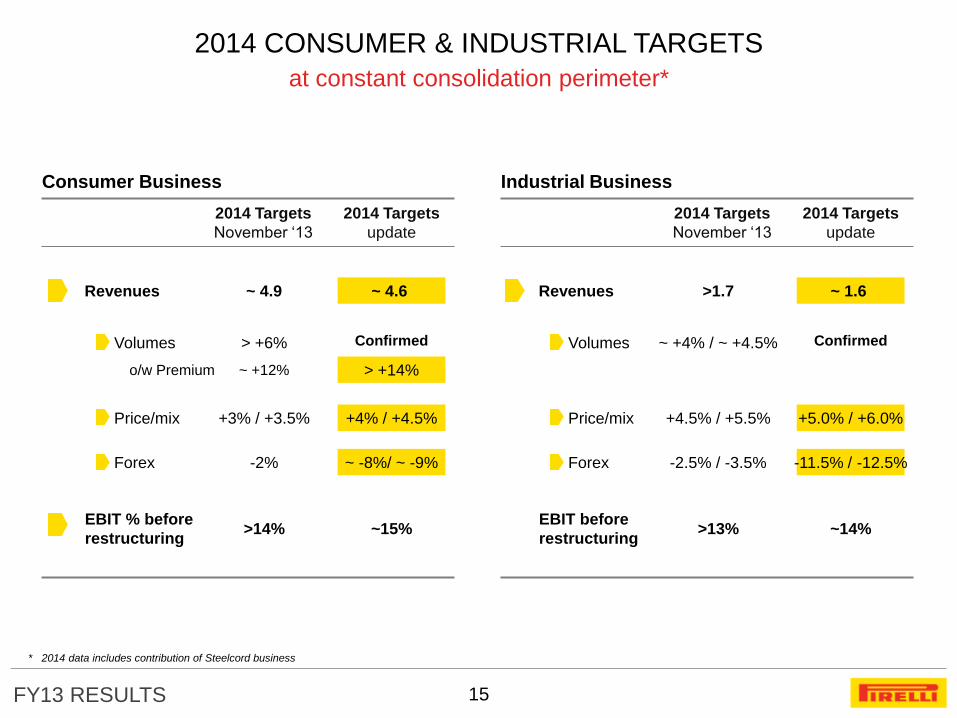
Consumer Business
2014 Targets
November ‘13
2014 Targets
update
Revenues ~ 4.9 ~ 4.6
o/w Premium ~ +12%
Volumes > +6%
Price/mix +3% / +3.5% +4% / +4.5%
Forex -2% ~ -8%/ ~ -9%
Industrial Business
2014 Targets
November ‘13
2014 Targets
update
Revenues >1.7 ~ 1.6
Volumes ~ +4% / ~ +4.5%
Price/mix +4.5% / +5.5% +5.0% / +6.0%
Forex -2.5% / -3.5% -11.5% / -12.5%
EBIT % before
restructuring >14% ~15% >13% ~14%
EBIT before
restructuring
Confirmed
> +14%
Confirmed
* 2014 data includes contribution of Steelcord business
2014 CONSUMER & INDUSTRIAL TARGETS
at constant consolidation perimeter*
FY13 RESULTS 16
FY 2013 RESULTS
2013 TYRE OVERVIEW
APPENDIX
AGENDA
2014 OUTLOOK & TARGETS
KEY MESSAGES
FY13 RESULTS
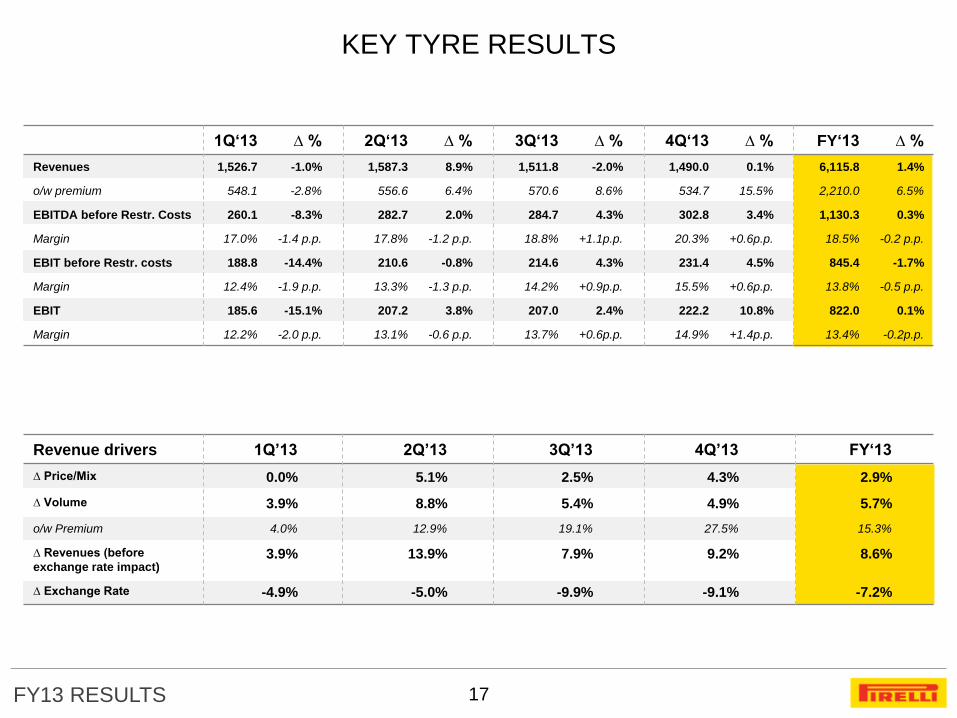
KEY TYRE RESULTS
17
1Q‘13 ∆ % 2Q‘13 ∆ % 3Q‘13 ∆ % 4Q‘13 ∆ % FY‘13 ∆ %
Revenues 1,526.7 -1.0% 1,587.3 8.9% 1,511.8 -2.0% 1,490.0 0.1% 6,115.8 1.4%
o/w premium 548.1 -2.8% 556.6 6.4% 570.6 8.6% 534.7 15.5% 2,210.0 6.5%
EBITDA before Restr. Costs 260.1 -8.3% 282.7 2.0% 284.7 4.3% 302.8 3.4% 1,130.3 0.3%
Margin 17.0% -1.4 p.p. 17.8% -1.2 p.p. 18.8% +1.1p.p. 20.3% +0.6p.p. 18.5% -0.2 p.p.
EBIT before Restr. costs 188.8 -14.4% 210.6 -0.8% 214.6 4.3% 231.4 4.5% 845.4 -1.7%
Margin 12.4% -1.9 p.p. 13.3% -1.3 p.p. 14.2% +0.9p.p. 15.5% +0.6p.p. 13.8% -0.5 p.p.
EBIT 185.6 -15.1% 207.2 3.8% 207.0 2.4% 222.2 10.8% 822.0 0.1%
Margin 12.2% -2.0 p.p. 13.1% -0.6 p.p. 13.7% +0.6p.p. 14.9% +1.4p.p. 13.4% -0.2p.p.
Revenue drivers 1Q’13 2Q’13 3Q’13 4Q’13 FY‘13
∆ Price/Mix 0.0% 5.1% 2.5% 4.3% 2.9%
∆ Volume 3.9% 8.8% 5.4% 4.9% 5.7%
o/w Premium 4.0% 12.9% 19.1% 27.5% 15.3%
∆ Revenues (before
exchange rate impact) 3.9% 13.9% 7.9% 9.2% 8.6%
∆ Exchange Rate -4.9% -5.0% -9.9% -9.1% -7.2%
FY13 RESULTS 18
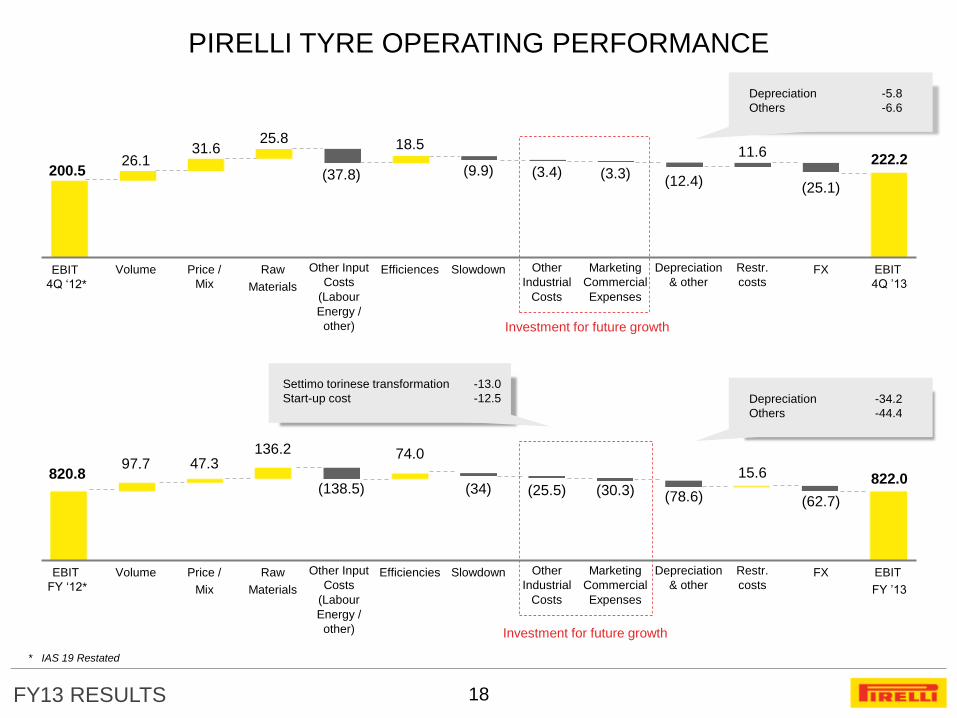
PIRELLI TYRE OPERATING PERFORMANCE
Investment for future growth
Investment for future growth
EBIT
4Q ‘12*
EBIT
FY ‘12*
200.5
820.8
Volume
Volume
26.1
97.7
Price /
Mix
Price /
Mix
31.6
47.3
Raw
Materials
Raw
Materials
25.8
136.2
Other Input
Costs
(Labour
Energy /
other)
Other Input
Costs
(Labour
Energy /
other)
(37.8)
(138.5)
Efficiences
Efficiencies
18.5
74.0
Slowdown
Slowdown
(9.9)
(34)
Other
Industrial
Costs
Other
Industrial
Costs
(3.4)
(25.5)
Marketing
Commercial
Expenses
Marketing
Commercial
Expenses
(3.3)
(30.3)
Depreciation
& other
Depreciation
& other
(12.4)
(78.6)
Restr.
costs
Restr.
costs
11.6
15.6
FX
FX
(25.1)
(62.7)
EBIT
4Q ’13
EBIT
FY ’13
222.2
822.0
Depreciation
Others
-5.8
-6.6
Depreciation
Others
-34.2
-44.4
Settimo torinese transformation
Start-up cost
-13.0
-12.5
* IAS 19 Restated
FY13 RESULTS
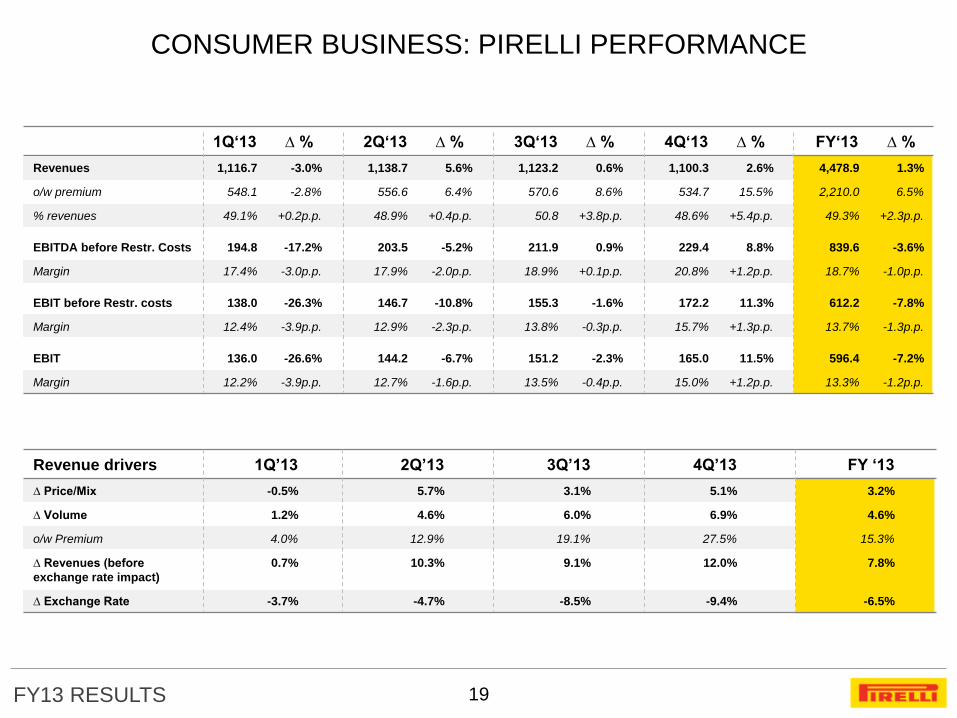
CONSUMER BUSINESS: PIRELLI PERFORMANCE
19
1Q‘13 ∆ % 2Q‘13 ∆ % 3Q‘13 ∆ % 4Q‘13 ∆ % FY‘13 ∆ %
Revenues 1,116.7 -3.0% 1,138.7 5.6% 1,123.2 0.6% 1,100.3 2.6% 4,478.9 1.3%
o/w premium 548.1 -2.8% 556.6 6.4% 570.6 8.6% 534.7 15.5% 2,210.0 6.5%
% revenues 49.1% +0.2p.p. 48.9% +0.4p.p. 50.8 +3.8p.p. 48.6% +5.4p.p. 49.3% +2.3p.p.
EBITDA before Restr. Costs 194.8 -17.2% 203.5 -5.2% 211.9 0.9% 229.4 8.8% 839.6 -3.6%
Margin 17.4% -3.0p.p. 17.9% -2.0p.p. 18.9% +0.1p.p. 20.8% +1.2p.p. 18.7% -1.0p.p.
EBIT before Restr. costs 138.0 -26.3% 146.7 -10.8% 155.3 -1.6% 172.2 11.3% 612.2 -7.8%
Margin 12.4% -3.9p.p. 12.9% -2.3p.p. 13.8% -0.3p.p. 15.7% +1.3p.p. 13.7% -1.3p.p.
EBIT 136.0 -26.6% 144.2 -6.7% 151.2 -2.3% 165.0 11.5% 596.4 -7.2%
Margin 12.2% -3.9p.p. 12.7% -1.6p.p. 13.5% -0.4p.p. 15.0% +1.2p.p. 13.3% -1.2p.p.
Revenue drivers 1Q’13 2Q’13 3Q’13 4Q’13 FY ‘13
∆ Price/Mix -0.5% 5.7% 3.1% 5.1% 3.2%
∆ Volume 1.2% 4.6% 6.0% 6.9% 4.6%
o/w Premium 4.0% 12.9% 19.1% 27.5% 15.3%
∆ Revenues (before
exchange rate impact)
0.7% 10.3% 9.1% 12.0% 7.8%
∆ Exchange Rate -3.7% -4.7% -8.5% -9.4% -6.5%
FY13 RESULTS
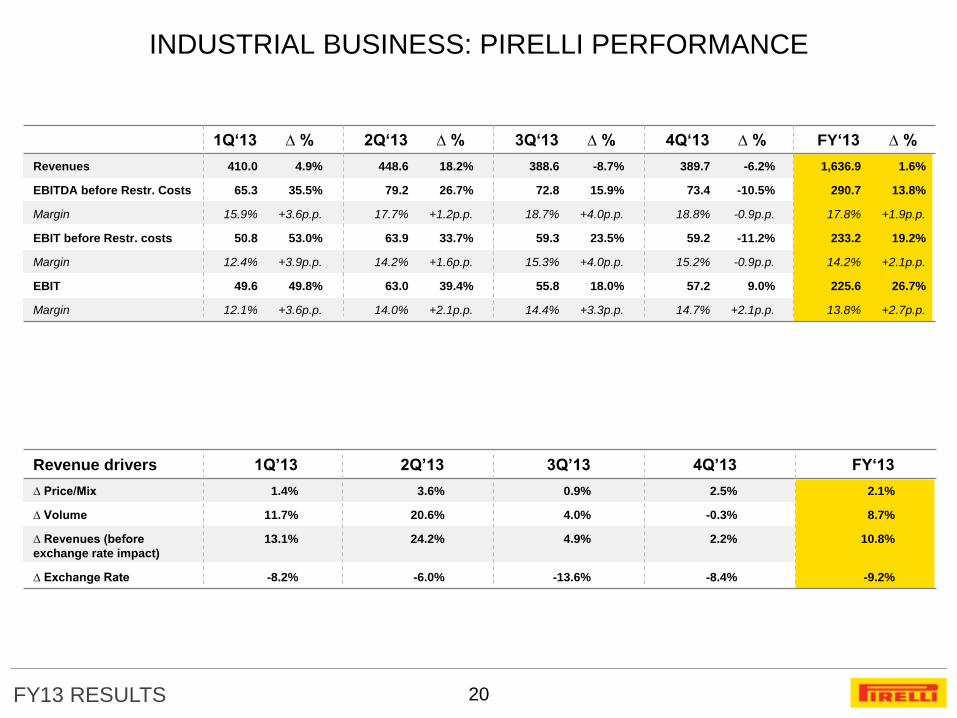
INDUSTRIAL BUSINESS: PIRELLI PERFORMANCE
20
1Q‘13 ∆ % 2Q‘13 ∆ % 3Q‘13 ∆ % 4Q‘13 ∆ % FY‘13 ∆ %
Revenues 410.0 4.9% 448.6 18.2% 388.6 -8.7% 389.7 -6.2% 1,636.9 1.6%
EBITDA before Restr. Costs 65.3 35.5% 79.2 26.7% 72.8 15.9% 73.4 -10.5% 290.7 13.8%
Margin 15.9% +3.6p.p. 17.7% +1.2p.p. 18.7% +4.0p.p. 18.8% -0.9p.p. 17.8% +1.9p.p.
EBIT before Restr. costs 50.8 53.0% 63.9 33.7% 59.3 23.5% 59.2 -11.2% 233.2 19.2%
Margin 12.4% +3.9p.p. 14.2% +1.6p.p. 15.3% +4.0p.p. 15.2% -0.9p.p. 14.2% +2.1p.p.
EBIT 49.6 49.8% 63.0 39.4% 55.8 18.0% 57.2 9.0% 225.6 26.7%
Margin 12.1% +3.6p.p. 14.0% +2.1p.p. 14.4% +3.3p.p. 14.7% +2.1p.p. 13.8% +2.7p.p.
Revenue drivers 1Q’13 2Q’13 3Q’13 4Q’13 FY‘13
∆ Price/Mix 1.4% 3.6% 0.9% 2.5% 2.1%
∆ Volume 11.7% 20.6% 4.0% -0.3% 8.7%
∆ Revenues (before
exchange rate impact)
13.1% 24.2% 4.9% 2.2% 10.8%
∆ Exchange Rate -8.2% -6.0% -13.6% -8.4% -9.2%
FY13 RESULTS
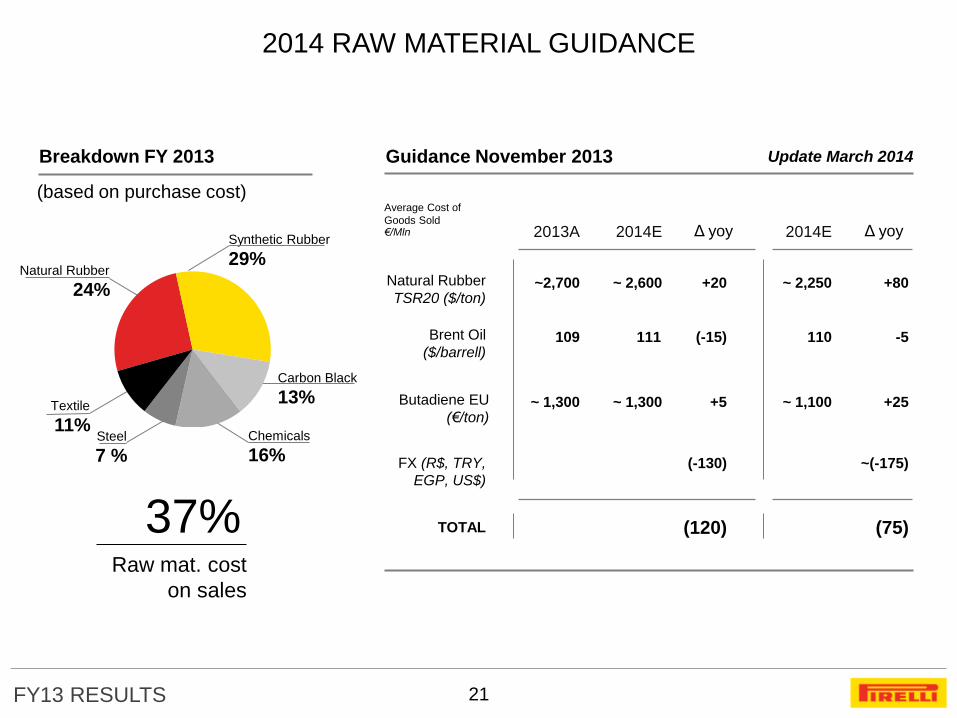
2014 RAW MATERIAL GUIDANCE
(based on purchase cost)
Guidance November 2013 Breakdown FY 2013 Update March 2014
21
Carbon Black
13%
Synthetic Rubber
29%
Textile
11% Chemicals
16%
Natural Rubber
24%
Steel
7 %
37% Raw mat. cost
on sales
€/Mln
Average Cost of
Goods Sold
TOTAL
FX (R$, TRY,
EGP, US$)
Natural Rubber
TSR20 ($/ton)
Brent Oil
($/barrell)
Butadiene EU
(€/ton)
2013A
~2,700
109
~ 1,300
2014E
~ 2,600
~ 1,300
111
Δ yoy
(120)
+20
(-15)
+5
(-130)
2014E
~ 2,250
~ 1,100
110
Δ yoy
(75)
+80
-5
+25
~(-175)
FY13 RESULTS
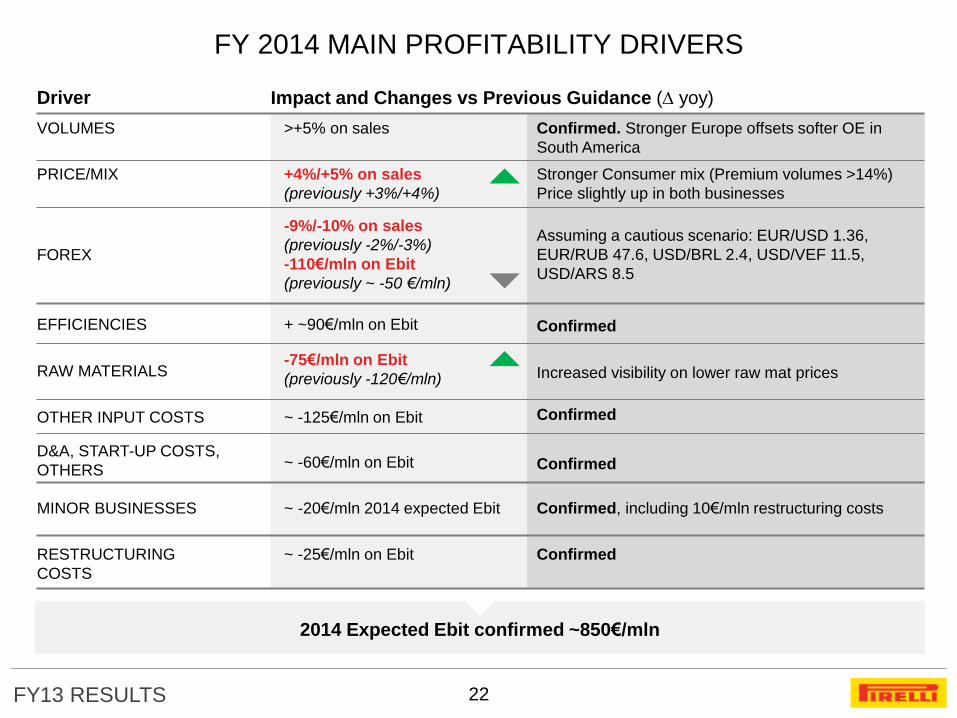
2014 Expected Ebit confirmed ~850€/mln
FY 2014 MAIN PROFITABILITY DRIVERS
22
VOLUMES
RESTRUCTURING
COSTS
>+5% on sales Confirmed. Stronger Europe offsets softer OE in
South America
MINOR BUSINESSES
D&A, START-UP COSTS,
OTHERS
Driver Impact and Changes vs Previous Guidance ( yoy)
PRICE/MIX +4%/+5% on sales
(previously +3%/+4%)
Stronger Consumer mix (Premium volumes >14%)
Price slightly up in both businesses
FOREX
-9%/-10% on sales
(previously -2%/-3%)
-110€/mln on Ebit
(previously ~ -50 €/mln)
Assuming a cautious scenario: EUR/USD 1.36,
EUR/RUB 47.6, USD/BRL 2.4, USD/VEF 11.5,
USD/ARS 8.5
EFFICIENCIES + ~90€/mln on Ebit Confirmed
RAW MATERIALS -75€/mln on Ebit
(previously -120€/mln) Increased visibility on lower raw mat prices
OTHER INPUT COSTS ~ -125€/mln on Ebit
~ -60€/mln on Ebit
~ -20€/mln 2014 expected Ebit Confirmed, including 10€/mln restructuring costs
~ -25€/mln on Ebit
Confirmed
Confirmed
Confirmed
FY13 RESULTS 23
2014 OUTLOOK & TARGETS
AGENDA
APPENDIX
FY 2013 RESULTS
TYRE BUSINESS FY 2013 OVERVIEW
FY13 RESULTS 24
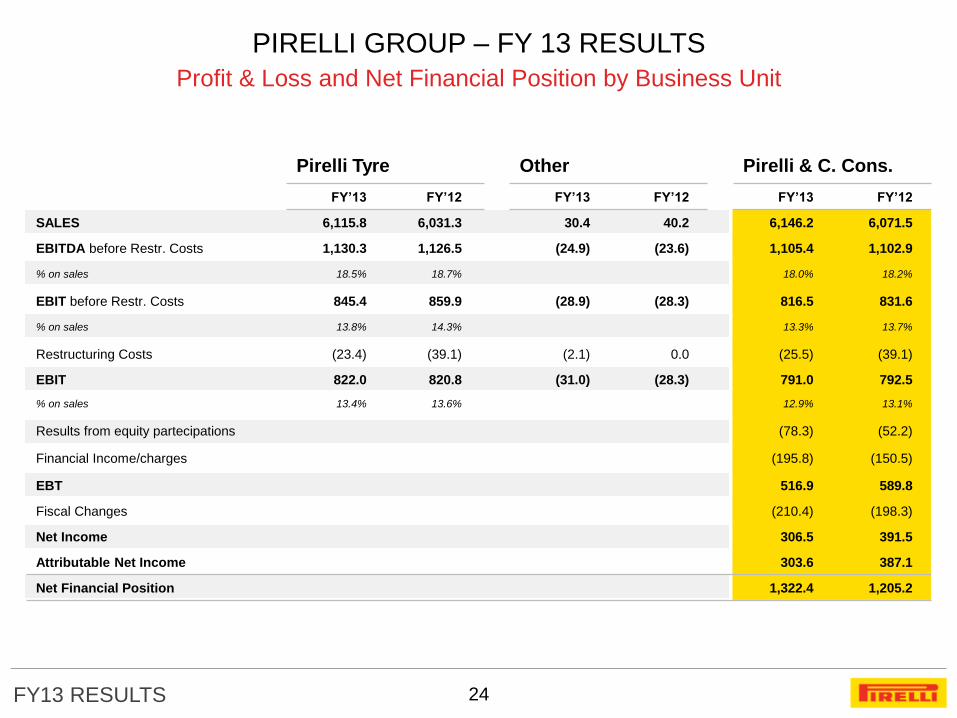
PIRELLI GROUP – FY 13 RESULTS
Profit & Loss and Net Financial Position by Business Unit
Pirelli Tyre Other Pirelli & C. Cons.
FY’13 FY’12 FY’13 FY’12 FY’13 FY’12
SALES 6,115.8 6,031.3 30.4 40.2 6,146.2 6,071.5
EBITDA before Restr. Costs 1,130.3 1,126.5 (24.9) (23.6) 1,105.4 1,102.9
% on sales 18.5% 18.7% 18.0% 18.2%
EBIT before Restr. Costs 845.4 859.9 (28.9) (28.3) 816.5 831.6
% on sales 13.8% 14.3% 13.3% 13.7%
Restructuring Costs (23.4) (39.1) (2.1) 0.0 (25.5) (39.1)
EBIT 822.0 820.8 (31.0) (28.3) 791.0 792.5
% on sales 13.4% 13.6% 12.9% 13.1%
Results from equity partecipations (78.3) (52.2)
Financial Income/charges (195.8) (150.5)
EBT 516.9 589.8
Fiscal Changes (210.4) (198.3)
Net Income 306.5 391.5
Attributable Net Income 303.6 387.1
Net Financial Position 1,322.4 1,205.2

FY13 RESULTS 25
PIRELLI GROUP – Q4 13 RESULTS
Profit & Loss and Net Financial Position by Business Unit
Pirelli Tyre Other Pirelli & C. Cons.
Q4’13 Q4’12 Q4’13 Q4’12 Q4’13 Q4’12
SALES 1,490.0 1,488.4 6.3 9.0 1,496.3 1,497.4
EBITDA before Restr. Costs 302.8 292.8 (10.8) (7.8) 292.0 285.0
% on sales 20.3% 19.7% 19.5% 19.0%
EBIT before Restr. Costs 231.4 221.4 (11.8) (8.8) 219.6 212.6
% on sales 15.5% 14.9% 14.7% 14.2%
Restructuring Costs (9.2) (20.9) (1.1) 0.0 (10.3) (20.9)
EBIT 222.2 200.5 (12.9) (8.8) 209.3 191.7
% on sales 14.9% 13.5% 14.0% 12.8%
Results from equity partecipations (55.4) (25.8)
Financial Income/charges (47.2) (47.2)
EBT 106.7 118.7
Fiscal Changes (58.3) (30.5)
Net Income 48.4 88.2
Attributable Net Income 41.5 85.8
Net Financial Position 1,322.4 1,205.2
FY13 RESULTS 26
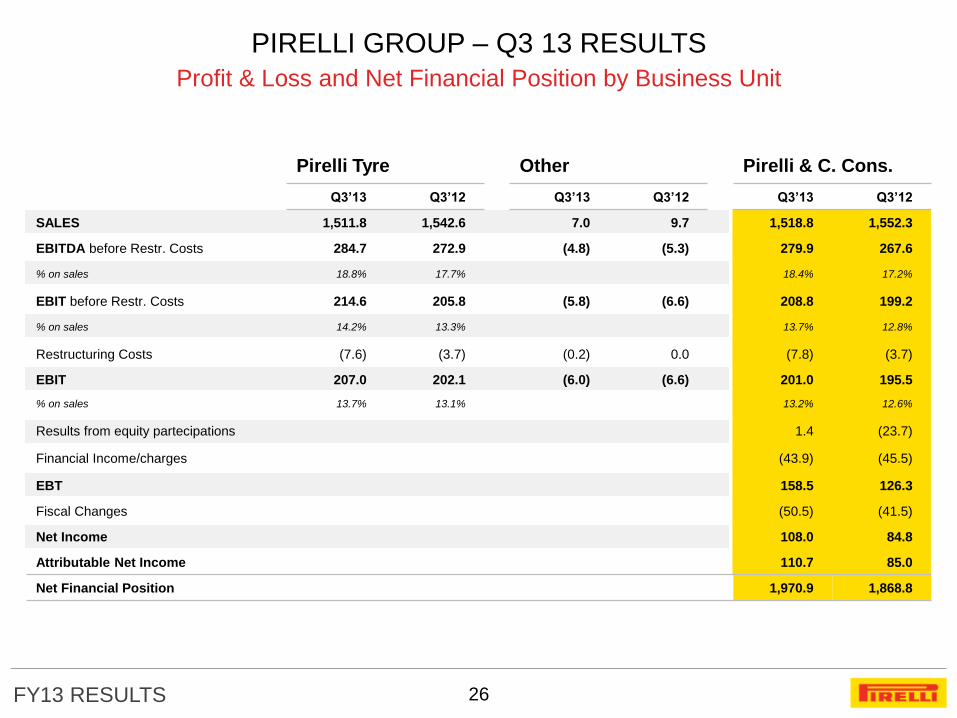
PIRELLI GROUP – Q3 13 RESULTS
Profit & Loss and Net Financial Position by Business Unit
Pirelli Tyre Other Pirelli & C. Cons.
Q3’13 Q3’12 Q3’13 Q3’12 Q3’13 Q3’12
SALES 1,511.8 1,542.6 7.0 9.7 1,518.8 1,552.3
EBITDA before Restr. Costs 284.7 272.9 (4.8) (5.3) 279.9 267.6
% on sales 18.8% 17.7% 18.4% 17.2%
EBIT before Restr. Costs 214.6 205.8 (5.8) (6.6) 208.8 199.2
% on sales 14.2% 13.3% 13.7% 12.8%
Restructuring Costs (7.6) (3.7) (0.2) 0.0 (7.8) (3.7)
EBIT 207.0 202.1 (6.0) (6.6) 201.0 195.5
% on sales 13.7% 13.1% 13.2% 12.6%
Results from equity partecipations 1.4 (23.7)
Financial Income/charges (43.9) (45.5)
EBT 158.5 126.3
Fiscal Changes (50.5) (41.5)
Net Income 108.0 84.8
Attributable Net Income 110.7 85.0
Net Financial Position 1,970.9 1,868.8

FY13 RESULTS 27
PIRELLI GROUP – Q2 13 RESULTS
Profit & Loss and Net Financial Position by Business Unit
Pirelli Tyre Other Pirelli & C. Cons.
Q2’13 Q2’12 Q2’13 Q2’12 Q2’13 Q2’12
SALES 1,587.3 1,457.7 7.5 7.6 1,594.8 1,465.3
EBITDA before Restr. Costs 282.7 277.2 (4.5) (6.0) 278.2 271.2
% on sales 17.8% 19.0% 17.4% 18.5%
EBIT before Restr. Costs 210.6 212.2 (5.5) (7.1) 205.1 205.1
% on sales 13.3% 14.6% 12.9% 14.0%
Restructuring Costs (3.4) (12.5) (0.8) 0.0 (4.2) (12.5)
EBIT 207.2 199.7 (6.3) (7.1) 200.9 192.6
% on sales 13.1% 13.7% 12.6% 13.1%
Results from equity partecipations (17.7) (3.2)
Financial Income/charges (46.1) (33.5)
EBT 137.1 155.9
Fiscal Changes (59.1) (61.0)
Net Income 78.0 94.9
Attributable Net Income 78.5 95.0
Net Financial Position 1,732.6 1,702.7
FY13 RESULTS 28
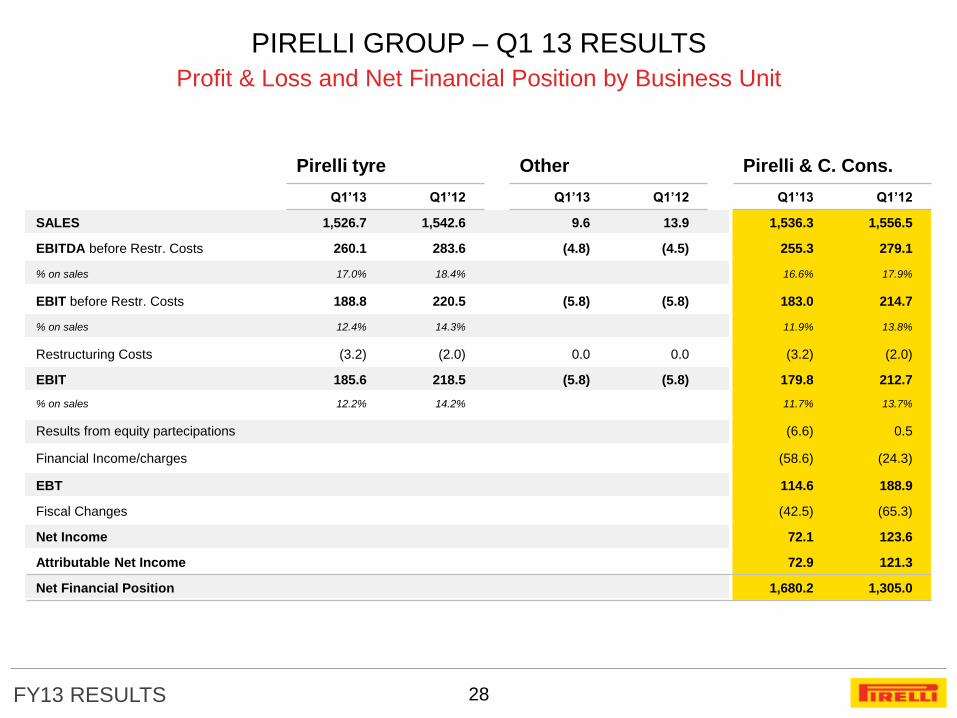
PIRELLI GROUP – Q1 13 RESULTS
Profit & Loss and Net Financial Position by Business Unit
Pirelli tyre Other Pirelli & C. Cons.
Q1’13 Q1’12 Q1’13 Q1’12 Q1’13 Q1’12
SALES 1,526.7 1,542.6 9.6 13.9 1,536.3 1,556.5
EBITDA before Restr. Costs 260.1 283.6 (4.8) (4.5) 255.3 279.1
% on sales 17.0% 18.4% 16.6% 17.9%
EBIT before Restr. Costs 188.8 220.5 (5.8) (5.8) 183.0 214.7
% on sales 12.4% 14.3% 11.9% 13.8%
Restructuring Costs (3.2) (2.0) 0.0 0.0 (3.2) (2.0)
EBIT 185.6 218.5 (5.8) (5.8) 179.8 212.7
% on sales 12.2% 14.2% 11.7% 13.7%
Results from equity partecipations (6.6) 0.5
Financial Income/charges (58.6) (24.3)
EBT 114.6 188.9
Fiscal Changes (42.5) (65.3)
Net Income 72.1 123.6
Attributable Net Income 72.9 121.3
Net Financial Position 1,680.2 1,305.0
FY13 RESULTS
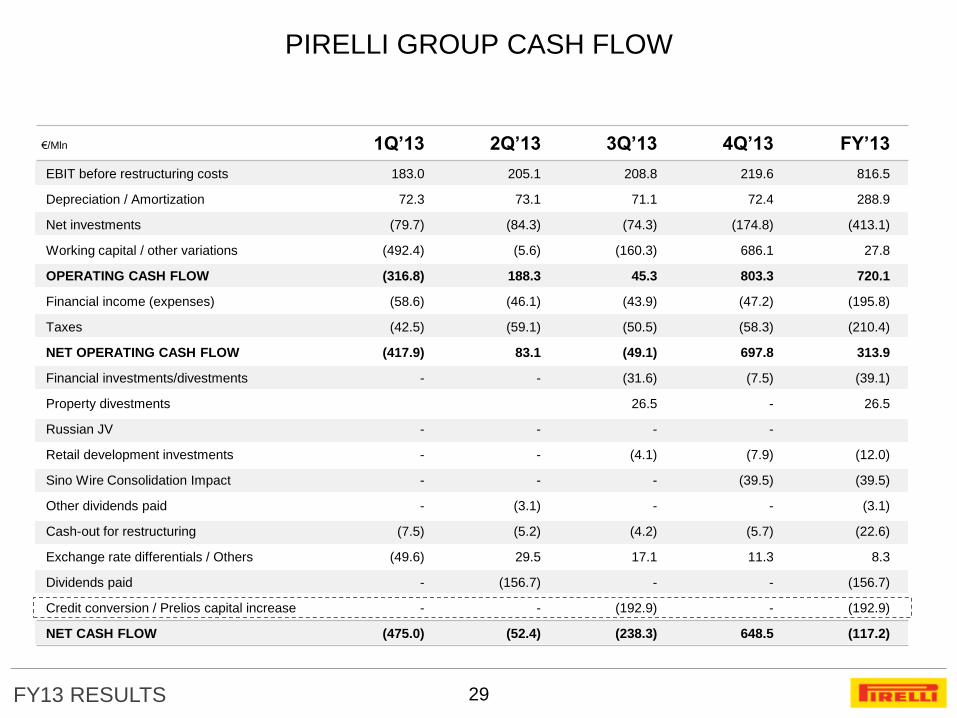
PIRELLI GROUP CASH FLOW
29
1Q’13 2Q’13 3Q’13 4Q’13 FY’13
EBIT before restructuring costs 183.0 205.1 208.8 219.6 816.5
Depreciation / Amortization 72.3 73.1 71.1 72.4 288.9
Net investments (79.7) (84.3) (74.3) (174.8) (413.1)
Working capital / other variations (492.4) (5.6) (160.3) 686.1 27.8
OPERATING CASH FLOW (316.8) 188.3 45.3 803.3 720.1
Financial income (expenses) (58.6) (46.1) (43.9) (47.2) (195.8)
Taxes (42.5) (59.1) (50.5) (58.3) (210.4)
NET OPERATING CASH FLOW (417.9) 83.1 (49.1) 697.8 313.9
Financial investments/divestments - - (31.6) (7.5) (39.1)
Property divestments 26.5 - 26.5
Russian JV - - - -
Retail development investments - - (4.1) (7.9) (12.0)
Sino Wire Consolidation Impact - - - (39.5) (39.5)
Other dividends paid - (3.1) - - (3.1)
Cash-out for restructuring (7.5) (5.2) (4.2) (5.7) (22.6)
Exchange rate differentials / Others (49.6) 29.5 17.1 11.3 8.3
Dividends paid - (156.7) - - (156.7)
Credit conversion / Prelios capital increase - - (192.9) - (192.9)
NET CASH FLOW (475.0) (52.4) (238.3) 648.5 (117.2)
€/Mln
FY13 RESULTS
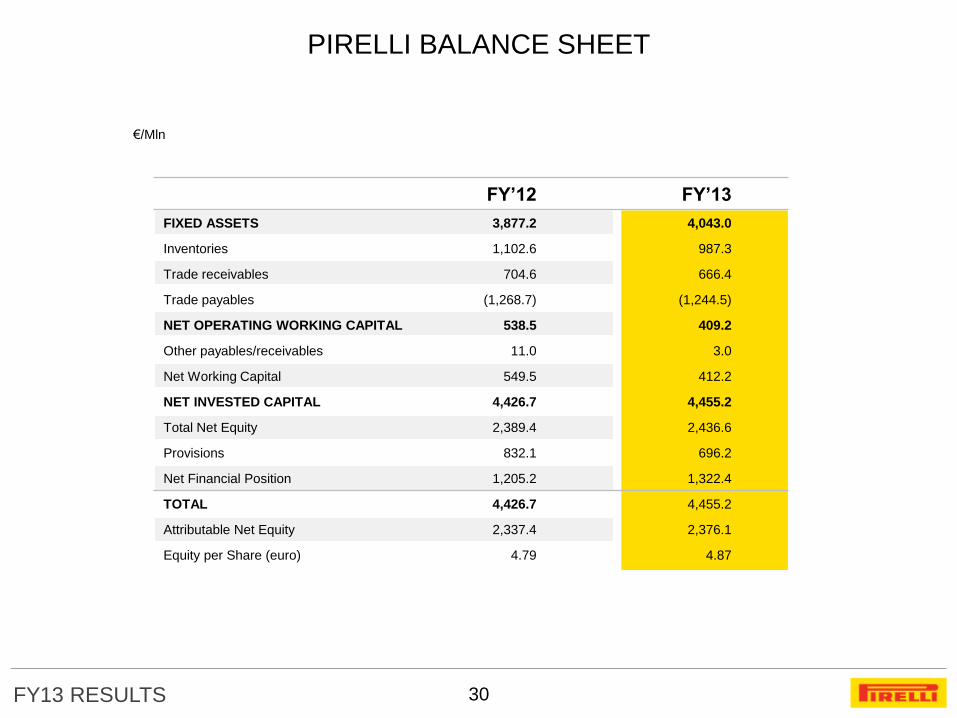
PIRELLI BALANCE SHEET
30
€/Mln
FY’12 FY’13
FIXED ASSETS 3,877.2 4,043.0
Inventories 1,102.6 987.3
Trade receivables 704.6 666.4
Trade payables (1,268.7) (1,244.5)
NET OPERATING WORKING CAPITAL 538.5 409.2
Other payables/receivables 11.0 3.0
Net Working Capital 549.5 412.2
NET INVESTED CAPITAL 4,426.7 4,455.2
Total Net Equity 2,389.4 2,436.6
Provisions 832.1 696.2
Net Financial Position 1,205.2 1,322.4
TOTAL 4,426.7 4,455.2
Attributable Net Equity 2,337.4 2,376.1
Equity per Share (euro) 4.79 4.87
FY13 RESULTS
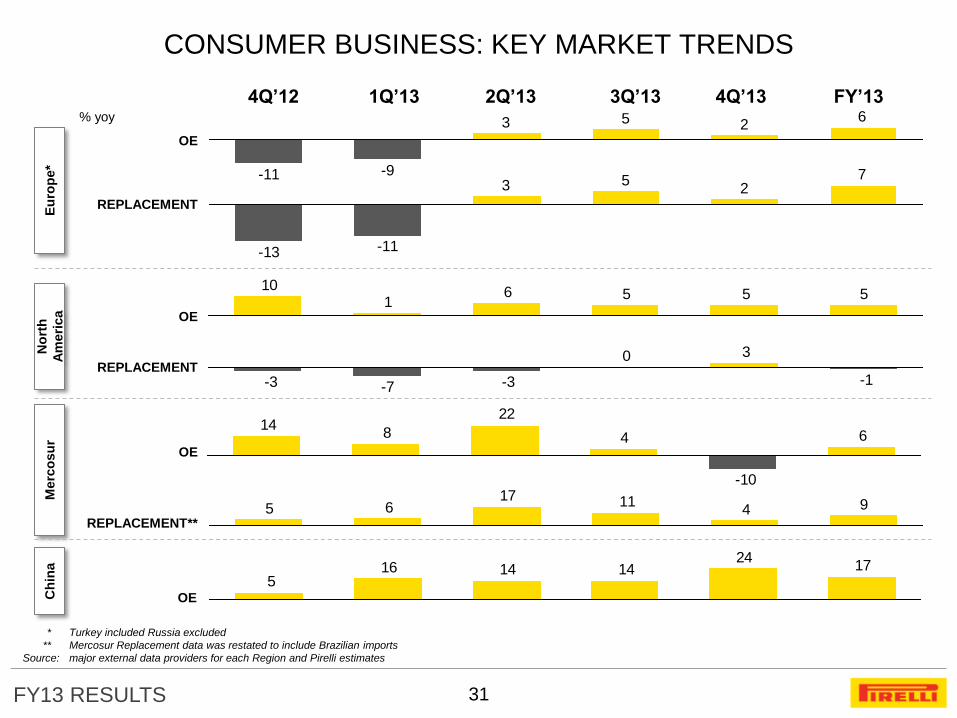
CONSUMER BUSINESS: KEY MARKET TRENDS
31
6253
-9-11 72
53
-11-13
55561
10
-1
30
-3-7-3
6
-10
4
22
814
941117
65
1724
1414165
* Turkey included Russia excluded
** Mercosur Replacement data was restated to include Brazilian imports
Source: major external data providers for each Region and Pirelli estimates
Eu
rop
e*
N
ort
h
Am
eri
ca
Merc
osu
r C
hin
a
OE
REPLACEMENT
OE
REPLACEMENT
OE
OE
4Q’12 1Q’13 2Q’13 3Q’13 4Q’13 FY’13 % yoy
REPLACEMENT**
FY13 RESULTS
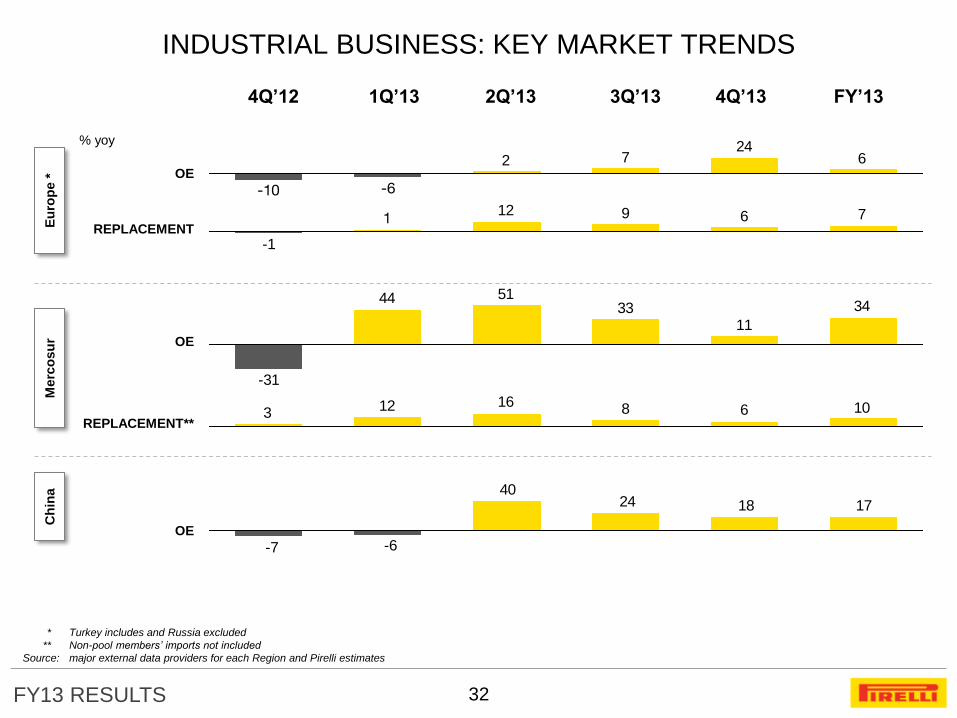
INDUSTRIAL BUSINESS: KEY MARKET TRENDS
32
624
72
-6-10
76912
-1
1
34
1133
5144
-31
106816123
17182440
-6-7
* Turkey includes and Russia excluded
** Non-pool members’ imports not included
Source: major external data providers for each Region and Pirelli estimates
Eu
rop
e *
M
erc
osu
r C
hin
a
OE
REPLACEMENT
OE
REPLACEMENT**
OE
% yoy
4Q’12 1Q’13 2Q’13 3Q’13 4Q’13 FY’13
FY13 RESULTS
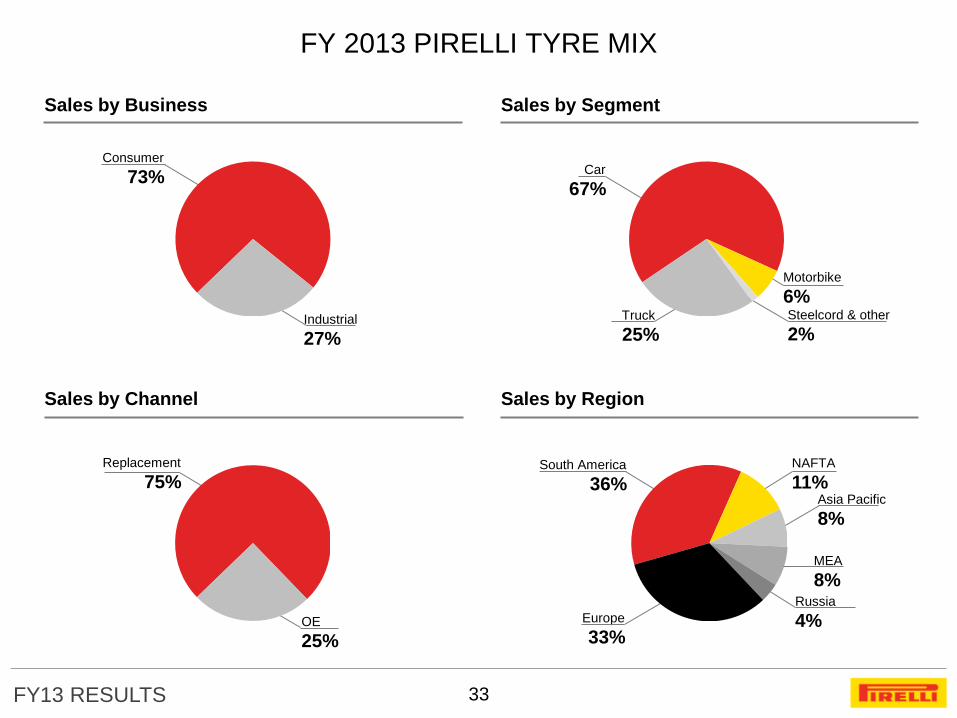
NAFTA
11%
FY 2013 PIRELLI TYRE MIX
Sales by Segment
Sales by Region
Car
67%
Motorbike
6% Steelcord & other
2% Truck
25%
MEA
8%
Asia Pacific
8%
Europe
33%
Russia
4%
South America
36%
Sales by Business
Sales by Channel
Replacement
75%
OE
25%
Industrial
27%
Consumer
73%
33
FY13 RESULTS
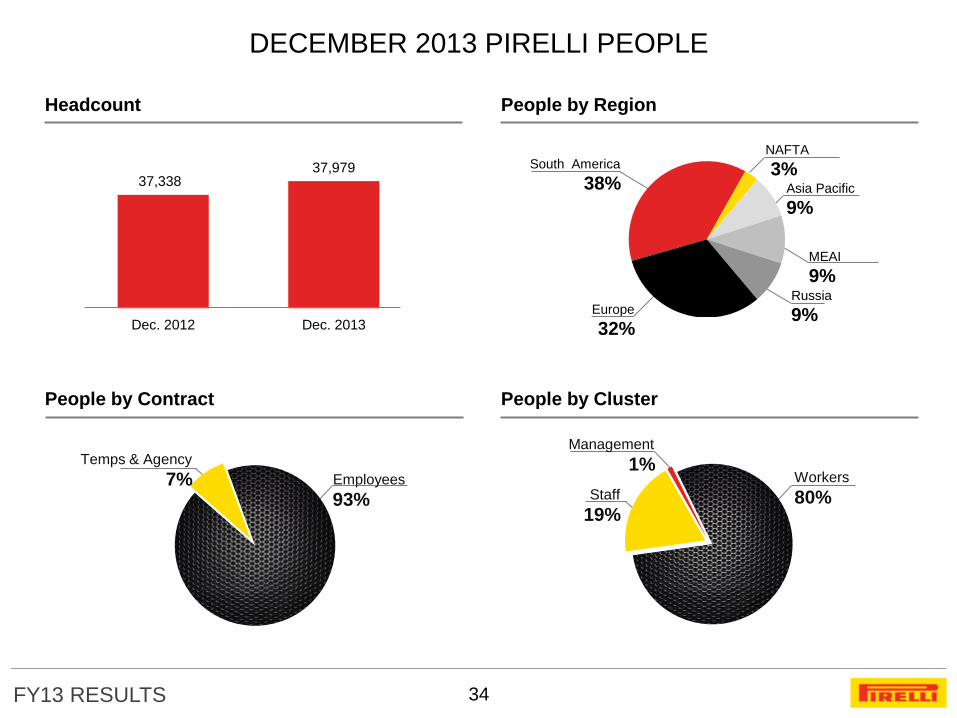
Russia
9%
DECEMBER 2013 PIRELLI PEOPLE
Headcount
People by Contract
People by Region
People by Cluster
MEAI
9%
Asia Pacific
9%
Europe
32%
NAFTA
3% South America
38%
Temps & Agency
7% Employees
93%
37,338 37,979
Dec. 2012 Dec. 2013
Workers
80%
Management
1%
Staff
19%
34
FY13 RESULTS
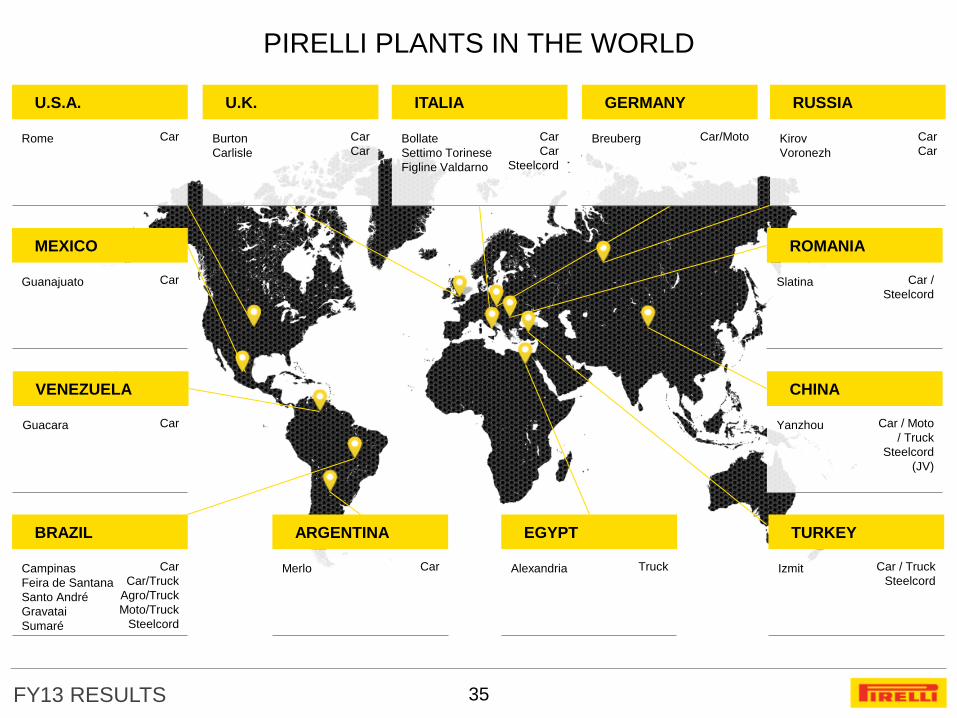
PIRELLI PLANTS IN THE WORLD
35
U.K. ITALIA GERMANY RUSSIA U.S.A.
Rome Car
Burton
Carlisle
Car
Car
MEXICO
Guanajuato Car
VENEZUELA
Guacara Car
BRAZIL
Campinas
Feira de Santana
Santo André
Gravatai
Sumaré
Car
Car/Truck
Agro/Truck
Moto/Truck
Steelcord
ARGENTINA
Merlo Car
EGYPT
Alexandria Truck
TURKEY
Izmit Car / Truck
Steelcord
ROMANIA
Slatina Car /
Steelcord
CHINA
Yanzhou Car / Moto
/ Truck
Steelcord
(JV)
Bollate
Settimo Torinese
Figline Valdarno
Car
Car
Steelcord
Breuberg Car/Moto Kirov
Voronezh
Car
Car
FY13 RESULTS
Carbon black
Chemicals
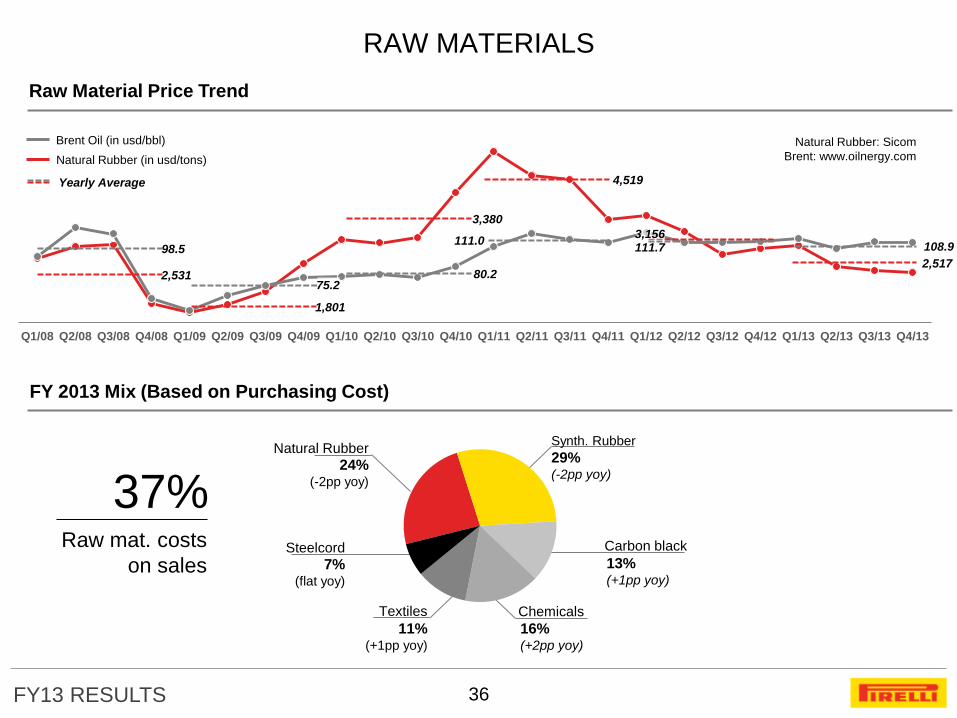
RAW MATERIALS
36
Raw Material Price Trend
Q1/08 Q2/08 Q3/08 Q4/08 Q1/09 Q2/09 Q3/09 Q4/09 Q1/10 Q2/10 Q3/10 Q4/10 Q1/11 Q2/11 Q3/11 Q4/11 Q1/12 Q2/12 Q3/12 Q4/12 Q1/13 Q2/13 Q3/13 Q4/13
Natural Rubber: Sicom
Brent: www.oilnergy.com
Yearly Average
Natural Rubber (in usd/tons)
Brent Oil (in usd/bbl)
111.0 3,156
98.5
2,531 75.2
1,801
80.2
3,380
4,519
111.7 108.9
2,517
Synth. Rubber
29% (-2pp yoy)
11% (+1pp yoy)
Textiles
7% (flat yoy)
Steelcord
24% (-2pp yoy)
Natural Rubber
37% Raw mat. costs
on sales 13% (+1pp yoy)
16% (+2pp yoy)
FY 2013 Mix (Based on Purchasing Cost)
FY13 RESULTS
DISCLAIMER
37
This presentation contains statements that constitute forward-looking statements based on Pirelli & C SpA’s current
expectations and projections about future events and does not constitute an offer or solicitation for the sale, purchase or
acquisition of securities of any of the companies mentioned and is directed to professionals of the financial community.
These statements appear in a number of places in this presentation and include statements regarding the intent, belief or
current expectations of the customer base, estimates regarding future growth in the different business lines and the global
business, market share, financial results and other aspects of the activities and situation relating to the Company. \
Such forward looking statements are not guarantees of future performance and involve risks and uncertainties, and actual
results may differ materially from those expressed in or implied by these forward looking statements as a result of various
factors, many of which are beyond the ability of Pirelli & C SpA to control or estimate precisely. Consequently it is
recommended that they be viewed as indicative only.
Analysts are cautioned not to place undue reliance on those forward looking statements, which speak only as of the date of
this presentation.
Pirelli & C. SpA undertakes no obligation to release publicly the results of any revisions to these forward looking statements
which may be made to reflect events and circumstances after the date of this presentation, including, without limitation,
changes in Pirelli & C. SpA business or acquisition strategy or to reflect the occurrence of unanticipated events.
Statement
The Manager mandated to draft corporate accounting documents of Pirelli & C. SpA. Francesco Tanzi, attests – as per
art.154-bis. comma 2 of the Testo Unico della Finanza (D.Lgs. 58/1998) – that all the accounting information contained in this
presentation correspond to the documented results, books and accounting of the Company.