Embed Size (px)
Citation preview
1
Pine Technical report: CDI versus TJLP, volatility versus trend July 25, 2012
In contrast to the period prior to the crisis in 2008 when the Brazilian Central Bank´s main
concern was the excessive growth of the economy and the subsequent rise in inflation, the
government´s attention has now turned to the weakening of GDP and gross private
investments. These two variables, along with the slowdown in inflation measured by the IPCA
amplified consumer price index, are among the main forces behind the fall in the Selic rate
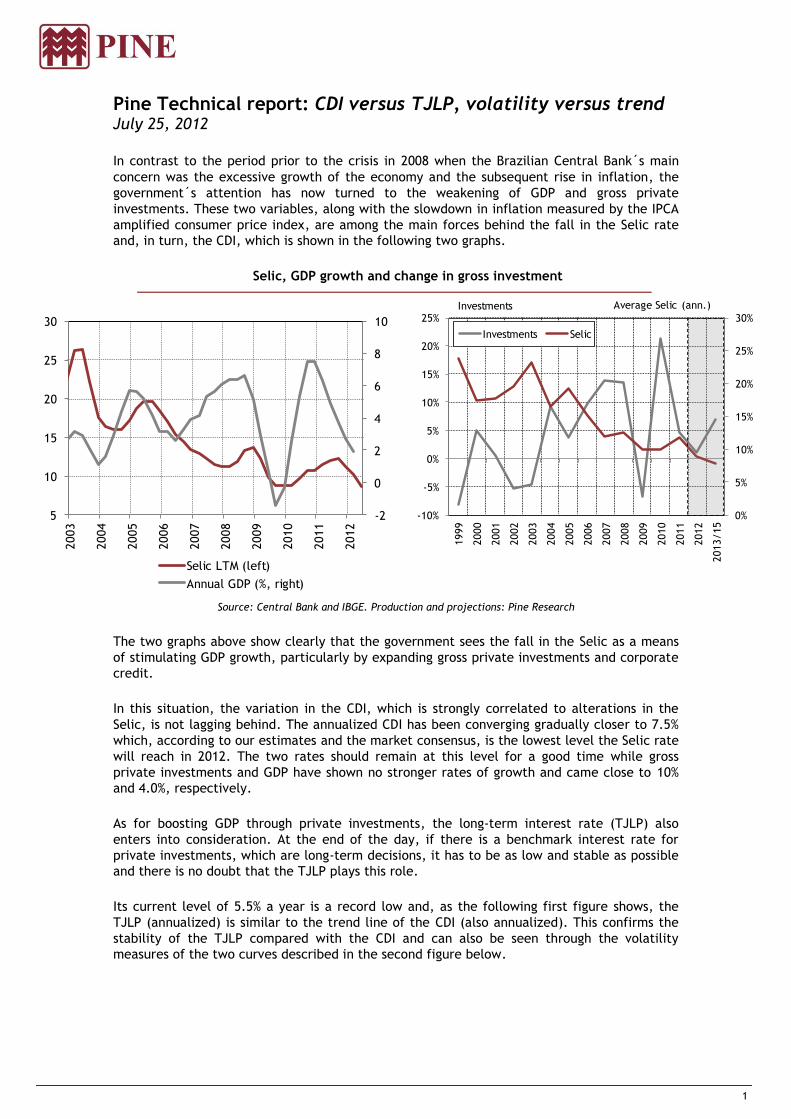
and, in turn, the CDI, which is shown in the following two graphs.
Selic, GDP growth and change in gross investment
Source: Central Bank and IBGE. Production and projections: Pine Research
The two graphs above show clearly that the government sees the fall in the Selic as a means
of stimulating GDP growth, particularly by expanding gross private investments and corporate
credit.
In this situation, the variation in the CDI, which is strongly correlated to alterations in the
Selic, is not lagging behind. The annualized CDI has been converging gradually closer to 7.5%
which, according to our estimates and the market consensus, is the lowest level the Selic rate
will reach in 2012. The two rates should remain at this level for a good time while gross
private investments and GDP have shown no stronger rates of growth and came close to 10%
and 4.0%, respectively.
As for boosting GDP through private investments, the long-term interest rate (TJLP) also
enters into consideration. At the end of the day, if there is a benchmark interest rate for
private investments, which are long-term decisions, it has to be as low and stable as possible
and there is no doubt that the TJLP plays this role.
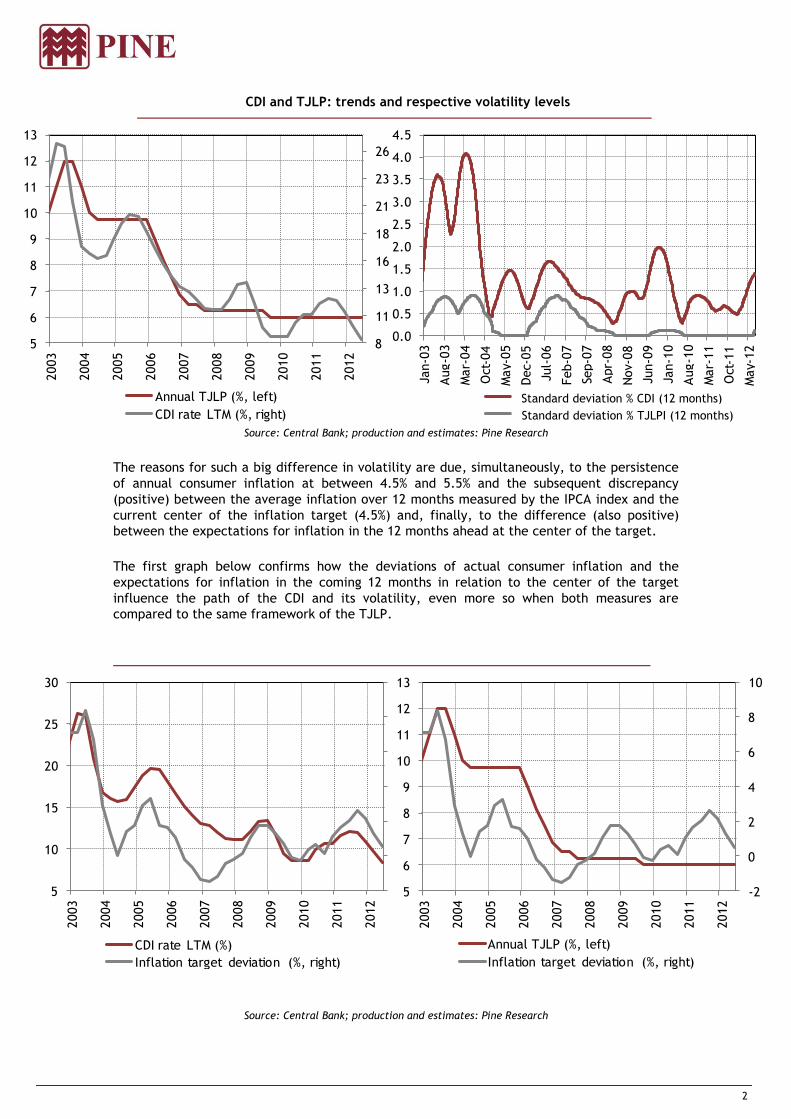
Its current level of 5.5% a year is a record low and, as the following first figure shows, the
TJLP (annualized) is similar to the trend line of the CDI (also annualized). This confirms the
stability of the TJLP compared with the CDI and can also be seen through the volatility
measures of the two curves described in the second figure below.
-2
0
2
4
6
8
10
5
10
15
20
25
30
2003
2004
2005
2006
2007
2008
2009
2010
2011
2012
Selic LTM (left)
Annual GDP (%, right)
0%
5%
10%
15%
20%
25%
30%
-10%
-5%
0%
5%
10%
15%
20%
25%
1999
2000
2001
2002
2003
2004
2005
2006
2007
2008
2009
2010
2011
2012
2013/15
Investments Selic
Investments Average Selic (ann.)
2
CDI and TJLP: trends and respective volatility levels
Source: Central Bank; production and estimates: Pine Research
The reasons for such a big difference in volatility are due, simultaneously, to the persistence
of annual consumer inflation at between 4.5% and 5.5% and the subsequent discrepancy
(positive) between the average inflation over 12 months measured by the IPCA index and the
current center of the inflation target (4.5%) and, finally, to the difference (also positive)
between the expectations for inflation in the 12 months ahead at the center of the target.
The first graph below confirms how the deviations of actual consumer inflation and the
expectations for inflation in the coming 12 months in relation to the center of the target
influence the path of the CDI and its volatility, even more so when both measures are
compared to the same framework of the TJLP.
Source: Central Bank; production and estimates: Pine Research
8
11
13
16
18
21
23
26
5
6
7
8
9
10
11
12
13
2003
2004
2005
2006
2007
2008
2009
2010
2011
2012
Annual TJLP (%, left)
CDI rate LTM (%, right)
-2
0
2
4
6
8
10
5
10
15
20
25
30
2003
2004
2005
2006
2007
2008
2009
2010
2011
2012
CDI rate LTM (%)
Inflation target deviation (%, right)
-2
0
2
4
6
8
10
5
6
7
8
9
10
11
12
13
2003
2004
2005
2006
2007
2008
2009
2010
2011
2012
Annual TJLP (%, left)
Inflation target deviation (%, right)
0.0
0.5
1.0
1.5
2.0
2.5
3.0
3.5
4.0
4.5
Jan-0
3
Aug-0
3
Mar-
04
Oct
-04
May-
05
Dec-
05
Jul-
06
Feb-0
7
Sep-0
7
Apr-
08
Nov-
08
Jun-0
9
Jan-1
0
Aug-1
0
Mar-
11
Oct
-11
May-
12
Desvio-padrão % CDI (12 meses)
Desvio-padrão % TJLP (12 meses)
Standard deviation % CDI (12 months)
Standard deviation % TJLPI (12 months)
3
In other words, the risk of a positive deviation from expectations of the variation in the IPCA
from actual consumer inflation in relation to the center of the target sets a floor for the CDI
at between 7.0% and 7.5% and the possibility of it rising, accompanying any possible increase
in the Selic rate to 8.5% from 2014. This outlook would only be possible if Brazilian GDP
started to grow again close to 4.0%, the European crisis lost force and, finally, if Brazil´s
consumer inflation were to return to between 5.5% and 6.0%. In the specific case of inflation
measured by the IPCA index, its rise would accompany: (i) an expansion of domestic demand;
(ii) an acceleration of the positive variation in prices of agricultural and non-agricultural
commodities in response to the greater world economic growth; and (iii) the resurgence of
inflation from domestic services which always accompany the real growth faster than
domestic demand.
For its part, the TJLP, the function of which is to finance and encourage the domestic capital
goods industry, including trucks, tractors and agricultural machinery, usually remains
between 5.0% and 5.5% in the long term. The aim is to promote the real annual expansion of
the gross formation of fixed capital by 10%, even though the fiscal burden of this subsidy in
relation to market rates costs the central government more than R$5.0 billion a year.
Marco Antonio Maciel Chief economist
Banco Pine
Marco Antonio Caruso Economist
Banco Pine
2
Disclaimer
This report has been prepared by PINE Research Macro/Commodities, a research department of Banco Pine S.A. PINE Securities USA LLC (“PINE”), a broker-dealer registered with the U.S. Securities and Exchange Commission and a member of the Financial Industry Regulatory Authority and the Securities Investor Protection Corporation, is distributing this report in the United States. PINE assumes responsibility for this research for purposes of U.S. law. Any U.S. person receiving this report and wishing to effect any transaction in a security discussed in this report should do so with PINE at +1-646-398-6900, 645 Madison Avenue, New York, NY 10022.
Banco Pine refers to PINE, as well as Banco Pine S.A. and PINE Investimentos.
This report is for distribution only under such circumstances as may be permitted by applicable law. This report is not directed at you if PINE is prohibited or restricted by any legislation or regulation in any jurisdiction from making it available to you. You should satisfy yourself before reading it that PINE is permitted to provide research material concerning investments to you under relevant legislation and regulations.
Nothing in this report constitutes a representation that any investment strategy or recommendation contained herein is suitable or appropriate to a recipient’s individual circumstances or otherwise constitutes a personal recommendation. It is published solely for information purposes, it does not constitute an advertisement and is not to be construed as a solicitation, offer, invitation or inducement to buy or sell any securities or related financial instruments in any jurisdiction. Prices in this report are believed to be reliable as of the date on which this report was issued and are derived from one or more of the following: (i) sources as expressly specified alongside the relevant data; (ii) the quoted price on the main regulated market for the security in question; (iii) other public sources believed to be reliable; or (iv) PINE's proprietary data or data available to Banco Pine. All other information herein is believed to be reliable as of the date on which this report was issued and has been obtained from public sources believed to be reliable. No representation or warranty, either express or implied, is provided in relation to the accuracy, completeness or reliability of the information contained herein, except with respect to information concerning PINE, its subsidiaries and affiliates, nor is it intended to be a complete statement or summary of the securities, markets or developments referred to in the report. In all cases, investors should conduct their own investigation and analysis of such information before taking or omitting to take any action in relation to securities or markets that are analyzed in this report.
Pine Research issues its views pursuant to relevant factors necessary to recommend an investment decision and independently of any instructions that Banco Pine might have from any covered company with which it has a business relationship. Banco Pine does not undertake that investors will obtain profits, nor will it share with investors any investment profits nor accept any liability for any investment losses. Investments involve risks and investors should exercise prudence in making their investment decisions. Banco Pine accepts no fiduciary duties to recipients of this report and in communicating this report is not acting in a fiduciary capacity. The report should not be regarded by recipients as a substitute for the exercise of their own judgment. Opinions, estimates, and projections expressed herein constitute the current judgment of the analyst responsible for the substance of this report as of the date in which was issued and are therefore subject to change without notice and may differ or be contrary to opinions expressed by other business areas or groups of Banco Pine as a result of using different assumptions and criteria. Any such opinions, estimates, and projections must not be construed as a representation that the matters referred to therein will occur. Prices and availability of financial instruments are indicative only and subject to change without notice.
Research will initiate, update and cease coverage solely at the discretion of Pine Research. The analysis contained herein is based on numerous assumptions. Different assumptions could result in materially different results. The analyst(s) responsible for the preparation of this report may interact with trading desk personnel, sales personnel and other constituencies for the purpose of gathering, synthesizing and interpreting market information. Banco Pine is under no obligation to update or keep current the information contained herein, except when terminating coverage of the companies discussed in the report. Banco Pine relies on information barriers to control the flow of information contained in one or more areas within Banco Pine, into other areas, units, groups or affiliates of Banco Pine. The compensation of the analyst who prepared this report is determined by research management and senior management (not including investment banking). Analyst compensation is not based on investment banking revenues, however, compensation may relate to the revenues of Banco Pine as a whole, of which investment banking, sales and trading are a part.
The securities described herein may not be eligible for sale in all jurisdictions or to certain categories of investors. Options, derivative products and futures are not suitable for all investors, and trading in these instruments is considered risky. Mortgage and asset-backed securities may involve a high degree of risk and may be highly volatile in response to fluctuations in interest rates and other market conditions. Past performance is not necessarily indicative of future results. If a financial instrument is denominated in a currency other than an investor’s currency, a change in rates of exchange may adversely affect the value or price of or the income derived from any security or related instrument mentioned in this report, and the reader of this report assumes any currency risk.
This report does not take into account the investment objectives, financial situation or particular needs of any particular investor. Investors should obtain independent financial advice based on their own particular circumstances before making an investment decision on the basis of the information contained herein. For investment advice, trade execution or other enquiries, clients should contact their local sales representative. Neither Banco Pine nor any of its affiliates, nor any of their respective directors, employees or agents, accepts any liability for any loss or damage arising out of the use of all or any part of this report.
Any prices stated in this report are for information purposes only and do not represent valuations for individual securities or other instruments. There is no representation that any transaction can or could have been effected at those prices and any prices do not necessarily reflect Banco Pine’s internal books and records or theoretical model-based valuations and may be based on certain assumptions. Different assumptions, by Banco Pine or any other source, may yield substantially different results.
This report may not be reproduced or redistributed to any other person, in whole or in part, for any purpose, without the prior written consent of Banco Pine, and Banco Pine accepts no liability whatsoever for the actions of third parties in this respect.
Additional information relating to the financial instruments discussed in this report is available upon request.