Embed Size (px)
Citation preview

Pilot Testing Project Report
Optimization of Conventional Treatment Processes for
Residual Aluminum Control
Walkerton Clean Water Centre
December 17, 2018
i
Disclaimer
The pilot testing project report is presented solely for information purposes and is
not intended to provide specific advice or recommendations in any circumstances.
This pilot testing project report includes information from different sources and
such information has not been independently confirmed for correctness or
completeness. The information provided does not imply on the part of the
Government of Ontario, the Walkerton Clean Water Centre (Centre) or its
employees, any endorsement or guarantee of any of the information. The
Government of Ontario, the Centre and its employees, do not assume and are not
responsible for any liability whatsoever for any information, interpretation,
comments or opinions expressed in the pilot testing project report.

ii
Executive Summary
Background
Aluminum is the most abundant metallic element, constituting about 8% of the
Earth’s crust (WHO, 1998). Varying amounts of aluminum are naturally occurring
in ground and surface water bodies, some of which are currently used as sources
of drinking water. Aluminum salts have been widely used as coagulants in
drinking water treatment processes, resulting in increased concentrations of
aluminum in finished water. Elevated residual aluminum could cause coating of
the pipes in the distribution system, increasing the energy demand for pumping
systems (Ontario MOE, 2003). Therefore, an operational guidance value of less
than 0.1 mg/L total aluminum has been established in Ontario (Ontario MOE,
2003).
A town located in Southwestern Ontario has discovered increased levels of
aluminum in the finished water. The town’s water treatment plant (WTP) uses a
blend of water from a nearby lake and two deep wells as its water source. In the
WTP, the lake water is treated by a chemically-assisted filtration process before it
is blended with the well water. The blended water is then subjected to an
advanced oxidation process using ultraviolet light and hydrogen peroxide,
followed by disinfection using chlorine gas. The WTP does not include rapid
mixing and flocculation processes in their chemically assisted filtration process,
which might reduce the efficiency of alum coagulant, resulting in elevated levels of
residual aluminum in finished water. The Walkerton Clean Water Centre (Centre)
was asked to assist in optimizing the chemically assisted filtration process in both
bench and pilot scales.
Objectives
The overall objective of this project is to optimize the chemically assisted filtration
process to reduce the residual aluminum concentrations in the finished water; to
be compliant with the operational guideline, without compromising the efficacy of

iii
organic matter removal which controls the precursors for disinfection by-products.
Specific objectives of this project are:
To compare aluminum sulfate and polyaluminum chloride (PACl) coagulant
performance on reducing residual aluminum in treated water.
To assess the effect of rapid mixing and flocculation following coagulation
on reducing the residual aluminum in treated water.
To assess the filtration process and its ability to reduce aluminum residuals
in treated water.
To evaluate the effect of objectives listed above on the treated water in
terms of dissolved organic carbon, UV254 absorbance, apparent colour and
true colour.
Approach
This project included four bench scale jar tests and four replicated pilot scale
experiments. The objectives of bench and pilot tests are demonstrated in Figure
ES-1. Raw water was collected from the WTP’s lake water intake and hauled to
the Centre for experiments.
Figure ES-1. Objectives of bench scale jar testing and pilot scale experiments
• To determine the optimal coagulant dose of alum and PACl
• To investigate the efficacy of rapid mixing using alum and PACl
• To determine the optimal flocculation time using alum and PACl
• To determine the optimal pH
Bench Scale Jar Testing
• To compare the efficacy of alum and PACl at pilot scale
Pilot Scale Experiments

iv
Bench Scale Jar Testing: Jar Test 1 was conducted to determine the optimal
dose of alum and PACl for aluminum control as well as turbidity removal. Those
optimal dosages of alum and PACl were then used in Jar Test 2 and Jar Test 3,
respectively, to investigate the impact of mixing on the levels of aluminum
residuals. Jar Test 4 was conducted using the optimal dosages of alum and PACl
as well as the optimal mixing condition to evaluate the effect of pH on the levels of
aluminum residuals.
Pilot Scale Experiments: Four replicated pilot scale experiments were
conducted to compare the performances of alum and PACl. Lake water collected
from the WTP’s intake was pumped through the pilot system and split evenly into
two trains. Water was then dosed with alum and PACl in Train 1 and Train 2,
respectively. Afterwards, water from each train was pumped through a rapid
mixer, flocculator, and clarifier, simultaneously, before going through a dual media
(anthracite/sand) filter.
Key Findings
The following conclusions were obtained from jar testing:
In Jar Test 1, PACl generated an average of 77% less total aluminum
residuals than alum. On average, about 86% of total aluminum residuals
derived from the alum test were present in dissolved form. Similarly, nearly
all of the total aluminum residuals of the PACl test were dissolved;
however, the PACl test had around 67% lower dissolved aluminum
residuals than what was obtained using alum.
In Jar Test 2 and Jar Test 3, the rapid mixing process significantly
increased turbidity removal and slightly improved the removal of dissolved
organics, reflected by UV254 absorbance results. However, the rapid mixing
process barely had any impact on the residual aluminum levels. In general,
the rapid mixing process could potentially increase coagulation efficiency.

v
In Jar Test 4, the effect of pH on aluminum residuals was tested. The
levels of total aluminum residuals were similar for all samples in spite of the
pH change between 7 and 8. However, lowering water pH to the 7 - 7.2
range transferred up to 95% of total aluminum into particulate form, which
could be more easily removed by a subsequent filtration process.
The following conclusions were obtained from pilot testing:
The PACl train had 38% and 74% lower total aluminum residuals than
the alum train in the clarifier and filter effluent, respectively.
Compared to the alum treated water, the PACl treated water had a 21-
23% reduction of dissolved organics, reflected by UV254 absorbance
and DOC results.
The PACl treated water had significant lower turbidity and color levels
than the alum treated water.

vi
Table of Contents
1. Introduction ..................................................................................................... 1
2. Materials and Methods ................................................................................... 3
2.1 Jar Testing .................................................................................................... 3
2.2 Pilot Testing .................................................................................................. 5
2.3 Monitoring and Sampling .............................................................................. 6
3. Results and Discussions ................................................................................. 8
3.1 Jar Testing Results ....................................................................................... 8
3.1.1 Effect of PACl vs. Alum on Residual Aluminum Reduction .................... 8
3.1.2 Effect of Mixing .................................................................................... 10
3.1.3 Effect of pH on aluminum residuals .................................................. 14
3.2 Pilot Testing Results ................................................................................... 18
3.2.1 Effect of PACl vs. Alum in Pilot Testing Experiments .......................... 18
3.2.2 Organics Removal ............................................................................... 19
3.2.3 General Water Quality ......................................................................... 21
4. Conclusions .................................................................................................. 23
References .......................................................................................................... 24

vii
List of Tables
Table 1. Pilot Testing Runs .................................................................................... 6
Table 2. Monitoring and Sampling ......................................................................... 7
List of Figures
Figure 1. Jar test objectives ................................................................................... 3
Figure 2. Jar test conditions ................................................................................... 4
Figure 3. Schematic of conventional pilot plant ...................................................... 5
Figure 4. Residual aluminum levels in Jar Test 1................................................... 8
Figure 5. Turbidity results in Jar Test 1 .................................................................. 9
Figure 6. Dissolved organic matter levels in Jar Test 2: A) DOC, and B) UV254
Absorbance .......................................................................................................... 11
Figure 7. Turbidity results in Jar Test 2 ................................................................ 11
Figure 8. Aluminum residuals in Jar Test 2 .......................................................... 12
Figure 9. Dissolved organic matter levels in Jar Test 2: A) DOC, and B) UV254
absorbance .......................................................................................................... 13
Figure 10. Turbidity results in Jar Test 2 .............................................................. 13
Figure 11. Aluminum residuals in Jar Test 2 ........................................................ 14
Figure 12. Effect of pH on aluminum residuals .................................................... 15
Figure 13. Effect of pH on turbidity....................................................................... 16
Figure 14. Effect of pH on DOC and UV254 absorbance ....................................... 16
Figure 15. Residual aluminum concentrations during pilot testing (O.G. represents
Operational Guideline [Ontario MOE, 2003]) ....................................................... 18
Figure 16. UV254 absorbance readings of each treatment stage in the pilot testing
process (n=4) ....................................................................................................... 19

viii
Figure 17. DOC levels of each treatment stage in the pilot testing process (n=4) 20
Figure 18. Turbidity levels of each treatment stage in the pilot testing process
(n=4) .................................................................................................................... 21
Figure 19. Apparent colour levels of each treatment stage in the pilot testing
process (n=4) ....................................................................................................... 22
Figure 20. Alkalinity levels of each treatment stage in the pilot testing process
(n=4) .................................................................................................................... 22

1
1. Introduction
Aluminum is the most abundant metallic element which constitutes about 8% of
the Earth’s crust (WHO, 1998). It is found in variety of minerals, soils, plants and
animal tissues (Health Canada, 1998). Varying amounts of aluminum are naturally
occurring in ground and surface waterbodies, some of which are currently used as
sources of drinking water. Aluminum is often regarded as a possible cause of
Alzheimer’s disease; however, no research results verifying such statements have
been considered conclusive (Health Canada, 2008). To date, no consistent,
convincing evidence has been discovered that aluminum residuals in drinking
water poses adverse health effects in humans, and aluminum does not affect the
acceptances of drinking water (Health Canada, 1998). Therefore, in Ontario,
neither a health-based regulation nor aesthetic objective has been established for
aluminum in drinking water (O.Reg. 169/03; Ontario MOE, 2003).
Aluminum salts have been widely used as coagulants in drinking water treatment
processes, resulting in increased concentrations of aluminum in finished water.
Elevated residual aluminum could cause coating of the pipes in the distribution
system, increasing energy demand for a pumping system (Ontario MOE, 2003). In
Ontario, an operational guidance value of less than 0.1 mg/L total aluminum has
been established to ensure the efficient and effective treatment, disinfection and
distribution of drinking water systems (Ontario MOE, 2003).
A town located in Southwestern Ontario has discovered higher levels of aluminum
in their treated water. Recently, concentrations of up to 0.09 mg/L have been
recorded, which is close to Ontario’s operational guideline (0.1 mg/L). The town’s
water treatment plant (WTP) provides safe drinking water to approximately 7,200
residents, using a blend of water from a nearby lake and two deep wells as a
water source. In the WTP, the lake water is dosed with aluminum sulfate (alum),
coagulant and then flows through an upflow clarifier followed by a dual media
(anthracite/sand) filter. Afterwards, the treated lake water is blended with the well

2
water. The blended water is then subjected to an advanced oxidation process
(AOP) using ultraviolet light (UV) and hydrogen peroxide (H2O2), followed by
disinfection using chlorine gas (Cl2). The WTP does not currently include rapid
mixing and flocculation processes in their chemically assisted filtration for lake
water treatment, which might reduce the efficiency of alum coagulant; which could
possibly result in higher levels of residual aluminum in the finished water.
Therefore, the WTP contacted the Centre to assist in optimizing its chemically
assisted filtration process by conducting both bench and pilot scale experiments.
The overall objective of this project is to optimize the chemically assisted filtration
process to reduce the residual aluminum concentrations in the finished water to
compliance with the operational guideline recommended in Ontario, without
compromising the efficacy of organic matter removal which controls the
precursors of disinfection by-products (DBPs).
Specific objectives of this project are:
1) To compare aluminum sulfate (alum) and polyaluminum chloride (PACl)
coagulant performance on reducing residual aluminum in treated water.
2) To assess the effect of rapid mixing and flocculation following coagulation
on reducing the residual aluminum in treated water.
3) To assess the filtration process and its ability to reduce aluminum residuals
in treated water.
4) To evaluate the effect of the objectives listed above on the treated water in
terms of dissolved organic carbon (DOC), UV absorbance, apparent colour
and true colour.

3
2. Materials and Methods
2.1 Jar Testing
The primary objective of the jar tests was to optimize coagulant dose, rapid mixing
time, flocculation time and pH. The lake water sample for jar testing was directly
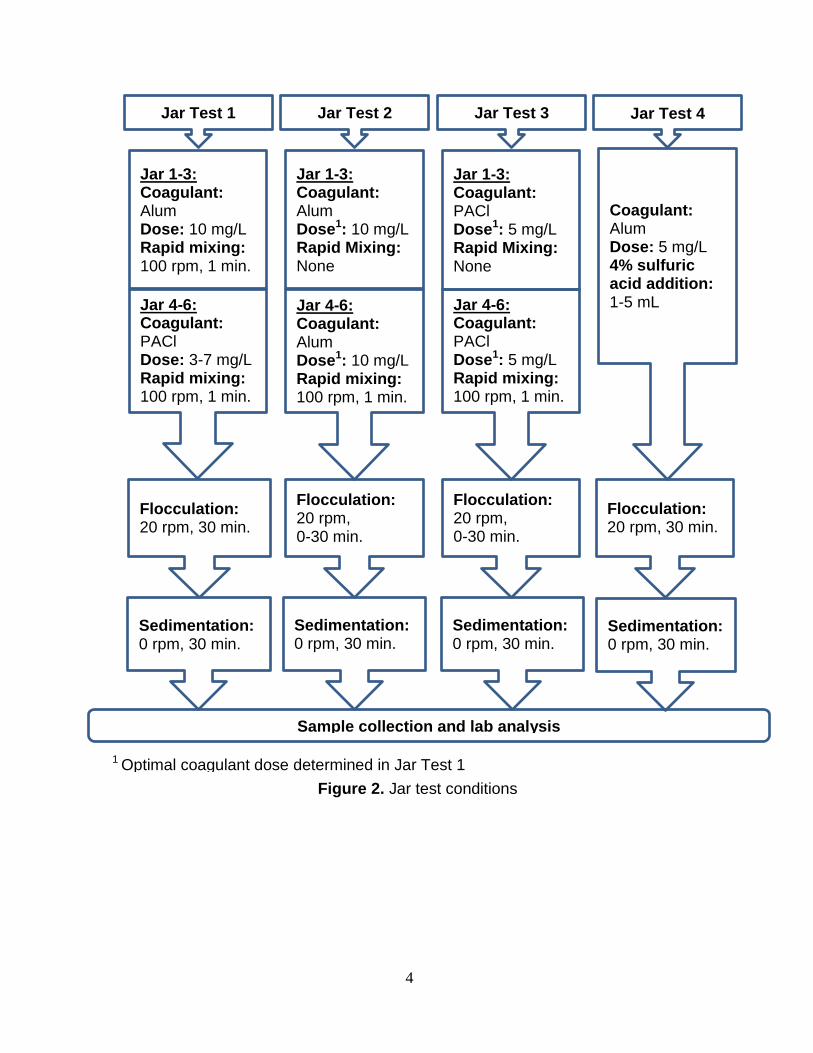
collected from the WTP’s intake. Four jar tests were then conducted at the
Centre. The objectives and test conditions of each jar test are shown in Figure 1
and Figure 2, respectively.
Figure 1. Jar test objectives
After jar testing, samples were collected from each jar and analyzed for general
water quality parameters including turbidity, dissolved organic carbon (DOC),
UV254 absorbance, total and dissolved aluminum residual, and apparent colour.
Optimizing pH may further reduce the concentrations of residual aluminum in the
treated water. Jar Test 4 was conducted to reduce the water’s pH and investigate
the impact of pH on residual aluminum levels. Pilot scale testing was not
performed to confirm these findings due to setup limitations.
Jar Test 1
•To determine the optimal coagulant dose of alum and PACl.
Jar Test 2
•To investigate the efficacy of rapid mixing using alum coagulant.
•To determine the optimal flocculation time using alum coagulant.
Jar Test 3
•To investigate the efficacy of rapid mixing using PACl coagulant.
•To determine the optimal flocculation time using PACl coagulant.
Jar Test 4
•To determine the optimal pH using alum coagulant.
4
Jar Test 1
Jar 4-6: Coagulant: PACl Dose: 3-7 mg/L Rapid mixing: 100 rpm, 1 min.
Jar 1-3: Coagulant: Alum Dose: 10 mg/L Rapid mixing: 100 rpm, 1 min.
Sample collection and lab analysis
Jar Test 2
Jar 4-6: Coagulant: Alum Dose1: 10 mg/L Rapid mixing: 100 rpm, 1 min.
Flocculation: 20 rpm, 0-30 min.
Jar 1-3: Coagulant: Alum Dose1: 10 mg/L Rapid Mixing: None
Jar Test 3
Jar 1-3: Coagulant: PACl Dose1: 5 mg/L Rapid Mixing: None
Jar 4-6: Coagulant: PACl Dose1: 5 mg/L Rapid mixing: 100 rpm, 1 min.
Jar Test 4
Coagulant: Alum Dose: 5 mg/L 4% sulfuric acid addition: 1-5 mL
Flocculation: 20 rpm, 0-30 min.
Figure 2. Jar test conditions
1 Optimal coagulant dose determined in Jar Test 1
Flocculation: 20 rpm, 30 min.
Sedimentation: 0 rpm, 30 min.
Sedimentation: 0 rpm, 30 min.
Sedimentation: 0 rpm, 30 min.
Flocculation: 20 rpm, 30 min.
Sedimentation: 0 rpm, 30 min.
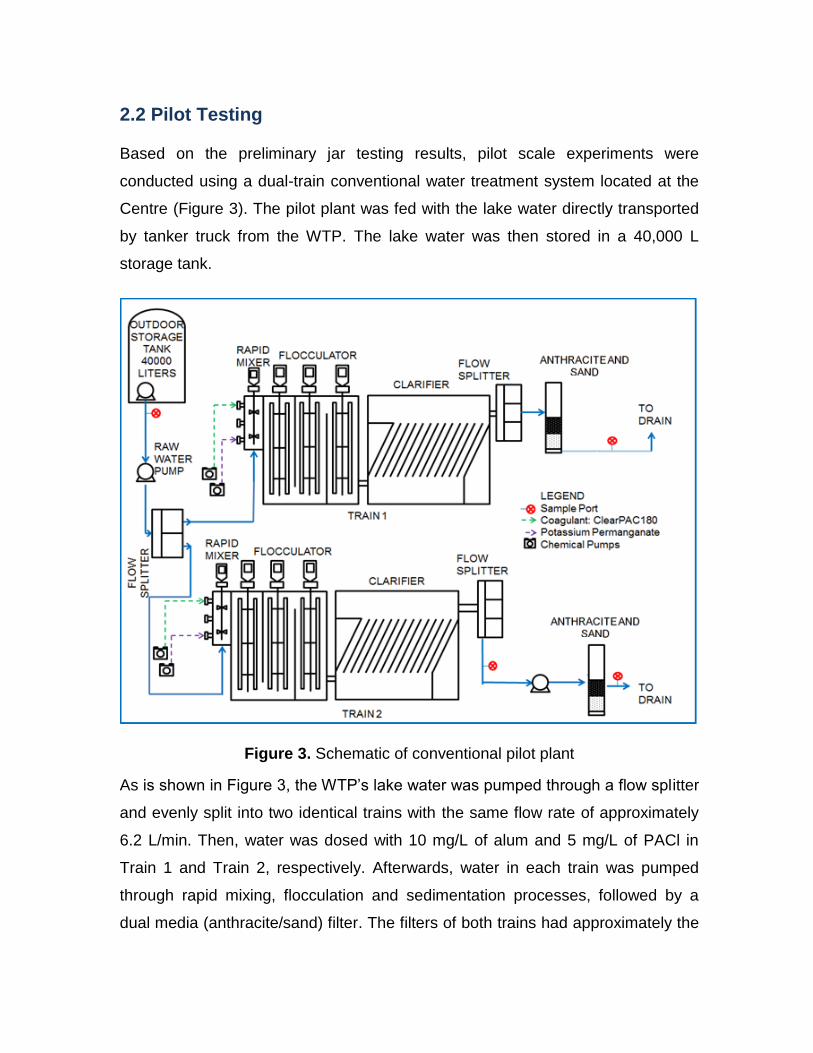
2.2 Pilot Testing
Based on the preliminary jar testing results, pilot scale experiments were
conducted using a dual-train conventional water treatment system located at the
Centre (Figure 3). The pilot plant was fed with the lake water directly transported
by tanker truck from the WTP. The lake water was then stored in a 40,000 L
storage tank.
Figure 3. Schematic of conventional pilot plant
As is shown in Figure 3, the WTP’s lake water was pumped through a flow splitter
and evenly split into two identical trains with the same flow rate of approximately
6.2 L/min. Then, water was dosed with 10 mg/L of alum and 5 mg/L of PACl in
Train 1 and Train 2, respectively. Afterwards, water in each train was pumped
through rapid mixing, flocculation and sedimentation processes, followed by a
dual media (anthracite/sand) filter. The filters of both trains had approximately the

6
same filtration rate at about 10 m/h. The filter effluents were then chlorinated to
simulate the WTP’s disinfection process. Details of pilot testing runs are
summarized in Table 1.
Table 1. Pilot Testing Runs
Run Train 1 Train 2 Duration
1 Alum PACl 12 hours
2 Alum PACl 16 hours,
20 minutes
3 Alum PACl 17 hours
4 Alum PACl 17 hours
Note: Coagulants were applied at their optimal dosages that were determined during Jar Test 1.
The pilot system had somewhat of a different setup compared to the town’s WTP.
The pilot system used consists of rapid mixing, flocculation, and a sedimentation
process for clarification, whereas the WTP adds coagulant and immediately
directs it to an upflow clarifier. Both plants utilize dual media filtration following
their clarification processes.
2.3 Monitoring and Sampling
During pilot testing, the water quality parameters of raw water, and the effluents
from the clarifier and anthracite/sand dual media filters were monitored. Alkalinity,
total and dissolved aluminum residuals, apparent colour, pH, turbidity, UV254
absorbance and DOC were analyzed on-site at the Centre. Further details of the
sampling and monitoring program are shown in Table 2.
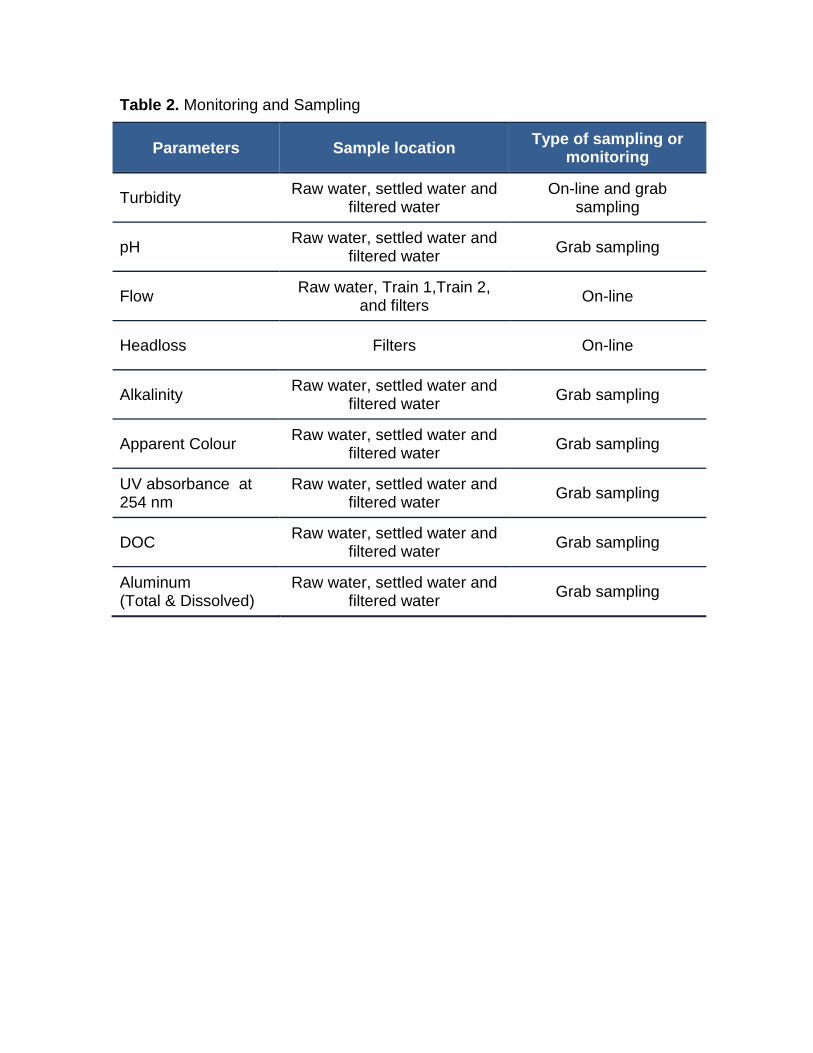
Table 2. Monitoring and Sampling
Parameters Sample location Type of sampling or
monitoring
Turbidity Raw water, settled water and
filtered water On-line and grab
sampling
pH Raw water, settled water and
filtered water Grab sampling
Flow Raw water, Train 1,Train 2,
and filters On-line
Headloss Filters On-line
Alkalinity Raw water, settled water and
filtered water Grab sampling
Apparent Colour Raw water, settled water and
filtered water Grab sampling
UV absorbance at 254 nm
Raw water, settled water and filtered water
Grab sampling
DOC Raw water, settled water and
filtered water Grab sampling
Aluminum (Total & Dissolved)
Raw water, settled water and filtered water
Grab sampling

3. Results and Discussions
The total aluminum concentration of raw water was tested on-site as 0.045 mg/L.
This elevated concentration of naturally occurring aluminum might have
contributed to the higher aluminum residuals discovered in the treated water.
3.1 Jar Testing Results
3.1.1 Effect of PACl vs. Alum on Residual Aluminum Reduction
Jar Test 1 was conducted to investigate the impact of two different coagulants
(alum and PACl) on residual aluminum levels in the treated water. During this test,
5, 10 and 15 mg/L of alum and PACl were dosed in Jars 1-3 and Jars 4-6,
respectively. The jar test allowed 1 minute of rapid mixing (at 100 rpm), followed
by 30 minutes of flocculation (at 20 rpm), and 30 minutes of sedimentation (at 0
rpm).
The following observations were noted during Jar Test 1 (Figures 4-5):
Figure 4. Residual aluminum levels in Jar Test 1
0.00
0.05
0.10
0.15
0.20
0.25
0.30
0.35
Total Dissolved Total Dissolved
Alum PACl
Alu
min
um
Re
sid
ua
l (m
g/L
)
5 mg/L of Coagulant 10 mg/L of Coagulant 15 mg/L of Coagulant

9
The average total residual aluminum concentrations for alum (Jars 1-3)
and PACl coagulants (Jars 4-6) were 0.286 and 0.067 mg/L, respectively,
indicating that PACl coagulant had 77% less total aluminum residuals than
alum.
During Jar Test 1, most residual aluminum (average 86%) presented in
dissolved form when alum was dosed at 5 and 10 mg/L. However, this
phenomenon was not observed with PACl results.
On average, PACl generated about 67% less dissolved aluminum residuals
than alum.
Figure 5. Turbidity results in Jar Test 1
On average, PACl had 77% lower turbidity than alum, showing higher
treatment efficiency.
The optimal alum dose was determined to be 10 mg/L for the subsequent
pilot tests since it achieved the lowest dissolved residual aluminum level
and turbidity. The WTP was dosing an average of 7-8 mg/L of alum in their
process.
0.00
0.20
0.40
0.60
0.80
1.00
1.20
Alum PACl
Turb
idit
y (N
TU)
5 mg/L of Coagulant 10 mg/L of Coagulant 15 mg/L of Coagulant
10
The diminishing return point of 5 mg/L was selected as the optimal PACl
dose for the pilot testing. The PACl dose was minimized to reduce
chemical costs.
3.1.2 Effect of Mixing
Jar Tests 2 and 3 were conducted to evaluate the impact of mixing on the
generation of aluminum residuals derived from the addition of alum and PACl,
respectively. During the jar tests, the lake water collected from the WTP was
dosed with alum (Jar Test 2) or PACl (Jar Test 3) at its optimal dose that was
previously determined from Jar Test 1. For each jar test, 0-15 minutes of
flocculation (at 20 rpm) was examined in Jars 1-3 followed by 30 minutes of
sedimentation (at 0 rpm), whereas Jars 4-6 had 1 minute of rapid mixing (at 100
rpm) prior to the 0-15 minutes of flocculation and 30 minutes of sedimentation.
Therefore, the effect of no rapid mixing was observed in Jars 1-3.
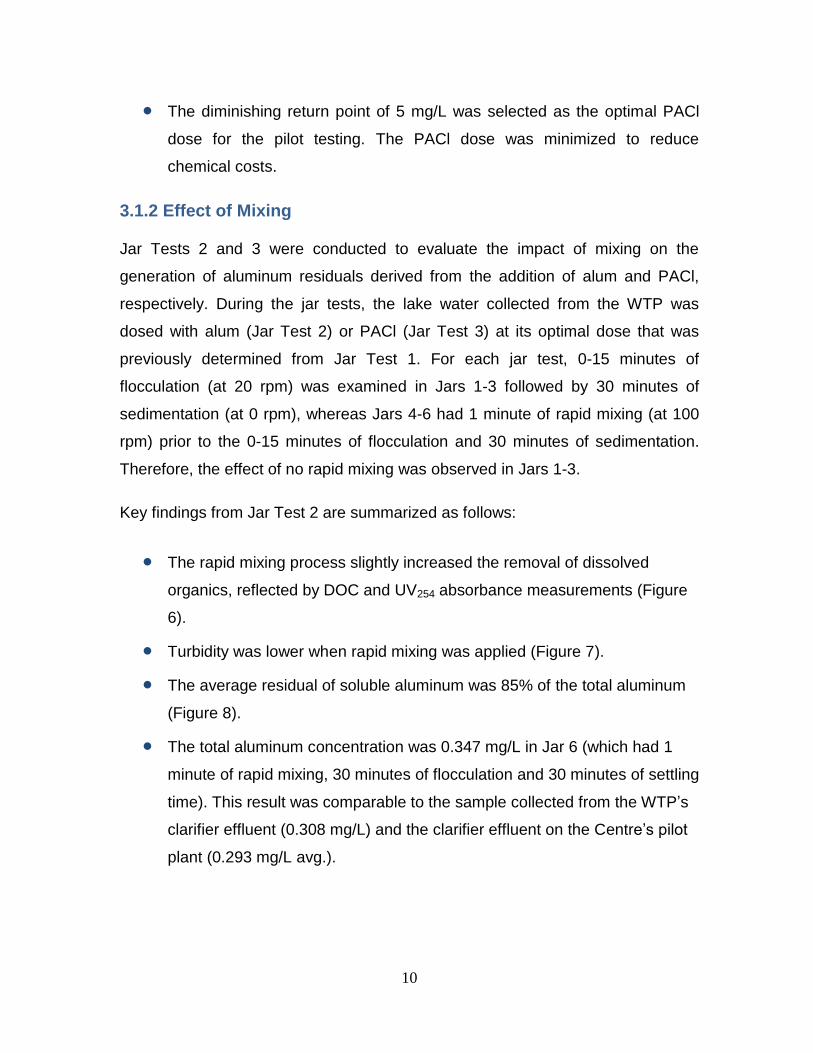
Key findings from Jar Test 2 are summarized as follows:
The rapid mixing process slightly increased the removal of dissolved
organics, reflected by DOC and UV254 absorbance measurements (Figure
6).
Turbidity was lower when rapid mixing was applied (Figure 7).
The average residual of soluble aluminum was 85% of the total aluminum
(Figure 8).
The total aluminum concentration was 0.347 mg/L in Jar 6 (which had 1
minute of rapid mixing, 30 minutes of flocculation and 30 minutes of settling
time). This result was comparable to the sample collected from the WTP’s
clarifier effluent (0.308 mg/L) and the clarifier effluent on the Centre’s pilot
plant (0.293 mg/L avg.).

Figure 6. Dissolved organic matter levels in Jar Test 2: A) DOC, and B) UV254
Absorbance
Figure 7. Turbidity results in Jar Test 2
0.0
0.5
1.0
1.5
2.0
2.5
3.0
0 15 30
DO
C (
mg
/L)
Flocculation Time (minutes)
Without Rapid Mixing With Rapid Mixing
A
0.00
0.01
0.02
0.03
0.04
0.05
0.06
0.07
0.08
0 15 30
UV
25
4 A
bso
rban
ce
(c
m-1
)
Flocculation Time (minutes)
Without Rapid Mixing With Rapid Mixing
0.0
0.5
1.0
1.5
2.0
2.5
0 15 30
Tu
rbid
ity (
NT
U)
Flocculation Time (minutes)
Without Rapid Mixing With Rapid Mixing
B

12
Figure 8. Aluminum residuals in Jar Test 2
Similarly, Jar Test 3 was conducted to see the effect of mixing on various water
quality parameters using PACl.
The following observations were made:
UV254 absorbance measurements determined that the tests with rapid
mixing and flocculation could achieve a higher removal of dissolved
organics. However, there was no effect observed on DOC levels (Figure 9).
Turbidity was significantly lowered by rapid mixing and flocculation;
specifically, 1 minute rapid mixing and 15-30 minutes of flocculation (Figure
10).
Aluminum residuals were similar in all jars (Figure 11).
0.00
0.05
0.10
0.15
0.20
0.25
0.30
0.35
0.40
Total Dissolved Total Dissolved
Without Rapid Mixing With Rapid Mixing
Alu
min
um
Re
sid
ua
l (m
g/L
)
0 min Flocculation 15 min Flocculation 30 min Flocculation
13
Figure 9. Dissolved organic matter levels in Jar Test 2: A) DOC, and B) UV254
absorbance
Figure 10. Turbidity results in Jar Test 2
0.0
0.5
1.0
1.5
2.0
2.5
3.0
0 15 30
DO
C (
mg
/L)
Flocculation Time (minutes)
Without Rapid Mixing With Rapid Mixing
0.00
0.01
0.02
0.03
0.04
0.05
0.06
0.07
0.08
0 15 30
UV
25
4 A
bso
rban
ce
(c
m-1
)
Flocculation Time (minutes)
Without Rapid Mixing With Rapid Mixing
0.0
0.5
1.0
1.5
2.0
2.5
3.0
0 15 30
Tu
rbid
ity (
NT
U)
Flocculation Time (minutes)
Without Rapid Mixing With Rapid Mixing
B A

14
Figure 11. Aluminum residuals in Jar Test 2
Overall, Jar Test 2 (alum) showed positive effects on turbidity reduction, while Jar
Test 3 (PACl) showed positive effects on turbidity and UV254 absorbance
reduction. Although the effect of mixing coagulant is said to increase efficiency
and decrease residual aluminum concentration in treated water, jar testing did not
show overwhelming evidence of this.
3.1.3 Effect of pH on aluminum residuals
Jar Test 4 evaluated the effect of lowering pH on the concentration of aluminum
residuals.
The following observations were obtained from Jar Test 4:
Concentrations of total residual aluminum were similar in all jars in spite of
a change in pH. However, dissolved aluminum residuals showed a
significant difference (Figure 12).
Dissolved aluminum levels ranged from 0.307 mg/L without pH adjustment
(pH 7.93) to 0.016 mg/L with pH adjustment (pH 6.97).
0.00
0.05
0.10
0.15
0.20
0.25
0.30
0.35
Total Dissolved Total Dissolved
Without Rapid Mixing With Rapid Mixing
Alu
min
um
Re
sid
ua
l (m
g/L
)
0 min Flocculation 15 min Flocculation 30 min Flocculation

15
The results indicated a 95% reduction in dissolved aluminum
concentrations and also complied with regulatory guidelines (≤0.1 mg/L of
aluminum, Ontario MOE, 2003).
Unfiltered samples collected from the jar tester showed 0.312 - 0.321 mg/L
of total residual aluminum; aluminum particulate would most likely be
reduced in the plant’s filtration process.
Figure 12. Effect of pH on aluminum residuals
The reduction of pH also showed a positive effect on turbidity removal
(Figure 13). Although the graph did not provide a clear trend, the
relationship is clear that turbidity is reduced with the pH of the water,
increasing the coagulation efficacy.
Reducing the pH had a positive effect on the reduction of dissolved
organics in terms of UV254 absorbance and DOC measurements (Figure
14).
0.00
0.05
0.10
0.15
0.20
0.25
0.30
0.35
6.8 7 7.2 7.4 7.6 7.8 8
Alu
min
um
Re
sid
ua
l (m
g/L
)
pH
Total Aluminum Residual Dissolved Aluminum Residual

16
Figure 13. Effect of pH on turbidity
Figure 14. Effect of pH on DOC and UV254 absorbance
Reducing pH is a viable option to control residual aluminum and has positive
effects on turbidity, UV254 absorbance and DOC removal. However, adjusting the
water’s pH may generate additional issues including the following:
0.0
0.2
0.4
0.6
0.8
1.0
1.2
1.4
1.6
1.8
2.0
6.8 7.0 7.2 7.4 7.6 7.8 8.0
Tu
rbid
ity (
NT
U)
pH
0.068
0.070
0.072
0.074
0.076
0.078
0.080
0.082
2.6
2.7
2.8
2.9
3.0
3.1
3.2
6.8 7 7.2 7.4 7.6 7.8 8
UV
25
4 A
bso
rban
ce
(c
m-1
)
DO
C (
mg
/L)
pH
DOC UV254 Absorbance

17
If pH is lowered during treatment, it must be raised again before entering
the distribution system to provide adequate corrosion control. Lowering pH
may result in increased corrosion of pipes that are cast iron, lead, zinc, or
asbestos cement (Health Canada, 2015).
DBPs, such as trihalomethanes (THMs) and haloacetic acids (HAAs), are
formed depending on the level of organic matter in the water and the
interaction between organics and chlorine. Decreasing the pH would
reduce THM formation, but HAA formation may increase. HAAs are not yet
regulated in Ontario; however, it is planned to be implemented in January
2020 (O. Reg. 169/03).
Adjusting water pH during treatment increases operational costs as it
increases chemical use and complexity of the operation.
Reduction of pH may increase nitrification issues in the distribution system.

3.2 Pilot Testing Results
3.2.1 Effect of PACl vs. Alum in Pilot Testing Experiments
Pilot testing experiments were conducted as per Table 1. Figure 15 demonstrates
the levels of residual aluminum for each treatment stage.
Figure 15. Residual aluminum concentrations during pilot testing (O.G.
represents Operational Guideline [Ontario MOE, 2003])
The following observations were noted during pilot testing:
The raw water total aluminum concentration was measured at the
Centre as 0.001 - 0.036 mg/L. However, the onsite measurement of the
raw water total aluminum residual was 0.045 mg/L. The difference in
analysis method and techniques could have contributed to a higher
aluminum residual found in treated water at the WTP.
In the clarifier of the pilot plant, both coagulants increased total and
dissolved aluminum residuals. However, on average, PACl had 42%
lower total aluminum residual and 38% lower dissolved aluminum
residual than alum.
0.00
0.05
0.10
0.15
0.20
0.25
0.30
0.35
Alum PACl Alum PACl
Raw Water Clarifier Anthracite/Sand Filter
Alu
min
um
(m
g/L
)
Total Aluminum Dissolved Aluminum
O.G. = 0.1 mg/L

19
The dual media (anthracite/sand) filter located on the train using PACl
showed significantly lower dissolved aluminum concentrations (74% on
average) compared to the one with alum.
On average, the dual media filters were able to remove 32% (from
0.317 mg/L to 0.184 mg/L) and 68% (from 0.214 mg/L to 0.068 mg/L) of
total aluminum from the alum and PACl trains, respectively, as PACl is
a polymerized product and capable of forming larger flocs which tend to
entrap in filters.
3.2.2 Organics Removal
During pilot testing, the organic removal capabilities of PACl and alum coagulants
were also evaluated. Figure 16 presents the effect of alum and PACl coagulation
on UV254 absorbance during pilot testing. On average, the PACl train had 21%
and 22% lower UV254 absorbance readings than the alum train in clarifier effluent
and filter effluent, respectively.
Figure 16. UV254 absorbance readings of each treatment stage in the pilot testing
process (n=4)
0.00
0.01
0.02
0.03
0.04
0.05
0.06
0.07
0.08
0.09
0.10
Alum PACl Alum PACl
Raw Water Clarifier Anthracite/Sand Filter
UV
25
4 A
bso
rban
ce
(c
m-1
)
20
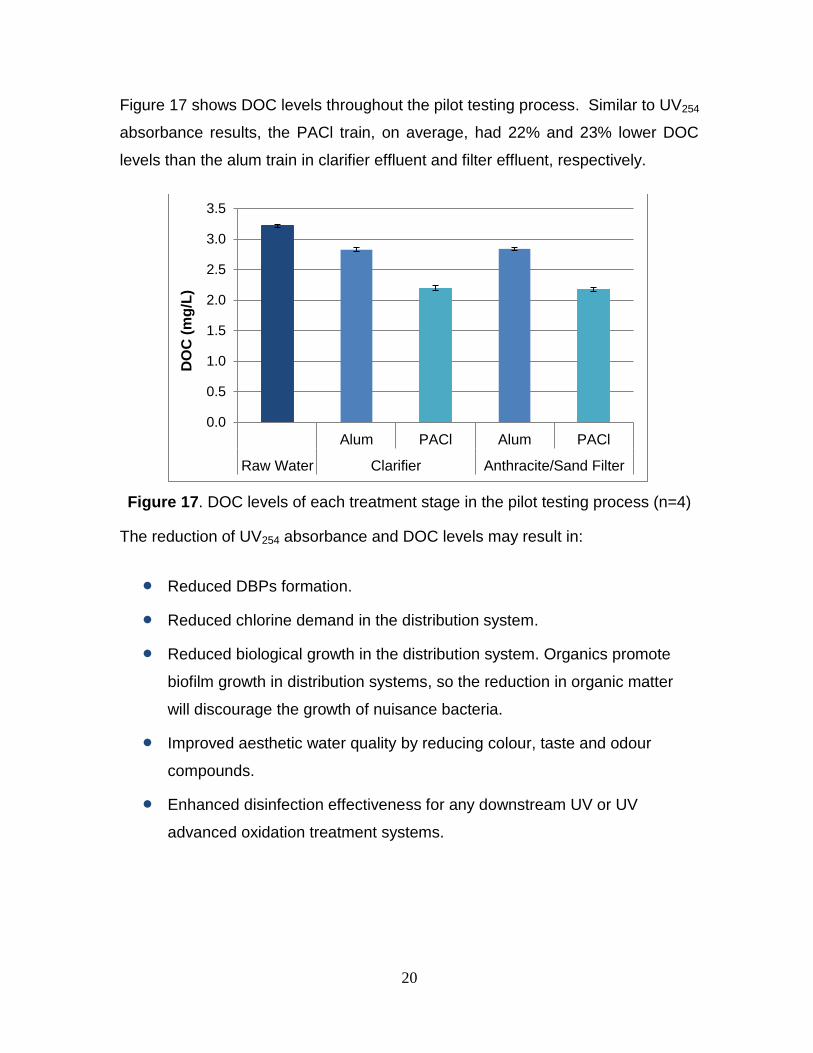
Figure 17 shows DOC levels throughout the pilot testing process. Similar to UV254
absorbance results, the PACl train, on average, had 22% and 23% lower DOC
levels than the alum train in clarifier effluent and filter effluent, respectively.
Figure 17. DOC levels of each treatment stage in the pilot testing process (n=4)
The reduction of UV254 absorbance and DOC levels may result in:
Reduced DBPs formation.
Reduced chlorine demand in the distribution system.
Reduced biological growth in the distribution system. Organics promote
biofilm growth in distribution systems, so the reduction in organic matter
will discourage the growth of nuisance bacteria.
Improved aesthetic water quality by reducing colour, taste and odour
compounds.
Enhanced disinfection effectiveness for any downstream UV or UV
advanced oxidation treatment systems.
0.0
0.5
1.0
1.5
2.0
2.5
3.0
3.5
Alum PACl Alum PACl
Raw Water Clarifier Anthracite/Sand Filter
DO
C (
mg
/L)
21
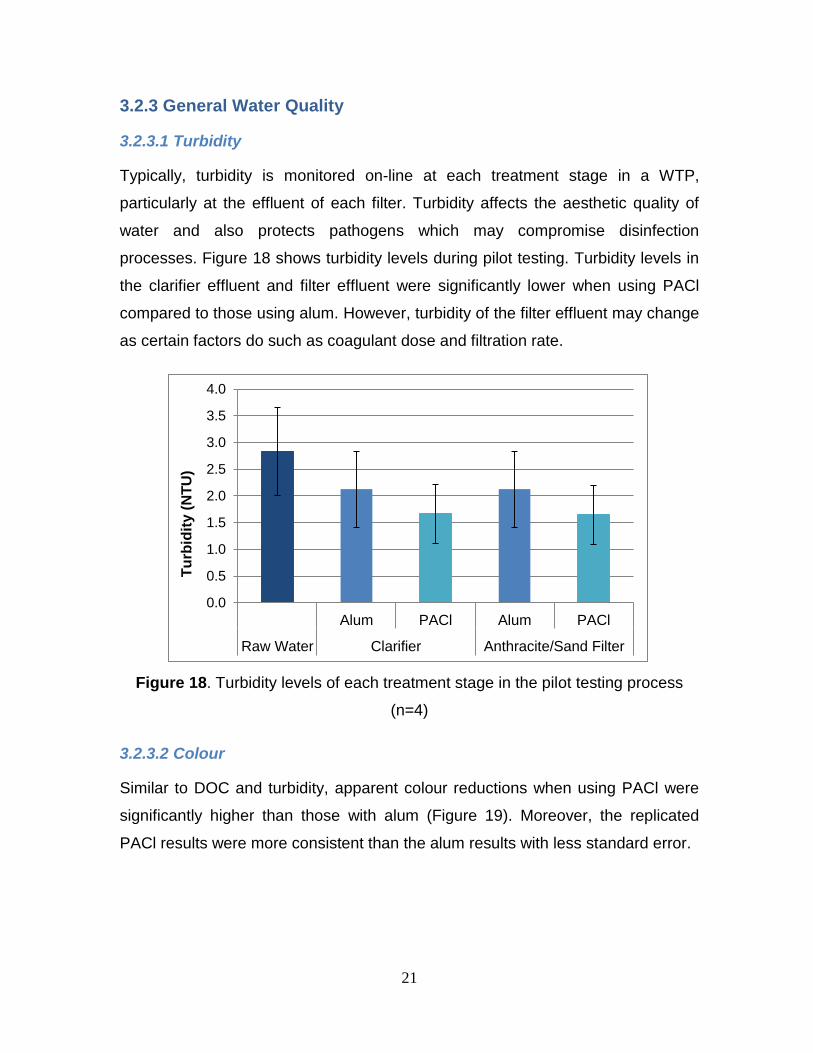
3.2.3 General Water Quality
3.2.3.1 Turbidity
Typically, turbidity is monitored on-line at each treatment stage in a WTP,
particularly at the effluent of each filter. Turbidity affects the aesthetic quality of
water and also protects pathogens which may compromise disinfection
processes. Figure 18 shows turbidity levels during pilot testing. Turbidity levels in
the clarifier effluent and filter effluent were significantly lower when using PACl
compared to those using alum. However, turbidity of the filter effluent may change
as certain factors do such as coagulant dose and filtration rate.
Figure 18. Turbidity levels of each treatment stage in the pilot testing process
(n=4)
3.2.3.2 Colour
Similar to DOC and turbidity, apparent colour reductions when using PACl were
significantly higher than those with alum (Figure 19). Moreover, the replicated
PACl results were more consistent than the alum results with less standard error.
0.0
0.5
1.0
1.5
2.0
2.5
3.0
3.5
4.0
Alum PACl Alum PACl
Raw Water Clarifier Anthracite/Sand Filter
Tu
rbid
ity (
NT
U)

22
Figure 19. Apparent colour levels of each treatment stage in the pilot testing
process (n=4)
3.2.3.3 Alkalinity
PACl and alum slightly reduced the water alkalinity during the
coagulation/flocculation processes (Figure 20). However, no significant difference
was obtained with alkalinity reduction using either alum and PACl.
Figure 20. Alkalinity levels of each treatment stage in the pilot testing process
(n=4)
0
10
20
30
40
50
60
Alum PACl Alum PACl
Raw Water Clarifier Anthracite/Sand Filter
Ap
pa
ren
t C
olo
r (P
t-C
o)
0
50
100
150
200
250
300
Alum PACl Alum PACl
Raw Water Clarifier Anthracite/Sand Filter
Alk
ali
nit
y (
mg
/L a
s C
aC
O3)
23
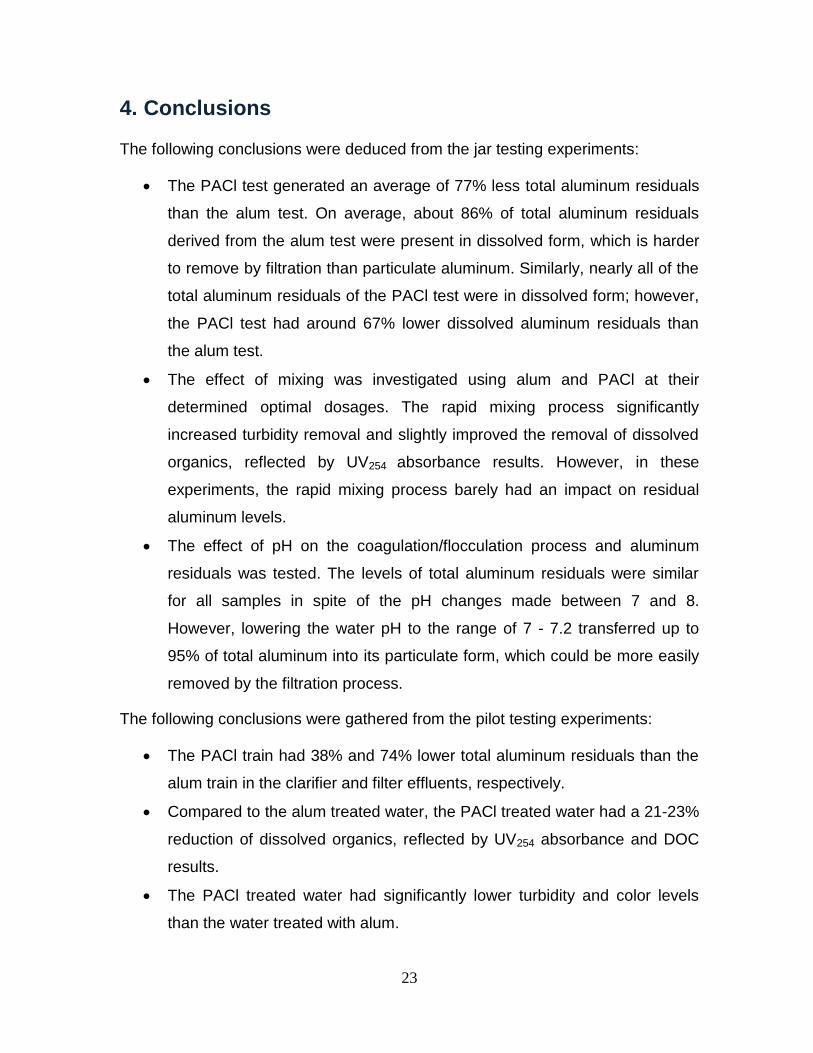
4. Conclusions
The following conclusions were deduced from the jar testing experiments:
The PACl test generated an average of 77% less total aluminum residuals
than the alum test. On average, about 86% of total aluminum residuals
derived from the alum test were present in dissolved form, which is harder
to remove by filtration than particulate aluminum. Similarly, nearly all of the
total aluminum residuals of the PACl test were in dissolved form; however,
the PACl test had around 67% lower dissolved aluminum residuals than
the alum test.
The effect of mixing was investigated using alum and PACl at their
determined optimal dosages. The rapid mixing process significantly
increased turbidity removal and slightly improved the removal of dissolved
organics, reflected by UV254 absorbance results. However, in these
experiments, the rapid mixing process barely had an impact on residual
aluminum levels.
The effect of pH on the coagulation/flocculation process and aluminum
residuals was tested. The levels of total aluminum residuals were similar
for all samples in spite of the pH changes made between 7 and 8.
However, lowering the water pH to the range of 7 - 7.2 transferred up to
95% of total aluminum into its particulate form, which could be more easily
removed by the filtration process.
The following conclusions were gathered from the pilot testing experiments:
The PACl train had 38% and 74% lower total aluminum residuals than the
alum train in the clarifier and filter effluents, respectively.
Compared to the alum treated water, the PACl treated water had a 21-23%
reduction of dissolved organics, reflected by UV254 absorbance and DOC
results.
The PACl treated water had significantly lower turbidity and color levels
than the water treated with alum.

References
Health Canada. (1998). Guidelines for Canadian Drinking Water Quality:
Guideline Technical Document – Aluminum. Retrieved on Oct. 31, 2018
from https://www.canada.ca/en/health-
canada/services/publications/healthy-living/guidelines-canadian-drinking-
water-quality-guideline-technical-document-aluminum.html
Health Canada. (2008). Health Canada Review of Dietary Exposure to Aluminum.
Retrieved on Oct. 31, 2018 from https://www.canada.ca/en/health-
canada/services/food-nutrition/food-safety/food-additives/review-dietary-
exposure-aluminum.html
Health Canada. (2015). Guidelines for Canadian Drinking Water Quality:
Guideline Technical Document – pH. Retrieved on Nov. 27, 2018 from
https://www.canada.ca/en/health-canada/services/publications/healthy-
living/guidelines-canadian-drinking-water-quality-guideline-technical-
document-ph.html
Ontario Drinking Water Quality Standards (Standard No. O. Reg. 169/03).
Ontario MOE [Ontario Ministry of the Environment]. (2003). Technical Support
Document for Ontario Drinking Water Standards, Objectives and
Guidelines (Document Number: PIBS 4449e01). Retrieved on Oct. 31,
2018 from https://cvc.ca/wp-content/uploads/2011/03/std01_079707.pdf
WHO [World Health Organization]. (1998). Aluminum in Drinking-water.
Background document for development of WHO Guidelines for Drinking-
water Quality. Retrieved on Oct. 31, 2018 from
http://apps.who.int/iris/bitstream/handle/10665/75362/WHO_SDE_WSH_0
3.04_53_eng.pdf?sequence=1

25