Embed Size (px)
Citation preview
Pilot StudySurvey Highlightsincluding BSM Model
FinScope Small BusinessTM
Gauteng 2006
1
Small businesses have been identified as powering anincrease in South Africa’s economic growth.
The National Small Business Act and the Acceleratedand Shared Growth Initiative of South Africa (AsgiSA)are two initiatives intended to bridge the gap betweenthe first and second economies and to address theinequalities that exist therein.
The related government strategy is broadly to:
■ curb unemployment through job creation,■ alleviate poverty, and■ redistribute wealth.
Resolving issues such as access to finance, preferentialprocurement, effective communication with, andsupport of small enterprises is critical for achieving thesector’s potential.
Despite government’s efforts to increase support tosmall business in the past two years, the SMMEBusiness Confidence Index, a survey of SMMEperceptions, suggests that these initiatives are notworking well.
Reliable and accurate information about smallbusinesses is lacking, and this makes assessing andservicing these diverse entities extremely difficult.
To assist in rectifying this, the Gauteng EnterprisePropeller (GEP) and the FinMark Trust commissionedAfrican Response to research the small business sectorin Gauteng.
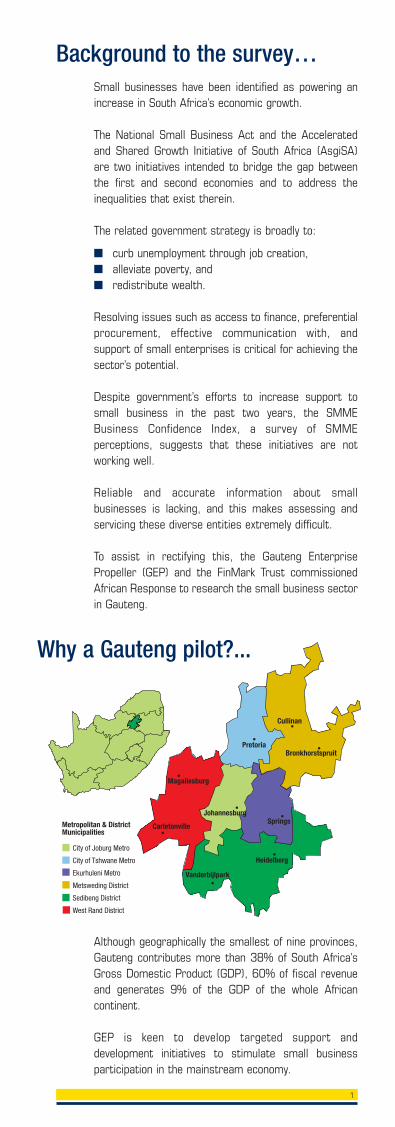
Although geographically the smallest of nine provinces,Gauteng contributes more than 38% of South Africa’sGross Domestic Product (GDP), 60% of fiscal revenueand generates 9% of the GDP of the whole Africancontinent.
GEP is keen to develop targeted support anddevelopment initiatives to stimulate small businessparticipation in the mainstream economy.
Background to the survey…
Why a Gauteng pilot?...
City of Joburg Metro
City of Tshwane Metro
Ekurhuleni Metro
Metsweding District
Sedibeng District
West Rand District
Magaliesburg
Carletonville
JohannesburgSprings
Heidelberg
Vanderbijlpark
PretoriaBronkhorstspruit
Cullinan
Metropolitan & DistrictMunicipalities
2
The survey is intended to deliver a comprehensiveunderstanding of the small business market in Gauteng,through:
■ Market sizing and benchmarking:– Quantifying the small business market– Understanding the market and potential for
growth– Facilitating year-on-year tracking
■ Effective market segmentation:– Understanding entrepreneurs – Determining the impetus to become a small
business owner– Identifying success and failure drivers – Developing a continuum of small businesses
through effective identification of marketsegments
– Enhancing the identification of opportunities forinnovation in service and product provision tosmall businesses
– Determining policy and regulation impacts
■ Market needs analysis:– Determining the extent of access to finance and
the related issues– Measuring the impact of support initiatives and
government assistance– Informing policy and regulation– Determining the role of education and training
in the business success cycle – Understanding the competitiveness elements in
the sector
Survey objectives…

3
The study was funded and supported by the followingentities:
These parties co-operated and gave of their time,insights and knowledge in the strategic intent,questionnaire design and feedback processes of thesurvey’s development.
The intention is that the findings will inform new smallbusiness sector development initiatives and innovationswithin both government and the private sector.
Survey sponsors…
ENTERPRISE INDUSTRYDEVELOPMENT DIVISION
SOUTH AFRICA
4
Challenges in establishing the best method of samplingwere:
– being able to determine a scientifically valid universeof small businesses from which to select thedesired sample profile
– the complexity in determining an agreed definition ofsmall business, compounded by the myriad ofexisting terminology and classifications of “smallbusiness”
– enabling robust weighting of the findings toprovincial level (Gauteng) and ensuring that thesampling methodology would be valid for a possiblenational survey
The sample design for the survey was informed andguided by Professor DJ Stoker and the Human SciencesResearch Council.
Sampling methodology…The challenge
A mixed household and enterprise survey approach wasused.
The Household survey approach An area stratified probability sample of 6 000 adultswas taken. Of all Enumerator Areas (EAs) listed inGauteng, 600 were selected with probability proportionalto the estimated number of households in each EA.Twelve dwelling sites were systematically chosen fromeach EA to allow for refusals and non-contacts.
In each selected household, a responsible adult, eitherthe main income earner, head of household, or anothersenior household member was chosen.
In the 6 000 households sampled, 12 422 adult contactinterviews were conducted. Demographic informationwas gathered about all adult household members.
Special attention was paid to work status as well as togeneral household data. The demographic informationwas necessary to weight the dataset to the Gautengadult population.
A screening questionnaire ensured the identification ofhousehold members who had their own small business.The questionnaire also sought to clarify which householdmembers worked in the same small business orbusinesses and those members that had one or moresmall enterprises.
The Enterprise survey approach After the household screening survey was completed inthe relevant dwellings, an enterprise survey to identifysmall businesses was conducted amongst eligiblerespondents.
The solution
5
Weighting the findings…
Small Business Sample Summary
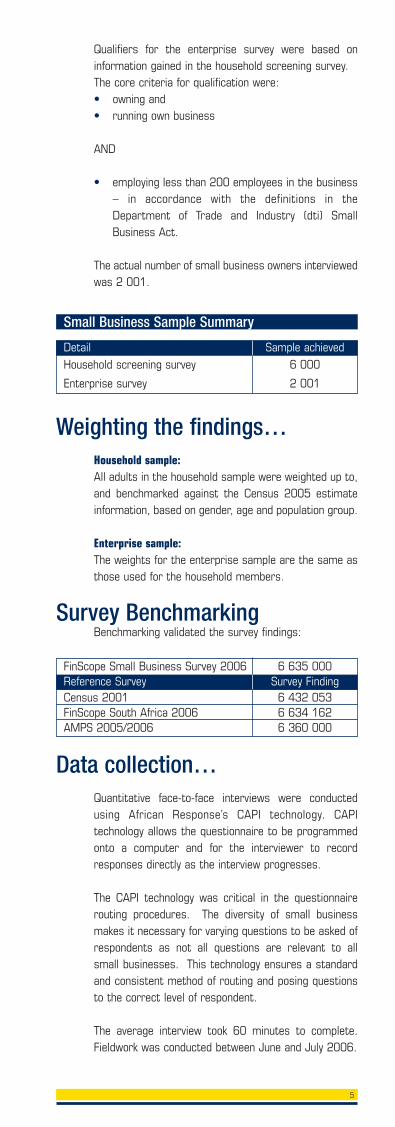
Qualifiers for the enterprise survey were based oninformation gained in the household screening survey. The core criteria for qualification were:• owning and • running own business
AND
• employing less than 200 employees in the business– in accordance with the definitions in theDepartment of Trade and Industry (dti) SmallBusiness Act.
The actual number of small business owners interviewedwas 2 001.
Household sample:All adults in the household sample were weighted up to,and benchmarked against the Census 2005 estimateinformation, based on gender, age and population group.
Enterprise sample:The weights for the enterprise sample are the same asthose used for the household members.
Data collection…Quantitative face-to-face interviews were conductedusing African Response’s CAPI technology. CAPItechnology allows the questionnaire to be programmedonto a computer and for the interviewer to recordresponses directly as the interview progresses.
The CAPI technology was critical in the questionnairerouting procedures. The diversity of small businessmakes it necessary for varying questions to be asked ofrespondents as not all questions are relevant to allsmall businesses. This technology ensures a standardand consistent method of routing and posing questionsto the correct level of respondent.
The average interview took 60 minutes to complete.Fieldwork was conducted between June and July 2006.
Survey Benchmarking
Detail Sample achievedHousehold screening survey 6 000
Enterprise survey 2 001
Reference Survey Survey FindingFinScope Small Business Survey 2006 6 635 000
Census 2001 6 432 053FinScope South Africa 2006 6 634 162AMPS 2005/2006 6 360 000
Benchmarking validated the survey findings:
6
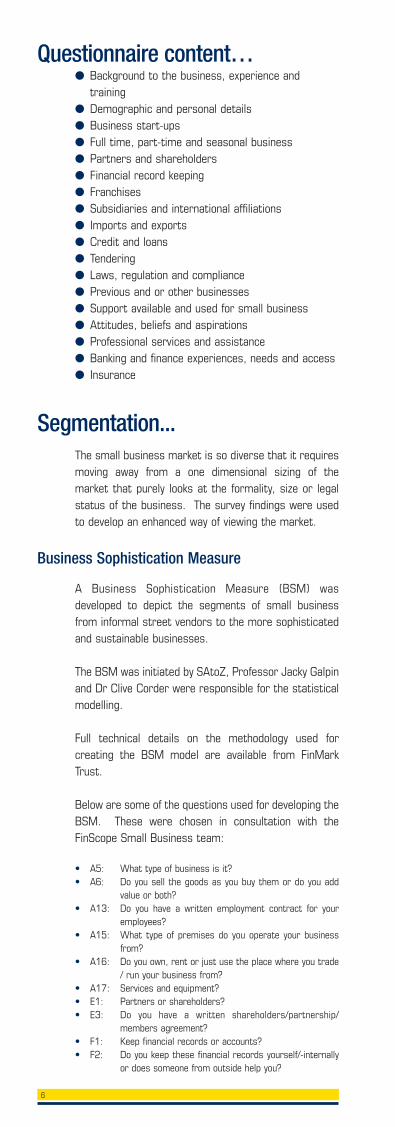
Questionnaire content…● Background to the business, experience and
training● Demographic and personal details● Business start-ups● Full time, part-time and seasonal business● Partners and shareholders● Financial record keeping ● Franchises ● Subsidiaries and international affiliations● Imports and exports● Credit and loans● Tendering● Laws, regulation and compliance● Previous and or other businesses● Support available and used for small business● Attitudes, beliefs and aspirations ● Professional services and assistance● Banking and finance experiences, needs and access● Insurance
Segmentation...
A Business Sophistication Measure (BSM) wasdeveloped to depict the segments of small businessfrom informal street vendors to the more sophisticatedand sustainable businesses.
The BSM was initiated by SAtoZ, Professor Jacky Galpinand Dr Clive Corder were responsible for the statisticalmodelling.
Full technical details on the methodology used forcreating the BSM model are available from FinMarkTrust.
Below are some of the questions used for developing theBSM. These were chosen in consultation with theFinScope Small Business team:
• A5: What type of business is it? • A6: Do you sell the goods as you buy them or do you add
value or both?• A13: Do you have a written employment contract for your
employees?• A15: What type of premises do you operate your business
from? • A16: Do you own, rent or just use the place where you trade
/ run your business from?• A17: Services and equipment?• E1: Partners or shareholders?• E3: Do you have a written shareholders/partnership/
members agreement?• F1: Keep financial records or accounts?• F2: Do you keep these financial records yourself/-internally
or does someone from outside help you?
Business Sophistication Measure
The small business market is so diverse that it requiresmoving away from a one dimensional sizing of themarket that purely looks at the formality, size or legalstatus of the business. The survey findings were usedto develop an enhanced way of viewing the market.

7
• F3: Are your financial records audited?• G1: Is this business a franchise? • H1: Is your company/business a subsidiary/part of another
company?• H2: Do you have any affiliations with international
companies?• I.1: Do you do any business/trade with anyone outside South
Africa?• I.3: Import/export/both?• J1: Offer goods or services on credit?• J2: Credit management?• L1: Pay taxes?• L3: Compliance with acts?• P2: Business functions handled by staff?• Q2: Banks used?• Q9: Type of banking services?• Q16: Do you have any loans for your business?• Q17: From where did you get the loan?• Q20: Types of insurance paid for by the business?
■ Attitudinal factors and certain financial behaviourswere used to develop a psychographicsegmentation. Full details will be available once therelationship with the BSM has been defined.
Psychographic segmentation
■ The survey established that Gauteng Province hasan adult population (16+) of 6 635 000
■ Total number of small business owners in Gautengis estimated at 1 053 818
■ This means that approximately 1 in 6 individuals areinvolved in small business
Survey highlights…
Economic and social contribution…
MARKET SIZE
Segment size:Informal businesses64%673 576
Segment size:Unregistered individuals18%195 250
Segment size:Registered businesses17%184 992
THE CLASSIFICATION OF SMALL BUSINESS■ Traditional classification of small business is
typically “informal”; “unregistered” and “registered”business. This broad-banding, underpins the needfor enhanced segmentation to support effectivemarket analysis
■ The BSM brings new insights and finer classifications
8
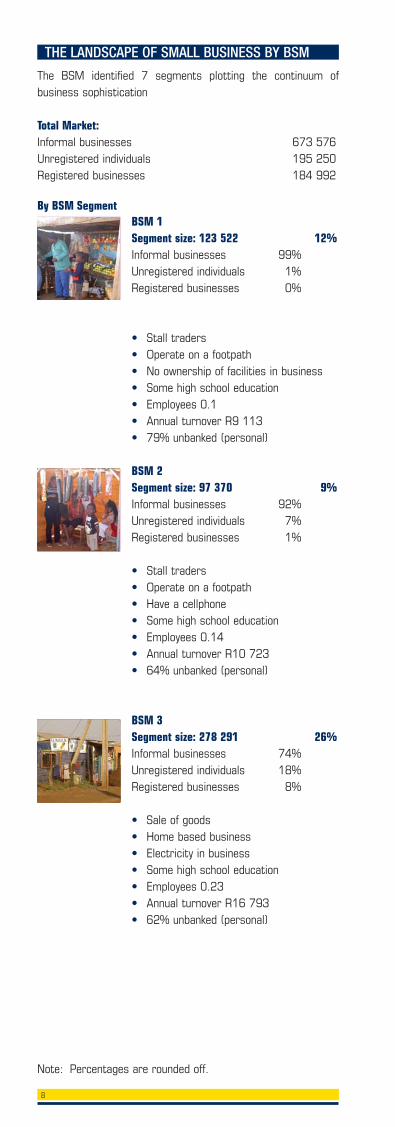
THE LANDSCAPE OF SMALL BUSINESS BY BSM
The BSM identified 7 segments plotting the continuum ofbusiness sophistication
Total Market:Informal businesses 673 576Unregistered individuals 195 250Registered businesses 184 992
BSM 1Segment size: 123 522 12%Informal businesses 99%Unregistered individuals 1%Registered businesses 0%
• Stall traders• Operate on a footpath• No ownership of facilities in business• Some high school education • Employees 0.1• Annual turnover R9 113• 79% unbanked (personal)
BSM 2Segment size: 97 370 9%Informal businesses 92%Unregistered individuals 7%Registered businesses 1%
• Stall traders• Operate on a footpath• Have a cellphone • Some high school education • Employees 0.14• Annual turnover R10 723 • 64% unbanked (personal)
BSM 3Segment size: 278 291 26%Informal businesses 74%Unregistered individuals 18%Registered businesses 8%
• Sale of goods• Home based business • Electricity in business • Some high school education • Employees 0.23• Annual turnover R16 793• 62% unbanked (personal)
By BSM Segment
Note: Percentages are rounded off.
9
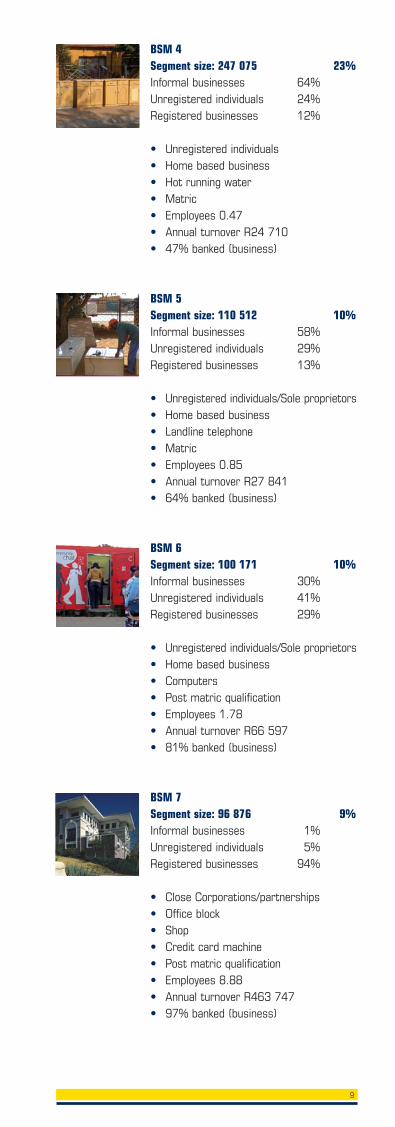
BSM 4Segment size: 247 075 23%Informal businesses 64%Unregistered individuals 24%Registered businesses 12%
• Unregistered individuals• Home based business • Hot running water • Matric • Employees 0.47• Annual turnover R24 710• 47% banked (business)
BSM 5Segment size: 110 512 10%Informal businesses 58%Unregistered individuals 29%Registered businesses 13%
• Unregistered individuals/Sole proprietors• Home based business• Landline telephone• Matric• Employees 0.85• Annual turnover R27 841• 64% banked (business)
BSM 6Segment size: 100 171 10%Informal businesses 30%Unregistered individuals 41%Registered businesses 29%
• Unregistered individuals/Sole proprietors• Home based business • Computers • Post matric qualification • Employees 1.78• Annual turnover R66 597 • 81% banked (business)
BSM 7Segment size: 96 876 9%Informal businesses 1%Unregistered individuals 5%Registered businesses 94%
• Close Corporations/partnerships• Office block • Shop • Credit card machine • Post matric qualification • Employees 8.88• Annual turnover R463 747 • 97% banked (business)
10
EMPLOYMENT LANDSCAPE
Formalemployment
Unemployed
Informalemployment
Student
Pensioner
Housewife/house husband
Other
41
23
16
10
7
3
1
(n=629)%
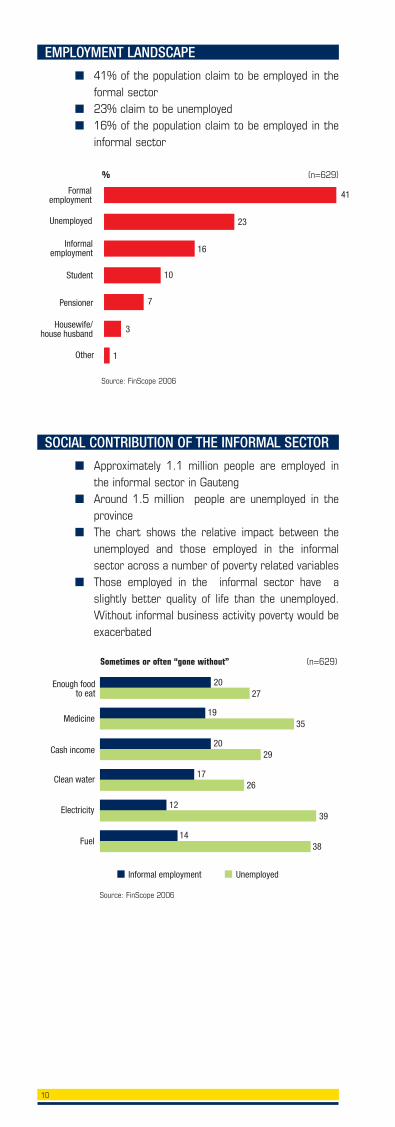
■ 41% of the population claim to be employed in theformal sector
■ 23% claim to be unemployed■ 16% of the population claim to be employed in the
informal sector
SOCIAL CONTRIBUTION OF THE INFORMAL SECTOR
Informal employment
20Enough foodto eat
Medicine
Cash income
Clean water
Electricity
Fuel
Unemployed
27
1935
2029
1726
1239
1438
(n=629)Sometimes or often “gone without”
■ Approximately 1.1 million people are employed inthe informal sector in Gauteng
■ Around 1.5 million people are unemployed in theprovince
■ The chart shows the relative impact between theunemployed and those employed in the informalsector across a number of poverty related variables
■ Those employed in the informal sector have aslightly better quality of life than the unemployed.Without informal business activity poverty would beexacerbated
Source: FinScope 2006
Source: FinScope 2006
11
SMALL BUSINESS OWNERS BY POPULATION GROUP
100%
90%
80%
70%
60%
50%
40%
30%
20%
10%
0%
Black Coloured Indian White
BSM1 BSM2 BSM3 BSM4 BSM5 BSM6 BSM7
100 99 10091 89
68
27
3
7
634
277
4
3151
1
(n=2001)
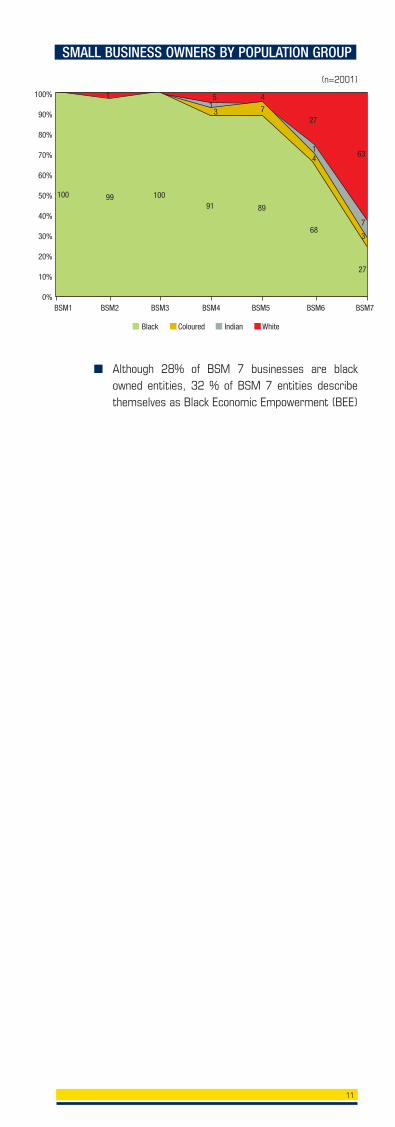
■ Although 28% of BSM 7 businesses are blackowned entities, 32 % of BSM 7 entities describethemselves as Black Economic Empowerment (BEE)
12
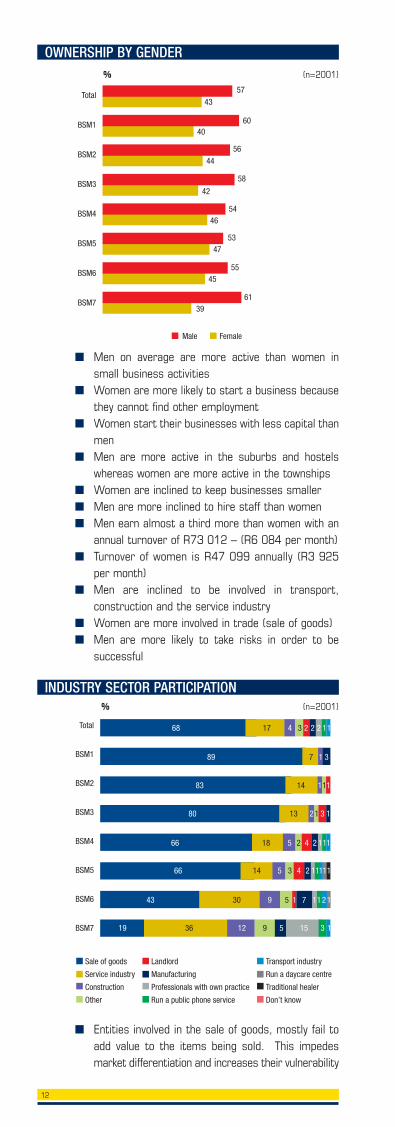
■ Men on average are more active than women insmall business activities
■ Women are more likely to start a business becausethey cannot find other employment
■ Women start their businesses with less capital thanmen
■ Men are more active in the suburbs and hostelswhereas women are more active in the townships
■ Women are inclined to keep businesses smaller ■ Men are more inclined to hire staff than women■ Men earn almost a third more than women with an
annual turnover of R73 012 – (R6 084 per month)■ Turnover of women is R47 099 annually (R3 925
per month)■ Men are inclined to be involved in transport,
construction and the service industry■ Women are more involved in trade (sale of goods)■ Men are more likely to take risks in order to be
successful
OWNERSHIP BY GENDER
INDUSTRY SECTOR PARTICIPATION
Total
BSM1
BSM2
BSM3
BSM4
BSM5
BSM6
BSM7
Male Female
57
43
6040
56
44
58
42
5446
5347
5545
6139
■ Entities involved in the sale of goods, mostly fail toadd value to the items being sold. This impedesmarket differentiation and increases their vulnerability
(n=2001)%
Total
BSM1
BSM2
BSM3
BSM4
BSM5
BSM6
BSM7
Sale of goods
Service industry
Construction
Other
Landlord
Manufacturing
Professionals with own practice
Run a public phone service
Transport industry
Run a daycare centre
Traditional healer
Don’t know
68 17 4 3 2 2 2 11
89 7 1 3
83 14 111
80 13 2 1 3 1
66 18 5 2 4 2 111
66 14 5 3 4 2 11 11 1
43 30 9 5 1 7 11 21
19 36 12 9 5 15 3 1
(n=2001)%
13
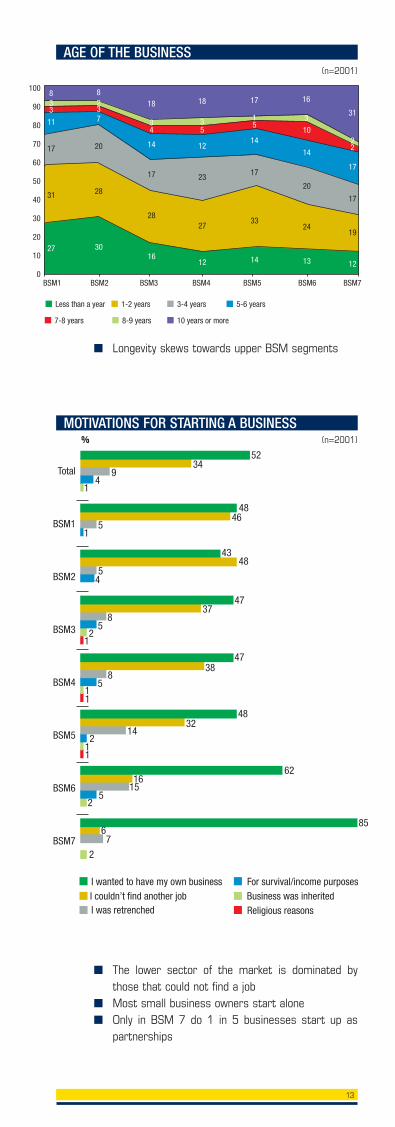
■ The lower sector of the market is dominated bythose that could not find a job
■ Most small business owners start alone ■ Only in BSM 7 do 1 in 5 businesses start up as
partnerships
AGE OF THE BUSINESS
MOTIVATIONS FOR STARTING A BUSINESS
100
90
80
70
60
50
40
30
20
10
0BSM1 BSM2 BSM3 BSM4 BSM5 BSM6 BSM7
Less than a year 1-2 years 3-4 years 5-6 years
7-8 years 8-9 years 10 years or more
833
17
31
27
823
20
28
30
18
34
14
17
28
16
18
35
12
23
27
12
17
15
14
17
33
14
16
3
10
14
20
24
13
31
22
17
17
19
12
11 7
(n=2001)
Total
BSM1
BSM2
BSM3
BSM4
BSM5
BSM6
BSM7
5234
9
14
4846
51
4348
54
4737
85
21
4738
85
11
4832
142
11
6216
155
2
856
7
2
I couldn’t find another jobI wanted to have my own business For survival/income purposes
I was retrenched Religious reasonsBusiness was inherited
(n=2001)%
■ Longevity skews towards upper BSM segments
14
MOTIVATION FOR BUSINESS START-UP
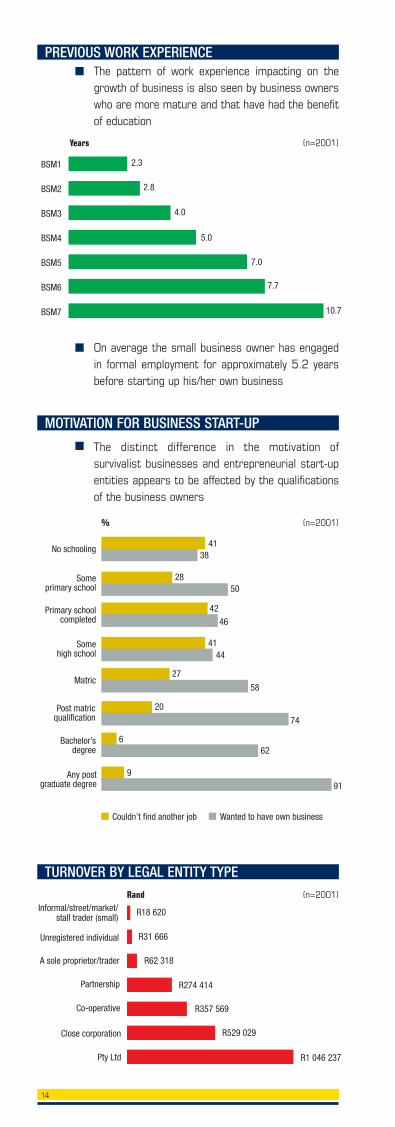
■ On average the small business owner has engagedin formal employment for approximately 5.2 yearsbefore starting up his/her own business
■ The distinct difference in the motivation ofsurvivalist businesses and entrepreneurial start-upentities appears to be affected by the qualificationsof the business owners
■ The pattern of work experience impacting on thegrowth of business is also seen by business ownerswho are more mature and that have had the benefitof education
PREVIOUS WORK EXPERIENCE
BSM1
BSM2
BSM3
BSM4
BSM5
BSM6
BSM7
2.3
2.8
4.0
5.0
7.0
7.7
10.7
(n=2001)Years
Couldn’t find another job
No schooling41
38
Someprimary school
Primary schoolcompleted
Somehigh school
Matric
Post matricqualification
Bachelor’sdegree
Any postgraduate degree
2850
4246
4144
27
58
20
74
662
991
Wanted to have own business
(n=2001)%
Informal/street/market/stall trader (small)
Unregistered individual
A sole proprietor/trader
Partnership
Co-operative
Close corporation
R18 620
R31 666
R62 318
R274 414
R357 569
R529 029
Pty Ltd R1 046 237
(n=2001)Rand
TURNOVER BY LEGAL ENTITY TYPE
15
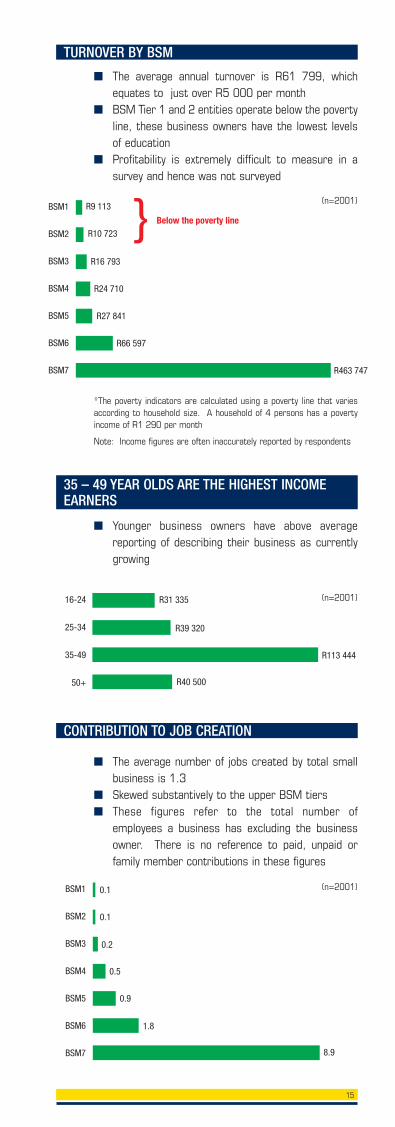
■ The average annual turnover is R61 799, whichequates to just over R5 000 per month
■ BSM Tier 1 and 2 entities operate below the povertyline, these business owners have the lowest levelsof education
■ Profitability is extremely difficult to measure in asurvey and hence was not surveyed
*The poverty indicators are calculated using a poverty line that variesaccording to household size. A household of 4 persons has a povertyincome of R1 290 per month
Note: Income figures are often inaccurately reported by respondents
TURNOVER BY BSM
CONTRIBUTION TO JOB CREATION
35 – 49 YEAR OLDS ARE THE HIGHEST INCOMEEARNERS
■ Younger business owners have above averagereporting of describing their business as currentlygrowing
■ The average number of jobs created by total smallbusiness is 1.3
■ Skewed substantively to the upper BSM tiers ■ These figures refer to the total number of
employees a business has excluding the businessowner. There is no reference to paid, unpaid orfamily member contributions in these figures
BSM1
BSM2
BSM3
BSM4
BSM5
BSM6
BSM7
R9 113
R10 723
R16 793
R24 710
R27 841
R66 597
R463 747
} Below the poverty line
(n=2001)
16-24
25-34
35-49
50+
R31 335
R39 320
R113 444
R40 500
(n=2001)
BSM1
BSM2
BSM3
BSM4
BSM5
BSM6
BSM7
0.1
0.1
0.2
0.5
0.9
1.8
8.9
(n=2001)
16
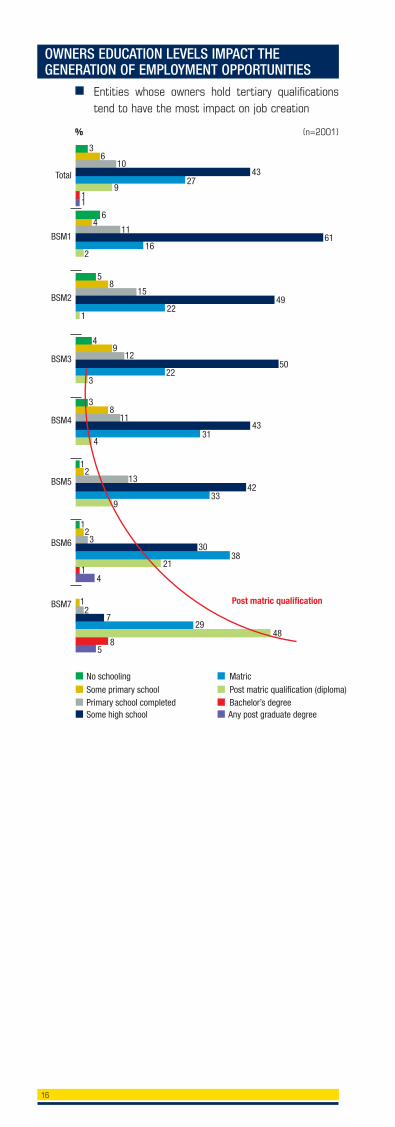
OWNERS EDUCATION LEVELS IMPACT THEGENERATION OF EMPLOYMENT OPPORTUNITIES
Total
BSM1
BSM2
BSM3
BSM4
BSM5
BSM6
BSM7
3
Matric
Post matric qualification (diploma)Bachelor’s degree
No schooling
Some primary schoolPrimary school completedSome high school
106
4327
911
64
1161
162
58
1549
221
49
1250
223
38
1143
314
21
1342
339
21
330
3821
14
21
729
488
5
Any post graduate degree
Post matric qualification
(n=2001)%
■ Entities whose owners hold tertiary qualificationstend to have the most impact on job creation
17
16-24
25-34
35-49
50+
0.76
0.80
2.30
0.81
(n=2001)Average number of employed
BSM1
BSM2
BSM3
BSM4
BSM5
BSM6
BSM7
3
1
4
11
12
21
55
(n=2001)%
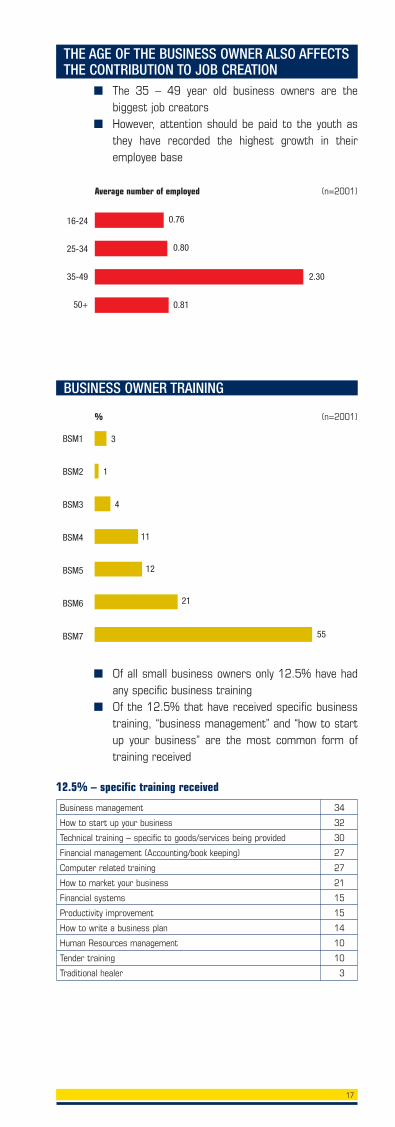
THE AGE OF THE BUSINESS OWNER ALSO AFFECTSTHE CONTRIBUTION TO JOB CREATION
■ The 35 – 49 year old business owners are thebiggest job creators
■ However, attention should be paid to the youth asthey have recorded the highest growth in theiremployee base
Business management 34
How to start up your business 32
Technical training – specific to goods/services being provided 30
Financial management (Accounting/book keeping) 27
Computer related training 27
How to market your business 21
Financial systems 15
Productivity improvement 15
How to write a business plan 14
Human Resources management 10
Tender training 10
Traditional healer 3
BUSINESS OWNER TRAINING
12.5% – specific training received
■ Of all small business owners only 12.5% have hadany specific business training
■ Of the 12.5% that have received specific businesstraining, “business management” and “how to startup your business” are the most common form oftraining received
18
Citizenship No Citizenship
Total
BSM1
BSM2
92
8
73
27
919
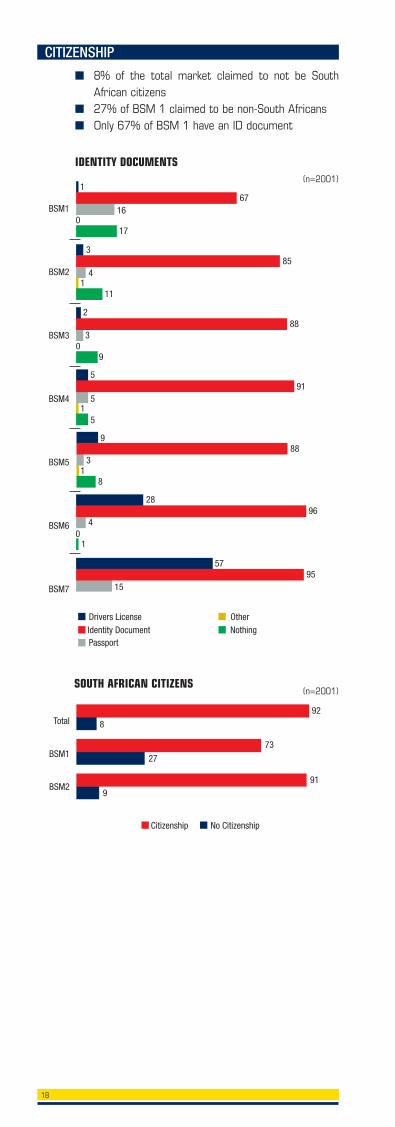
(n=2001)SOUTH AFRICAN CITIZENS
BSM1
BSM2
BSM3
BSM4
BSM5
BSM6
BSM7
1
Identity DocumentDrivers License Other
PassportNothing
6716
17
385
41
11
288
3
9
591
5
51
988
3
81
2896
4
1
5795
15
0
0
0
(n=2001)
IDENTITY DOCUMENTS
CITIZENSHIP
■ 8% of the total market claimed to not be SouthAfrican citizens
■ 27% of BSM 1 claimed to be non-South Africans ■ Only 67% of BSM 1 have an ID document
19
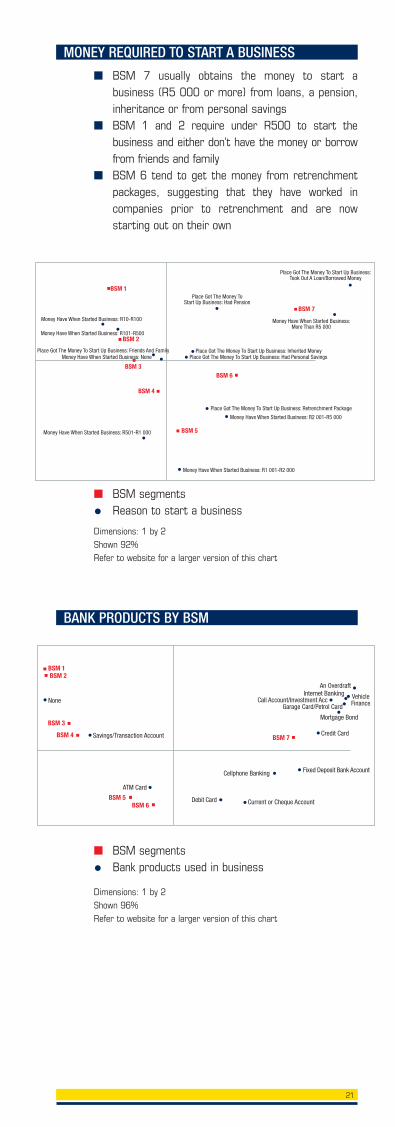
With one in six adults in Gauteng engaged in smallbusiness activity, supporting small businesses shouldclearly be a policy priority.
A small proportion of small businesses are likely to beengines of employment creation. Only registeredbusinesses (around 180 000 by number) are likely to beemployers, employing on average five people each.Given Gauteng’s importance to South Africa’s economy,this is a critically important segment whose needsshould be carefully analysed.
Special focus should be on the needs andcharacteristics of the 200 000 businesses in BSM 5and 6, the “zone of transition”, where businesses movefrom sole trader status into employment-generatingentities of greater sophistication. This is also wherebusiness owners start to say they would not prefer a jobin the formal sector but would rather stay with theirbusinesses.
Many more small businesses are engaged in businessto make ends meet. While half of small businessesmake between R1 300 and R2 000 per month, a fifth ofall small businesses are making between R750 andR900 per month. Life for these “breadline businesses”must be considered to be precarious in the extreme.Very few of these business owners also receive a socialgrant.
Comparing FinScope Small Business with FinScope SA2005 and 2006, it is possible to speculate that therehas been a significant upswing in the number of smallbusinesses between 2005 and 2006 – perhaps by asmany as 200 000.
Immigrants may well account for a significant proportionof these.
Non-South African (SA) individuals are responsible for88 000 of Gauteng’s small businesses (of which 66000are trading businesses). It is likely that this number ismuch higher as respondents may not have wanted todisclose their non-SA status. This poses a challenge forgovernment, with the need to balance economicinterests and the protection of citizens interests.
Although trading businesses (i.e. sale of goods) accountfor almost two-thirds of all small businesses in Gauteng,there are also 10 times more services businesses thanmanufacturing businesses. The question is whether thisis a function of the structure of Gauteng’s economy, withits high numbers of established larger businesses andsalaried employees requiring services, or becausemanufacturing businesses typically need more start-upcapital and this has not been available.
Considerations – Economic and socialcontributions
20
■ Access to finance remains one of the most criticalhindrances to the further development of theinformal sector
■ Broad-based economic growth and povertyreduction lies in offering diversity in the financialsystem rather than offering traditional formalbanking only
■ Currently, banks are servicing the upper sector ofthe small business market only with a wide varietyof products. The lower end of the market is onlyusing a savings product
■ Business owners are looking for financial servicesthat are conveniently located and are prepared tobank with whoever will accept them
■ The incidence of loans and borrowing from theformal financial sector is low
■ Family and friends are the main source of financialborrowing
■ Most small businesses claim to require a minimalamount of money for start-up. This start-up capitaldoes not come from the formal financial sector
Access to Finance
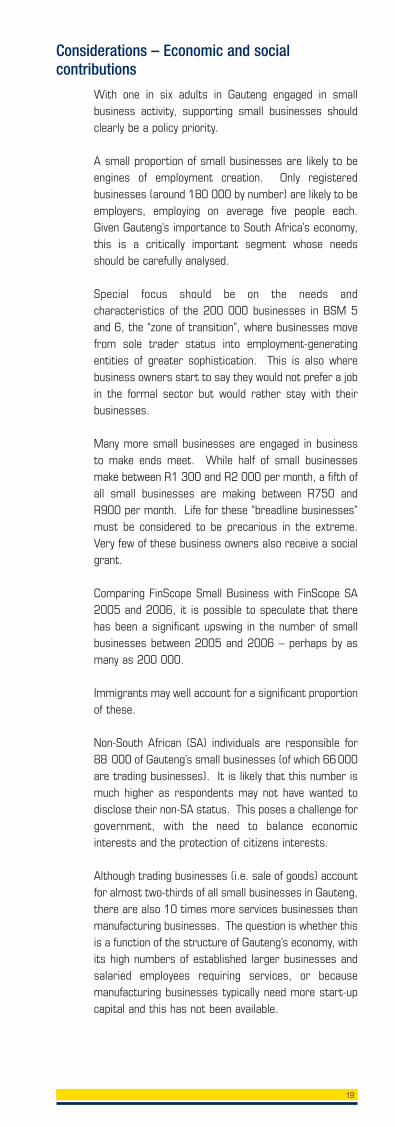
BANKING STATUS
■ The survey shows that the lower BSM segmentsstarting from BSM 1 are able to open personal bankaccounts – this is usually a savings account
■ Business accounts are only really significantly inevidence from BSM 5 and above
BSM1
BSM2
BSM3
BSM4
BSM5
BSM6
BSM7
Personal banked Personal unbanked
79
6436
6238
3070
1882
892
100
21
(n=629)% PERSONAL BANK ACCOUNT
BSM1
BSM2
BSM3
BSM4
BSM5
BSM6
BSM7
Business banked Business unbanked
100
8713
7723
5347
3664
1981
397
(n=629)% BUSINESS BANK ACCOUNT
21
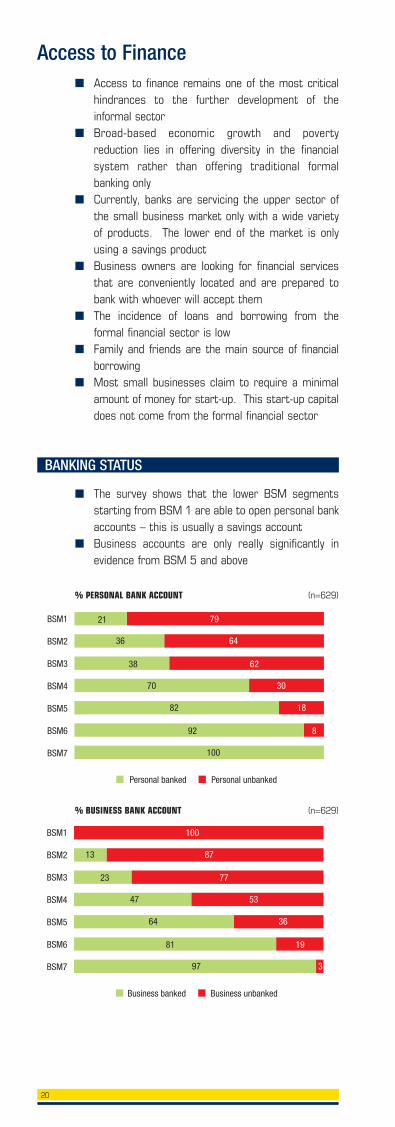
■ BSM segments
• Bank products used in business
Dimensions: 1 by 2Shown 96%Refer to website for a larger version of this chart
BANK PRODUCTS BY BSM
None
BSM 1
Savings/Transaction Account
ATM Card
Debit Card Current or Cheque Account
Cellphone Banking Fixed Deposit Bank Account
Credit Card
Call Account/Investment Acc
Mortgage Bond
Garage Card/Petrol Card
Internet Banking VehicleFinance
An Overdraft
BSM 2
BSM 3
BSM 4
BSM 5BSM 6
BSM 7
■ BSM 7 usually obtains the money to start abusiness (R5 000 or more) from loans, a pension,inheritance or from personal savings
■ BSM 1 and 2 require under R500 to start thebusiness and either don’t have the money or borrowfrom friends and family
■ BSM 6 tend to get the money from retrenchmentpackages, suggesting that they have worked incompanies prior to retrenchment and are nowstarting out on their own
■ BSM segments
• Reason to start a business
Dimensions: 1 by 2Shown 92%Refer to website for a larger version of this chart
MONEY REQUIRED TO START A BUSINESS
Money Have When Started Business: R10-R100
Money Have When Started Business: R101-R500
Place Got The Money To Start Up Business: Friends And FamilyMoney Have When Started Business: None
Money Have When Started Business: R501-R1 000
Place Got The Money ToStart Up Business: Had Pension
Place Got The Money To Start Up Business:Took Out A Loan/Borrowed Money
Money Have When Started Business:More Than R5 000
Place Got The Money To Start Up Business: Inherited MoneyPlace Got The Money To Start Up Business: Had Personal Savings
Place Got The Money To Start Up Business: Retrenchment Package
Money Have When Started Business: R2 001-R5 000
Money Have When Started Business: R1 001-R2 000
BSM 6
BSM 2
BSM 7
BSM 3
BSM 4
BSM 5
BSM 1
22
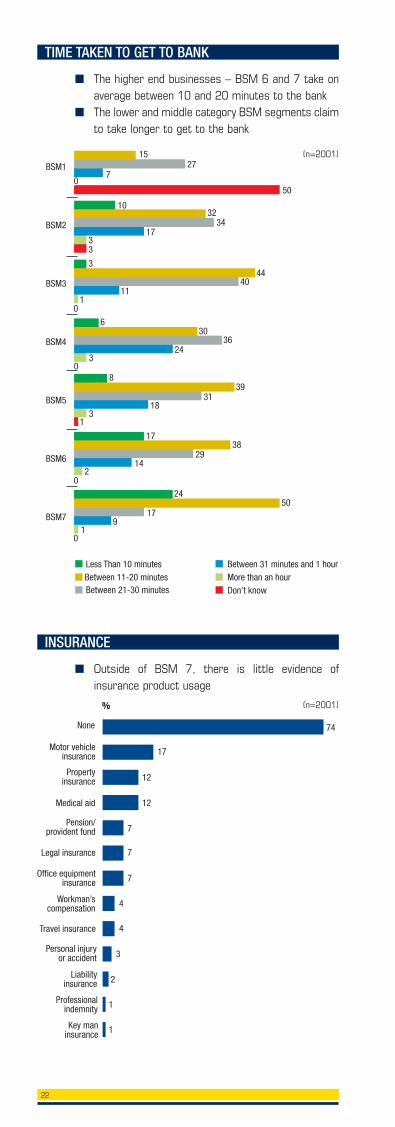
■ The higher end businesses – BSM 6 and 7 take onaverage between 10 and 20 minutes to the bank
■ The lower and middle category BSM segments claimto take longer to get to the bank
TIME TAKEN TO GET TO BANK
BSM1
BSM2
BSM3
BSM4
BSM5
BSM6
BSM7
15
Between 11-20 minutesLess Than 10 minutes Between 31 minutes and 1 hour
Between 21-30 minutes Don’t knowMore than an hour
277
50
1032
3417
33
344
4011
1
630
3624
3
839
3118
31
1738
2914
2
2450
179
1
0
0
0
0
0
(n=2001)
■ Outside of BSM 7, there is little evidence ofinsurance product usage
INSURANCE
74None
Motor vehicleinsurance
Propertyinsurance
Medical aid
Pension/provident fund
Legal insurance
Office equipmentinsurance
Workman’scompensation
Travel insurance
Personal injuryor accident
Liabilityinsurance
Professionalindemnity
Key maninsurance
17
12
12
7
7
7
4
4
3
2
1
1
(n=2001)%
23
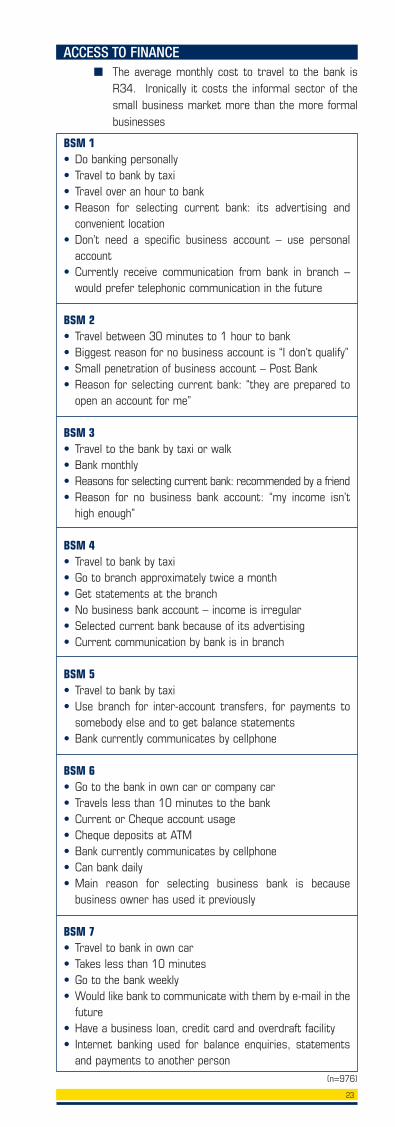
■ The average monthly cost to travel to the bank isR34. Ironically it costs the informal sector of thesmall business market more than the more formalbusinesses
BSM 1• Do banking personally• Travel to bank by taxi• Travel over an hour to bank• Reason for selecting current bank: its advertising and
convenient location• Don’t need a specific business account – use personal
account• Currently receive communication from bank in branch –
would prefer telephonic communication in the future
BSM 2• Travel between 30 minutes to 1 hour to bank• Biggest reason for no business account is “I don’t qualify”• Small penetration of business account – Post Bank• Reason for selecting current bank: “they are prepared to
open an account for me”
BSM 3• Travel to the bank by taxi or walk• Bank monthly• Reasons for selecting current bank: recommended by a friend• Reason for no business bank account: “my income isn’t
high enough”
BSM 4• Travel to bank by taxi• Go to branch approximately twice a month• Get statements at the branch• No business bank account – income is irregular• Selected current bank because of its advertising• Current communication by bank is in branch
BSM 5• Travel to bank by taxi• Use branch for inter-account transfers, for payments to
somebody else and to get balance statements• Bank currently communicates by cellphone
BSM 6• Go to the bank in own car or company car• Travels less than 10 minutes to the bank• Current or Cheque account usage• Cheque deposits at ATM• Bank currently communicates by cellphone• Can bank daily• Main reason for selecting business bank is because
business owner has used it previously
BSM 7• Travel to bank in own car• Takes less than 10 minutes• Go to the bank weekly• Would like bank to communicate with them by e-mail in the
future• Have a business loan, credit card and overdraft facility• Internet banking used for balance enquiries, statements
and payments to another person
ACCESS TO FINANCE
(n=976)
24
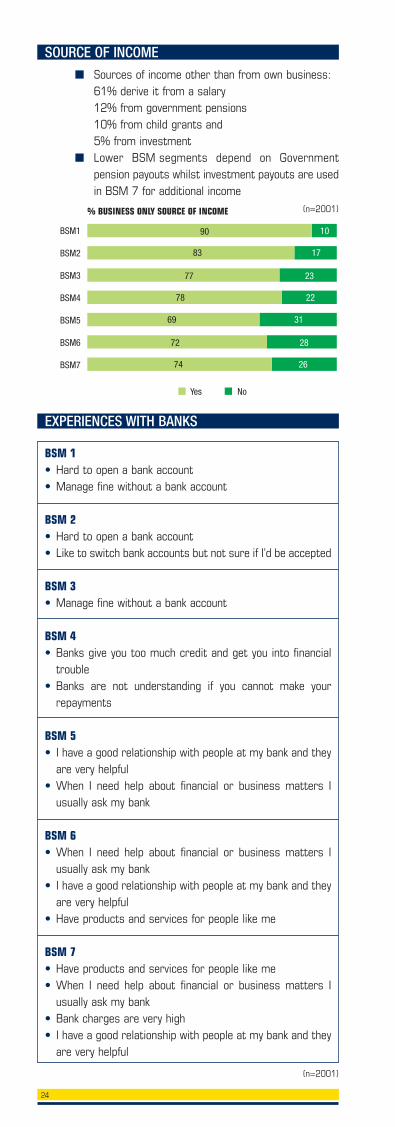
EXPERIENCES WITH BANKS
BSM 1• Hard to open a bank account• Manage fine without a bank account
BSM 2• Hard to open a bank account• Like to switch bank accounts but not sure if I’d be accepted
BSM 3• Manage fine without a bank account
BSM 4• Banks give you too much credit and get you into financial
trouble• Banks are not understanding if you cannot make your
repayments
BSM 5• I have a good relationship with people at my bank and they
are very helpful• When I need help about financial or business matters I
usually ask my bank
BSM 6• When I need help about financial or business matters I
usually ask my bank• I have a good relationship with people at my bank and they
are very helpful• Have products and services for people like me
BSM 7• Have products and services for people like me• When I need help about financial or business matters I
usually ask my bank• Bank charges are very high• I have a good relationship with people at my bank and they
are very helpful
(n=2001)
SOURCE OF INCOME
■ Sources of income other than from own business:61% derive it from a salary12% from government pensions10% from child grants and5% from investment
■ Lower BSM segments depend on Governmentpension payouts whilst investment payouts are usedin BSM 7 for additional income
BSM1
BSM2
BSM3
BSM4
BSM5
BSM6
BSM7
Yes No
10
1783
2377
2278
3169
2872
74
90
26
(n=2001)% BUSINESS ONLY SOURCE OF INCOME
25
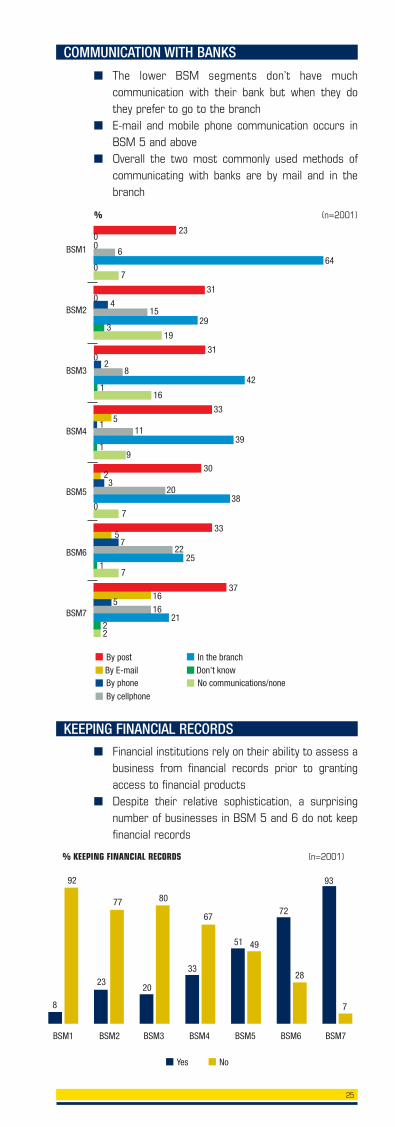
COMMUNICATION WITH BANKS
■ The lower BSM segments don’t have muchcommunication with their bank but when they dothey prefer to go to the branch
■ E-mail and mobile phone communication occurs inBSM 5 and above
■ Overall the two most commonly used methods ofcommunicating with banks are by mail and in thebranch
BSM1
BSM2
BSM3
BSM4
BSM5
BSM6
BSM7
By E-mailBy post
By phone
23
By cellphone
Don’t knowIn the branch
No communications/none
664
7
31
415
293
19
31
28
421
16
335
111
391
9
302
320
38
7
335
722
25
71
3716
516
2122
00
0
0
0
0
(n=2001)%
■ Financial institutions rely on their ability to assess abusiness from financial records prior to grantingaccess to financial products
■ Despite their relative sophistication, a surprisingnumber of businesses in BSM 5 and 6 do not keepfinancial records
Yes
BSM1
92
BSM2
No
BSM3 BSM4 BSM5 BSM6 BSM7
8
77
23
80
20
67
33
4951
28
72
7
93
(n=2001)% KEEPING FINANCIAL RECORDS
KEEPING FINANCIAL RECORDS
26
Credit extension to Gauteng’s small businesses isextremely low – so low, in fact, that it raises questionsabout whether the banks will achieve their commitmentsunder the Financial Sector Charter.
While accessing credit is unlikely to be the primaryrequirement for most small businesses, only 27% ofunbanked small businesses claim that they do not needa bank at all.
The desire for banking services is therefore real formost small businesses and a relationship based on arange of basic banking products (cash deposits, balanceenquiries, account payments to suppliers etc) could leadto credit extension in the future.
The need for capital is again cited as a primaryconstraint, even among trading businesses whosecapital requirements are very low.
This can be read in a number of ways:
– Businesses are undercapitalised from the start andcannot support debt
– Small business owners are making a rational choiceand not seeking bank debt or
– Banks are being too restrictive in their lendingpolicies.
Considerations – Access to finance
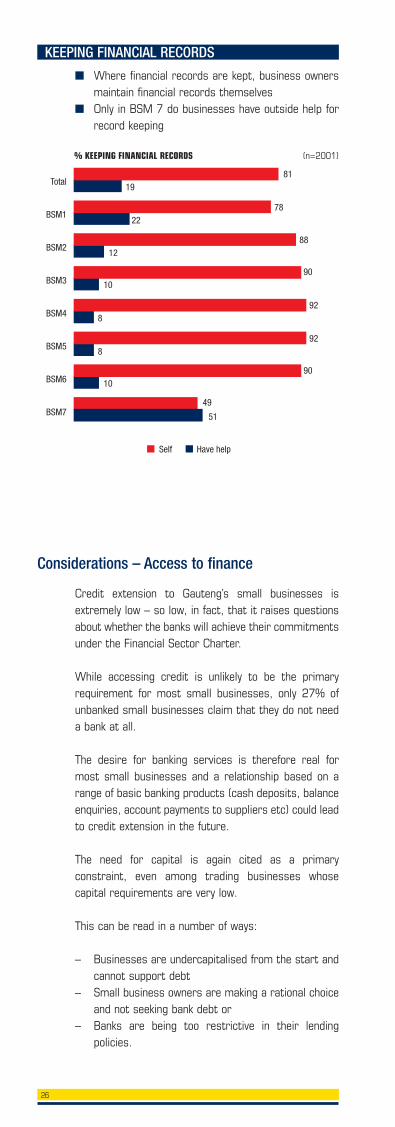
KEEPING FINANCIAL RECORDS
■ Where financial records are kept, business ownersmaintain financial records themselves
■ Only in BSM 7 do businesses have outside help forrecord keeping
Self Have help
Total
BSM1
BSM2
BSM3
BSM4
BSM5
BSM6
BSM7
8119
7822
8812
9010
928
928
9010
49
51
(n=2001)% KEEPING FINANCIAL RECORDS
27
Although about 120 000 small business said theyneeded start-up capital of more than R5 000, mostsmall businesses said they needed much less. Thesevery small sums suggest that the provision of capitalthrough formal sources (such as banks or venturecapital) may not be an appropriate focus. Only 2% saidthey took out a loan to start their business.
Government should rather seek to stimulate the supplyof capital from friends and family (easily the biggestsource of start-up capital after own savings).
Tax incentives could boost the number of newbusinesses formed and also the type of businesses,perhaps skew investment towards more substantive(and employment generative) businesses.
It is noteworthy that the percentage of small businesspeople who are unbanked in Gauteng is higher than thepercentage of unbanked individuals in Gauteng.
Why is this, when the needs of even basic smallbusinesses are likely to be more complex than the needsof many individuals? The opportunity for banks is surelythat, even if small business people are simply embracedas individual banking clients, they are likely to be moreprofitable as they will transact more.
Attitudes to banks are generally positive suggesting apotentially favourable market environment forappropriately structured services. Generally, smallbusiness owners consider that it is not difficult to opena bank account and that they have a good relationshipwith their bank. Only a third consider bank charges tobe “very high”.
Attitudes to technology are contradictory. There is amarked preference to communicate with the bank usinga cellphone, but there is also a relatively high use atpresent of bank branches, even for balance enquiries.
28
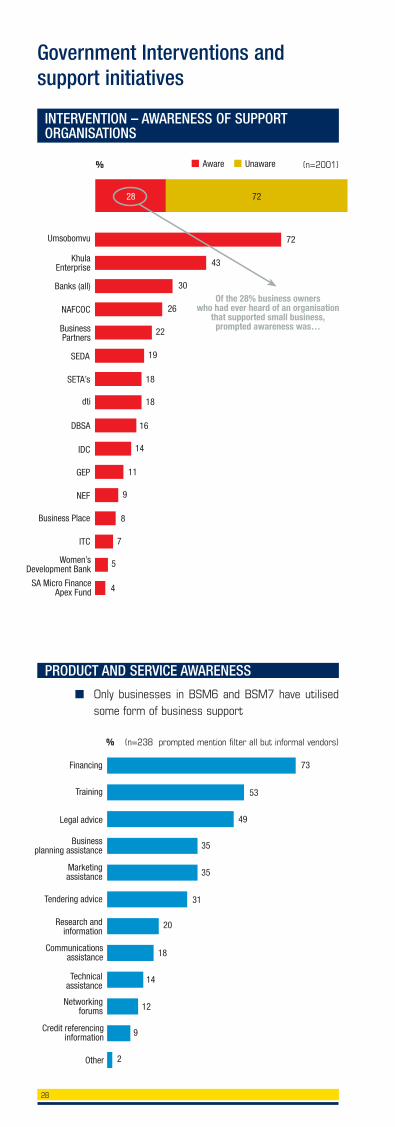
INTERVENTION – AWARENESS OF SUPPORTORGANISATIONS
Government Interventions andsupport initiatives
Umsobomvu 72
KhulaEnterprise
Banks (all)
NAFCOC
BusinessPartners
SEDA
SETA’s
dti
DBSA
IDC
GEP
NEF
Business Place
ITC
Women’sDevelopment Bank
SA Micro FinanceApex Fund
43
30
26
22
19
18
18
16
14
11
9
8
7
5
4
7228
Aware Unaware
Of the 28% business ownerswho had ever heard of an organisation
that supported small business,prompted awareness was…
(n=2001)%
Financing 73
Training
Legal advice
Businessplanning assistance
Marketingassistance
Tendering advice
Research andinformation
Communicationsassistance
Technicalassistance
Networkingforums
Credit referencinginformation
Other
53
49
35
35
31
20
18
14
12
9
2
(n=238 prompted mention filter all but informal vendors)%
PRODUCT AND SERVICE AWARENESS
■ Only businesses in BSM6 and BSM7 have utilisedsome form of business support
29
REACH OF SUPPORT INITIATIVES
■ The impact of education and training is substantial– with the success and growth potential dependenton these factors. Government interventions andsupport initiatives need to include skills development– not only of the technical and managerialrequirements of running a successful business, butalso for developing an entrepreneurial mindsetwhich is willing to take appropriate business risks todeliver business growth
■ A significant number of business owners havetaught themselves their current skills set –compounding the likelihood of business failure andalso stressing the need for effective appropriatesupport, development and training of businessowners and operators
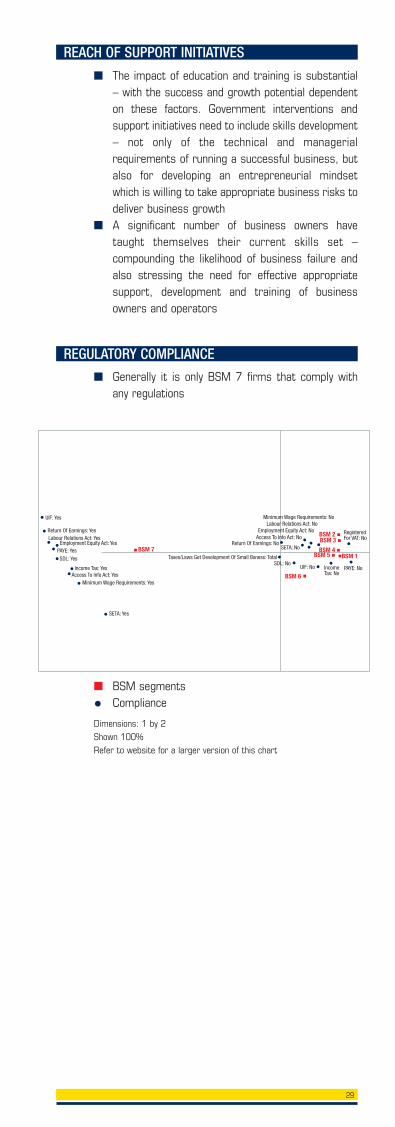
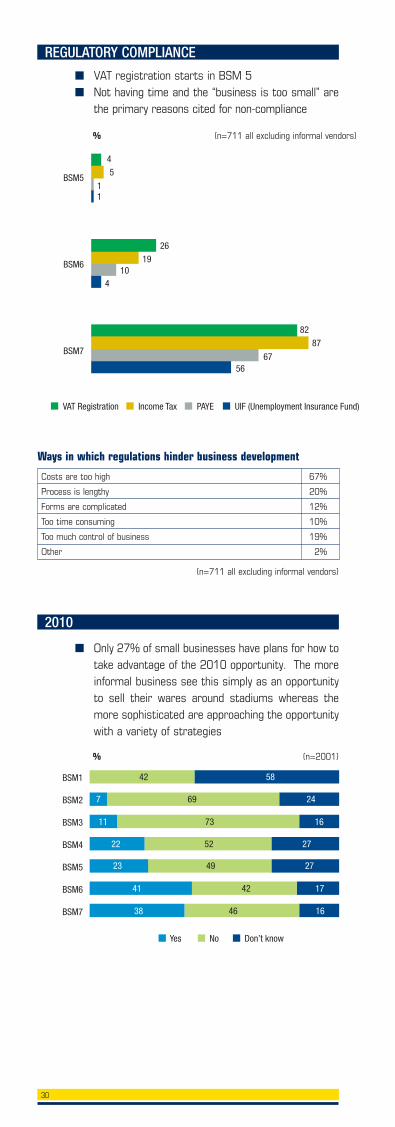
REGULATORY COMPLIANCE
■ Generally it is only BSM 7 firms that comply withany regulations
■ BSM segments
• Compliance
Dimensions: 1 by 2Shown 100%Refer to website for a larger version of this chart
UIF: Yes
Return Of Earnings: YesLabour Relations Act: Yes
Employment Equity Act: YesPAYE: YesSDL: Yes
Income Tax: YesAccess To Info Act: Yes
Minimum Wage Requirements: Yes
SETA: Yes
Minimum Wage Requirements: NoLabour Relations Act: No
Employment Equity Act: NoAccess To Info Act: No
SETA: NoReturn Of Earnings: No
UIF: No IncomeTax: No
SDL: NoPAYE: No
RegisteredFor VAT: No
Taxes/Laws Get Development Of Small Bsness: Total
BSM 6
BSM 2
BSM 7BSM 3
BSM 4BSM 5 BSM 1
30
■ VAT registration starts in BSM 5■ Not having time and the “business is too small” are
the primary reasons cited for non-compliance
■ Only 27% of small businesses have plans for how totake advantage of the 2010 opportunity. The moreinformal business see this simply as an opportunityto sell their wares around stadiums whereas themore sophisticated are approaching the opportunitywith a variety of strategies
REGULATORY COMPLIANCE
2010
BSM5
BSM6
BSM7
VAT Registration
4
Income Tax PAYE UIF (Unemployment Insurance Fund)
5
11
2619
104
8287
6756
(n=711 all excluding informal vendors)
(n=711 all excluding informal vendors)
%
BSM1
BSM2
BSM3
BSM4
BSM5
BSM6
BSM7
Yes No
7 69
Don’t know
24
42 58
11 73 16
22 52 27
23 49 27
41 42 17
38 46 16
(n=2001)%
Costs are too high 67%
Process is lengthy 20%
Forms are complicated 12%
Too time consuming 10%
Too much control of business 19%
Other 2%
Ways in which regulations hinder business development
31
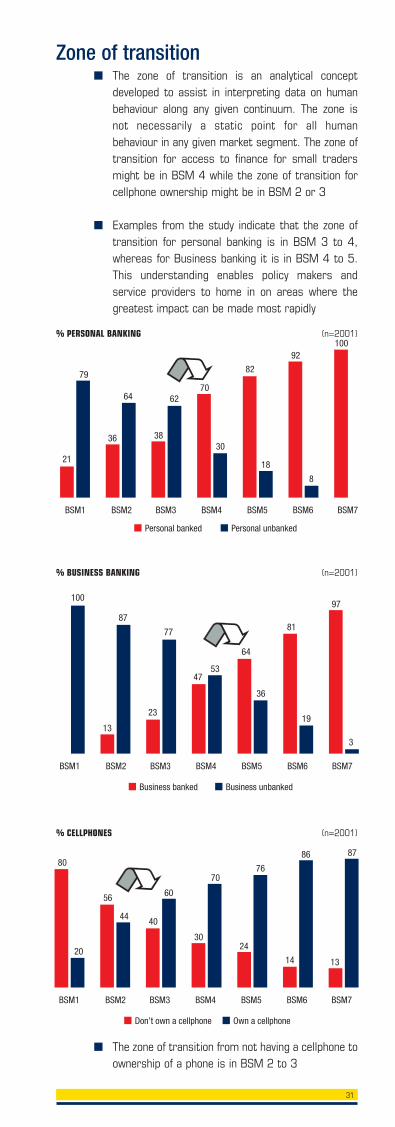
■ The zone of transition is an analytical conceptdeveloped to assist in interpreting data on humanbehaviour along any given continuum. The zone isnot necessarily a static point for all humanbehaviour in any given market segment. The zone oftransition for access to finance for small tradersmight be in BSM 4 while the zone of transition forcellphone ownership might be in BSM 2 or 3
■ Examples from the study indicate that the zone oftransition for personal banking is in BSM 3 to 4,whereas for Business banking it is in BSM 4 to 5.This understanding enables policy makers andservice providers to home in on areas where thegreatest impact can be made most rapidly
■ The zone of transition from not having a cellphone toownership of a phone is in BSM 2 to 3
Zone of transition
Personal banked
BSM1
21
BSM2
Personal unbanked
BSM3 BSM4 BSM5 BSM6 BSM7
79
36
64
38
6270
30
82
18
92
8
100(n=2001)% PERSONAL BANKING
Business banked
BSM1 BSM2
Business unbanked
BSM3 BSM4 BSM5 BSM6 BSM7
100
13
87
23
77
4753
64
36
81
19
97
3
(n=2001)% BUSINESS BANKING
Don’t own a cellphone
BSM1 BSM2
Own a cellphone
BSM3 BSM4 BSM5 BSM6 BSM7
80
20
56
44 40
60
30
70
24
76
14
86
13
87
(n=2001)% CELLPHONES
32
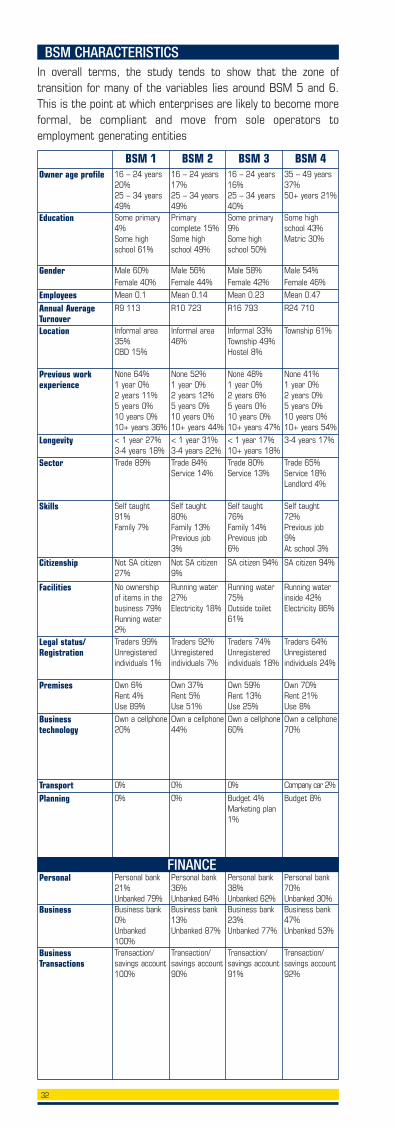
BSM CHARACTERISTICS
BSM 1 BSM 3 BSM 416 – 24 years20%25 – 34 years49%
16 – 24 years17%25 – 34 years49%
16 – 24 years16%25 – 34 years40%
35 – 49 years37%50+ years 21%
Owner age profile
Some primary4%Some highschool 61%
Primarycomplete 15%Some highschool 49%
Some primary9%Some highschool 50%
Some highschool 43%Matric 30%
Education
Mean 0.1 Mean 0.14 Mean 0.23 Mean 0.47EmployeesR9 113 R10 723 R16 793 R24 710 Annual Average
TurnoverInformal area35%CBD 15%
Informal area46%
Informal 33%Township 49%Hostel 8%
Township 61%Location
None 64%1 year 0%2 years 11%5 years 0%10 years 0%10+ years 36%
None 52%1 year 0%2 years 12%5 years 0%10 years 0%10+ years 44%
None 48%1 year 0%2 years 6%5 years 0%10 years 0%10+ years 47%
None 41%1 year 0%2 years 0%5 years 0%10 years 0%10+ years 54%
Previous workexperience
< 1 year 27%3-4 years 18%
< 1 year 31%3-4 years 22%
< 1 year 17%10+ years 18%
3-4 years 17%Longevity
Trade 89% Trade 84%Service 14%
Trade 80%Service 13%
Trade 65%Service 18%Landlord 4%
Self taught72%Previous job9%At school 3%
Sector
Self taught91%Family 7%
Self taught80%Family 13%Previous job3%
Self taught76%Family 14%Previous job6%
Skills
SA citizen 94% Not SA citizen27%
Not SA citizen9%
SA citizen 94%Citizenship
Running waterinside 42%Electricity 86%
No ownershipof items in thebusiness 79%Running water2%
Running water27% Electricity 18%
Running water75% Outside toilet61%
Facilities
Traders 64% Unregisteredindividuals 24%
Traders 99%Unregisteredindividuals 1%
Traders 92% Unregisteredindividuals 7%
Traders 74% Unregisteredindividuals 18%
Legal status/Registration
Own 70% Rent 21%Use 8%
Own 6% Rent 4%Use 89%
Own 37% Rent 5%Use 51%
Own 59% Rent 13%Use 25%
Premises
Own a cellphone70%
Own a cellphone20%
Own a cellphone44%
Own a cellphone60%
Businesstechnology
Company car 2% 0% 0% 0%TransportBudget 8%0% 0% Budget 4%
Marketing plan1%
Planning
Personal bank70%Unbanked 30%
Personal bank21%Unbanked 79%
Personal bank36%Unbanked 64%
Personal bank38%Unbanked 62%
Personal
Business bank47%Unbanked 53%
Business bank0%Unbanked100%
Business bank13%Unbanked 87%
Business bank23%Unbanked 77%
Business
Transaction/savings account92%
Transaction/savings account100%
Transaction/savings account90%
Transaction/savings account91%
BusinessTransactions
Male 60%Female 40%
Male 56%Female 44%
Male 58%Female 42%
Male 54%Female 46%
Gender
BSM 2
FINANCE
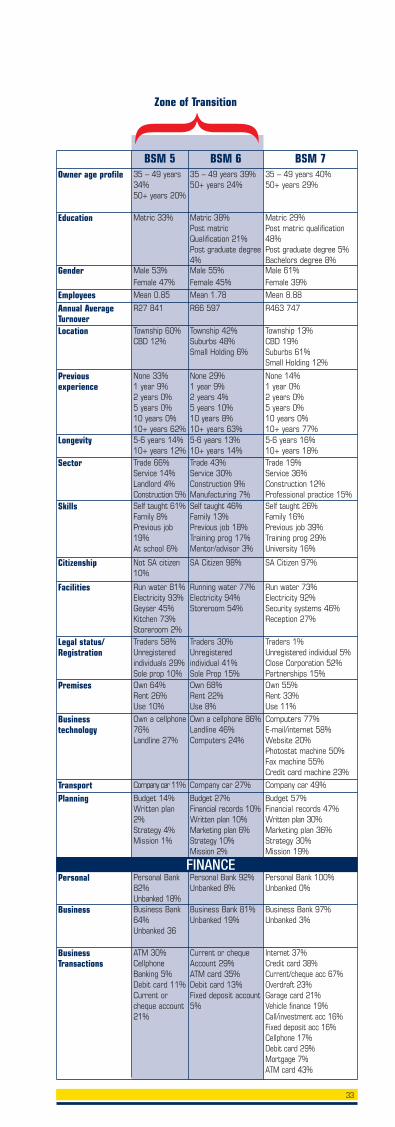
In overall terms, the study tends to show that the zone oftransition for many of the variables lies around BSM 5 and 6.This is the point at which enterprises are likely to become moreformal, be compliant and move from sole operators toemployment generating entities
33
BSM 5 BSM 735 – 49 years34%50+ years 20%
35 – 49 years 39%50+ years 24%
35 – 49 years 40%50+ years 29%
Owner age profile
Matric 33% Matric 38%Post matricQualification 21%Post graduate degree4%
Matric 29%Post matric qualification48%Post graduate degree 5%Bachelors degree 8%
Education
Mean 0.85 Mean 1.78 Mean 8.88EmployeesR27 841 R66 597 R463 747 Annual Average
TurnoverTownship 60%CBD 12%
Township 42%Suburbs 48%Small Holding 6%
Township 13%CBD 19%Suburbs 61%Small Holding 12%
Location
None 33%1 year 9%2 years 0%5 years 0%10 years 0%10+ years 62%
None 29%1 year 9%2 years 4%5 years 10%10 years 8%10+ years 63%
None 14%1 year 0%2 years 0%5 years 0%10 years 0%10+ years 77%
Previousexperience
5-6 years 14%10+ years 12%
5-6 years 13%10+ years 14%
5-6 years 16%10+ years 18%
Longevity
Trade 66%Service 14%Landlord 4%Construction 5%
Trade 43%Service 30%Construction 9%Manufacturing 7%
Trade 19%Service 36% Construction 12%Professional practice 15%
Sector
Self taught 61%Family 8%Previous job19%At school 6%
Self taught 46%Family 13%Previous job 18%Training prog 17%Mentor/advisor 3%
Self taught 26%Family 16%Previous job 39%Training prog 29%University 16%
Skills
Not SA citizen10%
SA Citizen 98% SA Citizen 97% Citizenship
Run water 81% Electricity 93%Geyser 45%Kitchen 73%Storeroom 2%
Running water 77% Electricity 94%Storeroom 54%
Run water 73% Electricity 92%Security systems 46%Reception 27%
Facilities
Traders 58% Unregisteredindividuals 29%Sole prop 10%
Traders 30%Unregisteredindividual 41%Sole Prop 15%
Traders 1% Unregistered individual 5%Close Corporation 52% Partnerships 15%
Legal status/Registration
Own 64% Rent 26%Use 10%
Own 68% Rent 22%Use 8%
Own 55% Rent 33%Use 11%
Premises
Own a cellphone76%Landline 27%
Own a cellphone 86%Landline 46%Computers 24%
Computers 77%E-mail/internet 58%Website 20%Photostat machine 50%Fax machine 55%Credit card machine 23%
Businesstechnology
Company car 11% Company car 27% Company car 49%TransportBudget 14%Written plan2%Strategy 4%Mission 1%
Budget 27%Financial records 10%Written plan 10%Marketing plan 6%Strategy 10%Mission 2%
Budget 57%Financial records 47%Written plan 30%Marketing plan 36%Strategy 30%Mission 19%
Planning
Personal Bank82%Unbanked 18%
Personal Bank 92%Unbanked 8%
Personal Bank 100%Unbanked 0%
Personal
Business Bank64%Unbanked 36
Business Bank 81%Unbanked 19%
Business Bank 97%Unbanked 3%
Business
ATM 30%CellphoneBanking 5%Debit card 11%Current orcheque account21%
Current or chequeAccount 29%ATM card 35%Debit card 13%Fixed deposit account5%
Internet 37%Credit card 38%Current/cheque acc 67%Overdraft 23%Garage card 21%Vehicle finance 19%Call/investment acc 16%Fixed deposit acc 16%Cellphone 17%Debit card 29%Mortgage 7%ATM card 43%
BusinessTransactions
BSM 6
FINANCE
Zone of Transition}Male 53%Female 47%
Male 55%Female 45%
Male 61%Female 39%
Gender
■ Black owned and women owned businesses arecurrently not able to capitalise on opportunities inthe broader economy – they tend to exist on thefringe of what has been labelled the first economy –substantial initiatives will be required to effect achange for these entities
■ Government procurement initiatives could be linkedwith support services or partnerships between bigand small business. A strategy of firm linkagescould assist small business in “learning by doing”and ”learning whilst earning”
■ Business skills need to be included in theeducational curriculum to assist in changing thelevels of perceived entrepreneurial opportunity. Acombination of both motivation and skills is requiredto take effective advantage of business opportunities
■ Although an entrepreneurial mindset cannot belearned, education could play a role in developing amindset that is not averse to competition and risk-taking
■ Radical innovations are required from policy makersand financial service providers to develop abeneficial environment and increase the impetus forsmall business– Free SMSs for balance enquiries– Tax incentives for private individuals to invest in
small businesses– A special permit that allows non-SA residents
access to financial services– A basic insurance product to accompany a
transaction account for small business to providesome form of safety net
34
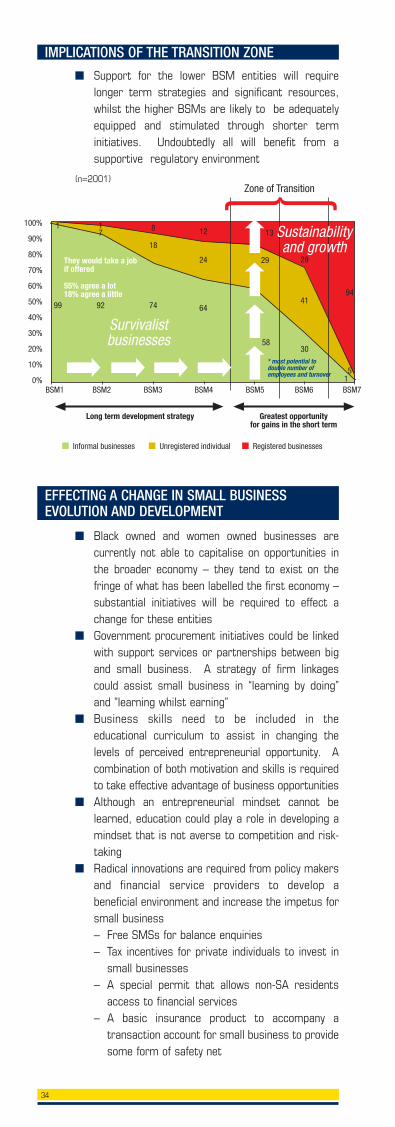
■ Support for the lower BSM entities will requirelonger term strategies and significant resources,whilst the higher BSMs are likely to be adequatelyequipped and stimulated through shorter terminitiatives. Undoubtedly all will benefit from asupportive regulatory environment
EFFECTING A CHANGE IN SMALL BUSINESSEVOLUTION AND DEVELOPMENT
IMPLICATIONS OF THE TRANSITION ZONE
100%
90%
80%
70%
60%
50%
40%
30%
20%
10%
0%BSM1 BSM2 BSM3 BSM4 BSM5 BSM6 BSM7
99
Long term development strategy
Survivalistbusinesses
Zone of Transition
Greatest opportunityfor gains in the short term
They would take a jobif offered
55% agree a lot18% agree a little
* most potential todouble number ofemployees and turnover
1
92
71
74
18
8
64
24
12
58
29
30
41
29
15
94
Sustainabilityand growth
Informal businesses Unregistered individual Registered businesses
13
(n=2001)
35
Government support mechanisms are being used byonly 8% of small businesses, with Umsobomvu far andaway the market leader in providing business support.Given the widespread desire for business developmentservices (BDS), there is a need to reflect on how tomake the delivery mechanisms for BDS more effective.For example, what is different in Umsobomvu’s approachthat makes it more successful?
With a quarter of small businesses reporting crime andtheft as a problem, government needs to make businesslocations safer. Initiatives that allow traders to bank theday’s takings in the same secure environment might beworth exploring.
Black Economic Empowerment (BEE) awareness isextremely low. Government agencies seeking topromote BEE initiatives, for example, throughprocurement contracts, will want to reflect on how tocommunicate the BEE message more effectively – forexample, through cellphones.
69% of small businesses operate from home (includinggarage, back room or rented accommodation).Government support for home-based businessesspecifically (including the lifting of restrictions on theuse of residential environments for business purposes)is paramount.
As VAT registration applies only to a small number ofbusinesses (BSM 5 and above), the government’seasing of the tax and regulatory burden on smallbusinesses should be accelerated.
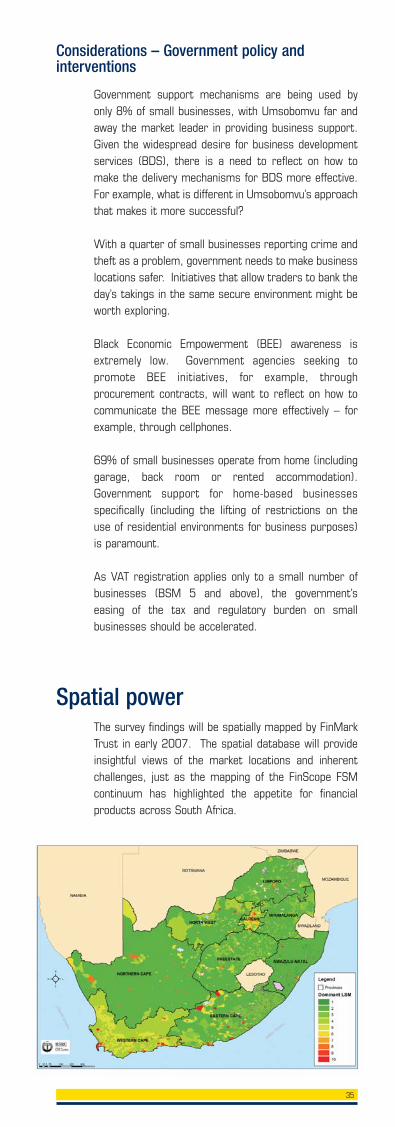
The survey findings will be spatially mapped by FinMarkTrust in early 2007. The spatial database will provideinsightful views of the market locations and inherentchallenges, just as the mapping of the FinScope FSMcontinuum has highlighted the appetite for financialproducts across South Africa.
Considerations – Government policy andinterventions
Spatial power
36
This brochure depicts only a snapshot of the surveyfindings. Further data analysis is recommended and canbe arranged at the request of users. The dataset isavailable free of charge from GEP or FinMark Trust.
Details of organisations who can assist in analysis andintrepretation, are available on the FinMark website.
The BSM and psychographic segmentation models areto be developed further. We invite constructive inputtowards the enhancement of these; comments can bedirected to the FinMark Trust website.
Should sufficient interest be generated from the pilotsurvey findings and segmentation models, it is possiblethat the FinScope Small Business survey could beconducted nationally. Interested parties are requestedto kindly advise FinMark Trust of any specific focus areasto be considered for that study.
FinMark Trust Website: www.finmark.org.zaTel: +27 11 315 9197Fax: +27 11 645 6896Contact person: Andrea van der Westhuizen
Gauteng Enterprise PropellerWebsite: www.gep.co.zaTel: +27 11 634 2600Fax: +27 11 634 2601
The way forward…..
Contact details
www.finmarktrust.org.za www.gep.co.za