Embed Size (px)
Citation preview

Pillar 3 Report 2018
Deutsche Bank
Contents5 Regulatory framework
5 Introduction5 Basel 3 and CRR / CRD 46 FSB TLAC and European MREL (SRMR/BRRD)
7 General requirements for disclosures
7 Article 431 (1) CRR – Pillar 3 disclosure concept7 Article 431 (2) CRR – Information on operational risk
methodologies7 Article 431 (3) CRR – Disclosure policy8 Article 431 (4) CRR – Explanation of rating decisions8 Article 432 CRR – Non-material, proprietary or
confidential information8 Article 433 CRR – Frequency of disclosure8 Article 434 CRR – Means of disclosure
10 Risk management objectives and policies
10 Article 435 (1)(a) CRR – Risk management strategies and processes
10 Article 435 (1)(b) CRR – Risk management structure and organization
11 Article 435 (1)(c) CRR – Scope and nature of risk reporting and measurement systems
12 Article 435 (1)(d) CRR – Policies for hedging and mitigating risk
12 Article 435 (1)(e) CRR – Declaration on the adequacy of risk management arrangements
13 Article 435 (1)(f) CRR – Concise risk statement approved by the board
13 Article 435 (2)(a) CRR – Number of directorships held by board members
13 Article 435 (2)(b) CRR – Recruitment policy for board members
14 Article 435 (2)(c) CRR – Policy on diversity for board members
14 Article 435 (2)(d-e) CRR – Risk committee and information flow
15 Scope of application of the regulatory framework
15 Article 436 (a) CRR – Name of the institution15 Article 436 (b) CRR – Difference in basis of consolidation
for accounting and prudential purposes21 Article 436 (c) CRR – Impediments to fund transfers21 Article 436 (d) CRR – Potential capital shortfalls in
unconsolidated subsidiaries21 Article 436 (e) CRR – Derogations from prudential or
liquidity requirements for subsidiaries
23 Own funds
23 Capital Adequacy23 Article 437 (1)(a,d-e) CRR – Regulatory capital composi-
tion, prudential filters and deduction items30 Article 437 (1)(b-c) CRR – Main features of capital
instruments30 Article 437 (1)(f) CRR – Capital ratios different to CRR
31 Capital requirements
31 Article 438 (a) CRR – Summary of Deutsche Bank’s ICAAP approach
35 Article 438 (b) CRR – SREP requirements35 Article 438 (c-f) CRR – Overview of capital require-
ments36 Article 438 CRR – Specialized lending and equity
exposures in the banking book37 Article 438 CRR – Other non-credit obligation assets in
the banking book38 Article 441 CRR – Indicators of global systemic
importance38 Article 440 CRR – Capital buffers
45 Credit risk and credit risk mitigation
45 General qualitative information on credit risk 45 Article 442 (a) CRR – Definitions of past due and
impairment 45 Article 442 (b) CRR – Credit risk adjustments45 General quantitative information on credit risk 45 Article 442 (c) CRR – Total and average amount of
credit exposure by exposure classes 46 Article 442 (d) CRR – Geographic distribution of
credit exposure 54 Article 442 (e) CRR – Distribution of credit exposure
by industry type 60 Article 442 (f) CRR – Residual maturity breakdown
of credit exposure 62 Article 442 (g) CRR – Defaulted exposures by
regulatory exposure class and industry 66 Article 442 (h) CRR – Defaulted exposures by
geographical area, past due, non-performing and forborne exposures
72 Article 442 (i) CRR – Development of credit risk adjustments and defaulted loans and debt securities
73 General qualitative information on credit risk mitigation 73 Introduction 73 Article 453 (a) CRR – Use of on- and off-balance
sheet netting 73 Article 453 (b) CRR – Collateral valuation and
management 74 Article 453 (c) CRR – Main types of collateral 74 Article 453 (d) CRR – Main types of guarantor and
credit derivative counterparties 74 Article 453 (e) CRR – Risk concentrations within
credit risk mitigation74 General quantitative information on credit risk
mitigation 74 Article 453 (f-g) CRR – Overview of credit risk
mitigation techniques
77 Credit risk exposure in the standardized approach
77 Standardized approach77 Article 444 (a-b) CRR – External ratings in the
standardized approach77 Article 444 (c) CRR – Usage of issue ratings77 Article 444 (d) CRR – Mapping of external rating to
credit quality steps77 Article 444 (e) CRR – Credit risk exposure and credit
risk mitigation in the standardized approach
139 Market risk
139 Own funds requirements for market risk under the standardized approach
139 Article 445 CRR – Market risk standardized approach
139 Qualitative information on the internal model approach
139 Article 455 (a)(i) CRR – Characteristics of the market risk models
141 Article 455 (a)(ii) CRR – Incremental risk charge and comprehensive risk measure
143 Article 455 (a)(iii) CRR – Market risk stress testing 143 Article 455 (a)(iv) CRR – Methodology
for backtesting and model validation 144 Article 455 (b) CRR – Regulatory approval
for market risk models 144 Article 455 (c) CRR – Trading book allocation
and prudent valuation145 Own funds requirements for market risk under the IMA 145 Article 455 (e) CRR – Regulatory capital
requirements for market risk147 Other quantitative information for market risk under
the internal models approach 147 Article 455 (d) CRR – Overview of Value-at-Risk
Metrics 147 Article 455 (f) CRR – Weighted average liquidity
horizons in market risk models 147 Article 455 (g) CRR – Comparison of end-of-day
VaR measures with one-day changes in portfolio‘s value
147 Economic capital usage for our trading market risk
148 Economic capital usage for our nontrading market risk portfolios per business area
149 Operational Risk
149 Article 446 CRR – Operational risk measurement150 Article 446 CRR – Operational risk exposure151 Article 454 CRR – Use of the advanced measurement
approaches to operational risk
153 Exposures in equities in the banking book
153 Article 447 (a) CRR – Accounting and valuation of equity investments
153 Article 447 (b) CRR – Equity investment exposure153 Article 447 (c) CRR – Types and nature
of equity exposures154 Article 447 (d-e) CRR – Gains and losses
from equity investments
154 Exposure to interest rate risk in the banking book (Article 448 CRR)
81 Credit risk exposure and credit risk mitigation in the internal-rating- based approach
81 Qualitative information on the use of the IRB approach
81 Article 452 (a) CRR – Approval status for IRB approaches
81 Article 452 (b)(i) CRR – Mapping of internal rating scales to external ratings
82 Article 452 (b)(ii) CRR – Use of internal ratings 82 Article 452 (b)(iii) CRR – Management
and recognition of credit risk mitigation 82 Article 452 (b)(iv) CRR – Controls around
ratings systems 82 Article 452 (c) – Internal rating-based approaches85 Quantitative information on the use of the IRB
approach 85 Article 452 (d-g) CRR – Advanced IRB exposure 94 Article 452 (d-g) CRR – Foundation IRB exposure 99 Article 453 (g) CRR – Total IRB exposure covered
by credit derivatives 99 Article 438 (d) CRR – Development of credit risk
RWA 100 Article 452 (h-i) CRR – Model validation results
and expected versus actual losses 110 Article 452 (j) CRR – IRB exposure by country
where Deutsche Bank operates
122 Counterparty credit risk (CCR)
122 Article 439 (a) CRR – Internal capital and credit limits for counterparty credit risk exposures
123 Article 439 (b) CRR – Collateral and credit reserves for counterparty credit risk
123 Article 439 (c) CRR – Management of wrong-way risk exposures
123 Article 439 (d) CRR – Collateral in the event of a rating downgrade
123 Article 439 (f) CRR – CCR exposures by model approach
125 Article 444 (e) CRR – CCR exposures in the standardized approach
127 Article 452 (e) CRR – CCR exposures within the advanced IRBA
133 Article 452 (e) CRR – CCR exposures within the foundation IRBA
136 Article 438 (d) CRR – Development of CCR RWA136 Article 439 (e) CRR – CCR exposures after
credit risk mitigation137 Article 439 (g-h) CRR – Credit derivatives exposures138 Article 439 (i) CRR – Estimate of alpha factor
138 Economic capital usage for credit risk
155 Exposure to securitization positions
155 Article 449 (a) CRR – Objectives in relation to securitization activity
155 Article 449 (b) CRR – Nature of other risks in securitized assets
155 Article 449 (d-e) CRR – The roles played in the securitization process
156 Article 449 (c,f) CRR – Management of securitization positions, and risks in re-securitization activities
157 Article 449 (g) CRR – Policies with respect to hedging and unfunded protection
158 Article 449 (h) CRR – RWA calculation approaches for securitization positions
160 Article 449 (i) CRR – SSPEs in sponsoring activities160 Article 449 (j) CRR – Accounting policies for
securitizations160 Article 449 (k) CRR – External rating agencies used
for securitizations161 Article 449 (l) CRR – Internal assessment approach161 Article 449 (m) CRR – Explanation of changes in
quantitative disclosures161 Article 449 (n) CRR – Banking and trading book
securitization exposures166 Article 449 (o)(i) CRR – Retained or purchased banking
and trading book securitizations broken down by risk-weight bands
168 Article 449 (o)(ii) CRR – Retained or purchased re-securitization exposures for banking and trading book
169 Article 449 (p) CRR – Impaired assets and recognized losses related to banking book securitizations
170 Article 449 (q) CRR – Trading book securitization positions
170 Article 449 (r) CRR – Financial support to securitization vehicles
170 Remuneration policy (Article 450 CRR)
171 Leverage (Article 451 CRR)
171 Leverage ratio according to revised CRR/CRD 4 framework
174 Process used to manage the risk of excessive leverage
174 Factors that had an impact on the leverage ratio in the second half of 2018
175 Unencumbered Assets (Article 443 CRR)
178 Liquidity
180 Business risk
181 List of tables
5
Deutsche Bank Regulatory frameworkPillar 3 Report as of December 31, 2018 Basel 3 and CRR/CRD 4
Regulatory framework
IntroductionThis Report provides Pillar 3 disclosures on the consolidated level of Deutsche Bank Group as required by the globalregulatory framework for capital and liquidity, established by the Basel Committee on Banking Supervision, also known asBasel 3. On European level these are implemented in the disclosure requirements as laid down in Part Eight of the “Regulation(EU) No 575/2013 on prudential requirements for credit institutions and investment firms” (Capital Requirements Regulation,or “CRR”) and the “Directive 2013/36/EU on access to the activity of credit institutions and the prudential supervision of creditinstitutions and investment firms” (Capital Requirements Directive 4, or “CRD 4”). Germany implemented these CRD 4requirements into national law in Section 26a of the German Banking Act (“Kreditwesengesetz” or “KWG”). Further disclosureguidance has been provided by the European Banking Authority (“EBA”) in its “Final Report on the Guidelines on DisclosureRequirements under Part Eight of Regulation (EU) No 575/2013” (“EBA Guideline”, EBA/GL/2016/11, version 2*). We alsoprovide for the first time Templates 1, 3 and 4 of the EBA Guidelines on disclosure of non-performing and forborne exposures(EBA/GL/2018/10) published on December 17, 2018. Per regulation it is not required to have Pillar 3 disclosures audited. Assuch the information provided in this Pillar 3 Report is unaudited.
Due to rounding, numbers presented throughout this document may not add up precisely to the totals we provide andpercentages may not precisely reflect the absolute figures.
Basel 3 and CRR/CRD 4In the European Union, the Basel 3 capital framework was implemented by the CRR and CRD 4. As a single rulebook theCRR is directly applicable to credit institutions and investment firms in the European Union and provides the grounds for thedetermination of regulatory own funds, regulatory capital requirements, leverage and liquidity as well as other relevantregulations. In addition, the CRD 4 was implemented into German law by means of further amendments to the KWG and theGerman Solvency Regulation (SolvV) and accompanying regulations. Jointly, these laws and regulations represent the newregulatory framework applicable in Germany.
The regulatory framework became effective on January 1, 2014, subject to transitional rules. When referring to Deutsche Bankresults according to transitional rules we use the term “CRR/CRD 4”. When referring to results according to full application ofthe final CRR/CRD 4 framework (without consideration of applicable transitional methodology) we use the term “CRR/CRD 4fully loaded”. For the calculation of risk-weighted assets (RWA) CRR/CRD 4 maintained transitional rules that permitted thegrandfathering of equity investments at a risk-weight of 100 %. These transitional arrangements have been considered lastlyfor December 31, 2017 and expired thereafter, resulting in no difference thereafter for RWA under the fully loaded ortransitional regime.
Since 2015 the Common Equity Tier 1 (CET 1) minimum capital requirement applicable to the Group is 4.5 % of risk-weightedassets. In addition to this minimum capital requirement, various capital buffer requirements were phased in starting 2016 andwill become fully effective from 2019 onwards. The development and maintenance of a high quality capital base which shouldprimarily consist of Common Equity Tier 1 reflects one of the core elements of the CRR/CRD 4 framework. Specific regulatoryadjustments were subject to transitional rules. For instance, deductions for deferred tax assets that rely on future profitabilityor deductions for indirect and synthetic holdings of own instruments and capital instruments issued by financial sector entitieswere phased in. These phase-in arrangements to the CET 1 were still applicable for December 31, 2017 reporting as thephase-in percentage was at 80 % in 2017. They are not applicable from January 1, 2018 onwards as the phase-in percentageincreased to 100 %. At the same time minority interest only recognizable under the transitional rules is now phased out with a100 % phase-out rate since January 1, 2018.
Transitional arrangements are still applicable for Additional Tier 1 (AT1) and Tier 2 (T2) capital. Capital instruments that nolonger qualify as AT1 or T2 capital under the CRR/CRD 4 fully loaded rules are subject to grandfathering rules during thetransitional period and are being phased out from 2013 to 2022 with their recognition capped at 50 % in 2017, 40 % in 2018and the cap decreasing by ten percentage points every year thereafter.
Additionally, the leverage ratio has been introduced as a non-risk based capital requirement to complement the risk-basedcapital requirements. The CRR/CRD 4 requires banks to calculate and disclose a regulatory leverage ratio that is generallybased on the accounting value as the relevant exposure measure for assets. Specific regulatory exposure measures apply toderivatives and securities financing transactions as well as off-balance sheet exposures and must be added to determine thetotal leverage exposure.
6
Deutsche Bank Regulatory frameworkPillar 3 Report as of December 31, 2018 FSB TLAC and European MREL (SRMR/BRRD)
The CRR/CRD 4 framework further introduced new liquidity standards. The Liquidity Coverage Ratio (LCR) aims to measurea bank’s short-term resilience to a severe liquidity stress scenario during a stress period of 30 calendar days. Detailed rulesfor the calculation of the LCR are set out in the Commission Delegated Regulation 2015/61 adopted in October 2014. TheLCR became a binding minimum requirement as of October 1, 2015 and is phased in progressively: the phase-in percentagenow reached 100 % in 2018 and was 80 % in 2017.
The Net Stable Funding Ratio (NSFR) requires banks to maintain a stable funding profile in relation to their on- and off-balancesheet exposures. Within the European Trilogue a revision of the Capital Requirement Regulation (“CRR”) is proposed toimplement the NSFR into EU legislation. A binding minimum ratio for the NSFR is expected but its date of application has notbeen finally defined.
There are still some interpretation uncertainties with regard to CRR/CRD 4 rules and some of the related binding TechnicalStandards are not yet available in their final version. Thus, we will continue to refine our assumptions and models in line withevolution of our as well as the industry’s understanding and interpretation of the rules. Against this background, currentCRR/CRD 4 measures may not be comparable to previous expectations. Also, our CRR/CRD 4 measures may not becomparable with similarly labeled measures used by our competitors as our competitors’ assumptions and estimates regardingsuch implementation may differ from ours.
ICAAP, ILAAP and SREP
The lnternal Capital Adequacy Assessment Process (“ICAAP”) as stipulated in Pillar 2 of Basel 3 requires banks to identifyand assess risks, maintain sufficient capital to face these risks and apply appropriate risk management techniques to maintainadequate capitalization. Our internal liquidity adequacy assessment process (“ILAAP”) aims to ensure that sufficient levels ofliquidity are maintained on an ongoing basis by identifying the key liquidity and funding risks to which the Group is exposed,by monitoring and measuring these risks, and by maintaining tools and resources to manage and mitigate these risks .
In accordance with Article 97 of CRD4 supervisors regularly review, as part of the Supervisory Review and Evaluation Process(“SREP”), the arrangements, strategies, processes and mechanisms implemented by banks and evaluate: (a) risks to whichthe institution is or might be exposed; (b) risks the institution poses to the financial system; and (c) risks revealed by stresstesting.
FSB TLAC and European MREL (SRMR/BRRD)Banks in the European Union are required to meet at all times a minimum requirement for own funds and eligible liabilities(“MREL”) which ensures that banks have sufficient loss absorbing capacity in resolution to avoid recourse to taxpayers’ money.Relevant laws are the Single Resolution Mechanism Regulation (“SRMR”) and the Bank Recovery and Resolution Directive(“BRRD”) as implemented through the German Recovery and Resolution Act (Sanierungs- und Abwicklungsgesetz, “SAG”).
Instruments which qualify for MREL are own funds (Common Equity Tier 1, Additional Tier 1 and Tier 2) as well as certaineligible liabilities (mainly plain-vanilla unsecured bonds). MREL is expressed as a percentage of Total Liabilities and OwnFunds (“TLOF”).
MREL is determined on a case-by-case basis by the resolution authority in line with guidance provided by CommissionDelegated Regulation (EU) 2016/1450. The Single Resolution Board (“SRB”) as Deutsche Bank’s resolution authority hasissued further MREL policies clarifying how the SRB will exercise its discretion under the above European laws in settingMREL and in determining eligible liabilities.
Within the European Trilogue a revision of the SRMR and the BRRD are proposed as well as amendments to the CRR. Theseamendments will implement the Total Loss Absorbing Capacity (“TLAC”) standard in Europe for Global Systemically ImportantInstitutions (G-SIIs) as internationally agreed in the Financial Stability Board (“FSB”) and will make further adjustments toMREL.
7
Deutsche Bank General requirements for disclosuresPillar 3 Report as of December 31, 2018 Article 431 (3) CRR - Disclosure policy
General requirements for disclosures
Article 431 (1) CRR - Pillar 3 disclosure conceptWe provide our Pillar 3 disclosures in line with the disclosure requirements as laid down in Part Eight of the “Regulation (EU)No 575/2013 on prudential requirements for credit institutions and investment firms” (CRR). This report provides the respectivePillar 3 disclosures to the extent that these Pillar 3 disclosures are not included in the Deutsche Bank Annual Report 2018.Where Pillar 3 disclosure elements are located in the Annual Report of Deutsche Bank, they are generally referenced fromthe Pillar 3 Report to the Annual Report accordingly. Further down in this Report we provide an overview of the referencesinto the Deutsche Bank Annual Report 2018.
In December 2016 the European Banking Authority (“EBA”) provided a “Final Report on the Guidelines on DisclosureRequirements under Part Eight of Regulation (EU) No 575/2013” (“EBA Guideline”, EBA/GL/2016/11, version 2*),subsequently to the Basel Committee on Banking Supervision releasing a revised version of the Basel 3 Pillar 3 framework.The EBA Guideline constitutes an own-initiative guideline to ensure the harmonized and timely implementation of the newBasel framework in the European Union. In this regard, these Guidelines do not supersede or change the substance of theregulatory disclosures regarding the requirements defined in Part Eight of the CRR. However, they provide guidance on thesedisclosures from a presentational aspect, in particular by introducing more specific guidance and formats through the use oftables and templates. This means that certain Pillar 3 disclosures follow a fixed format defined by EBA, including column orrow labeling, whereas other disclosures are flexible and may be modified to a certain degree to present the most relevantinformation.
Against this background, we organized the content flow of the Pillar 3 Report to allow for an easy identification of the respectivedisclosure elements against its specific Pillar 3 disclosure requirements. Within the broad risk sections “credit risk”,“counterparty credit risk”, “market risk”, “operational risk”, “liquidity risk” and “remuneration” we designed the Pillar 3 Report tofollow in principle the order of the CRR-Articles in Part Eight (relevant numberings are reflected in the headings of the sections).In some instances within these sections we follow the structure as provided by the EBA Guideline where it helps to presentspecific topics even more comprehensively at one place. The quantitative Pillar 3 requirements are presented under therelevant EBA template with respective references (e.g., EU OV1, EU CR6), also including the EBA column or row labeling. Ininstances where additional lines or columns have been added to certain templates for better disclosure presentation a newnumbering was introduced as specified in the EBA Guideline. Please note that we still use mainly our own naming conventionswithin the EBA templates for the description of rows and columns which allows us to stay aligned and consistent in ourdisclosure presentation over time. We principally make use of the transitional arrangements provided in the EBA Guideline insection 4.1, No. 20 in relation to comparative information for prior periods, where these can be omitted in case of a first yearof adoption of a disclosure element.
In 2012 the Enhanced Disclosure Task Force (“EDTF”) was established as a private sector initiative under the auspice of theFinancial Stability Board, with the primary objective to develop fundamental principles for enhanced risk disclosures and torecommend improvements to existing risk disclosures. As a member of the EDTF we adhered to the disclosurerecommendations in this Pillar 3 Report to the extent applicable.
Article 431 (2) CRR - Information on operational riskmethodologiesDeutsche Bank uses the Advanced Measurement Approach (AMA) to measure Operational Risk as outlined in section “Article446 CRR - Operational risk measurement” in this report on page 149.
Article 431 (3) CRR - Disclosure policyFor purposes of Article 431 CRR, we have adopted a formal Risk Disclosure Policy to ensure that our risk disclosures are incompliance with applicable legal, regulatory and accounting risk disclosure standards and are compiled based upon a set ofinternally defined principles and related processes. The Risk Disclosure Policy defines overall roles and responsibilities, setsup the disclosure production process and establishes the verification and sign off procedures. Principally seniorrepresentatives and subject matter experts from Finance and Risk assume responsibility for our risk disclosures and governour respective risk disclosure processes. Based upon our assessment and verification we believe that our risk disclosures
8
Deutsche Bank General requirements for disclosuresPillar 3 Report as of December 31, 2018 Article 434 CRR - Means of disclosure
presented throughout this Pillar 3 Report in conjunction with the Annual Report 2018 appropriately and comprehensivelyconvey our overall risk profile.
Article 431 (4) CRR - Explanation of rating decisionsDeutsche Bank Group provides explanations of rating decisions to small and medium entities and other corporates whoseloan applications were declined.
Article 432 CRR - Non-material, proprietary or confidentialinformationIn line with the Group’s internal Risk Disclosure Policy a dedicated process has to be followed in case the Group considers toomit certain disclosures due to these disclosures being immaterial, proprietary or confidential. In the rare cases where theGroup classifies information as non-material in this report this has been stated accordingly in the related disclosures.
Article 433 CRR - Frequency of disclosureIn line with the internal Risk Disclosure Policy the Group regularly assesses the need to disclose some or all informationrequired by Titles II and III in Part Eight of Regulation (EU) No 575/2013 more frequently than annually. In accordance withArticle 433 CRR the Group bases its assessment mainly on the relevant characteristics of its business such as scale ofoperations, range of activities, presence in different countries, involvement in different financial sectors, activity in internationalfinancial markets and considers participation in payment, settlement and clearing systems. In this regard, special attention ispaid to information on capital, capital requirements, risk and other elements that can change rapidly and therefore lead to amore frequent disclosure need.
There is a formal process set up for the identification of the need for higher than annual frequency of all Pillar 3 disclosureswhich is compatible with the size, the scope and the range of activities of the Group. It also considers external factors likemarket developments or investors and analysts’ expectations as well as internal aspects like expert judgments from areaseffected, process of disclosure implementation and quality assurance in the production process with the overall aim to deliverappropriate disclosures which provide a timely, complete and accurate view of the Group’s risk profile and risk position.
Subsequently the Group concludes, which parts of the information required under Part 8 CRR are to be disclosed morefrequently than once a year. In this regard the Group principally follows the recommendations regarding frequency ofdisclosures as prejudiced in the CRR and the EBA Guidelines on disclosure requirements under Part Eight of Regulation (EU)No 575/2013 as of December 14, 2016, for those items specified in there, but also reaches respective conclusions for allremaining disclosure items.
The internal Risk Disclosure Policy also states that Pillar 3 disclosures have to be published principally in conjunction with thedate of publication of the financial statements unless specified and agreed differently e.g. publication of standalone Pillar 3Report for significant subsidiaries according to Article 13 CRR.
Article 434 CRR - Means of disclosureThe Pillar 3 Report is provided on the bank’s website at db.com/ir/en/regulatory-reporting.htm
The Pillar 3 Report has been organized to principally follow the structure as defined by the EBA guideline (“Final Report onthe Guidelines on Disclosure Requirements under Part Eight of Regulation (EU) No 575/2013” EBA/GL/2016/11, version 2*,from 14 December 2016) and underlying Capital Requirement Regulation (CRR) related articles.
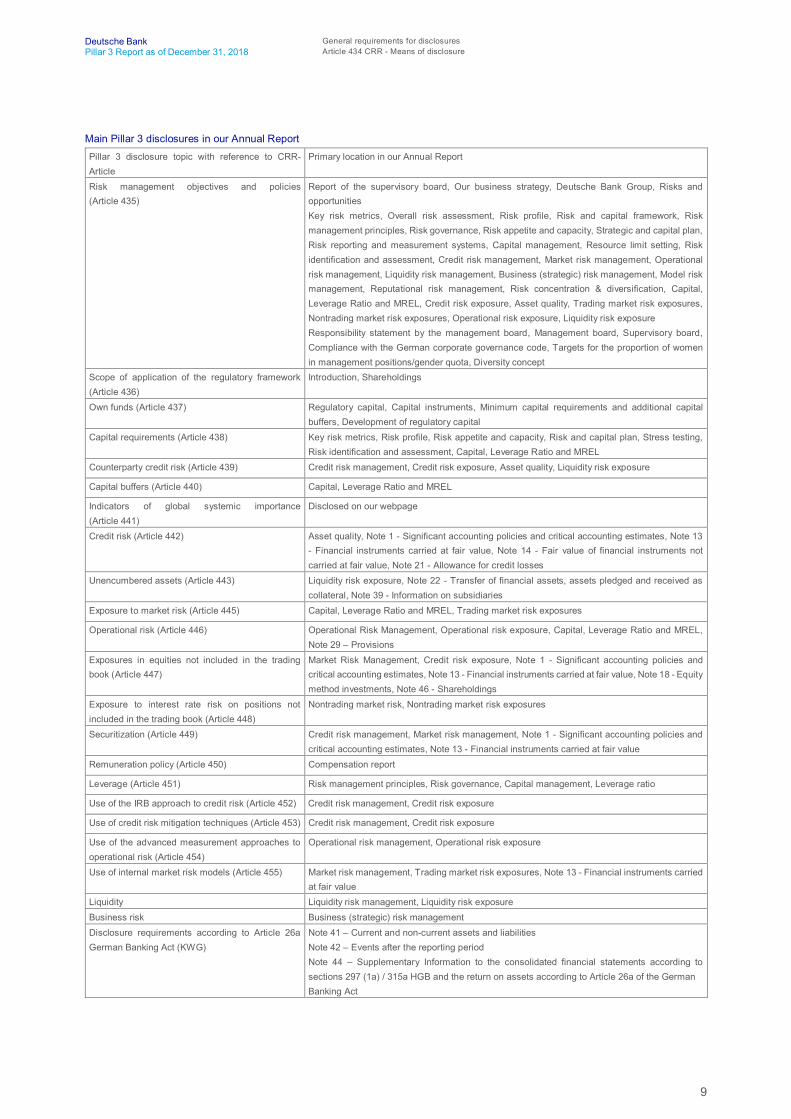
This report provides the Basel III Pillar 3 disclosures to the extent that these required Pillar 3 disclosures are not included inthe Deutsche Bank Annual Report 2018. Where Pillar 3 disclosure elements are located in the Annual Report of DeutscheBank, they are generally referenced from the Pillar 3 Report to the Annual Report accordingly. The following table providesan overview of the references into the Deutsche Bank Annual Report 2018.
9
Deutsche Bank General requirements for disclosuresPillar 3 Report as of December 31, 2018 Article 434 CRR - Means of disclosure
Main Pillar 3 disclosures in our Annual Report
Pillar 3 disclosure topic with reference to CRR-Article
Primary location in our Annual Report
Risk management objectives and policies(Article 435)
Report of the supervisory board, Our business strategy, Deutsche Bank Group, Risks andopportunitiesKey risk metrics, Overall risk assessment, Risk profile, Risk and capital framework, Riskmanagement principles, Risk governance, Risk appetite and capacity, Strategic and capital plan,Risk reporting and measurement systems, Capital management, Resource limit setting, Riskidentification and assessment, Credit risk management, Market risk management, Operationalrisk management, Liquidity risk management, Business (strategic) risk management, Model riskmanagement, Reputational risk management, Risk concentration & diversification, Capital,Leverage Ratio and MREL, Credit risk exposure, Asset quality, Trading market risk exposures,Nontrading market risk exposures, Operational risk exposure, Liquidity risk exposureResponsibility statement by the management board, Management board, Supervisory board,Compliance with the German corporate governance code, Targets for the proportion of womenin management positions/gender quota, Diversity concept
Scope of application of the regulatory framework(Article 436)
Introduction, Shareholdings
Own funds (Article 437) Regulatory capital, Capital instruments, Minimum capital requirements and additional capitalbuffers, Development of regulatory capital
Capital requirements (Article 438) Key risk metrics, Risk profile, Risk appetite and capacity, Risk and capital plan, Stress testing,Risk identification and assessment, Capital, Leverage Ratio and MREL
Counterparty credit risk (Article 439) Credit risk management, Credit risk exposure, Asset quality, Liquidity risk exposure
Capital buffers (Article 440) Capital, Leverage Ratio and MREL
Indicators of global systemic importance(Article 441)
Disclosed on our webpage
Credit risk (Article 442) Asset quality, Note 1 - Significant accounting policies and critical accounting estimates, Note 13- Financial instruments carried at fair value, Note 14 - Fair value of financial instruments notcarried at fair value, Note 21 - Allowance for credit losses
Unencumbered assets (Article 443) Liquidity risk exposure, Note 22 - Transfer of financial assets, assets pledged and received ascollateral, Note 39 - Information on subsidiaries
Exposure to market risk (Article 445) Capital, Leverage Ratio and MREL, Trading market risk exposures
Operational risk (Article 446) Operational Risk Management, Operational risk exposure, Capital, Leverage Ratio and MREL,Note 29 – Provisions
Exposures in equities not included in the tradingbook (Article 447)
Market Risk Management, Credit risk exposure, Note 1 - Significant accounting policies andcritical accounting estimates, Note 13 - Financial instruments carried at fair value, Note 18 - Equitymethod investments, Note 46 - Shareholdings
Exposure to interest rate risk on positions notincluded in the trading book (Article 448)
Nontrading market risk, Nontrading market risk exposures
Securitization (Article 449) Credit risk management, Market risk management, Note 1 - Significant accounting policies andcritical accounting estimates, Note 13 - Financial instruments carried at fair value
Remuneration policy (Article 450) Compensation report
Leverage (Article 451) Risk management principles, Risk governance, Capital management, Leverage ratio
Use of the IRB approach to credit risk (Article 452) Credit risk management, Credit risk exposure
Use of credit risk mitigation techniques (Article 453) Credit risk management, Credit risk exposure
Use of the advanced measurement approaches tooperational risk (Article 454)
Operational risk management, Operational risk exposure
Use of internal market risk models (Article 455) Market risk management, Trading market risk exposures, Note 13 - Financial instruments carriedat fair value
Liquidity Liquidity risk management, Liquidity risk exposureBusiness risk Business (strategic) risk managementDisclosure requirements according to Article 26aGerman Banking Act (KWG)
Note 41 – Current and non-current assets and liabilitiesNote 42 – Events after the reporting periodNote 44 – Supplementary Information to the consolidated financial statements according tosections 297 (1a) / 315a HGB and the return on assets according to Article 26a of the GermanBanking Act
10
Deutsche Bank Risk management objectives and policiesPillar 3 Report as of December 31, 2018 Article 435 (1)(b) CRR - Risk management structure and organization
Risk management objectives and policies
Article 435 (1)(a) CRR - Risk management strategies andprocessesDeutsche Bank Group discloses the risk management strategies and process in the Annual Report 2018 under sections “Riskmanagement principles” on page 50 and “Risk governance” on page 51.
Credit risk management strategies and processes
The management of credit risk is described in section “Credit risk management” on page 61 in the 2018 Annual Report.
Market risk management strategies and processes
The management of market risk is described in section “Market risk management” on page 72 in the 2018 Annual Report.
Liquidity risk management strategies and processes
The management of liquidity is described in section “Liquidity risk management” on page 83 in the 2018 Annual Report.
Business risk management strategies and processes
The management of business risk is described in sections “Risk identification and assessment” and “Business (strategic) riskmanagement” on pages 61 and 87 respectively in the 2018 Annual Report.
Operational risk management strategies and processes
The management of operational risk is described in section “Operational risk management” on page 78 in the 2018 AnnualReport.
Reputational risk management strategies and processes
The management of reputational risk is described in section “Reputational risk management” on page 89 of the 2018 AnnualReport.
Article 435 (1)(b) CRR - Risk management structure andorganizationDeutsche Bank discloses the overall risk management structure and organization in the 2018 Annual Report, chapter “Riskand capital framework”, section “Risk governance” on page 51.
More detailed descriptions are provided in the following specific chapters.
Credit risk management structure and organization
The structure and organization of credit risk management is described in section “Credit risk management” on pages 61 in the2018 Annual Report.
Market risk management structure and organization
The structure and organization of Market risk management is described in section “Market risk management”, in the 2018Annual Report, specifically in the chapter “Market risk framework” on page 72, “Trading market risk” on page 72 and“Nontrading market risk” on page 76.

11
Deutsche Bank Risk management objectives and policiesPillar 3 Report as of December 31, 2018 Article 435 (1)(c) CRR - Scope and nature of risk reporting and measurement systems
Liquidity risk management structure and organization
The structure and organization of liquidity risk management is described in section “Liquidity risk management”, in the 2018Annual Report, specifically in the chapter “Liquidity risk management framework” on page 83, “Capital markets issuance” onpage 83 and “Short term liquidity and wholesale funding” on page 83.
Business risk management structure and organization
Business risk is managed by the Risk Strategy team within Enterprise Risk Management. Further detail is provided in section“Business (strategic) risk management” in the 2018 Annual Report on page 87.
Operational risk management structure and organization
The structure and organization of operational risk management is described in section “Operational risk management” onpage 78 in the 2018 Annual Report.
Reputational risk management structure and organization
The structure and organization of reputational risk management is described in section “Reputational risk management” onpage 89 in the 2018 Annual Report.
Article 435 (1)(c) CRR - Scope and nature of risk reporting andmeasurement systemsThe nature of our risk reporting and measurement systems are described in the section “Risk reporting and measurementsystems” on page 57 of the Annual Report 2018.
Scope and nature of credit risk reporting and measurement systems
The scope and nature of our credit risk reporting and measurement systems are described in the section “Risk reporting andmeasurement systems” on page 57 of the Annual Report 2018.
Scope and nature of market risk reporting and measurement systems
The scope and nature of our market risk reporting and measurement systems are described in the section “Risk reporting andmeasurement systems” on page 57 of the Annual Report 2018.
Scope and nature of liquidity risk reporting and measurement systems
The scope and nature of our liquidity risk reporting and measurement systems are described in the section “Liquidity riskmanagement” on page 83 and onwards of the Annual Report 2018.
Scope and nature of business risk reporting and measurement systems
Please refer to the section “Capital requirements”, chapter “Business risk economic capital model” on page 34 of this Pillar 3report.
Scope and nature of operational risk reporting and measurement systems
The risk reporting and measurement methodology are described in section “Operational risk management” on page 78 in the2018 Annual Report.
Scope and nature of reputational risk reporting and measurement systems
The scope and nature of our reputational risk reporting and measurement systems are described in the section “Risk reportingand measurement systems” on page 57 of the Annual Report 2018.

12
Deutsche Bank Risk management objectives and policiesPillar 3 Report as of December 31, 2018 Article 435 (1)(e) CRR - Declaration on the adequacy of risk management arrangements
Article 435 (1)(d) CRR - Policies for hedging and mitigating risk
Policies for hedging and mitigating credit risk
The section "Managing and mitigation of credit risk" on page 66 in the Annual Report 2018 provides information on how ourcredit risk is hedged/mitigated on both counterparty and portfolio levels and exposures are disclosed in section “CIB creditexposure” and “CPSG risk mitigation for the CIB credit exposure” on pages 116-118 in the same report.
Policies for hedging and mitigating market risk
The approach to hedging and managing market risk is governed by policies explicitly designed to ensure that all hedgingactivities are risk reducing, not proprietary in nature and are documented prior to trade execution. Hedging activities arereviewed by the relevant business control forum. For a further description of the hedging approach for specific areas in thebanking book, please refer to the section “Nontrading market risk” of the 2018 Annual Report on page 76.
Policies for hedging and mitigating liquidity risk
The policies for mitigating risk, and the strategies and processes for monitoring the continuing effectiveness of mitigantsregarding liquidity risk are described in the section “Liquidity risk management” on page 83 and onwards of the Annual Report2018.
Policies for hedging and mitigating operational risk
The risk mitigating processes regarding operational risk are described in section “Operational risk management” on page 78in the 2018 Annual Report. The hedging of operational risk is described in “Article 454 CRR - Use of the AdvancedMeasurement Approaches to operational risk” on page 151 in this report.
Article 435 (1)(e) CRR - Declaration on the adequacy of riskmanagement arrangementsOur Management Board confirms, for the purpose of Article 435 CRR, that our risk management systems are adequate withregard to our risk profile and strategy.
13
Deutsche Bank Risk management objectives and policiesPillar 3 Report as of December 31, 2018 Article 435 (2)(b) CRR - Recruitment policy for board members
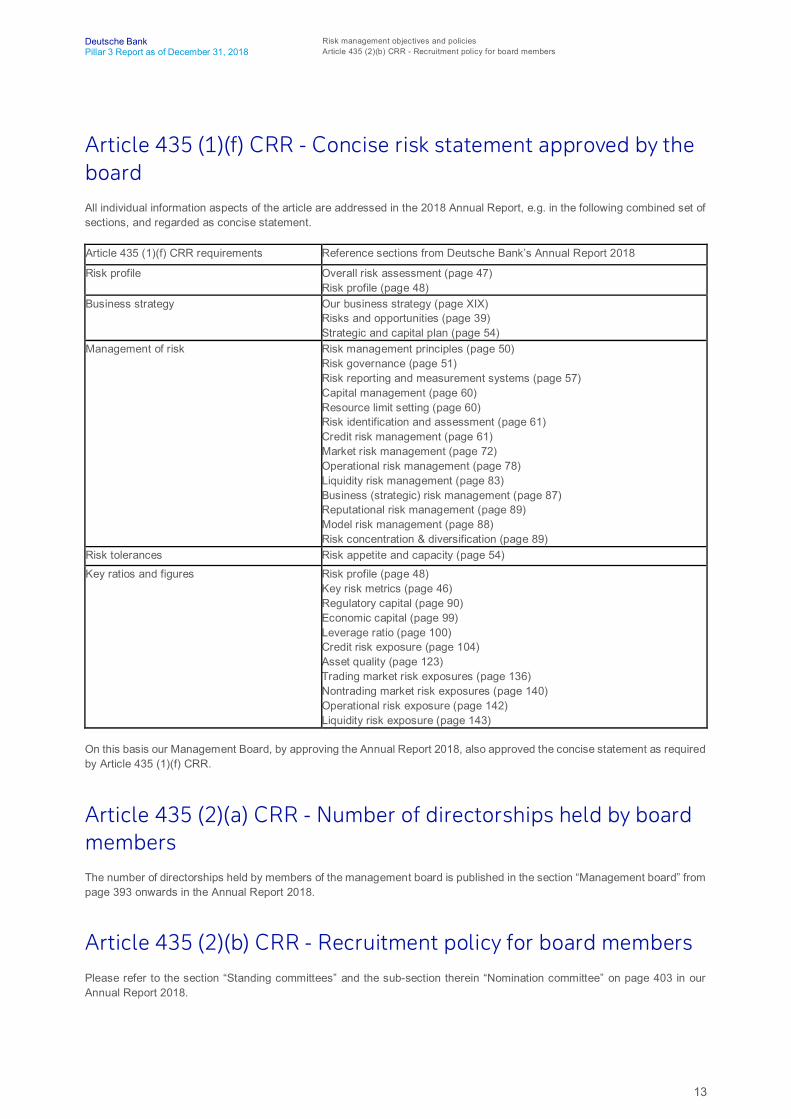
Article 435 (1)(f) CRR - Concise risk statement approved by theboardAll individual information aspects of the article are addressed in the 2018 Annual Report, e.g. in the following combined set ofsections, and regarded as concise statement.
Article 435 (1)(f) CRR requirements Reference sections from Deutsche Bank’s Annual Report 2018
Risk profile Overall risk assessment (page 47)Risk profile (page 48)
Business strategy Our business strategy (page XIX)Risks and opportunities (page 39)Strategic and capital plan (page 54)
Management of risk Risk management principles (page 50)Risk governance (page 51)Risk reporting and measurement systems (page 57)Capital management (page 60)Resource limit setting (page 60)Risk identification and assessment (page 61)Credit risk management (page 61)Market risk management (page 72)Operational risk management (page 78)Liquidity risk management (page 83)Business (strategic) risk management (page 87)Reputational risk management (page 89)Model risk management (page 88)Risk concentration & diversification (page 89)
Risk tolerances Risk appetite and capacity (page 54)
Key ratios and figures Risk profile (page 48)Key risk metrics (page 46)Regulatory capital (page 90)Economic capital (page 99)Leverage ratio (page 100)Credit risk exposure (page 104)Asset quality (page 123)Trading market risk exposures (page 136)Nontrading market risk exposures (page 140)Operational risk exposure (page 142)Liquidity risk exposure (page 143)
On this basis our Management Board, by approving the Annual Report 2018, also approved the concise statement as requiredby Article 435 (1)(f) CRR.
Article 435 (2)(a) CRR - Number of directorships held by boardmembersThe number of directorships held by members of the management board is published in the section “Management board” frompage 393 onwards in the Annual Report 2018.
Article 435 (2)(b) CRR - Recruitment policy for board membersPlease refer to the section “Standing committees” and the sub-section therein “Nomination committee” on page 403 in ourAnnual Report 2018.
14
Deutsche Bank Risk management objectives and policiesPillar 3 Report as of December 31, 2018 Article 435 (2)(d-e) CRR - Risk committee and information flow
Article 435 (2)(c) CRR - Policy on diversity for board membersPlease refer to the section "Diversity concept" on Deutsche Bank's approach and processes to support diversity, includingdiversity objectives, targets and achievements in relation to the management bodies in our Annual Report 2018 on page 412.
Page 412 of the Annual Report 2018 refers in “Targets for the proportion of women in management positions/gender quota”to Deutsche Bank’s approach to the proportion of women in Supervisory Board as well as Management Board. It also showstargets for the first and second level reporting to the Management Board.
On page 393 of the Annual Report 2018, we provide information on duties and responsibilities and procedures of theManagement Board including a reference to the respective Terms of Reference (ToR) link.
The Management Board ToR §5 (9) states inter alia: "In appointing people to management functions in the Group, theManagement Board takes diversity into account and strives, in particular, to achieve an appropriate representation of women".The Annual Report 2018 provides on pages 398 to 402 similar information for the Supervisory Board with specific informationon page 401 on “Objectives for the composition of the Supervisory Board, Profile of Requirements and status ofimplementation”.
Article 435 (2)(d-e) CRR - Risk committee and information flowDedicated risk committees are in place both to support the Supervisory Board (the Risk Committee of the Supervisory Board)as well as the Management Board (the Group Risk Committee, “GRC”).
Please refer to our Annual Report 2018, page VII, chapter “Report of the Supervisory Board”, section “The committees of theSupervisory Board”, paragraph “Risk committee” for the number of meetings the Risk committee of the Supervisory Boardheld in 2018.
The Group Risk Committee generally has held meetings once a week in 2018.
Please refer to our Annual Report 2018, page 57, chapter “Risk and capital framework”, section “Risk reporting andmeasurement systems” for a description of the information flow.
15
Deutsche Bank Scope of application of the regulatory frameworkPillar 3 Report as of December 31, 2018 Article 436 (b) CRR - Difference in basis of consolidation for accounting and prudential purposes
Scope of application of the regulatory framework
Article 436 (a) CRR - Name of the institutionDeutsche Bank Aktiengesellschaft (“Deutsche Bank AG”), headquartered in Frankfurt am Main, Germany, is the parentinstitution of the Deutsche Bank Group of institutions (the “regulatory group”), which is subject to the supervisory regulationsof the KWG and the SolvV, including the references to the CRR and CRD 4. Under Section 10a KWG in conjunction withArticles 11 and 18 CRR, a regulatory group of institutions consists of an institution (meaning a credit institution or an investmentfirm) as the parent company, and all other institutions and financial institutions (comprising inter alia financial holdingcompanies, payment institutions, asset management companies) that are its subsidiaries within the meaning of Article 4 (16)CRR or are jointly managed together with other parties within the meaning of Article 18 (4) CRR. Subsidiaries are fullyconsolidated, while companies which are not subsidiaries are consolidated on a pro-rata basis.
Insurance companies and companies outside the banking and financial sector are not consolidated in the regulatory group ofinstitutions. We do not qualify as a financial conglomerate and are not subject to the respective supplementary supervisions.
Article 436 (b) CRR - Difference in basis of consolidation foraccounting and prudential purposesThe principles of consolidation for our regulatory group are not identical to those applied for our financial statements.Nonetheless, the majority of our subsidiaries in the regulatory group are also fully consolidated in accordance with IFRS inour consolidated financial statements.
The main differences between regulatory and accounting consolidation are:
– Subsidiaries outside the banking and financial sector are not consolidated within the regulatory group of institutions, butare included in the consolidated financial statements according to IFRS.
– Most of our Special Purpose Entities (“SPEs”) consolidated under IFRS do not meet the regulatory subsidiary definitionpursuant to Article 4 (1) (16) CRR and were consequently not consolidated within our regulatory group. However, the risksresulting from our exposures to such entities are reflected in the regulatory capital requirements.
– Only a few entities included in the regulatory group are not consolidated as subsidiaries for accounting purposes but aretreated differently: four, mostly immaterial subsidiaries which were not consolidated for accounting purposes wereconsolidated within the regulatory group; one further entity was jointly managed by us and other owners and wasconsolidated on a pro-rata basis within the regulatory group while for financial accounting purposes it was treated as anfair value through profit or loss asset.
As of year-end 2018, our regulatory group comprised 463 entities (excluding the parent Deutsche Bank Aktiengesellschaft),of which one was consolidated on a pro-rata basis. The classification applied for these entities is in accordance with CRR.The regulatory group comprised 27 credit institutions, two payment institutions, 33 investment firms, 258 financial institutions,16 financial holding companies, 13 asset management companies and 114 ancillary services undertakings.
The classification applied as of year-end 2017, was in accordance with KWG and our regulatory group comprised 535 entities(excluding the parent Deutsche Bank Aktiengesellschaft), of which one was consolidated on a pro-rata basis. The regulatorygroup comprised 92 credit institutions, one payment institution, 52 financial services institutions, 262 financial enterprises,seven asset management companies and 121 ancillary services undertakings.
53 entities were exempted from regulatory consolidation pursuant to Section 31 (3) KWG in conjunction with Article 19 CRRas per year end 2018 (year end 2017: 74 entities). These regulations allow the exclusion of small entities in the regulatoryscope of application from consolidated regulatory reporting if either their total assets (including off-balance sheet items) arebelow € 10 million or below 1 % of our Group’s total assets. Also these entities were not required to be consolidated in ourfinancial statements in accordance with IFRS.
These regulatory unconsolidated entities have to be included in the deduction treatment for significant investments in financialsector entities pursuant to Article 36 (1) (i) CRR in conjunction with Article 43 (c) CRR. The book values of our participationsin their equity included in the deduction treatment amounted to in total € 2 million as per year end 2018 (year end 2017:€ 10 million). We further have applied the deduction treatment to 196 regulatory unconsolidated entities in the financial sector(including three insurance entities) where we have an investment of more than 10 % of the capital of these entities as per year

16
Deutsche Bank Scope of application of the regulatory frameworkPillar 3 Report as of December 31, 2018 Article 436 (b) CRR - Difference in basis of consolidation for accounting and prudential purposes
end 2018 (year end 2017: 208 entities). Pursuant to Article 36 (1) (i) CRR and in conjunction with Article 48 CRR, investmentsin the capital of financial sector entities have to be deducted from CET 1 capital if they exceed in sum 10 % of the institution’sown CET 1 capital or if they exceed in aggregate with deferred tax assets that rely on future profitability and arise fromtemporary differences 15 % of the relevant CET 1 capital.
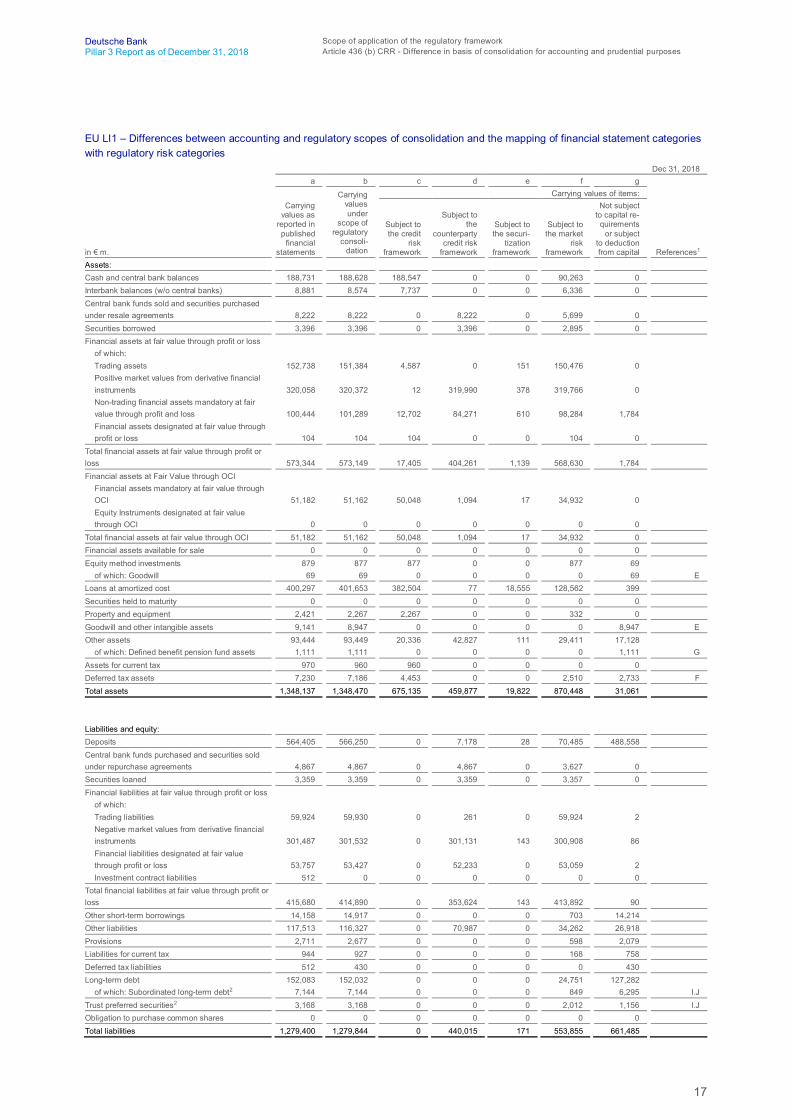
The table EU LI1 below provides an outline of the difference in the basis of consolidation for accounting and prudentialpurposes and also breaks down how the amounts reported in our financial statements, once the regulatory scope ofconsolidation is applied, are to be allocated to the different risk frameworks laid out in Part Three of the CRR. Consequentlywe split our regulatory balance sheet into the parts subject to credit risk, counterparty credit risk, securitization positions in theregulatory banking book, market risk as well as the part which is not subject to capital requirements or relevant for deductionfrom capital. The market risk framework in column (f) includes our trading book exposure, our banking book exposure whichis booked in a currency different from Euro as well as securitization positions in the regulatory trading book. Specific assetsand liabilities may be subject to more than one regulatory risk framework, therefore the sum of values in column (c) to (g) maynot equal to that in column (b). Moreover the allocation of positions to the regulatory trading or banking book as well as theproduct definition impacts the allocation to and treatment within a regulatory framework and might be different to the productdefinition or trading classification under the accounting framework.
Differences between carrying values on the regulatory balance sheet in column (b) and amounts deducted from CRR/CRD 4capital are explained further in the footnotes of the “Own funds template (incl. RWA and Capital Ratios)” as referenced in thelast column of this table.
17
Deutsche Bank Scope of application of the regulatory frameworkPillar 3 Report as of December 31, 2018 Article 436 (b) CRR - Difference in basis of consolidation for accounting and prudential purposes
EU LI1 – Differences between accounting and regulatory scopes of consolidation and the mapping of financial statement categorieswith regulatory risk categories
Dec 31, 2018a b c d e f g
Carryingvaluesunder
scope ofregulatory
consoli-dation
Carrying values of items:
in € m.
Carryingvalues as
reported inpublished
financialstatements
Subject tothe credit
riskframework
Subject tothe
counterpartycredit risk
framework
Subject tothe securi-
tizationframework
Subject tothe market
riskframework
Not subjectto capital re-
quirementsor subject
to deductionfrom capital References1
Assets:Cash and central bank balances 188,731 188,628 188,547 0 0 90,263 0Interbank balances (w/o central banks) 8,881 8,574 7,737 0 0 6,336 0Central bank funds sold and securities purchasedunder resale agreements 8,222 8,222 0 8,222 0 5,699 0Securities borrowed 3,396 3,396 0 3,396 0 2,895 0Financial assets at fair value through profit or loss
of which:Trading assets 152,738 151,384 4,587 0 151 150,476 0Positive market values from derivative financialinstruments 320,058 320,372 12 319,990 378 319,766 0Non-trading financial assets mandatory at fairvalue through profit and loss 100,444 101,289 12,702 84,271 610 98,284 1,784Financial assets designated at fair value throughprofit or loss 104 104 104 0 0 104 0
Total financial assets at fair value through profit orloss 573,344 573,149 17,405 404,261 1,139 568,630 1,784Financial assets at Fair Value through OCI
Financial assets mandatory at fair value throughOCI 51,182 51,162 50,048 1,094 17 34,932 0Equity Instruments designated at fair valuethrough OCI 0 0 0 0 0 0 0
Total financial assets at fair value through OCI 51,182 51,162 50,048 1,094 17 34,932 0Financial assets available for sale 0 0 0 0 0 0 0Equity method investments 879 877 877 0 0 877 69
of which: Goodwill 69 69 0 0 0 0 69 ELoans at amortized cost 400,297 401,653 382,504 77 18,555 128,562 399Securities held to maturity 0 0 0 0 0 0 0Property and equipment 2,421 2,267 2,267 0 0 332 0Goodwill and other intangible assets 9,141 8,947 0 0 0 0 8,947 EOther assets 93,444 93,449 20,336 42,827 111 29,411 17,128
of which: Defined benefit pension fund assets 1,111 1,111 0 0 0 0 1,111 GAssets for current tax 970 960 960 0 0 0 0Deferred tax assets 7,230 7,186 4,453 0 0 2,510 2,733 FTotal assets 1,348,137 1,348,470 675,135 459,877 19,822 870,448 31,061
Liabilities and equity:Deposits 564,405 566,250 0 7,178 28 70,485 488,558Central bank funds purchased and securities soldunder repurchase agreements 4,867 4,867 0 4,867 0 3,627 0Securities loaned 3,359 3,359 0 3,359 0 3,357 0Financial liabilities at fair value through profit or loss
of which:Trading liabilities 59,924 59,930 0 261 0 59,924 2Negative market values from derivative financialinstruments 301,487 301,532 0 301,131 143 300,908 86Financial liabilities designated at fair valuethrough profit or loss 53,757 53,427 0 52,233 0 53,059 2Investment contract liabilities 512 0 0 0 0 0 0
Total financial liabilities at fair value through profit orloss 415,680 414,890 0 353,624 143 413,892 90Other short-term borrowings 14,158 14,917 0 0 0 703 14,214Other liabilities 117,513 116,327 0 70,987 0 34,262 26,918Provisions 2,711 2,677 0 0 0 598 2,079Liabilities for current tax 944 927 0 0 0 168 758Deferred tax liabilities 512 430 0 0 0 0 430Long-term debt 152,083 152,032 0 0 0 24,751 127,282
of which: Subordinated long-term debt2 7,144 7,144 0 0 0 849 6,295 I.JTrust preferred securities2 3,168 3,168 0 0 0 2,012 1,156 I.JObligation to purchase common shares 0 0 0 0 0 0 0Total liabilities 1,279,400 1,279,844 0 440,015 171 553,855 661,485
18
Deutsche Bank Scope of application of the regulatory frameworkPillar 3 Report as of December 31, 2018 Article 436 (b) CRR - Difference in basis of consolidation for accounting and prudential purposes
Dec 31, 2018a b c d e f g
Carryingvaluesunder
scope ofregulatory
consoli-dation
Carrying values of items:
in € m.
Carryingvalues as
reported inpublished
financialstatements
Subject tothe credit
riskframework
Subject tothe
counterpartycredit risk
framework
Subject tothe securi-
tizationframework
Subject tothe market
riskframework
Not subjectto capital re-
quirementsor subject
to deductionfrom capital References1
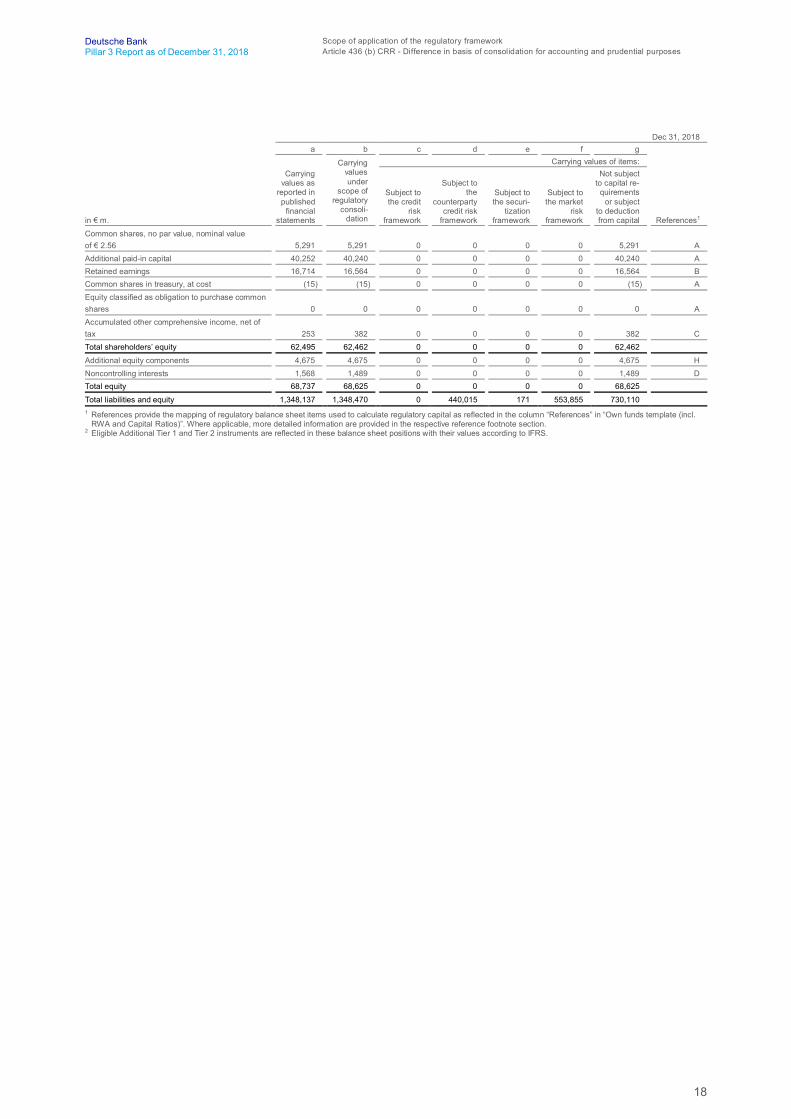
Common shares, no par value, nominal valueof € 2.56 5,291 5,291 0 0 0 0 5,291 AAdditional paid-in capital 40,252 40,240 0 0 0 0 40,240 ARetained earnings 16,714 16,564 0 0 0 0 16,564 BCommon shares in treasury, at cost (15) (15) 0 0 0 0 (15) AEquity classified as obligation to purchase commonshares 0 0 0 0 0 0 0 AAccumulated other comprehensive income, net oftax 253 382 0 0 0 0 382 CTotal shareholders’ equity 62,495 62,462 0 0 0 0 62,462
Additional equity components 4,675 4,675 0 0 0 0 4,675 HNoncontrolling interests 1,568 1,489 0 0 0 0 1,489 DTotal equity 68,737 68,625 0 0 0 0 68,625
Total liabilities and equity 1,348,137 1,348,470 0 440,015 171 553,855 730,1101 References provide the mapping of regulatory balance sheet items used to calculate regulatory capital as reflected in the column “References” in “Own funds template (incl.
RWA and Capital Ratios)”. Where applicable, more detailed information are provided in the respective reference footnote section.2 Eligible Additional Tier 1 and Tier 2 instruments are reflected in these balance sheet positions with their values according to IFRS.
19
Deutsche Bank Scope of application of the regulatory frameworkPillar 3 Report as of December 31, 2018 Article 436 (b) CRR - Difference in basis of consolidation for accounting and prudential purposes
Dec 31, 2017a b c d e f g
Carryingvaluesunder
scope ofregulatory
consoli-dation
Carrying values of items:
in € m.
Carryingvalues as
reported inpublished
financialstatements
Subject tothe credit
riskframework
Subject tothe
counterpartycredit risk
framework
Subject tothe securi-
tizationframework
Subject tothe market
riskframework¹
Not subjectto capital re-
quirementsor subject
to deductionfrom capital References²
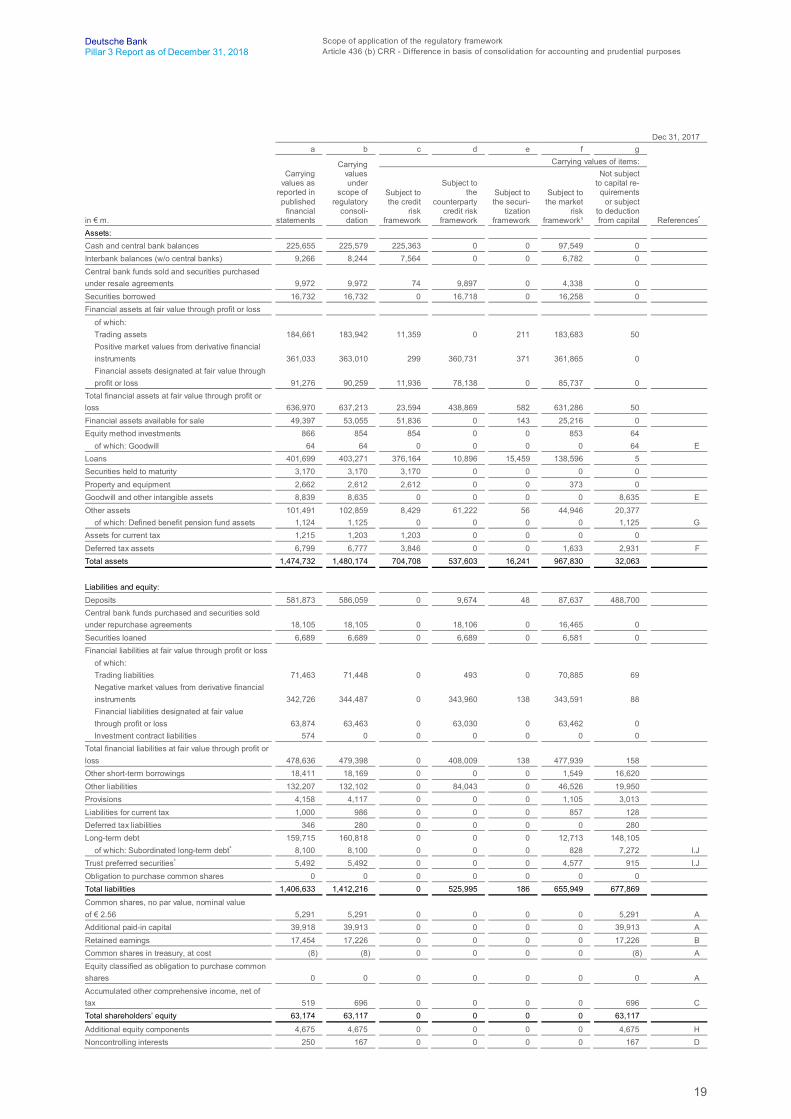
Assets:Cash and central bank balances 225,655 225,579 225,363 0 0 97,549 0Interbank balances (w/o central banks) 9,266 8,244 7,564 0 0 6,782 0Central bank funds sold and securities purchasedunder resale agreements 9,972 9,972 74 9,897 0 4,338 0Securities borrowed 16,732 16,732 0 16,718 0 16,258 0Financial assets at fair value through profit or loss
of which:Trading assets 184,661 183,942 11,359 0 211 183,683 50Positive market values from derivative financialinstruments 361,033 363,010 299 360,731 371 361,865 0Financial assets designated at fair value throughprofit or loss 91,276 90,259 11,936 78,138 0 85,737 0
Total financial assets at fair value through profit orloss 636,970 637,213 23,594 438,869 582 631,286 50Financial assets available for sale 49,397 53,055 51,836 0 143 25,216 0Equity method investments 866 854 854 0 0 853 64
of which: Goodwill 64 64 0 0 0 0 64 ELoans 401,699 403,271 376,164 10,896 15,459 138,596 5Securities held to maturity 3,170 3,170 3,170 0 0 0 0Property and equipment 2,662 2,612 2,612 0 0 373 0Goodwill and other intangible assets 8,839 8,635 0 0 0 0 8,635 EOther assets 101,491 102,859 8,429 61,222 56 44,946 20,377
of which: Defined benefit pension fund assets 1,124 1,125 0 0 0 0 1,125 GAssets for current tax 1,215 1,203 1,203 0 0 0 0Deferred tax assets 6,799 6,777 3,846 0 0 1,633 2,931 FTotal assets 1,474,732 1,480,174 704,708 537,603 16,241 967,830 32,063
Liabilities and equity:Deposits 581,873 586,059 0 9,674 48 87,637 488,700Central bank funds purchased and securities soldunder repurchase agreements 18,105 18,105 0 18,106 0 16,465 0Securities loaned 6,689 6,689 0 6,689 0 6,581 0Financial liabilities at fair value through profit or loss
of which:Trading liabilities 71,463 71,448 0 493 0 70,885 69Negative market values from derivative financialinstruments 342,726 344,487 0 343,960 138 343,591 88Financial liabilities designated at fair valuethrough profit or loss 63,874 63,463 0 63,030 0 63,462 0Investment contract liabilities 574 0 0 0 0 0 0
Total financial liabilities at fair value through profit orloss 478,636 479,398 0 408,009 138 477,939 158Other short-term borrowings 18,411 18,169 0 0 0 1,549 16,620Other liabilities 132,207 132,102 0 84,043 0 46,526 19,950Provisions 4,158 4,117 0 0 0 1,105 3,013Liabilities for current tax 1,000 986 0 0 0 857 128Deferred tax liabilities 346 280 0 0 0 0 280Long-term debt 159,715 160,818 0 0 0 12,713 148,105
of which: Subordinated long-term debt³ 8,100 8,100 0 0 0 828 7,272 I.JTrust preferred securities³ 5,492 5,492 0 0 0 4,577 915 I.JObligation to purchase common shares 0 0 0 0 0 0 0Total liabilities 1,406,633 1,412,216 0 525,995 186 655,949 677,869
Common shares, no par value, nominal valueof € 2.56 5,291 5,291 0 0 0 0 5,291 AAdditional paid-in capital 39,918 39,913 0 0 0 0 39,913 ARetained earnings 17,454 17,226 0 0 0 0 17,226 BCommon shares in treasury, at cost (8) (8) 0 0 0 0 (8) AEquity classified as obligation to purchase commonshares 0 0 0 0 0 0 0 AAccumulated other comprehensive income, net oftax 519 696 0 0 0 0 696 CTotal shareholders’ equity 63,174 63,117 0 0 0 0 63,117
Additional equity components 4,675 4,675 0 0 0 0 4,675 HNoncontrolling interests 250 167 0 0 0 0 167 D
20
Deutsche Bank Scope of application of the regulatory frameworkPillar 3 Report as of December 31, 2018 Article 436 (b) CRR - Difference in basis of consolidation for accounting and prudential purposes
Dec 31, 2017a b c d e f g
Carryingvaluesunder
scope ofregulatory
consoli-dation
Carrying values of items:
in € m.
Carryingvalues as
reported inpublished
financialstatements
Subject tothe credit
riskframework
Subject tothe
counterpartycredit risk
framework
Subject tothe securi-
tizationframework
Subject tothe market
riskframework¹
Not subjectto capital re-
quirementsor subject
to deductionfrom capital References²
Total equity 68,099 67,959 0 0 0 0 67,959
Total liabilities and equity 1,474,732 1,480,174 0 525,995 186 655,949 745,8281 The approach to assign positions to the market risk framework has been revised for deferred tax assets to account also for the non-EUR portion. The numbers for year end
2017 have been adjusted accordingly.2 References provide the mapping of regulatory balance sheet items used to calculate regulatory capital as reflected in the column “References” in “Own funds template (incl.
RWA and Capital Ratios)”. Where applicable, more detailed information are provided in the respective reference footnote section.3 Eligible Additional Tier 1 and Tier 2 instruments are reflected in these balance sheet positions with their values according to IFRS.
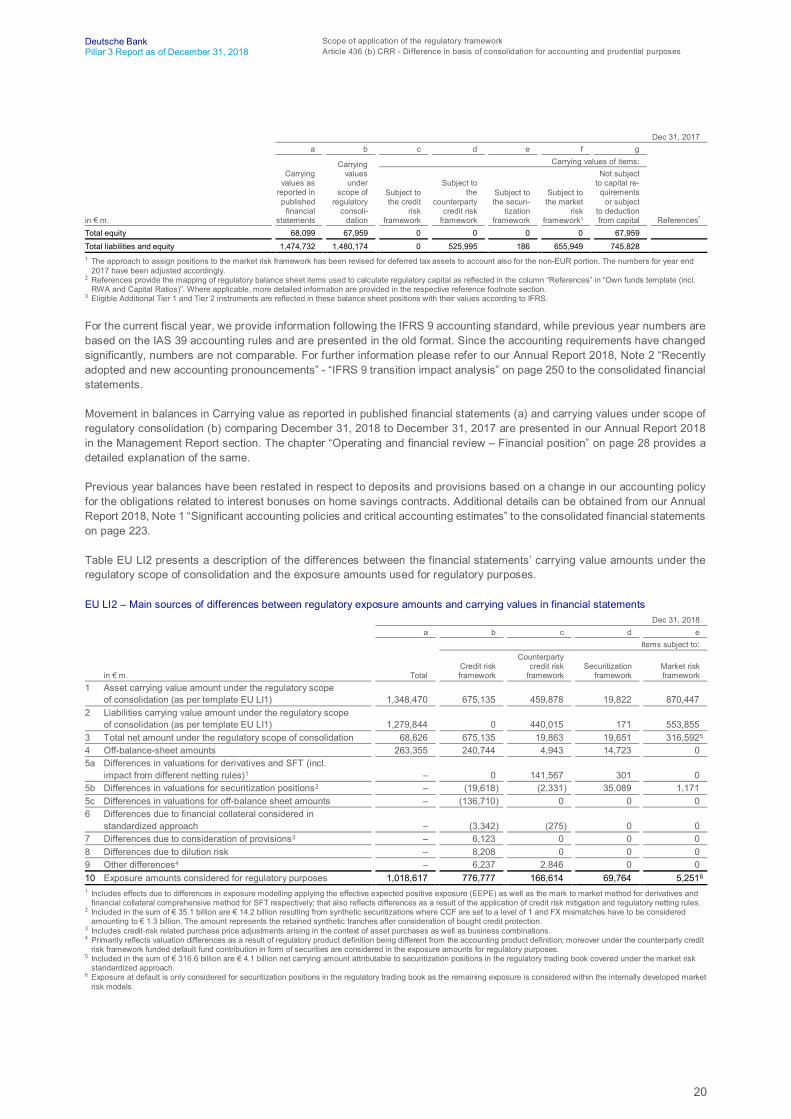
For the current fiscal year, we provide information following the IFRS 9 accounting standard, while previous year numbers arebased on the IAS 39 accounting rules and are presented in the old format. Since the accounting requirements have changedsignificantly, numbers are not comparable. For further information please refer to our Annual Report 2018, Note 2 “Recentlyadopted and new accounting pronouncements” - “IFRS 9 transition impact analysis” on page 250 to the consolidated financialstatements.
Movement in balances in Carrying value as reported in published financial statements (a) and carrying values under scope ofregulatory consolidation (b) comparing December 31, 2018 to December 31, 2017 are presented in our Annual Report 2018in the Management Report section. The chapter “Operating and financial review – Financial position” on page 28 provides adetailed explanation of the same.
Previous year balances have been restated in respect to deposits and provisions based on a change in our accounting policyfor the obligations related to interest bonuses on home savings contracts. Additional details can be obtained from our AnnualReport 2018, Note 1 “Significant accounting policies and critical accounting estimates” to the consolidated financial statementson page 223.
Table EU LI2 presents a description of the differences between the financial statements’ carrying value amounts under theregulatory scope of consolidation and the exposure amounts used for regulatory purposes.
EU LI2 – Main sources of differences between regulatory exposure amounts and carrying values in financial statementsDec 31, 2018
a b c d eItems subject to:
in € m. TotalCredit riskframework
Counterpartycredit risk
frameworkSecuritization
frameworkMarket riskframework
1 Asset carrying value amount under the regulatory scopeof consolidation (as per template EU LI1) 1,348,470 675,135 459,878 19,822 870,447
2 Liabilities carrying value amount under the regulatory scopeof consolidation (as per template EU LI1) 1,279,844 0 440,015 171 553,855
3 Total net amount under the regulatory scope of consolidation 68,626 675,135 19,863 19,651 316,5925
4 Off-balance-sheet amounts 263,355 240,744 4,943 14,723 05a Differences in valuations for derivatives and SFT (incl.
impact from different netting rules)1 – 0 141,567 301 05b Differences in valuations for securitization positions2 – (19,618) (2,331) 35,089 1,1715c Differences in valuations for off-balance sheet amounts – (136,710) 0 0 06 Differences due to financial collateral considered in
standardized approach – (3,342) (275) 0 07 Differences due to consideration of provisions3 – 6,123 0 0 08 Differences due to dilution risk – 8,208 0 0 09 Other differences4 – 6,237 2,846 0 010 Exposure amounts considered for regulatory purposes 1,018,617 776,777 166,614 69,764 5,2516
1 Includes effects due to differences in exposure modelling applying the effective expected positive exposure (EEPE) as well as the mark to market method for derivatives andfinancial collateral comprehensive method for SFT respectively; that also reflects differences as a result of the application of credit risk mitigation and regulatory netting rules.
2 Included in the sum of € 35.1 billion are € 14.2 billion resulting from synthetic securitizations where CCF are set to a level of 1 and FX mismatches have to be consideredamounting to € 1.3 billion. The amount represents the retained synthetic tranches after consideration of bought credit protection.
3 Includes credit-risk related purchase price adjustments arising in the context of asset purchases as well as business combinations.4 Primarily reflects valuation differences as a result of regulatory product definition being different from the accounting product definition; moreover under the counterparty credit
risk framework funded default fund contribution in form of securities are considered in the exposure amounts for regulatory purposes.5 Included in the sum of € 316.6 billion are € 4.1 billion net carrying amount attributable to securitization positions in the regulatory trading book covered under the market risk
standardized approach.6 Exposure at default is only considered for securitization positions in the regulatory trading book as the remaining exposure is considered within the internally developed market
risk models.
21
Deutsche Bank Scope of application of the regulatory frameworkPillar 3 Report as of December 31, 2018 Article 436 (e) CRR - Derogations from prudential or liquidity requirements for subsidiaries
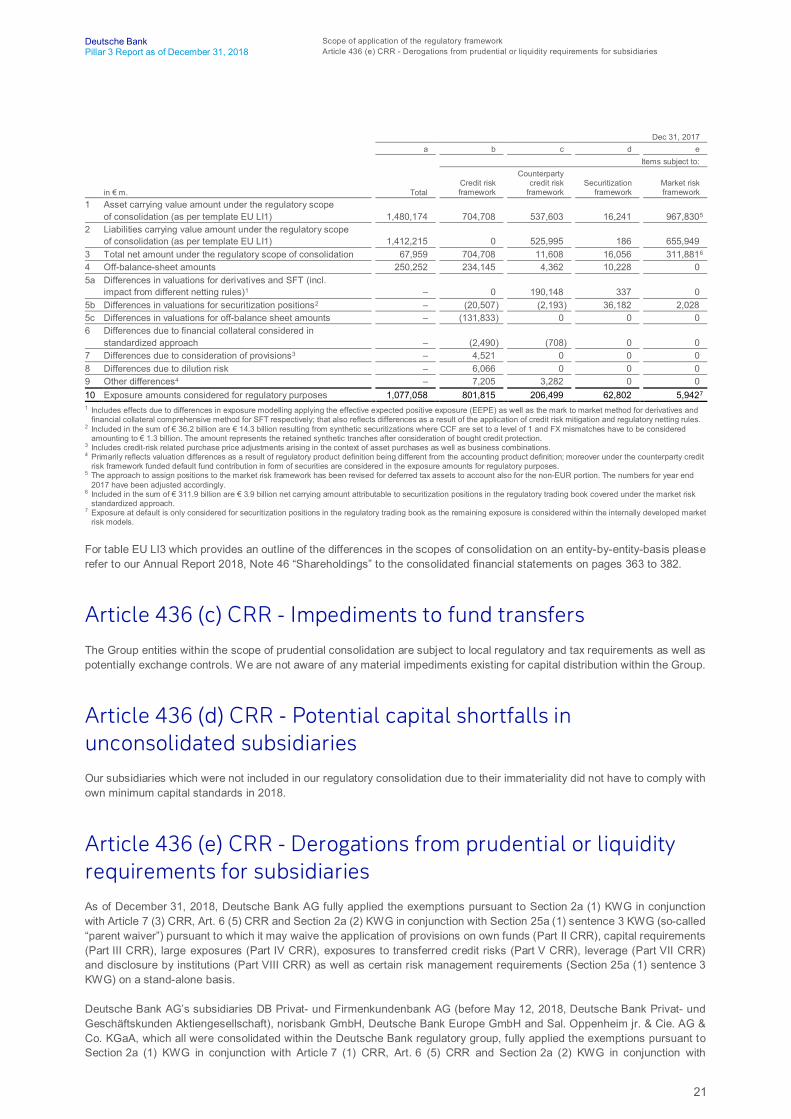
Dec 31, 2017a b c d e
Items subject to:
in € m. TotalCredit riskframework
Counterpartycredit risk
frameworkSecuritization
frameworkMarket riskframework
1 Asset carrying value amount under the regulatory scopeof consolidation (as per template EU LI1) 1,480,174 704,708 537,603 16,241 967,8305
2 Liabilities carrying value amount under the regulatory scopeof consolidation (as per template EU LI1) 1,412,215 0 525,995 186 655,949
3 Total net amount under the regulatory scope of consolidation 67,959 704,708 11,608 16,056 311,8816
4 Off-balance-sheet amounts 250,252 234,145 4,362 10,228 05a Differences in valuations for derivatives and SFT (incl.
impact from different netting rules)1 – 0 190,148 337 05b Differences in valuations for securitization positions2 – (20,507) (2,193) 36,182 2,0285c Differences in valuations for off-balance sheet amounts – (131,833) 0 0 06 Differences due to financial collateral considered in
standardized approach – (2,490) (708) 0 07 Differences due to consideration of provisions3 – 4,521 0 0 08 Differences due to dilution risk – 6,066 0 0 09 Other differences4 – 7,205 3,282 0 010 Exposure amounts considered for regulatory purposes 1,077,058 801,815 206,499 62,802 5,9427
1 Includes effects due to differences in exposure modelling applying the effective expected positive exposure (EEPE) as well as the mark to market method for derivatives andfinancial collateral comprehensive method for SFT respectively; that also reflects differences as a result of the application of credit risk mitigation and regulatory netting rules.
2 Included in the sum of € 36.2 billion are € 14.3 billion resulting from synthetic securitizations where CCF are set to a level of 1 and FX mismatches have to be consideredamounting to € 1.3 billion. The amount represents the retained synthetic tranches after consideration of bought credit protection.
3 Includes credit-risk related purchase price adjustments arising in the context of asset purchases as well as business combinations.4 Primarily reflects valuation differences as a result of regulatory product definition being different from the accounting product definition; moreover under the counterparty credit
risk framework funded default fund contribution in form of securities are considered in the exposure amounts for regulatory purposes.5 The approach to assign positions to the market risk framework has been revised for deferred tax assets to account also for the non-EUR portion. The numbers for year end
2017 have been adjusted accordingly.6 Included in the sum of € 311.9 billion are € 3.9 billion net carrying amount attributable to securitization positions in the regulatory trading book covered under the market risk
standardized approach.7 Exposure at default is only considered for securitization positions in the regulatory trading book as the remaining exposure is considered within the internally developed market
risk models.
For table EU LI3 which provides an outline of the differences in the scopes of consolidation on an entity-by-entity-basis pleaserefer to our Annual Report 2018, Note 46 “Shareholdings” to the consolidated financial statements on pages 363 to 382.
Article 436 (c) CRR - Impediments to fund transfersThe Group entities within the scope of prudential consolidation are subject to local regulatory and tax requirements as well aspotentially exchange controls. We are not aware of any material impediments existing for capital distribution within the Group.
Article 436 (d) CRR - Potential capital shortfalls inunconsolidated subsidiariesOur subsidiaries which were not included in our regulatory consolidation due to their immateriality did not have to comply withown minimum capital standards in 2018.
Article 436 (e) CRR - Derogations from prudential or liquidityrequirements for subsidiariesAs of December 31, 2018, Deutsche Bank AG fully applied the exemptions pursuant to Section 2a (1) KWG in conjunctionwith Article 7 (3) CRR, Art. 6 (5) CRR and Section 2a (2) KWG in conjunction with Section 25a (1) sentence 3 KWG (so-called“parent waiver”) pursuant to which it may waive the application of provisions on own funds (Part II CRR), capital requirements(Part III CRR), large exposures (Part IV CRR), exposures to transferred credit risks (Part V CRR), leverage (Part VII CRR)and disclosure by institutions (Part VIII CRR) as well as certain risk management requirements (Section 25a (1) sentence 3KWG) on a stand-alone basis.
Deutsche Bank AG’s subsidiaries DB Privat- und Firmenkundenbank AG (before May 12, 2018, Deutsche Bank Privat- undGeschäftskunden Aktiengesellschaft), norisbank GmbH, Deutsche Bank Europe GmbH and Sal. Oppenheim jr. & Cie. AG &Co. KGaA, which all were consolidated within the Deutsche Bank regulatory group, fully applied the exemptions pursuant toSection 2a (1) KWG in conjunction with Article 7 (1) CRR, Art. 6 (5) CRR and Section 2a (2) KWG in conjunction with

22
Deutsche Bank Scope of application of the regulatory frameworkPillar 3 Report as of December 31, 2018 Article 436 (e) CRR - Derogations from prudential or liquidity requirements for subsidiaries
Section 25a (1) sentence 3 KWG (so-called “subsidiary waiver”) pursuant to which they may waive certain regulatoryrequirements to the same extent as Deutsche Bank AG (see preceding paragraph) on a stand-alone basis. In addition,Deutsche Bank AG’s subsidiaries Deutsche Immobilien Leasing GmbH and Leasing Verwaltungsgesellschaft WaltersdorfmbH, also consolidated within the Deutsche Bank regulatory group, applied the “subsidiary waiver” rules to the extentapplicable to them, i.e. with regard to certain risk management requirements pursuant to Section 25a (1) sentence 3 KWG.
These exemptions are available only for group companies in Germany and can only be applied if, amongst others, the riskstrategies and risk management processes of Deutsche Bank AG or the Group also include the companies that apply the“waiver” rules and there is no material practical or legal impediment to the prompt transfer of own funds or repayment ofliabilities from Deutsche Bank AG to the respective subsidiaries or from subsidiaries in the Group to Deutsche Bank AG.
The application of the aforementioned exemptions and the fulfillment of the respective requirements were notified to the BaFinand Deutsche Bundesbank on the basis of Section 2a (1) or (6) KWG in its version applicable until December 31, 2013.Pursuant to Section 2a (5) KWG the exemptions based on these notifications are grandfathered, i.e. the “waivers” are deemedto be granted under the current CRR and KWG rules. With regard to DB Privat- und Firmenkundenbank AG, the EuropeanCentral Bank (ECB) has renewed the “waiver” in connection with the merger with Deutsche Postbank AG in May 2018.
Article 18 CRR Additional Disclosure Requirements for Significant Subsidiaries
In line with Article 13 (1) CRR our significant subsidiaries and those subsidiaries which are of significance for their local marketare required to disclose information to the extent applicable in respect of own funds, capital requirements, capital buffers,credit risk adjustments, remuneration policy, leverage and use of credit risk mitigation techniques on an individual or sub-consolidated basis.
For some of our subsidiaries located in Germany it is not mandatory to calculate or report regulatory capital or leverage ratioson a stand-alone basis if they qualify for the exemptions codified in the waiver rule pursuant to Section 2a KWG in conjunctionwith Article 7 CRR. In these cases, the above-mentioned disclosure requirements are also not applicable for thosesubsidiaries.
In order to identify significant subsidiaries a catalogue of criteria has been developed, applied to all subsidiaries classified as“credit institution” or “investment firm” under the CRR and not qualifying for a waiver status pursuant to Section 2a KWG inconjunction with Article 7 CRR. A subsidiary is required to comply with the requirements in Article 13 CRR (as describedabove) if at least one criterion mentioned in the list below has been met. The criteria have been defined in relation to ourbusiness activities as well as the complexity and risk profile of the respective subsidiary. All figures referenced below arecalculated on an IFRS basis as of December 31, 2018:
– Total Assets of € 30 billion or more (on individual or sub-consolidated basis)– Five percent or more of our risk-weighted assets on group level– 20 percent or more of the gross domestic product in its respective country, in which the subsidiary is located, but at least
total assets of € five billion (on individual or sub-consolidated basis)– Institutions directly supported by the European Stability Mechanism (ESM), European Financial Stability Facility (EFSF) or
similar mechanisms– Institutions belonging to the three largest institutions in their respective countries, in which the subsidiary is located
(referring to the amount of total assets)– Classification as “local systemically important institution” by the local competent authority
None of our subsidiaries have received support from any kind of stability mechanism.
As a result of the selection process described above, we identified two subsidiaries as “significant” for the Group and hencerequired to provide additional disclosure requirements as laid down in Article 13 CRR:
– Deutsche Bank Luxembourg S.A., Luxembourg– DB USA Corporation, United States of America
The additional disclosures for our significant subsidiaries in relation to Article 13 CRR can be found either within the Pillar 3Reports of the respective subsidiary as published on its website or on the Group’s website for DB USA Corporation.
23
Deutsche Bank Own fundsPillar 3 Report as of December 31, 2018 Article 437 (1)(a,d-e) CRR - Regulatory capital composition, prudential filters and deduction items
Own funds
Capital adequacyThe calculation of our regulatory capital incorporates the capital requirements following the “Regulation (EU) No 575/2013 onprudential requirements for credit institutions and investment firms” (Capital Requirements Regulation or “CRR”) and the“Directive 2013/36/EU on access to the activity of credit institutions and the prudential supervision of credit institutions andinvestment firms” (Capital Requirements Directive 4 or “CRD 4”) as implemented into German law. The information in thissection as well as in the section “Article 438 (c-f) CRR - Overview of capital requirements” is based on the regulatory principlesof consolidation.
Article 437 (1)(a,d-e) CRR - Regulatory capital composition,prudential filters and deduction items
Development of regulatory capital
Our CRR/CRD 4 Tier 1 capital as of December 31, 2018 amounted to € 55.1 billion, consisting of a Common Equity Tier 1(CET 1) capital of € 47.5 billion and Additional Tier 1 (AT1) capital of € 7.6 billion. The CRR/CRD 4 Tier 1 capital was € 0.4billion lower than at the end of June 2018, driven by a decrease in CET 1 capital of € 0.4 billion.
The € 0.4 billion decrease of CRR/CRD 4 CET 1 capital was largely the result of negative effects from regulatory adjustmentsfrom prudential filters (Additional valuation adjustments) of € 0.3 billion and CET 1 capital deduction of irrevocable paymentcommitments related to the Single Resolution Fund and the Deposit Guarantee Scheme of € 0.1 billion. As of December 31,2018 our positive net income of € 0.3 billion was completely offset by our dividend and AT1 coupon accrual of € 0.3 billion forthe year-end 2018 which is in line with the ECB Decision (EU) (2015/656) on the recognition of interim or year-end profits inCET 1 capital in accordance with the Article 26(2) of Regulation (EU) No 575/2013 (ECB/2015/4).
Our fully loaded CRR/CRD 4 Tier 1 capital as of December 31, 2018 was € 52.1 billion, compared to € 52.5 billion at the endof June 2018. Our fully loaded CRR/CRD 4 CET 1 capital amounted to € 47.5 billion as of December 31, 2018, compared to€ 47.9 billion as of June 30, 2018. Our fully loaded CRR/CRD 4 Additional Tier 1 capital amounted to € 4.6 billion as per endof December 2018, unchanged compared to June 2018.
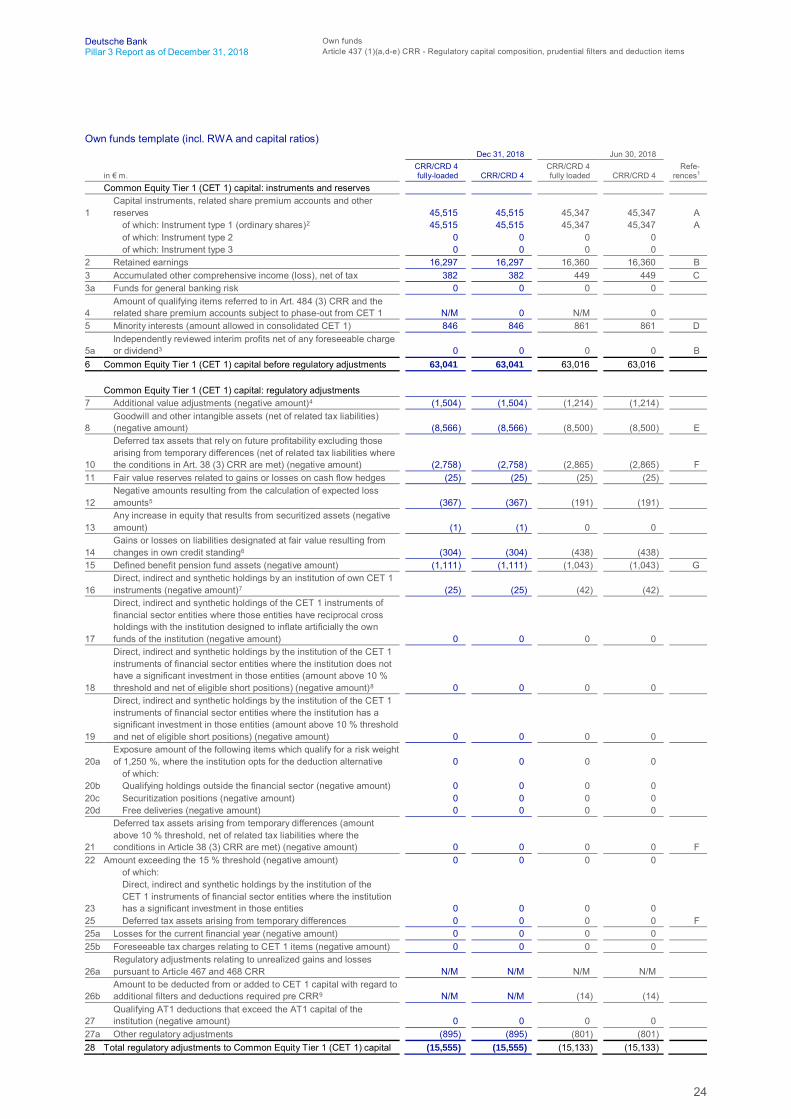
24
Deutsche Bank Own fundsPillar 3 Report as of December 31, 2018 Article 437 (1)(a,d-e) CRR - Regulatory capital composition, prudential filters and deduction items
Own funds template (incl. RWA and capital ratios)Dec 31, 2018 Jun 30, 2018
in € m.CRR/CRD 4fully-loaded CRR/CRD 4
CRR/CRD 4fully loaded CRR/CRD 4
Refe-rences1
Common Equity Tier 1 (CET 1) capital: instruments and reserves
1Capital instruments, related share premium accounts and otherreserves 45,515 45,515 45,347 45,347 A
of which: Instrument type 1 (ordinary shares)2 45,515 45,515 45,347 45,347 Aof which: Instrument type 2 0 0 0 0of which: Instrument type 3 0 0 0 0
2 Retained earnings 16,297 16,297 16,360 16,360 B3 Accumulated other comprehensive income (loss), net of tax 382 382 449 449 C3a Funds for general banking risk 0 0 0 0
4Amount of qualifying items referred to in Art. 484 (3) CRR and therelated share premium accounts subject to phase-out from CET 1 N/M 0 N/M 0
5 Minority interests (amount allowed in consolidated CET 1) 846 846 861 861 D
5aIndependently reviewed interim profits net of any foreseeable chargeor dividend3 0 0 0 0 B
6 Common Equity Tier 1 (CET 1) capital before regulatory adjustments 63,041 63,041 63,016 63,016
Common Equity Tier 1 (CET 1) capital: regulatory adjustments7 Additional value adjustments (negative amount)4 (1,504) (1,504) (1,214) (1,214)
8Goodwill and other intangible assets (net of related tax liabilities)(negative amount) (8,566) (8,566) (8,500) (8,500) E
10
Deferred tax assets that rely on future profitability excluding thosearising from temporary differences (net of related tax liabilities wherethe conditions in Art. 38 (3) CRR are met) (negative amount) (2,758) (2,758) (2,865) (2,865) F
11 Fair value reserves related to gains or losses on cash flow hedges (25) (25) (25) (25)
12Negative amounts resulting from the calculation of expected lossamounts5 (367) (367) (191) (191)
13Any increase in equity that results from securitized assets (negativeamount) (1) (1) 0 0
14Gains or losses on liabilities designated at fair value resulting fromchanges in own credit standing6 (304) (304) (438) (438)
15 Defined benefit pension fund assets (negative amount) (1,111) (1,111) (1,043) (1,043) G
16Direct, indirect and synthetic holdings by an institution of own CET 1instruments (negative amount)7 (25) (25) (42) (42)
17
Direct, indirect and synthetic holdings of the CET 1 instruments offinancial sector entities where those entities have reciprocal crossholdings with the institution designed to inflate artificially the ownfunds of the institution (negative amount) 0 0 0 0
18
Direct, indirect and synthetic holdings by the institution of the CET 1instruments of financial sector entities where the institution does nothave a significant investment in those entities (amount above 10 %threshold and net of eligible short positions) (negative amount)8 0 0 0 0
19
Direct, indirect and synthetic holdings by the institution of the CET 1instruments of financial sector entities where the institution has asignificant investment in those entities (amount above 10 % thresholdand net of eligible short positions) (negative amount) 0 0 0 0
20aExposure amount of the following items which qualify for a risk weightof 1,250 %, where the institution opts for the deduction alternative 0 0 0 0
of which:20b Qualifying holdings outside the financial sector (negative amount) 0 0 0 020c Securitization positions (negative amount) 0 0 0 020d Free deliveries (negative amount) 0 0 0 0
21
Deferred tax assets arising from temporary differences (amountabove 10 % threshold, net of related tax liabilities where theconditions in Article 38 (3) CRR are met) (negative amount) 0 0 0 0 F
22 Amount exceeding the 15 % threshold (negative amount) 0 0 0 0of which:
23
Direct, indirect and synthetic holdings by the institution of theCET 1 instruments of financial sector entities where the institutionhas a significant investment in those entities 0 0 0 0
25 Deferred tax assets arising from temporary differences 0 0 0 0 F25a Losses for the current financial year (negative amount) 0 0 0 025b Foreseeable tax charges relating to CET 1 items (negative amount) 0 0 0 0
26aRegulatory adjustments relating to unrealized gains and lossespursuant to Article 467 and 468 CRR N/M N/M N/M N/M
26bAmount to be deducted from or added to CET 1 capital with regard toadditional filters and deductions required pre CRR9 N/M N/M (14) (14)
27Qualifying AT1 deductions that exceed the AT1 capital of theinstitution (negative amount) 0 0 0 0
27a Other regulatory adjustments (895) (895) (801) (801)28 Total regulatory adjustments to Common Equity Tier 1 (CET 1) capital (15,555) (15,555) (15,133) (15,133)
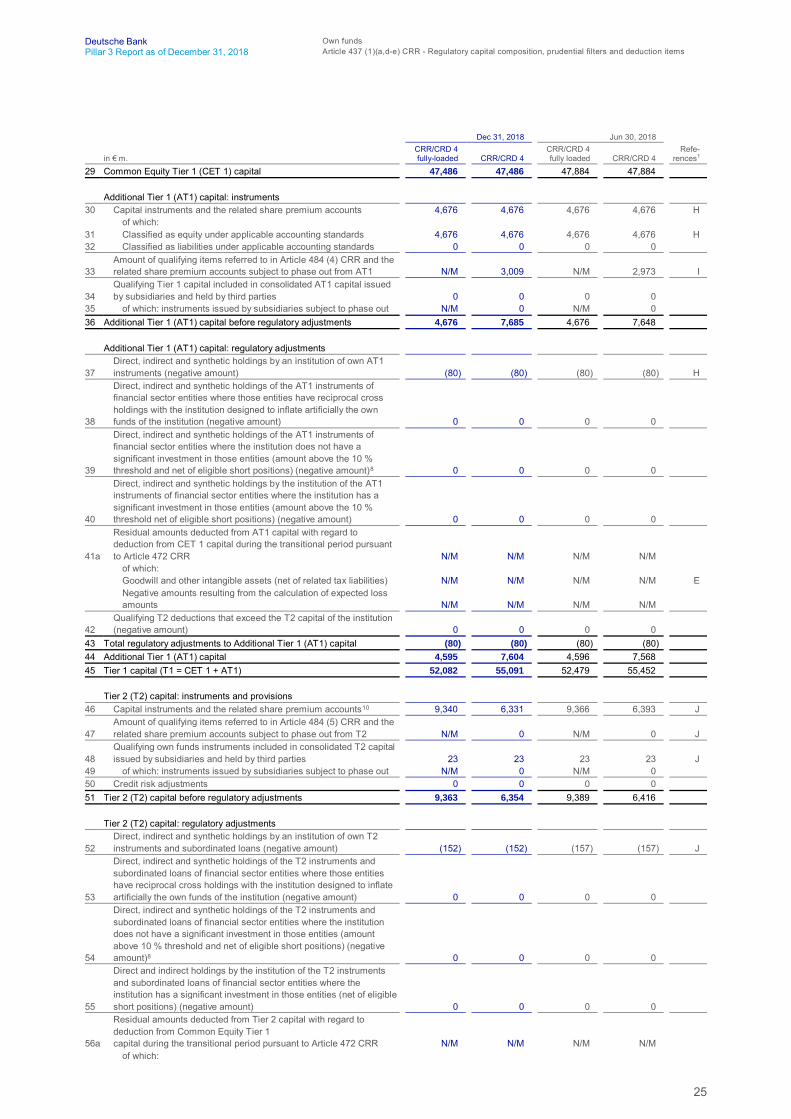
25
Deutsche Bank Own fundsPillar 3 Report as of December 31, 2018 Article 437 (1)(a,d-e) CRR - Regulatory capital composition, prudential filters and deduction items
Dec 31, 2018 Jun 30, 2018
in € m.CRR/CRD 4fully-loaded CRR/CRD 4
CRR/CRD 4fully loaded CRR/CRD 4
Refe-rences1
29 Common Equity Tier 1 (CET 1) capital 47,486 47,486 47,884 47,884
Additional Tier 1 (AT1) capital: instruments30 Capital instruments and the related share premium accounts 4,676 4,676 4,676 4,676 H
of which:31 Classified as equity under applicable accounting standards 4,676 4,676 4,676 4,676 H32 Classified as liabilities under applicable accounting standards 0 0 0 0
33Amount of qualifying items referred to in Article 484 (4) CRR and therelated share premium accounts subject to phase out from AT1 N/M 3,009 N/M 2,973 I
34Qualifying Tier 1 capital included in consolidated AT1 capital issuedby subsidiaries and held by third parties 0 0 0 0
35 of which: instruments issued by subsidiaries subject to phase out N/M 0 N/M 036 Additional Tier 1 (AT1) capital before regulatory adjustments 4,676 7,685 4,676 7,648
Additional Tier 1 (AT1) capital: regulatory adjustments
37Direct, indirect and synthetic holdings by an institution of own AT1instruments (negative amount) (80) (80) (80) (80) H
38
Direct, indirect and synthetic holdings of the AT1 instruments offinancial sector entities where those entities have reciprocal crossholdings with the institution designed to inflate artificially the ownfunds of the institution (negative amount) 0 0 0 0
39
Direct, indirect and synthetic holdings of the AT1 instruments offinancial sector entities where the institution does not have asignificant investment in those entities (amount above the 10 %threshold and net of eligible short positions) (negative amount)8 0 0 0 0
40
Direct, indirect and synthetic holdings by the institution of the AT1instruments of financial sector entities where the institution has asignificant investment in those entities (amount above the 10 %threshold net of eligible short positions) (negative amount) 0 0 0 0
41a
Residual amounts deducted from AT1 capital with regard todeduction from CET 1 capital during the transitional period pursuantto Article 472 CRR N/M N/M N/M N/M
of which:Goodwill and other intangible assets (net of related tax liabilities) N/M N/M N/M N/M ENegative amounts resulting from the calculation of expected lossamounts N/M N/M N/M N/M
42Qualifying T2 deductions that exceed the T2 capital of the institution(negative amount) 0 0 0 0
43 Total regulatory adjustments to Additional Tier 1 (AT1) capital (80) (80) (80) (80)44 Additional Tier 1 (AT1) capital 4,595 7,604 4,596 7,56845 Tier 1 capital (T1 = CET 1 + AT1) 52,082 55,091 52,479 55,452
Tier 2 (T2) capital: instruments and provisions46 Capital instruments and the related share premium accounts10 9,340 6,331 9,366 6,393 J
47Amount of qualifying items referred to in Article 484 (5) CRR and therelated share premium accounts subject to phase out from T2 N/M 0 N/M 0 J
48Qualifying own funds instruments included in consolidated T2 capitalissued by subsidiaries and held by third parties 23 23 23 23 J
49 of which: instruments issued by subsidiaries subject to phase out N/M 0 N/M 050 Credit risk adjustments 0 0 0 051 Tier 2 (T2) capital before regulatory adjustments 9,363 6,354 9,389 6,416
Tier 2 (T2) capital: regulatory adjustments
52Direct, indirect and synthetic holdings by an institution of own T2instruments and subordinated loans (negative amount) (152) (152) (157) (157) J
53
Direct, indirect and synthetic holdings of the T2 instruments andsubordinated loans of financial sector entities where those entitieshave reciprocal cross holdings with the institution designed to inflateartificially the own funds of the institution (negative amount) 0 0 0 0
54
Direct, indirect and synthetic holdings of the T2 instruments andsubordinated loans of financial sector entities where the institutiondoes not have a significant investment in those entities (amountabove 10 % threshold and net of eligible short positions) (negativeamount)8 0 0 0 0
55
Direct and indirect holdings by the institution of the T2 instrumentsand subordinated loans of financial sector entities where theinstitution has a significant investment in those entities (net of eligibleshort positions) (negative amount) 0 0 0 0
56a
Residual amounts deducted from Tier 2 capital with regard todeduction from Common Equity Tier 1capital during the transitional period pursuant to Article 472 CRR N/M N/M N/M N/M
of which:
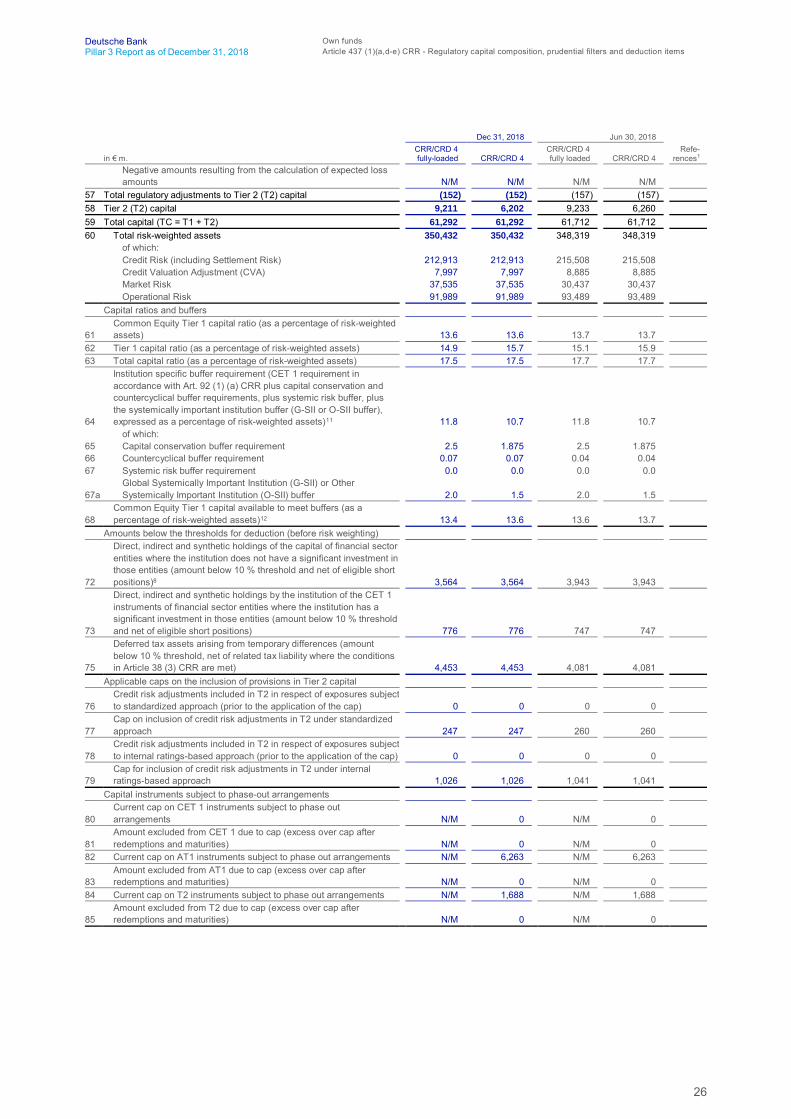
26
Deutsche Bank Own fundsPillar 3 Report as of December 31, 2018 Article 437 (1)(a,d-e) CRR - Regulatory capital composition, prudential filters and deduction items
Dec 31, 2018 Jun 30, 2018
in € m.CRR/CRD 4fully-loaded CRR/CRD 4
CRR/CRD 4fully loaded CRR/CRD 4
Refe-rences1
Negative amounts resulting from the calculation of expected lossamounts N/M N/M N/M N/M
57 Total regulatory adjustments to Tier 2 (T2) capital (152) (152) (157) (157)58 Tier 2 (T2) capital 9,211 6,202 9,233 6,26059 Total capital (TC = T1 + T2) 61,292 61,292 61,712 61,71260 Total risk-weighted assets 350,432 350,432 348,319 348,319
of which:Credit Risk (including Settlement Risk) 212,913 212,913 215,508 215,508Credit Valuation Adjustment (CVA) 7,997 7,997 8,885 8,885Market Risk 37,535 37,535 30,437 30,437Operational Risk 91,989 91,989 93,489 93,489
Capital ratios and buffers
61Common Equity Tier 1 capital ratio (as a percentage of risk-weightedassets) 13.6 13.6 13.7 13.7
62 Tier 1 capital ratio (as a percentage of risk-weighted assets) 14.9 15.7 15.1 15.963 Total capital ratio (as a percentage of risk-weighted assets) 17.5 17.5 17.7 17.7
64
Institution specific buffer requirement (CET 1 requirement inaccordance with Art. 92 (1) (a) CRR plus capital conservation andcountercyclical buffer requirements, plus systemic risk buffer, plusthe systemically important institution buffer (G-SII or O-SII buffer),expressed as a percentage of risk-weighted assets)11 11.8 10.7 11.8 10.7
of which:65 Capital conservation buffer requirement 2.5 1.875 2.5 1.87566 Countercyclical buffer requirement 0.07 0.07 0.04 0.0467 Systemic risk buffer requirement 0.0 0.0 0.0 0.0
67aGlobal Systemically Important Institution (G-SII) or OtherSystemically Important Institution (O-SII) buffer 2.0 1.5 2.0 1.5
68Common Equity Tier 1 capital available to meet buffers (as apercentage of risk-weighted assets)12 13.4 13.6 13.6 13.7
Amounts below the thresholds for deduction (before risk weighting)
72
Direct, indirect and synthetic holdings of the capital of financial sectorentities where the institution does not have a significant investment inthose entities (amount below 10 % threshold and net of eligible shortpositions)8 3,564 3,564 3,943 3,943
73
Direct, indirect and synthetic holdings by the institution of the CET 1instruments of financial sector entities where the institution has asignificant investment in those entities (amount below 10 % thresholdand net of eligible short positions) 776 776 747 747
75
Deferred tax assets arising from temporary differences (amountbelow 10 % threshold, net of related tax liability where the conditionsin Article 38 (3) CRR are met) 4,453 4,453 4,081 4,081
Applicable caps on the inclusion of provisions in Tier 2 capital
76Credit risk adjustments included in T2 in respect of exposures subjectto standardized approach (prior to the application of the cap) 0 0 0 0
77Cap on inclusion of credit risk adjustments in T2 under standardizedapproach 247 247 260 260
78Credit risk adjustments included in T2 in respect of exposures subjectto internal ratings-based approach (prior to the application of the cap) 0 0 0 0
79Cap for inclusion of credit risk adjustments in T2 under internalratings-based approach 1,026 1,026 1,041 1,041
Capital instruments subject to phase-out arrangements
80Current cap on CET 1 instruments subject to phase outarrangements N/M 0 N/M 0
81Amount excluded from CET 1 due to cap (excess over cap afterredemptions and maturities) N/M 0 N/M 0
82 Current cap on AT1 instruments subject to phase out arrangements N/M 6,263 N/M 6,263
83Amount excluded from AT1 due to cap (excess over cap afterredemptions and maturities) N/M 0 N/M 0
84 Current cap on T2 instruments subject to phase out arrangements N/M 1,688 N/M 1,688
85Amount excluded from T2 due to cap (excess over cap afterredemptions and maturities) N/M 0 N/M 0

27
Deutsche Bank Own fundsPillar 3 Report as of December 31, 2018 Article 437 (1)(a,d-e) CRR - Regulatory capital composition, prudential filters and deduction items
N/M – Not meaningful1 References provide the mapping of regulatory balance sheet items used to calculate regulatory capital as reflected in the column “References" in the section “EU LI1 –
Differences between accounting and regulatory scopes of consolidation and the mapping of financial statement categories with regulatory risk categories”. Where applicable,more detailed information are provided in the respective reference footnote section.
2 Based on EBA list as referred to in Article 26 (3) CRR.3 No interim profits to be recognized as per ECB Decision (EU) 2015/656 in accordance with the Article 26(2) of Regulation (EU) No 575/2013 (ECB/2015/4).4 The € 1.5 billion additional value adjustments were derived from the EBA Regulatory Technical Standard on prudent valuation and are before consideration of a benefit from
the related reduction of the shortfall of provisions to expected losses of € 45 million.5 Based on Article 159 CRR and recent guidance provided by EBA (Q&A 2017_3426) published on January 18, 2019 only unearned credit spread additional value adjustments
are used as specific credit risk adjustments.6 Gains and losses on liabilities of the institution that are valued at fair value that result from changes in the own credit standing of the institution according to Article 33 (1) (b)
CRR as well as all fair value gains and losses arising from the institution’s own credit risk related to derivative liabilities according to Article 33 (1) (c) CRR.7 Excludes holdings that are already considered in the accounting base of Common Equity.8 Based on our current interpretation no deduction amount expected.9 Prudential filter for fund for home loans and savings protection (“Fonds zur bauspartechnischen Absicherung”).10 Amortization is taken into account.11Includes Pillar 2 Requirement. June 2018 comparatives have been revised accordingly.12Calculated as the CET 1 capital less any CET 1 items used to meet Tier 1 and Total capital requirements.
A Common shares, additional paid-in capital and common shares in treasury reflect regulatory eligible CET 1 capital instruments.B The position retained earnings in the regulatory balance sheet includes net income (loss) attributable to Deutsche Bank shareholders and additional equity components of
€ 267 million (June 2018: € 481 million). This item is excluded from the position retained earnings in the transitional template for regulatory capital and shown separately alongwith accrual for dividend and AT1 coupons of € (267) million (June 2018: € (481) million) in the position independently reviewed interim profits net of any foreseeable charge ordividend.
C Difference to regulatory balance sheet position driven by prudential filters for unrealized gains and losses.D Phase-out of minority interests (i.e noncontrolling interests) at a rate of 0 % in 2018.E Regulatory applicable amount is goodwill and other intangible assets of € 8,947 million (June 2018: € 8,791 million) plus goodwill from equity method investments of € 69
million (June 2018: € 63 million) as per regulatory balance sheet reduced by deferred tax liabilities on other intangibles of € 450 million (June 2018: € 355 million). Total CET 1deduction amount is phased-in at a rate of 100 % in 2018. Residual amount is deducted from AT1 capital.
F Differences to balance sheet position mainly driven by adjustments as set out in Article 38 (2) to (5) CRR (e.g. regulatory offsetting requirements).G Phase-in at a rate of 100 % in 2018.H Additional equity components reflects regulatory eligible AT1 capital instruments.I Difference to regulatory balance sheet driven by regulatory adjustments as set out in Articles 51 to 61 CRR (e.g. current cap on AT1 instruments subject to phase-out
arrangements).J Difference to regulatory balance sheet driven by regulatory adjustments as set out in Articles 62 to 71 CRR (e.g. maturity deduction, noncontrolling interests).
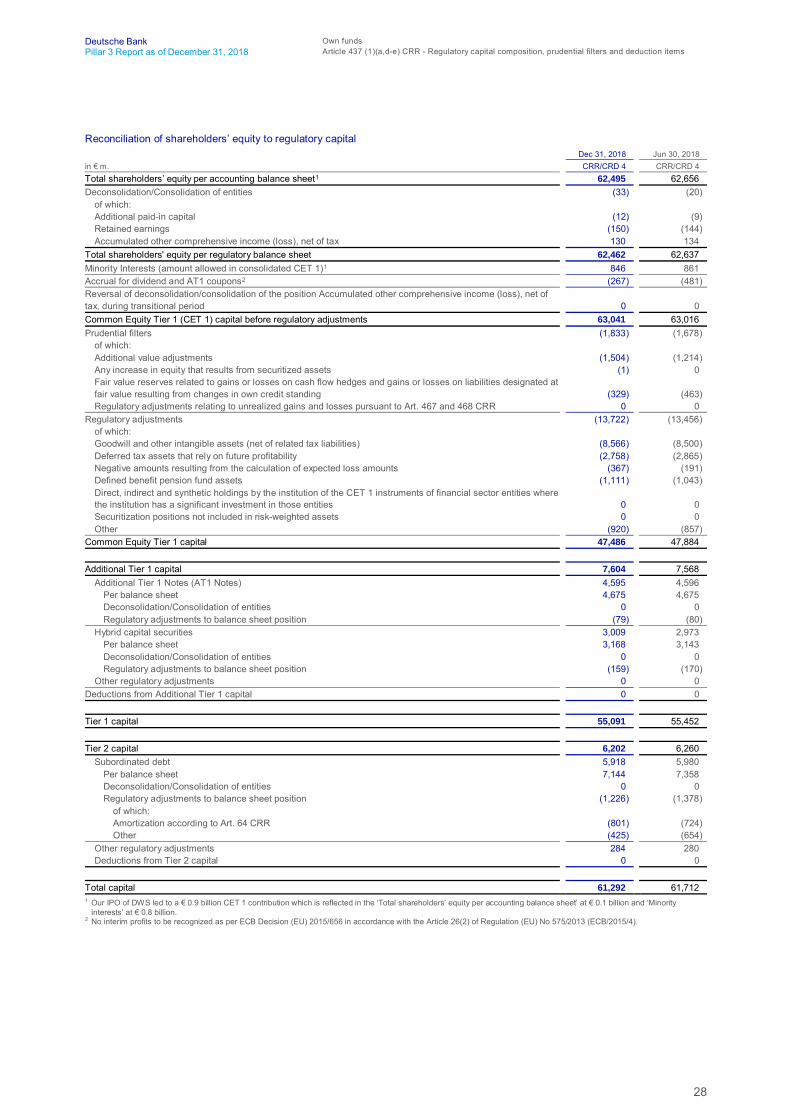
28
Deutsche Bank Own fundsPillar 3 Report as of December 31, 2018 Article 437 (1)(a,d-e) CRR - Regulatory capital composition, prudential filters and deduction items
Reconciliation of shareholders’ equity to regulatory capitalDec 31, 2018 Jun 30, 2018
in € m. CRR/CRD 4 CRR/CRD 4Total shareholders’ equity per accounting balance sheet1 62,495 62,656Deconsolidation/Consolidation of entities (33) (20)
of which:Additional paid-in capital (12) (9)Retained earnings (150) (144)Accumulated other comprehensive income (loss), net of tax 130 134
Total shareholders' equity per regulatory balance sheet 62,462 62,637Minority Interests (amount allowed in consolidated CET 1)1 846 861Accrual for dividend and AT1 coupons2 (267) (481)Reversal of deconsolidation/consolidation of the position Accumulated other comprehensive income (loss), net oftax, during transitional period 0 0Common Equity Tier 1 (CET 1) capital before regulatory adjustments 63,041 63,016Prudential filters (1,833) (1,678)
of which:Additional value adjustments (1,504) (1,214)Any increase in equity that results from securitized assets (1) 0Fair value reserves related to gains or losses on cash flow hedges and gains or losses on liabilities designated atfair value resulting from changes in own credit standing (329) (463)Regulatory adjustments relating to unrealized gains and losses pursuant to Art. 467 and 468 CRR 0 0
Regulatory adjustments (13,722) (13,456)of which:Goodwill and other intangible assets (net of related tax liabilities) (8,566) (8,500)Deferred tax assets that rely on future profitability (2,758) (2,865)Negative amounts resulting from the calculation of expected loss amounts (367) (191)Defined benefit pension fund assets (1,111) (1,043)Direct, indirect and synthetic holdings by the institution of the CET 1 instruments of financial sector entities wherethe institution has a significant investment in those entities 0 0Securitization positions not included in risk-weighted assets 0 0Other (920) (857)
Common Equity Tier 1 capital 47,486 47,884
Additional Tier 1 capital 7,604 7,568Additional Tier 1 Notes (AT1 Notes) 4,595 4,596
Per balance sheet 4,675 4,675Deconsolidation/Consolidation of entities 0 0Regulatory adjustments to balance sheet position (79) (80)
Hybrid capital securities 3,009 2,973Per balance sheet 3,168 3,143Deconsolidation/Consolidation of entities 0 0Regulatory adjustments to balance sheet position (159) (170)
Other regulatory adjustments 0 0Deductions from Additional Tier 1 capital 0 0
Tier 1 capital 55,091 55,452
Tier 2 capital 6,202 6,260Subordinated debt 5,918 5,980
Per balance sheet 7,144 7,358Deconsolidation/Consolidation of entities 0 0Regulatory adjustments to balance sheet position (1,226) (1,378)
of which:Amortization according to Art. 64 CRR (801) (724)Other (425) (654)
Other regulatory adjustments 284 280Deductions from Tier 2 capital 0 0
Total capital 61,292 61,7121 Our IPO of DWS led to a € 0.9 billion CET 1 contribution which is reflected in the ‘Total shareholders’ equity per accounting balance sheet’ at € 0.1 billion and ‘Minority
interests’ at € 0.8 billion.2 No interim profits to be recognized as per ECB Decision (EU) 2015/656 in accordance with the Article 26(2) of Regulation (EU) No 575/2013 (ECB/2015/4).
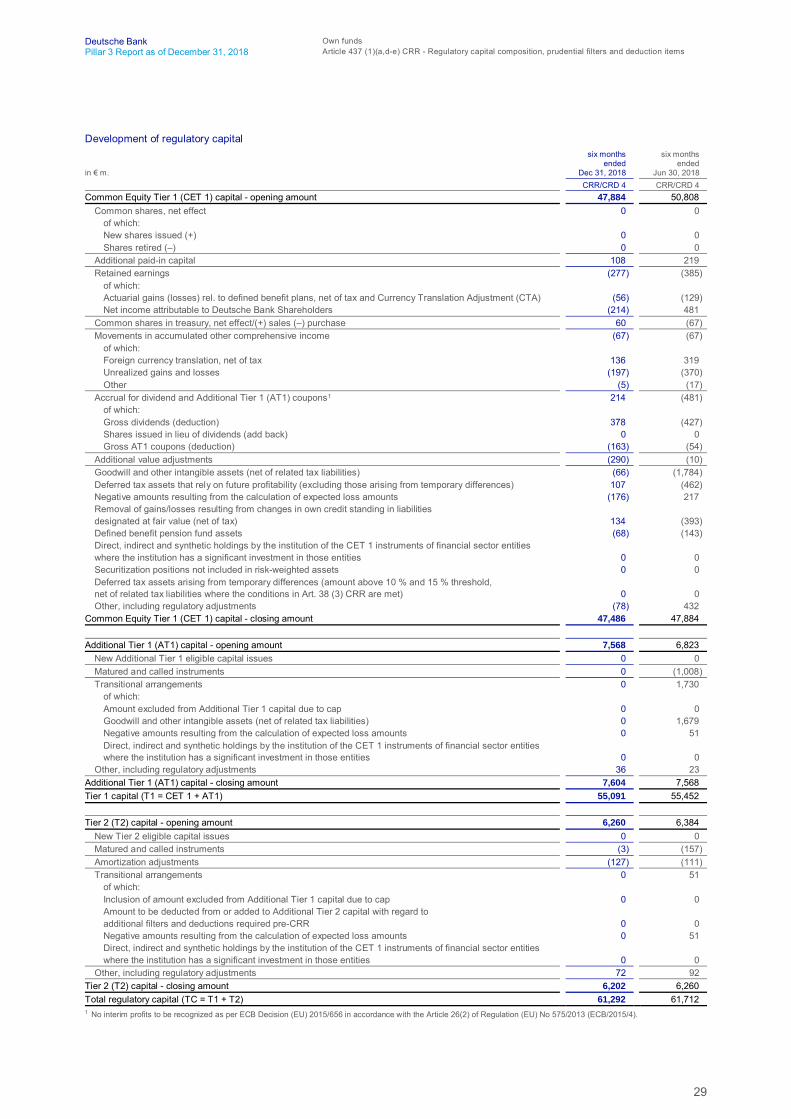
29
Deutsche Bank Own fundsPillar 3 Report as of December 31, 2018 Article 437 (1)(a,d-e) CRR - Regulatory capital composition, prudential filters and deduction items
Development of regulatory capital
in € m.
six monthsended
Dec 31, 2018
six monthsended
Jun 30, 2018CRR/CRD 4 CRR/CRD 4
Common Equity Tier 1 (CET 1) capital - opening amount 47,884 50,808Common shares, net effect 0 0
of which:New shares issued (+) 0 0Shares retired (–) 0 0
Additional paid-in capital 108 219Retained earnings (277) (385)
of which:Actuarial gains (losses) rel. to defined benefit plans, net of tax and Currency Translation Adjustment (CTA) (56) (129)Net income attributable to Deutsche Bank Shareholders (214) 481
Common shares in treasury, net effect/(+) sales (–) purchase 60 (67)Movements in accumulated other comprehensive income (67) (67)
of which:Foreign currency translation, net of tax 136 319Unrealized gains and losses (197) (370)Other (5) (17)
Accrual for dividend and Additional Tier 1 (AT1) coupons1 214 (481)of which:Gross dividends (deduction) 378 (427)Shares issued in lieu of dividends (add back) 0 0Gross AT1 coupons (deduction) (163) (54)
Additional value adjustments (290) (10)Goodwill and other intangible assets (net of related tax liabilities) (66) (1,784)Deferred tax assets that rely on future profitability (excluding those arising from temporary differences) 107 (462)Negative amounts resulting from the calculation of expected loss amounts (176) 217Removal of gains/losses resulting from changes in own credit standing in liabilitiesdesignated at fair value (net of tax) 134 (393)Defined benefit pension fund assets (68) (143)Direct, indirect and synthetic holdings by the institution of the CET 1 instruments of financial sector entitieswhere the institution has a significant investment in those entities 0 0Securitization positions not included in risk-weighted assets 0 0Deferred tax assets arising from temporary differences (amount above 10 % and 15 % threshold,net of related tax liabilities where the conditions in Art. 38 (3) CRR are met) 0 0Other, including regulatory adjustments (78) 432
Common Equity Tier 1 (CET 1) capital - closing amount 47,486 47,884
Additional Tier 1 (AT1) capital - opening amount 7,568 6,823New Additional Tier 1 eligible capital issues 0 0Matured and called instruments 0 (1,008)Transitional arrangements 0 1,730
of which:Amount excluded from Additional Tier 1 capital due to cap 0 0Goodwill and other intangible assets (net of related tax liabilities) 0 1,679Negative amounts resulting from the calculation of expected loss amounts 0 51Direct, indirect and synthetic holdings by the institution of the CET 1 instruments of financial sector entitieswhere the institution has a significant investment in those entities 0 0
Other, including regulatory adjustments 36 23Additional Tier 1 (AT1) capital - closing amount 7,604 7,568Tier 1 capital (T1 = CET 1 + AT1) 55,091 55,452
Tier 2 (T2) capital - opening amount 6,260 6,384New Tier 2 eligible capital issues 0 0Matured and called instruments (3) (157)Amortization adjustments (127) (111)Transitional arrangements 0 51
of which:Inclusion of amount excluded from Additional Tier 1 capital due to cap 0 0Amount to be deducted from or added to Additional Tier 2 capital with regard toadditional filters and deductions required pre-CRR 0 0Negative amounts resulting from the calculation of expected loss amounts 0 51Direct, indirect and synthetic holdings by the institution of the CET 1 instruments of financial sector entitieswhere the institution has a significant investment in those entities 0 0
Other, including regulatory adjustments 72 92Tier 2 (T2) capital - closing amount 6,202 6,260Total regulatory capital (TC = T1 + T2) 61,292 61,7121 No interim profits to be recognized as per ECB Decision (EU) 2015/656 in accordance with the Article 26(2) of Regulation (EU) No 575/2013 (ECB/2015/4).

30
Deutsche Bank Own fundsPillar 3 Report as of December 31, 2018 Article 437 (1)(f) CRR - Capital ratios different to CRR
Article 437 (1)(b-c) CRR - Main features of capital instrumentsA description of the main features of the Common Equity Tier 1, Additional Tier 1 and Tier 2 capital instruments issued byDeutsche Bank is published on Deutsche Bank’s website (db.com/ir/en/capital-instruments.htm). In addition, this websiteprovides full terms and conditions of all Common Equity Tier 1, Additional Tier 1 and Tier 2 capital instruments.
Article 437 (1)(f) CRR - Capital ratios different to CRRThe own funds capital ratios provided for Deutsche Bank Group are built upon the CRR regulations.
31
Deutsche Bank Capital requirementsPillar 3 Report as of December 31, 2018 Article 438 (a) CRR - Summary of Deutsche Bank’s ICAAP approach
Capital requirements
Article 438 (a) CRR - Summary of Deutsche Bank’s ICAAPapproachDeutsche Bank’s internal capital adequacy assessment process (“ICAAP”) consists of several well established componentswhich ensure that the Group maintains sufficient capital to cover the risks to which the bank is exposed on an ongoing basis:
– Risk identification and assessment: The risk identification process forms the basis of the ICAAP and results in an inventoryof risks for the Group. All risks identified are assessed for their materiality.
– Capital demand/risk measurement: Risk measurement methodologies and models are applied to quantify the capitaldemand which is required to cover all material risks except for those which cannot be adequately limited by capital e.g.liquidity risk.
– Capital supply: Capital supply quantification refers to the definition of available capital resources to absorb unexpectedlosses quantified as part of the capital demand.
– Risk appetite: Deutsche Bank has established Group risk appetite thresholds which express the level of risk that we arewilling to assume to achieve our strategic objectives. Threshold breaches are subject to a dedicated governance frameworktriggering management actions aimed to safeguard capital adequacy.
– Capital planning: The risk appetite thresholds for capital adequacy metrics constitute boundaries which have to be met tosafeguard capital adequacy on a forward-looking basis.
– Stress testing: Capital plan figures are also considered under various stress test scenarios to prove resilience and overallviability of the bank. Capital adequacy metrics are also subject to regular stress tests throughout the year to constantlyevaluate Deutsche Bank’s capital position in hypothetical stress scenarios and to detect vulnerabilities under stress.
– Capital adequacy assessment: Although capital adequacy is constantly monitored throughout the year, the ICAAPconcludes with a dedicated annual capital adequacy assessment (CAS). The assessment consists of a Management Boardstatement about Deutsche Bank’s capital adequacy, which is linked to specific conclusions and management actions to betaken to safeguard capital adequacy on a forward-looking basis.
As part of its ICAAP, Deutsche Bank distinguishes between a normative and economic internal perspective. The normativeinternal perspective refers to an internal process aimed at the fulfilment of all capital-related legal requirements and supervisorydemands on an ongoing basis. The economic internal perspective refers to an internal process aimed at capital adequacyusing internal economic capital demand models and an internal economic capital supply definition. Both perspectives focuson maintaining the viability of Deutsche Bank on an ongoing basis.
For a further description of the above ICAAP components, please refer to the Annual Report 2018 under sections “Riskidentification and assessment” on page 61, “Risk profile” on page 48, “Capital, Leverage Ratio and MREL” on page 90, “Riskappetite and capacity” on page 54, “Key risk metrics” on pages 46, “Strategic and capital plan” on page 54, and “Stress testing”on page 56. Additionally, the following sections below on pages 31-34 in this report describe the risk measurementmethodologies (economic capital models) applied by Deutsche Bank to quantify capital demand required to cover all materialrisks.
Credit risk economic capital model
We calculate economic capital for counterparty risk, transfer risk and settlement risk as elements of credit risk. In line with oureconomic capital framework, economic capital for credit risk is set at a level to absorb with a probability of 99.9 % very severeaggregate unexpected losses within one year.
Our economic capital for credit risk is derived from the loss distribution of a portfolio via Monte Carlo Simulation of correlatedrating migrations. The portfolio loss distribution is calculated as follows: in a first step, potential credit losses are quantified ontransactional level based on available exposure and loss-given-default information. In a second step, the probability of jointdefaults is modeled stochastically in terms of risk factors representing the relevant countries and industries that thecounterparties are linked to. The simulation of portfolio losses is then performed by an internally developed model, which takesrating migration and maturity effects into account. Effects due to wrong-way derivatives risk (i.e., the credit exposure of aderivative in the default case is higher than in nondefault scenarios) are modeled by applying our own alpha factor whenderiving the exposure at default for derivatives and securities financing transactions under the Basel 3 Internal Models Method(“IMM”).We allocate expected losses and economic capital derived from loss distributions down to transaction level to enablemanagement on transaction, customer and business level.
32
Deutsche Bank Capital requirementsPillar 3 Report as of December 31, 2018 Article 438 (a) CRR - Summary of Deutsche Bank’s ICAAP approach
Our asset value credit portfolio model is based on the assumption that an obligor firm defaults when its value is no longer highenough to cover its liabilities. The obligor’s asset value or "ability to pay" is modeled as a random process, the Ability to PayProcess (APP). An obligor is taken to default when its asset value or ability to pay falls below a given default point. Changesin the value of systematic and specific factors are simulated in terms of multivariate distributions. The weight assigned tosystematic and specific components and the covariance of systematic factors are estimated using equity and rating time seriesor are based on standard settings for particular portfolio segments.
Modeling correlations via a factor model: A factor model describes the dynamics of a large number of random variables bymaking use of a reduced and fixed number of other random variables, called factors. The approach has the advantage ofreducing computing time: fewer correlations need to be evaluated, and the factor correlation matrix does not change whennew obligors are introduced. The parameters that specify the factor model are:
– The factor model characteristics for the different borrowers, i.e., the weights for the systematic country and industry factors(our model uses 37 systematic factors) and the R2, which determines the weight for the specific factor
– The covariance matrix between the country and industry factors
Modeling rating migration: The rating migration methodology requires additional information, namely yield curves and transitionmatrices describing the probabilities of migrating between different credit ratings.
– Migration matrix: For K non-default credit rating grades and 1 default credit rating, a migration matrix is a (K + 1) × (K + 1)matrix with entries πij. It expresses in percentage terms the probability πij that any borrower with the credit rating i movesto the credit rating j in the next time step.
– Risk-free curve: The risk-free curve required as an input for different points in time is used to derive the corresponding risk-free discount factors.
Economic capital is derived from Value-at-Risk (VaR) with confidence level α = 99.9 %. The economic capital is allocated toindividual transactions using expected shortfall allocation. Portfolio information includes exposure, loss given default, one-year default probability and maturity. The parameters are consistent with the parameters used for the regulatory reporting,with the exception of those from the exposure for derivatives.
Market risk economic capital model
Economic capital for market risk measures the amount of capital needed to absorb very severe, unexpected losses arisingfrom our exposures over the period of one year. “Very severe” in this context means that the underlying economic capital isset at a level which covers, with a probability of 99.9 %, all unexpected losses over a one year time horizon. Market RiskEconomic Capital consists of the following three components:
– Traded Market Risk, capturing the risk due to valuation changes from market price movements– Traded Default Risk, capturing the risk due to valuation changes caused by issuer default and migration risk– Non-traded Market Risk, market risk arising outside of the core trading activities
Traded market risk economic capital (“TMR EC”)
Our traded market risk economic capital model - scaled Stressed VaR based EC (SVaR based EC) - comprises two corecomponents, the “common risk” component covering risk drivers across all businesses and the “business-specific risk”component, which enriches the Common Risk via a suite of Business Specific Stress Tests (BSSTs). Both components arecalibrated to historically-observed severe market shocks.
Common risk is calculated using a scaled version of the Regulatory SVaR framework. The SVaR measure itself replicates theValue-at-Risk calculation that would be generated on the bank’s current portfolio if the relevant market factors wereexperiencing a period of stress. In particular, the model inputs are calibrated to historical data from a continuous 12-monthperiod of significant financial stress relevant to the bank’s portfolio. The Regulatory SVaR model is then scaled-up to cover adifferent liquidity horizon (up to 1 year) and confidence level (99.9 %). The liquidity horizon framework that is utilized in theSVaR based EC model accounts for different levels of market liquidity as well as risk concentrations in the bank’s portfolios.In terms of coverage, the “common risk” captures outright linear and some non-linear risks (e.g. Gamma, Vega etc) tosystematic and idiosyncratic risk drivers. The model incorporates the following risk factors: interest rates, credit spreads, equityprices, foreign exchange rates, commodity prices, volatilities and correlations.
The “business-specific risk” captures more product/business-related bespoke risks (e.g. complex basis risks) as well as higherorder risks (e.g. for equity options) not captured in the common risk component. The concept of business-specific risk is inparticular important in areas where the lack of meaningful market data prevents direct use of the common risk model. BSSTsare in general calibrated to available historical data to obtain a stress scenario. Where appropriate, risk managers use theirexpert judgment to define severe market shocks, based upon the knowledge of past extreme market conditions. In addition to

33
Deutsche Bank Capital requirementsPillar 3 Report as of December 31, 2018 Article 438 (a) CRR - Summary of Deutsche Bank’s ICAAP approach
the BSSTs the business specific risk component of the SVaR based EC model also contains placeholders which carry anestimated EC component on a temporary basis, while efforts are being made to cover those risks with a proper business-specific stress test or integrate it in the common risk framework.
We also continuously assess and refine our market risk EC model to ensure the capture of new material risks as well as theappropriateness of the shocks applied. The calculation of the Traded Market Risk EC is performed weekly.
Traded default risk economic capital (“TDR EC”)
TDR refers to changes in the value of instruments caused by default or rating changes of the issuer. For credit derivatives likecredit default swaps (CDS), the rating of the issuer of the reference asset is modeled. TDR covers the following positions:
– Fair value assets in the banking book;– Unsecuritized credit products in the trading book;– Securitized products in the trading book.
The TDR methodology is similar to the credit risk methodology. An important difference between the EC calculation for tradeddefault risk and credit risk is the capital horizon of 6 months which is used for most TDR positions compared to 12 monthsused for credit risk. Recognizing traded default risk EC for unsecuritized credit products corresponds to the calculation of theincremental risk charge for the trading book for regulatory purposes. EC for TDR represents an estimate of the default andmigration risks of credit products at a 99.9 % confidence level, taking into account the liquidity horizons of the respective sub-portfolios.
TDR EC captures the relevant credit exposures across our trading and banking books. Trading book exposures are monitoredby market risk management via single name concentration and portfolio thresholds which are set based upon rating, size andliquidity. Single name concentration risk thresholds are set for two key metrics: Default Exposure, i.e., the P&L impact of aninstantaneous default at the current recovery rate (RR), and bond equivalent Market Value (MV), i.e. default exposure at 0 %recovery. In order to capture diversification and concentration effects we perform a joint calculation for traded default riskeconomic capital and credit risk economic capital. Important parameters for the calculation of traded default risk are exposures,recovery rates and default probabilities as well as maturities. Exposures, recovery rates and default probabilities are derivedfrom market information and external ratings for trading book positions or from internal assessments for the banking bookpositions as for credit risk economic capital. Rating migrations are governed by issuer type specific migration matrices, whichare obtained from historical rating time series from rating agencies and internal observations. The probability of joint ratingdowngrades and defaults is determined by the default and rating correlations of the portfolio model. These correlations arespecified through systematic factors that represent countries, geographical regions and industries.
Non-traded market risk economic capital (“NTMR EC”)
Non-traded market risk arises from market movements, primarily outside the activities of our trading units, in our banking bookand from off-balance sheet items. Significant market risk factors which the bank is exposed to and are overseen by riskmanagement groups in that area are:
– Interest rate risk (including risk from embedded optionality and changes in behavioral patterns for relevant product types),credit spread risk, foreign exchange risk, equity risk (including investments in public and private equity as well as realestate, infrastructure and fund assets); and
– Market risks from off-balance sheet items such as pension schemes and guarantees as well as structural foreign exchangerisk and equity compensation risk.
Non-traded market risk economic capital is being calculated either by applying the standard traded market risk ECmethodology (SVaR based EC model) or through the use of non-traded market risk models that are specific to each risk classand which consider, among other factors, large historically observed market moves, the liquidity of each asset class, andchanges in client’s behavior in relation to products with behavioral optionalities. The calculation of EC for non-traded marketrisk is performed monthly.
An independent model validation team reviews all quantitative aspects of our MR EC model on a regular basis. The reviewcovers, but is not limited to, model assumptions and calibration approaches for risk parameters.
Operational risk economic capital model
For the quantification of economic capital requirements the Group uses the Advanced Measurement Approach (“AMA”). Theeconomic capital is set at a 99.9 % percentile to absorb very severe unexpected losses within one year. Since the fourthquarter of 2017 we apply the same confidence levels for the calculation of regulatory and economic capital requirements as

34
Deutsche Bank Capital requirementsPillar 3 Report as of December 31, 2018 Article 438 (a) CRR - Summary of Deutsche Bank’s ICAAP approach
described in chapter “Capital, Leverage Ratio and MREL”, section “Internal capital adequacy” in the 2018 Annual Report onpage 99.
For detailed information on our Operational risk measurement approaches refer to our Pillar 3 report section “Article 446 CRR- Operational risk measurement” on page 149.
Business risk economic capital model
We measure economic capital for business risk, which includes strategic risk and tax risk.
The economic capital for strategic risk is based on a model calculating an earnings distribution on Deutsche Bank group level.Important input parameters of the EC model are planned revenues and costs from the Group strategic plan and monthlyforecast process on business unit level. This ensures that the model includes strategic decisions or changes to the businessenvironment in a timely manner. These forecasts determine the mean values of the revenue and cost distributions. Thevolatilities of the revenue distributions are derived from historical revenue time series of our business units. Risk concentrationswithin and across businesses are specified by revenue drivers for individual business units. The correlations of revenuedrivers, e.g. market or macroeconomic factors, are calibrated with historical time series. Revenues are then simulated togetherwith costs to allow for a partial offset of revenue decreases by cost reductions, e.g. by reduced bonus payments. Revenuesand costs are combined to an earnings distribution for the Group, which is used for deriving the economic capital for strategicrisk. Strategic risk EC is held to protect against operating income losses covering a twelve months time-horizon and iscalculated with a confidence of 99.9 %, in line with our general economic capital definition.
Tax risk is determined by reference to corporate income tax re-determination risk with respect to transactions undertaken bythe Bank. Tax re-determination risk is the risk that the eventual tax treatment of a transaction differs from that initiallydetermined by the Bank because of a judicial determination or a compromise by the Bank with a tax authority. Examples oftax re-determination risk include a tax ceasing to be creditable, taxable income being treated as arising, a tax deduction notbeing granted, a tax consolidated group not being respected, or an anti avoidance rule being determined to apply. Tax relatedinputs of the process are under the direction and control of tax professionals of the Bank who are independent of businessunits. The calculation of tax risk EC is performed in a portfolio model which incorporates issues with a one year time horizon.The notional exposure for each “tax issue” is determined and is then modified for reserves and a settlement adjustment. Aprobability is assigned to each “tax issue”. Tax risk EC is computed at the 99.9 % confidence level of the portfolio lossdistribution, which is obtained through Monte Carlo simulation.
Risk type diversification
The risk type diversification benefit quantifies diversification effects between credit, market, operational and strategic risk inthe economic capital calculation caused by non-perfect correlations between these risk types. The calculation of the risk typediversification benefit is intended to ensure that the standalone economic capital figures for the individual risk types areaggregated in an economically meaningful way. Please refer to section “Risk profile” on page 48 in our Annual Report 2018for the diversification amount across credit risk, market risk, operational risk and business risk.
Stress testing
Deutsche Bank is subject to stress test exercises to satisfy both internal as well as externally imposed stress test requirements.The internal stress tests are based on in-house developed methods and inform a variety of risk management use cases suchas our risk appetite framework or capital allocation. The regulatory stress tests, e.g. the EBA stress test and the US-basedCCAR (Comprehensive Capital Analysis and Review) stress tests are strictly following the processes and methodologies asprescribed by the regulatory authorities.
Our internal stress tests are performed on a regular basis in order to assess the impact of a severe economic downturn onour risk profile and financial position. These exercises complement traditional risk measures and represent an integral part ofour strategic and capital planning process. Our stress testing framework comprises regular Group-wide stress tests based oninternally defined scenarios of different severities and localizations. We include all material risk types into our stress testingexercises. The time-horizon of internal stress tests is generally one year and can be extended to multi-year, if required by thescenario assumptions. Our methodologies undergo regular scrutiny from Deutsche Bank’s internal validation team (ModelRisk Management) whether they correctly capture the impact of a given stress scenario. These analyses are complementedby portfolio- and country-specific stress tests as well as regulatory requirements, such as annual reverse stress tests andadditional stress tests requested by our regulators on group or legal entity level. Moreover, capital plan stress testing isperformed to assess the viability of our capital plan in adverse circumstances and to demonstrate a clear link between riskappetite, business strategy, capital plan and stress testing. An integrated procedure allows us to assess the impact of ad-hocscenarios that simulate potential imminent financial or geopolitical shocks.
35
Deutsche Bank Capital requirementsPillar 3 Report as of December 31, 2018 Article 438 (c-f) CRR - Overview of capital requirements
The initial phase of our internal stress tests consists of defining a macroeconomic downturn scenario by ERM Risk Researchin cooperation with business specialists. ERM Risk Research monitors the political and economic development around theworld and maintains a macro-economic heat map that identifies potentially harmful scenarios. Based on quantitative modelsand expert judgments, economic parameters such as foreign exchange rates, interest rates, GDP growth or unemploymentrates are set accordingly to reflect the impact on our business. The scenario parameters are translated into specific risk driversby subject matter experts in the risk units. Based on our internal models framework for stress testing, the following majormetrics are calculated under stress: risk-weighted assets, impacts on profit and loss and economic capital by risk type. Theseresults are aggregated at the Group level, and key metrics such as the CET 1 ratio, ECA ratio and Leverage Ratio understress are derived. Stress impacts on the Liquidity Coverage Ratio (LCR) and the Liquidity Reserve are also considered. Priorto the impact assessment the more severe scenarios are discussed and approved by the Enterprise Risk Committee (ERC)which also reviews the final stress results. After comparing these results against our defined risk appetite, the ERC alsodiscusses specific mitigation actions to remediate the stress impact in alignment with the overall strategic and capital plan ifcertain limits are breached. The results also feed into the recovery planning which is crucial for the recoverability of the Bankin times of crisis. The outcome is presented to senior management up to the Management Board to raise awareness on thehighest level as it provides key insights into specific business vulnerabilities and contributes to the overall risk profileassessment of the bank. The group wide stress tests performed in 2018 indicated that the bank’s capitalization together withavailable mitigation measures allow it to reach the internally set stress exit level, the latter being above regulatory earlyintervention levels. A reverse stress test is performed annually in order to challenge our business model by determiningscenarios which would cause us to become unviable. Such a reverse stress test is based on a hypothetical macroeconomicscenario enriched by idiosyncratic events based on the top risks monitored by each risk type. Comparing the hypotheticalscenario resulting in the Bank’s non-viability to the current economic environment, we consider the probability of occurrenceof such a hypothetical stress scenario as extremely low. Given this, we do not believe that our business continuity is at risk.
Deutsche Bank also took part in two major regulatory stress tests performed in 2018, i.e. the biannual European EBA stresstest as well as the US-based CCAR stress test. In the US, DB USA Corporation received no Federal Reserve (FRB) objectionsto its quantitative capital plan given its ample capital and liquidity under the stressed scenario. The entity, however, receiveda qualitative objection to the CCAR 2018 capital plan for weaknesses in governance, model methodology, validation, data andinfrastructure.
The EBA stress test exercise 2018 was based on the newly introduced IFRS 9 accounting framework and did not prescribeany pass/fail threshold for the projected CET 1 and Leverage ratios under the macroeconomic base and adverse scenario.
Article 438 (b) CRR - SREP requirementsThe SREP requirements are described further below in this Report in section “Article 440 CCR - Capital buffers” on page 38as well as in the Annual Report 2018 under chapter “Capital, Leverage Ratio and MREL”, section “Minimum capitalrequirements and additional capital buffers” on page 91.
Article 438 (c-f) CRR - Overview of capital requirementsThe table below shows RWA and regulatory capital requirements broken down by risk types and model approaches comparedto the previous quarter-end.
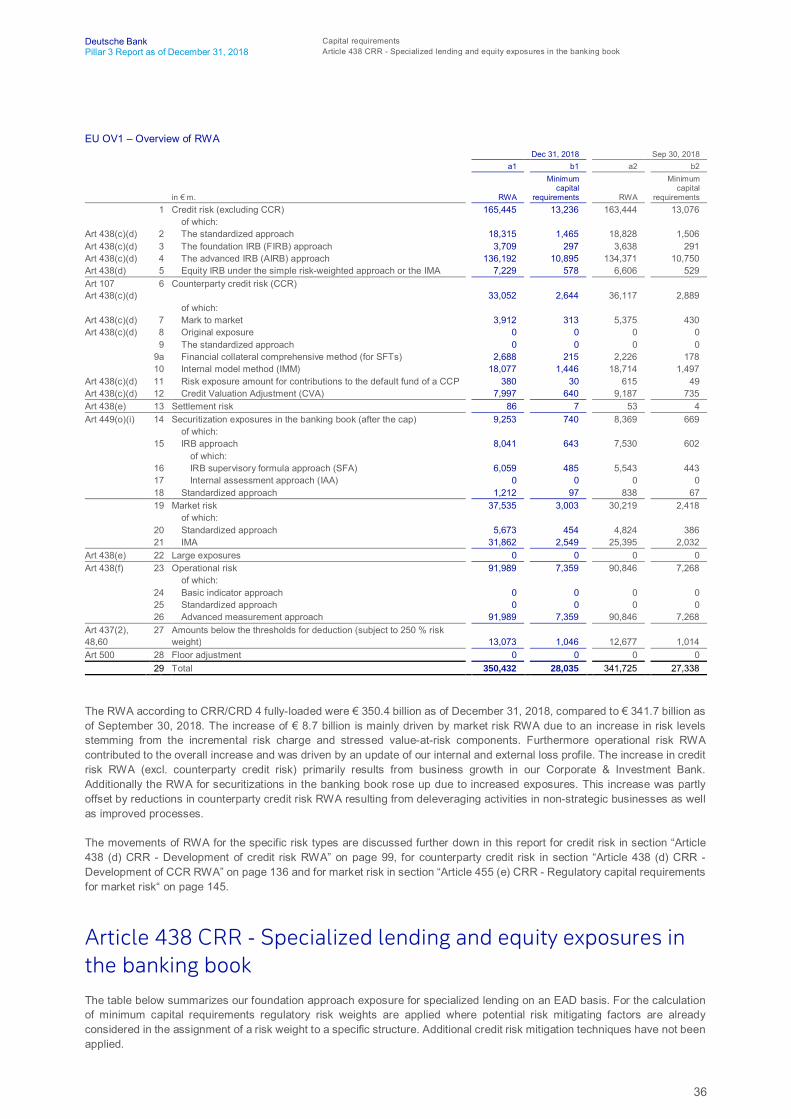
36
Deutsche Bank Capital requirementsPillar 3 Report as of December 31, 2018 Article 438 CRR - Specialized lending and equity exposures in the banking book
EU OV1 – Overview of RWADec 31, 2018 Sep 30, 2018
a1 b1 a2 b2
in € m. RWA
Minimumcapital
requirements RWA
Minimumcapital
requirements 1 Credit risk (excluding CCR) 165,445 13,236 163,444 13,076
of which:Art 438(c)(d) 2 The standardized approach 18,315 1,465 18,828 1,506Art 438(c)(d) 3 The foundation IRB (FIRB) approach 3,709 297 3,638 291Art 438(c)(d) 4 The advanced IRB (AIRB) approach 136,192 10,895 134,371 10,750Art 438(d) 5 Equity IRB under the simple risk-weighted approach or the IMA 7,229 578 6,606 529Art 107Art 438(c)(d)
6 Counterparty credit risk (CCR) 33,052 2,644 36,117 2,889
of which:Art 438(c)(d) 7 Mark to market 3,912 313 5,375 430Art 438(c)(d) 8 Original exposure 0 0 0 0
9 The standardized approach 0 0 0 0 9a Financial collateral comprehensive method (for SFTs) 2,688 215 2,226 178 10 Internal model method (IMM) 18,077 1,446 18,714 1,497
Art 438(c)(d) 11 Risk exposure amount for contributions to the default fund of a CCP 380 30 615 49Art 438(c)(d) 12 Credit Valuation Adjustment (CVA) 7,997 640 9,187 735Art 438(e) 13 Settlement risk 86 7 53 4Art 449(o)(i) 14 Securitization exposures in the banking book (after the cap) 9,253 740 8,369 669
of which: 15 IRB approach 8,041 643 7,530 602
of which: 16 IRB supervisory formula approach (SFA) 6,059 485 5,543 443 17 Internal assessment approach (IAA) 0 0 0 0 18 Standardized approach 1,212 97 838 67 19 Market risk 37,535 3,003 30,219 2,418
of which: 20 Standardized approach 5,673 454 4,824 386 21 IMA 31,862 2,549 25,395 2,032
Art 438(e) 22 Large exposures 0 0 0 0Art 438(f) 23 Operational risk 91,989 7,359 90,846 7,268
of which: 24 Basic indicator approach 0 0 0 0 25 Standardized approach 0 0 0 0 26 Advanced measurement approach 91,989 7,359 90,846 7,268
Art 437(2),48,60
27 Amounts below the thresholds for deduction (subject to 250 % riskweight) 13,073 1,046 12,677 1,014
Art 500 28 Floor adjustment 0 0 0 0 29 Total 350,432 28,035 341,725 27,338
The RWA according to CRR/CRD 4 fully-loaded were € 350.4 billion as of December 31, 2018, compared to € 341.7 billion asof September 30, 2018. The increase of € 8.7 billion is mainly driven by market risk RWA due to an increase in risk levelsstemming from the incremental risk charge and stressed value-at-risk components. Furthermore operational risk RWAcontributed to the overall increase and was driven by an update of our internal and external loss profile. The increase in creditrisk RWA (excl. counterparty credit risk) primarily results from business growth in our Corporate & Investment Bank.Additionally the RWA for securitizations in the banking book rose up due to increased exposures. This increase was partlyoffset by reductions in counterparty credit risk RWA resulting from deleveraging activities in non-strategic businesses as wellas improved processes.
The movements of RWA for the specific risk types are discussed further down in this report for credit risk in section “Article438 (d) CRR - Development of credit risk RWA” on page 99, for counterparty credit risk in section “Article 438 (d) CRR -Development of CCR RWA” on page 136 and for market risk in section “Article 455 (e) CRR - Regulatory capital requirementsfor market risk“ on page 145.
Article 438 CRR - Specialized lending and equity exposures inthe banking bookThe table below summarizes our foundation approach exposure for specialized lending on an EAD basis. For the calculationof minimum capital requirements regulatory risk weights are applied where potential risk mitigating factors are alreadyconsidered in the assignment of a risk weight to a specific structure. Additional credit risk mitigation techniques have not beenapplied.

37
Deutsche Bank Capital requirementsPillar 3 Report as of December 31, 2018 Article 438 CRR - Other non-credit obligation assets in the banking book
For specific exposures in the advanced IRBA we are required to apply regulatory defined risk weights. In the following sectionwe summarize our IRBA exposures for equities and other non-credit obligation assets falling under this requirement. Creditrisk mitigation techniques have not been applied.
EU CR10 – IRB (specialized lending and equities)in € m.(unless stated otherwise) Dec 31, 2018Specialized lending
Regulatorycategories Remaining maturity
On-balancesheet amount
Off-balancesheet amount Risk weight
Exposureamount RWA
Expectedlosses
Category 1 Less than 2.5 years 235 93 50 % 307 153 0Equal to or more than 2.5 years 800 87 70 % 919 643 3
Category 2 Less than 2.5 years 38 39 70 % 66 46 0Equal to or more than 2.5 years 94 89 90 % 137 124 1
Category 3 Less than 2.5 years 1 0 115 % 2 3 0Equal to or more than 2.5 years 28 0 115 % 30 34 1
Category 4 Less than 2.5 years 8 0 250 % 8 19 1Equal to or more than 2.5 years 8 0 250 % 9 21 1
Category 5 Less than 2.5 years 3 0 – 10 0 5Equal to or more than 2.5 years 15 0 – 19 0 10
Total Less than 2.5 years 285 132 – 392 221 6Equal to or more than 2.5 years 946 177 – 1,114 822 16
Equities under the simple risk-weighted approach
CategoriesOn-balance
sheet amountOff-balance
sheet amount Risk weightExposure
amount RWACapital
requirementsPrivate equity exposures sufficiently diversified 450 0 190 % 450 855 68Exchange-traded equity exposures 166 0 290 % 166 482 39All other equity exposures 1,544 48 370 % 1,593 5,893 471Total 2,160 48 – 2,209 7,229 578
in € m.(unless stated otherwise) Jun 30, 2018Specialized lending
Regulatorycategories Remaining maturity
On-balancesheet amount
Off-balancesheet amount Risk weight
Exposureamount RWA
Expectedlosses
Category 1 Less than 2.5 years 89 11 50 % 99 49 0Equal to or more than 2.5 years 923 152 70 % 1,080 756 4
Category 2 Less than 2.5 years 30 9 70 % 36 25 0Equal to or more than 2.5 years 111 88 90 % 178 160 1
Category 3 Less than 2.5 years 2 0 115 % 3 3 0Equal to or more than 2.5 years 30 1 115 % 31 36 1
Category 4 Less than 2.5 years 8 0 250 % 7 19 1Equal to or more than 2.5 years 6 0 250 % 7 17 1
Category 5 Less than 2.5 years 9 0 – 9 0 5Equal to or more than 2.5 years 24 0 – 24 0 12
Total Less than 2.5 years 138 20 – 155 97 6Equal to or more than 2.5 years 1,095 240 – 1,320 969 19
Equities under the simple risk-weighted approach
CategoriesOn-balance
sheet amountOff-balance
sheet amount Risk weightExposure
amount RWACapital
requirementsPrivate equity exposures sufficiently diversified 425 8 190 % 433 822 66Exchange-traded equity exposures 4 119 290 % 122 354 28All other equity exposures 1,369 56 370 % 1,424 5,270 422Total1 1,797 182 – 1,979 6,447 516
Article 438 CRR - Other non-credit obligation assets in thebanking bookThe table below presents the exposures assigned to the exposure class “other non-credit obligation assets” as outlined inArticle 156 CRR. We split the table into cash positions in accordance with Article 156 (a) CRR, which receive a risk weight of0 % as well as other positions receiving a risk weight of 100 %. Additional credit risk mitigation techniques have not beenapplied.
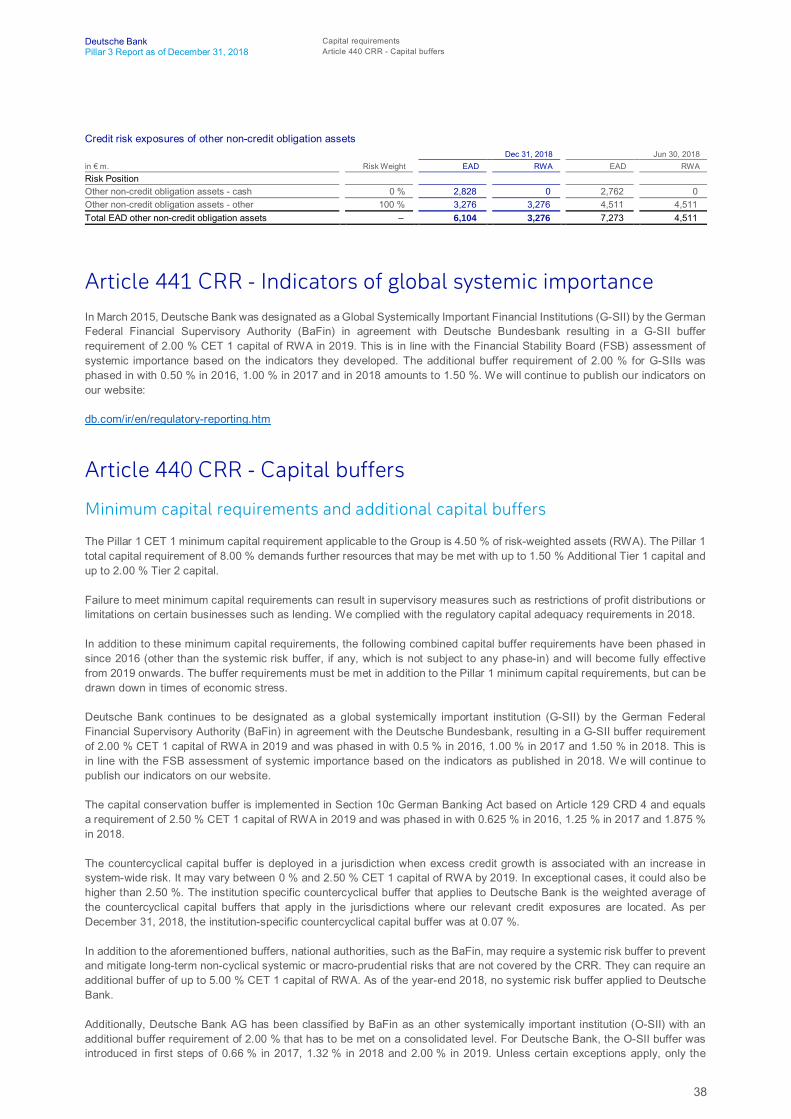
38
Deutsche Bank Capital requirementsPillar 3 Report as of December 31, 2018 Article 440 CRR - Capital buffers
Credit risk exposures of other non-credit obligation assetsDec 31, 2018 Jun 30, 2018
in € m. Risk Weight EAD RWA EAD RWARisk PositionOther non-credit obligation assets - cash 0 % 2,828 0 2,762 0Other non-credit obligation assets - other 100 % 3,276 3,276 4,511 4,511Total EAD other non-credit obligation assets – 6,104 3,276 7,273 4,511
Article 441 CRR - Indicators of global systemic importanceIn March 2015, Deutsche Bank was designated as a Global Systemically Important Financial Institutions (G-SII) by the GermanFederal Financial Supervisory Authority (BaFin) in agreement with Deutsche Bundesbank resulting in a G-SII bufferrequirement of 2.00 % CET 1 capital of RWA in 2019. This is in line with the Financial Stability Board (FSB) assessment ofsystemic importance based on the indicators they developed. The additional buffer requirement of 2.00 % for G-SIIs wasphased in with 0.50 % in 2016, 1.00 % in 2017 and in 2018 amounts to 1.50 %. We will continue to publish our indicators onour website:
db.com/ir/en/regulatory-reporting.htm
Article 440 CRR - Capital buffers
Minimum capital requirements and additional capital buffers
The Pillar 1 CET 1 minimum capital requirement applicable to the Group is 4.50 % of risk-weighted assets (RWA). The Pillar 1total capital requirement of 8.00 % demands further resources that may be met with up to 1.50 % Additional Tier 1 capital andup to 2.00 % Tier 2 capital.
Failure to meet minimum capital requirements can result in supervisory measures such as restrictions of profit distributions orlimitations on certain businesses such as lending. We complied with the regulatory capital adequacy requirements in 2018.
In addition to these minimum capital requirements, the following combined capital buffer requirements have been phased insince 2016 (other than the systemic risk buffer, if any, which is not subject to any phase-in) and will become fully effectivefrom 2019 onwards. The buffer requirements must be met in addition to the Pillar 1 minimum capital requirements, but can bedrawn down in times of economic stress.
Deutsche Bank continues to be designated as a global systemically important institution (G-SII) by the German FederalFinancial Supervisory Authority (BaFin) in agreement with the Deutsche Bundesbank, resulting in a G-SII buffer requirementof 2.00 % CET 1 capital of RWA in 2019 and was phased in with 0.5 % in 2016, 1.00 % in 2017 and 1.50 % in 2018. This isin line with the FSB assessment of systemic importance based on the indicators as published in 2018. We will continue topublish our indicators on our website.
The capital conservation buffer is implemented in Section 10c German Banking Act based on Article 129 CRD 4 and equalsa requirement of 2.50 % CET 1 capital of RWA in 2019 and was phased in with 0.625 % in 2016, 1.25 % in 2017 and 1.875 %in 2018.
The countercyclical capital buffer is deployed in a jurisdiction when excess credit growth is associated with an increase insystem-wide risk. It may vary between 0 % and 2.50 % CET 1 capital of RWA by 2019. In exceptional cases, it could also behigher than 2.50 %. The institution specific countercyclical buffer that applies to Deutsche Bank is the weighted average ofthe countercyclical capital buffers that apply in the jurisdictions where our relevant credit exposures are located. As perDecember 31, 2018, the institution-specific countercyclical capital buffer was at 0.07 %.
In addition to the aforementioned buffers, national authorities, such as the BaFin, may require a systemic risk buffer to preventand mitigate long-term non-cyclical systemic or macro-prudential risks that are not covered by the CRR. They can require anadditional buffer of up to 5.00 % CET 1 capital of RWA. As of the year-end 2018, no systemic risk buffer applied to DeutscheBank.
Additionally, Deutsche Bank AG has been classified by BaFin as an other systemically important institution (O-SII) with anadditional buffer requirement of 2.00 % that has to be met on a consolidated level. For Deutsche Bank, the O-SII buffer wasintroduced in first steps of 0.66 % in 2017, 1.32 % in 2018 and 2.00 % in 2019. Unless certain exceptions apply, only the
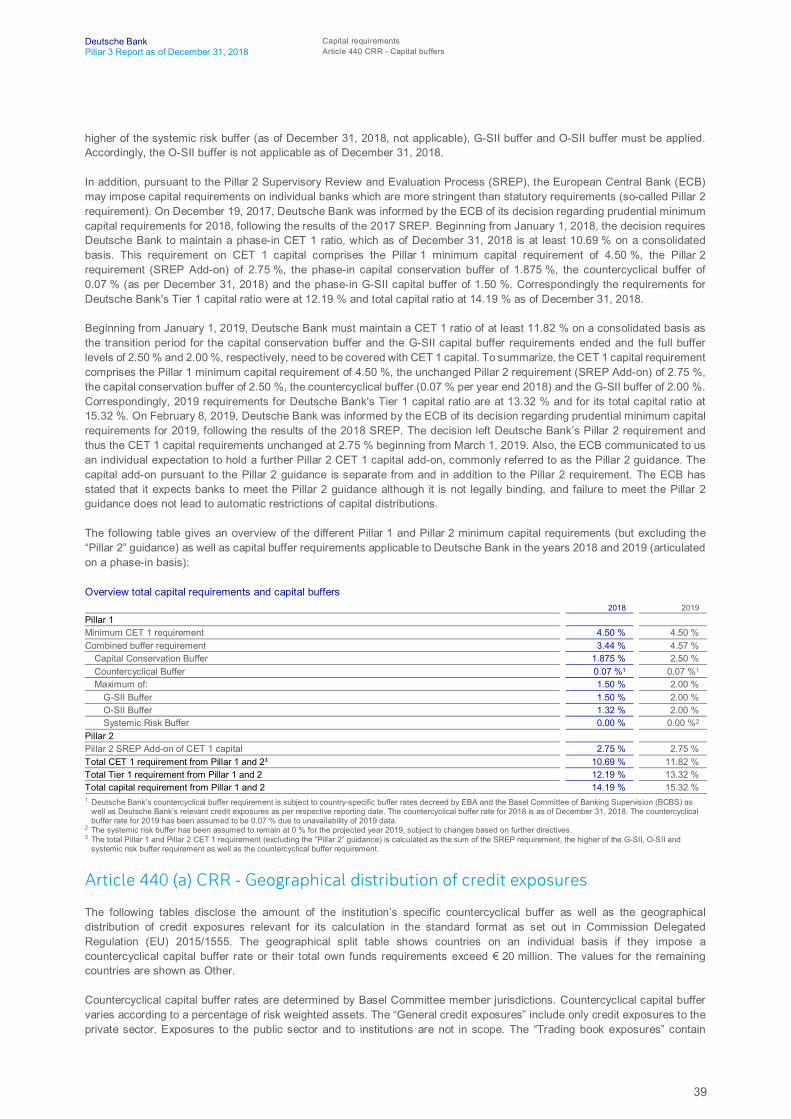
39
Deutsche Bank Capital requirementsPillar 3 Report as of December 31, 2018 Article 440 CRR - Capital buffers
higher of the systemic risk buffer (as of December 31, 2018, not applicable), G-SII buffer and O-SII buffer must be applied.Accordingly, the O-SII buffer is not applicable as of December 31, 2018.
In addition, pursuant to the Pillar 2 Supervisory Review and Evaluation Process (SREP), the European Central Bank (ECB)may impose capital requirements on individual banks which are more stringent than statutory requirements (so-called Pillar 2requirement). On December 19, 2017, Deutsche Bank was informed by the ECB of its decision regarding prudential minimumcapital requirements for 2018, following the results of the 2017 SREP. Beginning from January 1, 2018, the decision requiresDeutsche Bank to maintain a phase-in CET 1 ratio, which as of December 31, 2018 is at least 10.69 % on a consolidatedbasis. This requirement on CET 1 capital comprises the Pillar 1 minimum capital requirement of 4.50 %, the Pillar 2requirement (SREP Add-on) of 2.75 %, the phase-in capital conservation buffer of 1.875 %, the countercyclical buffer of0.07 % (as per December 31, 2018) and the phase-in G-SII capital buffer of 1.50 %. Correspondingly the requirements forDeutsche Bank's Tier 1 capital ratio were at 12.19 % and total capital ratio at 14.19 % as of December 31, 2018.
Beginning from January 1, 2019, Deutsche Bank must maintain a CET 1 ratio of at least 11.82 % on a consolidated basis asthe transition period for the capital conservation buffer and the G-SII capital buffer requirements ended and the full bufferlevels of 2.50 % and 2.00 %, respectively, need to be covered with CET 1 capital. To summarize, the CET 1 capital requirementcomprises the Pillar 1 minimum capital requirement of 4.50 %, the unchanged Pillar 2 requirement (SREP Add-on) of 2.75 %,the capital conservation buffer of 2.50 %, the countercyclical buffer (0.07 % per year end 2018) and the G-SII buffer of 2.00 %.Correspondingly, 2019 requirements for Deutsche Bank's Tier 1 capital ratio are at 13.32 % and for its total capital ratio at15.32 %. On February 8, 2019, Deutsche Bank was informed by the ECB of its decision regarding prudential minimum capitalrequirements for 2019, following the results of the 2018 SREP. The decision left Deutsche Bank’s Pillar 2 requirement andthus the CET 1 capital requirements unchanged at 2.75 % beginning from March 1, 2019. Also, the ECB communicated to usan individual expectation to hold a further Pillar 2 CET 1 capital add-on, commonly referred to as the Pillar 2 guidance. Thecapital add-on pursuant to the Pillar 2 guidance is separate from and in addition to the Pillar 2 requirement. The ECB hasstated that it expects banks to meet the Pillar 2 guidance although it is not legally binding, and failure to meet the Pillar 2guidance does not lead to automatic restrictions of capital distributions.
The following table gives an overview of the different Pillar 1 and Pillar 2 minimum capital requirements (but excluding the“Pillar 2” guidance) as well as capital buffer requirements applicable to Deutsche Bank in the years 2018 and 2019 (articulatedon a phase-in basis):
Overview total capital requirements and capital buffers2018 2019
Pillar 1Minimum CET 1 requirement 4.50 % 4.50 %Combined buffer requirement 3.44 % 4.57 %
Capital Conservation Buffer 1.875 % 2.50 %Countercyclical Buffer 0.07 %1 0.07 %1
Maximum of: 1.50 % 2.00 %G-SII Buffer 1.50 % 2.00 %O-SII Buffer 1.32 % 2.00 %Systemic Risk Buffer 0.00 % 0.00 %2
Pillar 2Pillar 2 SREP Add-on of CET 1 capital 2.75 % 2.75 %Total CET 1 requirement from Pillar 1 and 2³ 10.69 % 11.82 %Total Tier 1 requirement from Pillar 1 and 2 12.19 % 13.32 %Total capital requirement from Pillar 1 and 2 14.19 % 15.32 %1 Deutsche Bank’s countercyclical buffer requirement is subject to country-specific buffer rates decreed by EBA and the Basel Committee of Banking Supervision (BCBS) as
well as Deutsche Bank’s relevant credit exposures as per respective reporting date. The countercyclical buffer rate for 2018 is as of December 31, 2018. The countercyclicalbuffer rate for 2019 has been assumed to be 0.07 % due to unavailability of 2019 data.
2 The systemic risk buffer has been assumed to remain at 0 % for the projected year 2019, subject to changes based on further directives.3 The total Pillar 1 and Pillar 2 CET 1 requirement (excluding the “Pillar 2” guidance) is calculated as the sum of the SREP requirement, the higher of the G-SII, O-SII and
systemic risk buffer requirement as well as the countercyclical buffer requirement.
Article 440 (a) CRR - Geographical distribution of credit exposures
The following tables disclose the amount of the institution’s specific countercyclical buffer as well as the geographicaldistribution of credit exposures relevant for its calculation in the standard format as set out in Commission DelegatedRegulation (EU) 2015/1555. The geographical split table shows countries on an individual basis if they impose acountercyclical capital buffer rate or their total own funds requirements exceed € 20 million. The values for the remainingcountries are shown as Other.
Countercyclical capital buffer rates are determined by Basel Committee member jurisdictions. Countercyclical capital buffervaries according to a percentage of risk weighted assets. The “General credit exposures” include only credit exposures to theprivate sector. Exposures to the public sector and to institutions are not in scope. The “Trading book exposures” contain

40
Deutsche Bank Capital requirementsPillar 3 Report as of December 31, 2018 Article 440 CRR - Capital buffers
market risk standardized approach non-securitization and trading book securitization positions as well as IRC (“IncrementalRisk Charge”) and CTP (“Correlation Trading Portfolio”) related positions.
Geographical distribution of credit exposures relevant for the calculation of the countercyclical capital bufferDec 31, 2018
General credit exposures Trading book exposures Securitization exposures
in € m.Exposure value
for SAExposure value
for IRB
Sum of long andshort positions of
trading bookexposures for
SA
Value of tradingbook exposures
for Internalmodels
Exposure valuefor SA
Exposure valuefor IRB
Angola 0 360 0 3 0 0Argentina 25 355 0 0 0 0Australia 213 3,033 673 0 62 636Austria 11 1,545 0 0 0 0Belgium 90 1,815 0 115 0 0Bermuda 22 867 0 39 0 116Brazil 6 718 0 0 0 0British Virgin Islands 106 8,158 0 15 0 0Canada 159 2,679 6 80 0 360Cayman Islands 317 5,789 66 24 0 982China 36 5,462 131 2,436 0 0Czech Republic 19 180 0 5 0 0Denmark 4 1,563 0 107 0 0Finland 6 782 0 89 0 0France 97 6,010 185 836 0 509Germany 7,180 240,772 160 3,225 0 6,125Hong Kong 80 5,232 0 147 0 0Iceland 3 24 0 60 0 0India 2,157 6,805 0 913 0 0Indonesia 50 1,931 0 126 0 0Ireland 574 7,484 345 156 12 3,509Israel 23 449 0 0 0 0Italy (incl. San Marino) 1,446 23,673 22 0 38 121Japan 102 2,868 0 0 0 144Jersey 154 1,608 2 9 223 5Lebanon 0 633 0 0 0 0Lithuania 0 4 0 0 0 0Luxembourg 3,939 13,346 14 182 0 3,153Malaysia 15 921 10 539 0 0Mauritius 335 244 0 0 0 0Mexico 14 1,852 0 0 0 0Netherlands 1,061 13,144 215 245 0 327Norway 1 2,114 0 188 0 0Pakistan 2 238 0 0 0 0Philippines 5 749 0 144 0 0Poland 18 3,514 0 0 0 0Portugal 50 2,948 20 135 17 0Russian Federation 1 624 0 0 0 0Saudi Arabia 63 5,341 0 0 0 0Singapore 129 9,073 22 591 0 0Slovakia 0 86 0 0 0 0South Korea 9 5,298 0 2,148 0 0South Africa 7 540 0 0 0 0Spain 380 20,043 171 319 4 105Sweden 8 1,945 0 0 171 0Switzerland 89 9,535 0 226 0 0Taiwan 42 1,452 0 543 0 0Thailand 0 1,211 0 336 0 0Turkey 1 609 0 38 0 0United Arab Emirates 14 1,507 0 0 0 0United Kingdom 579 23,411 812 1,807 250 380United States of America(incl. Puerto Rico) 3,626 130,341 2,381 2,754 1,276 47,929Vietnam 6 342 0 25 0 0Other 267 10,452 15 534 32 3,277Total 23,540 591,678 5,251 19,135 2,085 67,677
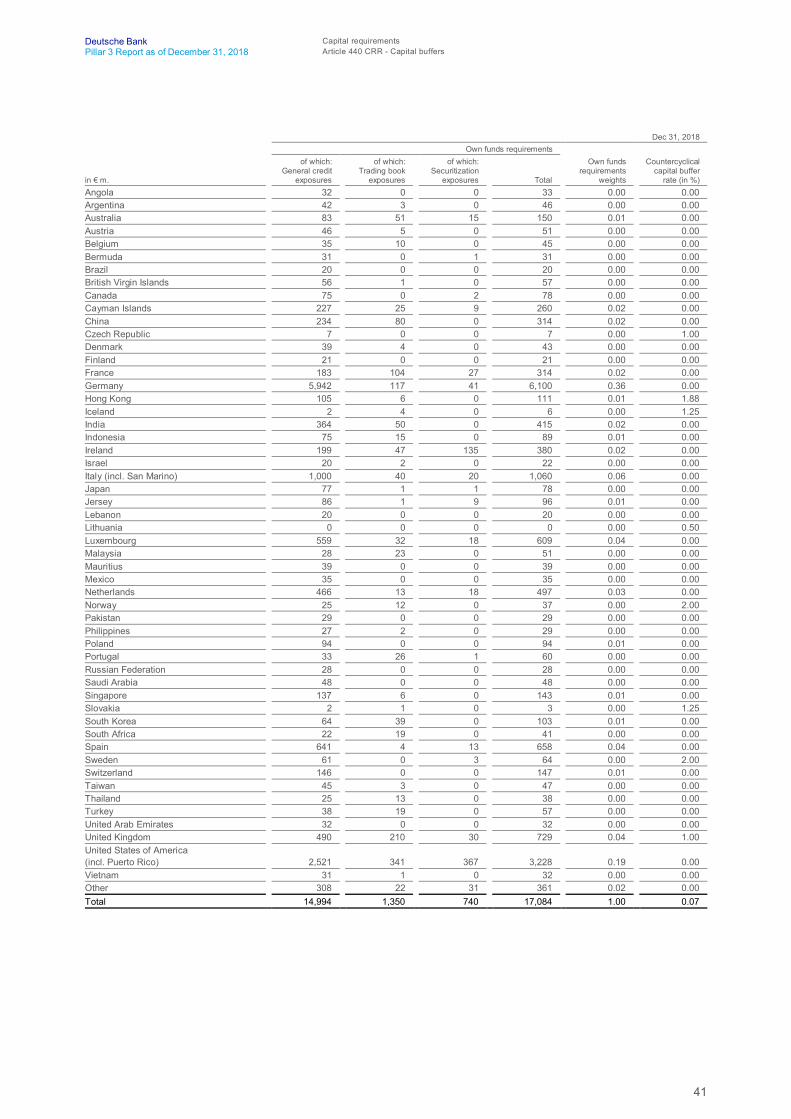
41
Deutsche Bank Capital requirementsPillar 3 Report as of December 31, 2018 Article 440 CRR - Capital buffers
Dec 31, 2018Own funds requirements
in € m.
of which:General credit
exposures
of which:Trading book
exposures
of which:Securitization
exposures Total
Own fundsrequirements
weights
Countercyclicalcapital buffer
rate (in %)Angola 32 0 0 33 0.00 0.00Argentina 42 3 0 46 0.00 0.00Australia 83 51 15 150 0.01 0.00Austria 46 5 0 51 0.00 0.00Belgium 35 10 0 45 0.00 0.00Bermuda 31 0 1 31 0.00 0.00Brazil 20 0 0 20 0.00 0.00British Virgin Islands 56 1 0 57 0.00 0.00Canada 75 0 2 78 0.00 0.00Cayman Islands 227 25 9 260 0.02 0.00China 234 80 0 314 0.02 0.00Czech Republic 7 0 0 7 0.00 1.00Denmark 39 4 0 43 0.00 0.00Finland 21 0 0 21 0.00 0.00France 183 104 27 314 0.02 0.00Germany 5,942 117 41 6,100 0.36 0.00Hong Kong 105 6 0 111 0.01 1.88Iceland 2 4 0 6 0.00 1.25India 364 50 0 415 0.02 0.00Indonesia 75 15 0 89 0.01 0.00Ireland 199 47 135 380 0.02 0.00Israel 20 2 0 22 0.00 0.00Italy (incl. San Marino) 1,000 40 20 1,060 0.06 0.00Japan 77 1 1 78 0.00 0.00Jersey 86 1 9 96 0.01 0.00Lebanon 20 0 0 20 0.00 0.00Lithuania 0 0 0 0 0.00 0.50Luxembourg 559 32 18 609 0.04 0.00Malaysia 28 23 0 51 0.00 0.00Mauritius 39 0 0 39 0.00 0.00Mexico 35 0 0 35 0.00 0.00Netherlands 466 13 18 497 0.03 0.00Norway 25 12 0 37 0.00 2.00Pakistan 29 0 0 29 0.00 0.00Philippines 27 2 0 29 0.00 0.00Poland 94 0 0 94 0.01 0.00Portugal 33 26 1 60 0.00 0.00Russian Federation 28 0 0 28 0.00 0.00Saudi Arabia 48 0 0 48 0.00 0.00Singapore 137 6 0 143 0.01 0.00Slovakia 2 1 0 3 0.00 1.25South Korea 64 39 0 103 0.01 0.00South Africa 22 19 0 41 0.00 0.00Spain 641 4 13 658 0.04 0.00Sweden 61 0 3 64 0.00 2.00Switzerland 146 0 0 147 0.01 0.00Taiwan 45 3 0 47 0.00 0.00Thailand 25 13 0 38 0.00 0.00Turkey 38 19 0 57 0.00 0.00United Arab Emirates 32 0 0 32 0.00 0.00United Kingdom 490 210 30 729 0.04 1.00United States of America(incl. Puerto Rico) 2,521 341 367 3,228 0.19 0.00Vietnam 31 1 0 32 0.00 0.00Other 308 22 31 361 0.02 0.00Total 14,994 1,350 740 17,084 1.00 0.07
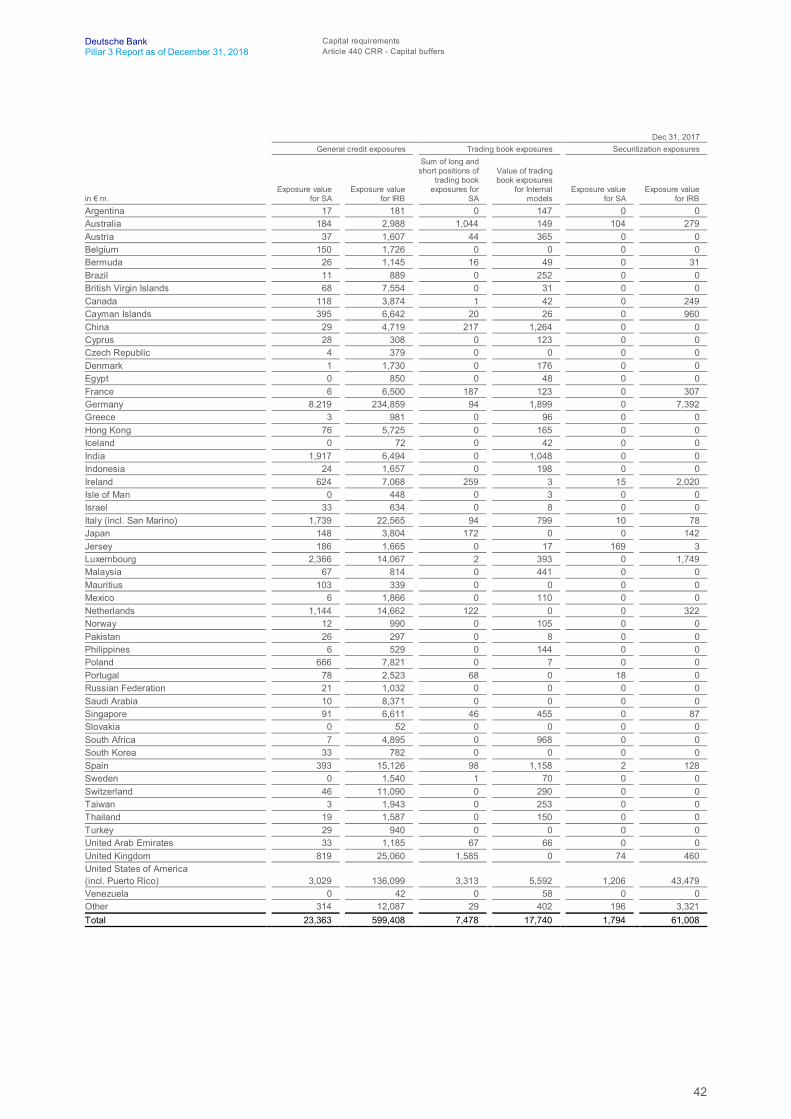
42
Deutsche Bank Capital requirementsPillar 3 Report as of December 31, 2018 Article 440 CRR - Capital buffers
Dec 31, 2017General credit exposures Trading book exposures Securitization exposures
in € m.Exposure value
for SAExposure value
for IRB
Sum of long andshort positions of
trading bookexposures for
SA
Value of tradingbook exposures
for Internalmodels
Exposure valuefor SA
Exposure valuefor IRB
Argentina 17 181 0 147 0 0Australia 184 2,988 1,044 149 104 279Austria 37 1,607 44 365 0 0Belgium 150 1,726 0 0 0 0Bermuda 26 1,145 16 49 0 31Brazil 11 889 0 252 0 0British Virgin Islands 68 7,554 0 31 0 0Canada 118 3,874 1 42 0 249Cayman Islands 395 6,642 20 26 0 960China 29 4,719 217 1,264 0 0Cyprus 28 308 0 123 0 0Czech Republic 4 379 0 0 0 0Denmark 1 1,730 0 176 0 0Egypt 0 850 0 48 0 0France 6 6,500 187 123 0 307Germany 8,219 234,859 94 1,899 0 7,392Greece 3 981 0 96 0 0Hong Kong 76 5,725 0 165 0 0Iceland 0 72 0 42 0 0India 1,917 6,494 0 1,048 0 0Indonesia 24 1,657 0 198 0 0Ireland 624 7,068 259 3 15 2,020Isle of Man 0 448 0 3 0 0Israel 33 634 0 8 0 0Italy (incl. San Marino) 1,739 22,565 94 799 10 78Japan 148 3,804 172 0 0 142Jersey 186 1,665 0 17 169 3Luxembourg 2,366 14,067 2 393 0 1,749Malaysia 67 814 0 441 0 0Mauritius 103 339 0 0 0 0Mexico 6 1,866 0 110 0 0Netherlands 1,144 14,662 122 0 0 322Norway 12 990 0 105 0 0Pakistan 26 297 0 8 0 0Philippines 6 529 0 144 0 0Poland 666 7,821 0 7 0 0Portugal 78 2,523 68 0 18 0Russian Federation 21 1,032 0 0 0 0Saudi Arabia 10 8,371 0 0 0 0Singapore 91 6,611 46 455 0 87Slovakia 0 52 0 0 0 0South Africa 7 4,895 0 968 0 0South Korea 33 782 0 0 0 0Spain 393 15,126 98 1,158 2 128Sweden 0 1,540 1 70 0 0Switzerland 46 11,090 0 290 0 0Taiwan 3 1,943 0 253 0 0Thailand 19 1,587 0 150 0 0Turkey 29 940 0 0 0 0United Arab Emirates 33 1,185 67 66 0 0United Kingdom 819 25,060 1,585 0 74 460United States of America(incl. Puerto Rico) 3,029 136,099 3,313 5,592 1,206 43,479Venezuela 0 42 0 58 0 0Other 314 12,087 29 402 196 3,321Total 23,363 599,408 7,478 17,740 1,794 61,008
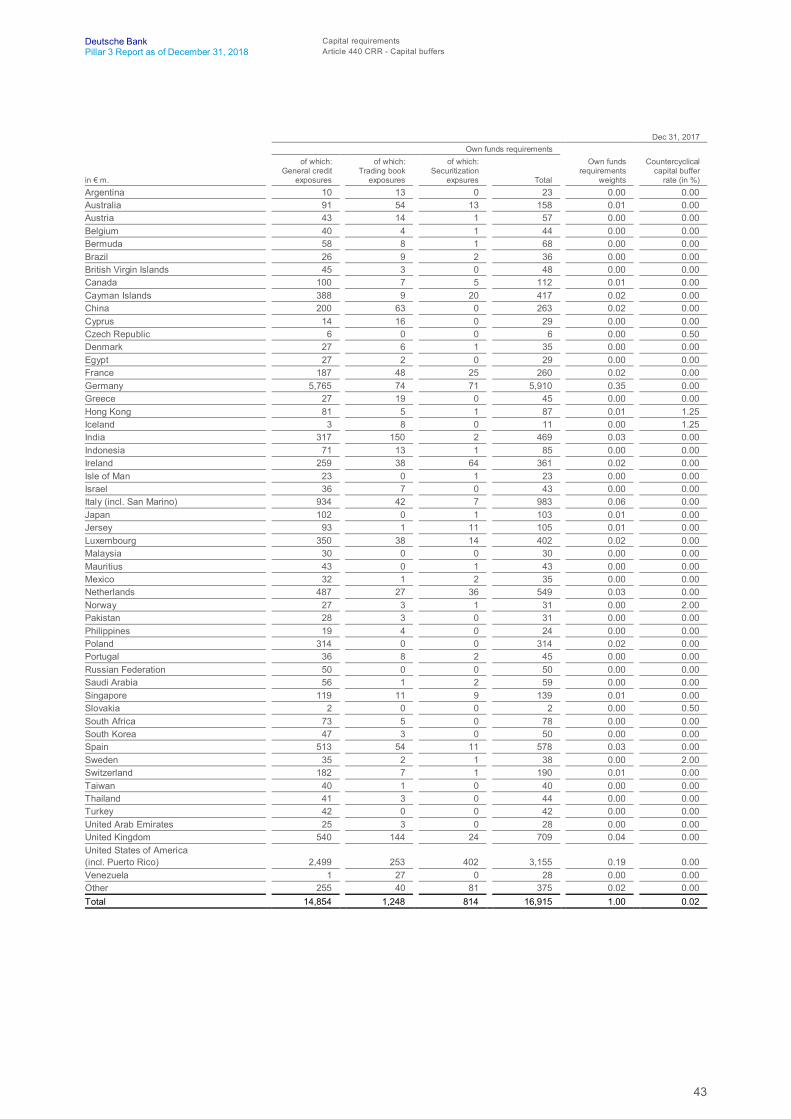
43
Deutsche Bank Capital requirementsPillar 3 Report as of December 31, 2018 Article 440 CRR - Capital buffers
Dec 31, 2017Own funds requirements
in € m.
of which:General credit
exposures
of which:Trading book
exposures
of which:Securitization
expsures Total
Own fundsrequirements
weights
Countercyclicalcapital buffer
rate (in %)Argentina 10 13 0 23 0.00 0.00Australia 91 54 13 158 0.01 0.00Austria 43 14 1 57 0.00 0.00Belgium 40 4 1 44 0.00 0.00Bermuda 58 8 1 68 0.00 0.00Brazil 26 9 2 36 0.00 0.00British Virgin Islands 45 3 0 48 0.00 0.00Canada 100 7 5 112 0.01 0.00Cayman Islands 388 9 20 417 0.02 0.00China 200 63 0 263 0.02 0.00Cyprus 14 16 0 29 0.00 0.00Czech Republic 6 0 0 6 0.00 0.50Denmark 27 6 1 35 0.00 0.00Egypt 27 2 0 29 0.00 0.00France 187 48 25 260 0.02 0.00Germany 5,765 74 71 5,910 0.35 0.00Greece 27 19 0 45 0.00 0.00Hong Kong 81 5 1 87 0.01 1.25Iceland 3 8 0 11 0.00 1.25India 317 150 2 469 0.03 0.00Indonesia 71 13 1 85 0.00 0.00Ireland 259 38 64 361 0.02 0.00Isle of Man 23 0 1 23 0.00 0.00Israel 36 7 0 43 0.00 0.00Italy (incl. San Marino) 934 42 7 983 0.06 0.00Japan 102 0 1 103 0.01 0.00Jersey 93 1 11 105 0.01 0.00Luxembourg 350 38 14 402 0.02 0.00Malaysia 30 0 0 30 0.00 0.00Mauritius 43 0 1 43 0.00 0.00Mexico 32 1 2 35 0.00 0.00Netherlands 487 27 36 549 0.03 0.00Norway 27 3 1 31 0.00 2.00Pakistan 28 3 0 31 0.00 0.00Philippines 19 4 0 24 0.00 0.00Poland 314 0 0 314 0.02 0.00Portugal 36 8 2 45 0.00 0.00Russian Federation 50 0 0 50 0.00 0.00Saudi Arabia 56 1 2 59 0.00 0.00Singapore 119 11 9 139 0.01 0.00Slovakia 2 0 0 2 0.00 0.50South Africa 73 5 0 78 0.00 0.00South Korea 47 3 0 50 0.00 0.00Spain 513 54 11 578 0.03 0.00Sweden 35 2 1 38 0.00 2.00Switzerland 182 7 1 190 0.01 0.00Taiwan 40 1 0 40 0.00 0.00Thailand 41 3 0 44 0.00 0.00Turkey 42 0 0 42 0.00 0.00United Arab Emirates 25 3 0 28 0.00 0.00United Kingdom 540 144 24 709 0.04 0.00United States of America(incl. Puerto Rico) 2,499 253 402 3,155 0.19 0.00Venezuela 1 27 0 28 0.00 0.00Other 255 40 81 375 0.02 0.00Total 14,854 1,248 814 16,915 1.00 0.02

44
Deutsche Bank Capital requirementsPillar 3 Report as of December 31, 2018 Article 440 CRR - Capital buffers
Article 440 (b) CRR - Institution specific countercyclical capital buffer
The following table shows an overview of our countercyclical exposure and buffer requirements.
Institution-specific countercyclical capital bufferDec 31, 2018 Dec 31, 2017
Total risk exposure amount (in € m.)¹ 350,432 343,316Institution specific countercyclical buffer rate 0.07 % 0.02 %Institution specific countercyclical buffer requirement (in € m.) 237 531 To calculate the institution specific countercyclical buffer requirement the phase-in value of the total risk exposure amount is used.

45
Deutsche Bank Credit risk and credit risk mitigationPillar 3 Report as of December 31, 2018 General quantitative information on credit risk
Credit risk and credit risk mitigation
General qualitative information on credit risk
Article 442 (a) CRR - Definitions of past due and impairment
Loans are considered to be past due if contractually agreed payments of principal and/or interest remain unpaid by theborrower, except if those are acquired through consolidation. The latter are considered to be past due if payments of principaland/or interest, which were expected at a certain payment date at the time of the initial consolidation of the loans, are unpaidby the borrower.
The Group has aligned its definition of “credit impaired” under IFRS 9 to the default definition as per Art. 178 of the CapitalRequirements Regulation (CRR) for regulatory purposes. As a consequence, credit impaired financial assets (or Stage 3financial assets) consist of two types of defaulted financial assets: firstly financial assets, where the Group expects animpairment loss reflected in an allowance for credit losses and secondly financial assets, where the group does not expect animpairment loss (e.g., due to high quality collateral or sufficient expected future cash flows following thorough due diligence).This is a major difference to our impairment definition under IAS 39, where financial assets were only considered to beimpaired if the Group expected to suffer an impairment loss.
Article 442 (b) CRR - Credit risk adjustments
Following the introduction of IFRS 9 in 2018, the impairment definition has changed compared to prior years. IFRS 9accounting rules have been applied for the current reporting period and will continue to be used onwards, while comparativenumbers have been based on IAS 39 accounting rules. Credit risk adjustments and credit risk adjustment charges of theperiod are therefore not comparable.
The determination of impairment losses and allowance moves from an incurred credit loss model under IAS 39, whereby creditlosses are recognized when a defined loss event occurs, to an expected credit loss model under IFRS 9, where allowancesfor loan losses are recorded upon initial recognition of the financial asset, based on expectations of potential credit losses atthe time of initial recognition.
For a detailed description of the Group’s accounting policies and risk management practices, please refer to Note 1,“Significant accounting policies and critical accounting estimates“ to the consolidated financial statements and chapter “Creditrisk management” in our Annual Report 2018 on page 223 and 61.
General quantitative information on credit risk
Article 442 (c) CRR - Total and average amount of credit exposure by exposureclasses
The table EU CRB-B below shows the total and average net credit risk exposures based on IFRS accounting values accordingto the regulatory scope of consolidation. For on-balance sheet items the "Net value of exposure" is calculated by deductingcredit risk adjustments from the gross amount and for off-balance sheet exposures respective provisions have been deducted.Hence, credit risk exposures values are shown after accounting offsets but before credit risk mitigation. The breakout into theexposure classes follows those as defined for the IRBA (i.e., combining the advanced and foundation IRB) as well as the forthe standardized approach. In the IRB approach, the line item “Central governments and central banks” includes exposuresto regional governments or local authorities, public sector entities, multilateral developments banks and internationalorganizations. The exposure class “Other items” within the standardized approach includes all exposures not covered in theother categories. The average credit exposure is calculated as on December 31, 2018 taking the averages of all four quartersof the fiscal year.
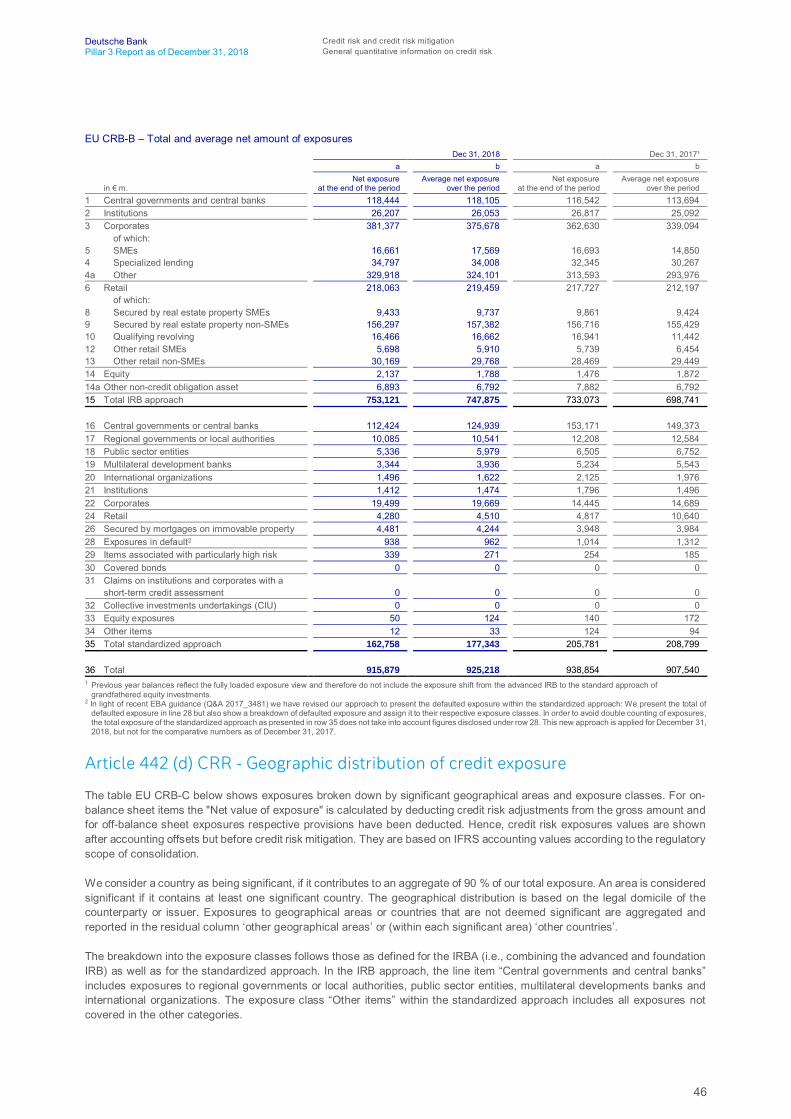
46
Deutsche Bank Credit risk and credit risk mitigationPillar 3 Report as of December 31, 2018 General quantitative information on credit risk
EU CRB-B – Total and average net amount of exposuresDec 31, 2018 Dec 31, 2017¹
a b a b
in € m.Net exposure
at the end of the periodAverage net exposure
over the periodNet exposure
at the end of the period Average net exposure
over the period1 Central governments and central banks 118,444 118,105 116,542 113,6942 Institutions 26,207 26,053 26,817 25,0923 Corporates 381,377 375,678 362,630 339,094
of which:5 SMEs 16,661 17,569 16,693 14,8504 Specialized lending 34,797 34,008 32,345 30,2674a Other 329,918 324,101 313,593 293,9766 Retail 218,063 219,459 217,727 212,197
of which:8 Secured by real estate property SMEs 9,433 9,737 9,861 9,4249 Secured by real estate property non-SMEs 156,297 157,382 156,716 155,42910 Qualifying revolving 16,466 16,662 16,941 11,44212 Other retail SMEs 5,698 5,910 5,739 6,45413 Other retail non-SMEs 30,169 29,768 28,469 29,44914 Equity 2,137 1,788 1,476 1,87214a Other non-credit obligation asset 6,893 6,792 7,882 6,79215 Total IRB approach 753,121 747,875 733,073 698,741
16 Central governments or central banks 112,424 124,939 153,171 149,37317 Regional governments or local authorities 10,085 10,541 12,208 12,58418 Public sector entities 5,336 5,979 6,505 6,75219 Multilateral development banks 3,344 3,936 5,234 5,54320 International organizations 1,496 1,622 2,125 1,97621 Institutions 1,412 1,474 1,796 1,49622 Corporates 19,499 19,669 14,445 14,68924 Retail 4,280 4,510 4,817 10,64026 Secured by mortgages on immovable property 4,481 4,244 3,948 3,98428 Exposures in default2 938 962 1,014 1,31229 Items associated with particularly high risk 339 271 254 18530 Covered bonds 0 0 0 031 Claims on institutions and corporates with a
short-term credit assessment 0 0 0 032 Collective investments undertakings (CIU) 0 0 0 033 Equity exposures 50 124 140 17234 Other items 12 33 124 9435 Total standardized approach 162,758 177,343 205,781 208,799
36 Total 915,879 925,218 938,854 907,5401 Previous year balances reflect the fully loaded exposure view and therefore do not include the exposure shift from the advanced IRB to the standard approach of
grandfathered equity investments.2 In light of recent EBA guidance (Q&A 2017_3481) we have revised our approach to present the defaulted exposure within the standardized approach: We present the total of
defaulted exposure in line 28 but also show a breakdown of defaulted exposure and assign it to their respective exposure classes. In order to avoid double counting of exposures,the total exposure of the standardized approach as presented in row 35 does not take into account figures disclosed under row 28. This new approach is applied for December 31,2018, but not for the comparative numbers as of December 31, 2017.
Article 442 (d) CRR - Geographic distribution of credit exposure
The table EU CRB-C below shows exposures broken down by significant geographical areas and exposure classes. For on-balance sheet items the "Net value of exposure" is calculated by deducting credit risk adjustments from the gross amount andfor off-balance sheet exposures respective provisions have been deducted. Hence, credit risk exposures values are shownafter accounting offsets but before credit risk mitigation. They are based on IFRS accounting values according to the regulatoryscope of consolidation.
We consider a country as being significant, if it contributes to an aggregate of 90 % of our total exposure. An area is consideredsignificant if it contains at least one significant country. The geographical distribution is based on the legal domicile of thecounterparty or issuer. Exposures to geographical areas or countries that are not deemed significant are aggregated andreported in the residual column ‘other geographical areas’ or (within each significant area) ‘other countries’.
The breakdown into the exposure classes follows those as defined for the IRBA (i.e., combining the advanced and foundationIRB) as well as for the standardized approach. In the IRB approach, the line item “Central governments and central banks”includes exposures to regional governments or local authorities, public sector entities, multilateral developments banks andinternational organizations. The exposure class “Other items” within the standardized approach includes all exposures notcovered in the other categories.
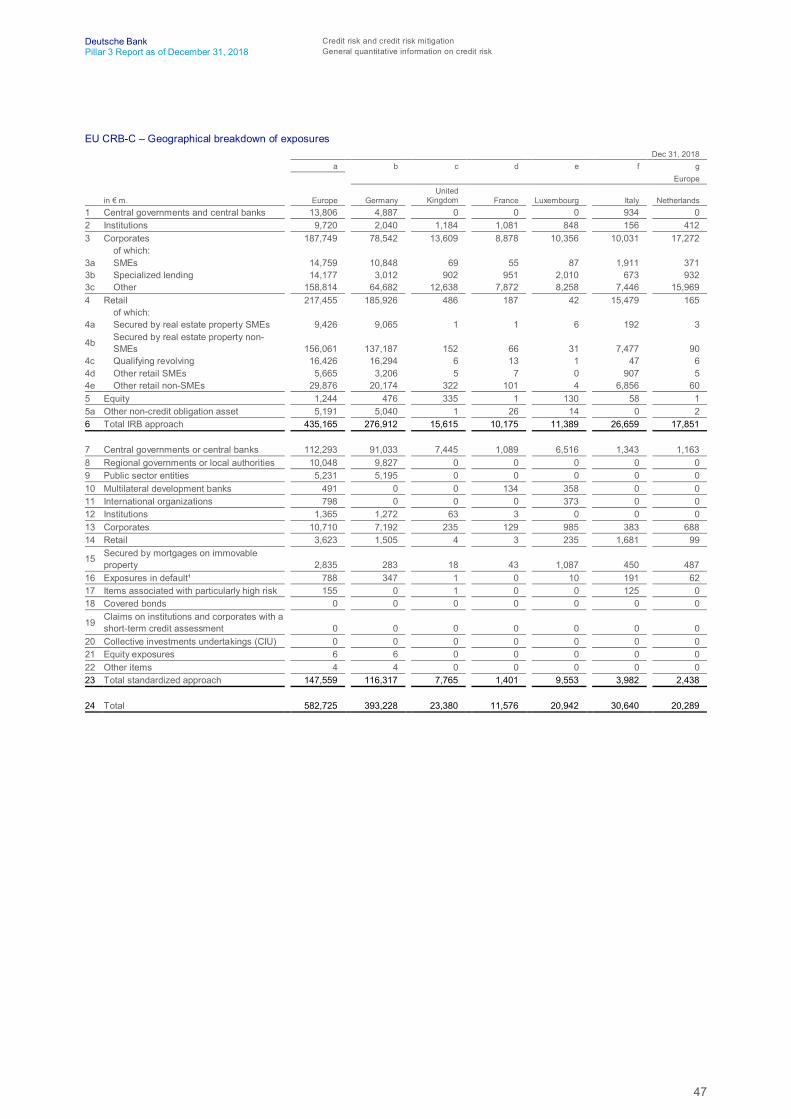
47
Deutsche Bank Credit risk and credit risk mitigationPillar 3 Report as of December 31, 2018 General quantitative information on credit risk
EU CRB-C – Geographical breakdown of exposuresDec 31, 2018
a b c d e f gEurope
in € m. Europe GermanyUnited
Kingdom France Luxembourg Italy Netherlands1 Central governments and central banks 13,806 4,887 0 0 0 934 02 Institutions 9,720 2,040 1,184 1,081 848 156 4123 Corporates 187,749 78,542 13,609 8,878 10,356 10,031 17,272
of which:3a SMEs 14,759 10,848 69 55 87 1,911 3713b Specialized lending 14,177 3,012 902 951 2,010 673 9323c Other 158,814 64,682 12,638 7,872 8,258 7,446 15,9694 Retail 217,455 185,926 486 187 42 15,479 165
of which:4a Secured by real estate property SMEs 9,426 9,065 1 1 6 192 3
4b Secured by real estate property non-SMEs 156,061 137,187 152 66 31 7,477 90
4c Qualifying revolving 16,426 16,294 6 13 1 47 64d Other retail SMEs 5,665 3,206 5 7 0 907 54e Other retail non-SMEs 29,876 20,174 322 101 4 6,856 605 Equity 1,244 476 335 1 130 58 15a Other non-credit obligation asset 5,191 5,040 1 26 14 0 26 Total IRB approach 435,165 276,912 15,615 10,175 11,389 26,659 17,851
7 Central governments or central banks 112,293 91,033 7,445 1,089 6,516 1,343 1,1638 Regional governments or local authorities 10,048 9,827 0 0 0 0 09 Public sector entities 5,231 5,195 0 0 0 0 010 Multilateral development banks 491 0 0 134 358 0 011 International organizations 798 0 0 0 373 0 012 Institutions 1,365 1,272 63 3 0 0 013 Corporates 10,710 7,192 235 129 985 383 68814 Retail 3,623 1,505 4 3 235 1,681 99
15 Secured by mortgages on immovableproperty 2,835 283 18 43 1,087 450 487
16 Exposures in default¹ 788 347 1 0 10 191 6217 Items associated with particularly high risk 155 0 1 0 0 125 018 Covered bonds 0 0 0 0 0 0 0
19 Claims on institutions and corporates with ashort-term credit assessment 0 0 0 0 0 0 0
20 Collective investments undertakings (CIU) 0 0 0 0 0 0 021 Equity exposures 6 6 0 0 0 0 022 Other items 4 4 0 0 0 0 023 Total standardized approach 147,559 116,317 7,765 1,401 9,553 3,982 2,438
24 Total 582,725 393,228 23,380 11,576 20,942 30,640 20,289

48
Deutsche Bank Credit risk and credit risk mitigationPillar 3 Report as of December 31, 2018 General quantitative information on credit risk
Dec 31, 2018h i j k l m n
Europe
in € m. Spain Ireland Switzerland Poland BelgiumOther
EuropeNorth
America1 Central governments and central banks 268 0 3,830 2,424 127 1,335 87,2342 Institutions 564 75 644 11 1,059 1,645 7,4813 Corporates 10,620 5,719 13,296 1,127 2,738 15,562 141,336
of which:3a SMEs 906 19 243 8 7 233 1,0303b Specialized lending 885 1,624 76 245 283 2,584 18,0943c Other 8,829 4,076 12,977 873 2,447 12,745 122,2124 Retail 9,993 26 251 2,424 48 2,427 105
of which:4a Secured by real estate property SMEs 107 0 5 2 1 43 1
4b Secured by real estate property non-SMEs 6,953 24 183 2,403 33 1,463 74
4c Qualifying revolving 6 0 20 3 5 25 94d Other retail SMEs 1,436 1 4 3 2 90 114e Other retail non-SMEs 1,492 0 39 13 8 806 115 Equity 7 19 62 130 16 10 7075a Other non-credit obligation asset 0 13 45 8 0 43 3376 Total IRB approach 21,453 5,851 18,128 6,123 3,989 21,022 237,201
7 Central governments or central banks 1,780 201 0 70 489 1,164 108 Regional governments or local authorities 221 0 0 0 0 0 379 Public sector entities 36 0 0 0 0 0 7610 Multilateral development banks 0 0 0 0 0 0 011 International organizations 0 0 0 0 425 0 012 Institutions 0 0 7 0 0 20 3313 Corporates 69 467 44 18 31 470 5,76514 Retail 64 0 5 0 17 8 1
15 Secured by mortgages on immovableproperty 239 67 52 0 67 42 76
16 Exposures in default¹ 1 141 3 (1) 4 26 417 Items associated with particularly high risk 6 0 0 0 0 23 17918 Covered bonds 0 0 0 0 0 0 0
19 Claims on institutions and corporates with ashort-term credit assessment 0 0 0 0 0 0 0
20 Collective investments undertakings (CIU) 0 0 0 0 0 0 021 Equity exposures 0 0 0 0 0 0 4222 Other items 0 0 0 0 0 0 823 Total standardized approach 2,417 736 108 89 1,029 1,726 6,227
24 Total 23,869 6,587 18,235 6,212 5,018 22,748 243,428

49
Deutsche Bank Credit risk and credit risk mitigationPillar 3 Report as of December 31, 2018 General quantitative information on credit risk
Dec 31, 2018o p q r s t u
North America Asia/Pacific
in € m. U.S.Cayman
Islands Canada Other North
America Asia/Pacific Japan Australia1 Central governments and central banks 87,125 0 96 14 15,389 4,617 4632 Institutions 6,558 0 923 0 8,201 394 8563 Corporates 127,816 2,638 2,505 8,377 45,591 1,488 2,473
of which:3a SMEs 913 0 1 116 635 0 103b Specialized lending 17,411 198 152 332 2,243 611 4173c Other 109,492 2,440 2,352 7,928 42,713 877 2,0474 Retail 91 0 14 0 240 6 12
of which:4a Secured by real estate property SMEs 1 0 0 0 6 0 2
4b Secured by real estate property non-SMEs 68 0 5 0 123 5 6
4c Qualifying revolving 8 0 1 0 20 1 14d Other retail SMEs 10 0 1 0 10 0 14e Other retail non-SMEs 4 0 7 0 80 0 25 Equity 685 22 0 0 68 7 15a Other non-credit obligation asset 326 12 0 0 970 58 206 Total IRB approach 222,601 2,672 3,538 8,390 70,458 6,570 3,826
7 Central governments or central banks 10 0 0 0 0 0 08 Regional governments or local authorities 37 0 0 0 0 0 09 Public sector entities 76 0 0 0 0 0 010 Multilateral development banks 0 0 0 0 0 0 011 International organizations 0 0 0 0 0 0 012 Institutions 33 0 0 0 9 2 113 Corporates 4,335 519 157 754 1,854 756 15214 Retail 1 0 0 0 651 0 0
15 Secured by mortgages on immovableproperty 62 0 1 12 1,553 0 0
16 Exposures in default¹ 4 0 0 0 146 99 017 Items associated with particularly high risk 179 0 0 0 4 0 018 Covered bonds 0 0 0 0 0 0 0
19 Claims on institutions and corporates with ashort-term credit assessment 0 0 0 0 0 0 0
20 Collective investments undertakings (CIU) 0 0 0 0 0 0 021 Equity exposures 42 0 0 0 0 0 022 Other items 8 0 0 0 0 0 023 Total standardized approach 4,783 519 158 766 4,071 758 154
24 Total 227,383 3,191 3,697 9,157 74,529 7,328 3,979

50
Deutsche Bank Credit risk and credit risk mitigationPillar 3 Report as of December 31, 2018 General quantitative information on credit risk
Dec 31, 2018v w x y z aa ab
Asia/Pacific
in € m. India China Singapore Hong KongOther
Asia/Pacific
Othergeographical
areas Total1 Central governments and central banks 2,772 1,102 1,881 342 4,212 2,016 118,4442 Institutions 1,463 2,252 234 440 2,561 806 26,2073 Corporates 7,533 4,331 7,989 5,531 16,246 6,700 381,377
of which:3a SMEs 234 1 16 1 372 239 16,6613b Specialized lending 272 0 171 93 680 283 34,7973c Other 7,027 4,330 7,802 5,437 15,194 6,178 329,9184 Retail 30 31 18 15 126 263 218,063
of which:4a Secured by real estate property SMEs 0 0 0 0 5 0 9,433
4b Secured by real estate property non-SMEs 3 22 14 14 59 40 156,297
4c Qualifying revolving 2 3 1 1 11 10 16,4664d Other retail SMEs 3 3 0 0 3 11 5,6984e Other retail non-SMEs 22 4 3 1 48 202 30,1695 Equity 42 9 0 6 3 117 2,1375a Other non-credit obligation asset 53 585 139 19 95 395 6,8936 Total IRB approach 11,894 8,311 10,261 6,353 23,243 10,297 753,121
7 Central governments or central banks 0 0 0 0 0 121 112,4248 Regional governments or local authorities 0 0 0 0 0 0 10,0859 Public sector entities 0 0 0 0 0 29 5,33610 Multilateral development banks 0 0 0 0 0 2,853 3,34411 International organizations 0 0 0 0 0 698 1,49612 Institutions 1 0 3 0 1 5 1,41213 Corporates 236 6 48 280 376 1,169 19,49914 Retail 643 0 0 0 7 5 4,280
15 Secured by mortgages on immovableproperty 1,517 11 0 1 23 17 4,481
16 Exposures in default¹ 45 0 1 1 1 1 93817 Items associated with particularly high risk 0 0 0 0 4 1 33918 Covered bonds 0 0 0 0 0 0 0
19 Claims on institutions and corporates with ashort-term credit assessment 0 0 0 0 0 0 0
20 Collective investments undertakings (CIU) 0 0 0 0 0 0 021 Equity exposures 0 0 0 0 0 2 5022 Other items 0 0 0 0 0 0 1223 Total standardized approach 2,397 18 51 281 413 4,900 162,758
24 Total 14,291 8,329 10,312 6,635 23,655 15,197 915,8791 In light of recent EBA guidance (Q&A 2017_3481) we have revised our approach to present the defaulted exposure within the standardized approach: We present the total of
defaulted exposure in line 16 but also show a breakdown of defaulted exposure and assign it to their respective exposure classes. In order to avoid double counting of exposures,the total exposure of the standardized approach as presented in row 23 does not take into account figures disclosed under row 16. This new approach is applied for December 31,2018, but not for the comparative numbers as of December 31, 2017.
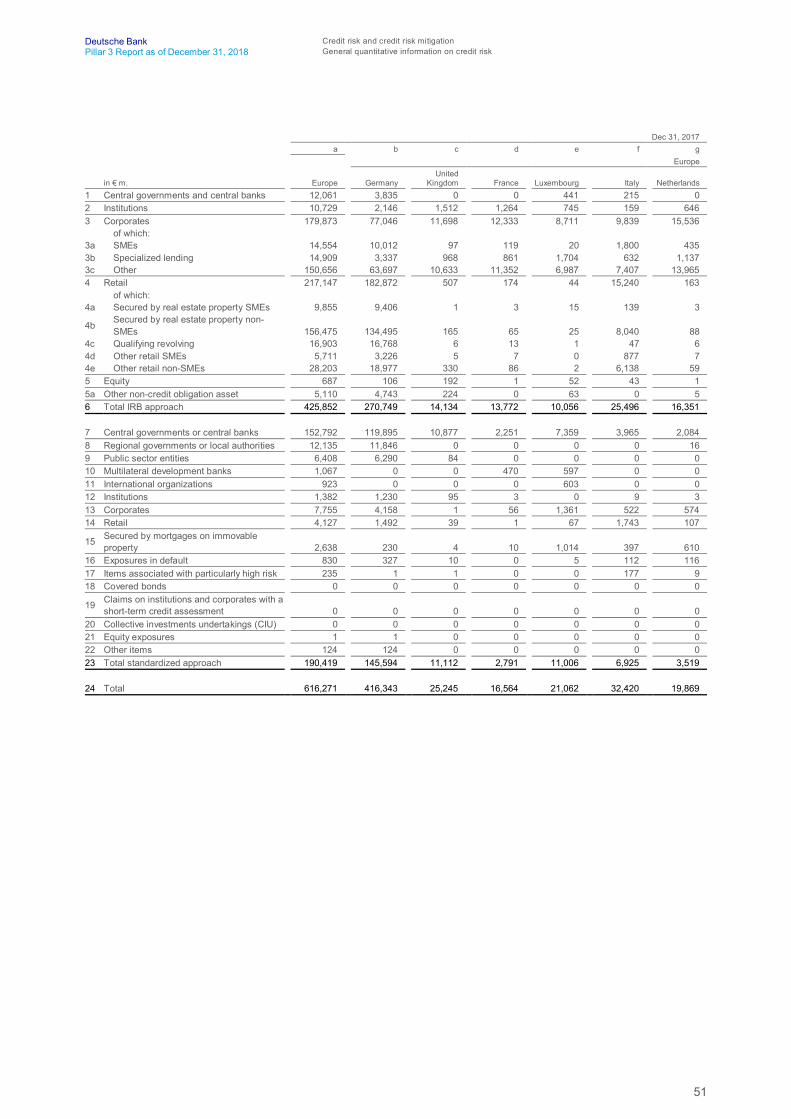
51
Deutsche Bank Credit risk and credit risk mitigationPillar 3 Report as of December 31, 2018 General quantitative information on credit risk
Dec 31, 2017a b c d e f g
Europe
in € m. Europe GermanyUnited
Kingdom France Luxembourg Italy Netherlands1 Central governments and central banks 12,061 3,835 0 0 441 215 02 Institutions 10,729 2,146 1,512 1,264 745 159 6463 Corporates 179,873 77,046 11,698 12,333 8,711 9,839 15,536
of which:3a SMEs 14,554 10,012 97 119 20 1,800 4353b Specialized lending 14,909 3,337 968 861 1,704 632 1,1373c Other 150,656 63,697 10,633 11,352 6,987 7,407 13,9654 Retail 217,147 182,872 507 174 44 15,240 163
of which:4a Secured by real estate property SMEs 9,855 9,406 1 3 15 139 3
4b Secured by real estate property non-SMEs 156,475 134,495 165 65 25 8,040 88
4c Qualifying revolving 16,903 16,768 6 13 1 47 64d Other retail SMEs 5,711 3,226 5 7 0 877 74e Other retail non-SMEs 28,203 18,977 330 86 2 6,138 595 Equity 687 106 192 1 52 43 15a Other non-credit obligation asset 5,110 4,743 224 0 63 0 56 Total IRB approach 425,852 270,749 14,134 13,772 10,056 25,496 16,351
7 Central governments or central banks 152,792 119,895 10,877 2,251 7,359 3,965 2,0848 Regional governments or local authorities 12,135 11,846 0 0 0 0 169 Public sector entities 6,408 6,290 84 0 0 0 010 Multilateral development banks 1,067 0 0 470 597 0 011 International organizations 923 0 0 0 603 0 012 Institutions 1,382 1,230 95 3 0 9 313 Corporates 7,755 4,158 1 56 1,361 522 57414 Retail 4,127 1,492 39 1 67 1,743 107
15 Secured by mortgages on immovableproperty 2,638 230 4 10 1,014 397 610
16 Exposures in default 830 327 10 0 5 112 11617 Items associated with particularly high risk 235 1 1 0 0 177 918 Covered bonds 0 0 0 0 0 0 0
19 Claims on institutions and corporates with ashort-term credit assessment 0 0 0 0 0 0 0
20 Collective investments undertakings (CIU) 0 0 0 0 0 0 021 Equity exposures 1 1 0 0 0 0 022 Other items 124 124 0 0 0 0 023 Total standardized approach 190,419 145,594 11,112 2,791 11,006 6,925 3,519
24 Total 616,271 416,343 25,245 16,564 21,062 32,420 19,869
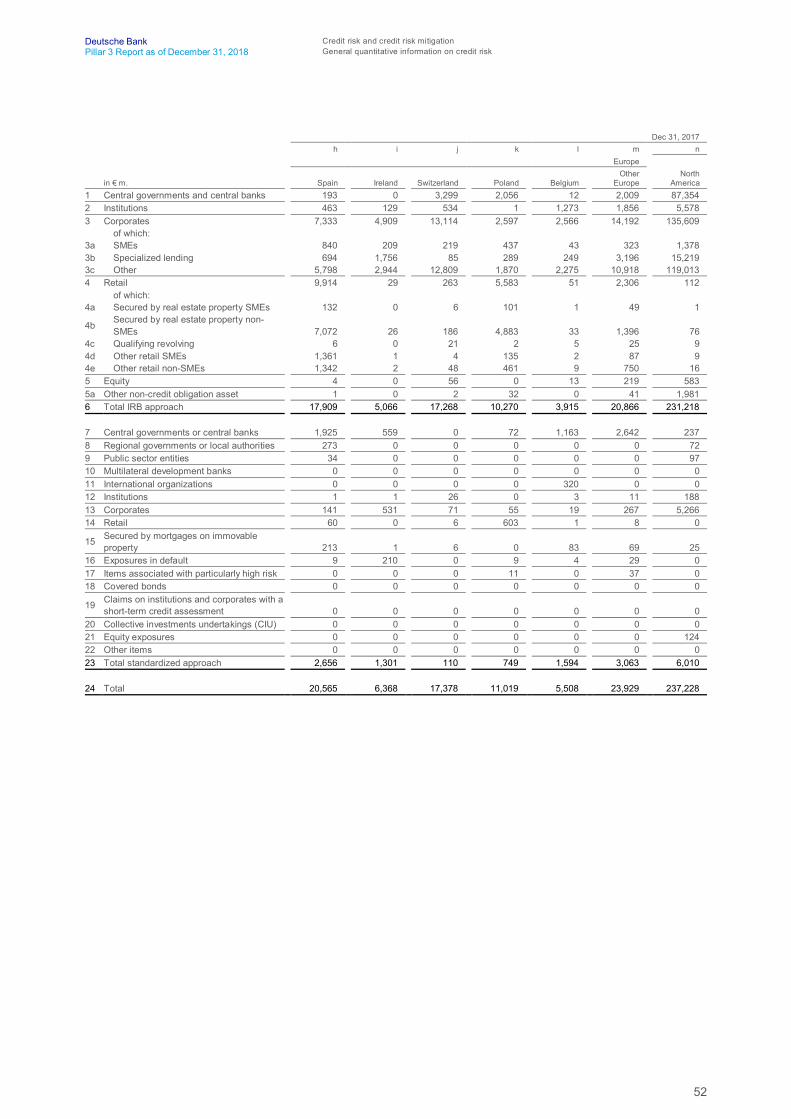
52
Deutsche Bank Credit risk and credit risk mitigationPillar 3 Report as of December 31, 2018 General quantitative information on credit risk
Dec 31, 2017h i j k l m n
Europe
in € m. Spain Ireland Switzerland Poland BelgiumOther
EuropeNorth
America1 Central governments and central banks 193 0 3,299 2,056 12 2,009 87,3542 Institutions 463 129 534 1 1,273 1,856 5,5783 Corporates 7,333 4,909 13,114 2,597 2,566 14,192 135,609
of which:3a SMEs 840 209 219 437 43 323 1,3783b Specialized lending 694 1,756 85 289 249 3,196 15,2193c Other 5,798 2,944 12,809 1,870 2,275 10,918 119,0134 Retail 9,914 29 263 5,583 51 2,306 112
of which:4a Secured by real estate property SMEs 132 0 6 101 1 49 1
4b Secured by real estate property non-SMEs 7,072 26 186 4,883 33 1,396 76
4c Qualifying revolving 6 0 21 2 5 25 94d Other retail SMEs 1,361 1 4 135 2 87 94e Other retail non-SMEs 1,342 2 48 461 9 750 165 Equity 4 0 56 0 13 219 5835a Other non-credit obligation asset 1 0 2 32 0 41 1,9816 Total IRB approach 17,909 5,066 17,268 10,270 3,915 20,866 231,218
7 Central governments or central banks 1,925 559 0 72 1,163 2,642 2378 Regional governments or local authorities 273 0 0 0 0 0 729 Public sector entities 34 0 0 0 0 0 9710 Multilateral development banks 0 0 0 0 0 0 011 International organizations 0 0 0 0 320 0 012 Institutions 1 1 26 0 3 11 18813 Corporates 141 531 71 55 19 267 5,26614 Retail 60 0 6 603 1 8 0
15 Secured by mortgages on immovableproperty 213 1 6 0 83 69 25
16 Exposures in default 9 210 0 9 4 29 017 Items associated with particularly high risk 0 0 0 11 0 37 018 Covered bonds 0 0 0 0 0 0 0
19 Claims on institutions and corporates with ashort-term credit assessment 0 0 0 0 0 0 0
20 Collective investments undertakings (CIU) 0 0 0 0 0 0 021 Equity exposures 0 0 0 0 0 0 12422 Other items 0 0 0 0 0 0 023 Total standardized approach 2,656 1,301 110 749 1,594 3,063 6,010
24 Total 20,565 6,368 17,378 11,019 5,508 23,929 237,228
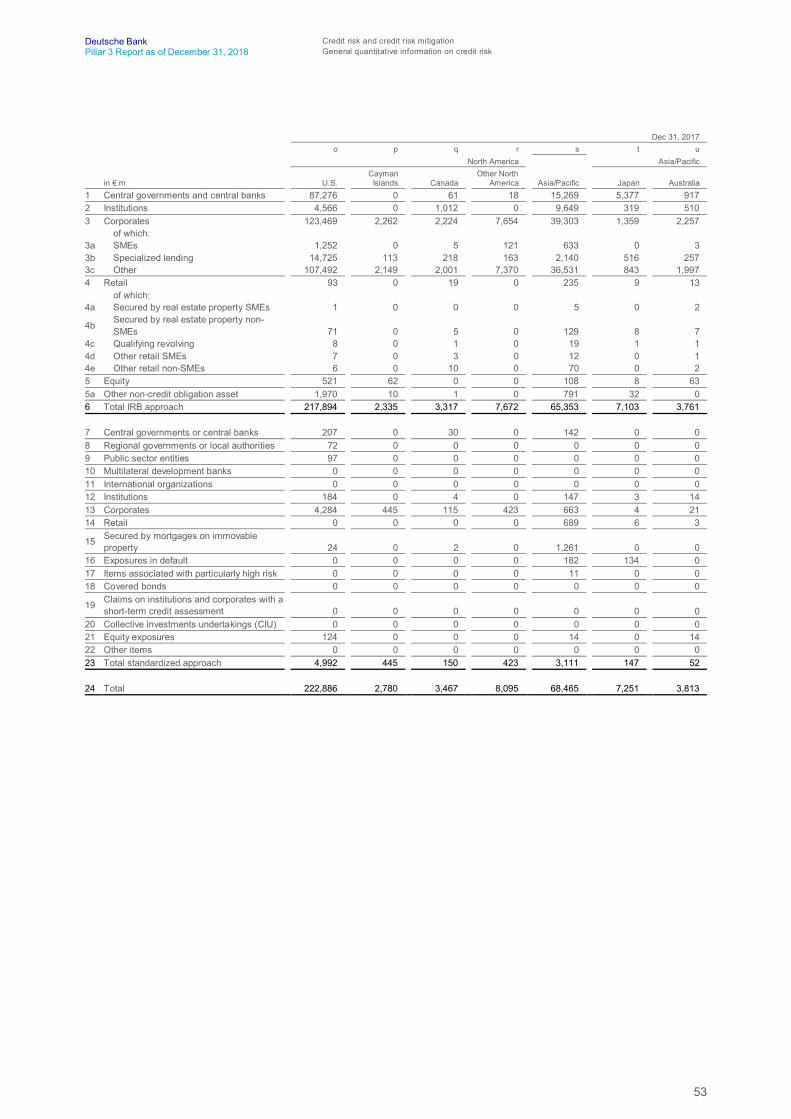
53
Deutsche Bank Credit risk and credit risk mitigationPillar 3 Report as of December 31, 2018 General quantitative information on credit risk
Dec 31, 2017o p q r s t u
North America Asia/Pacific
in € m. U.S.Cayman
Islands Canada Other North
America Asia/Pacific Japan Australia1 Central governments and central banks 87,276 0 61 18 15,269 5,377 9172 Institutions 4,566 0 1,012 0 9,649 319 5103 Corporates 123,469 2,262 2,224 7,654 39,303 1,359 2,257
of which:3a SMEs 1,252 0 5 121 633 0 33b Specialized lending 14,725 113 218 163 2,140 516 2573c Other 107,492 2,149 2,001 7,370 36,531 843 1,9974 Retail 93 0 19 0 235 9 13
of which:4a Secured by real estate property SMEs 1 0 0 0 5 0 2
4b Secured by real estate property non-SMEs 71 0 5 0 129 8 7
4c Qualifying revolving 8 0 1 0 19 1 14d Other retail SMEs 7 0 3 0 12 0 14e Other retail non-SMEs 6 0 10 0 70 0 25 Equity 521 62 0 0 108 8 635a Other non-credit obligation asset 1,970 10 1 0 791 32 06 Total IRB approach 217,894 2,335 3,317 7,672 65,353 7,103 3,761
7 Central governments or central banks 207 0 30 0 142 0 08 Regional governments or local authorities 72 0 0 0 0 0 09 Public sector entities 97 0 0 0 0 0 010 Multilateral development banks 0 0 0 0 0 0 011 International organizations 0 0 0 0 0 0 012 Institutions 184 0 4 0 147 3 1413 Corporates 4,284 445 115 423 663 4 2114 Retail 0 0 0 0 689 6 3
15 Secured by mortgages on immovableproperty 24 0 2 0 1,261 0 0
16 Exposures in default 0 0 0 0 182 134 017 Items associated with particularly high risk 0 0 0 0 11 0 018 Covered bonds 0 0 0 0 0 0 0
19 Claims on institutions and corporates with ashort-term credit assessment 0 0 0 0 0 0 0
20 Collective investments undertakings (CIU) 0 0 0 0 0 0 021 Equity exposures 124 0 0 0 14 0 1422 Other items 0 0 0 0 0 0 023 Total standardized approach 4,992 445 150 423 3,111 147 52
24 Total 222,886 2,780 3,467 8,095 68,465 7,251 3,813
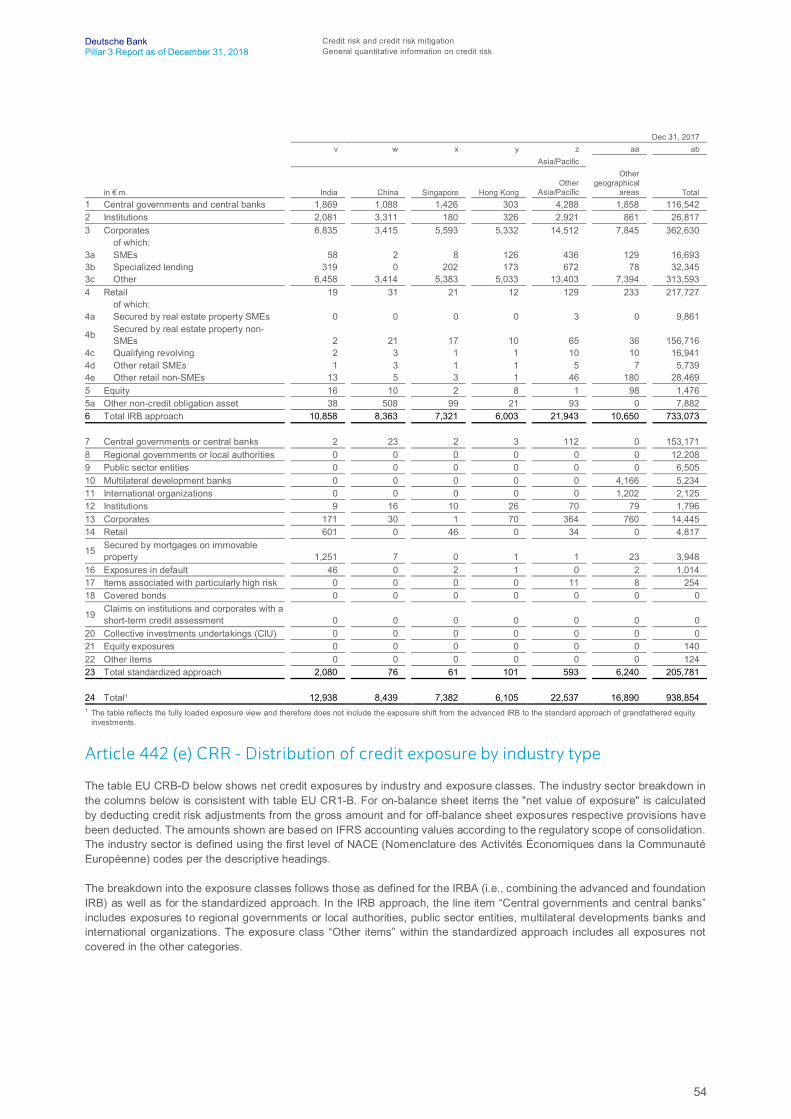
54
Deutsche Bank Credit risk and credit risk mitigationPillar 3 Report as of December 31, 2018 General quantitative information on credit risk
Dec 31, 2017v w x y z aa ab
Asia/Pacific
in € m. India China Singapore Hong KongOther
Asia/Pacific
Othergeographical
areas Total1 Central governments and central banks 1,869 1,088 1,426 303 4,288 1,858 116,5422 Institutions 2,081 3,311 180 326 2,921 861 26,8173 Corporates 6,835 3,415 5,593 5,332 14,512 7,845 362,630
of which:3a SMEs 58 2 8 126 436 129 16,6933b Specialized lending 319 0 202 173 672 78 32,3453c Other 6,458 3,414 5,383 5,033 13,403 7,394 313,5934 Retail 19 31 21 12 129 233 217,727
of which:4a Secured by real estate property SMEs 0 0 0 0 3 0 9,861
4b Secured by real estate property non-SMEs 2 21 17 10 65 36 156,716
4c Qualifying revolving 2 3 1 1 10 10 16,9414d Other retail SMEs 1 3 1 1 5 7 5,7394e Other retail non-SMEs 13 5 3 1 46 180 28,4695 Equity 16 10 2 8 1 98 1,4765a Other non-credit obligation asset 38 508 99 21 93 0 7,8826 Total IRB approach 10,858 8,363 7,321 6,003 21,943 10,650 733,073
7 Central governments or central banks 2 23 2 3 112 0 153,1718 Regional governments or local authorities 0 0 0 0 0 0 12,2089 Public sector entities 0 0 0 0 0 0 6,50510 Multilateral development banks 0 0 0 0 0 4,166 5,23411 International organizations 0 0 0 0 0 1,202 2,12512 Institutions 9 16 10 26 70 79 1,79613 Corporates 171 30 1 70 364 760 14,44514 Retail 601 0 46 0 34 0 4,817
15 Secured by mortgages on immovableproperty 1,251 7 0 1 1 23 3,948
16 Exposures in default 46 0 2 1 0 2 1,01417 Items associated with particularly high risk 0 0 0 0 11 8 25418 Covered bonds 0 0 0 0 0 0 0
19 Claims on institutions and corporates with ashort-term credit assessment 0 0 0 0 0 0 0
20 Collective investments undertakings (CIU) 0 0 0 0 0 0 021 Equity exposures 0 0 0 0 0 0 14022 Other items 0 0 0 0 0 0 12423 Total standardized approach 2,080 76 61 101 593 6,240 205,781
24 Total¹ 12,938 8,439 7,382 6,105 22,537 16,890 938,8541 The table reflects the fully loaded exposure view and therefore does not include the exposure shift from the advanced IRB to the standard approach of grandfathered equity
investments.
Article 442 (e) CRR - Distribution of credit exposure by industry type
The table EU CRB-D below shows net credit exposures by industry and exposure classes. The industry sector breakdown inthe columns below is consistent with table EU CR1-B. For on-balance sheet items the "net value of exposure" is calculatedby deducting credit risk adjustments from the gross amount and for off-balance sheet exposures respective provisions havebeen deducted. The amounts shown are based on IFRS accounting values according to the regulatory scope of consolidation.The industry sector is defined using the first level of NACE (Nomenclature des Activités Économiques dans la CommunautéEuropéenne) codes per the descriptive headings.
The breakdown into the exposure classes follows those as defined for the IRBA (i.e., combining the advanced and foundationIRB) as well as for the standardized approach. In the IRB approach, the line item “Central governments and central banks”includes exposures to regional governments or local authorities, public sector entities, multilateral developments banks andinternational organizations. The exposure class “Other items” within the standardized approach includes all exposures notcovered in the other categories.
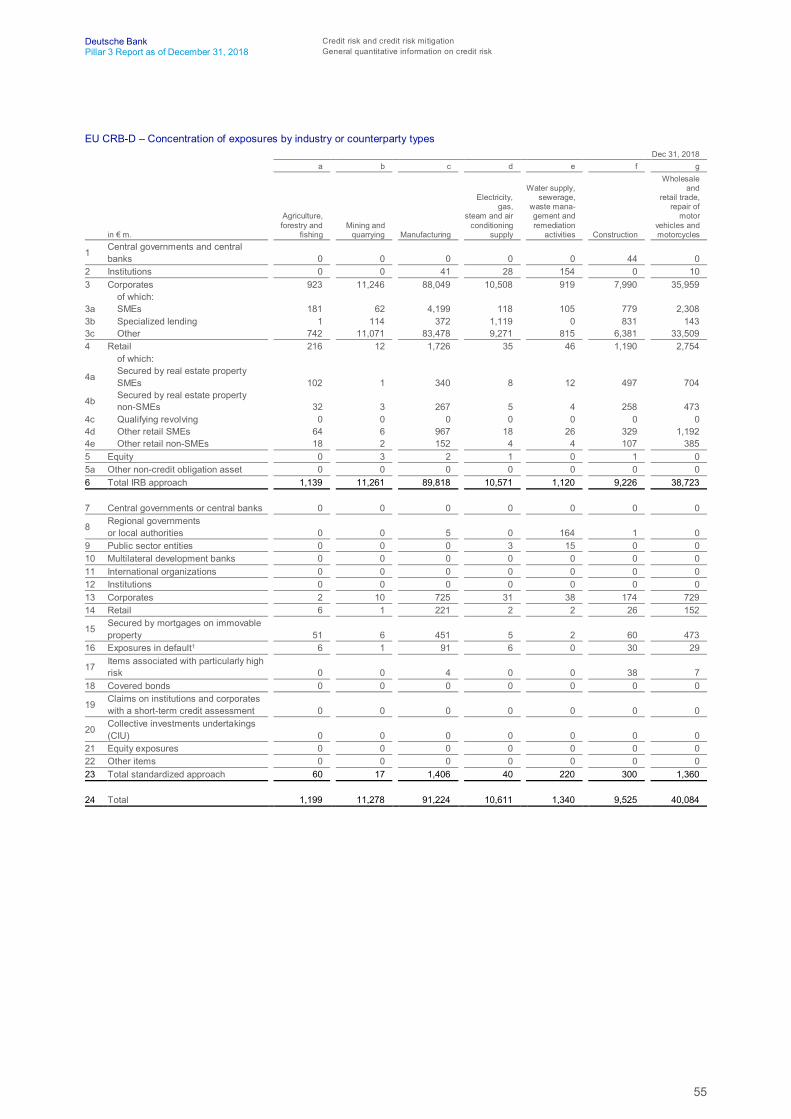
55
Deutsche Bank Credit risk and credit risk mitigationPillar 3 Report as of December 31, 2018 General quantitative information on credit risk
EU CRB-D – Concentration of exposures by industry or counterparty typesDec 31, 2018
a b c d e f g
in € m.
Agriculture,forestry and
fishingMining and
quarrying Manufacturing
Electricity,gas,
steam and airconditioning
supply
Water supply,sewerage,
waste mana-gement andremediation
activities Construction
Wholesaleand
retail trade,repair of
motorvehicles andmotorcycles
1 Central governments and centralbanks 0 0 0 0 0 44 0
2 Institutions 0 0 41 28 154 0 103 Corporates 923 11,246 88,049 10,508 919 7,990 35,959
of which:3a SMEs 181 62 4,199 118 105 779 2,3083b Specialized lending 1 114 372 1,119 0 831 1433c Other 742 11,071 83,478 9,271 815 6,381 33,5094 Retail 216 12 1,726 35 46 1,190 2,754
of which:
4a Secured by real estate propertySMEs 102 1 340 8 12 497 704
4b Secured by real estate propertynon-SMEs 32 3 267 5 4 258 473
4c Qualifying revolving 0 0 0 0 0 0 04d Other retail SMEs 64 6 967 18 26 329 1,1924e Other retail non-SMEs 18 2 152 4 4 107 3855 Equity 0 3 2 1 0 1 05a Other non-credit obligation asset 0 0 0 0 0 0 06 Total IRB approach 1,139 11,261 89,818 10,571 1,120 9,226 38,723
7 Central governments or central banks 0 0 0 0 0 0 0
8 Regional governmentsor local authorities 0 0 5 0 164 1 0
9 Public sector entities 0 0 0 3 15 0 010 Multilateral development banks 0 0 0 0 0 0 011 International organizations 0 0 0 0 0 0 012 Institutions 0 0 0 0 0 0 013 Corporates 2 10 725 31 38 174 72914 Retail 6 1 221 2 2 26 152
15 Secured by mortgages on immovableproperty 51 6 451 5 2 60 473
16 Exposures in default1 6 1 91 6 0 30 29
17 Items associated with particularly highrisk 0 0 4 0 0 38 7
18 Covered bonds 0 0 0 0 0 0 0
19 Claims on institutions and corporateswith a short-term credit assessment 0 0 0 0 0 0 0
20 Collective investments undertakings(CIU) 0 0 0 0 0 0 0
21 Equity exposures 0 0 0 0 0 0 022 Other items 0 0 0 0 0 0 023 Total standardized approach 60 17 1,406 40 220 300 1,360
24 Total 1,199 11,278 91,224 10,611 1,340 9,525 40,084
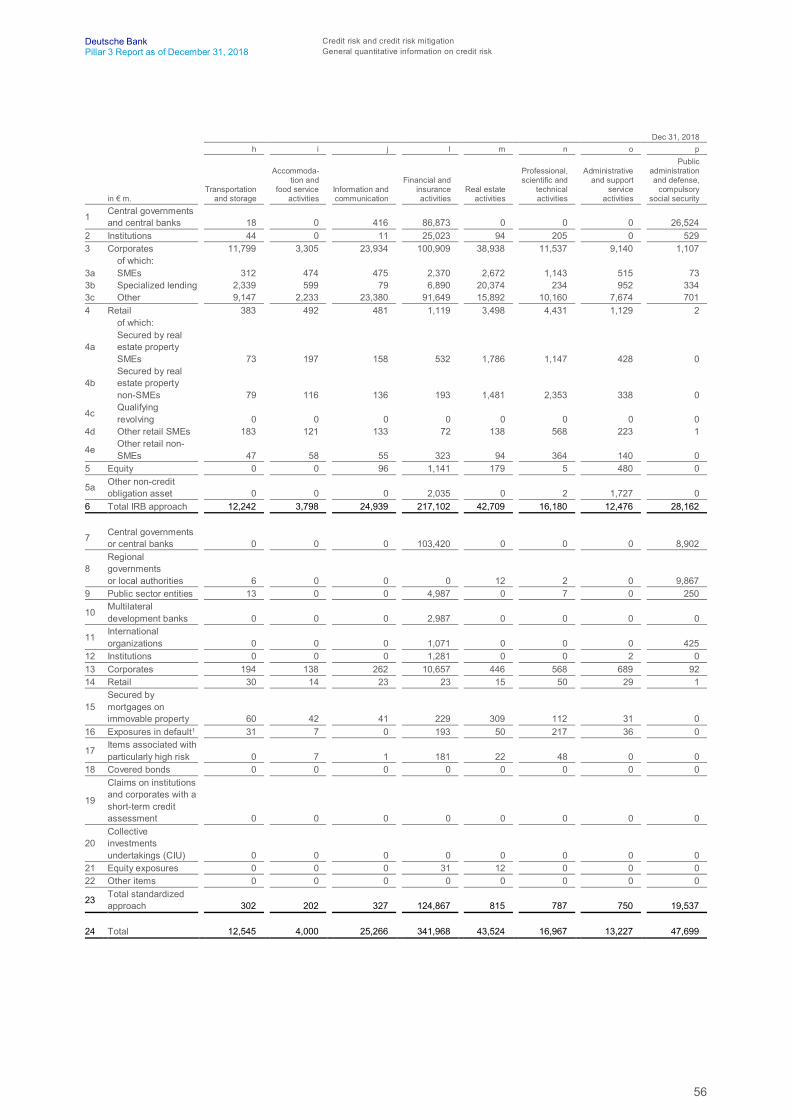
56
Deutsche Bank Credit risk and credit risk mitigationPillar 3 Report as of December 31, 2018 General quantitative information on credit risk
Dec 31, 2018h i j l m n o p
in € m.Transportation
and storage
Accommoda-tion and
food serviceactivities
Information andcommunication
Financial andinsuranceactivities
Real estateactivities
Professional,scientific and
technicalactivities
Administrativeand support
serviceactivities
Publicadministrationand defense,
compulsorysocial security
1 Central governmentsand central banks 18 0 416 86,873 0 0 0 26,524
2 Institutions 44 0 11 25,023 94 205 0 5293 Corporates 11,799 3,305 23,934 100,909 38,938 11,537 9,140 1,107
of which:3a SMEs 312 474 475 2,370 2,672 1,143 515 733b Specialized lending 2,339 599 79 6,890 20,374 234 952 3343c Other 9,147 2,233 23,380 91,649 15,892 10,160 7,674 7014 Retail 383 492 481 1,119 3,498 4,431 1,129 2
of which:
4aSecured by realestate propertySMEs 73 197 158 532 1,786 1,147 428 0
4bSecured by realestate propertynon-SMEs 79 116 136 193 1,481 2,353 338 0
4c Qualifyingrevolving 0 0 0 0 0 0 0 0
4d Other retail SMEs 183 121 133 72 138 568 223 1
4e Other retail non-SMEs 47 58 55 323 94 364 140 0
5 Equity 0 0 96 1,141 179 5 480 0
5a Other non-creditobligation asset 0 0 0 2,035 0 2 1,727 0
6 Total IRB approach 12,242 3,798 24,939 217,102 42,709 16,180 12,476 28,162
7 Central governmentsor central banks 0 0 0 103,420 0 0 0 8,902
8Regionalgovernmentsor local authorities 6 0 0 0 12 2 0 9,867
9 Public sector entities 13 0 0 4,987 0 7 0 250
10 Multilateraldevelopment banks 0 0 0 2,987 0 0 0 0
11 Internationalorganizations 0 0 0 1,071 0 0 0 425
12 Institutions 0 0 0 1,281 0 0 2 013 Corporates 194 138 262 10,657 446 568 689 9214 Retail 30 14 23 23 15 50 29 1
15Secured bymortgages onimmovable property 60 42 41 229 309 112 31 0
16 Exposures in default1 31 7 0 193 50 217 36 0
17 Items associated withparticularly high risk 0 7 1 181 22 48 0 0
18 Covered bonds 0 0 0 0 0 0 0 0
19
Claims on institutionsand corporates with ashort-term creditassessment 0 0 0 0 0 0 0 0
20Collectiveinvestmentsundertakings (CIU) 0 0 0 0 0 0 0 0
21 Equity exposures 0 0 0 31 12 0 0 022 Other items 0 0 0 0 0 0 0 0
23 Total standardizedapproach 302 202 327 124,867 815 787 750 19,537
24 Total 12,545 4,000 25,266 341,968 43,524 16,967 13,227 47,699

57
Deutsche Bank Credit risk and credit risk mitigationPillar 3 Report as of December 31, 2018 General quantitative information on credit risk
Dec 31, 2018q r s t u v w
in € m. Education
Humanhealth
and socialwork
activities
Arts,entertainment
andrecreation
Other serviceactivities
Activities ofhouseholds as
employers,undifferentiated
goods- andservices-
producingactivities of
households forown use
Activities ofextraterritorialorganizations
and bodies Total1 Central governments and central banks 0 0 0 4,453 0 116 118,4442 Institutions 1 27 0 35 5 0 26,2073 Corporates 498 2,780 1,556 2,004 18,263 10 381,377
of which:3a SMEs 49 292 89 220 228 0 16,6613b Specialized lending 0 12 84 28 295 0 34,7973c Other 449 2,477 1,384 1,756 17,740 10 329,9184 Retail 120 2,623 277 1,103 196,425 0 218,063
of which:4a Secured by real estate property SMEs 38 954 130 413 1,914 0 9,433
4b Secured by real estate property non-SMEs 39 419 70 248 149,783 0 156,297
4c Qualifying revolving 0 0 0 0 16,466 0 16,4664d Other retail SMEs 24 727 44 126 733 0 5,6984e Other retail non-SMEs 18 522 32 315 27,530 0 30,1695 Equity 0 0 0 229 0 0 2,1375a Other non-credit obligation asset 0 0 0 1,932 1,197 0 6,8936 Total IRB approach 618 5,431 1,833 9,756 215,891 127 753,121
7 Central governments or central banks 0 0 0 100 0 1 112,424
8 Regional governmentsor local authorities 0 1 2 22 3 0 10,085
9 Public sector entities 0 61 0 1 0 0 5,33610 Multilateral development banks 0 0 0 0 0 358 3,34411 International organizations 0 0 0 0 0 0 1,49612 Institutions 0 0 0 0 129 0 1,41213 Corporates 14 28 4 3,389 1,307 1 19,49914 Retail 2 9 5 139 3,533 0 4,280
15 Secured by mortgages on immovableproperty 4 24 14 477 2,090 0 4,481
16 Exposures in default1 0 0 1 80 160 0 938
17 Items associated with particularly highrisk 0 0 0 1 31 0 339
18 Covered bonds 0 0 0 0 0 0 0
19 Claims on institutions and corporateswith a short-term credit assessment 0 0 0 0 0 0 0
20 Collective investments undertakings(CIU) 0 0 0 0 0 0 0
21 Equity exposures 0 0 0 7 0 0 5022 Other items 0 0 0 12 0 0 1223 Total standardized approach 19 123 26 4,149 7,093 360 162,758
24 Total 637 5,553 1,859 13,904 222,984 487 915,8791 In light of recent EBA guidance (Q&A 2017_3481) we have revised our approach to present the defaulted exposure within the standardized approach: We present the total ofdefaulted exposure in line 16 but also show a breakdown of defaulted exposure and assign it to their respective exposure classes. In order to avoid double counting of exposures,the total exposure of the standardized approach as presented in row 23 does not take into account figures disclosed under row 16. This new approach is applied for December 31,2018, but not for the comparative numbers as of December 31, 2017.
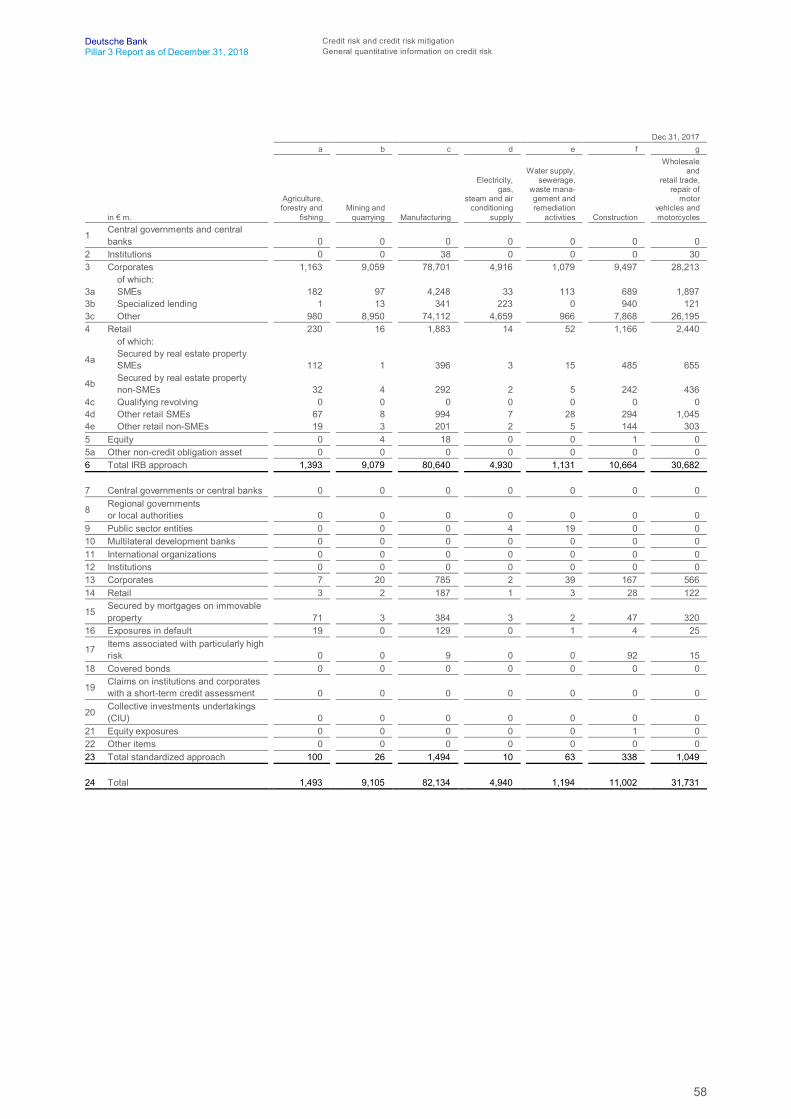
58
Deutsche Bank Credit risk and credit risk mitigationPillar 3 Report as of December 31, 2018 General quantitative information on credit risk
Dec 31, 2017a b c d e f g
in € m.
Agriculture,forestry and
fishingMining and
quarrying Manufacturing
Electricity,gas,
steam and airconditioning
supply
Water supply,sewerage,
waste mana-gement andremediation
activities Construction
Wholesaleand
retail trade,repair of
motorvehicles andmotorcycles
1 Central governments and centralbanks 0 0 0 0 0 0 0
2 Institutions 0 0 38 0 0 0 303 Corporates 1,163 9,059 78,701 4,916 1,079 9,497 28,213
of which:3a SMEs 182 97 4,248 33 113 689 1,8973b Specialized lending 1 13 341 223 0 940 1213c Other 980 8,950 74,112 4,659 966 7,868 26,1954 Retail 230 16 1,883 14 52 1,166 2,440
of which:
4a Secured by real estate propertySMEs 112 1 396 3 15 485 655
4b Secured by real estate propertynon-SMEs 32 4 292 2 5 242 436
4c Qualifying revolving 0 0 0 0 0 0 04d Other retail SMEs 67 8 994 7 28 294 1,0454e Other retail non-SMEs 19 3 201 2 5 144 3035 Equity 0 4 18 0 0 1 05a Other non-credit obligation asset 0 0 0 0 0 0 06 Total IRB approach 1,393 9,079 80,640 4,930 1,131 10,664 30,682
7 Central governments or central banks 0 0 0 0 0 0 0
8 Regional governmentsor local authorities 0 0 0 0 0 0 0
9 Public sector entities 0 0 0 4 19 0 010 Multilateral development banks 0 0 0 0 0 0 011 International organizations 0 0 0 0 0 0 012 Institutions 0 0 0 0 0 0 013 Corporates 7 20 785 2 39 167 56614 Retail 3 2 187 1 3 28 122
15 Secured by mortgages on immovableproperty 71 3 384 3 2 47 320
16 Exposures in default 19 0 129 0 1 4 25
17 Items associated with particularly highrisk 0 0 9 0 0 92 15
18 Covered bonds 0 0 0 0 0 0 0
19 Claims on institutions and corporateswith a short-term credit assessment 0 0 0 0 0 0 0
20 Collective investments undertakings(CIU) 0 0 0 0 0 0 0
21 Equity exposures 0 0 0 0 0 1 022 Other items 0 0 0 0 0 0 023 Total standardized approach 100 26 1,494 10 63 338 1,049
24 Total 1,493 9,105 82,134 4,940 1,194 11,002 31,731
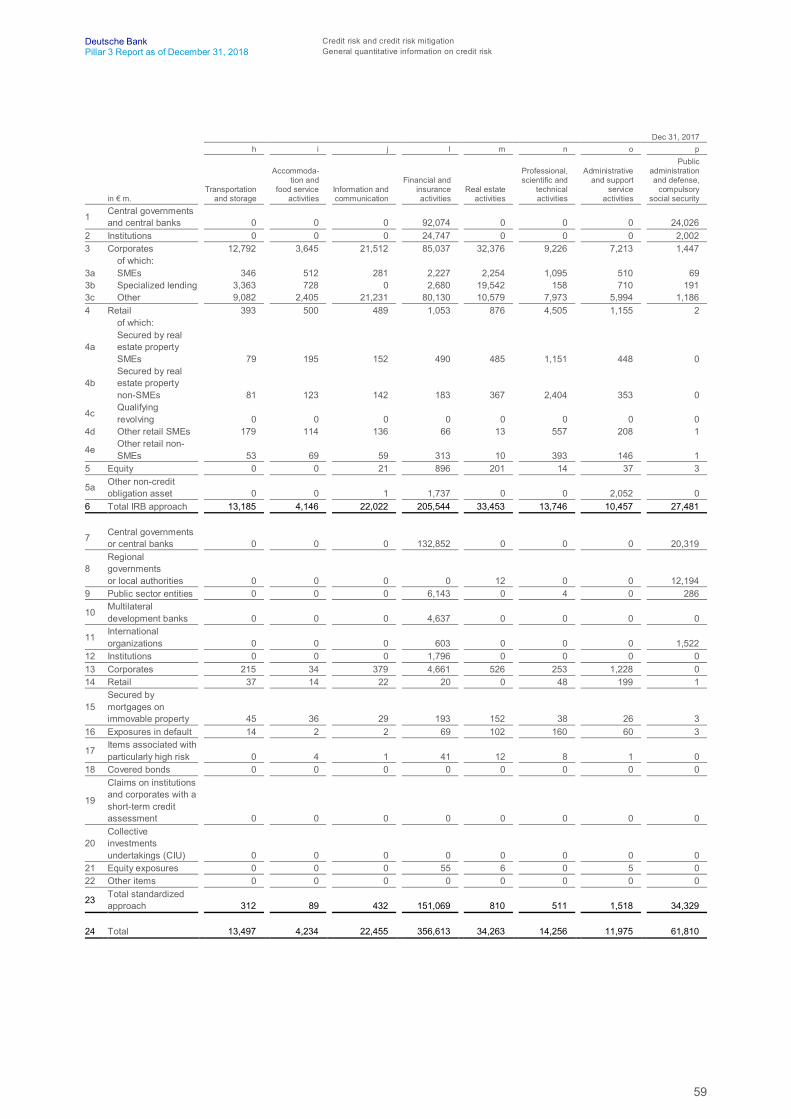
59
Deutsche Bank Credit risk and credit risk mitigationPillar 3 Report as of December 31, 2018 General quantitative information on credit risk
Dec 31, 2017h i j l m n o p
in € m.Transportation
and storage
Accommoda-tion and
food serviceactivities
Information andcommunication
Financial andinsuranceactivities
Real estateactivities
Professional,scientific and
technicalactivities
Administrativeand support
serviceactivities
Publicadministrationand defense,
compulsorysocial security
1 Central governmentsand central banks 0 0 0 92,074 0 0 0 24,026
2 Institutions 0 0 0 24,747 0 0 0 2,0023 Corporates 12,792 3,645 21,512 85,037 32,376 9,226 7,213 1,447
of which:3a SMEs 346 512 281 2,227 2,254 1,095 510 693b Specialized lending 3,363 728 0 2,680 19,542 158 710 1913c Other 9,082 2,405 21,231 80,130 10,579 7,973 5,994 1,1864 Retail 393 500 489 1,053 876 4,505 1,155 2
of which:
4aSecured by realestate propertySMEs 79 195 152 490 485 1,151 448 0
4bSecured by realestate propertynon-SMEs 81 123 142 183 367 2,404 353 0
4c Qualifyingrevolving 0 0 0 0 0 0 0 0
4d Other retail SMEs 179 114 136 66 13 557 208 1
4e Other retail non-SMEs 53 69 59 313 10 393 146 1
5 Equity 0 0 21 896 201 14 37 3
5a Other non-creditobligation asset 0 0 1 1,737 0 0 2,052 0
6 Total IRB approach 13,185 4,146 22,022 205,544 33,453 13,746 10,457 27,481
7 Central governmentsor central banks 0 0 0 132,852 0 0 0 20,319
8Regionalgovernmentsor local authorities 0 0 0 0 12 0 0 12,194
9 Public sector entities 0 0 0 6,143 0 4 0 286
10 Multilateraldevelopment banks 0 0 0 4,637 0 0 0 0
11 Internationalorganizations 0 0 0 603 0 0 0 1,522
12 Institutions 0 0 0 1,796 0 0 0 013 Corporates 215 34 379 4,661 526 253 1,228 014 Retail 37 14 22 20 0 48 199 1
15Secured bymortgages onimmovable property 45 36 29 193 152 38 26 3
16 Exposures in default 14 2 2 69 102 160 60 3
17 Items associated withparticularly high risk 0 4 1 41 12 8 1 0
18 Covered bonds 0 0 0 0 0 0 0 0
19
Claims on institutionsand corporates with ashort-term creditassessment 0 0 0 0 0 0 0 0
20Collectiveinvestmentsundertakings (CIU) 0 0 0 0 0 0 0 0
21 Equity exposures 0 0 0 55 6 0 5 022 Other items 0 0 0 0 0 0 0 0
23 Total standardizedapproach 312 89 432 151,069 810 511 1,518 34,329
24 Total 13,497 4,234 22,455 356,613 34,263 14,256 11,975 61,810
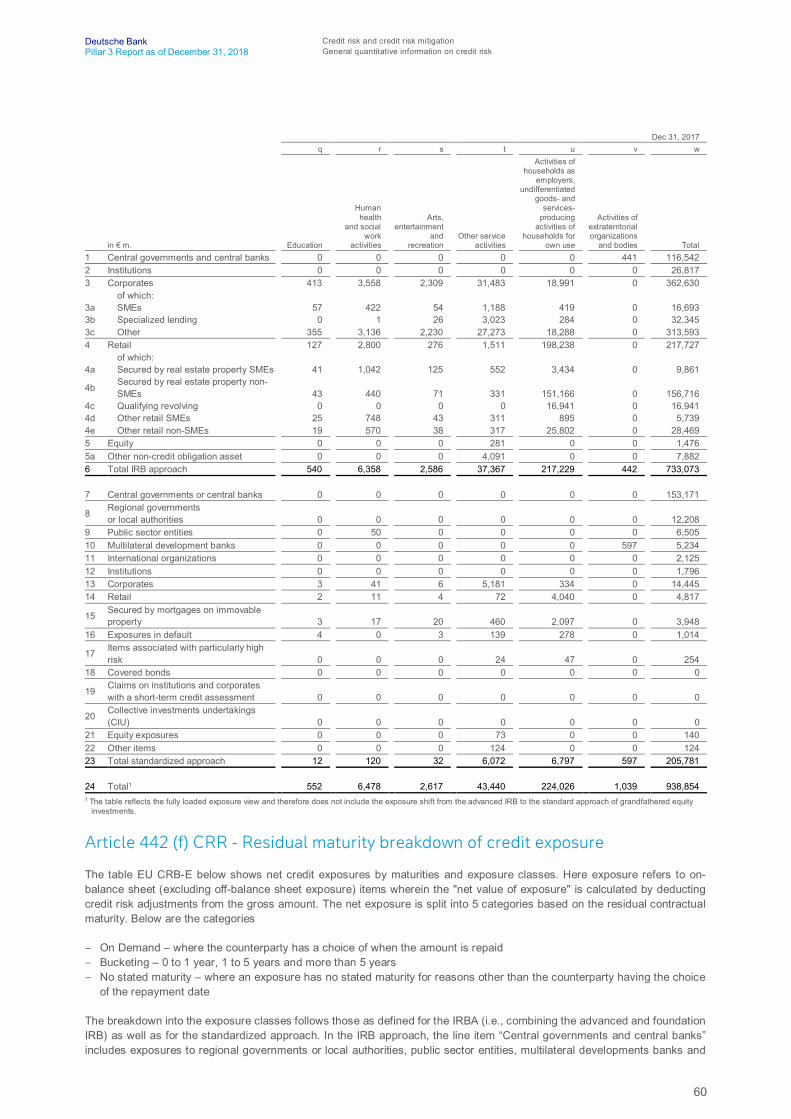
60
Deutsche Bank Credit risk and credit risk mitigationPillar 3 Report as of December 31, 2018 General quantitative information on credit risk
Dec 31, 2017q r s t u v w
in € m. Education
Humanhealth
and socialwork
activities
Arts,entertainment
andrecreation
Other serviceactivities
Activities ofhouseholds as
employers,undifferentiated
goods- andservices-
producingactivities of
households forown use
Activities ofextraterritorialorganizations
and bodies Total1 Central governments and central banks 0 0 0 0 0 441 116,5422 Institutions 0 0 0 0 0 0 26,8173 Corporates 413 3,558 2,309 31,483 18,991 0 362,630
of which:3a SMEs 57 422 54 1,188 419 0 16,6933b Specialized lending 0 1 26 3,023 284 0 32,3453c Other 355 3,136 2,230 27,273 18,288 0 313,5934 Retail 127 2,800 276 1,511 198,238 0 217,727
of which:4a Secured by real estate property SMEs 41 1,042 125 552 3,434 0 9,861
4b Secured by real estate property non-SMEs 43 440 71 331 151,166 0 156,716
4c Qualifying revolving 0 0 0 0 16,941 0 16,9414d Other retail SMEs 25 748 43 311 895 0 5,7394e Other retail non-SMEs 19 570 38 317 25,802 0 28,4695 Equity 0 0 0 281 0 0 1,4765a Other non-credit obligation asset 0 0 0 4,091 0 0 7,8826 Total IRB approach 540 6,358 2,586 37,367 217,229 442 733,073
7 Central governments or central banks 0 0 0 0 0 0 153,171
8 Regional governmentsor local authorities 0 0 0 0 0 0 12,208
9 Public sector entities 0 50 0 0 0 0 6,50510 Multilateral development banks 0 0 0 0 0 597 5,23411 International organizations 0 0 0 0 0 0 2,12512 Institutions 0 0 0 0 0 0 1,79613 Corporates 3 41 6 5,181 334 0 14,44514 Retail 2 11 4 72 4,040 0 4,817
15 Secured by mortgages on immovableproperty 3 17 20 460 2,097 0 3,948
16 Exposures in default 4 0 3 139 278 0 1,014
17 Items associated with particularly highrisk 0 0 0 24 47 0 254
18 Covered bonds 0 0 0 0 0 0 0
19 Claims on institutions and corporateswith a short-term credit assessment 0 0 0 0 0 0 0
20 Collective investments undertakings(CIU) 0 0 0 0 0 0 0
21 Equity exposures 0 0 0 73 0 0 14022 Other items 0 0 0 124 0 0 12423 Total standardized approach 12 120 32 6,072 6,797 597 205,781
24 Total1 552 6,478 2,617 43,440 224,026 1,039 938,8541 The table reflects the fully loaded exposure view and therefore does not include the exposure shift from the advanced IRB to the standard approach of grandfathered equity
investments.
Article 442 (f) CRR - Residual maturity breakdown of credit exposure
The table EU CRB-E below shows net credit exposures by maturities and exposure classes. Here exposure refers to on-balance sheet (excluding off-balance sheet exposure) items wherein the "net value of exposure" is calculated by deductingcredit risk adjustments from the gross amount. The net exposure is split into 5 categories based on the residual contractualmaturity. Below are the categories
– On Demand – where the counterparty has a choice of when the amount is repaid– Bucketing – 0 to 1 year, 1 to 5 years and more than 5 years– No stated maturity – where an exposure has no stated maturity for reasons other than the counterparty having the choice
of the repayment date
The breakdown into the exposure classes follows those as defined for the IRBA (i.e., combining the advanced and foundationIRB) as well as for the standardized approach. In the IRB approach, the line item “Central governments and central banks”includes exposures to regional governments or local authorities, public sector entities, multilateral developments banks and
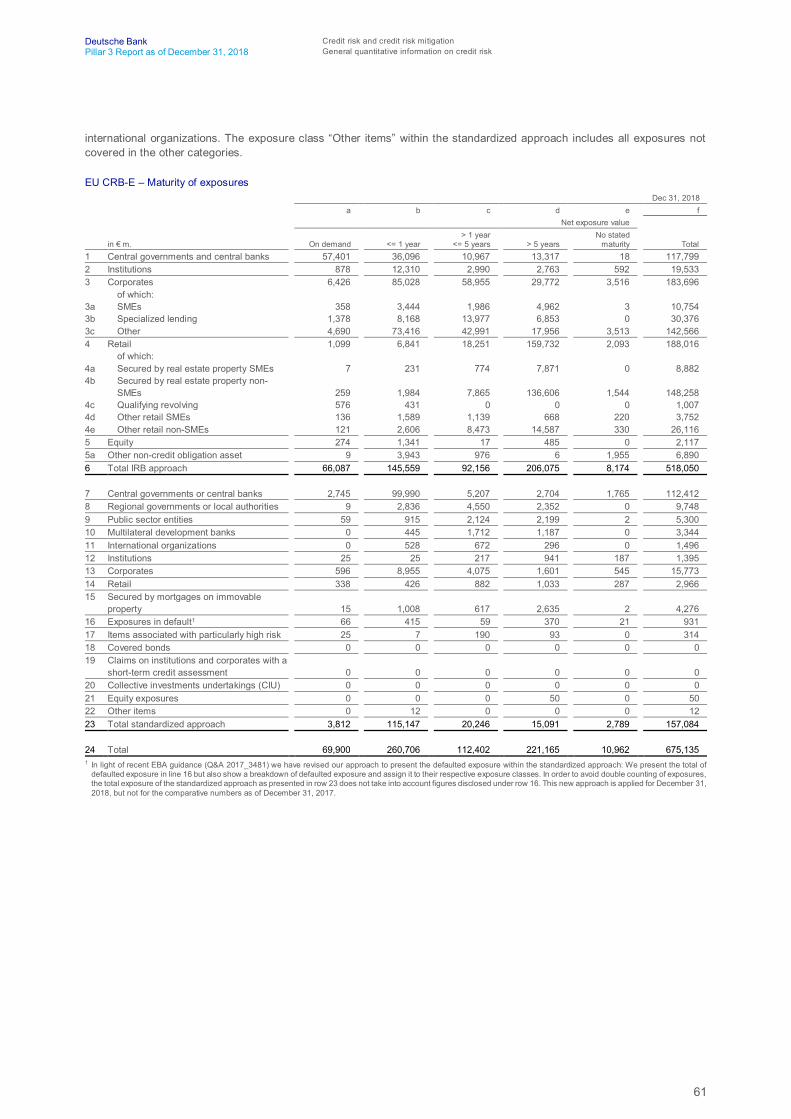
61
Deutsche Bank Credit risk and credit risk mitigationPillar 3 Report as of December 31, 2018 General quantitative information on credit risk
international organizations. The exposure class “Other items” within the standardized approach includes all exposures notcovered in the other categories.
EU CRB-E – Maturity of exposuresDec 31, 2018
a b c d e fNet exposure value
in € m. On demand <= 1 year> 1 year
<= 5 years > 5 yearsNo stated
maturity Total1 Central governments and central banks 57,401 36,096 10,967 13,317 18 117,7992 Institutions 878 12,310 2,990 2,763 592 19,5333 Corporates 6,426 85,028 58,955 29,772 3,516 183,696
of which:3a SMEs 358 3,444 1,986 4,962 3 10,7543b Specialized lending 1,378 8,168 13,977 6,853 0 30,3763c Other 4,690 73,416 42,991 17,956 3,513 142,5664 Retail 1,099 6,841 18,251 159,732 2,093 188,016
of which:4a Secured by real estate property SMEs 7 231 774 7,871 0 8,8824b Secured by real estate property non-
SMEs 259 1,984 7,865 136,606 1,544 148,2584c Qualifying revolving 576 431 0 0 0 1,0074d Other retail SMEs 136 1,589 1,139 668 220 3,7524e Other retail non-SMEs 121 2,606 8,473 14,587 330 26,1165 Equity 274 1,341 17 485 0 2,1175a Other non-credit obligation asset 9 3,943 976 6 1,955 6,8906 Total IRB approach 66,087 145,559 92,156 206,075 8,174 518,050
7 Central governments or central banks 2,745 99,990 5,207 2,704 1,765 112,4128 Regional governments or local authorities 9 2,836 4,550 2,352 0 9,7489 Public sector entities 59 915 2,124 2,199 2 5,30010 Multilateral development banks 0 445 1,712 1,187 0 3,34411 International organizations 0 528 672 296 0 1,49612 Institutions 25 25 217 941 187 1,39513 Corporates 596 8,955 4,075 1,601 545 15,77314 Retail 338 426 882 1,033 287 2,96615 Secured by mortgages on immovable
property 15 1,008 617 2,635 2 4,27616 Exposures in default1 66 415 59 370 21 93117 Items associated with particularly high risk 25 7 190 93 0 31418 Covered bonds 0 0 0 0 0 019 Claims on institutions and corporates with a
short-term credit assessment 0 0 0 0 0 020 Collective investments undertakings (CIU) 0 0 0 0 0 021 Equity exposures 0 0 0 50 0 5022 Other items 0 12 0 0 0 1223 Total standardized approach 3,812 115,147 20,246 15,091 2,789 157,084
24 Total 69,900 260,706 112,402 221,165 10,962 675,1351 In light of recent EBA guidance (Q&A 2017_3481) we have revised our approach to present the defaulted exposure within the standardized approach: We present the total of
defaulted exposure in line 16 but also show a breakdown of defaulted exposure and assign it to their respective exposure classes. In order to avoid double counting of exposures,the total exposure of the standardized approach as presented in row 23 does not take into account figures disclosed under row 16. This new approach is applied for December 31,2018, but not for the comparative numbers as of December 31, 2017.
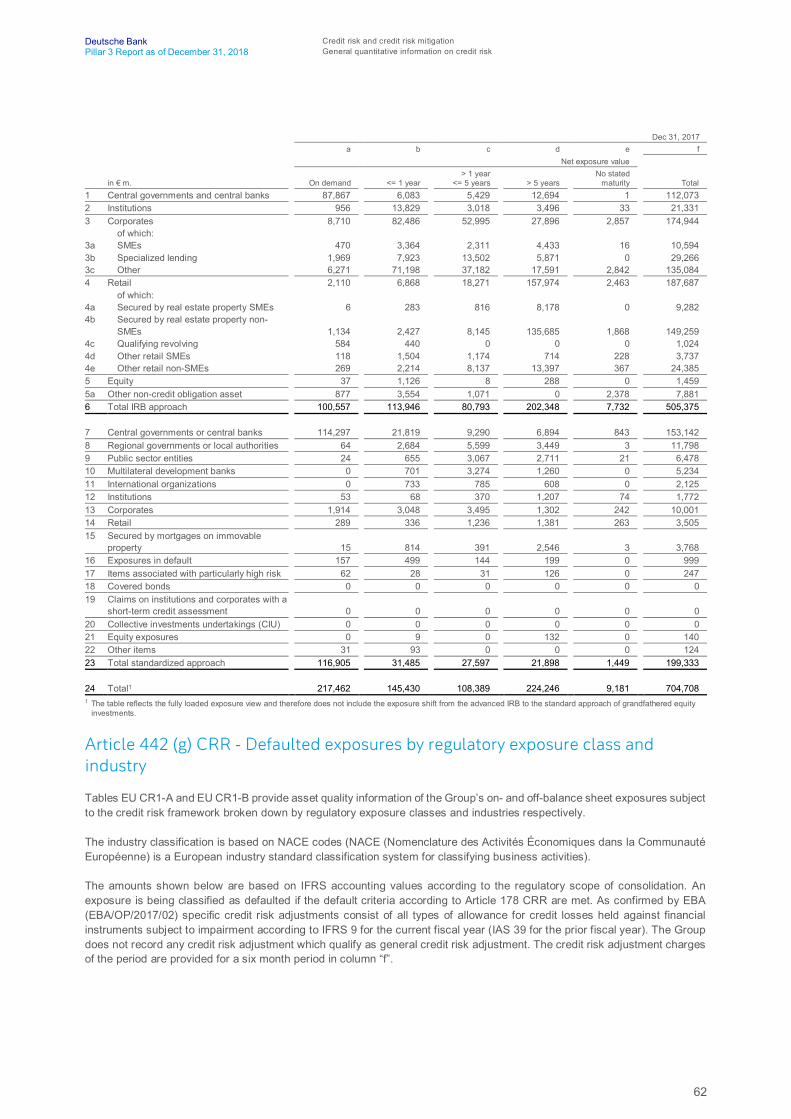
62
Deutsche Bank Credit risk and credit risk mitigationPillar 3 Report as of December 31, 2018 General quantitative information on credit risk
Dec 31, 2017a b c d e f
Net exposure value
in € m. On demand <= 1 year> 1 year
<= 5 years > 5 yearsNo stated
maturity Total1 Central governments and central banks 87,867 6,083 5,429 12,694 1 112,0732 Institutions 956 13,829 3,018 3,496 33 21,3313 Corporates 8,710 82,486 52,995 27,896 2,857 174,944
of which:3a SMEs 470 3,364 2,311 4,433 16 10,5943b Specialized lending 1,969 7,923 13,502 5,871 0 29,2663c Other 6,271 71,198 37,182 17,591 2,842 135,0844 Retail 2,110 6,868 18,271 157,974 2,463 187,687
of which:4a Secured by real estate property SMEs 6 283 816 8,178 0 9,2824b Secured by real estate property non-
SMEs 1,134 2,427 8,145 135,685 1,868 149,2594c Qualifying revolving 584 440 0 0 0 1,0244d Other retail SMEs 118 1,504 1,174 714 228 3,7374e Other retail non-SMEs 269 2,214 8,137 13,397 367 24,3855 Equity 37 1,126 8 288 0 1,4595a Other non-credit obligation asset 877 3,554 1,071 0 2,378 7,8816 Total IRB approach 100,557 113,946 80,793 202,348 7,732 505,375
7 Central governments or central banks 114,297 21,819 9,290 6,894 843 153,1428 Regional governments or local authorities 64 2,684 5,599 3,449 3 11,7989 Public sector entities 24 655 3,067 2,711 21 6,47810 Multilateral development banks 0 701 3,274 1,260 0 5,23411 International organizations 0 733 785 608 0 2,12512 Institutions 53 68 370 1,207 74 1,77213 Corporates 1,914 3,048 3,495 1,302 242 10,00114 Retail 289 336 1,236 1,381 263 3,50515 Secured by mortgages on immovable
property 15 814 391 2,546 3 3,76816 Exposures in default 157 499 144 199 0 99917 Items associated with particularly high risk 62 28 31 126 0 24718 Covered bonds 0 0 0 0 0 019 Claims on institutions and corporates with a
short-term credit assessment 0 0 0 0 0 020 Collective investments undertakings (CIU) 0 0 0 0 0 021 Equity exposures 0 9 0 132 0 14022 Other items 31 93 0 0 0 12423 Total standardized approach 116,905 31,485 27,597 21,898 1,449 199,333
24 Total1 217,462 145,430 108,389 224,246 9,181 704,7081 The table reflects the fully loaded exposure view and therefore does not include the exposure shift from the advanced IRB to the standard approach of grandfathered equity
investments.
Article 442 (g) CRR - Defaulted exposures by regulatory exposure class andindustry
Tables EU CR1-A and EU CR1-B provide asset quality information of the Group’s on- and off-balance sheet exposures subjectto the credit risk framework broken down by regulatory exposure classes and industries respectively.
The industry classification is based on NACE codes (NACE (Nomenclature des Activités Économiques dans la CommunautéEuropéenne) is a European industry standard classification system for classifying business activities).
The amounts shown below are based on IFRS accounting values according to the regulatory scope of consolidation. Anexposure is being classified as defaulted if the default criteria according to Article 178 CRR are met. As confirmed by EBA(EBA/OP/2017/02) specific credit risk adjustments consist of all types of allowance for credit losses held against financialinstruments subject to impairment according to IFRS 9 for the current fiscal year (IAS 39 for the prior fiscal year). The Groupdoes not record any credit risk adjustment which qualify as general credit risk adjustment. The credit risk adjustment chargesof the period are provided for a six month period in column “f”.
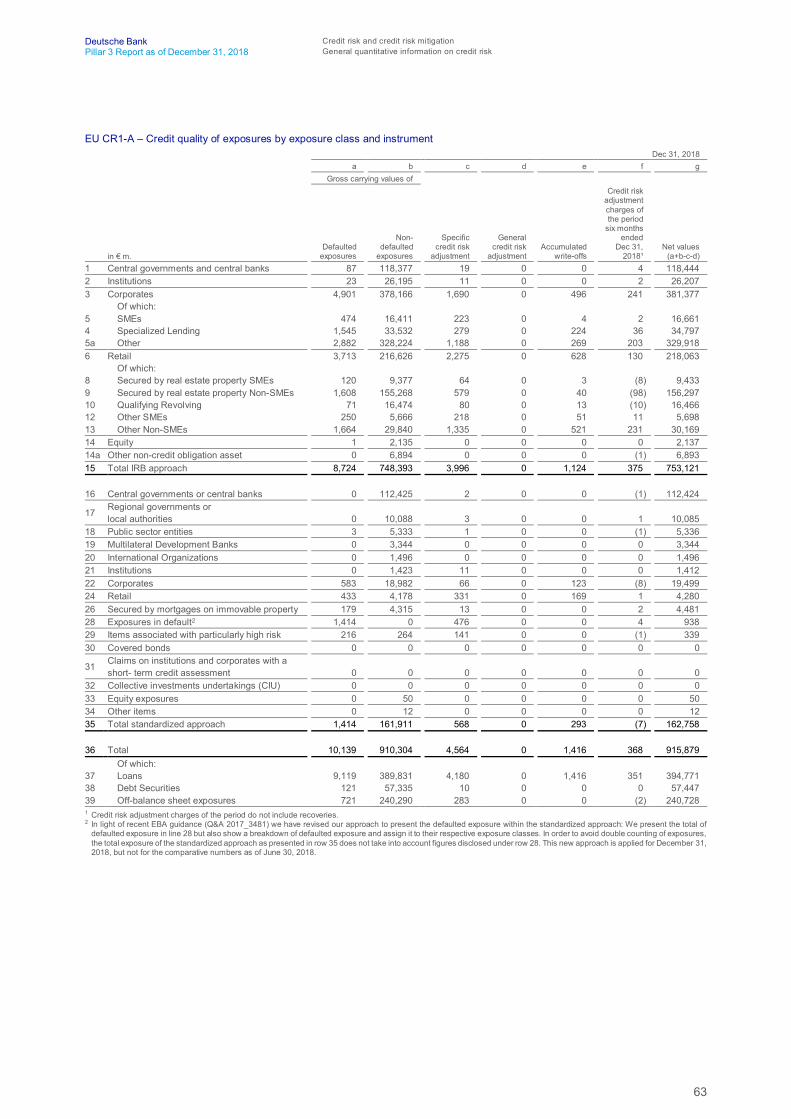
63
Deutsche Bank Credit risk and credit risk mitigationPillar 3 Report as of December 31, 2018 General quantitative information on credit risk
EU CR1-A – Credit quality of exposures by exposure class and instrumentDec 31, 2018
a b c d e f gGross carrying values of
in € m.Defaulted
exposures
Non-defaulted
exposures
Specificcredit risk
adjustment
Generalcredit risk
adjustmentAccumulated
write-offs
Credit riskadjustmentcharges ofthe period
six monthsended
Dec 31,2018¹
Net values(a+b-c-d)
1 Central governments and central banks 87 118,377 19 0 0 4 118,4442 Institutions 23 26,195 11 0 0 2 26,2073 Corporates 4,901 378,166 1,690 0 496 241 381,377
Of which:5 SMEs 474 16,411 223 0 4 2 16,6614 Specialized Lending 1,545 33,532 279 0 224 36 34,7975a Other 2,882 328,224 1,188 0 269 203 329,9186 Retail 3,713 216,626 2,275 0 628 130 218,063
Of which:8 Secured by real estate property SMEs 120 9,377 64 0 3 (8) 9,4339 Secured by real estate property Non-SMEs 1,608 155,268 579 0 40 (98) 156,29710 Qualifying Revolving 71 16,474 80 0 13 (10) 16,46612 Other SMEs 250 5,666 218 0 51 11 5,69813 Other Non-SMEs 1,664 29,840 1,335 0 521 231 30,16914 Equity 1 2,135 0 0 0 0 2,13714a Other non-credit obligation asset 0 6,894 0 0 0 (1) 6,89315 Total IRB approach 8,724 748,393 3,996 0 1,124 375 753,121
16 Central governments or central banks 0 112,425 2 0 0 (1) 112,424
17 Regional governments orlocal authorities 0 10,088 3 0 0 1 10,085
18 Public sector entities 3 5,333 1 0 0 (1) 5,33619 Multilateral Development Banks 0 3,344 0 0 0 0 3,34420 International Organizations 0 1,496 0 0 0 0 1,49621 Institutions 0 1,423 11 0 0 0 1,41222 Corporates 583 18,982 66 0 123 (8) 19,49924 Retail 433 4,178 331 0 169 1 4,28026 Secured by mortgages on immovable property 179 4,315 13 0 0 2 4,48128 Exposures in default2 1,414 0 476 0 0 4 93829 Items associated with particularly high risk 216 264 141 0 0 (1) 33930 Covered bonds 0 0 0 0 0 0 0
31 Claims on institutions and corporates with ashort- term credit assessment 0 0 0 0 0 0 0
32 Collective investments undertakings (CIU) 0 0 0 0 0 0 033 Equity exposures 0 50 0 0 0 0 5034 Other items 0 12 0 0 0 0 1235 Total standardized approach 1,414 161,911 568 0 293 (7) 162,758
36 Total 10,139 910,304 4,564 0 1,416 368 915,879Of which:
37 Loans 9,119 389,831 4,180 0 1,416 351 394,77138 Debt Securities 121 57,335 10 0 0 0 57,44739 Off-balance sheet exposures 721 240,290 283 0 0 (2) 240,7281 Credit risk adjustment charges of the period do not include recoveries.2 In light of recent EBA guidance (Q&A 2017_3481) we have revised our approach to present the defaulted exposure within the standardized approach: We present the total of
defaulted exposure in line 28 but also show a breakdown of defaulted exposure and assign it to their respective exposure classes. In order to avoid double counting of exposures,the total exposure of the standardized approach as presented in row 35 does not take into account figures disclosed under row 28. This new approach is applied for December 31,2018, but not for the comparative numbers as of June 30, 2018.
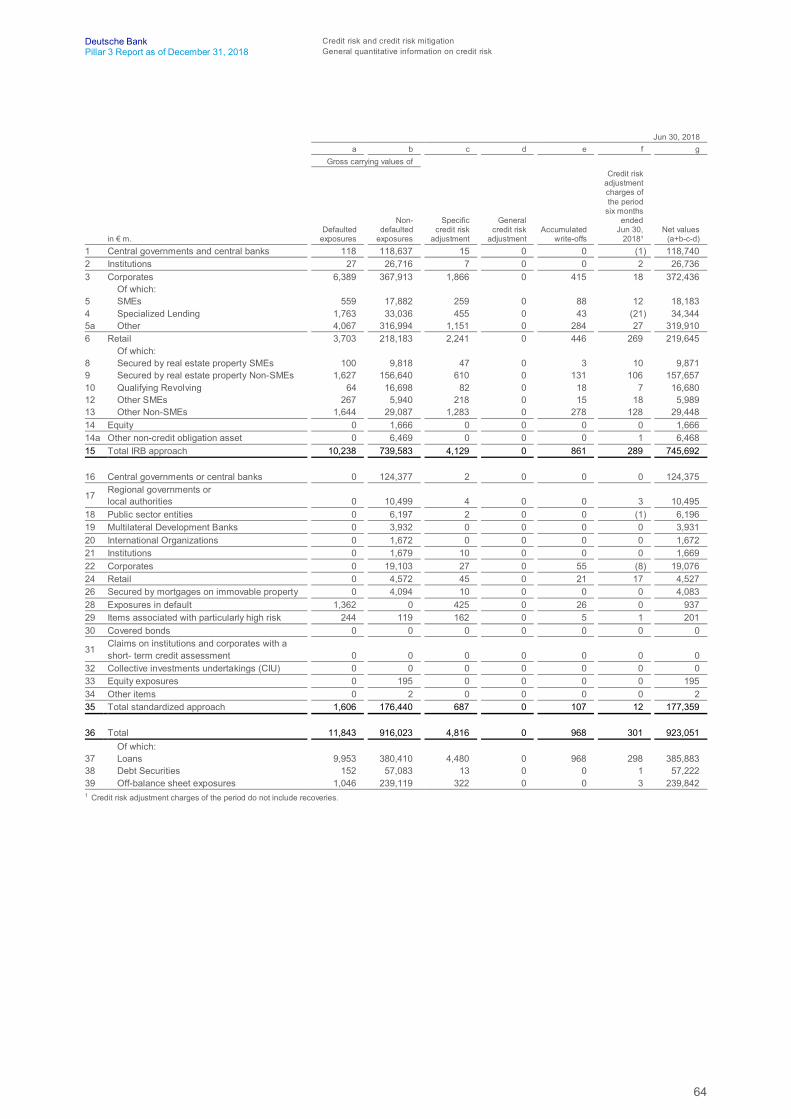
64
Deutsche Bank Credit risk and credit risk mitigationPillar 3 Report as of December 31, 2018 General quantitative information on credit risk
Jun 30, 2018a b c d e f g
Gross carrying values of
in € m.Defaulted
exposures
Non-defaulted
exposures
Specificcredit risk
adjustment
Generalcredit risk
adjustmentAccumulated
write-offs
Credit riskadjustmentcharges ofthe period
six monthsended
Jun 30,2018¹
Net values(a+b-c-d)
1 Central governments and central banks 118 118,637 15 0 0 (1) 118,7402 Institutions 27 26,716 7 0 0 2 26,7363 Corporates 6,389 367,913 1,866 0 415 18 372,436
Of which:5 SMEs 559 17,882 259 0 88 12 18,1834 Specialized Lending 1,763 33,036 455 0 43 (21) 34,3445a Other 4,067 316,994 1,151 0 284 27 319,9106 Retail 3,703 218,183 2,241 0 446 269 219,645
Of which:8 Secured by real estate property SMEs 100 9,818 47 0 3 10 9,8719 Secured by real estate property Non-SMEs 1,627 156,640 610 0 131 106 157,65710 Qualifying Revolving 64 16,698 82 0 18 7 16,68012 Other SMEs 267 5,940 218 0 15 18 5,98913 Other Non-SMEs 1,644 29,087 1,283 0 278 128 29,44814 Equity 0 1,666 0 0 0 0 1,66614a Other non-credit obligation asset 0 6,469 0 0 0 1 6,46815 Total IRB approach 10,238 739,583 4,129 0 861 289 745,692
16 Central governments or central banks 0 124,377 2 0 0 0 124,375
17 Regional governments orlocal authorities 0 10,499 4 0 0 3 10,495
18 Public sector entities 0 6,197 2 0 0 (1) 6,19619 Multilateral Development Banks 0 3,932 0 0 0 0 3,93120 International Organizations 0 1,672 0 0 0 0 1,67221 Institutions 0 1,679 10 0 0 0 1,66922 Corporates 0 19,103 27 0 55 (8) 19,07624 Retail 0 4,572 45 0 21 17 4,52726 Secured by mortgages on immovable property 0 4,094 10 0 0 0 4,08328 Exposures in default 1,362 0 425 0 26 0 93729 Items associated with particularly high risk 244 119 162 0 5 1 20130 Covered bonds 0 0 0 0 0 0 0
31 Claims on institutions and corporates with ashort- term credit assessment 0 0 0 0 0 0 0
32 Collective investments undertakings (CIU) 0 0 0 0 0 0 033 Equity exposures 0 195 0 0 0 0 19534 Other items 0 2 0 0 0 0 235 Total standardized approach 1,606 176,440 687 0 107 12 177,359
36 Total 11,843 916,023 4,816 0 968 301 923,051Of which:
37 Loans 9,953 380,410 4,480 0 968 298 385,88338 Debt Securities 152 57,083 13 0 0 1 57,22239 Off-balance sheet exposures 1,046 239,119 322 0 0 3 239,8421 Credit risk adjustment charges of the period do not include recoveries.
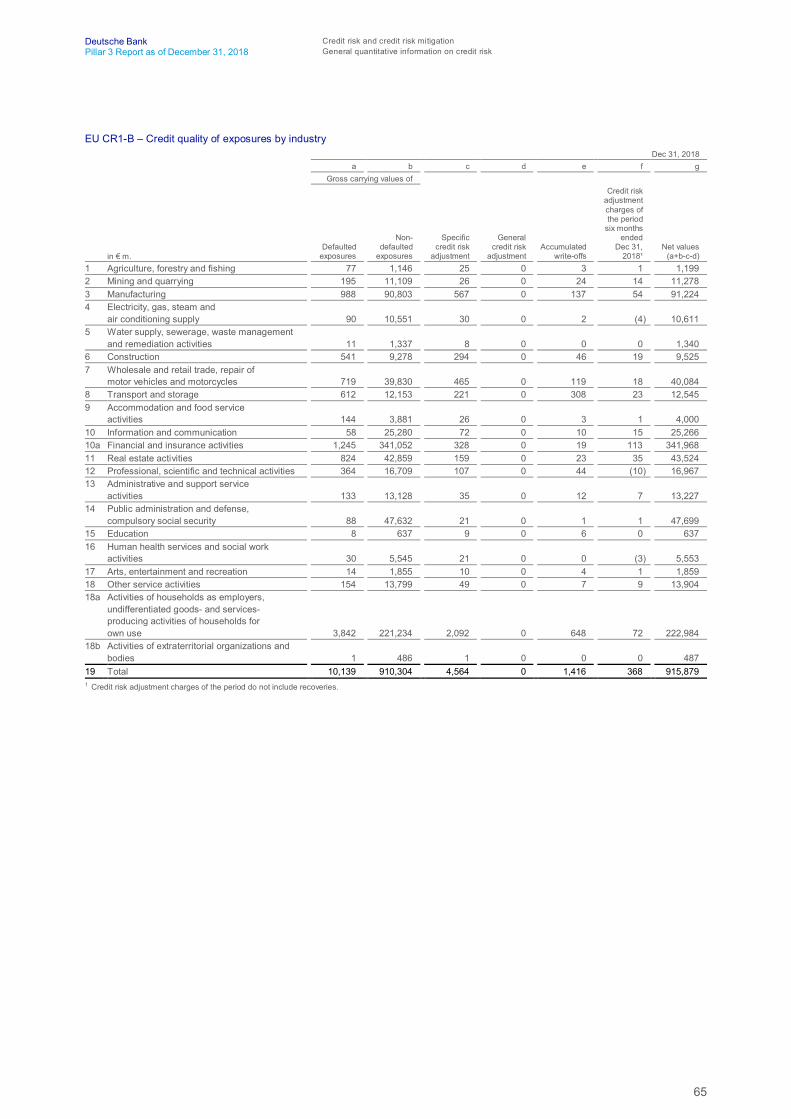
65
Deutsche Bank Credit risk and credit risk mitigationPillar 3 Report as of December 31, 2018 General quantitative information on credit risk
EU CR1-B – Credit quality of exposures by industryDec 31, 2018
a b c d e f gGross carrying values of
in € m.Defaulted
exposures
Non-defaulted
exposures
Specificcredit risk
adjustment
Generalcredit risk
adjustmentAccumulated
write-offs
Credit riskadjustmentcharges ofthe period
six monthsended
Dec 31,2018¹
Net values(a+b-c-d)
1 Agriculture, forestry and fishing 77 1,146 25 0 3 1 1,1992 Mining and quarrying 195 11,109 26 0 24 14 11,2783 Manufacturing 988 90,803 567 0 137 54 91,2244 Electricity, gas, steam and
air conditioning supply 90 10,551 30 0 2 (4) 10,6115 Water supply, sewerage, waste management
and remediation activities 11 1,337 8 0 0 0 1,3406 Construction 541 9,278 294 0 46 19 9,5257 Wholesale and retail trade, repair of
motor vehicles and motorcycles 719 39,830 465 0 119 18 40,0848 Transport and storage 612 12,153 221 0 308 23 12,5459 Accommodation and food service
activities 144 3,881 26 0 3 1 4,00010 Information and communication 58 25,280 72 0 10 15 25,26610a Financial and insurance activities 1,245 341,052 328 0 19 113 341,96811 Real estate activities 824 42,859 159 0 23 35 43,52412 Professional, scientific and technical activities 364 16,709 107 0 44 (10) 16,96713 Administrative and support service
activities 133 13,128 35 0 12 7 13,22714 Public administration and defense,
compulsory social security 88 47,632 21 0 1 1 47,69915 Education 8 637 9 0 6 0 63716 Human health services and social work
activities 30 5,545 21 0 0 (3) 5,55317 Arts, entertainment and recreation 14 1,855 10 0 4 1 1,85918 Other service activities 154 13,799 49 0 7 9 13,90418a Activities of households as employers,
undifferentiated goods- and services-producing activities of households forown use 3,842 221,234 2,092 0 648 72 222,984
18b Activities of extraterritorial organizations andbodies 1 486 1 0 0 0 487
19 Total 10,139 910,304 4,564 0 1,416 368 915,8791 Credit risk adjustment charges of the period do not include recoveries.
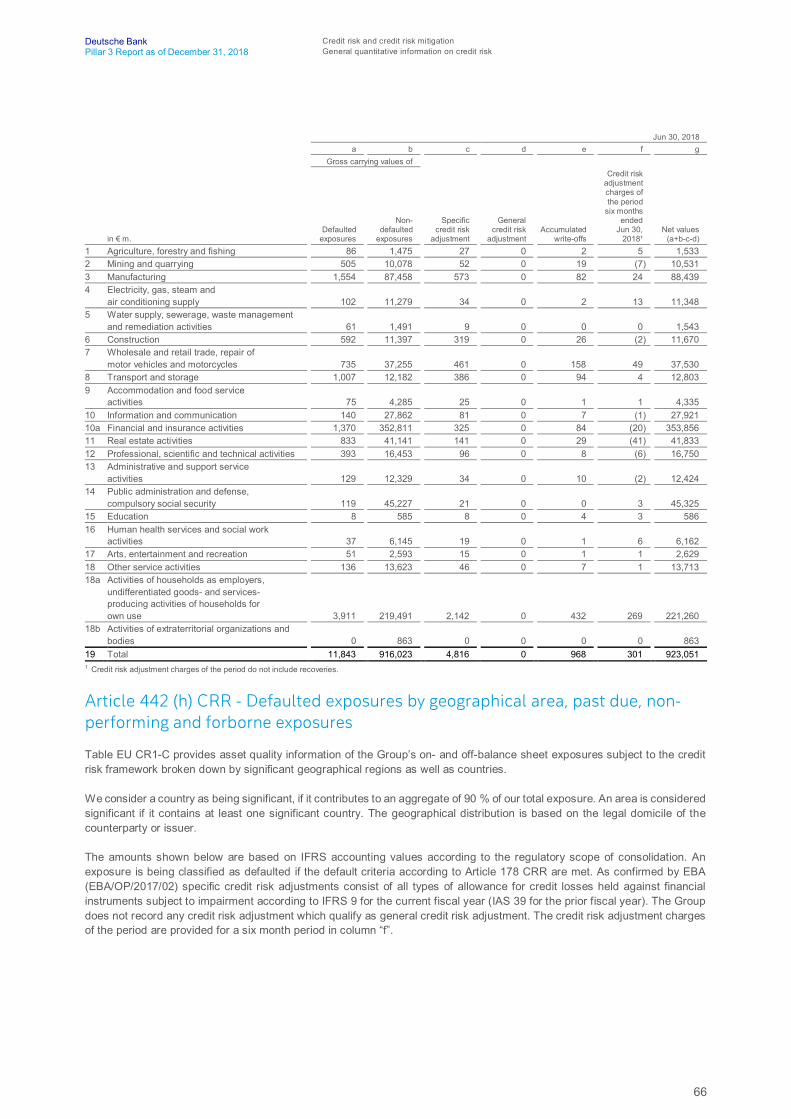
66
Deutsche Bank Credit risk and credit risk mitigationPillar 3 Report as of December 31, 2018 General quantitative information on credit risk
Jun 30, 2018a b c d e f g
Gross carrying values of
in € m.Defaulted
exposures
Non-defaulted
exposures
Specificcredit risk
adjustment
Generalcredit risk
adjustmentAccumulated
write-offs
Credit riskadjustmentcharges ofthe period
six monthsended
Jun 30,2018¹
Net values(a+b-c-d)
1 Agriculture, forestry and fishing 86 1,475 27 0 2 5 1,5332 Mining and quarrying 505 10,078 52 0 19 (7) 10,5313 Manufacturing 1,554 87,458 573 0 82 24 88,4394 Electricity, gas, steam and
air conditioning supply 102 11,279 34 0 2 13 11,3485 Water supply, sewerage, waste management
and remediation activities 61 1,491 9 0 0 0 1,5436 Construction 592 11,397 319 0 26 (2) 11,6707 Wholesale and retail trade, repair of
motor vehicles and motorcycles 735 37,255 461 0 158 49 37,5308 Transport and storage 1,007 12,182 386 0 94 4 12,8039 Accommodation and food service
activities 75 4,285 25 0 1 1 4,33510 Information and communication 140 27,862 81 0 7 (1) 27,92110a Financial and insurance activities 1,370 352,811 325 0 84 (20) 353,85611 Real estate activities 833 41,141 141 0 29 (41) 41,83312 Professional, scientific and technical activities 393 16,453 96 0 8 (6) 16,75013 Administrative and support service
activities 129 12,329 34 0 10 (2) 12,42414 Public administration and defense,
compulsory social security 119 45,227 21 0 0 3 45,32515 Education 8 585 8 0 4 3 58616 Human health services and social work
activities 37 6,145 19 0 1 6 6,16217 Arts, entertainment and recreation 51 2,593 15 0 1 1 2,62918 Other service activities 136 13,623 46 0 7 1 13,71318a Activities of households as employers,
undifferentiated goods- and services-producing activities of households forown use 3,911 219,491 2,142 0 432 269 221,260
18b Activities of extraterritorial organizations andbodies 0 863 0 0 0 0 863
19 Total 11,843 916,023 4,816 0 968 301 923,0511 Credit risk adjustment charges of the period do not include recoveries.
Article 442 (h) CRR - Defaulted exposures by geographical area, past due, non-performing and forborne exposures
Table EU CR1-C provides asset quality information of the Group’s on- and off-balance sheet exposures subject to the creditrisk framework broken down by significant geographical regions as well as countries.
We consider a country as being significant, if it contributes to an aggregate of 90 % of our total exposure. An area is consideredsignificant if it contains at least one significant country. The geographical distribution is based on the legal domicile of thecounterparty or issuer.
The amounts shown below are based on IFRS accounting values according to the regulatory scope of consolidation. Anexposure is being classified as defaulted if the default criteria according to Article 178 CRR are met. As confirmed by EBA(EBA/OP/2017/02) specific credit risk adjustments consist of all types of allowance for credit losses held against financialinstruments subject to impairment according to IFRS 9 for the current fiscal year (IAS 39 for the prior fiscal year). The Groupdoes not record any credit risk adjustment which qualify as general credit risk adjustment. The credit risk adjustment chargesof the period are provided for a six month period in column “f”.

67
Deutsche Bank Credit risk and credit risk mitigationPillar 3 Report as of December 31, 2018 General quantitative information on credit risk
EU CR1-C – Credit quality of exposures by geographyDec 31, 2018
a b c d e f gGross carrying values of
in € m.Defaulted
exposures
Non-defaulted
exposures
Specificcredit risk
adjustment
Generalcredit risk
adjustmentAccumulated
write-offs
Credit riskadjustmentcharges ofthe period
six monthsended
Dec 31, 2018¹Net values
(a+b-c-d)1 Europe 8,661 578,036 3,972 0 1,222 199 582,725
Of which:2 Germany 3,578 391,557 1,906 0 376 97 393,2283 United Kingdom 393 23,033 46 0 18 4 23,3804 France 13 11,576 13 0 3 2 11,5765 Luxembourg 25 20,934 17 0 0 8 20,9426 Italy 1,612 30,155 1,126 0 291 23 30,6407 Netherlands 509 20,041 261 0 30 14 20,2898 Spain 1,146 23,120 397 0 351 41 23,8699 Ireland 552 6,063 28 0 1 13 6,58710 Switzerland 326 17,934 25 0 0 0 18,23511 Poland 64 6,188 41 0 31 (22) 6,21212 Belgium 7 5,014 3 0 2 (2) 5,01813 Other Europe 437 22,420 108 0 119 21 22,74814 North America 633 243,035 240 0 119 105 243,428
Of which:15 U.S. 251 227,332 199 0 95 93 227,38316 Cayman Islands 137 3,062 8 0 0 3 3,19117 Canada 27 3,677 7 0 0 5 3,69718 Other North America 218 8,964 25 0 24 4 9,15719 Asia/Pacific 604 74,191 266 0 22 36 74,529
Of which:20 Japan 100 7,225 (3) 0 (11) 1 7,32821 Australia 30 3,957 8 0 0 2 3,97922 India 319 14,107 135 0 9 8 14,29123 China 23 8,333 27 0 0 2 8,32924 Singapore 41 10,282 10 0 0 5 10,31225 Hong Kong 7 6,633 5 0 0 2 6,63526 Other Asia/Pacific 85 23,654 84 0 23 15 23,65527 Other geographical areas 241 15,042 86 0 54 28 15,19728 Total 10,139 910,304 4,564 0 1,416 368 915,8791 Credit risk adjustment charges of the period do not include recoveries.
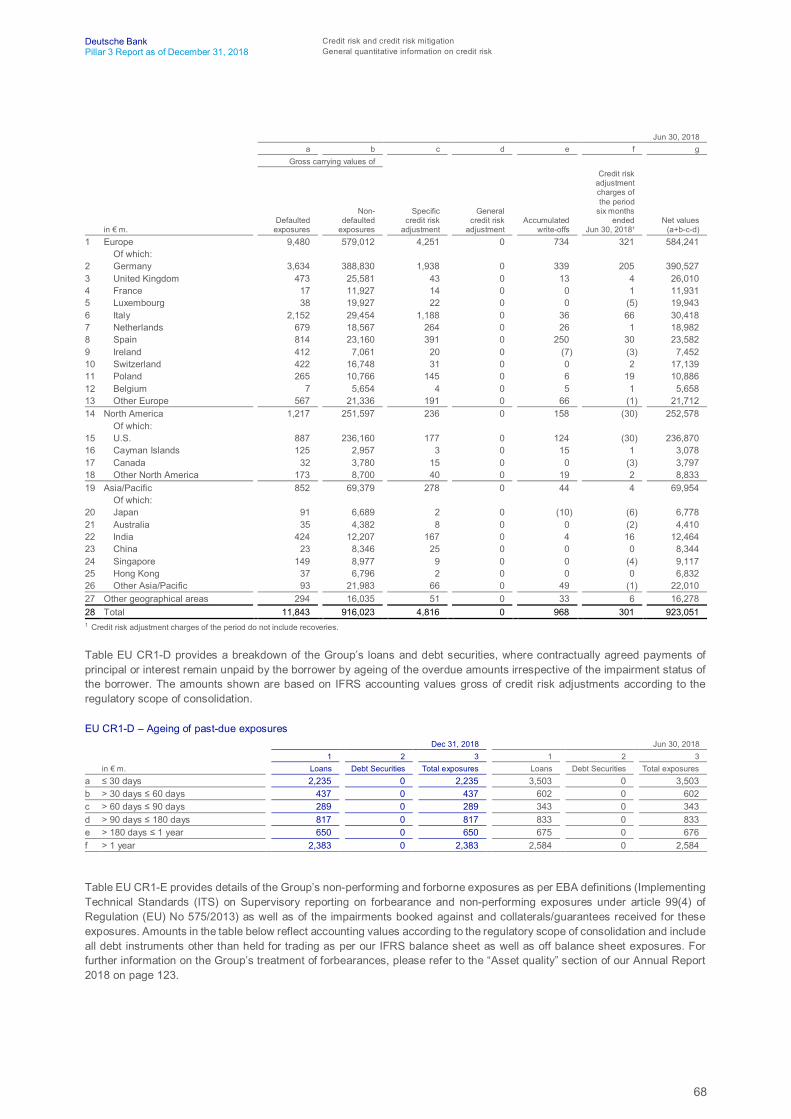
68
Deutsche Bank Credit risk and credit risk mitigationPillar 3 Report as of December 31, 2018 General quantitative information on credit risk
Jun 30, 2018a b c d e f g
Gross carrying values of
in € m.Defaulted
exposures
Non-defaulted
exposures
Specificcredit risk
adjustment
Generalcredit risk
adjustmentAccumulated
write-offs
Credit riskadjustmentcharges ofthe period
six monthsended
Jun 30, 2018¹Net values
(a+b-c-d)1 Europe 9,480 579,012 4,251 0 734 321 584,241
Of which:2 Germany 3,634 388,830 1,938 0 339 205 390,5273 United Kingdom 473 25,581 43 0 13 4 26,0104 France 17 11,927 14 0 0 1 11,9315 Luxembourg 38 19,927 22 0 0 (5) 19,9436 Italy 2,152 29,454 1,188 0 36 66 30,4187 Netherlands 679 18,567 264 0 26 1 18,9828 Spain 814 23,160 391 0 250 30 23,5829 Ireland 412 7,061 20 0 (7) (3) 7,45210 Switzerland 422 16,748 31 0 0 2 17,13911 Poland 265 10,766 145 0 6 19 10,88612 Belgium 7 5,654 4 0 5 1 5,65813 Other Europe 567 21,336 191 0 66 (1) 21,71214 North America 1,217 251,597 236 0 158 (30) 252,578
Of which:15 U.S. 887 236,160 177 0 124 (30) 236,87016 Cayman Islands 125 2,957 3 0 15 1 3,07817 Canada 32 3,780 15 0 0 (3) 3,79718 Other North America 173 8,700 40 0 19 2 8,83319 Asia/Pacific 852 69,379 278 0 44 4 69,954
Of which:20 Japan 91 6,689 2 0 (10) (6) 6,77821 Australia 35 4,382 8 0 0 (2) 4,41022 India 424 12,207 167 0 4 16 12,46423 China 23 8,346 25 0 0 0 8,34424 Singapore 149 8,977 9 0 0 (4) 9,11725 Hong Kong 37 6,796 2 0 0 0 6,83226 Other Asia/Pacific 93 21,983 66 0 49 (1) 22,01027 Other geographical areas 294 16,035 51 0 33 6 16,27828 Total 11,843 916,023 4,816 0 968 301 923,0511 Credit risk adjustment charges of the period do not include recoveries.
Table EU CR1-D provides a breakdown of the Group’s loans and debt securities, where contractually agreed payments ofprincipal or interest remain unpaid by the borrower by ageing of the overdue amounts irrespective of the impairment status ofthe borrower. The amounts shown are based on IFRS accounting values gross of credit risk adjustments according to theregulatory scope of consolidation.
EU CR1-D – Ageing of past-due exposuresDec 31, 2018 Jun 30, 2018
1 2 3 1 2 3in € m. Loans Debt Securities Total exposures Loans Debt Securities Total exposures
a ≤ 30 days 2,235 0 2,235 3,503 0 3,503b > 30 days ≤ 60 days 437 0 437 602 0 602c > 60 days ≤ 90 days 289 0 289 343 0 343d > 90 days ≤ 180 days 817 0 817 833 0 833e > 180 days ≤ 1 year 650 0 650 675 0 676f > 1 year 2,383 0 2,383 2,584 0 2,584
Table EU CR1-E provides details of the Group’s non-performing and forborne exposures as per EBA definitions (ImplementingTechnical Standards (ITS) on Supervisory reporting on forbearance and non-performing exposures under article 99(4) ofRegulation (EU) No 575/2013) as well as of the impairments booked against and collaterals/guarantees received for theseexposures. Amounts in the table below reflect accounting values according to the regulatory scope of consolidation and includeall debt instruments other than held for trading as per our IFRS balance sheet as well as off balance sheet exposures. Forfurther information on the Group’s treatment of forbearances, please refer to the “Asset quality” section of our Annual Report2018 on page 123.
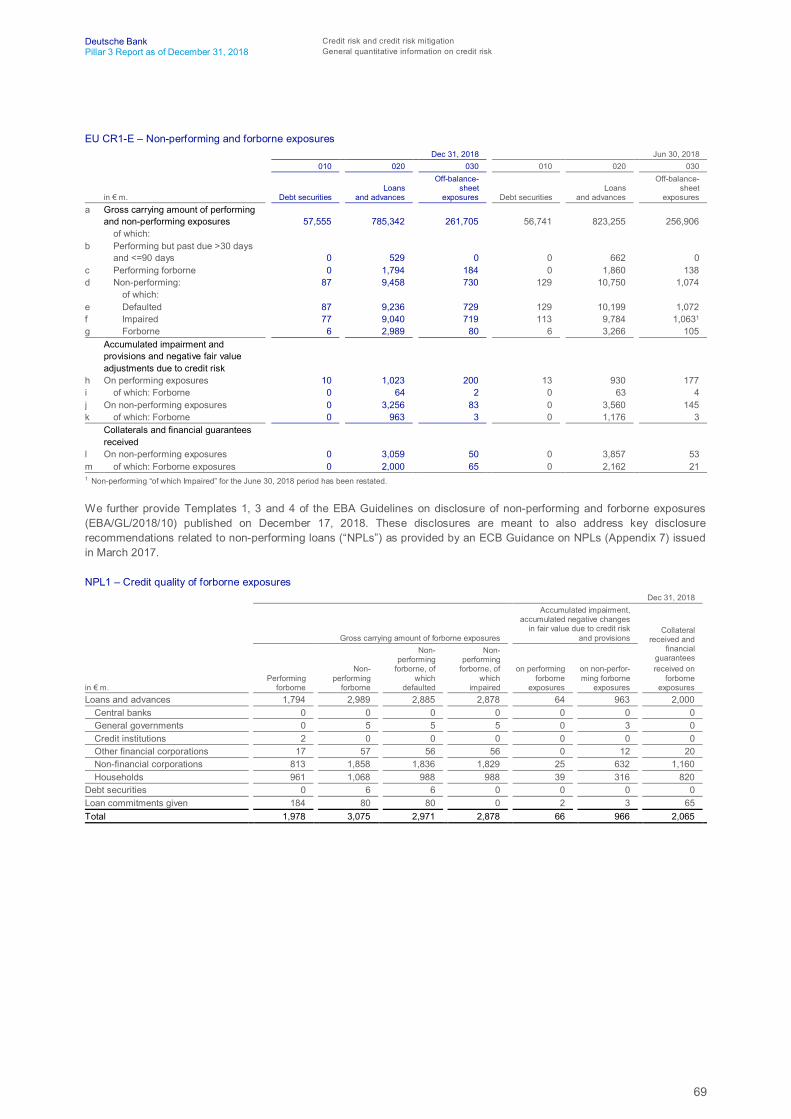
69
Deutsche Bank Credit risk and credit risk mitigationPillar 3 Report as of December 31, 2018 General quantitative information on credit risk
EU CR1-E – Non-performing and forborne exposuresDec 31, 2018 Jun 30, 2018
010 020 030 010 020 030
in € m. Debt securitiesLoans
and advances
Off-balance-sheet
exposures Debt securitiesLoans
and advances
Off-balance-sheet
exposuresa Gross carrying amount of performing
and non-performing exposures 57,555 785,342 261,705 56,741 823,255 256,906of which:
b Performing but past due >30 daysand <=90 days 0 529 0 0 662 0
c Performing forborne 0 1,794 184 0 1,860 138d Non-performing: 87 9,458 730 129 10,750 1,074
of which:e Defaulted 87 9,236 729 129 10,199 1,072f Impaired 77 9,040 719 113 9,784 1,0631
g Forborne 6 2,989 80 6 3,266 105Accumulated impairment andprovisions and negative fair valueadjustments due to credit risk
h On performing exposures 10 1,023 200 13 930 177i of which: Forborne 0 64 2 0 63 4j On non-performing exposures 0 3,256 83 0 3,560 145k of which: Forborne 0 963 3 0 1,176 3
Collaterals and financial guaranteesreceived
l On non-performing exposures 0 3,059 50 0 3,857 53m of which: Forborne exposures 0 2,000 65 0 2,162 211 Non-performing “of which Impaired” for the June 30, 2018 period has been restated.
We further provide Templates 1, 3 and 4 of the EBA Guidelines on disclosure of non-performing and forborne exposures(EBA/GL/2018/10) published on December 17, 2018. These disclosures are meant to also address key disclosurerecommendations related to non-performing loans (“NPLs”) as provided by an ECB Guidance on NPLs (Appendix 7) issuedin March 2017.
NPL1 – Credit quality of forborne exposuresDec 31, 2018
Gross carrying amount of forborne exposures
Accumulated impairment,accumulated negative changes
in fair value due to credit riskand provisions
Collateralreceived and
financialguaranteesreceived on
forborneexposuresin € m.
Performingforborne
Non-performing
forborne
Non-performing
forborne, ofwhich
defaulted
Non-performing
forborne, ofwhich
impaired
on performingforborne
exposures
on non-perfor-ming forborne
exposuresLoans and advances 1,794 2,989 2,885 2,878 64 963 2,000
Central banks 0 0 0 0 0 0 0General governments 0 5 5 5 0 3 0Credit institutions 2 0 0 0 0 0 0Other financial corporations 17 57 56 56 0 12 20Non-financial corporations 813 1,858 1,836 1,829 25 632 1,160Households 961 1,068 988 988 39 316 820
Debt securities 0 6 6 0 0 0 0Loan commitments given 184 80 80 0 2 3 65Total 1,978 3,075 2,971 2,878 66 966 2,065
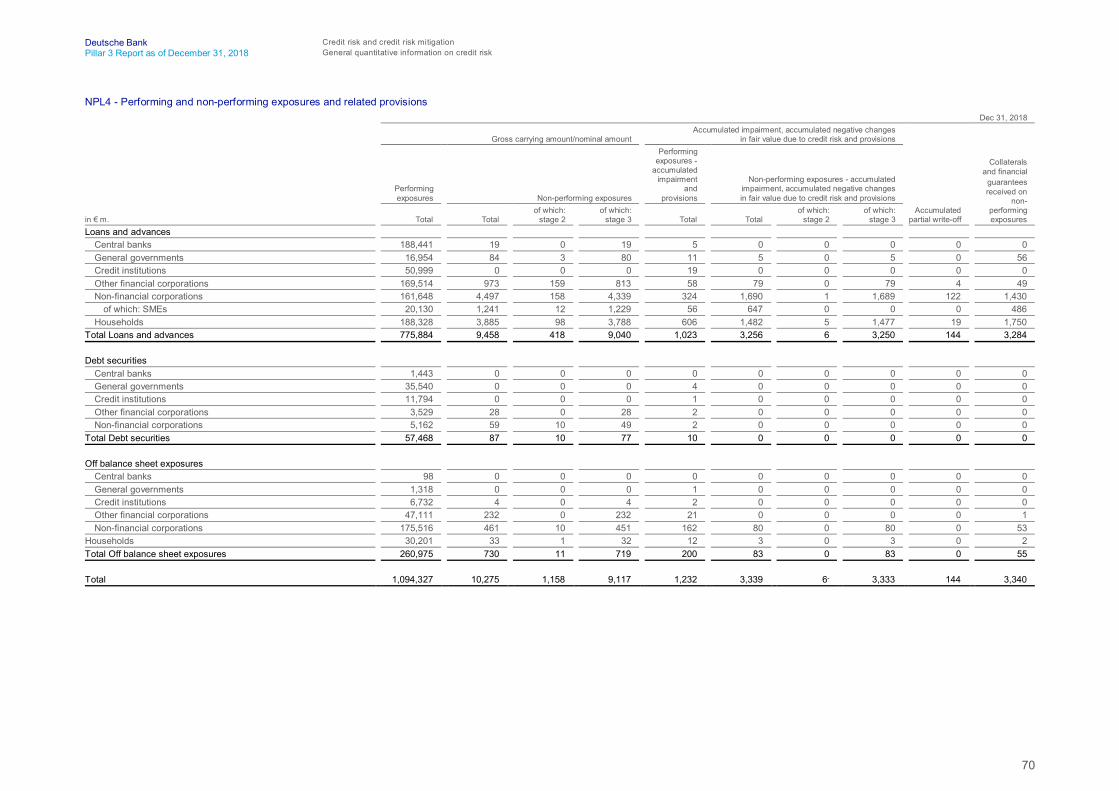
70
Deutsche Bank Credit risk and credit risk mitigationPillar 3 Report as of December 31, 2018 General quantitative information on credit risk
NPL4 - Performing and non-performing exposures and related provisionsDec 31, 2018
Gross carrying amount/nominal amountAccumulated impairment, accumulated negative changes
in fair value due to credit risk and provisions
Accumulatedpartial write-off
Collateralsand financial
guaranteesreceived on
non-performingexposures
Performingexposures Non-performing exposures
Performingexposures -
accumulatedimpairment
andprovisions
Non-performing exposures - accumulatedimpairment, accumulated negative changesin fair value due to credit risk and provisions
in € m. Total Totalof which:
stage 2of which:
stage 3 Total Totalof which:
stage 2of which:
stage 3Loans and advances
Central banks 188,441 19 0 19 5 0 0 0 0 0General governments 16,954 84 3 80 11 5 0 5 0 56Credit institutions 50,999 0 0 0 19 0 0 0 0 0Other financial corporations 169,514 973 159 813 58 79 0 79 4 49Non-financial corporations 161,648 4,497 158 4,339 324 1,690 1 1,689 122 1,430
of which: SMEs 20,130 1,241 12 1,229 56 647 0 0 0 486Households 188,328 3,885 98 3,788 606 1,482 5 1,477 19 1,750
Total Loans and advances 775,884 9,458 418 9,040 1,023 3,256 6 3,250 144 3,284
Debt securitiesCentral banks 1,443 0 0 0 0 0 0 0 0 0General governments 35,540 0 0 0 4 0 0 0 0 0Credit institutions 11,794 0 0 0 1 0 0 0 0 0Other financial corporations 3,529 28 0 28 2 0 0 0 0 0Non-financial corporations 5,162 59 10 49 2 0 0 0 0 0
Total Debt securities 57,468 87 10 77 10 0 0 0 0 0
Off balance sheet exposuresCentral banks 98 0 0 0 0 0 0 0 0 0General governments 1,318 0 0 0 1 0 0 0 0 0Credit institutions 6,732 4 0 4 2 0 0 0 0 0Other financial corporations 47,111 232 0 232 21 0 0 0 0 1Non-financial corporations 175,516 461 10 451 162 80 0 80 0 53
Households 30,201 33 1 32 12 3 0 3 0 2Total Off balance sheet exposures 260,975 730 11 719 200 83 0 83 0 55
Total 1,094,327 10,275 1,158 9,117 1,232 3,339 6- 3,333 144 3,340
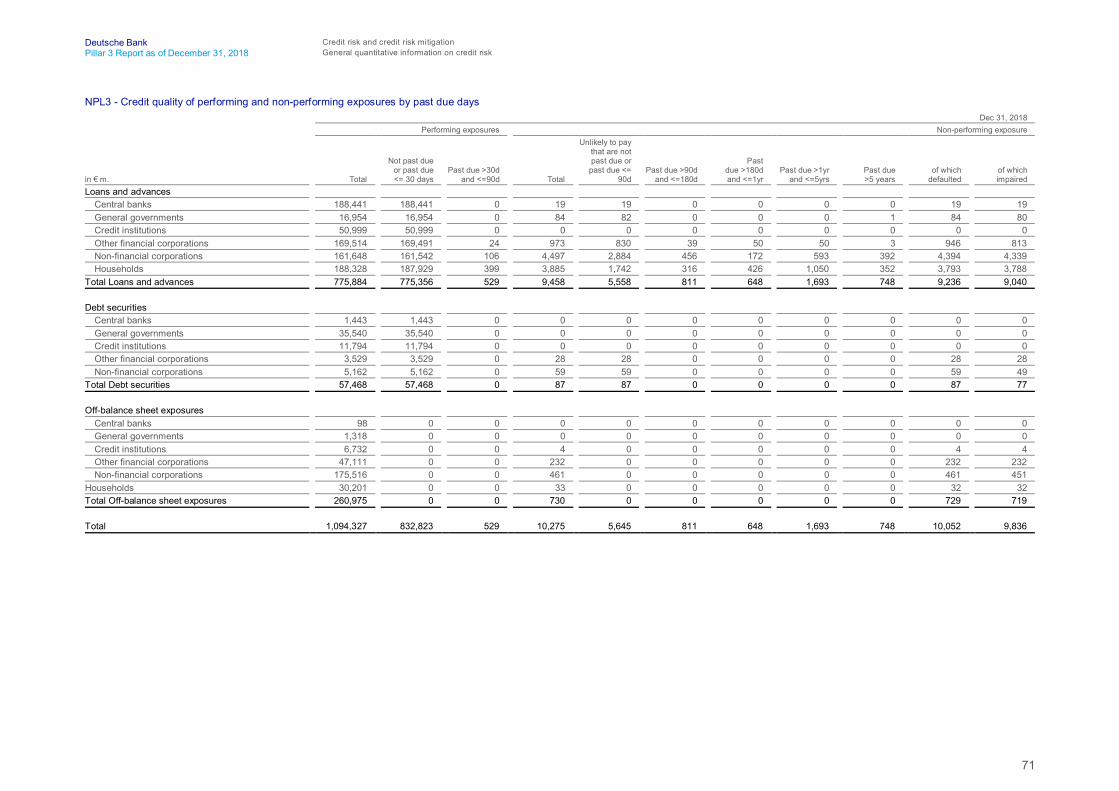
71
Deutsche Bank Credit risk and credit risk mitigationPillar 3 Report as of December 31, 2018 General quantitative information on credit risk
NPL3 - Credit quality of performing and non-performing exposures by past due daysDec 31, 2018
Performing exposures Non-performing exposure
in € m. Total
Not past dueor past due<= 30 days
Past due >30dand <=90d Total
Unlikely to paythat are notpast due or
past due <=90d
Past due >90dand <=180d
Pastdue >180dand <=1yr
Past due >1yrand <=5yrs
Past due>5 years
of whichdefaulted
of whichimpaired
Loans and advancesCentral banks 188,441 188,441 0 19 19 0 0 0 0 19 19General governments 16,954 16,954 0 84 82 0 0 0 1 84 80Credit institutions 50,999 50,999 0 0 0 0 0 0 0 0 0Other financial corporations 169,514 169,491 24 973 830 39 50 50 3 946 813Non-financial corporations 161,648 161,542 106 4,497 2,884 456 172 593 392 4,394 4,339Households 188,328 187,929 399 3,885 1,742 316 426 1,050 352 3,793 3,788
Total Loans and advances 775,884 775,356 529 9,458 5,558 811 648 1,693 748 9,236 9,040
Debt securitiesCentral banks 1,443 1,443 0 0 0 0 0 0 0 0 0General governments 35,540 35,540 0 0 0 0 0 0 0 0 0Credit institutions 11,794 11,794 0 0 0 0 0 0 0 0 0Other financial corporations 3,529 3,529 0 28 28 0 0 0 0 28 28Non-financial corporations 5,162 5,162 0 59 59 0 0 0 0 59 49
Total Debt securities 57,468 57,468 0 87 87 0 0 0 0 87 77
Off-balance sheet exposuresCentral banks 98 0 0 0 0 0 0 0 0 0 0General governments 1,318 0 0 0 0 0 0 0 0 0 0Credit institutions 6,732 0 0 4 0 0 0 0 0 4 4Other financial corporations 47,111 0 0 232 0 0 0 0 0 232 232Non-financial corporations 175,516 0 0 461 0 0 0 0 0 461 451
Households 30,201 0 0 33 0 0 0 0 0 32 32Total Off-balance sheet exposures 260,975 0 0 730 0 0 0 0 0 729 719
Total 1,094,327 832,823 529 10,275 5,645 811 648 1,693 748 10,052 9,836
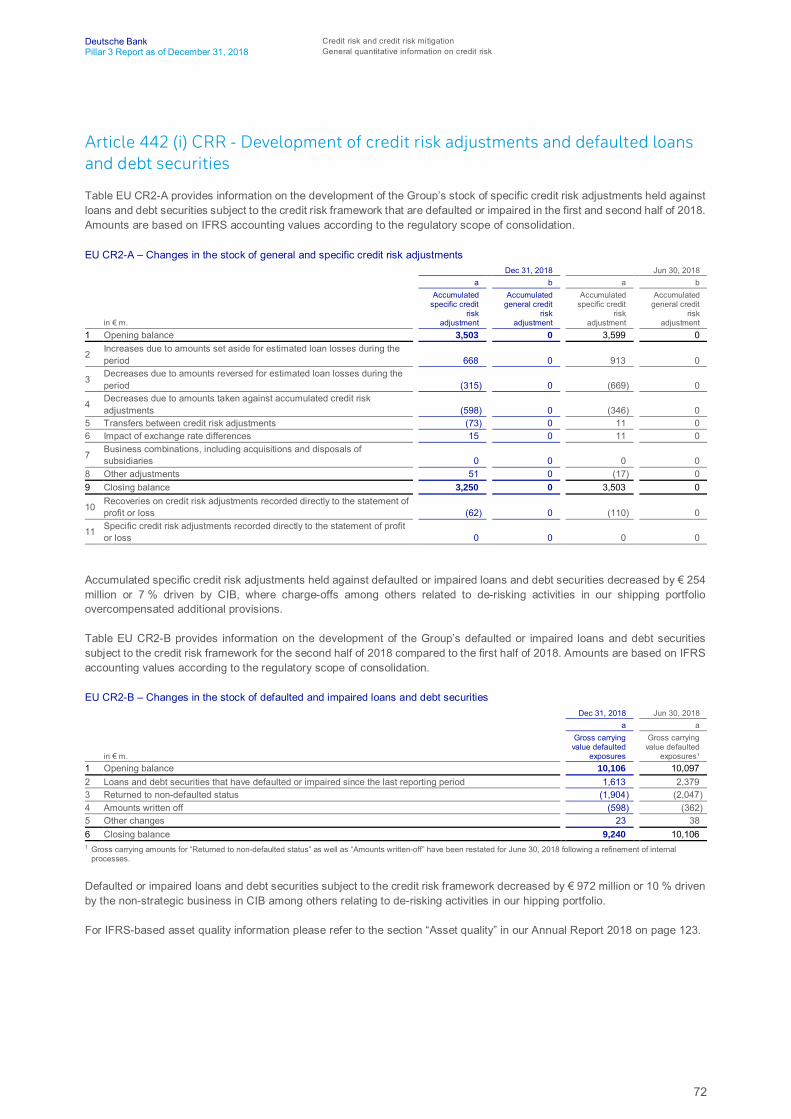
72
Deutsche Bank Credit risk and credit risk mitigationPillar 3 Report as of December 31, 2018 General quantitative information on credit risk
Article 442 (i) CRR - Development of credit risk adjustments and defaulted loansand debt securities
Table EU CR2-A provides information on the development of the Group’s stock of specific credit risk adjustments held againstloans and debt securities subject to the credit risk framework that are defaulted or impaired in the first and second half of 2018.Amounts are based on IFRS accounting values according to the regulatory scope of consolidation.
EU CR2-A – Changes in the stock of general and specific credit risk adjustmentsDec 31, 2018 Jun 30, 2018
a b a b
in € m.
Accumulatedspecific credit
riskadjustment
Accumulatedgeneral credit
riskadjustment
Accumulatedspecific credit
riskadjustment
Accumulatedgeneral credit
riskadjustment
1 Opening balance 3,503 0 3,599 0
2 Increases due to amounts set aside for estimated loan losses during theperiod 668 0 913 0
3 Decreases due to amounts reversed for estimated loan losses during theperiod (315) 0 (669) 0
4 Decreases due to amounts taken against accumulated credit riskadjustments (598) 0 (346) 0
5 Transfers between credit risk adjustments (73) 0 11 06 Impact of exchange rate differences 15 0 11 0
7 Business combinations, including acquisitions and disposals ofsubsidiaries 0 0 0 0
8 Other adjustments 51 0 (17) 09 Closing balance 3,250 0 3,503 0
10 Recoveries on credit risk adjustments recorded directly to the statement ofprofit or loss (62) 0 (110) 0
11 Specific credit risk adjustments recorded directly to the statement of profitor loss 0 0 0 0
Accumulated specific credit risk adjustments held against defaulted or impaired loans and debt securities decreased by € 254million or 7 % driven by CIB, where charge-offs among others related to de-risking activities in our shipping portfolioovercompensated additional provisions.
Table EU CR2-B provides information on the development of the Group’s defaulted or impaired loans and debt securitiessubject to the credit risk framework for the second half of 2018 compared to the first half of 2018. Amounts are based on IFRSaccounting values according to the regulatory scope of consolidation.
EU CR2-B – Changes in the stock of defaulted and impaired loans and debt securitiesDec 31, 2018 Jun 30, 2018
a a
in € m.
Gross carryingvalue defaulted
exposures
Gross carryingvalue defaulted
exposures¹1 Opening balance 10,106 10,0972 Loans and debt securities that have defaulted or impaired since the last reporting period 1,613 2,3793 Returned to non-defaulted status (1,904) (2,047)4 Amounts written off (598) (362)5 Other changes 23 386 Closing balance 9,240 10,1061 Gross carrying amounts for “Returned to non-defaulted status” as well as “Amounts written-off” have been restated for June 30, 2018 following a refinement of internal
processes.
Defaulted or impaired loans and debt securities subject to the credit risk framework decreased by € 972 million or 10 % drivenby the non-strategic business in CIB among others relating to de-risking activities in our hipping portfolio.
For IFRS-based asset quality information please refer to the section “Asset quality” in our Annual Report 2018 on page 123.
73
Deutsche Bank Credit risk and credit risk mitigationPillar 3 Report as of December 31, 2018 General qualitative information on credit risk mitigation
General qualitative information on credit risk mitigation
Introduction
Risk-weighted assets and regulatory capital requirements can be managed actively by credit risk mitigation techniques. As aprerequisite for recognition in regulatory calculations, we must adhere to certain minimum requirements as stipulated in theCRR regarding collateral management, monitoring processes and legal enforceability.
The range of collateral being eligible for regulatory recognition is dependent predominantly on the regulatory capital calculationmethod used for a specific risk position. The principle is that a higher degree of sophistication with regard to the underlyingmethodology generally leads to a wider range of admissible collateral and options to recognize protection via guarantees andcredit derivatives. However, also the minimum requirements to be adhered to and the mechanism available to reflect the riskmitigation benefits are predominantly a function of the regulatory calculation method applied.
The advanced IRBA generally accepts all types of financial collateral, as well as real estate, collateral assignments and otherphysical collateral. In our application of the advanced IRBA, there is basically no limitation to the range of accepted collateralas long as we can demonstrate to the competent authorities that reliable estimates of the collateral values can be generatedand that basic requirements are fulfilled.
The same principle holds true for taking benefits from guarantee and credit derivative arrangements. Within the advancedIRBA, again there are generally no limitations with regard to the range of eligible collateral providers as long as some basicminimum requirements are met. However, collateral providers’ credit quality and other relevant factors are incorporatedthrough our internal models.
In our advanced IRBA calculations financial and other collateral is generally considered through an adjustment to theapplicable LGD as the input parameter for determining the risk weight. For recognizing protection from guarantees and creditderivatives, generally a PD substitution approach is applied, i.e., within the advanced IRBA risk-weight calculation the PD ofthe borrower is replaced by the protection seller’s or guarantor’s PD. However, for certain guaranteed exposures and certainprotection providers the so-called double default treatment is applicable. The double default effect implies that for a guaranteedexposure a loss only occurs if the originator and the guarantor fail to meet their obligations at the same time.
The foundation IRBA sets stricter limitations with regard to the eligibility of credit risk mitigation compared to the advancedIRBA but allows for consideration of financial collateral, guarantees and credit derivatives as well as other foundation IRBA-eligible collateral like mortgages and security assignments.
The financial collateral recognized in the foundation IRBA essentially comprises cash, bonds and other securities related torepo lending.
In the standardized approach, collateral recognition is limited to eligible financial collateral, such as cash, gold bullion, certaindebt securities, equities and CIUs, in many cases only with their volatility-adjusted collateral value. In its general structure, thestandardized approach provides a preferred (lower) risk-weight for “claims secured by real estate property” while real estateasset is not considered as an explicit collateral item under the standardized approach. Further limitations must be consideredwith regard to eligible guarantee and credit derivative providers.
In order to reflect risk mitigation techniques in the calculation of capital requirements we apply the financial collateralcomprehensive method since the higher sophistication of that method allows a broader range of eligible collateral. Within thisapproach, financial collateral is reflected through a reduction in the exposure value of the respective risk position, whileprotection taken in the form of guarantees and credit derivatives is considered by means of a substitution, i.e., the borrower’srisk weight is replaced by the risk weight of the protection provider.
Article 453 (a) CRR - Use of on- and off-balance sheet netting
Please refer to the Annual Report 2018 section “Managing and mitigation of credit risk” on page 66.
Article 453 (b) CRR - Collateral valuation and management
Please refer to the Annual Report 2018 section “Managing and mitigation of credit risk” on page 66.
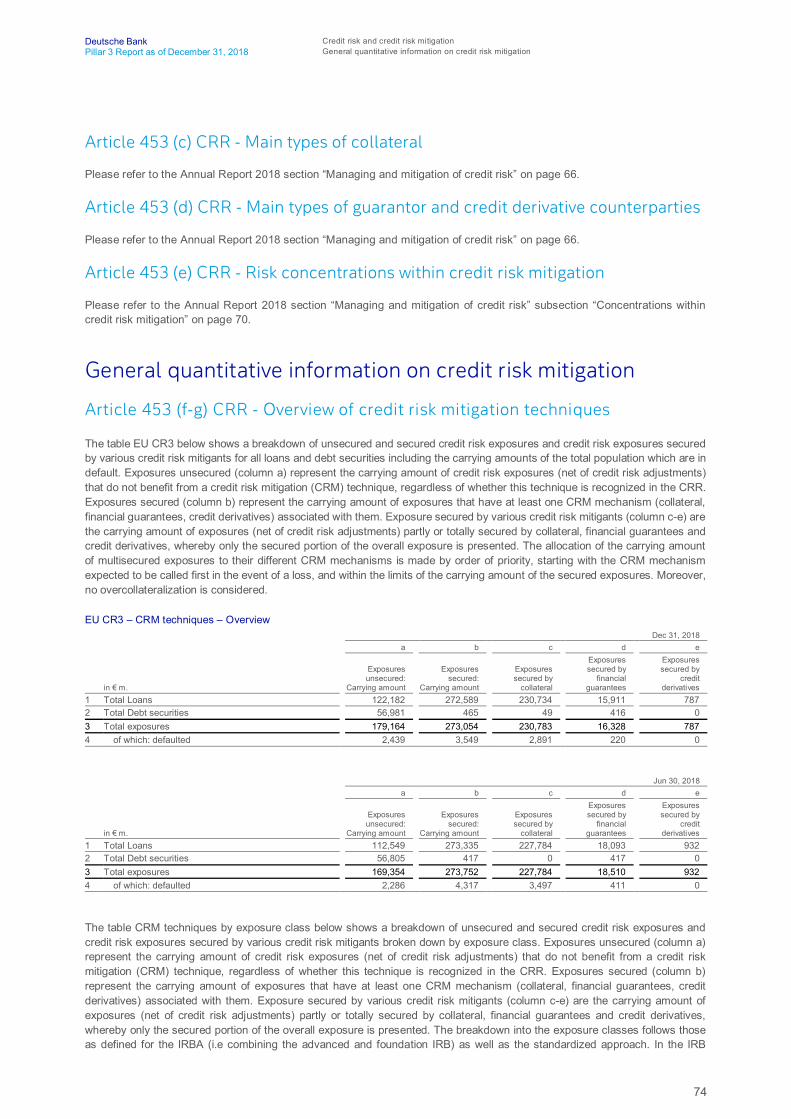
74
Deutsche Bank Credit risk and credit risk mitigationPillar 3 Report as of December 31, 2018 General quantitative information on credit risk mitigation
Article 453 (c) CRR - Main types of collateral
Please refer to the Annual Report 2018 section “Managing and mitigation of credit risk” on page 66.
Article 453 (d) CRR - Main types of guarantor and credit derivative counterparties
Please refer to the Annual Report 2018 section “Managing and mitigation of credit risk” on page 66.
Article 453 (e) CRR - Risk concentrations within credit risk mitigation
Please refer to the Annual Report 2018 section “Managing and mitigation of credit risk” subsection “Concentrations withincredit risk mitigation” on page 70.
General quantitative information on credit risk mitigation
Article 453 (f-g) CRR - Overview of credit risk mitigation techniques
The table EU CR3 below shows a breakdown of unsecured and secured credit risk exposures and credit risk exposures securedby various credit risk mitigants for all loans and debt securities including the carrying amounts of the total population which are indefault. Exposures unsecured (column a) represent the carrying amount of credit risk exposures (net of credit risk adjustments)that do not benefit from a credit risk mitigation (CRM) technique, regardless of whether this technique is recognized in the CRR.Exposures secured (column b) represent the carrying amount of exposures that have at least one CRM mechanism (collateral,financial guarantees, credit derivatives) associated with them. Exposure secured by various credit risk mitigants (column c-e) arethe carrying amount of exposures (net of credit risk adjustments) partly or totally secured by collateral, financial guarantees andcredit derivatives, whereby only the secured portion of the overall exposure is presented. The allocation of the carrying amountof multisecured exposures to their different CRM mechanisms is made by order of priority, starting with the CRM mechanismexpected to be called first in the event of a loss, and within the limits of the carrying amount of the secured exposures. Moreover,no overcollateralization is considered.
EU CR3 – CRM techniques – OverviewDec 31, 2018
a b c d e
in € m.
Exposuresunsecured:
Carrying amount
Exposuressecured:
Carrying amount
Exposuressecured by
collateral
Exposuressecured by
financialguarantees
Exposuressecured by
creditderivatives
1 Total Loans 122,182 272,589 230,734 15,911 7872 Total Debt securities 56,981 465 49 416 03 Total exposures 179,164 273,054 230,783 16,328 7874 of which: defaulted 2,439 3,549 2,891 220 0
Jun 30, 2018a b c d e
in € m.
Exposuresunsecured:
Carrying amount
Exposuressecured:
Carrying amount
Exposuressecured by
collateral
Exposuressecured by
financialguarantees
Exposuressecured by
creditderivatives
1 Total Loans 112,549 273,335 227,784 18,093 9322 Total Debt securities 56,805 417 0 417 03 Total exposures 169,354 273,752 227,784 18,510 9324 of which: defaulted 2,286 4,317 3,497 411 0
The table CRM techniques by exposure class below shows a breakdown of unsecured and secured credit risk exposures andcredit risk exposures secured by various credit risk mitigants broken down by exposure class. Exposures unsecured (column a)represent the carrying amount of credit risk exposures (net of credit risk adjustments) that do not benefit from a credit riskmitigation (CRM) technique, regardless of whether this technique is recognized in the CRR. Exposures secured (column b)represent the carrying amount of exposures that have at least one CRM mechanism (collateral, financial guarantees, creditderivatives) associated with them. Exposure secured by various credit risk mitigants (column c-e) are the carrying amount ofexposures (net of credit risk adjustments) partly or totally secured by collateral, financial guarantees and credit derivatives,whereby only the secured portion of the overall exposure is presented. The breakdown into the exposure classes follows thoseas defined for the IRBA (i.e combining the advanced and foundation IRB) as well as the standardized approach. In the IRB

75
Deutsche Bank Credit risk and credit risk mitigationPillar 3 Report as of December 31, 2018 General quantitative information on credit risk mitigation
approach, the line item “Central governments and central banks” includes exposures to regional governments or local authorities,public sector entities, multilateral developments banks and international organizations. The exposure class “Other items” withinthe standardized approach includes all exposures not covered in the other categories.
The table CRM techniques by exposure class shows a breakdown of unsecured and secured credit risk exposures and credit riskexposures secured by various credit risk mitigants broken down by exposure class whereas table EU CR3 shows a breakdownof unsecured and secured credit risk exposures and credit risk exposures secured by various credit risk mitigants for all loansand debt securities including the carrying amounts of the total population which are in default.
CRM techniques by exposure classDec 31, 2018
a b c d e
in € m.
Exposuresunsecured:
Carrying amount
Exposuressecured:
Carrying amount
Exposuressecured
by collateral
Exposuressecured by
financialguarantees
Exposuressecured by
creditderivatives
Advanced IRBACentral governments and central banks 115,921 2,506 37 2,124 0Institutions 21,347 4,220 3,363 346 47Corporates 240,552 133,644 82,853 18,154 5,120
of which:SMEs 8,481 8,157 4,420 1,695 0Specialized lending 6,044 27,262 23,171 761 0Other 226,027 98,225 55,261 15,698 5,120
Retail 52,817 165,246 140,560 1,929 0of which:Secured by real estate property SMEs 987 8,446 6,866 184 0Secured by real estate property non-SMEs 7,194 149,103 128,959 320 0Qualifying revolving 16,414 52 26 1 0Other retail SMEs 3,550 2,148 483 1,165 0Other retail non-SMEs 24,673 5,496 4,225 260 0
Equity 2,137 0 0 0 0Other non-credit obligation asset 6,893 0 0 0 0Total advanced IRBA 439,668 305,617 226,813 22,553 5,167
Foundation IRBACentral governments and central banks 17 0 0 0 0Institutions 639 0 0 0 0Corporates 4,867 2,314 1,212 665 0
of which:SMEs 23 0 0 0 0Specialized lending 22 1,470 1,189 0 0Other 4,822 844 23 665 0
Total foundation IRBA 5,523 2,314 1,212 665 0
Standardized ApproachCentral governments or central banks 112,422 2 1 1 0Regional governments or local authorities 10,050 35 13 15 0Public sector entities 5,336 0 0 0 0Multilateral development banks 3,344 0 0 0 0International organizations 1,496 0 0 0 0Institutions 1,394 18 11 7 0Corporates 14,552 4,947 4,288 156 0Retail 3,126 1,155 963 82 0Secured by mortgages on immovable property 160 4,321 3,959 55 0Exposures in default1 542 396 356 10 0Items associated with particularly high risk 33 306 289 4 0Covered bonds 0 0 0 0 0Claims on institutions and corporates with a short-termcredit assessment 0 0 0 0 0Collective investments undertakings (CIU) 0 0 0 0 0Equity exposures 50 0 0 0 0Other items 12 0 0 0 0Total standardized approach 151,973 10,784 9,524 321 0
Total 597,164 318,714 237,549 23,538 5,1671 In light of recent EBA guidance (Q&A 2017_3481) we have revised our approach to present the defaulted exposure within the standardized approach: We present the total of
defaulted exposure but also show a breakdown of defaulted exposure and assign it to their respective exposure classes. In order to avoid double counting of exposures, thetotal exposure of the standardized approach as presented does not take into account figures disclosed. This new approach is applied for December 31, 2018, but not for thecomparative numbers as of June 30, 2018.

76
Deutsche Bank Credit risk and credit risk mitigationPillar 3 Report as of December 31, 2018 General quantitative information on credit risk mitigation
Jun 30, 2018a b c d e
in € m.
Exposuresunsecured:
Carrying amount
Exposuressecured:
Carrying amount
Exposuressecured
by collateral
Exposuressecured by
financialguarantees
Exposuressecured by
creditderivatives
Advanced IRBACentral governments and central banks 115,649 3,079 75 2,488 0Institutions 22,390 4,345 3,353 522 47Corporates 237,080 128,863 80,184 19,627 5,446
of which:SMEs 8,806 9,318 5,138 1,667 0Specialized lending 6,287 26,662 22,759 746 0Other 221,987 92,883 52,287 17,215 5,446
Retail 57,900 161,745 142,130 1,814 0of which:Secured by real estate property SMEs 907 8,964 7,303 186 0Secured by real estate property non-SMEs 12,380 145,277 130,229 298 0Qualifying revolving 16,624 56 29 1 0Other retail SMEs 3,865 2,124 582 1,036 0Other retail non-SMEs 24,124 5,324 3,987 294 0
Equity 1,666 0 0 0 0Other non-credit obligation asset 6,468 0 0 0 0Total advanced IRBA 441,154 298,031 225,742 24,451 5,494
Foundation IRBACentral governments and central banks 12 0 0 0 0Institutions 1 0 0 0 0Corporates 4,441 2,052 1,150 677 0
of which:SMEs 55 4 0 3 0Specialized lending 263 1,133 1,089 0 0Other 4,124 915 60 673 0
Total foundation IRBA 4,454 2,052 1,150 676 0
Standardized ApproachCentral governments or central banks 124,372 3 2 0 0Regional governments or local authorities 10,464 31 10 0 0Public sector entities 6,195 0 0 0 0Multilateral development banks 3,931 0 0 0 0International organizations 1,672 0 0 0 0Institutions 1,490 179 170 7 0Corporates 14,130 4,947 4,330 226 0Retail 3,714 812 627 97 0Secured by mortgages on immovable property 59 4,024 3,719 66 0Exposures in default 627 310 279 11 0Items associated with particularly high risk 49 152 133 4 0Covered bonds 0 0 0 0 0Claims on institutions and corporates with a short-termcredit assessment 0 0 0 0 0Collective investments undertakings (CIU) 0 0 0 0 0Equity exposures 195 0 0 0 0Other items 2 0 0 0 0Total standardized approach 166,900 10,459 9,270 412 0
Total 612,509 310,542 236,161 25,539 5,494

77
Deutsche Bank Credit risk exposure in the standardized approachPillar 3 Report as of December 31, 2018 Article 444 (e) CRR - Credit risk exposure and credit risk mitigation in the standardized approach
Credit risk exposure in the standardized approach
Standardized approachWe treat a subset of our credit risk exposures within the standardized approach. The standardized approach measures creditrisk either pursuant to fixed risk weights, which are regulatorily predefined or determined through the application of externalratings.
We assign certain credit exposures permanently to the standardized approach in accordance with Article 150 CRR. Theseare predominantly exposures to the Federal Republic of Germany and other German public sector entities as well asexposures to central governments of other European Member States that meet the required conditions. These exposuresmake up the majority of the exposures carried in the standardized approach and receive predominantly a risk weight of zeropercent. For internal purposes, however, these exposures are subject to an internal credit assessment and fully integrated inthe risk management and economic capital processes.
In line with Article 150 CRR and Section 10 SolvV, we assign further – generally IRBA eligible – exposures permanently tothe standardized approach. This population comprises several small-sized portfolios, which are considered to be immaterialon a stand-alone basis for inclusion in the IRBA.
Other credit exposures which are small in size are temporarily assigned to the standardized approach and we plan to transferthem to the IRBA over time. The prioritization and the corresponding transition plan is discussed and agreed with thecompetent authorities, the Bundesbank, the BaFin and the ECB.
Article 444 (a-b) CRR - External ratings in the standardizedapproachIn order to calculate the regulatory capital requirements under the standardized approach, we use eligible external ratingsfrom Standard & Poor’s, Moody’s, Fitch Ratings and in some cases from DBRS. Ratings are applied to all relevant exposureclasses in the standardized approach. If more than one rating is available for a specific counterparty, the selection criteria asset out in Article 138 CRR are applied in order to determine the relevant risk weight for the capital calculation.
Article 444 (c) CRR - Usage of issue ratingsGiven the low volume of exposures covered under the standardized approach and the high percentage of (externally rated)central government exposures therein, we principally do not consider impacts from inferring issue ratings from issuer ratings.
Article 444 (d) CRR - Mapping of external rating to credit qualitystepsThis information does not need to be disclosed separately as Deutsche Bank Group complies with the standard associationpublished by EBA.
Please refer to section “Article 452 (b)(i) CRR – Mapping of internal rating scales to external ratings” in this Pillar 3 Report onpage 81 for a mapping of internal ratings and probability of defaults.
Article 444 (e) CRR - Credit risk exposure and credit riskmitigation in the standardized approachThe table below shows our credit risk exposure before credit conversion factors and credit risk mitigation obtained in the formof eligible financial collateral, guarantees and credit derivatives and the exposure at default values (EaD) in the standardized
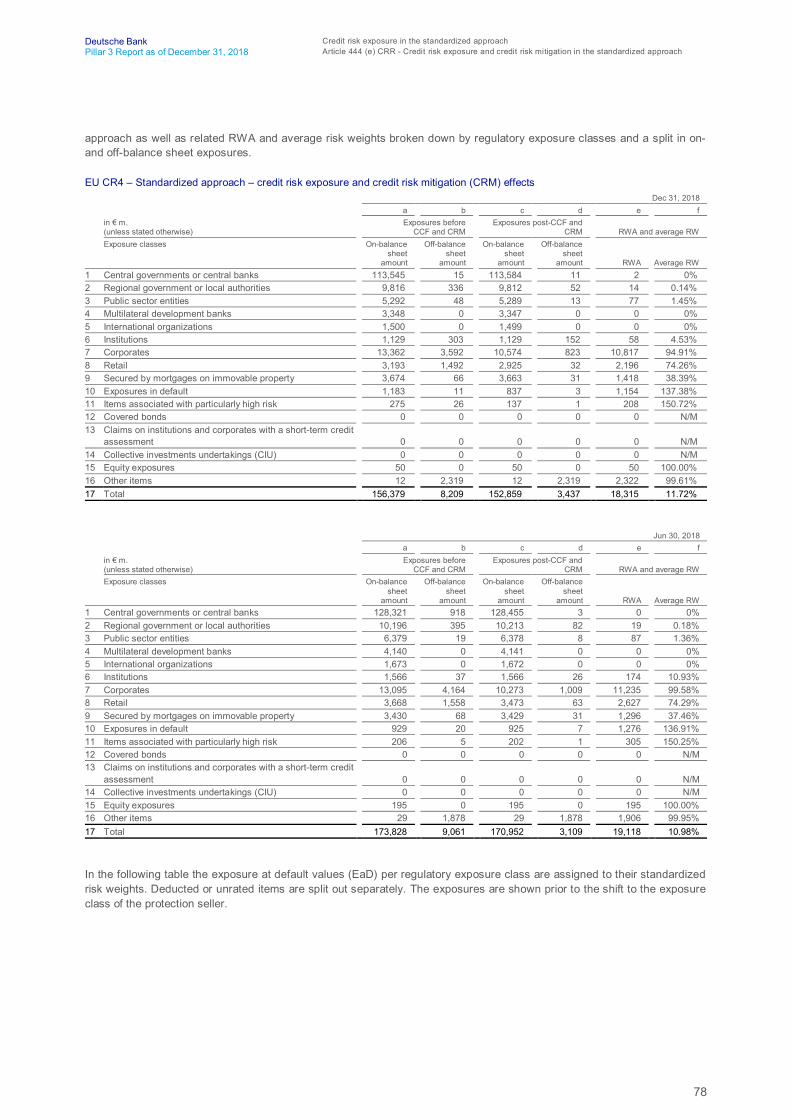
78
Deutsche Bank Credit risk exposure in the standardized approachPillar 3 Report as of December 31, 2018 Article 444 (e) CRR - Credit risk exposure and credit risk mitigation in the standardized approach
approach as well as related RWA and average risk weights broken down by regulatory exposure classes and a split in on-and off-balance sheet exposures.
EU CR4 – Standardized approach – credit risk exposure and credit risk mitigation (CRM) effectsDec 31, 2018
a b c d e fin € m.(unless stated otherwise)
Exposures beforeCCF and CRM
Exposures post-CCF andCRM RWA and average RW
Exposure classes On-balancesheet
amount
Off-balancesheet
amount
On-balancesheet
amount
Off-balancesheet
amount RWA Average RW1 Central governments or central banks 113,545 15 113,584 11 2 0%2 Regional government or local authorities 9,816 336 9,812 52 14 0.14%3 Public sector entities 5,292 48 5,289 13 77 1.45%4 Multilateral development banks 3,348 0 3,347 0 0 0%5 International organizations 1,500 0 1,499 0 0 0%6 Institutions 1,129 303 1,129 152 58 4.53%7 Corporates 13,362 3,592 10,574 823 10,817 94.91%8 Retail 3,193 1,492 2,925 32 2,196 74.26%9 Secured by mortgages on immovable property 3,674 66 3,663 31 1,418 38.39%10 Exposures in default 1,183 11 837 3 1,154 137.38%11 Items associated with particularly high risk 275 26 137 1 208 150.72%12 Covered bonds 0 0 0 0 0 N/M13 Claims on institutions and corporates with a short-term credit
assessment 0 0 0 0 0 N/M14 Collective investments undertakings (CIU) 0 0 0 0 0 N/M15 Equity exposures 50 0 50 0 50 100.00%16 Other items 12 2,319 12 2,319 2,322 99.61%17 Total 156,379 8,209 152,859 3,437 18,315 11.72%
Jun 30, 2018a b c d e f
in € m.(unless stated otherwise)
Exposures beforeCCF and CRM
Exposures post-CCF andCRM RWA and average RW
Exposure classes On-balancesheet
amount
Off-balancesheet
amount
On-balancesheet
amount
Off-balancesheet
amount RWA Average RW1 Central governments or central banks 128,321 918 128,455 3 0 0%2 Regional government or local authorities 10,196 395 10,213 82 19 0.18%3 Public sector entities 6,379 19 6,378 8 87 1.36%4 Multilateral development banks 4,140 0 4,141 0 0 0%5 International organizations 1,673 0 1,672 0 0 0%6 Institutions 1,566 37 1,566 26 174 10.93%7 Corporates 13,095 4,164 10,273 1,009 11,235 99.58%8 Retail 3,668 1,558 3,473 63 2,627 74.29%9 Secured by mortgages on immovable property 3,430 68 3,429 31 1,296 37.46%10 Exposures in default 929 20 925 7 1,276 136.91%11 Items associated with particularly high risk 206 5 202 1 305 150.25%12 Covered bonds 0 0 0 0 0 N/M13 Claims on institutions and corporates with a short-term credit
assessment 0 0 0 0 0 N/M14 Collective investments undertakings (CIU) 0 0 0 0 0 N/M15 Equity exposures 195 0 195 0 195 100.00%16 Other items 29 1,878 29 1,878 1,906 99.95%17 Total 173,828 9,061 170,952 3,109 19,118 10.98%
In the following table the exposure at default values (EaD) per regulatory exposure class are assigned to their standardizedrisk weights. Deducted or unrated items are split out separately. The exposures are shown prior to the shift to the exposureclass of the protection seller.
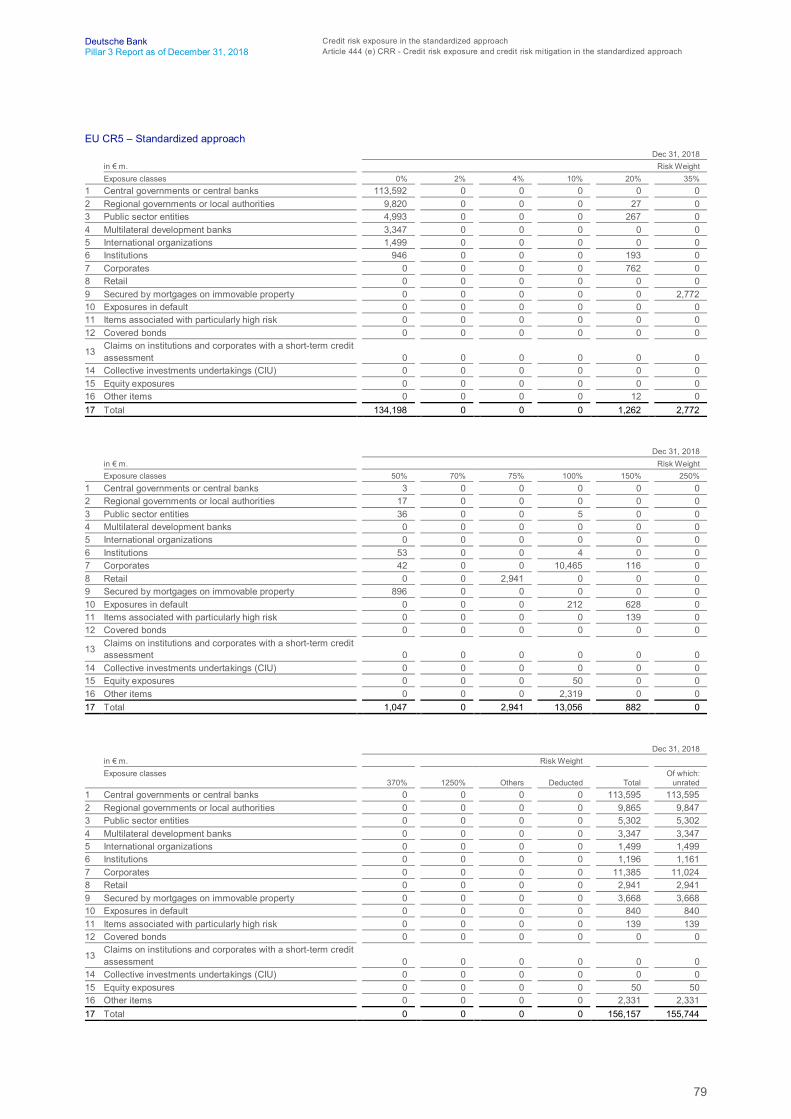
79
Deutsche Bank Credit risk exposure in the standardized approachPillar 3 Report as of December 31, 2018 Article 444 (e) CRR - Credit risk exposure and credit risk mitigation in the standardized approach
EU CR5 – Standardized approachDec 31, 2018
in € m. Risk WeightExposure classes 0% 2% 4% 10% 20% 35%
1 Central governments or central banks 113,592 0 0 0 0 02 Regional governments or local authorities 9,820 0 0 0 27 03 Public sector entities 4,993 0 0 0 267 04 Multilateral development banks 3,347 0 0 0 0 05 International organizations 1,499 0 0 0 0 06 Institutions 946 0 0 0 193 07 Corporates 0 0 0 0 762 08 Retail 0 0 0 0 0 09 Secured by mortgages on immovable property 0 0 0 0 0 2,77210 Exposures in default 0 0 0 0 0 011 Items associated with particularly high risk 0 0 0 0 0 012 Covered bonds 0 0 0 0 0 0
13 Claims on institutions and corporates with a short-term creditassessment 0 0 0 0 0 0
14 Collective investments undertakings (CIU) 0 0 0 0 0 015 Equity exposures 0 0 0 0 0 016 Other items 0 0 0 0 12 017 Total 134,198 0 0 0 1,262 2,772
Dec 31, 2018in € m. Risk WeightExposure classes 50% 70% 75% 100% 150% 250%
1 Central governments or central banks 3 0 0 0 0 02 Regional governments or local authorities 17 0 0 0 0 03 Public sector entities 36 0 0 5 0 04 Multilateral development banks 0 0 0 0 0 05 International organizations 0 0 0 0 0 06 Institutions 53 0 0 4 0 07 Corporates 42 0 0 10,465 116 08 Retail 0 0 2,941 0 0 09 Secured by mortgages on immovable property 896 0 0 0 0 010 Exposures in default 0 0 0 212 628 011 Items associated with particularly high risk 0 0 0 0 139 012 Covered bonds 0 0 0 0 0 0
13 Claims on institutions and corporates with a short-term creditassessment 0 0 0 0 0 0
14 Collective investments undertakings (CIU) 0 0 0 0 0 015 Equity exposures 0 0 0 50 0 016 Other items 0 0 0 2,319 0 017 Total 1,047 0 2,941 13,056 882 0
Dec 31, 2018in € m. Risk WeightExposure classes
370% 1250% Others Deducted TotalOf which:
unrated1 Central governments or central banks 0 0 0 0 113,595 113,5952 Regional governments or local authorities 0 0 0 0 9,865 9,8473 Public sector entities 0 0 0 0 5,302 5,3024 Multilateral development banks 0 0 0 0 3,347 3,3475 International organizations 0 0 0 0 1,499 1,4996 Institutions 0 0 0 0 1,196 1,1617 Corporates 0 0 0 0 11,385 11,0248 Retail 0 0 0 0 2,941 2,9419 Secured by mortgages on immovable property 0 0 0 0 3,668 3,66810 Exposures in default 0 0 0 0 840 84011 Items associated with particularly high risk 0 0 0 0 139 13912 Covered bonds 0 0 0 0 0 0
13 Claims on institutions and corporates with a short-term creditassessment 0 0 0 0 0 0
14 Collective investments undertakings (CIU) 0 0 0 0 0 015 Equity exposures 0 0 0 0 50 5016 Other items 0 0 0 0 2,331 2,33117 Total 0 0 0 0 156,157 155,744

80
Deutsche Bank Credit risk exposure in the standardized approachPillar 3 Report as of December 31, 2018 Article 444 (e) CRR - Credit risk exposure and credit risk mitigation in the standardized approach
Jun 30, 2018in € m. Risk WeightExposure classes 0% 2% 4% 10% 20% 35%
1 Central governments or central banks 128,458 0 0 0 0 02 Regional governments or local authorities 10,209 0 0 0 85 03 Public sector entities 6,010 0 0 0 338 04 Multilateral development banks 4,141 0 0 0 0 05 International organizations 1,672 0 0 0 0 06 Institutions 1,060 0 0 0 418 07 Corporates 0 0 0 0 30 08 Retail 0 0 0 0 0 09 Secured by mortgages on immovable property 0 0 0 0 0 2,78810 Exposures in default 0 0 0 0 0 011 Items associated with particularly high risk 0 0 0 0 0 012 Covered bonds 0 0 0 0 0 0
13 Claims on institutions and corporates with a short-term creditassessment 0 0 0 0 0 0
14 Collective investments undertakings (CIU) 0 0 0 0 0 015 Equity exposures 0 0 0 0 0 016 Other items 0 0 0 0 2 017 Total 151,549 0 0 0 872 2,788
Jun 30, 2018in € m. Risk WeightExposure classes 50% 70% 75% 100% 150% 250%
1 Central governments or central banks 0 0 0 0 0 02 Regional governments or local authorities 0 0 0 2 0 03 Public sector entities 39 0 0 0 0 04 Multilateral development banks 0 0 0 0 0 05 International organizations 0 0 0 0 0 06 Institutions 51 0 0 64 0 07 Corporates 46 0 0 11,048 98 08 Retail 0 0 3,536 0 0 09 Secured by mortgages on immovable property 673 0 0 0 0 010 Exposures in default 0 0 0 244 687 011 Items associated with particularly high risk 0 0 0 0 203 012 Covered bonds 0 0 0 0 0 0
13 Claims on institutions and corporates with a short-term creditassessment 0 0 0 0 0 0
14 Collective investments undertakings (CIU) 0 0 0 0 0 015 Equity exposures 0 0 0 195 0 016 Other items 0 0 0 1,905 0 017 Total 807 0 3,536 13,459 989 0
Jun 30, 2018in € m. Risk WeightExposure classes
370% 1250% Others Deducted TotalOf which:
unrated1 Central governments or central banks 0 0 0 0 128,458 121,5472 Regional governments or local authorities 0 0 0 0 10,295 3,5843 Public sector entities 0 0 0 0 6,386 5,5664 Multilateral development banks 0 0 0 0 4,141 3,5655 International organizations 0 0 0 0 1,672 1,1466 Institutions 0 0 0 0 1,593 1,5547 Corporates 0 0 0 0 11,223 11,1618 Retail 0 0 0 0 3,537 3,5379 Secured by mortgages on immovable property 0 0 0 0 3,460 3,46010 Exposures in default 0 0 0 0 932 93211 Items associated with particularly high risk 0 0 0 0 203 20312 Covered bonds 0 0 0 0 0 0
13 Claims on institutions and corporates with a short-term creditassessment 0 0 0 0 0 0
14 Collective investments undertakings (CIU) 0 0 0 0 0 015 Equity exposures 0 0 0 0 195 19516 Other items 0 0 0 0 1,907 1,88517 Total 0 0 0 0 174,002 158,335
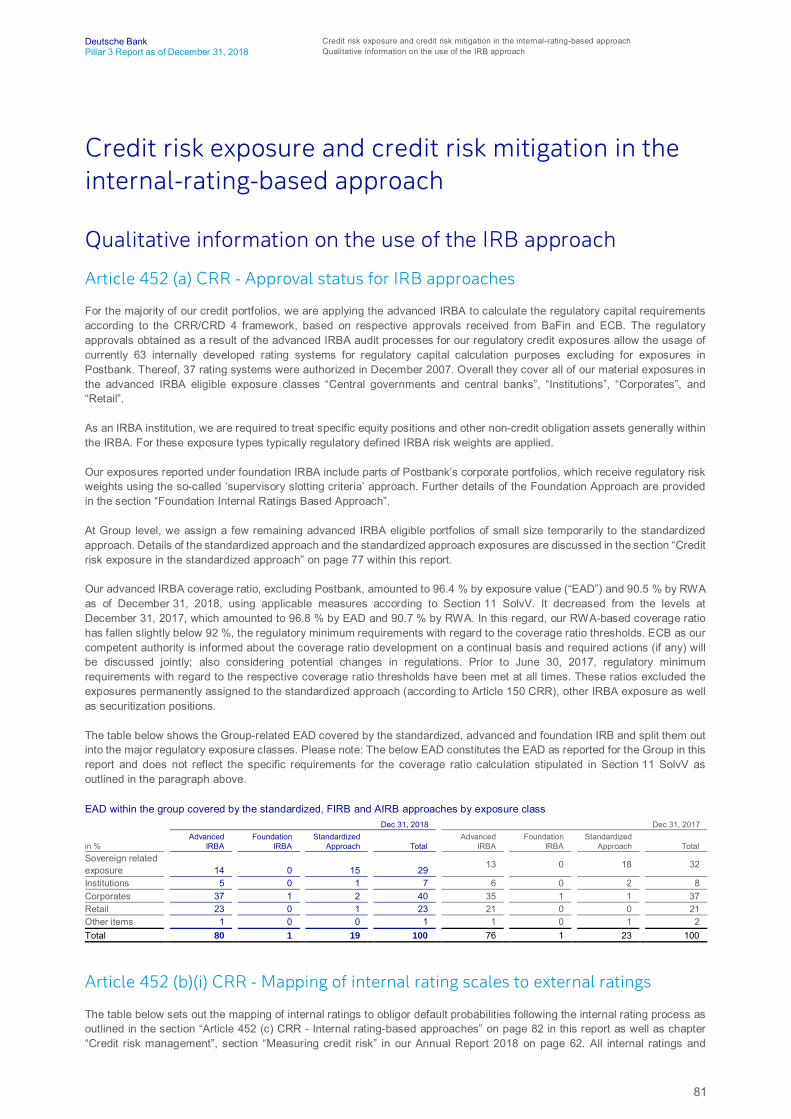
81
Deutsche Bank Credit risk exposure and credit risk mitigation in the internal-rating-based approachPillar 3 Report as of December 31, 2018 Qualitative information on the use of the IRB approach
Credit risk exposure and credit risk mitigation in theinternal-rating-based approach
Qualitative information on the use of the IRB approach
Article 452 (a) CRR - Approval status for IRB approaches
For the majority of our credit portfolios, we are applying the advanced IRBA to calculate the regulatory capital requirementsaccording to the CRR/CRD 4 framework, based on respective approvals received from BaFin and ECB. The regulatoryapprovals obtained as a result of the advanced IRBA audit processes for our regulatory credit exposures allow the usage ofcurrently 63 internally developed rating systems for regulatory capital calculation purposes excluding for exposures inPostbank. Thereof, 37 rating systems were authorized in December 2007. Overall they cover all of our material exposures inthe advanced IRBA eligible exposure classes “Central governments and central banks”, “Institutions”, “Corporates”, and“Retail”.
As an IRBA institution, we are required to treat specific equity positions and other non-credit obligation assets generally withinthe IRBA. For these exposure types typically regulatory defined IRBA risk weights are applied.
Our exposures reported under foundation IRBA include parts of Postbank’s corporate portfolios, which receive regulatory riskweights using the so-called ‘supervisory slotting criteria’ approach. Further details of the Foundation Approach are providedin the section “Foundation Internal Ratings Based Approach”.
At Group level, we assign a few remaining advanced IRBA eligible portfolios of small size temporarily to the standardizedapproach. Details of the standardized approach and the standardized approach exposures are discussed in the section “Creditrisk exposure in the standardized approach” on page 77 within this report.
Our advanced IRBA coverage ratio, excluding Postbank, amounted to 96.4 % by exposure value (“EAD”) and 90.5 % by RWAas of December 31, 2018, using applicable measures according to Section 11 SolvV. It decreased from the levels atDecember 31, 2017, which amounted to 96.8 % by EAD and 90.7 % by RWA. In this regard, our RWA-based coverage ratiohas fallen slightly below 92 %, the regulatory minimum requirements with regard to the coverage ratio thresholds. ECB as ourcompetent authority is informed about the coverage ratio development on a continual basis and required actions (if any) willbe discussed jointly; also considering potential changes in regulations. Prior to June 30, 2017, regulatory minimumrequirements with regard to the respective coverage ratio thresholds have been met at all times. These ratios excluded theexposures permanently assigned to the standardized approach (according to Article 150 CRR), other IRBA exposure as wellas securitization positions.
The table below shows the Group-related EAD covered by the standardized, advanced and foundation IRB and split them outinto the major regulatory exposure classes. Please note: The below EAD constitutes the EAD as reported for the Group in thisreport and does not reflect the specific requirements for the coverage ratio calculation stipulated in Section 11 SolvV asoutlined in the paragraph above.
EAD within the group covered by the standardized, FIRB and AIRB approaches by exposure classDec 31, 2018 Dec 31, 2017
in %Advanced
IRBAFoundation
IRBAStandardized
Approach TotalAdvanced
IRBAFoundation
IRBAStandardized
Approach TotalSovereign relatedexposure 14 0 15 29 13 0 18 32
Institutions 5 0 1 7 6 0 2 8Corporates 37 1 2 40 35 1 1 37Retail 23 0 1 23 21 0 0 21Other items 1 0 0 1 1 0 1 2Total 80 1 19 100 76 1 23 100
Article 452 (b)(i) CRR - Mapping of internal rating scales to external ratings
The table below sets out the mapping of internal ratings to obligor default probabilities following the internal rating process asoutlined in the section “Article 452 (c) CRR - Internal rating-based approaches” on page 82 in this report as well as chapter“Credit risk management”, section “Measuring credit risk” in our Annual Report 2018 on page 62. All internal ratings and
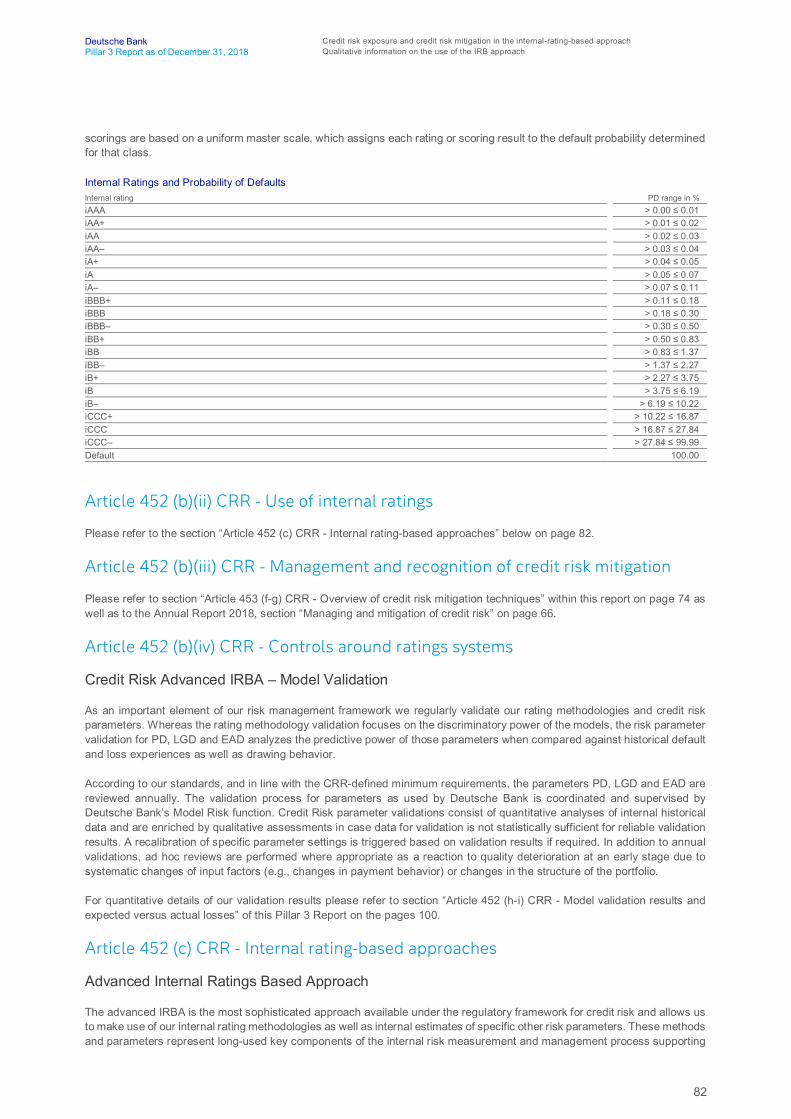
82
Deutsche Bank Credit risk exposure and credit risk mitigation in the internal-rating-based approachPillar 3 Report as of December 31, 2018 Qualitative information on the use of the IRB approach
scorings are based on a uniform master scale, which assigns each rating or scoring result to the default probability determinedfor that class.
Internal Ratings and Probability of DefaultsInternal rating PD range in %iAAA > 0.00 ≤ 0.01iAA+ > 0.01 ≤ 0.02iAA > 0.02 ≤ 0.03iAA– > 0.03 ≤ 0.04iA+ > 0.04 ≤ 0.05iA > 0.05 ≤ 0.07iA– > 0.07 ≤ 0.11iBBB+ > 0.11 ≤ 0.18iBBB > 0.18 ≤ 0.30iBBB– > 0.30 ≤ 0.50iBB+ > 0.50 ≤ 0.83iBB > 0.83 ≤ 1.37iBB– > 1.37 ≤ 2.27iB+ > 2.27 ≤ 3.75iB > 3.75 ≤ 6.19iB– > 6.19 ≤ 10.22iCCC+ > 10.22 ≤ 16.87iCCC > 16.87 ≤ 27.84iCCC– > 27.84 ≤ 99.99Default 100.00
Article 452 (b)(ii) CRR - Use of internal ratings
Please refer to the section “Article 452 (c) CRR - Internal rating-based approaches” below on page 82.
Article 452 (b)(iii) CRR - Management and recognition of credit risk mitigation
Please refer to section “Article 453 (f-g) CRR - Overview of credit risk mitigation techniques” within this report on page 74 aswell as to the Annual Report 2018, section “Managing and mitigation of credit risk” on page 66.
Article 452 (b)(iv) CRR - Controls around ratings systems
Credit Risk Advanced IRBA – Model Validation
As an important element of our risk management framework we regularly validate our rating methodologies and credit riskparameters. Whereas the rating methodology validation focuses on the discriminatory power of the models, the risk parametervalidation for PD, LGD and EAD analyzes the predictive power of those parameters when compared against historical defaultand loss experiences as well as drawing behavior.
According to our standards, and in line with the CRR-defined minimum requirements, the parameters PD, LGD and EAD arereviewed annually. The validation process for parameters as used by Deutsche Bank is coordinated and supervised byDeutsche Bank’s Model Risk function. Credit Risk parameter validations consist of quantitative analyses of internal historicaldata and are enriched by qualitative assessments in case data for validation is not statistically sufficient for reliable validationresults. A recalibration of specific parameter settings is triggered based on validation results if required. In addition to annualvalidations, ad hoc reviews are performed where appropriate as a reaction to quality deterioration at an early stage due tosystematic changes of input factors (e.g., changes in payment behavior) or changes in the structure of the portfolio.
For quantitative details of our validation results please refer to section “Article 452 (h-i) CRR - Model validation results andexpected versus actual losses” of this Pillar 3 Report on the pages 100.
Article 452 (c) CRR - Internal rating-based approaches
Advanced Internal Ratings Based Approach
The advanced IRBA is the most sophisticated approach available under the regulatory framework for credit risk and allows usto make use of our internal rating methodologies as well as internal estimates of specific other risk parameters. These methodsand parameters represent long-used key components of the internal risk measurement and management process supporting

83
Deutsche Bank Credit risk exposure and credit risk mitigation in the internal-rating-based approachPillar 3 Report as of December 31, 2018 Qualitative information on the use of the IRB approach
the credit approval process, the economic capital and expected loss calculation and the internal monitoring and reporting ofcredit risk. The relevant parameters include the probability of default (“PD”), the loss given default (“LGD”) and the maturity(“M”) driving the regulatory risk-weight and the credit conversion factor (“CCF”) as part of the regulatory exposure at default(“EAD”) estimation. For most of our internal rating systems more than seven years of historical information is available toassess these parameters. Our internal rating methodologies aim at point-in-time rather than a through-the-cycle rating.
The probability of default for customers is derived from our internal rating systems. We assign a probability of default to eachrelevant counterparty credit exposure as a function of a transparent and consistent 21-grade master rating scale for all of ourexposure (excluding parts of Postbank).
A prerequisite for the development of rating methodologies and the determination of risk parameters is a proper definition,identification and recording of the default event of a customer. We apply a default definition in accordance with therequirements of Article 178 CRR as confirmed by the BaFin and ECB as part of the IRBA approval process. With theintroduction of IFRS9, Deutsche Bank has aligned its definition of “credit impaired” under IFRS 9 to the default definition asper Art. 178 of the Capital Requirements Regulation (CRR) for regulatory purposes. As a consequence, Stage 3 FinancialAssets consist of two types of defaulted financial assets: firstly financial assets, where the Group expects an impairment lossreflected in an allowance for credit losses and secondly financial assets, where the group does not expect an impairment loss(e.g., due to high quality collateral or sufficient expected future cash flows following thorough due diligence). This is a majordifference to our impairment definition under IAS 39, where Financial Assets were only considered to be impaired if the Groupexpected to suffer an impairment loss.
The borrower ratings assigned are derived on the grounds of internally developed rating models which specify consistent anddistinct customer-relevant criteria and assign a rating grade based on a specific set of criteria as given for a certain customer.The set of criteria is generated from information sets relevant for the respective customer segments like general customerbehavior, financial and external data. The methods in use range from statistical scoring models to expert-based models takinginto account the relevant available quantitative and qualitative information. Expert-based models are usually applied forcounterparts in the exposure classes “Central governments and central banks”, “Institutions” and “Corporates” with theexception of “Corporates” segments for which sufficient data basis is available for statistical scoring models. For the latter aswell as for the retail segment statistical scoring or hybrid models combining both approaches are commonly used. Quantitativerating methodologies are developed based on applicable statistical modeling techniques, such as logistic regression. In linewith Article 174 CRR, these models are complemented by human judgment and oversight to review model-based assignmentsand are intended to ensure that the models are used appropriately. When we assign our internal risk ratings, it allows us tocompare them with external risk ratings assigned to our counterparties by the major international rating agencies, wherepossible, as our internal rating scale has been designed to principally correspond to the external rating scales from ratingagencies.
Ratings for central governments and central banks take into account economic, political and sociodemographic indicators,e.g. the political dynamics in a country. The model incorporates relevant aspects covered in the fields of empirical country riskanalysis and early warning crisis models to arrive at an overall risk evaluation.
The majority of ratings for corporate and institutions combine quantitative analysis of financial information with qualitativeassessments of, inter alia, industry trends, market position and management experience. Financial analysis has a specificfocus on cash flow generation and the counterparty’s capability to service its debts, also in comparison to peers. Wesupplement the analysis of financials by an internal forecast of the counterparty’s financial profile where deemed to benecessary. For purchased corporate receivables the corporate rating approach is applied.
Ratings for SME clients are based on automated sub-ratings for e.g. financial aspects and conduct of bank account.Specialized lending is managed by specific credit risk management teams, e.g. for real estate, ship finance or leveragedtransactions. Following the individual characteristic of the underlying credit transactions we have developed bespokescorecards where appropriate to derive credit ratings.
In our retail business, creditworthiness checks and counterparty ratings are generally derived by utilizing an automateddecision engine. The decision engine incorporates quantitative aspects (i.e., financial figures), behavioral aspects, creditbureau information (such as SCHUFA in Germany) and general customer data. These input factors are used by the decisionengine to determine the creditworthiness of the borrower and, after consideration of collateral, the expected loss. Theestablished rating procedures we have implemented in our retail business are based on multivariate statistical methods. Forthe portfolios in the former Postbank, separate rating tools based on product specific scores are still applied. Alignment projectsare in place to harmonize these with group wide applied counterparty centric view.
They are used to support our individual credit decisions for the retail portfolio as well as to continuously monitor it in anautomated fashion. In case elevated risks are identified as part to this monitoring process or new regulatory requirementsapply, credit ratings are reviewed on an individual basis for these affected counterparties
84
Deutsche Bank Credit risk exposure and credit risk mitigation in the internal-rating-based approachPillar 3 Report as of December 31, 2018 Qualitative information on the use of the IRB approach
Although different rating methodologies are applied to the various customer segments in order to properly reflect customer-specific characteristics, they all adhere to the same risk management principles. Credit process policies provide guidance onthe classification of customers into the various rating systems.
We apply internally estimated LGD factors as part of the advanced IRBA capital requirement calculation as approved by theBaFin and ECB. LGD is defined as the likely loss intensity in case of a counterparty default. It provides an estimation of theexposure that cannot be recovered in a default event and therefore captures the severity of a loss. Conceptually, LGDestimates are independent of a customer’s probability of default. The LGD models ensure that the main drivers for losses (i.e.,different levels and quality of collateralization and customer or product types or seniority of facility) are reflected in specificLGD factors. In our LGD models, except for the former Postbank portfolios, we assign collateral type specific LGD parametersto the collateralized exposure (collateral value after application of haircuts). Moreover, the LGD for uncollateralized exposurecannot be below the LGD assigned to collateralized exposure and regulatory floors (e.g.10 % for residential mortgage loans)are applied. For the former Postbank portfolios, individually modeled LGD parameters are in use.
As part of the application of the advanced IRBA we apply specific CCFs in order to calculate an EAD value. Conceptually theEAD is defined as the expected amount of the credit exposure to a counterparty at the time of its default. For advanced IRBAcalculation purposes we apply the general principles as defined in Article 166 CRR to determine the EAD of a transaction. Ininstances, however, where a transaction involves an unused limit, a percentage share of this unused limit is added to theoutstanding amount in order to appropriately reflect the expected outstanding amount in case of a counterparty default. Thisreflects the assumption that for commitments the utilization at the time of default might be higher than the current utilization.When a transaction involves an additional contingent component (i.e., guarantees) a further percentage share (usage factor)is applied as part of the CCF model in order to estimate the amount of guarantees drawn in case of default. Where allowedunder the advanced IRBA, the CCFs are internally estimated. The calibrations of such parameters are based on statisticalexperience as well as internal historical data and consider customer and product type specifics. As part of the approvalprocess, the BaFin and ECB assessed our CCF models and stated their appropriateness for use in the process of regulatorycapital requirement calculations.
The EAD for our derivatives and securities financing transactions (“SFT”) portfolios are primarily calculated based on the IMMapproach as described in the section “Counterparty credit risk” of this report on the pages 122 to 137.
Foundation Internal Ratings Based Approach
The foundation IRBA is an approach available under the regulatory framework for credit risk allowing institutions to make useof their internal rating methodologies while using pre-defined regulatory values for all other risk parameters. Parameterssubject to internal estimates include the probability of default (“PD”) while the loss given default (“LGD”) and the creditconversion factor (“CCF”) are defined in the regulatory framework.
A probability of default is assigned to each relevant counterparty credit exposure as a function of a transparent and consistentrating master scale. The borrower ratings assigned are derived on the grounds of internally developed rating models whichspecify consistent and distinct customer-relevant criteria and assign a rating grade based on a specific set of criteria as givenfor a certain customer following the approaches as outlined for our Advanced IRBA rating systems. Our Project Financeexposure (Specialized Lending) is reported under the foundation IRBA, but regulatory risk weights are applied using the so-called ‘supervisory slotting criteria’ approach as defined by Article 153 CRR.
For the foundation IRBA we apply the same default definition as for Advanced IRBA in accordance with the requirements ofArticle 178 CRR as confirmed by the BaFin as part of its IRBA approval process.
Assignment to regulatory exposure classes
The advanced and foundation IRBA requires differentiating a bank’s credit portfolio into various regulatory defined expo-sureclasses. We identify the relevant regulatory exposure class for each exposure by taking into account factors like customer-specific characteristics, the rating system used as well as certain materiality thresholds which are regulatory defined.
As an IRBA institution, we are required to treat equity investments, collective investment undertakings (“CIU”) and other non-credit obligation assets generally within the IRBA. For these exposure types typically regulatory-defined IRBA risk weights areapplied. For certain CIUs, i.e. the CIUs in the former Postbank-portfolio within DB Privat- und Firmenkundenbank AG and asmaller CIU-portfolio at DWS, we apply a “look through”-approach and derive the risk weighs based on the underlyingpositions.
We use the simple risk-weight approach according to Article 155 (2) CRR for our investments in equity positions. Itdistinguishes between exposure in equities which are non-exchange traded but sufficiently diversified, exchange-traded andother non-exchange-traded and then uses the regulatory-defined risk weights of 190 %, 290 % or 370 %, respectively. We
85
Deutsche Bank Credit risk exposure and credit risk mitigation in the internal-rating-based approachPillar 3 Report as of December 31, 2018 Quantitative information on the use of the IRB approach
also include exposures attracting a risk weight of 250 % according to Article 48 (4) for significant investments in the CET 1instruments of financial sector entities which are subject to the threshold exemptions as outlined in Article 48 CRR.
Exposures which are assigned to the exposure class “other non-credit obligation assets” receive an IRBA risk weight of 0 %in case of cash positions, 250 % for deferred tax assets that rely on future profitability and arise from temporary differencessubject to the threshold exemptions as outlined in Article 48 CRR, or 100 %.
Quantitative information on the use of the IRB approach
Article 452 (d-g) CRR - Advanced IRB exposure
The following series of tables details the Group’s advanced IRB exposure distributed on our internal rating scale, separatelyfor all relevant regulatory exposure classes. They exclude the counterparty credit risk position from derivatives and securitiesfinancing transactions which are presented separately in the section “Counterparty credit risk” later in this report.
The tables show the EAD gross as well as the off-balance sheet exposure with their corresponding exposure-weighted creditconversion factors. All undrawn commitment exposure values shown below are assigned to the exposure class of their originalcounterparty and not to the exposure class of the protection seller.
In addition they provide the EAD net after CRM and CCF, where exposures covered by guarantees or credit derivatives isassigned to the protection seller. As a consequence the EAD net can be higher than the original balance sheet exposure.
The EAD net is presented in conjunction with exposures-weighted average PD, LGD, maturity as well as the RWA and theaverage risk weight (RW). The effect of double default, as far as applicable to exposures outside of former Postbank, isconsidered in the average RW. It implies that for a guaranteed exposure a loss only occurs if the primary obligor and theguarantor fail to meet their obligations at the same time. The tables provide the defaulted exposure separately, where weapply a LGD conception already incorporating potential unexpected losses in the loss rate estimate as required byArticle 181 (1) (h) CRR.
Further details in the tables are number of obligors, expected loss and provisions.

86
Deutsche Bank Credit risk exposure and credit risk mitigation in the internal-rating-based approachPillar 3 Report as of December 31, 2018 Quantitative information on the use of the IRB approach
EU CR6 – AIRB approach – Credit risk exposures by exposure class and PD rangeDec 31, 2018
in € m. a b c d e f g h i j k l(unless stated otherwise)
Exposure class/PD scale EAD gross
Undrawncommitments
WeightedCredit
ConversionFactor (CCF)
(in %)
EAD net,post CRM
and post-CCFAverage PD
(in %)
Number ofobligors
(in 1,000s)Average LGD
(in %)
Averagematurity
(in years) RWAAverage RW
(in %)Expected
Loss
Valueadjustments
andProvisions
Central governmentsand central banks0.00 to <0.15 107,189 250 41.68 115,108 0.01 0.1 49.97 3.4 1,598 1.39 3 –0.15 to <0.25 3,496 0 100.00 3,527 0.23 <0.1 50.00 1.5 1,547 43.86 4 –0.25 to <0.50 837 110 100.00 762 0.39 <0.1 50.00 1.4 450 59.04 1 –0.50 to <0.75 289 0 99.86 276 0.64 <0.1 49.58 1.1 199 71.83 1 –0.75 to <2.50 307 80 33.92 150 1.23 <0.1 43.68 2.4 148 98.62 1 –2.50 to <10.00 1,144 263 100.00 513 4.35 <0.1 48.41 2.7 438 85.27 5 –10.00 to <100.00 496 65 100.00 43 13.00 <0.1 19.96 1.5 40 92.83 2 –100.00 (Default) 88 0 0 32 100.00 <0.1 22.91 3.2 22 68.72 5 –Sub-total 113,845 769 44.74 120,412 0.07 0.2 49.94 3.3 4,441 3.69 21 21Dilution risk 44 4 100.00 48 10.45 0 2.42 1.0 5 10.18 0 0Sub-total incl. dilution risk 113,889 773 44.81 120,460 0.07 0.2 49.92 3.3 4,446 3.69 21 21
Institutions0.00 to <0.15 13,177 4,857 40.40 19,491 0.05 0.5 45.35 1.7 2,204 11.31 3 –0.15 to <0.25 618 485 38.67 785 0.23 0.1 27.10 1.6 213 27.09 1 –0.25 to <0.50 581 393 49.04 801 0.39 0.1 29.53 1.6 368 45.89 1 –0.50 to <0.75 879 209 61.27 1,167 0.64 <0.1 30.48 2.5 675 57.84 2 –0.75 to <2.50 1,512 292 40.96 1,562 1.57 0.1 21.22 1.2 620 39.73 4 –2.50 to <10.00 1,242 263 75.07 1,354 3.44 <0.1 10.83 2.6 413 30.49 5 –10.00 to <100.00 118 68 21.19 126 13.77 <0.1 4.48 1.1 28 22.30 1 –100.00 (Default) 263 4 28.87 264 100.00 <0.1 17.25 1.5 19 7.14 44 –Sub-total 18,390 6,572 41.27 25,551 1.47 0.8 39.82 1.7 4,540 17.77 61 55Dilution risk 104 0 0 104 10.45 0 2.41 1.0 11 10.16 0 0Sub-total incl. dilution risk 18,494 6,572 41.27 25,655 1.51 0.8 39.66 1.7 4,550 17.74 61 55
Corporates0.00 to <0.15 57,688 123,134 27.73 92,905 0.08 19.2 31.46 2.0 16,446 17.70 26 –0.15 to <0.25 19,136 24,353 30.08 26,753 0.23 6.2 33.77 2.2 9,031 33.76 20 –0.25 to <0.50 14,618 15,409 29.56 19,272 0.39 5.8 26.50 2.3 6,809 35.33 19 –0.50 to <0.75 14,042 11,422 31.71 17,022 0.65 4.7 24.63 2.5 7,189 42.23 31 –0.75 to <2.50 26,568 24,270 31.13 32,188 1.46 6.5 23.45 2.9 17,119 53.18 106 –2.50 to <10.00 22,381 27,022 32.21 27,750 4.84 3.6 19.12 2.7 17,590 63.39 230 –10.00 to <100.00 7,895 4,873 31.27 8,774 17.62 0.9 9.68 1.9 4,265 48.61 150 –100.00 (Default) 7,462 794 50.78 7,675 100.00 1.3 42.91 1.8 1,515 19.74 3,089 –Sub-total 169,789 231,278 29.26 232,339 4.89 48.1 27.79 2.3 79,965 34.42 3,671 3,087Dilution risk 4,214 605 33.64 4,578 10.45 0 2.47 1.0 476 10.41 12 0Sub-total incl. dilution risk 174,003 231,883 29.27 236,917 4.99 48.1 27.30 2.3 80,441 33.95 3,683 3,087
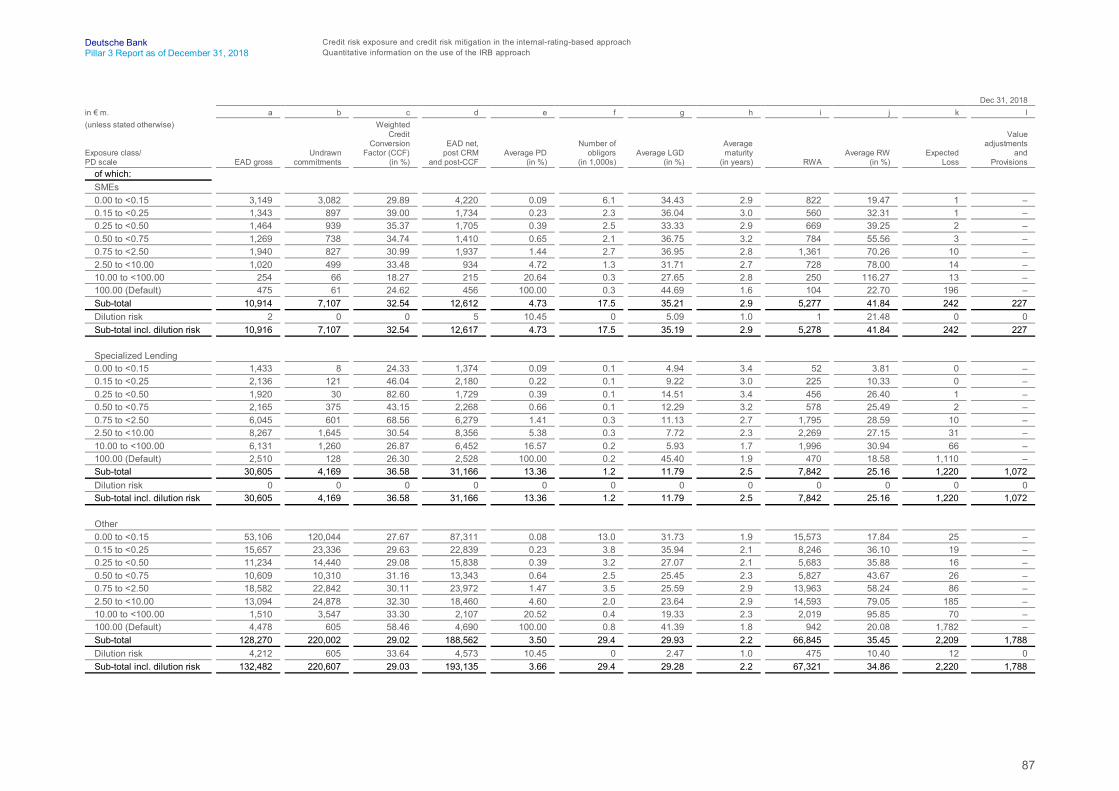
87
Deutsche Bank Credit risk exposure and credit risk mitigation in the internal-rating-based approachPillar 3 Report as of December 31, 2018 Quantitative information on the use of the IRB approach
Dec 31, 2018in € m. a b c d e f g h i j k l(unless stated otherwise)
Exposure class/PD scale EAD gross
Undrawncommitments
WeightedCredit
ConversionFactor (CCF)
(in %)
EAD net,post CRM
and post-CCFAverage PD
(in %)
Number ofobligors
(in 1,000s)Average LGD
(in %)
Averagematurity
(in years) RWAAverage RW
(in %)Expected
Loss
Valueadjustments
andProvisions
of which:SMEs0.00 to <0.15 3,149 3,082 29.89 4,220 0.09 6.1 34.43 2.9 822 19.47 1 –0.15 to <0.25 1,343 897 39.00 1,734 0.23 2.3 36.04 3.0 560 32.31 1 –0.25 to <0.50 1,464 939 35.37 1,705 0.39 2.5 33.33 2.9 669 39.25 2 –0.50 to <0.75 1,269 738 34.74 1,410 0.65 2.1 36.75 3.2 784 55.56 3 –0.75 to <2.50 1,940 827 30.99 1,937 1.44 2.7 36.95 2.8 1,361 70.26 10 –2.50 to <10.00 1,020 499 33.48 934 4.72 1.3 31.71 2.7 728 78.00 14 –10.00 to <100.00 254 66 18.27 215 20.64 0.3 27.65 2.8 250 116.27 13 –100.00 (Default) 475 61 24.62 456 100.00 0.3 44.69 1.6 104 22.70 196 –Sub-total 10,914 7,107 32.54 12,612 4.73 17.5 35.21 2.9 5,277 41.84 242 227Dilution risk 2 0 0 5 10.45 0 5.09 1.0 1 21.48 0 0Sub-total incl. dilution risk 10,916 7,107 32.54 12,617 4.73 17.5 35.19 2.9 5,278 41.84 242 227
Specialized Lending0.00 to <0.15 1,433 8 24.33 1,374 0.09 0.1 4.94 3.4 52 3.81 0 –0.15 to <0.25 2,136 121 46.04 2,180 0.22 0.1 9.22 3.0 225 10.33 0 –0.25 to <0.50 1,920 30 82.60 1,729 0.39 0.1 14.51 3.4 456 26.40 1 –0.50 to <0.75 2,165 375 43.15 2,268 0.66 0.1 12.29 3.2 578 25.49 2 –0.75 to <2.50 6,045 601 68.56 6,279 1.41 0.3 11.13 2.7 1,795 28.59 10 –2.50 to <10.00 8,267 1,645 30.54 8,356 5.38 0.3 7.72 2.3 2,269 27.15 31 –10.00 to <100.00 6,131 1,260 26.87 6,452 16.57 0.2 5.93 1.7 1,996 30.94 66 –100.00 (Default) 2,510 128 26.30 2,528 100.00 0.2 45.40 1.9 470 18.58 1,110 –Sub-total 30,605 4,169 36.58 31,166 13.36 1.2 11.79 2.5 7,842 25.16 1,220 1,072Dilution risk 0 0 0 0 0 0 0 0 0 0 0 0Sub-total incl. dilution risk 30,605 4,169 36.58 31,166 13.36 1.2 11.79 2.5 7,842 25.16 1,220 1,072
Other0.00 to <0.15 53,106 120,044 27.67 87,311 0.08 13.0 31.73 1.9 15,573 17.84 25 –0.15 to <0.25 15,657 23,336 29.63 22,839 0.23 3.8 35.94 2.1 8,246 36.10 19 –0.25 to <0.50 11,234 14,440 29.08 15,838 0.39 3.2 27.07 2.1 5,683 35.88 16 –0.50 to <0.75 10,609 10,310 31.16 13,343 0.64 2.5 25.45 2.3 5,827 43.67 26 –0.75 to <2.50 18,582 22,842 30.11 23,972 1.47 3.5 25.59 2.9 13,963 58.24 86 –2.50 to <10.00 13,094 24,878 32.30 18,460 4.60 2.0 23.64 2.9 14,593 79.05 185 –10.00 to <100.00 1,510 3,547 33.30 2,107 20.52 0.4 19.33 2.3 2,019 95.85 70 –100.00 (Default) 4,478 605 58.46 4,690 100.00 0.8 41.39 1.8 942 20.08 1,782 –Sub-total 128,270 220,002 29.02 188,562 3.50 29.4 29.93 2.2 66,845 35.45 2,209 1,788Dilution risk 4,212 605 33.64 4,573 10.45 0 2.47 1.0 475 10.40 12 0Sub-total incl. dilution risk 132,482 220,607 29.03 193,135 3.66 29.4 29.28 2.2 67,321 34.86 2,220 1,788
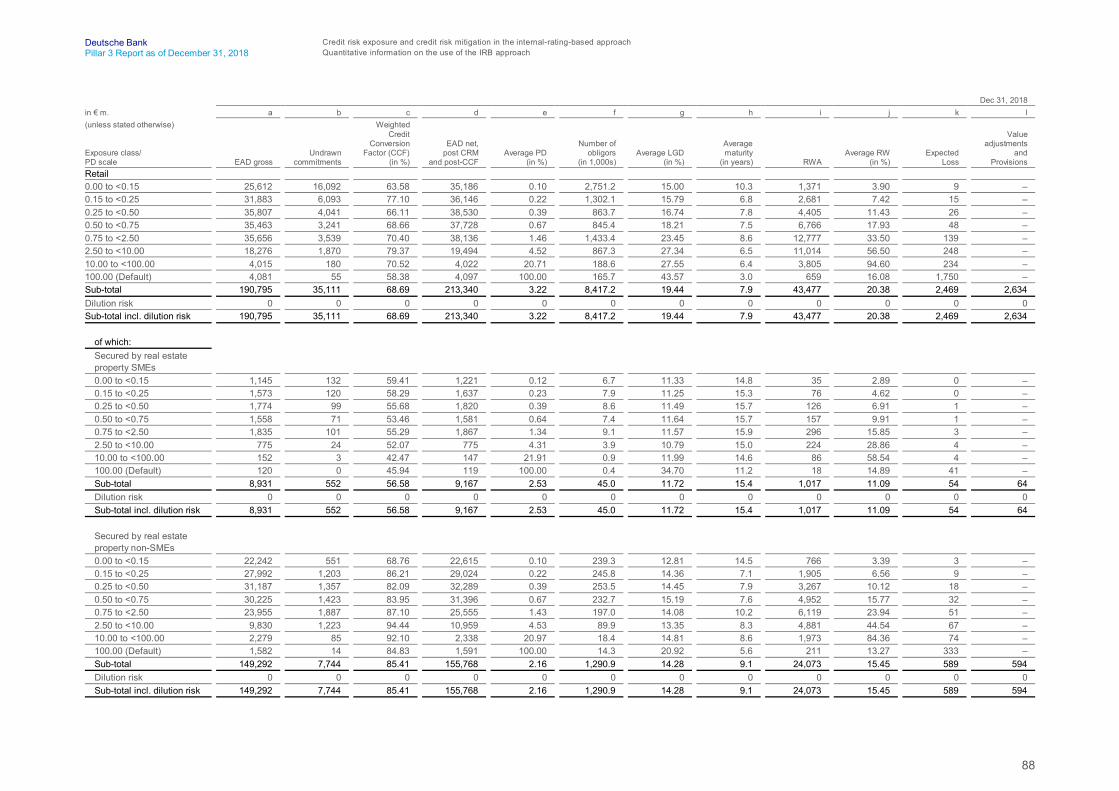
88
Deutsche Bank Credit risk exposure and credit risk mitigation in the internal-rating-based approachPillar 3 Report as of December 31, 2018 Quantitative information on the use of the IRB approach
Dec 31, 2018in € m. a b c d e f g h i j k l(unless stated otherwise)
Exposure class/PD scale EAD gross
Undrawncommitments
WeightedCredit
ConversionFactor (CCF)
(in %)
EAD net,post CRM
and post-CCFAverage PD
(in %)
Number ofobligors
(in 1,000s)Average LGD
(in %)
Averagematurity
(in years) RWAAverage RW
(in %)Expected
Loss
Valueadjustments
andProvisions
Retail0.00 to <0.15 25,612 16,092 63.58 35,186 0.10 2,751.2 15.00 10.3 1,371 3.90 9 –0.15 to <0.25 31,883 6,093 77.10 36,146 0.22 1,302.1 15.79 6.8 2,681 7.42 15 –0.25 to <0.50 35,807 4,041 66.11 38,530 0.39 863.7 16.74 7.8 4,405 11.43 26 –0.50 to <0.75 35,463 3,241 68.66 37,728 0.67 845.4 18.21 7.5 6,766 17.93 48 –0.75 to <2.50 35,656 3,539 70.40 38,136 1.46 1,433.4 23.45 8.6 12,777 33.50 139 –2.50 to <10.00 18,276 1,870 79.37 19,494 4.52 867.3 27.34 6.5 11,014 56.50 248 –10.00 to <100.00 4,015 180 70.52 4,022 20.71 188.6 27.55 6.4 3,805 94.60 234 –100.00 (Default) 4,081 55 58.38 4,097 100.00 165.7 43.57 3.0 659 16.08 1,750 –Sub-total 190,795 35,111 68.69 213,340 3.22 8,417.2 19.44 7.9 43,477 20.38 2,469 2,634Dilution risk 0 0 0 0 0 0 0 0 0 0 0 0Sub-total incl. dilution risk 190,795 35,111 68.69 213,340 3.22 8,417.2 19.44 7.9 43,477 20.38 2,469 2,634
of which:Secured by real estateproperty SMEs0.00 to <0.15 1,145 132 59.41 1,221 0.12 6.7 11.33 14.8 35 2.89 0 –0.15 to <0.25 1,573 120 58.29 1,637 0.23 7.9 11.25 15.3 76 4.62 0 –0.25 to <0.50 1,774 99 55.68 1,820 0.39 8.6 11.49 15.7 126 6.91 1 –0.50 to <0.75 1,558 71 53.46 1,581 0.64 7.4 11.64 15.7 157 9.91 1 –0.75 to <2.50 1,835 101 55.29 1,867 1.34 9.1 11.57 15.9 296 15.85 3 –2.50 to <10.00 775 24 52.07 775 4.31 3.9 10.79 15.0 224 28.86 4 –10.00 to <100.00 152 3 42.47 147 21.91 0.9 11.99 14.6 86 58.54 4 –100.00 (Default) 120 0 45.94 119 100.00 0.4 34.70 11.2 18 14.89 41 –Sub-total 8,931 552 56.58 9,167 2.53 45.0 11.72 15.4 1,017 11.09 54 64Dilution risk 0 0 0 0 0 0 0 0 0 0 0 0Sub-total incl. dilution risk 8,931 552 56.58 9,167 2.53 45.0 11.72 15.4 1,017 11.09 54 64
Secured by real estateproperty non-SMEs0.00 to <0.15 22,242 551 68.76 22,615 0.10 239.3 12.81 14.5 766 3.39 3 –0.15 to <0.25 27,992 1,203 86.21 29,024 0.22 245.8 14.36 7.1 1,905 6.56 9 –0.25 to <0.50 31,187 1,357 82.09 32,289 0.39 253.5 14.45 7.9 3,267 10.12 18 –0.50 to <0.75 30,225 1,423 83.95 31,396 0.67 232.7 15.19 7.6 4,952 15.77 32 –0.75 to <2.50 23,955 1,887 87.10 25,555 1.43 197.0 14.08 10.2 6,119 23.94 51 –2.50 to <10.00 9,830 1,223 94.44 10,959 4.53 89.9 13.35 8.3 4,881 44.54 67 –10.00 to <100.00 2,279 85 92.10 2,338 20.97 18.4 14.81 8.6 1,973 84.36 74 –100.00 (Default) 1,582 14 84.83 1,591 100.00 14.3 20.92 5.6 211 13.27 333 –Sub-total 149,292 7,744 85.41 155,768 2.16 1,290.9 14.28 9.1 24,073 15.45 589 594Dilution risk 0 0 0 0 0 0 0 0 0 0 0 0Sub-total incl. dilution risk 149,292 7,744 85.41 155,768 2.16 1,290.9 14.28 9.1 24,073 15.45 589 594

89
Deutsche Bank Credit risk exposure and credit risk mitigation in the internal-rating-based approachPillar 3 Report as of December 31, 2018 Quantitative information on the use of the IRB approach
Dec 31, 2018in € m. a b c d e f g h i j k l(unless stated otherwise)
Exposure class/PD scale EAD gross
Undrawncommitments
WeightedCredit
ConversionFactor (CCF)
(in %)
EAD net,post CRM
and post-CCFAverage PD
(in %)
Number ofobligors
(in 1,000s)Average LGD
(in %)
Averagematurity
(in years) RWAAverage RW
(in %)Expected
Loss
Valueadjustments
andProvisions
Qualifying Revolving0.00 to <0.15 51 10,272 88.55 7,277 0.07 2,250.9 11.19 0.0 214 2.94 4 –0.15 to <0.25 98 3,142 92.03 2,365 0.19 847.9 6.07 0.0 163 6.90 3 –0.25 to <0.50 142 1,005 79.21 819 0.38 396.5 14.99 0.0 90 11.00 2 –0.50 to <0.75 175 650 73.32 592 0.67 348.5 18.08 0.0 102 17.30 2 –0.75 to <2.50 290 531 71.01 626 1.49 422.9 21.66 0.0 194 31.07 5 –2.50 to <10.00 195 185 73.16 313 4.68 242.8 22.20 0.0 220 70.22 8 –10.00 to <100.00 53 18 75.42 64 20.11 50.3 24.26 0.0 95 147.95 7 –100.00 (Default) 70 2 61.51 71 100.00 34.4 60.96 0.0 48 67.56 43 –Sub-total 1,073 15,803 87.03 12,126 1.03 4,594.3 11.96 0.0 1,126 9.29 74 80Dilution risk 0 0 0 0 0 0 0 0 0 0 0 0Sub-total incl. dilution risk 1,073 15,803 87.03 12,126 1.03 4,594.3 11.96 0.0 1,126 9.29 74 80
Other retail SMEs0.00 to <0.15 362 2,314 18.90 1,019 0.11 31.7 42.19 3.9 95 9.28 0 –0.15 to <0.25 409 904 31.02 779 0.23 36.1 42.06 3.9 122 15.69 1 –0.25 to <0.50 535 871 28.64 910 0.39 34.7 46.26 3.7 221 24.32 2 –0.50 to <0.75 581 568 29.39 857 0.65 25.5 51.89 3.0 307 35.83 3 –0.75 to <2.50 979 555 33.42 1,230 1.36 25.0 54.91 2.8 636 51.75 9 –2.50 to <10.00 674 252 35.05 562 4.45 14.3 52.90 2.6 355 63.19 13 –10.00 to <100.00 181 40 36.72 110 21.42 4.3 51.04 2.9 100 91.46 12 –100.00 (Default) 244 13 37.24 241 100.00 3.4 62.59 2.1 50 20.58 150 –Sub-total 3,965 5,518 26.01 5,708 5.57 174.9 49.10 3.3 1,887 33.05 191 223Dilution risk 0 0 0 0 0 0 0 0 0 0 0 0Sub-total incl. dilution risk 3,965 5,518 26.01 5,708 5.57 174.9 49.10 3.3 1,887 33.05 191 223
Other retail non-SMEs0.00 to <0.15 1,814 2,823 30.97 3,054 0.09 411.4 32.79 3.5 261 8.55 1 –0.15 to <0.25 1,812 723 66.37 2,340 0.22 237.1 37.76 4.5 416 17.76 2 –0.25 to <0.50 2,169 709 66.10 2,693 0.39 243.2 38.38 5.0 700 26.01 4 –0.50 to <0.75 2,924 529 65.28 3,302 0.67 295.2 41.33 4.3 1,248 37.81 9 –0.75 to <2.50 8,597 464 47.96 8,859 1.58 867.4 48.76 3.8 5,532 62.44 70 –2.50 to <10.00 6,801 185 46.09 6,886 4.54 558.2 49.63 3.3 5,335 77.48 155 –10.00 to <100.00 1,351 35 53.67 1,362 20.11 123.9 49.36 2.3 1,550 113.80 136 –100.00 (Default) 2,066 26 54.61 2,075 100.00 117.3 58.64 0.8 332 16.02 1,184 –Sub-total 27,533 5,494 45.69 30,571 9.30 2,853.8 45.50 3.6 15,375 50.29 1,562 1,672Dilution risk 0 0 0 0 0 0 0 0 0 0 0 0Sub-total incl. dilution risk 27,533 5,494 45.69 30,571 9.30 2,853.8 45.50 3.6 15,375 50.29 1,562 1,672
All exposure classesDilution risk 4,363 609 34.10 4,730 10.45 0.4 2.47 1.0 492 10.40 12 0Total incl. dilution risk 497,181 274,339 35.19 596,372 3.22 8,465.3 29.59 4.5 132,915 22.29 6,235 5,797
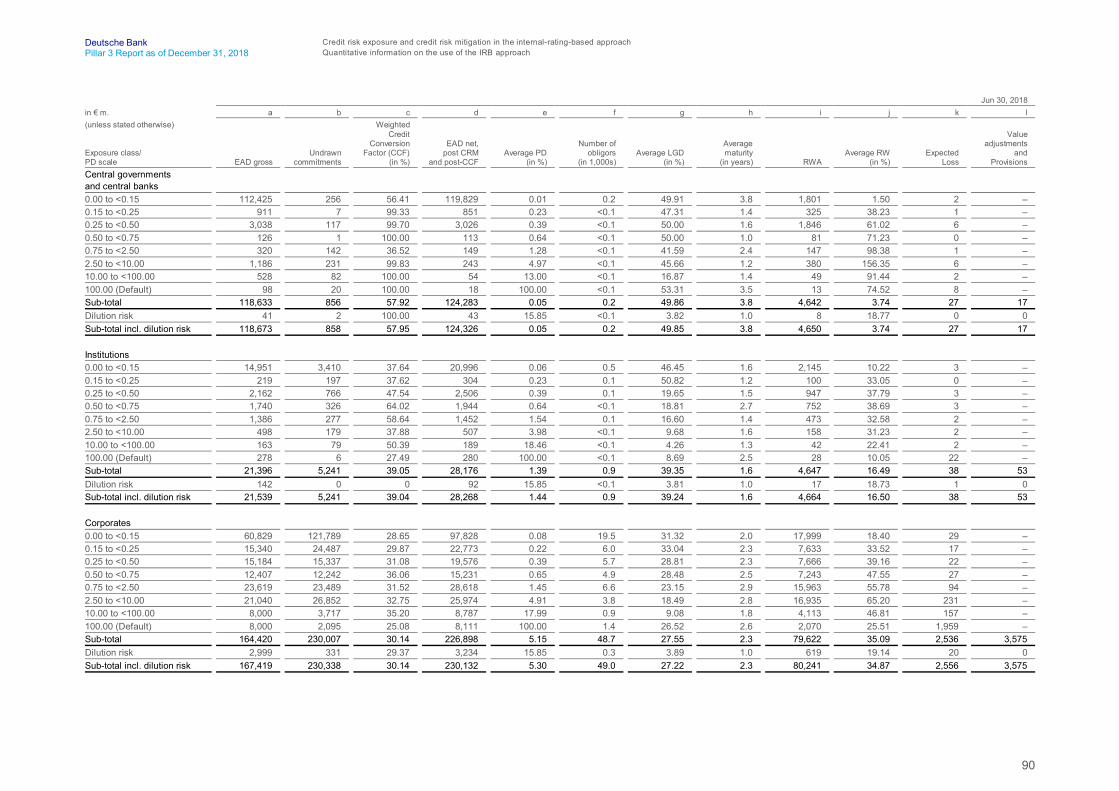
90
Deutsche Bank Credit risk exposure and credit risk mitigation in the internal-rating-based approachPillar 3 Report as of December 31, 2018 Quantitative information on the use of the IRB approach
Jun 30, 2018in € m. a b c d e f g h i j k l(unless stated otherwise)
Exposure class/PD scale EAD gross
Undrawncommitments
WeightedCredit
ConversionFactor (CCF)
(in %)
EAD net,post CRM
and post-CCFAverage PD
(in %)
Number ofobligors
(in 1,000s)Average LGD
(in %)
Averagematurity
(in years) RWAAverage RW
(in %)Expected
Loss
Valueadjustments
andProvisions
Central governmentsand central banks0.00 to <0.15 112,425 256 56.41 119,829 0.01 0.2 49.91 3.8 1,801 1.50 2 –0.15 to <0.25 911 7 99.33 851 0.23 <0.1 47.31 1.4 325 38.23 1 –0.25 to <0.50 3,038 117 99.70 3,026 0.39 <0.1 50.00 1.6 1,846 61.02 6 –0.50 to <0.75 126 1 100.00 113 0.64 <0.1 50.00 1.0 81 71.23 0 –0.75 to <2.50 320 142 36.52 149 1.28 <0.1 41.59 2.4 147 98.38 1 –2.50 to <10.00 1,186 231 99.83 243 4.97 <0.1 45.66 1.2 380 156.35 6 –10.00 to <100.00 528 82 100.00 54 13.00 <0.1 16.87 1.4 49 91.44 2 –100.00 (Default) 98 20 100.00 18 100.00 <0.1 53.31 3.5 13 74.52 8 –Sub-total 118,633 856 57.92 124,283 0.05 0.2 49.86 3.8 4,642 3.74 27 17Dilution risk 41 2 100.00 43 15.85 <0.1 3.82 1.0 8 18.77 0 0Sub-total incl. dilution risk 118,673 858 57.95 124,326 0.05 0.2 49.85 3.8 4,650 3.74 27 17
Institutions0.00 to <0.15 14,951 3,410 37.64 20,996 0.06 0.5 46.45 1.6 2,145 10.22 3 –0.15 to <0.25 219 197 37.62 304 0.23 0.1 50.82 1.2 100 33.05 0 –0.25 to <0.50 2,162 766 47.54 2,506 0.39 0.1 19.65 1.5 947 37.79 3 –0.50 to <0.75 1,740 326 64.02 1,944 0.64 <0.1 18.81 2.7 752 38.69 3 –0.75 to <2.50 1,386 277 58.64 1,452 1.54 0.1 16.60 1.4 473 32.58 2 –2.50 to <10.00 498 179 37.88 507 3.98 <0.1 9.68 1.6 158 31.23 2 –10.00 to <100.00 163 79 50.39 189 18.46 <0.1 4.26 1.3 42 22.41 2 –100.00 (Default) 278 6 27.49 280 100.00 <0.1 8.69 2.5 28 10.05 22 –Sub-total 21,396 5,241 39.05 28,176 1.39 0.9 39.35 1.6 4,647 16.49 38 53Dilution risk 142 0 0 92 15.85 <0.1 3.81 1.0 17 18.73 1 0Sub-total incl. dilution risk 21,539 5,241 39.04 28,268 1.44 0.9 39.24 1.6 4,664 16.50 38 53
Corporates0.00 to <0.15 60,829 121,789 28.65 97,828 0.08 19.5 31.32 2.0 17,999 18.40 29 –0.15 to <0.25 15,340 24,487 29.87 22,773 0.22 6.0 33.04 2.3 7,633 33.52 17 –0.25 to <0.50 15,184 15,337 31.08 19,576 0.39 5.7 28.81 2.3 7,666 39.16 22 –0.50 to <0.75 12,407 12,242 36.06 15,231 0.65 4.9 28.48 2.5 7,243 47.55 27 –0.75 to <2.50 23,619 23,489 31.52 28,618 1.45 6.6 23.15 2.9 15,963 55.78 94 –2.50 to <10.00 21,040 26,852 32.75 25,974 4.91 3.8 18.49 2.8 16,935 65.20 231 –10.00 to <100.00 8,000 3,717 35.20 8,787 17.99 0.9 9.08 1.8 4,113 46.81 157 –100.00 (Default) 8,000 2,095 25.08 8,111 100.00 1.4 26.52 2.6 2,070 25.51 1,959 –Sub-total 164,420 230,007 30.14 226,898 5.15 48.7 27.55 2.3 79,622 35.09 2,536 3,575Dilution risk 2,999 331 29.37 3,234 15.85 0.3 3.89 1.0 619 19.14 20 0Sub-total incl. dilution risk 167,419 230,338 30.14 230,132 5.30 49.0 27.22 2.3 80,241 34.87 2,556 3,575

91
Deutsche Bank Credit risk exposure and credit risk mitigation in the internal-rating-based approachPillar 3 Report as of December 31, 2018 Quantitative information on the use of the IRB approach
Jun 30, 2018in € m. a b c d e f g h i j k l(unless stated otherwise)
Exposure class/PD scale EAD gross
Undrawncommitments
WeightedCredit
ConversionFactor (CCF)
(in %)
EAD net,post CRM
and post-CCFAverage PD
(in %)
Number ofobligors
(in 1,000s)Average LGD
(in %)
Averagematurity
(in years) RWAAverage RW
(in %)Expected
Loss
Valueadjustments
andProvisions
of which:SMEs0.00 to <0.15 3,182 3,306 30.97 4,218 0.09 6.3 32.46 2.9 757 17.95 1 –0.15 to <0.25 1,472 993 41.41 1,820 0.23 2.4 34.70 3.2 575 31.57 1 –0.25 to <0.50 1,501 962 32.32 1,726 0.39 2.4 34.80 3.0 708 41.03 2 –0.50 to <0.75 1,269 699 32.68 1,439 0.64 2.1 39.16 3.0 821 57.04 4 –0.75 to <2.50 1,955 825 28.89 2,034 1.42 2.7 36.09 2.8 1,364 67.07 10 –2.50 to <10.00 1,750 635 30.03 1,674 5.09 1.4 28.04 2.5 1,233 73.64 23 –10.00 to <100.00 329 74 24.52 283 21.55 0.3 35.45 2.7 413 145.96 22 –100.00 (Default) 527 81 26.86 511 100.00 0.3 41.90 2.4 184 36.02 201 –Sub-total 11,986 7,574 32.32 13,706 5.18 17.9 34.17 2.9 6,055 44.18 264 261Dilution risk 33 0 0 41 15.85 <0.1 4.32 1.0 9 21.24 0 0Sub-total incl. dilution risk 12,019 7,574 32.32 13,747 5.21 18.0 34.08 2.9 6,063 44.11 264 261
Specialized Lending0.00 to <0.15 1,226 56 71.20 1,203 0.09 0.1 11.85 4.1 135 11.19 0 –0.15 to <0.25 1,741 70 24.25 1,746 0.22 0.1 7.81 2.9 158 9.02 0 –0.25 to <0.50 1,999 729 30.14 2,089 0.39 0.1 17.23 3.4 618 29.57 1 –0.50 to <0.75 2,086 1,230 89.01 2,318 0.66 0.1 12.52 3.0 527 22.73 2 –0.75 to <2.50 5,155 546 74.77 5,310 1.41 0.2 11.72 2.6 1,625 30.60 9 –2.50 to <10.00 8,578 748 32.32 8,526 5.17 0.3 7.97 2.2 2,505 29.38 37 –10.00 to <100.00 6,314 1,427 25.32 6,638 17.66 0.2 5.88 1.8 2,070 31.18 74 –100.00 (Default) 2,586 86 25.50 2,530 100.00 0.1 15.06 2.3 660 26.08 297 –Sub-total 29,685 4,892 48.49 30,359 13.98 1.2 9.89 2.4 8,296 27.33 421 1,110Dilution risk 0 0 0 0 0 0 0 0 0 0 0 0Sub-total incl. dilution risk 29,685 4,892 48.49 30,359 13.98 1.2 9.89 2.4 8,296 27.33 421 1,110
Other0.00 to <0.15 56,422 118,427 28.56 92,407 0.08 13.2 31.52 1.9 17,108 18.51 28 –0.15 to <0.25 12,127 23,424 29.39 19,207 0.23 3.6 35.18 2.1 6,900 35.93 16 –0.25 to <0.50 11,684 13,646 31.04 15,760 0.39 3.2 29.68 2.1 6,340 40.23 18 –0.50 to <0.75 9,052 10,313 29.59 11,474 0.64 2.7 30.35 2.3 5,895 51.38 22 –0.75 to <2.50 16,509 22,118 30.51 21,274 1.46 3.6 24.76 3.0 12,974 60.98 75 –2.50 to <10.00 10,711 25,470 32.83 15,775 4.74 2.0 23.17 3.2 13,198 83.66 171 –10.00 to <100.00 1,357 2,216 42.54 1,865 18.67 0.4 16.45 2.0 1,630 87.39 61 –100.00 (Default) 4,887 1,928 24.99 5,071 100.00 1.0 30.68 2.8 1,226 24.17 1,461 –Sub-total 122,749 217,541 29.64 182,833 3.68 29.7 29.99 2.3 65,270 35.70 1,851 2,203Dilution risk 2,967 331 29.37 3,193 15.85 0.3 3.88 1.0 610 19.11 20 0Sub-total incl. dilution risk 125,716 217,872 29.64 186,026 3.89 30.0 29.54 2.2 65,881 35.41 1,871 2,203
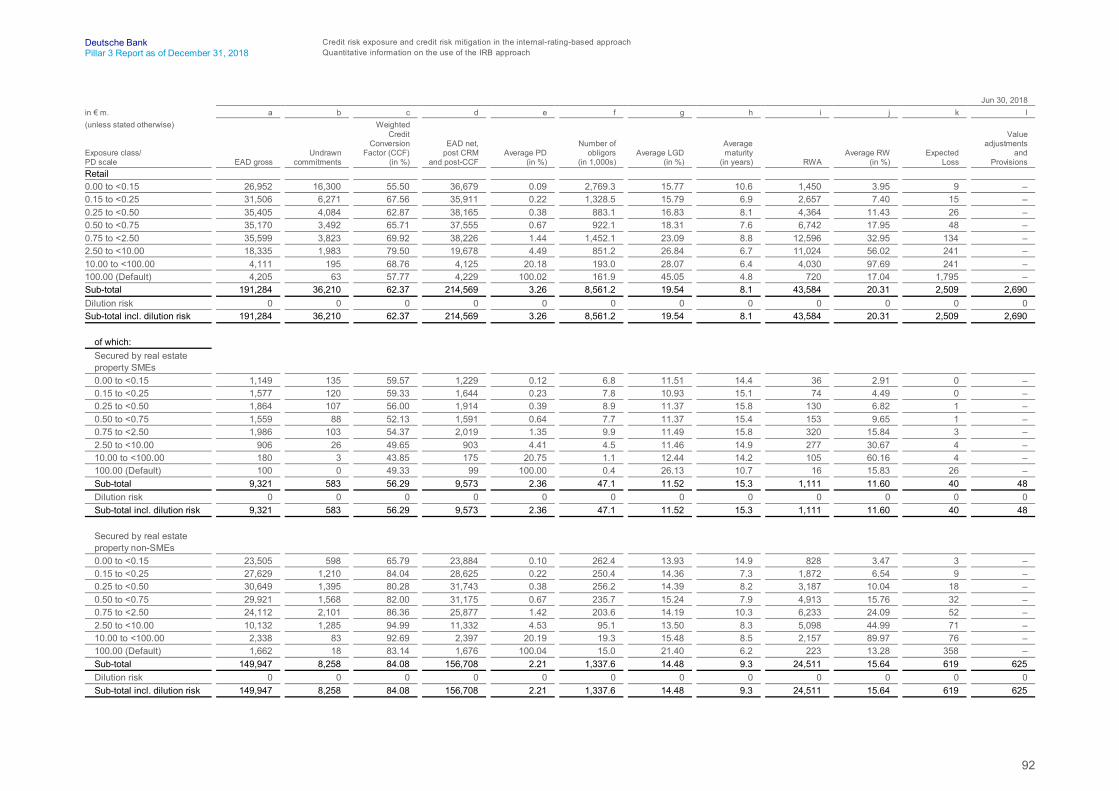
92
Deutsche Bank Credit risk exposure and credit risk mitigation in the internal-rating-based approachPillar 3 Report as of December 31, 2018 Quantitative information on the use of the IRB approach
Jun 30, 2018in € m. a b c d e f g h i j k l(unless stated otherwise)
Exposure class/PD scale EAD gross
Undrawncommitments
WeightedCredit
ConversionFactor (CCF)
(in %)
EAD net,post CRM
and post-CCFAverage PD
(in %)
Number ofobligors
(in 1,000s)Average LGD
(in %)
Averagematurity
(in years) RWAAverage RW
(in %)Expected
Loss
Valueadjustments
andProvisions
Retail0.00 to <0.15 26,952 16,300 55.50 36,679 0.09 2,769.3 15.77 10.6 1,450 3.95 9 –0.15 to <0.25 31,506 6,271 67.56 35,911 0.22 1,328.5 15.79 6.9 2,657 7.40 15 –0.25 to <0.50 35,405 4,084 62.87 38,165 0.38 883.1 16.83 8.1 4,364 11.43 26 –0.50 to <0.75 35,170 3,492 65.71 37,555 0.67 922.1 18.31 7.6 6,742 17.95 48 –0.75 to <2.50 35,599 3,823 69.92 38,226 1.44 1,452.1 23.09 8.8 12,596 32.95 134 –2.50 to <10.00 18,335 1,983 79.50 19,678 4.49 851.2 26.84 6.7 11,024 56.02 241 –10.00 to <100.00 4,111 195 68.76 4,125 20.18 193.0 28.07 6.4 4,030 97.69 241 –100.00 (Default) 4,205 63 57.77 4,229 100.02 161.9 45.05 4.8 720 17.04 1,795 –Sub-total 191,284 36,210 62.37 214,569 3.26 8,561.2 19.54 8.1 43,584 20.31 2,509 2,690Dilution risk 0 0 0 0 0 0 0 0 0 0 0 0Sub-total incl. dilution risk 191,284 36,210 62.37 214,569 3.26 8,561.2 19.54 8.1 43,584 20.31 2,509 2,690
of which:Secured by real estateproperty SMEs0.00 to <0.15 1,149 135 59.57 1,229 0.12 6.8 11.51 14.4 36 2.91 0 –0.15 to <0.25 1,577 120 59.33 1,644 0.23 7.8 10.93 15.1 74 4.49 0 –0.25 to <0.50 1,864 107 56.00 1,914 0.39 8.9 11.37 15.8 130 6.82 1 –0.50 to <0.75 1,559 88 52.13 1,591 0.64 7.7 11.37 15.4 153 9.65 1 –0.75 to <2.50 1,986 103 54.37 2,019 1.35 9.9 11.49 15.8 320 15.84 3 –2.50 to <10.00 906 26 49.65 903 4.41 4.5 11.46 14.9 277 30.67 4 –10.00 to <100.00 180 3 43.85 175 20.75 1.1 12.44 14.2 105 60.16 4 –100.00 (Default) 100 0 49.33 99 100.00 0.4 26.13 10.7 16 15.83 26 –Sub-total 9,321 583 56.29 9,573 2.36 47.1 11.52 15.3 1,111 11.60 40 48Dilution risk 0 0 0 0 0 0 0 0 0 0 0 0Sub-total incl. dilution risk 9,321 583 56.29 9,573 2.36 47.1 11.52 15.3 1,111 11.60 40 48
Secured by real estateproperty non-SMEs0.00 to <0.15 23,505 598 65.79 23,884 0.10 262.4 13.93 14.9 828 3.47 3 –0.15 to <0.25 27,629 1,210 84.04 28,625 0.22 250.4 14.36 7.3 1,872 6.54 9 –0.25 to <0.50 30,649 1,395 80.28 31,743 0.38 256.2 14.39 8.2 3,187 10.04 18 –0.50 to <0.75 29,921 1,568 82.00 31,175 0.67 235.7 15.24 7.9 4,913 15.76 32 –0.75 to <2.50 24,112 2,101 86.36 25,877 1.42 203.6 14.19 10.3 6,233 24.09 52 –2.50 to <10.00 10,132 1,285 94.99 11,332 4.53 95.1 13.50 8.3 5,098 44.99 71 –10.00 to <100.00 2,338 83 92.69 2,397 20.19 19.3 15.48 8.5 2,157 89.97 76 –100.00 (Default) 1,662 18 83.14 1,676 100.04 15.0 21.40 6.2 223 13.28 358 –Sub-total 149,947 8,258 84.08 156,708 2.21 1,337.6 14.48 9.3 24,511 15.64 619 625Dilution risk 0 0 0 0 0 0 0 0 0 0 0 0Sub-total incl. dilution risk 149,947 8,258 84.08 156,708 2.21 1,337.6 14.48 9.3 24,511 15.64 619 625
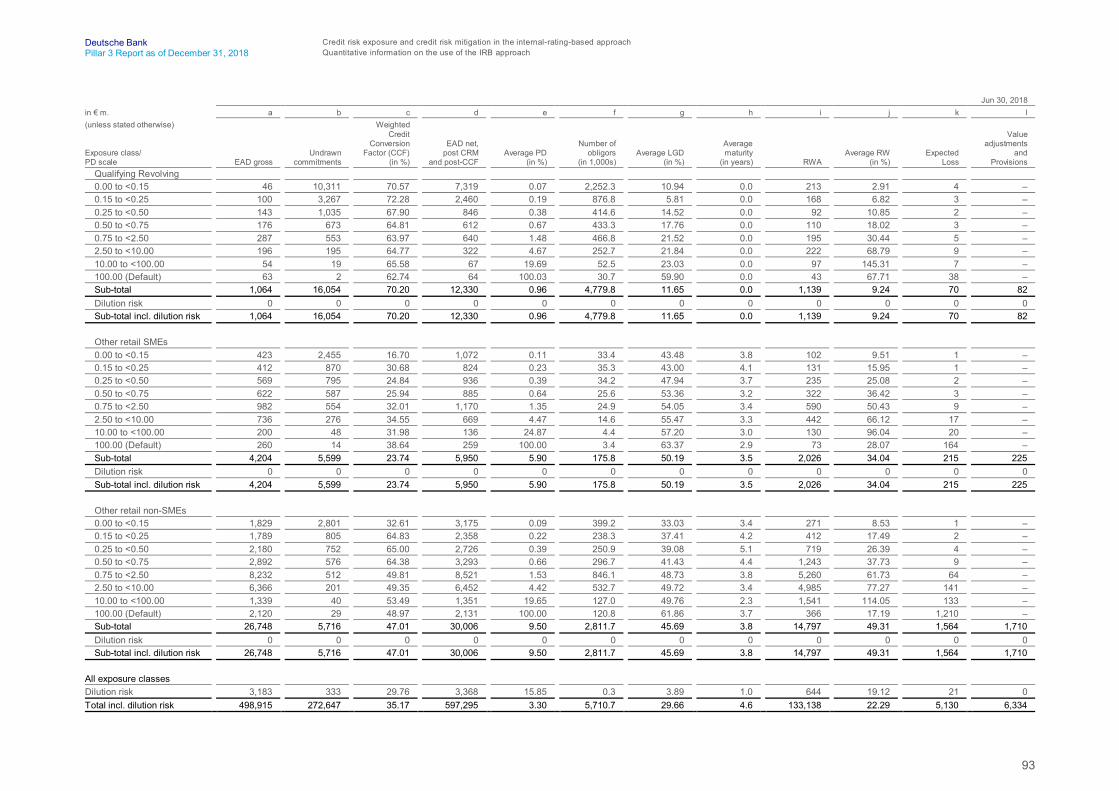
93
Deutsche Bank Credit risk exposure and credit risk mitigation in the internal-rating-based approachPillar 3 Report as of December 31, 2018 Quantitative information on the use of the IRB approach
Jun 30, 2018in € m. a b c d e f g h i j k l(unless stated otherwise)
Exposure class/PD scale EAD gross
Undrawncommitments
WeightedCredit
ConversionFactor (CCF)
(in %)
EAD net,post CRM
and post-CCFAverage PD
(in %)
Number ofobligors
(in 1,000s)Average LGD
(in %)
Averagematurity
(in years) RWAAverage RW
(in %)Expected
Loss
Valueadjustments
andProvisions
Qualifying Revolving0.00 to <0.15 46 10,311 70.57 7,319 0.07 2,252.3 10.94 0.0 213 2.91 4 –0.15 to <0.25 100 3,267 72.28 2,460 0.19 876.8 5.81 0.0 168 6.82 3 –0.25 to <0.50 143 1,035 67.90 846 0.38 414.6 14.52 0.0 92 10.85 2 –0.50 to <0.75 176 673 64.81 612 0.67 433.3 17.76 0.0 110 18.02 3 –0.75 to <2.50 287 553 63.97 640 1.48 466.8 21.52 0.0 195 30.44 5 –2.50 to <10.00 196 195 64.77 322 4.67 252.7 21.84 0.0 222 68.79 9 –10.00 to <100.00 54 19 65.58 67 19.69 52.5 23.03 0.0 97 145.31 7 –100.00 (Default) 63 2 62.74 64 100.03 30.7 59.90 0.0 43 67.71 38 –Sub-total 1,064 16,054 70.20 12,330 0.96 4,779.8 11.65 0.0 1,139 9.24 70 82Dilution risk 0 0 0 0 0 0 0 0 0 0 0 0Sub-total incl. dilution risk 1,064 16,054 70.20 12,330 0.96 4,779.8 11.65 0.0 1,139 9.24 70 82
Other retail SMEs0.00 to <0.15 423 2,455 16.70 1,072 0.11 33.4 43.48 3.8 102 9.51 1 –0.15 to <0.25 412 870 30.68 824 0.23 35.3 43.00 4.1 131 15.95 1 –0.25 to <0.50 569 795 24.84 936 0.39 34.2 47.94 3.7 235 25.08 2 –0.50 to <0.75 622 587 25.94 885 0.64 25.6 53.36 3.2 322 36.42 3 –0.75 to <2.50 982 554 32.01 1,170 1.35 24.9 54.05 3.4 590 50.43 9 –2.50 to <10.00 736 276 34.55 669 4.47 14.6 55.47 3.3 442 66.12 17 –10.00 to <100.00 200 48 31.98 136 24.87 4.4 57.20 3.0 130 96.04 20 –100.00 (Default) 260 14 38.64 259 100.00 3.4 63.37 2.9 73 28.07 164 –Sub-total 4,204 5,599 23.74 5,950 5.90 175.8 50.19 3.5 2,026 34.04 215 225Dilution risk 0 0 0 0 0 0 0 0 0 0 0 0Sub-total incl. dilution risk 4,204 5,599 23.74 5,950 5.90 175.8 50.19 3.5 2,026 34.04 215 225
Other retail non-SMEs0.00 to <0.15 1,829 2,801 32.61 3,175 0.09 399.2 33.03 3.4 271 8.53 1 –0.15 to <0.25 1,789 805 64.83 2,358 0.22 238.3 37.41 4.2 412 17.49 2 –0.25 to <0.50 2,180 752 65.00 2,726 0.39 250.9 39.08 5.1 719 26.39 4 –0.50 to <0.75 2,892 576 64.38 3,293 0.66 296.7 41.43 4.4 1,243 37.73 9 –0.75 to <2.50 8,232 512 49.81 8,521 1.53 846.1 48.73 3.8 5,260 61.73 64 –2.50 to <10.00 6,366 201 49.35 6,452 4.42 532.7 49.72 3.4 4,985 77.27 141 –10.00 to <100.00 1,339 40 53.49 1,351 19.65 127.0 49.76 2.3 1,541 114.05 133 –100.00 (Default) 2,120 29 48.97 2,131 100.00 120.8 61.86 3.7 366 17.19 1,210 –Sub-total 26,748 5,716 47.01 30,006 9.50 2,811.7 45.69 3.8 14,797 49.31 1,564 1,710Dilution risk 0 0 0 0 0 0 0 0 0 0 0 0Sub-total incl. dilution risk 26,748 5,716 47.01 30,006 9.50 2,811.7 45.69 3.8 14,797 49.31 1,564 1,710
All exposure classesDilution risk 3,183 333 29.76 3,368 15.85 0.3 3.89 1.0 644 19.12 21 0Total incl. dilution risk 498,915 272,647 35.17 597,295 3.30 5,710.7 29.66 4.6 133,138 22.29 5,130 6,334
94
Deutsche Bank Credit risk exposure and credit risk mitigation in the internal-rating-based approachPillar 3 Report as of December 31, 2018 Quantitative information on the use of the IRB approach
The credit risk exposures in our advanced IRB portfolio were at € 133.1 billion as of June 30, 2018, compared to € 126.9 billionas of December 31, 2017. The increase of € 6.2 billion is mainly driven by our portfolio in the exposure class corporates andretail showing the increase in business volumes in our CIB and PCB segments.
Article 452 (d-g) CRR - Foundation IRB exposure
The following series of tables details the Group’s foundation IRB exposure distributed on our internal rating scale, separatelyfor all relevant regulatory exposure classes. They exclude the counterparty credit risk position from derivatives and securitiesfinancing transactions which are presented separately in the section “Counterparty credit risk” in this report from page 122 to137.
The tables show the EAD gross as well as the off-balance sheet exposure. All undrawn commitment exposure values shownbelow are assigned to the exposure class of their original counterparty and not to the exposure class of the protection seller.
In addition they provide the EAD net after CRM, where exposures covered by guarantees or credit derivatives is assigned tothe protection seller. As a consequence the EAD net can be higher than the original balance sheet exposure.
The EAD net is presented in conjunction with exposures-weighted average PD, maturity as well as the RWA and the averagerisk weight (RW). In addition it provides the average LGD and average maturity, which is regulatory pre-defined in thefoundation IRB. Further details in the tables are number of obligors, expected loss and provisions.
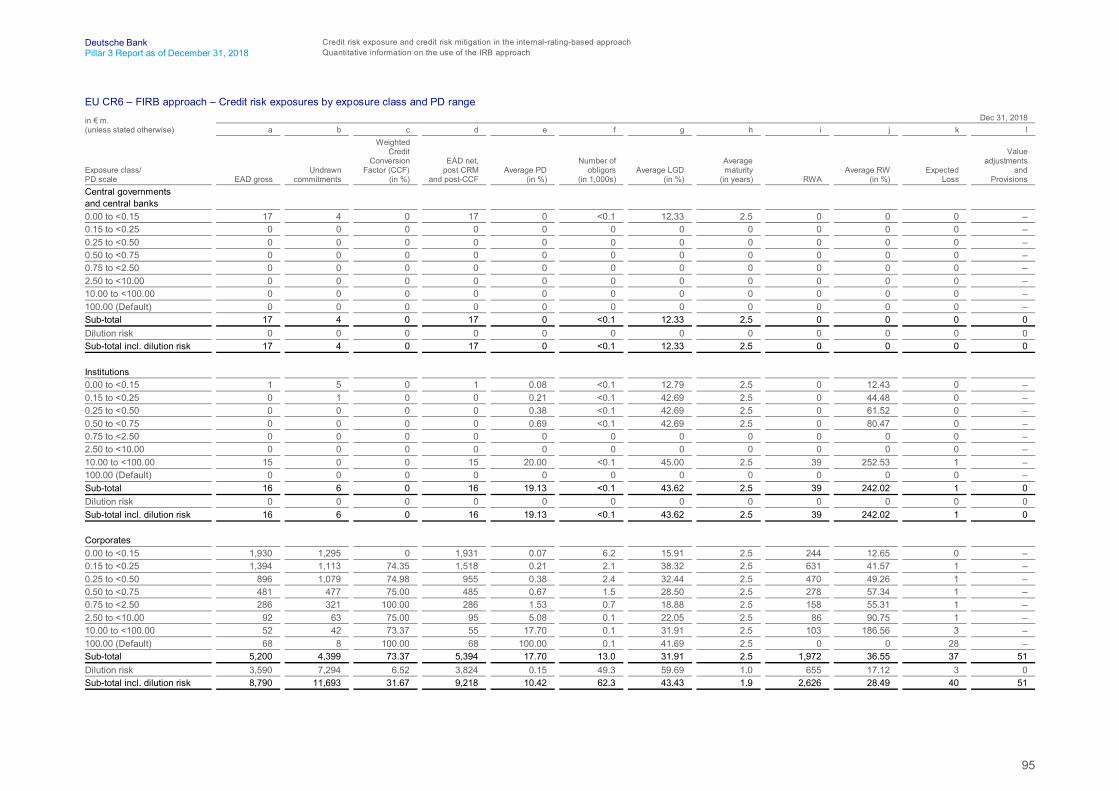
95
Deutsche Bank Credit risk exposure and credit risk mitigation in the internal-rating-based approachPillar 3 Report as of December 31, 2018 Quantitative information on the use of the IRB approach
EU CR6 – FIRB approach – Credit risk exposures by exposure class and PD range
in € m.(unless stated otherwise)
Dec 31, 2018a b c d e f g h i j k l
Exposure class/PD scale EAD gross
Undrawncommitments
WeightedCredit
ConversionFactor (CCF)
(in %)
EAD net,post CRM
and post-CCFAverage PD
(in %)
Number ofobligors
(in 1,000s)Average LGD
(in %)
Averagematurity
(in years) RWAAverage RW
(in %)Expected
Loss
Valueadjustments
andProvisions
Central governmentsand central banks0.00 to <0.15 17 4 0 17 0 <0.1 12.33 2.5 0 0 0 –0.15 to <0.25 0 0 0 0 0 0 0 0 0 0 0 –0.25 to <0.50 0 0 0 0 0 0 0 0 0 0 0 –0.50 to <0.75 0 0 0 0 0 0 0 0 0 0 0 –0.75 to <2.50 0 0 0 0 0 0 0 0 0 0 0 –2.50 to <10.00 0 0 0 0 0 0 0 0 0 0 0 –10.00 to <100.00 0 0 0 0 0 0 0 0 0 0 0 –100.00 (Default) 0 0 0 0 0 0 0 0 0 0 0 –Sub-total 17 4 0 17 0 <0.1 12.33 2.5 0 0 0 0Dilution risk 0 0 0 0 0 0 0 0 0 0 0 0Sub-total incl. dilution risk 17 4 0 17 0 <0.1 12.33 2.5 0 0 0 0
Institutions0.00 to <0.15 1 5 0 1 0.08 <0.1 12.79 2.5 0 12.43 0 –0.15 to <0.25 0 1 0 0 0.21 <0.1 42.69 2.5 0 44.48 0 –0.25 to <0.50 0 0 0 0 0.38 <0.1 42.69 2.5 0 61.52 0 –0.50 to <0.75 0 0 0 0 0.69 <0.1 42.69 2.5 0 80.47 0 –0.75 to <2.50 0 0 0 0 0 0 0 0 0 0 0 –2.50 to <10.00 0 0 0 0 0 0 0 0 0 0 0 –10.00 to <100.00 15 0 0 15 20.00 <0.1 45.00 2.5 39 252.53 1 –100.00 (Default) 0 0 0 0 0 0 0 0 0 0 0 –Sub-total 16 6 0 16 19.13 <0.1 43.62 2.5 39 242.02 1 0Dilution risk 0 0 0 0 0 0 0 0 0 0 0 0Sub-total incl. dilution risk 16 6 0 16 19.13 <0.1 43.62 2.5 39 242.02 1 0
Corporates0.00 to <0.15 1,930 1,295 0 1,931 0.07 6.2 15.91 2.5 244 12.65 0 –0.15 to <0.25 1,394 1,113 74.35 1,518 0.21 2.1 38.32 2.5 631 41.57 1 –0.25 to <0.50 896 1,079 74.98 955 0.38 2.4 32.44 2.5 470 49.26 1 –0.50 to <0.75 481 477 75.00 485 0.67 1.5 28.50 2.5 278 57.34 1 –0.75 to <2.50 286 321 100.00 286 1.53 0.7 18.88 2.5 158 55.31 1 –2.50 to <10.00 92 63 75.00 95 5.08 0.1 22.05 2.5 86 90.75 1 –10.00 to <100.00 52 42 73.37 55 17.70 0.1 31.91 2.5 103 186.56 3 –100.00 (Default) 68 8 100.00 68 100.00 0.1 41.69 2.5 0 0 28 –Sub-total 5,200 4,399 73.37 5,394 17.70 13.0 31.91 2.5 1,972 36.55 37 51Dilution risk 3,590 7,294 6.52 3,824 0.15 49.3 59.69 1.0 655 17.12 3 0Sub-total incl. dilution risk 8,790 11,693 31.67 9,218 10.42 62.3 43.43 1.9 2,626 28.49 40 51
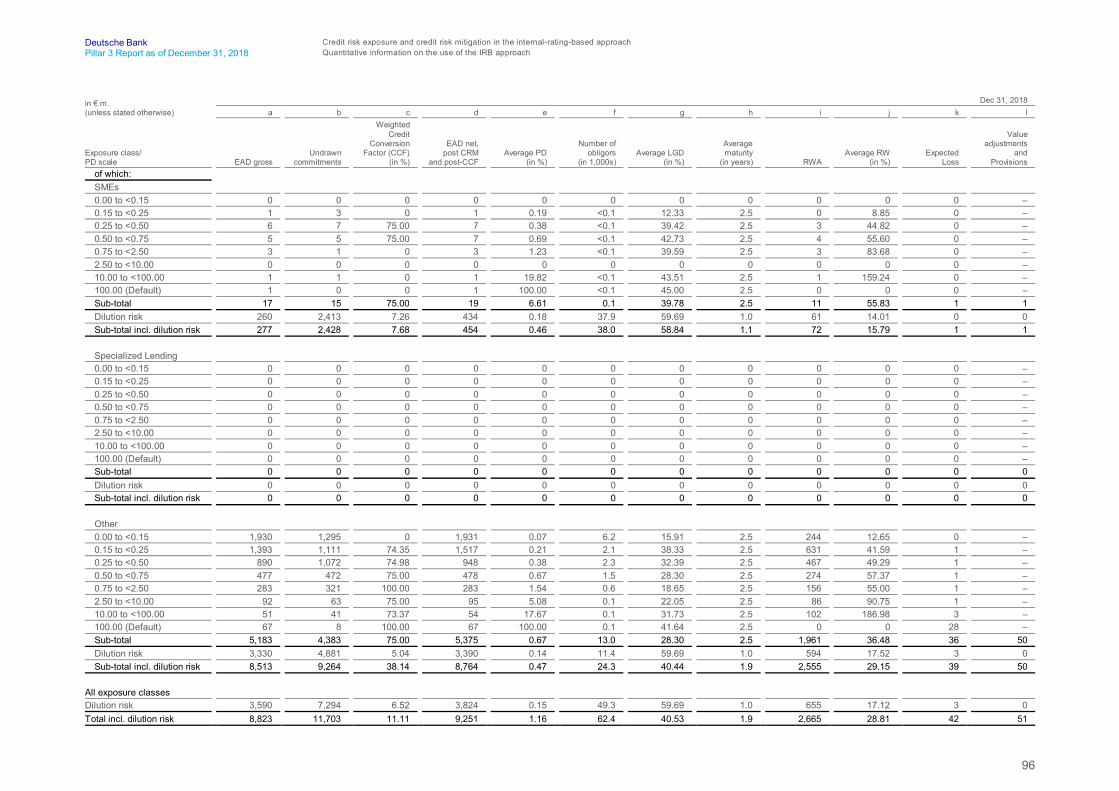
96
Deutsche Bank Credit risk exposure and credit risk mitigation in the internal-rating-based approachPillar 3 Report as of December 31, 2018 Quantitative information on the use of the IRB approach
in € m.(unless stated otherwise)
Dec 31, 2018a b c d e f g h i j k l
Exposure class/PD scale EAD gross
Undrawncommitments
WeightedCredit
ConversionFactor (CCF)
(in %)
EAD net,post CRM
and post-CCFAverage PD
(in %)
Number ofobligors
(in 1,000s)Average LGD
(in %)
Averagematurity
(in years) RWAAverage RW
(in %)Expected
Loss
Valueadjustments
andProvisions
of which:SMEs0.00 to <0.15 0 0 0 0 0 0 0 0 0 0 0 –0.15 to <0.25 1 3 0 1 0.19 <0.1 12.33 2.5 0 8.85 0 –0.25 to <0.50 6 7 75.00 7 0.38 <0.1 39.42 2.5 3 44.82 0 –0.50 to <0.75 5 5 75.00 7 0.69 <0.1 42.73 2.5 4 55.60 0 –0.75 to <2.50 3 1 0 3 1.23 <0.1 39.59 2.5 3 83.68 0 –2.50 to <10.00 0 0 0 0 0 0 0 0 0 0 0 –10.00 to <100.00 1 1 0 1 19.82 <0.1 43.51 2.5 1 159.24 0 –100.00 (Default) 1 0 0 1 100.00 <0.1 45.00 2.5 0 0 0 –Sub-total 17 15 75.00 19 6.61 0.1 39.78 2.5 11 55.83 1 1Dilution risk 260 2,413 7.26 434 0.18 37.9 59.69 1.0 61 14.01 0 0Sub-total incl. dilution risk 277 2,428 7.68 454 0.46 38.0 58.84 1.1 72 15.79 1 1
Specialized Lending0.00 to <0.15 0 0 0 0 0 0 0 0 0 0 0 –0.15 to <0.25 0 0 0 0 0 0 0 0 0 0 0 –0.25 to <0.50 0 0 0 0 0 0 0 0 0 0 0 –0.50 to <0.75 0 0 0 0 0 0 0 0 0 0 0 –0.75 to <2.50 0 0 0 0 0 0 0 0 0 0 0 –2.50 to <10.00 0 0 0 0 0 0 0 0 0 0 0 –10.00 to <100.00 0 0 0 0 0 0 0 0 0 0 0 –100.00 (Default) 0 0 0 0 0 0 0 0 0 0 0 –Sub-total 0 0 0 0 0 0 0 0 0 0 0 0Dilution risk 0 0 0 0 0 0 0 0 0 0 0 0Sub-total incl. dilution risk 0 0 0 0 0 0 0 0 0 0 0 0
Other0.00 to <0.15 1,930 1,295 0 1,931 0.07 6.2 15.91 2.5 244 12.65 0 –0.15 to <0.25 1,393 1,111 74.35 1,517 0.21 2.1 38.33 2.5 631 41.59 1 –0.25 to <0.50 890 1,072 74.98 948 0.38 2.3 32.39 2.5 467 49.29 1 –0.50 to <0.75 477 472 75.00 478 0.67 1.5 28.30 2.5 274 57.37 1 –0.75 to <2.50 283 321 100.00 283 1.54 0.6 18.65 2.5 156 55.00 1 –2.50 to <10.00 92 63 75.00 95 5.08 0.1 22.05 2.5 86 90.75 1 –10.00 to <100.00 51 41 73.37 54 17.67 0.1 31.73 2.5 102 186.98 3 –100.00 (Default) 67 8 100.00 67 100.00 0.1 41.64 2.5 0 0 28 –Sub-total 5,183 4,383 75.00 5,375 0.67 13.0 28.30 2.5 1,961 36.48 36 50Dilution risk 3,330 4,881 5.04 3,390 0.14 11.4 59.69 1.0 594 17.52 3 0Sub-total incl. dilution risk 8,513 9,264 38.14 8,764 0.47 24.3 40.44 1.9 2,555 29.15 39 50
All exposure classesDilution risk 3,590 7,294 6.52 3,824 0.15 49.3 59.69 1.0 655 17.12 3 0Total incl. dilution risk 8,823 11,703 11.11 9,251 1.16 62.4 40.53 1.9 2,665 28.81 42 51
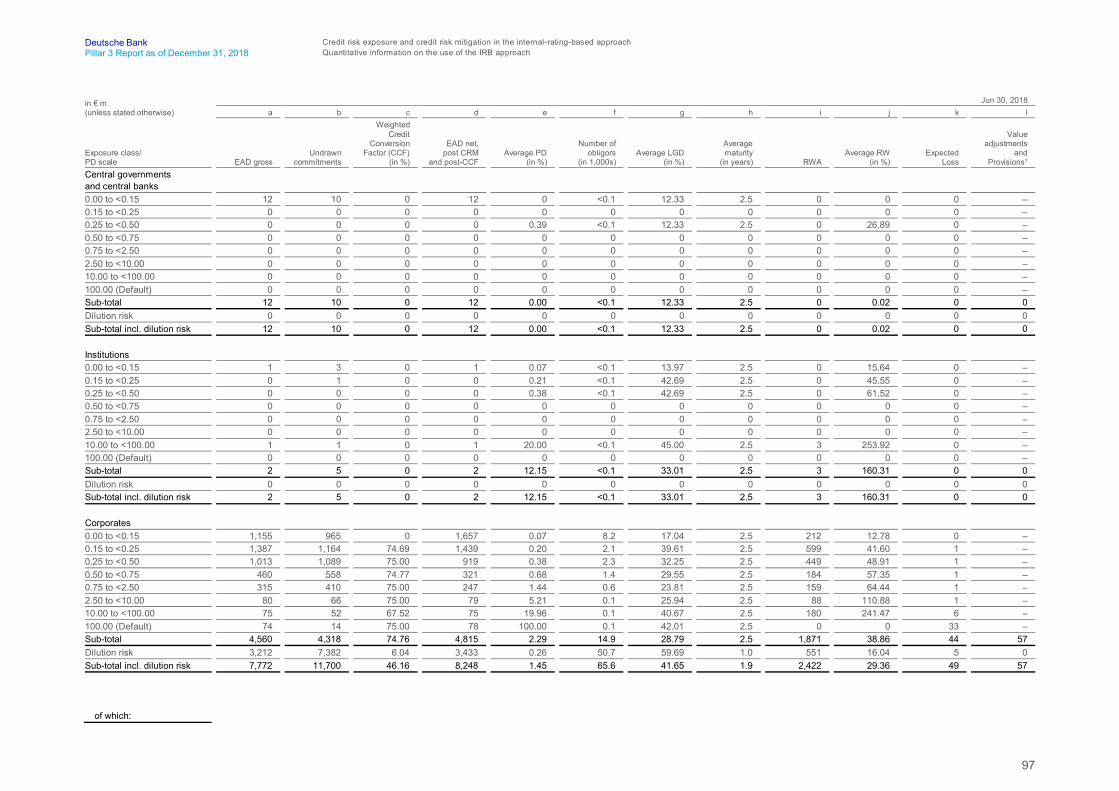
97
Deutsche Bank Credit risk exposure and credit risk mitigation in the internal-rating-based approachPillar 3 Report as of December 31, 2018 Quantitative information on the use of the IRB approach
in € m.(unless stated otherwise)
Jun 30, 2018a b c d e f g h i j k l
Exposure class/PD scale EAD gross
Undrawncommitments
WeightedCredit
ConversionFactor (CCF)
(in %)
EAD net,post CRM
and post-CCFAverage PD
(in %)
Number ofobligors
(in 1,000s)Average LGD
(in %)
Averagematurity
(in years) RWAAverage RW
(in %)Expected
Loss
Valueadjustments
andProvisions¹
Central governmentsand central banks0.00 to <0.15 12 10 0 12 0 <0.1 12.33 2.5 0 0 0 –0.15 to <0.25 0 0 0 0 0 0 0 0 0 0 0 –0.25 to <0.50 0 0 0 0 0.39 <0.1 12.33 2.5 0 26.89 0 –0.50 to <0.75 0 0 0 0 0 0 0 0 0 0 0 –0.75 to <2.50 0 0 0 0 0 0 0 0 0 0 0 –2.50 to <10.00 0 0 0 0 0 0 0 0 0 0 0 –10.00 to <100.00 0 0 0 0 0 0 0 0 0 0 0 –100.00 (Default) 0 0 0 0 0 0 0 0 0 0 0 –Sub-total 12 10 0 12 0.00 <0.1 12.33 2.5 0 0.02 0 0Dilution risk 0 0 0 0 0 0 0 0 0 0 0 0Sub-total incl. dilution risk 12 10 0 12 0.00 <0.1 12.33 2.5 0 0.02 0 0
Institutions0.00 to <0.15 1 3 0 1 0.07 <0.1 13.97 2.5 0 15.64 0 –0.15 to <0.25 0 1 0 0 0.21 <0.1 42.69 2.5 0 45.55 0 –0.25 to <0.50 0 0 0 0 0.38 <0.1 42.69 2.5 0 61.52 0 –0.50 to <0.75 0 0 0 0 0 0 0 0 0 0 0 –0.75 to <2.50 0 0 0 0 0 0 0 0 0 0 0 –2.50 to <10.00 0 0 0 0 0 0 0 0 0 0 0 –10.00 to <100.00 1 1 0 1 20.00 <0.1 45.00 2.5 3 253.92 0 –100.00 (Default) 0 0 0 0 0 0 0 0 0 0 0 –Sub-total 2 5 0 2 12.15 <0.1 33.01 2.5 3 160.31 0 0Dilution risk 0 0 0 0 0 0 0 0 0 0 0 0Sub-total incl. dilution risk 2 5 0 2 12.15 <0.1 33.01 2.5 3 160.31 0 0
Corporates0.00 to <0.15 1,155 965 0 1,657 0.07 8.2 17.04 2.5 212 12.78 0 –0.15 to <0.25 1,387 1,164 74.69 1,439 0.20 2.1 39.61 2.5 599 41.60 1 –0.25 to <0.50 1,013 1,089 75.00 919 0.38 2.3 32.25 2.5 449 48.91 1 –0.50 to <0.75 460 558 74.77 321 0.68 1.4 29.55 2.5 184 57.35 1 –0.75 to <2.50 315 410 75.00 247 1.44 0.6 23.81 2.5 159 64.44 1 –2.50 to <10.00 80 66 75.00 79 5.21 0.1 25.94 2.5 88 110.88 1 –10.00 to <100.00 75 52 67.52 75 19.96 0.1 40.67 2.5 180 241.47 6 –100.00 (Default) 74 14 75.00 78 100.00 0.1 42.01 2.5 0 0 33 –Sub-total 4,560 4,318 74.76 4,815 2.29 14.9 28.79 2.5 1,871 38.86 44 57Dilution risk 3,212 7,382 6.04 3,433 0.26 50.7 59.69 1.0 551 16.04 5 0Sub-total incl. dilution risk 7,772 11,700 46.16 8,248 1.45 65.6 41.65 1.9 2,422 29.36 49 57
of which:

98
Deutsche Bank Credit risk exposure and credit risk mitigation in the internal-rating-based approachPillar 3 Report as of December 31, 2018 Quantitative information on the use of the IRB approach
in € m.(unless stated otherwise)
Jun 30, 2018a b c d e f g h i j k l
Exposure class/PD scale EAD gross
Undrawncommitments
WeightedCredit
ConversionFactor (CCF)
(in %)
EAD net,post CRM
and post-CCFAverage PD
(in %)
Number ofobligors
(in 1,000s)Average LGD
(in %)
Averagematurity
(in years) RWAAverage RW
(in %)Expected
Loss
Valueadjustments
andProvisions¹
SMEs0.00 to <0.15 0 0 0 0 0 0 0 0 0 0 0 –0.15 to <0.25 18 20 0 16 0.23 <0.1 43.21 2.5 7 41.08 0 –0.25 to <0.50 18 16 75.00 17 0.38 <0.1 26.71 2.5 5 29.38 0 –0.50 to <0.75 3 4 0 3 0.69 <0.1 29.76 2.5 1 41.44 0 –0.75 to <2.50 1 0 0 0 1.68 <0.1 29.21 2.5 0 48.92 0 –2.50 to <10.00 0 0 0 0 7.26 <0.1 12.33 2.5 0 33.66 0 –10.00 to <100.00 0 2 0 0 12.78 <0.1 12.43 2.5 0 40.73 0 –100.00 (Default) 1 0 75.00 1 100.00 <0.1 45.00 2.5 0 0 1 –Sub-total 40 42 75.00 38 3.83 0.1 34.56 2.5 13 34.43 1 1Dilution risk 299 2,492 6.62 462 0.42 38.2 59.69 1.0 63 13.71 1 0Sub-total incl. dilution risk 339 2,535 11.76 500 0.68 38.3 57.80 1.1 76 15.27 2 1
Specialized Lending0.00 to <0.15 0 0 0 0 0 0 0 0 0 0 0 –0.15 to <0.25 0 0 0 0 0 0 0 0 0 0 0 –0.25 to <0.50 0 0 0 0 0 0 0 0 0 0 0 –0.50 to <0.75 0 0 0 0 0 0 0 0 0 0 0 –0.75 to <2.50 0 0 0 0 0 0 0 0 0 0 0 –2.50 to <10.00 0 0 0 0 0 0 0 0 0 0 0 –10.00 to <100.00 0 0 0 0 0 0 0 0 0 0 0 –100.00 (Default) 0 0 0 0 0 0 0 0 0 0 0 –Sub-total 0 0 0 0 0 0 0 0 0 0 0 0Dilution risk 0 0 0 0 0 0 0 0 0 0 0 0Sub-total incl. dilution risk 0 0 0 0 0 0 0 0 0 0 0 0
Other0.00 to <0.15 1,155 965 0 1,657 0.07 8.2 17.04 2.5 212 12.78 0 –0.15 to <0.25 1,370 1,144 74.69 1,423 0.20 2.1 39.57 2.5 592 41.61 1 –0.25 to <0.50 995 1,073 75.00 902 0.38 2.3 32.36 2.5 444 49.29 1 –0.50 to <0.75 457 554 74.77 319 0.68 1.4 29.55 2.5 183 57.48 1 –0.75 to <2.50 315 410 75.00 246 1.44 0.6 23.79 2.5 159 64.47 1 –2.50 to <10.00 80 66 75.00 79 5.21 0.1 25.94 2.5 88 110.88 1 –10.00 to <100.00 75 50 67.52 75 19.96 0.1 40.69 2.5 180 241.57 6 –100.00 (Default) 73 13 75.00 77 100.00 0.1 41.96 2.5 0 0 32 –Sub-total 4,520 4,276 74.76 4,777 2.28 14.8 28.74 2.5 1,858 38.90 43 57Dilution risk 2,913 4,889 4.85 2,971 0.23 12.5 59.69 1.0 487 16.40 4 0Sub-total incl. dilution risk 7,433 9,165 47.96 7,749 1.50 27.3 40.61 1.9 2,346 30.27 47 57
All exposure classesDilution risk 3,212 7,382 6.04 3,433 0.26 50.7 59.69 1.0 551 16.04 5 0Total incl. dilution risk 7,787 11,715 46.21 8,262 1.45 65.6 41.61 1.9 2,425 29.35 49 571 Figures of value adjustments and provisions adjusted.
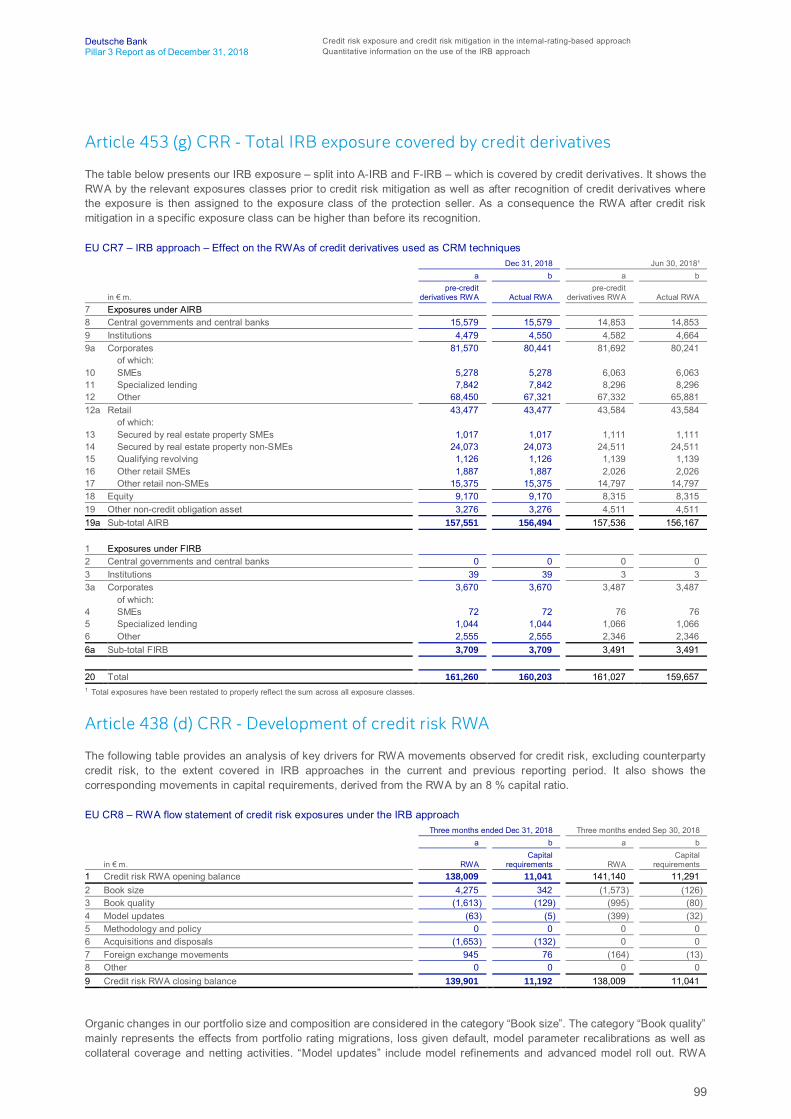
99
Deutsche Bank Credit risk exposure and credit risk mitigation in the internal-rating-based approachPillar 3 Report as of December 31, 2018 Quantitative information on the use of the IRB approach
Article 453 (g) CRR - Total IRB exposure covered by credit derivatives
The table below presents our IRB exposure – split into A-IRB and F-IRB – which is covered by credit derivatives. It shows theRWA by the relevant exposures classes prior to credit risk mitigation as well as after recognition of credit derivatives wherethe exposure is then assigned to the exposure class of the protection seller. As a consequence the RWA after credit riskmitigation in a specific exposure class can be higher than before its recognition.
EU CR7 – IRB approach – Effect on the RWAs of credit derivatives used as CRM techniquesDec 31, 2018 Jun 30, 2018¹
a b a b
in € m.pre-credit
derivatives RWA Actual RWApre-credit
derivatives RWA Actual RWA7 Exposures under AIRB8 Central governments and central banks 15,579 15,579 14,853 14,8539 Institutions 4,479 4,550 4,582 4,6649a Corporates 81,570 80,441 81,692 80,241
of which:10 SMEs 5,278 5,278 6,063 6,06311 Specialized lending 7,842 7,842 8,296 8,29612 Other 68,450 67,321 67,332 65,88112a Retail 43,477 43,477 43,584 43,584
of which:13 Secured by real estate property SMEs 1,017 1,017 1,111 1,11114 Secured by real estate property non-SMEs 24,073 24,073 24,511 24,51115 Qualifying revolving 1,126 1,126 1,139 1,13916 Other retail SMEs 1,887 1,887 2,026 2,02617 Other retail non-SMEs 15,375 15,375 14,797 14,79718 Equity 9,170 9,170 8,315 8,31519 Other non-credit obligation asset 3,276 3,276 4,511 4,51119a Sub-total AIRB 157,551 156,494 157,536 156,167
1 Exposures under FIRB2 Central governments and central banks 0 0 0 03 Institutions 39 39 3 33a Corporates 3,670 3,670 3,487 3,487
of which:4 SMEs 72 72 76 765 Specialized lending 1,044 1,044 1,066 1,0666 Other 2,555 2,555 2,346 2,3466a Sub-total FIRB 3,709 3,709 3,491 3,491
20 Total 161,260 160,203 161,027 159,6571 Total exposures have been restated to properly reflect the sum across all exposure classes.
Article 438 (d) CRR - Development of credit risk RWA
The following table provides an analysis of key drivers for RWA movements observed for credit risk, excluding counterpartycredit risk, to the extent covered in IRB approaches in the current and previous reporting period. It also shows thecorresponding movements in capital requirements, derived from the RWA by an 8 % capital ratio.
EU CR8 – RWA flow statement of credit risk exposures under the IRB approachThree months ended Dec 31, 2018 Three months ended Sep 30, 2018
a b a b
in € m. RWACapital
requirements RWACapital
requirements1 Credit risk RWA opening balance 138,009 11,041 141,140 11,2912 Book size 4,275 342 (1,573) (126)3 Book quality (1,613) (129) (995) (80)4 Model updates (63) (5) (399) (32)5 Methodology and policy 0 0 0 06 Acquisitions and disposals (1,653) (132) 0 07 Foreign exchange movements 945 76 (164) (13)8 Other 0 0 0 09 Credit risk RWA closing balance 139,901 11,192 138,009 11,041
Organic changes in our portfolio size and composition are considered in the category “Book size”. The category “Book quality”mainly represents the effects from portfolio rating migrations, loss given default, model parameter recalibrations as well ascollateral coverage and netting activities. “Model updates” include model refinements and advanced model roll out. RWA
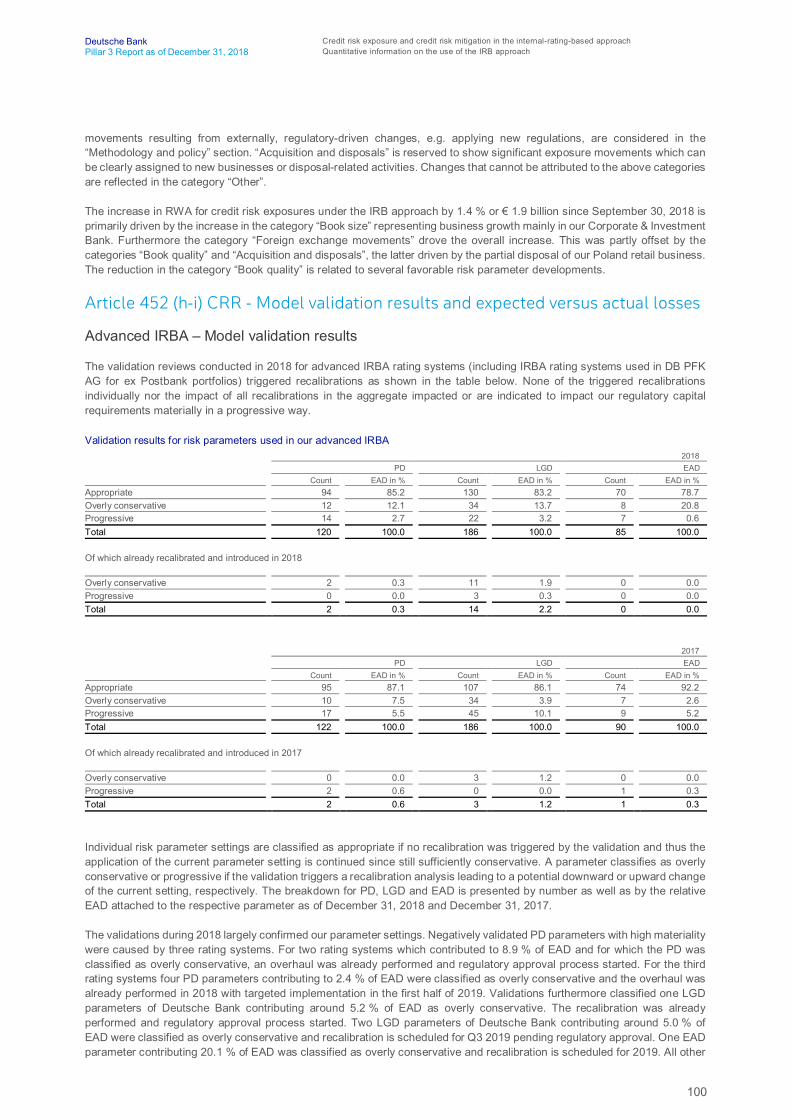
100
Deutsche Bank Credit risk exposure and credit risk mitigation in the internal-rating-based approachPillar 3 Report as of December 31, 2018 Quantitative information on the use of the IRB approach
movements resulting from externally, regulatory-driven changes, e.g. applying new regulations, are considered in the“Methodology and policy” section. “Acquisition and disposals” is reserved to show significant exposure movements which canbe clearly assigned to new businesses or disposal-related activities. Changes that cannot be attributed to the above categoriesare reflected in the category “Other”.
The increase in RWA for credit risk exposures under the IRB approach by 1.4 % or € 1.9 billion since September 30, 2018 isprimarily driven by the increase in the category “Book size” representing business growth mainly in our Corporate & InvestmentBank. Furthermore the category “Foreign exchange movements” drove the overall increase. This was partly offset by thecategories “Book quality” and “Acquisition and disposals”, the latter driven by the partial disposal of our Poland retail business.The reduction in the category “Book quality” is related to several favorable risk parameter developments.
Article 452 (h-i) CRR - Model validation results and expected versus actual losses
Advanced IRBA – Model validation results
The validation reviews conducted in 2018 for advanced IRBA rating systems (including IRBA rating systems used in DB PFKAG for ex Postbank portfolios) triggered recalibrations as shown in the table below. None of the triggered recalibrationsindividually nor the impact of all recalibrations in the aggregate impacted or are indicated to impact our regulatory capitalrequirements materially in a progressive way.
Validation results for risk parameters used in our advanced IRBA2018
PD LGD EADCount EAD in % Count EAD in % Count EAD in %
Appropriate 94 85.2 130 83.2 70 78.7Overly conservative 12 12.1 34 13.7 8 20.8Progressive 14 2.7 22 3.2 7 0.6Total 120 100.0 186 100.0 85 100.0
Of which already recalibrated and introduced in 2018
Overly conservative 2 0.3 11 1.9 0 0.0Progressive 0 0.0 3 0.3 0 0.0Total 2 0.3 14 2.2 0 0.0
2017PD LGD EAD
Count EAD in % Count EAD in % Count EAD in %Appropriate 95 87.1 107 86.1 74 92.2Overly conservative 10 7.5 34 3.9 7 2.6Progressive 17 5.5 45 10.1 9 5.2Total 122 100.0 186 100.0 90 100.0
Of which already recalibrated and introduced in 2017
Overly conservative 0 0.0 3 1.2 0 0.0Progressive 2 0.6 0 0.0 1 0.3Total 2 0.6 3 1.2 1 0.3
Individual risk parameter settings are classified as appropriate if no recalibration was triggered by the validation and thus theapplication of the current parameter setting is continued since still sufficiently conservative. A parameter classifies as overlyconservative or progressive if the validation triggers a recalibration analysis leading to a potential downward or upward changeof the current setting, respectively. The breakdown for PD, LGD and EAD is presented by number as well as by the relativeEAD attached to the respective parameter as of December 31, 2018 and December 31, 2017.
The validations during 2018 largely confirmed our parameter settings. Negatively validated PD parameters with high materialitywere caused by three rating systems. For two rating systems which contributed to 8.9 % of EAD and for which the PD wasclassified as overly conservative, an overhaul was already performed and regulatory approval process started. For the thirdrating systems four PD parameters contributing to 2.4 % of EAD were classified as overly conservative and the overhaul wasalready performed in 2018 with targeted implementation in the first half of 2019. Validations furthermore classified one LGDparameters of Deutsche Bank contributing around 5.2 % of EAD as overly conservative. The recalibration was alreadyperformed and regulatory approval process started. Two LGD parameters of Deutsche Bank contributing around 5.0 % ofEAD were classified as overly conservative and recalibration is scheduled for Q3 2019 pending regulatory approval. One EADparameter contributing 20.1 % of EAD was classified as overly conservative and recalibration is scheduled for 2019. All other
101
Deutsche Bank Credit risk exposure and credit risk mitigation in the internal-rating-based approachPillar 3 Report as of December 31, 2018 Quantitative information on the use of the IRB approach
negatively validated parameters are only applied to smaller portfolios. Overall, out of the 97 risk parameters, where arecalibration was triggered during 2018 validation, 16 were already amended in 2018.
For the remaining parameters (affecting various smaller portfolios) classified as either too progressive or overly conservativethe recalibration process is ongoing.
The below table EU CR9 aims at providing backtesting information for probabilities of default (“PD”). It compares the PD usedin the advanced IRB capital calculations with the effective obligors’ default rates presented on a five year average by regulatoryexposure classes. It has to be noted that the below table reflects credit risk as well as counterparty credit risk informationsimultaneously in line with our internal rating model validation practice where ratings are validated on a counterparty levelacross all exposure types. Moreover, some limitations have to be considered when comparing the below backtesting resultswith the above presented PD model validation results: Whilst in line with our internal procedures model validation is conductedon the level of the rating model and the model validation results provided above reflect this practice, for the below presentationby regulatory exposure classes the underlying ratings models have been assigned subsequently to the relevant regulatoryexposure class. This different way of aggregation applied for the below backtesting information may result in some bias forthe below backtesting results in contrast to the above model validation results.
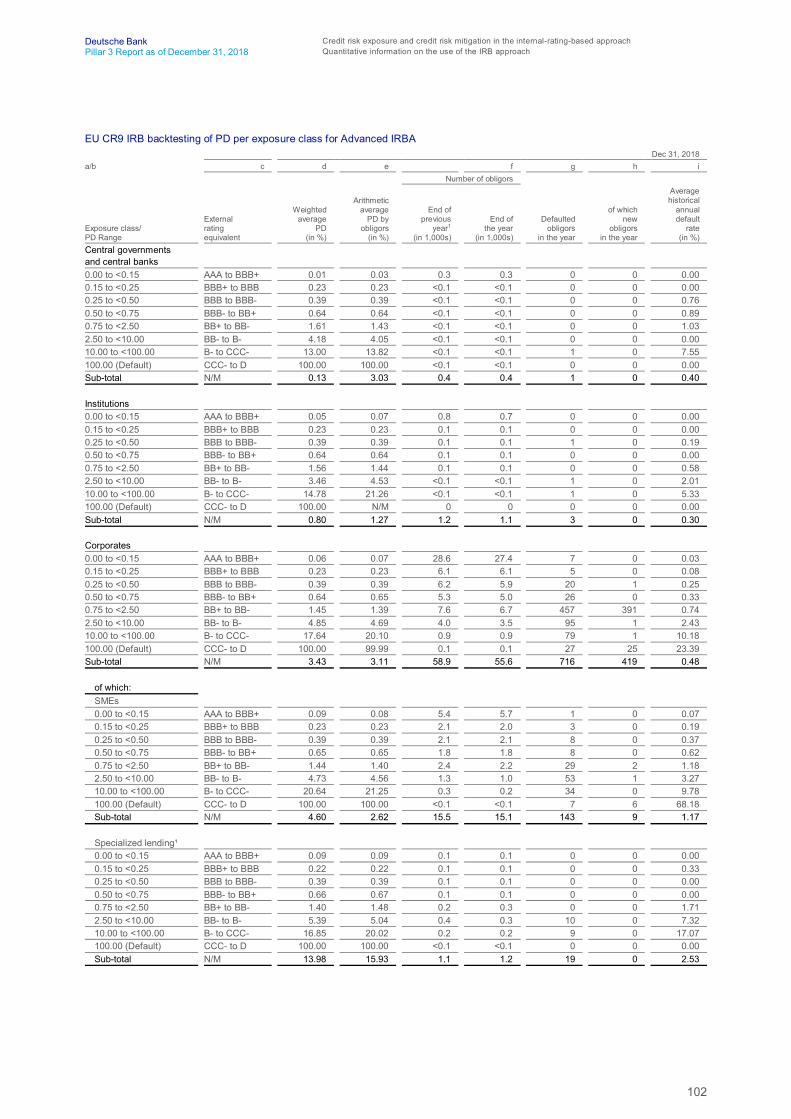
102
Deutsche Bank Credit risk exposure and credit risk mitigation in the internal-rating-based approachPillar 3 Report as of December 31, 2018 Quantitative information on the use of the IRB approach
EU CR9 IRB backtesting of PD per exposure class for Advanced IRBADec 31, 2018
a/b c d e f g h iNumber of obligors
Exposure class/PD Range
Externalratingequivalent
Weightedaverage
PD(in %)
Arithmeticaverage
PD byobligors
(in %)
End ofprevious
year1
(in 1,000s)
End ofthe year
(in 1,000s)
Defaultedobligors
in the year
of whichnew
obligorsin the year
Averagehistorical
annualdefault
rate(in %)
Central governmentsand central banks0.00 to <0.15 AAA to BBB+ 0.01 0.03 0.3 0.3 0 0 0.000.15 to <0.25 BBB+ to BBB 0.23 0.23 <0.1 <0.1 0 0 0.000.25 to <0.50 BBB to BBB- 0.39 0.39 <0.1 <0.1 0 0 0.760.50 to <0.75 BBB- to BB+ 0.64 0.64 <0.1 <0.1 0 0 0.890.75 to <2.50 BB+ to BB- 1.61 1.43 <0.1 <0.1 0 0 1.032.50 to <10.00 BB- to B- 4.18 4.05 <0.1 <0.1 0 0 0.0010.00 to <100.00 B- to CCC- 13.00 13.82 <0.1 <0.1 1 0 7.55100.00 (Default) CCC- to D 100.00 100.00 <0.1 <0.1 0 0 0.00Sub-total N/M 0.13 3.03 0.4 0.4 1 0 0.40
Institutions0.00 to <0.15 AAA to BBB+ 0.05 0.07 0.8 0.7 0 0 0.000.15 to <0.25 BBB+ to BBB 0.23 0.23 0.1 0.1 0 0 0.000.25 to <0.50 BBB to BBB- 0.39 0.39 0.1 0.1 1 0 0.190.50 to <0.75 BBB- to BB+ 0.64 0.64 0.1 0.1 0 0 0.000.75 to <2.50 BB+ to BB- 1.56 1.44 0.1 0.1 0 0 0.582.50 to <10.00 BB- to B- 3.46 4.53 <0.1 <0.1 1 0 2.0110.00 to <100.00 B- to CCC- 14.78 21.26 <0.1 <0.1 1 0 5.33100.00 (Default) CCC- to D 100.00 N/M 0 0 0 0 0.00Sub-total N/M 0.80 1.27 1.2 1.1 3 0 0.30
Corporates0.00 to <0.15 AAA to BBB+ 0.06 0.07 28.6 27.4 7 0 0.030.15 to <0.25 BBB+ to BBB 0.23 0.23 6.1 6.1 5 0 0.080.25 to <0.50 BBB to BBB- 0.39 0.39 6.2 5.9 20 1 0.250.50 to <0.75 BBB- to BB+ 0.64 0.65 5.3 5.0 26 0 0.330.75 to <2.50 BB+ to BB- 1.45 1.39 7.6 6.7 457 391 0.742.50 to <10.00 BB- to B- 4.85 4.69 4.0 3.5 95 1 2.4310.00 to <100.00 B- to CCC- 17.64 20.10 0.9 0.9 79 1 10.18100.00 (Default) CCC- to D 100.00 99.99 0.1 0.1 27 25 23.39Sub-total N/M 3.43 3.11 58.9 55.6 716 419 0.48
of which:SMEs0.00 to <0.15 AAA to BBB+ 0.09 0.08 5.4 5.7 1 0 0.070.15 to <0.25 BBB+ to BBB 0.23 0.23 2.1 2.0 3 0 0.190.25 to <0.50 BBB to BBB- 0.39 0.39 2.1 2.1 8 0 0.370.50 to <0.75 BBB- to BB+ 0.65 0.65 1.8 1.8 8 0 0.620.75 to <2.50 BB+ to BB- 1.44 1.40 2.4 2.2 29 2 1.182.50 to <10.00 BB- to B- 4.73 4.56 1.3 1.0 53 1 3.2710.00 to <100.00 B- to CCC- 20.64 21.25 0.3 0.2 34 0 9.78100.00 (Default) CCC- to D 100.00 100.00 <0.1 <0.1 7 6 68.18Sub-total N/M 4.60 2.62 15.5 15.1 143 9 1.17
Specialized lending¹0.00 to <0.15 AAA to BBB+ 0.09 0.09 0.1 0.1 0 0 0.000.15 to <0.25 BBB+ to BBB 0.22 0.22 0.1 0.1 0 0 0.330.25 to <0.50 BBB to BBB- 0.39 0.39 0.1 0.1 0 0 0.000.50 to <0.75 BBB- to BB+ 0.66 0.67 0.1 0.1 0 0 0.000.75 to <2.50 BB+ to BB- 1.40 1.48 0.2 0.3 0 0 1.712.50 to <10.00 BB- to B- 5.39 5.04 0.4 0.3 10 0 7.3210.00 to <100.00 B- to CCC- 16.85 20.02 0.2 0.2 9 0 17.07100.00 (Default) CCC- to D 100.00 100.00 <0.1 <0.1 0 0 0.00Sub-total N/M 13.98 15.93 1.1 1.2 19 0 2.53
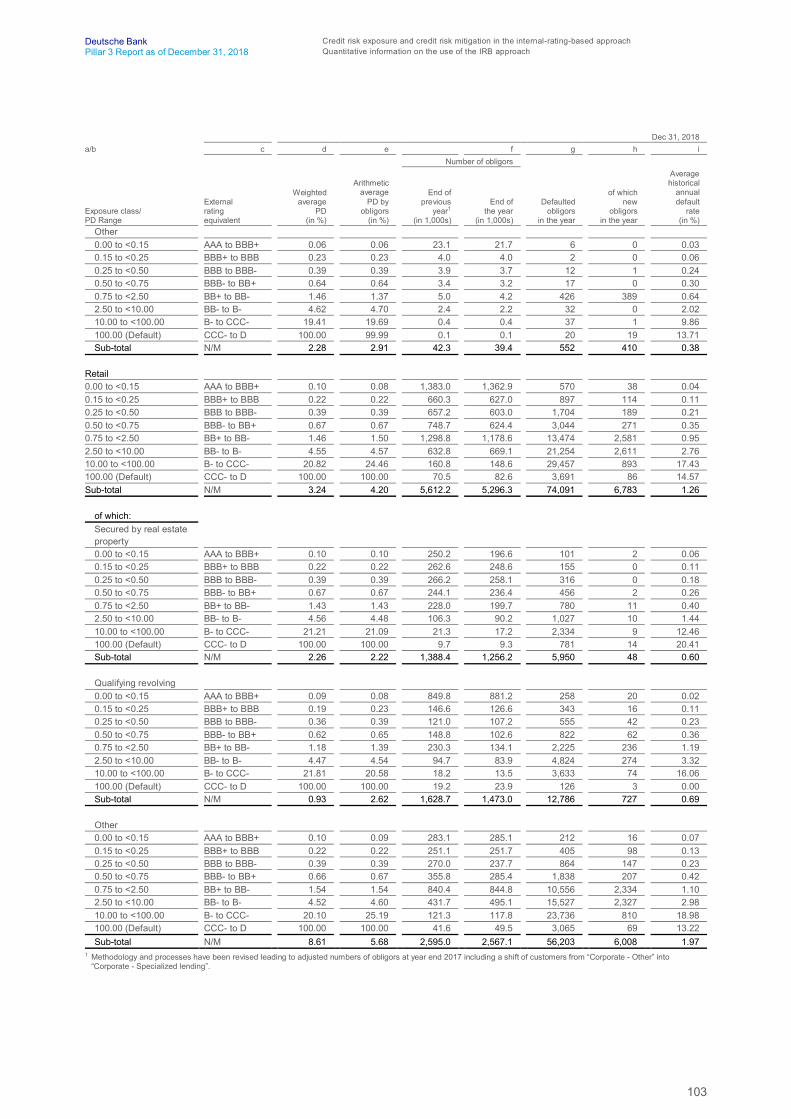
103
Deutsche Bank Credit risk exposure and credit risk mitigation in the internal-rating-based approachPillar 3 Report as of December 31, 2018 Quantitative information on the use of the IRB approach
Dec 31, 2018a/b c d e f g h i
Number of obligors
Exposure class/PD Range
Externalratingequivalent
Weightedaverage
PD(in %)
Arithmeticaverage
PD byobligors
(in %)
End ofprevious
year1
(in 1,000s)
End ofthe year
(in 1,000s)
Defaultedobligors
in the year
of whichnew
obligorsin the year
Averagehistorical
annualdefault
rate(in %)
Other0.00 to <0.15 AAA to BBB+ 0.06 0.06 23.1 21.7 6 0 0.030.15 to <0.25 BBB+ to BBB 0.23 0.23 4.0 4.0 2 0 0.060.25 to <0.50 BBB to BBB- 0.39 0.39 3.9 3.7 12 1 0.240.50 to <0.75 BBB- to BB+ 0.64 0.64 3.4 3.2 17 0 0.300.75 to <2.50 BB+ to BB- 1.46 1.37 5.0 4.2 426 389 0.642.50 to <10.00 BB- to B- 4.62 4.70 2.4 2.2 32 0 2.0210.00 to <100.00 B- to CCC- 19.41 19.69 0.4 0.4 37 1 9.86100.00 (Default) CCC- to D 100.00 99.99 0.1 0.1 20 19 13.71Sub-total N/M 2.28 2.91 42.3 39.4 552 410 0.38
Retail0.00 to <0.15 AAA to BBB+ 0.10 0.08 1,383.0 1,362.9 570 38 0.040.15 to <0.25 BBB+ to BBB 0.22 0.22 660.3 627.0 897 114 0.110.25 to <0.50 BBB to BBB- 0.39 0.39 657.2 603.0 1,704 189 0.210.50 to <0.75 BBB- to BB+ 0.67 0.67 748.7 624.4 3,044 271 0.350.75 to <2.50 BB+ to BB- 1.46 1.50 1,298.8 1,178.6 13,474 2,581 0.952.50 to <10.00 BB- to B- 4.55 4.57 632.8 669.1 21,254 2,611 2.7610.00 to <100.00 B- to CCC- 20.82 24.46 160.8 148.6 29,457 893 17.43100.00 (Default) CCC- to D 100.00 100.00 70.5 82.6 3,691 86 14.57Sub-total N/M 3.24 4.20 5,612.2 5,296.3 74,091 6,783 1.26
of which:Secured by real estateproperty0.00 to <0.15 AAA to BBB+ 0.10 0.10 250.2 196.6 101 2 0.060.15 to <0.25 BBB+ to BBB 0.22 0.22 262.6 248.6 155 0 0.110.25 to <0.50 BBB to BBB- 0.39 0.39 266.2 258.1 316 0 0.180.50 to <0.75 BBB- to BB+ 0.67 0.67 244.1 236.4 456 2 0.260.75 to <2.50 BB+ to BB- 1.43 1.43 228.0 199.7 780 11 0.402.50 to <10.00 BB- to B- 4.56 4.48 106.3 90.2 1,027 10 1.4410.00 to <100.00 B- to CCC- 21.21 21.09 21.3 17.2 2,334 9 12.46100.00 (Default) CCC- to D 100.00 100.00 9.7 9.3 781 14 20.41Sub-total N/M 2.26 2.22 1,388.4 1,256.2 5,950 48 0.60
Qualifying revolving0.00 to <0.15 AAA to BBB+ 0.09 0.08 849.8 881.2 258 20 0.020.15 to <0.25 BBB+ to BBB 0.19 0.23 146.6 126.6 343 16 0.110.25 to <0.50 BBB to BBB- 0.36 0.39 121.0 107.2 555 42 0.230.50 to <0.75 BBB- to BB+ 0.62 0.65 148.8 102.6 822 62 0.360.75 to <2.50 BB+ to BB- 1.18 1.39 230.3 134.1 2,225 236 1.192.50 to <10.00 BB- to B- 4.47 4.54 94.7 83.9 4,824 274 3.3210.00 to <100.00 B- to CCC- 21.81 20.58 18.2 13.5 3,633 74 16.06100.00 (Default) CCC- to D 100.00 100.00 19.2 23.9 126 3 0.00Sub-total N/M 0.93 2.62 1,628.7 1,473.0 12,786 727 0.69
Other0.00 to <0.15 AAA to BBB+ 0.10 0.09 283.1 285.1 212 16 0.070.15 to <0.25 BBB+ to BBB 0.22 0.22 251.1 251.7 405 98 0.130.25 to <0.50 BBB to BBB- 0.39 0.39 270.0 237.7 864 147 0.230.50 to <0.75 BBB- to BB+ 0.66 0.67 355.8 285.4 1,838 207 0.420.75 to <2.50 BB+ to BB- 1.54 1.54 840.4 844.8 10,556 2,334 1.102.50 to <10.00 BB- to B- 4.52 4.60 431.7 495.1 15,527 2,327 2.9810.00 to <100.00 B- to CCC- 20.10 25.19 121.3 117.8 23,736 810 18.98100.00 (Default) CCC- to D 100.00 100.00 41.6 49.5 3,065 69 13.22Sub-total N/M 8.61 5.68 2,595.0 2,567.1 56,203 6,008 1.97
1 Methodology and processes have been revised leading to adjusted numbers of obligors at year end 2017 including a shift of customers from “Corporate - Other” into“Corporate - Specialized lending”.
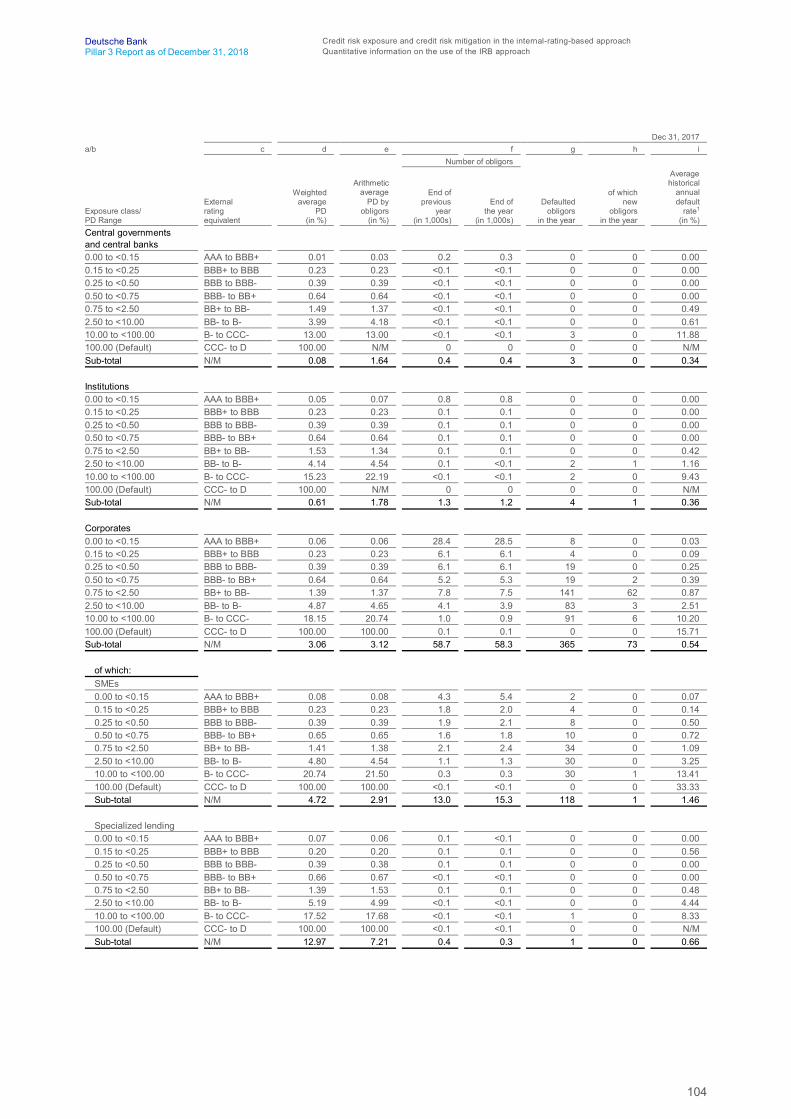
104
Deutsche Bank Credit risk exposure and credit risk mitigation in the internal-rating-based approachPillar 3 Report as of December 31, 2018 Quantitative information on the use of the IRB approach
Dec 31, 2017a/b c d e f g h i
Number of obligors
Exposure class/PD Range
Externalratingequivalent
Weightedaverage
PD(in %)
Arithmeticaverage
PD byobligors
(in %)
End ofprevious
year(in 1,000s)
End ofthe year
(in 1,000s)
Defaultedobligors
in the year
of whichnew
obligorsin the year
Averagehistorical
annualdefault
rate1
(in %)Central governmentsand central banks0.00 to <0.15 AAA to BBB+ 0.01 0.03 0.2 0.3 0 0 0.000.15 to <0.25 BBB+ to BBB 0.23 0.23 <0.1 <0.1 0 0 0.000.25 to <0.50 BBB to BBB- 0.39 0.39 <0.1 <0.1 0 0 0.000.50 to <0.75 BBB- to BB+ 0.64 0.64 <0.1 <0.1 0 0 0.000.75 to <2.50 BB+ to BB- 1.49 1.37 <0.1 <0.1 0 0 0.492.50 to <10.00 BB- to B- 3.99 4.18 <0.1 <0.1 0 0 0.6110.00 to <100.00 B- to CCC- 13.00 13.00 <0.1 <0.1 3 0 11.88100.00 (Default) CCC- to D 100.00 N/M 0 0 0 0 N/MSub-total N/M 0.08 1.64 0.4 0.4 3 0 0.34
Institutions0.00 to <0.15 AAA to BBB+ 0.05 0.07 0.8 0.8 0 0 0.000.15 to <0.25 BBB+ to BBB 0.23 0.23 0.1 0.1 0 0 0.000.25 to <0.50 BBB to BBB- 0.39 0.39 0.1 0.1 0 0 0.000.50 to <0.75 BBB- to BB+ 0.64 0.64 0.1 0.1 0 0 0.000.75 to <2.50 BB+ to BB- 1.53 1.34 0.1 0.1 0 0 0.422.50 to <10.00 BB- to B- 4.14 4.54 0.1 <0.1 2 1 1.1610.00 to <100.00 B- to CCC- 15.23 22.19 <0.1 <0.1 2 0 9.43100.00 (Default) CCC- to D 100.00 N/M 0 0 0 0 N/MSub-total N/M 0.61 1.78 1.3 1.2 4 1 0.36
Corporates0.00 to <0.15 AAA to BBB+ 0.06 0.06 28.4 28.5 8 0 0.030.15 to <0.25 BBB+ to BBB 0.23 0.23 6.1 6.1 4 0 0.090.25 to <0.50 BBB to BBB- 0.39 0.39 6.1 6.1 19 0 0.250.50 to <0.75 BBB- to BB+ 0.64 0.64 5.2 5.3 19 2 0.390.75 to <2.50 BB+ to BB- 1.39 1.37 7.8 7.5 141 62 0.872.50 to <10.00 BB- to B- 4.87 4.65 4.1 3.9 83 3 2.5110.00 to <100.00 B- to CCC- 18.15 20.74 1.0 0.9 91 6 10.20100.00 (Default) CCC- to D 100.00 100.00 0.1 0.1 0 0 15.71Sub-total N/M 3.06 3.12 58.7 58.3 365 73 0.54
of which:SMEs0.00 to <0.15 AAA to BBB+ 0.08 0.08 4.3 5.4 2 0 0.070.15 to <0.25 BBB+ to BBB 0.23 0.23 1.8 2.0 4 0 0.140.25 to <0.50 BBB to BBB- 0.39 0.39 1.9 2.1 8 0 0.500.50 to <0.75 BBB- to BB+ 0.65 0.65 1.6 1.8 10 0 0.720.75 to <2.50 BB+ to BB- 1.41 1.38 2.1 2.4 34 0 1.092.50 to <10.00 BB- to B- 4.80 4.54 1.1 1.3 30 0 3.2510.00 to <100.00 B- to CCC- 20.74 21.50 0.3 0.3 30 1 13.41100.00 (Default) CCC- to D 100.00 100.00 <0.1 <0.1 0 0 33.33Sub-total N/M 4.72 2.91 13.0 15.3 118 1 1.46
Specialized lending0.00 to <0.15 AAA to BBB+ 0.07 0.06 0.1 <0.1 0 0 0.000.15 to <0.25 BBB+ to BBB 0.20 0.20 0.1 0.1 0 0 0.560.25 to <0.50 BBB to BBB- 0.39 0.38 0.1 0.1 0 0 0.000.50 to <0.75 BBB- to BB+ 0.66 0.67 <0.1 <0.1 0 0 0.000.75 to <2.50 BB+ to BB- 1.39 1.53 0.1 0.1 0 0 0.482.50 to <10.00 BB- to B- 5.19 4.99 <0.1 <0.1 0 0 4.4410.00 to <100.00 B- to CCC- 17.52 17.68 <0.1 <0.1 1 0 8.33100.00 (Default) CCC- to D 100.00 100.00 <0.1 <0.1 0 0 N/MSub-total N/M 12.97 7.21 0.4 0.3 1 0 0.66

105
Deutsche Bank Credit risk exposure and credit risk mitigation in the internal-rating-based approachPillar 3 Report as of December 31, 2018 Quantitative information on the use of the IRB approach
Dec 31, 2017a/b c d e f g h i
Number of obligors
Exposure class/PD Range
Externalratingequivalent
Weightedaverage
PD(in %)
Arithmeticaverage
PD byobligors
(in %)
End ofprevious
year(in 1,000s)
End ofthe year
(in 1,000s)
Defaultedobligors
in the year
of whichnew
obligorsin the year
Averagehistorical
annualdefault
rate1
(in %)Other0.00 to <0.15 AAA to BBB+ 0.05 0.06 24.1 23.1 6 0 0.030.15 to <0.25 BBB+ to BBB 0.23 0.23 4.2 4.0 0 0 0.060.25 to <0.50 BBB to BBB- 0.39 0.39 4.2 3.9 11 0 0.220.50 to <0.75 BBB- to BB+ 0.64 0.64 3.5 3.4 9 2 0.340.75 to <2.50 BB+ to BB- 1.39 1.36 5.6 5.0 107 62 0.802.50 to <10.00 BB- to B- 4.72 4.65 3.0 2.6 53 3 2.4010.00 to <100.00 B- to CCC- 19.56 20.86 0.7 0.6 60 5 9.82100.00 (Default) CCC- to D 100.00 100.00 0.1 0.1 0 0 13.33Sub-total N/M 1.93 2.83 45.3 42.7 246 72 0.48
Retail0.00 to <0.15 AAA to BBB+ 0.10 0.09 1,352.3 1,338.1 649 30 0.050.15 to <0.25 BBB+ to BBB 0.22 0.22 666.8 651.2 799 49 0.120.25 to <0.50 BBB to BBB- 0.39 0.39 664.5 645.0 1,609 271 0.220.50 to <0.75 BBB- to BB+ 0.66 0.66 711.4 741.1 3,141 529 0.380.75 to <2.50 BB+ to BB- 1.42 1.41 1,263.6 1,290.3 13,278 2,150 1.012.50 to <10.00 BB- to B- 4.53 4.51 642.7 629.0 20,969 2,598 2.7510.00 to <100.00 B- to CCC- 20.49 20.59 156.1 159.1 29,846 965 17.59100.00 (Default) CCC- to D 100.00 100.00 39.1 70.6 4,799 575 24.47Sub-total N/M 3.33 3.71 5,496.3 5,524.3 75,090 7,167 1.33
of which:Secured by real estateproperty0.00 to <0.15 AAA to BBB+ 0.10 0.09 236.8 205.7 76 0 0.060.15 to <0.25 BBB+ to BBB 0.22 0.21 268.8 255.5 131 1 0.120.25 to <0.50 BBB to BBB- 0.38 0.38 270.5 262.4 279 1 0.210.50 to <0.75 BBB- to BB+ 0.67 0.67 248.8 242.2 423 8 0.310.75 to <2.50 BB+ to BB- 1.41 1.42 229.2 226.5 784 11 0.452.50 to <10.00 BB- to B- 4.51 4.48 107.1 105.6 1,046 7 1.5510.00 to <100.00 B- to CCC- 20.86 21.08 25.2 20.5 2,708 8 11.96100.00 (Default) CCC- to D 100.00 100.00 10.8 9.7 551 0 40.39Sub-total N/M 2.46 2.37 1,397.2 1,328.0 5,998 36 0.67
Qualifying revolving0.00 to <0.15 AAA to BBB+ 0.08 0.08 848.8 849.8 282 17 0.020.15 to <0.25 BBB+ to BBB 0.23 0.23 149.5 146.6 252 13 0.090.25 to <0.50 BBB to BBB- 0.39 0.39 119.7 121.0 418 31 0.190.50 to <0.75 BBB- to BB+ 0.65 0.65 108.7 148.8 705 101 0.360.75 to <2.50 BB+ to BB- 1.39 1.31 156.6 230.3 2,047 419 1.142.50 to <10.00 BB- to B- 4.45 4.50 88.7 94.7 3,573 433 2.7710.00 to <100.00 B- to CCC- 20.73 19.65 16.6 18.2 3,070 159 14.58100.00 (Default) CCC- to D 100.00 100.00 0.8 19.2 58 0 0.00Sub-total N/M 1.16 1.47 1,489.3 1,628.7 10,405 1,173 0.68
Other0.00 to <0.15 AAA to BBB+ 0.08 0.09 266.7 282.7 291 13 0.100.15 to <0.25 BBB+ to BBB 0.22 0.22 248.5 249.1 416 35 0.150.25 to <0.50 BBB to BBB- 0.39 0.39 274.2 261.6 912 239 0.250.50 to <0.75 BBB- to BB+ 0.65 0.65 353.9 350.1 2,013 420 0.440.75 to <2.50 BB+ to BB- 1.47 1.43 877.8 833.5 10,447 1,720 1.172.50 to <10.00 BB- to B- 4.57 4.50 446.8 428.7 16,350 2,158 3.0410.00 to <100.00 B- to CCC- 19.74 20.78 114.3 120.4 24,068 798 19.74100.00 (Default) CCC- to D 100.00 100.00 27.5 41.6 4,190 575 20.06Sub-total N/M 7.80 5.77 2,609.8 2,567.6 58,687 5,958 2.05
1 Please note that some of the ‘%’-figures show rounding differences compared to the 2017 Pillar 3 report.
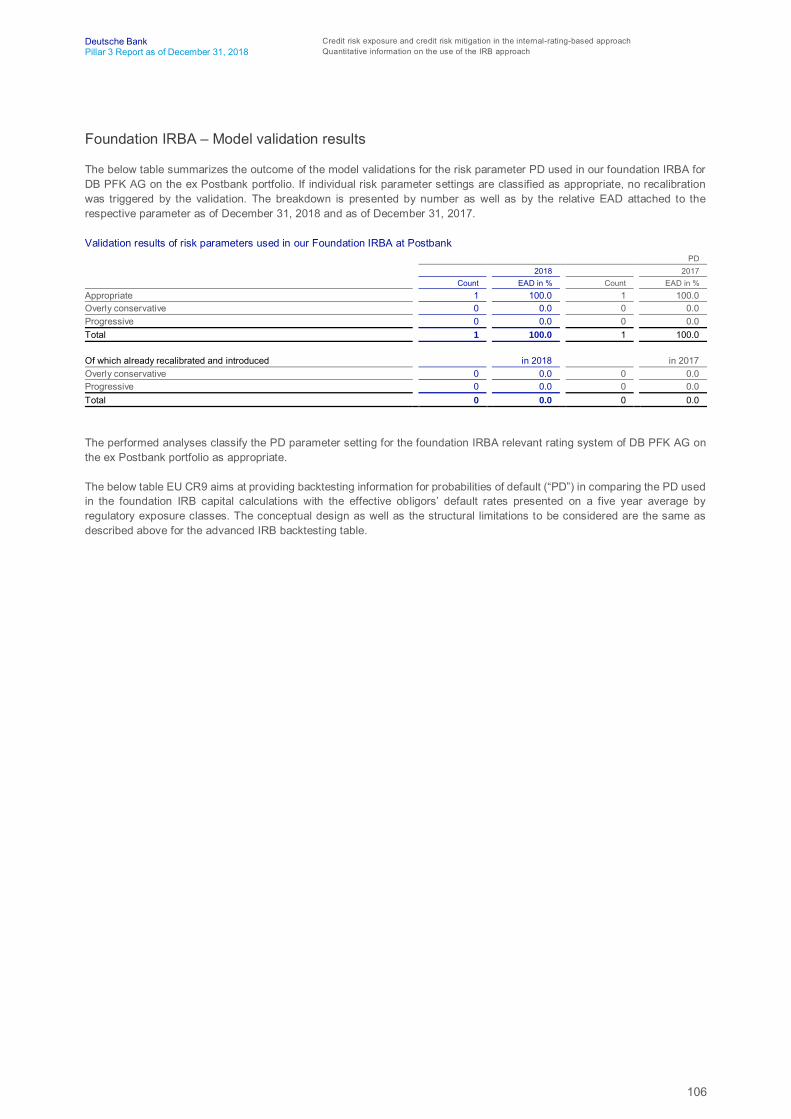
106
Deutsche Bank Credit risk exposure and credit risk mitigation in the internal-rating-based approachPillar 3 Report as of December 31, 2018 Quantitative information on the use of the IRB approach
Foundation IRBA – Model validation results
The below table summarizes the outcome of the model validations for the risk parameter PD used in our foundation IRBA forDB PFK AG on the ex Postbank portfolio. If individual risk parameter settings are classified as appropriate, no recalibrationwas triggered by the validation. The breakdown is presented by number as well as by the relative EAD attached to therespective parameter as of December 31, 2018 and as of December 31, 2017.
Validation results of risk parameters used in our Foundation IRBA at PostbankPD
2018 2017Count EAD in % Count EAD in %
Appropriate 1 100.0 1 100.0Overly conservative 0 0.0 0 0.0Progressive 0 0.0 0 0.0Total 1 100.0 1 100.0
Of which already recalibrated and introduced in 2018 in 2017Overly conservative 0 0.0 0 0.0Progressive 0 0.0 0 0.0Total 0 0.0 0 0.0
The performed analyses classify the PD parameter setting for the foundation IRBA relevant rating system of DB PFK AG onthe ex Postbank portfolio as appropriate.
The below table EU CR9 aims at providing backtesting information for probabilities of default (“PD”) in comparing the PD usedin the foundation IRB capital calculations with the effective obligors’ default rates presented on a five year average byregulatory exposure classes. The conceptual design as well as the structural limitations to be considered are the same asdescribed above for the advanced IRB backtesting table.
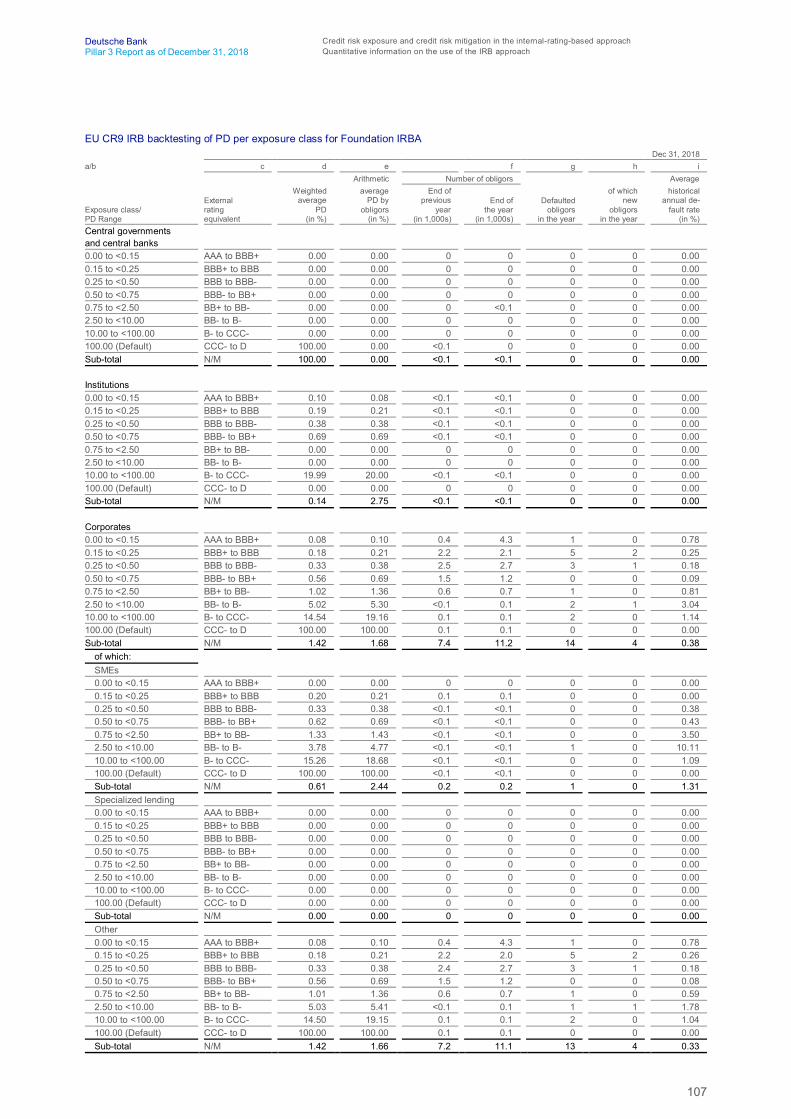
107
Deutsche Bank Credit risk exposure and credit risk mitigation in the internal-rating-based approachPillar 3 Report as of December 31, 2018 Quantitative information on the use of the IRB approach
EU CR9 IRB backtesting of PD per exposure class for Foundation IRBADec 31, 2018
a/b c d e f g h iArithmetic Number of obligors Average
Exposure class/PD Range
Externalratingequivalent
Weightedaverage
PD(in %)
averagePD by
obligors(in %)
End ofprevious
year(in 1,000s)
End ofthe year
(in 1,000s)
Defaultedobligors
in the year
of whichnew
obligorsin the year
historicalannual de-
fault rate(in %)
Central governmentsand central banks0.00 to <0.15 AAA to BBB+ 0.00 0.00 0 0 0 0 0.000.15 to <0.25 BBB+ to BBB 0.00 0.00 0 0 0 0 0.000.25 to <0.50 BBB to BBB- 0.00 0.00 0 0 0 0 0.000.50 to <0.75 BBB- to BB+ 0.00 0.00 0 0 0 0 0.000.75 to <2.50 BB+ to BB- 0.00 0.00 0 <0.1 0 0 0.002.50 to <10.00 BB- to B- 0.00 0.00 0 0 0 0 0.0010.00 to <100.00 B- to CCC- 0.00 0.00 0 0 0 0 0.00100.00 (Default) CCC- to D 100.00 0.00 <0.1 0 0 0 0.00Sub-total N/M 100.00 0.00 <0.1 <0.1 0 0 0.00
Institutions0.00 to <0.15 AAA to BBB+ 0.10 0.08 <0.1 <0.1 0 0 0.000.15 to <0.25 BBB+ to BBB 0.19 0.21 <0.1 <0.1 0 0 0.000.25 to <0.50 BBB to BBB- 0.38 0.38 <0.1 <0.1 0 0 0.000.50 to <0.75 BBB- to BB+ 0.69 0.69 <0.1 <0.1 0 0 0.000.75 to <2.50 BB+ to BB- 0.00 0.00 0 0 0 0 0.002.50 to <10.00 BB- to B- 0.00 0.00 0 0 0 0 0.0010.00 to <100.00 B- to CCC- 19.99 20.00 <0.1 <0.1 0 0 0.00100.00 (Default) CCC- to D 0.00 0.00 0 0 0 0 0.00Sub-total N/M 0.14 2.75 <0.1 <0.1 0 0 0.00
Corporates0.00 to <0.15 AAA to BBB+ 0.08 0.10 0.4 4.3 1 0 0.780.15 to <0.25 BBB+ to BBB 0.18 0.21 2.2 2.1 5 2 0.250.25 to <0.50 BBB to BBB- 0.33 0.38 2.5 2.7 3 1 0.180.50 to <0.75 BBB- to BB+ 0.56 0.69 1.5 1.2 0 0 0.090.75 to <2.50 BB+ to BB- 1.02 1.36 0.6 0.7 1 0 0.812.50 to <10.00 BB- to B- 5.02 5.30 <0.1 0.1 2 1 3.0410.00 to <100.00 B- to CCC- 14.54 19.16 0.1 0.1 2 0 1.14100.00 (Default) CCC- to D 100.00 100.00 0.1 0.1 0 0 0.00Sub-total N/M 1.42 1.68 7.4 11.2 14 4 0.38
of which:SMEs0.00 to <0.15 AAA to BBB+ 0.00 0.00 0 0 0 0 0.000.15 to <0.25 BBB+ to BBB 0.20 0.21 0.1 0.1 0 0 0.000.25 to <0.50 BBB to BBB- 0.33 0.38 <0.1 <0.1 0 0 0.380.50 to <0.75 BBB- to BB+ 0.62 0.69 <0.1 <0.1 0 0 0.430.75 to <2.50 BB+ to BB- 1.33 1.43 <0.1 <0.1 0 0 3.502.50 to <10.00 BB- to B- 3.78 4.77 <0.1 <0.1 1 0 10.1110.00 to <100.00 B- to CCC- 15.26 18.68 <0.1 <0.1 0 0 1.09100.00 (Default) CCC- to D 100.00 100.00 <0.1 <0.1 0 0 0.00Sub-total N/M 0.61 2.44 0.2 0.2 1 0 1.31Specialized lending0.00 to <0.15 AAA to BBB+ 0.00 0.00 0 0 0 0 0.000.15 to <0.25 BBB+ to BBB 0.00 0.00 0 0 0 0 0.000.25 to <0.50 BBB to BBB- 0.00 0.00 0 0 0 0 0.000.50 to <0.75 BBB- to BB+ 0.00 0.00 0 0 0 0 0.000.75 to <2.50 BB+ to BB- 0.00 0.00 0 0 0 0 0.002.50 to <10.00 BB- to B- 0.00 0.00 0 0 0 0 0.0010.00 to <100.00 B- to CCC- 0.00 0.00 0 0 0 0 0.00100.00 (Default) CCC- to D 0.00 0.00 0 0 0 0 0.00Sub-total N/M 0.00 0.00 0 0 0 0 0.00Other0.00 to <0.15 AAA to BBB+ 0.08 0.10 0.4 4.3 1 0 0.780.15 to <0.25 BBB+ to BBB 0.18 0.21 2.2 2.0 5 2 0.260.25 to <0.50 BBB to BBB- 0.33 0.38 2.4 2.7 3 1 0.180.50 to <0.75 BBB- to BB+ 0.56 0.69 1.5 1.2 0 0 0.080.75 to <2.50 BB+ to BB- 1.01 1.36 0.6 0.7 1 0 0.592.50 to <10.00 BB- to B- 5.03 5.41 <0.1 0.1 1 1 1.7810.00 to <100.00 B- to CCC- 14.50 19.15 0.1 0.1 2 0 1.04100.00 (Default) CCC- to D 100.00 100.00 0.1 0.1 0 0 0.00Sub-total N/M 1.42 1.66 7.2 11.1 13 4 0.33
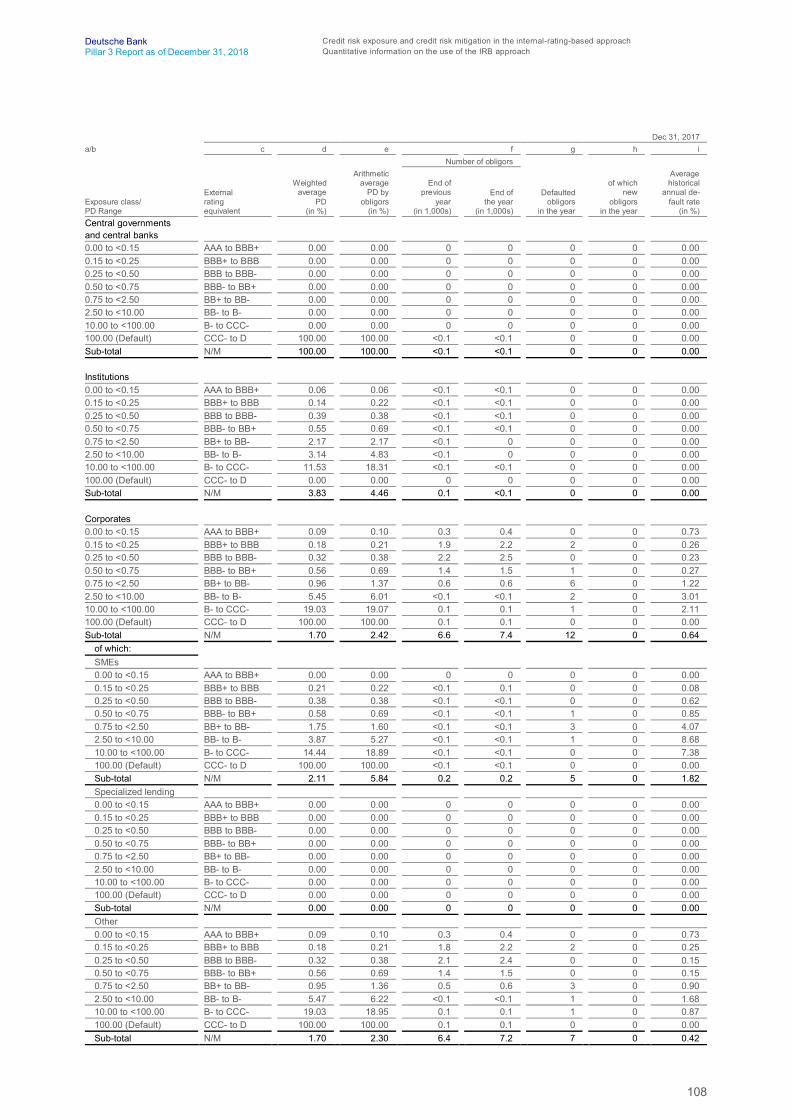
108
Deutsche Bank Credit risk exposure and credit risk mitigation in the internal-rating-based approachPillar 3 Report as of December 31, 2018 Quantitative information on the use of the IRB approach
Dec 31, 2017a/b c d e f g h i
Number of obligors
Exposure class/PD Range
Externalratingequivalent
Weightedaverage
PD(in %)
Arithmeticaverage
PD byobligors
(in %)
End ofprevious
year(in 1,000s)
End ofthe year
(in 1,000s)
Defaultedobligors
in the year
of whichnew
obligorsin the year
Averagehistorical
annual de-fault rate
(in %)Central governmentsand central banks0.00 to <0.15 AAA to BBB+ 0.00 0.00 0 0 0 0 0.000.15 to <0.25 BBB+ to BBB 0.00 0.00 0 0 0 0 0.000.25 to <0.50 BBB to BBB- 0.00 0.00 0 0 0 0 0.000.50 to <0.75 BBB- to BB+ 0.00 0.00 0 0 0 0 0.000.75 to <2.50 BB+ to BB- 0.00 0.00 0 0 0 0 0.002.50 to <10.00 BB- to B- 0.00 0.00 0 0 0 0 0.0010.00 to <100.00 B- to CCC- 0.00 0.00 0 0 0 0 0.00100.00 (Default) CCC- to D 100.00 100.00 <0.1 <0.1 0 0 0.00Sub-total N/M 100.00 100.00 <0.1 <0.1 0 0 0.00
Institutions0.00 to <0.15 AAA to BBB+ 0.06 0.06 <0.1 <0.1 0 0 0.000.15 to <0.25 BBB+ to BBB 0.14 0.22 <0.1 <0.1 0 0 0.000.25 to <0.50 BBB to BBB- 0.39 0.38 <0.1 <0.1 0 0 0.000.50 to <0.75 BBB- to BB+ 0.55 0.69 <0.1 <0.1 0 0 0.000.75 to <2.50 BB+ to BB- 2.17 2.17 <0.1 0 0 0 0.002.50 to <10.00 BB- to B- 3.14 4.83 <0.1 0 0 0 0.0010.00 to <100.00 B- to CCC- 11.53 18.31 <0.1 <0.1 0 0 0.00100.00 (Default) CCC- to D 0.00 0.00 0 0 0 0 0.00Sub-total N/M 3.83 4.46 0.1 <0.1 0 0 0.00
Corporates0.00 to <0.15 AAA to BBB+ 0.09 0.10 0.3 0.4 0 0 0.730.15 to <0.25 BBB+ to BBB 0.18 0.21 1.9 2.2 2 0 0.260.25 to <0.50 BBB to BBB- 0.32 0.38 2.2 2.5 0 0 0.230.50 to <0.75 BBB- to BB+ 0.56 0.69 1.4 1.5 1 0 0.270.75 to <2.50 BB+ to BB- 0.96 1.37 0.6 0.6 6 0 1.222.50 to <10.00 BB- to B- 5.45 6.01 <0.1 <0.1 2 0 3.0110.00 to <100.00 B- to CCC- 19.03 19.07 0.1 0.1 1 0 2.11100.00 (Default) CCC- to D 100.00 100.00 0.1 0.1 0 0 0.00Sub-total N/M 1.70 2.42 6.6 7.4 12 0 0.64
of which:SMEs0.00 to <0.15 AAA to BBB+ 0.00 0.00 0 0 0 0 0.000.15 to <0.25 BBB+ to BBB 0.21 0.22 <0.1 0.1 0 0 0.080.25 to <0.50 BBB to BBB- 0.38 0.38 <0.1 <0.1 0 0 0.620.50 to <0.75 BBB- to BB+ 0.58 0.69 <0.1 <0.1 1 0 0.850.75 to <2.50 BB+ to BB- 1.75 1.60 <0.1 <0.1 3 0 4.072.50 to <10.00 BB- to B- 3.87 5.27 <0.1 <0.1 1 0 8.6810.00 to <100.00 B- to CCC- 14.44 18.89 <0.1 <0.1 0 0 7.38100.00 (Default) CCC- to D 100.00 100.00 <0.1 <0.1 0 0 0.00Sub-total N/M 2.11 5.84 0.2 0.2 5 0 1.82Specialized lending0.00 to <0.15 AAA to BBB+ 0.00 0.00 0 0 0 0 0.000.15 to <0.25 BBB+ to BBB 0.00 0.00 0 0 0 0 0.000.25 to <0.50 BBB to BBB- 0.00 0.00 0 0 0 0 0.000.50 to <0.75 BBB- to BB+ 0.00 0.00 0 0 0 0 0.000.75 to <2.50 BB+ to BB- 0.00 0.00 0 0 0 0 0.002.50 to <10.00 BB- to B- 0.00 0.00 0 0 0 0 0.0010.00 to <100.00 B- to CCC- 0.00 0.00 0 0 0 0 0.00100.00 (Default) CCC- to D 0.00 0.00 0 0 0 0 0.00Sub-total N/M 0.00 0.00 0 0 0 0 0.00Other0.00 to <0.15 AAA to BBB+ 0.09 0.10 0.3 0.4 0 0 0.730.15 to <0.25 BBB+ to BBB 0.18 0.21 1.8 2.2 2 0 0.250.25 to <0.50 BBB to BBB- 0.32 0.38 2.1 2.4 0 0 0.150.50 to <0.75 BBB- to BB+ 0.56 0.69 1.4 1.5 0 0 0.150.75 to <2.50 BB+ to BB- 0.95 1.36 0.5 0.6 3 0 0.902.50 to <10.00 BB- to B- 5.47 6.22 <0.1 <0.1 1 0 1.6810.00 to <100.00 B- to CCC- 19.03 18.95 0.1 0.1 1 0 0.87100.00 (Default) CCC- to D 100.00 100.00 0.1 0.1 0 0 0.00Sub-total N/M 1.70 2.30 6.4 7.2 7 0 0.42
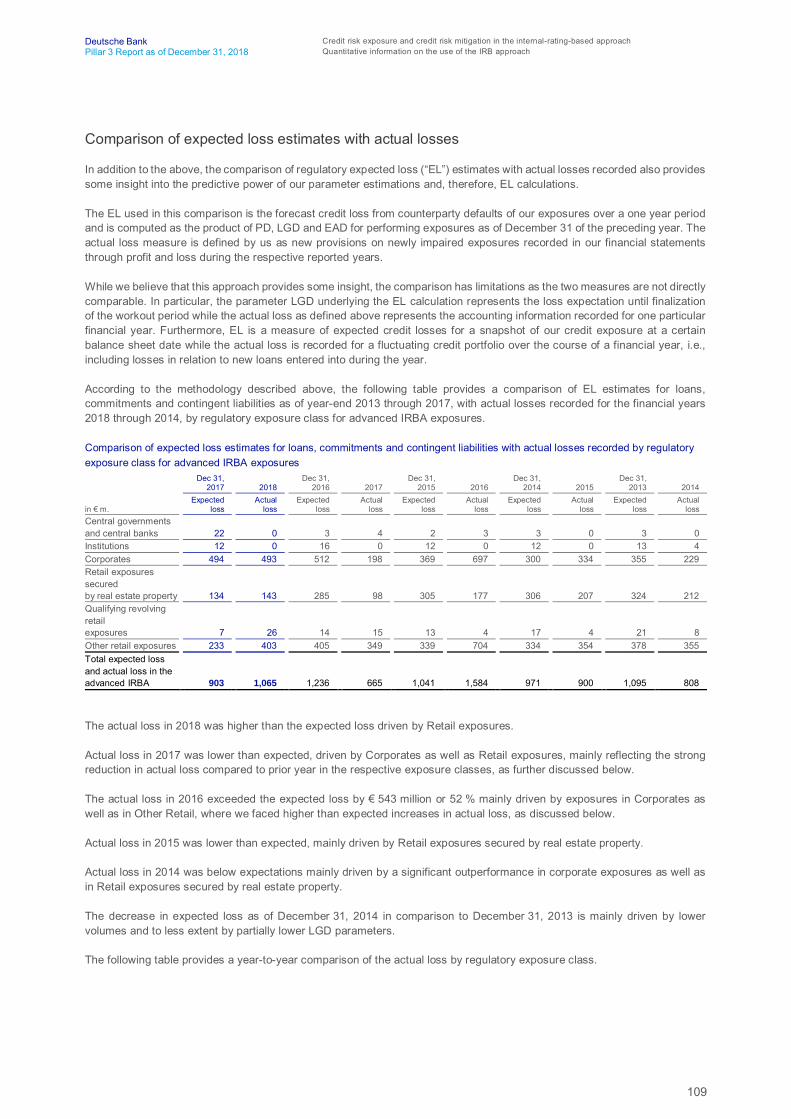
109
Deutsche Bank Credit risk exposure and credit risk mitigation in the internal-rating-based approachPillar 3 Report as of December 31, 2018 Quantitative information on the use of the IRB approach
Comparison of expected loss estimates with actual losses
In addition to the above, the comparison of regulatory expected loss (“EL”) estimates with actual losses recorded also providessome insight into the predictive power of our parameter estimations and, therefore, EL calculations.
The EL used in this comparison is the forecast credit loss from counterparty defaults of our exposures over a one year periodand is computed as the product of PD, LGD and EAD for performing exposures as of December 31 of the preceding year. Theactual loss measure is defined by us as new provisions on newly impaired exposures recorded in our financial statementsthrough profit and loss during the respective reported years.
While we believe that this approach provides some insight, the comparison has limitations as the two measures are not directlycomparable. In particular, the parameter LGD underlying the EL calculation represents the loss expectation until finalizationof the workout period while the actual loss as defined above represents the accounting information recorded for one particularfinancial year. Furthermore, EL is a measure of expected credit losses for a snapshot of our credit exposure at a certainbalance sheet date while the actual loss is recorded for a fluctuating credit portfolio over the course of a financial year, i.e.,including losses in relation to new loans entered into during the year.
According to the methodology described above, the following table provides a comparison of EL estimates for loans,commitments and contingent liabilities as of year-end 2013 through 2017, with actual losses recorded for the financial years2018 through 2014, by regulatory exposure class for advanced IRBA exposures.
Comparison of expected loss estimates for loans, commitments and contingent liabilities with actual losses recorded by regulatoryexposure class for advanced IRBA exposures
Dec 31,2017 2018
Dec 31,2016 2017
Dec 31, 2015 2016
Dec 31,2014 2015
Dec 31, 2013 2014
in € m.Expected
lossActual
lossExpected
lossActual
lossExpected
lossActual
lossExpected
lossActual
lossExpected
lossActual
lossCentral governmentsand central banks 22 0 3 4 2 3 3 0 3 0Institutions 12 0 16 0 12 0 12 0 13 4Corporates 494 493 512 198 369 697 300 334 355 229Retail exposuressecuredby real estate property 134 143 285 98 305 177 306 207 324 212Qualifying revolvingretailexposures 7 26 14 15 13 4 17 4 21 8Other retail exposures 233 403 405 349 339 704 334 354 378 355Total expected lossand actual loss in theadvanced IRBA 903 1,065 1,236 665 1,041 1,584 971 900 1,095 808
The actual loss in 2018 was higher than the expected loss driven by Retail exposures.
Actual loss in 2017 was lower than expected, driven by Corporates as well as Retail exposures, mainly reflecting the strongreduction in actual loss compared to prior year in the respective exposure classes, as further discussed below.
The actual loss in 2016 exceeded the expected loss by € 543 million or 52 % mainly driven by exposures in Corporates aswell as in Other Retail, where we faced higher than expected increases in actual loss, as discussed below.
Actual loss in 2015 was lower than expected, mainly driven by Retail exposures secured by real estate property.
Actual loss in 2014 was below expectations mainly driven by a significant outperformance in corporate exposures as well asin Retail exposures secured by real estate property.
The decrease in expected loss as of December 31, 2014 in comparison to December 31, 2013 is mainly driven by lowervolumes and to less extent by partially lower LGD parameters.
The following table provides a year-to-year comparison of the actual loss by regulatory exposure class.
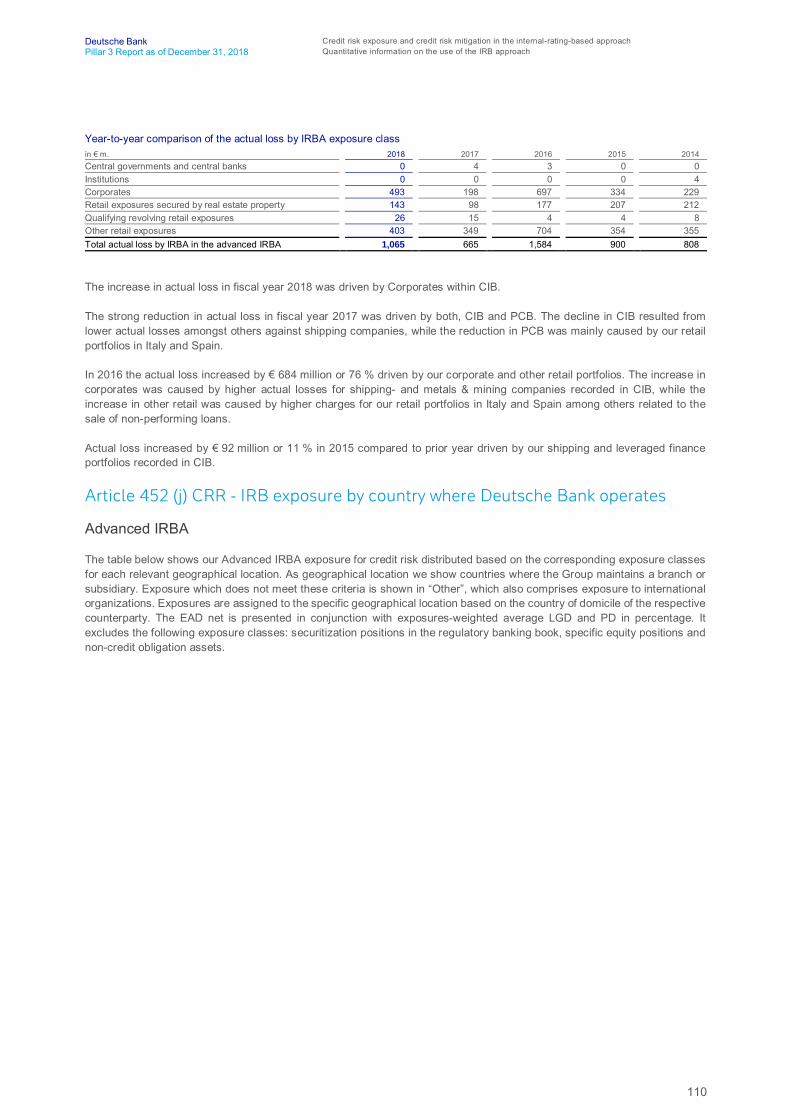
110
Deutsche Bank Credit risk exposure and credit risk mitigation in the internal-rating-based approachPillar 3 Report as of December 31, 2018 Quantitative information on the use of the IRB approach
Year-to-year comparison of the actual loss by IRBA exposure classin € m. 2018 2017 2016 2015 2014Central governments and central banks 0 4 3 0 0Institutions 0 0 0 0 4Corporates 493 198 697 334 229Retail exposures secured by real estate property 143 98 177 207 212Qualifying revolving retail exposures 26 15 4 4 8Other retail exposures 403 349 704 354 355Total actual loss by IRBA in the advanced IRBA 1,065 665 1,584 900 808
The increase in actual loss in fiscal year 2018 was driven by Corporates within CIB.
The strong reduction in actual loss in fiscal year 2017 was driven by both, CIB and PCB. The decline in CIB resulted fromlower actual losses amongst others against shipping companies, while the reduction in PCB was mainly caused by our retailportfolios in Italy and Spain.
In 2016 the actual loss increased by € 684 million or 76 % driven by our corporate and other retail portfolios. The increase incorporates was caused by higher actual losses for shipping- and metals & mining companies recorded in CIB, while theincrease in other retail was caused by higher charges for our retail portfolios in Italy and Spain among others related to thesale of non-performing loans.
Actual loss increased by € 92 million or 11 % in 2015 compared to prior year driven by our shipping and leveraged financeportfolios recorded in CIB.
Article 452 (j) CRR - IRB exposure by country where Deutsche Bank operates
Advanced IRBA
The table below shows our Advanced IRBA exposure for credit risk distributed based on the corresponding exposure classesfor each relevant geographical location. As geographical location we show countries where the Group maintains a branch orsubsidiary. Exposure which does not meet these criteria is shown in “Other”, which also comprises exposure to internationalorganizations. Exposures are assigned to the specific geographical location based on the country of domicile of the respectivecounterparty. The EAD net is presented in conjunction with exposures-weighted average LGD and PD in percentage. Itexcludes the following exposure classes: securitization positions in the regulatory banking book, specific equity positions andnon-credit obligation assets.
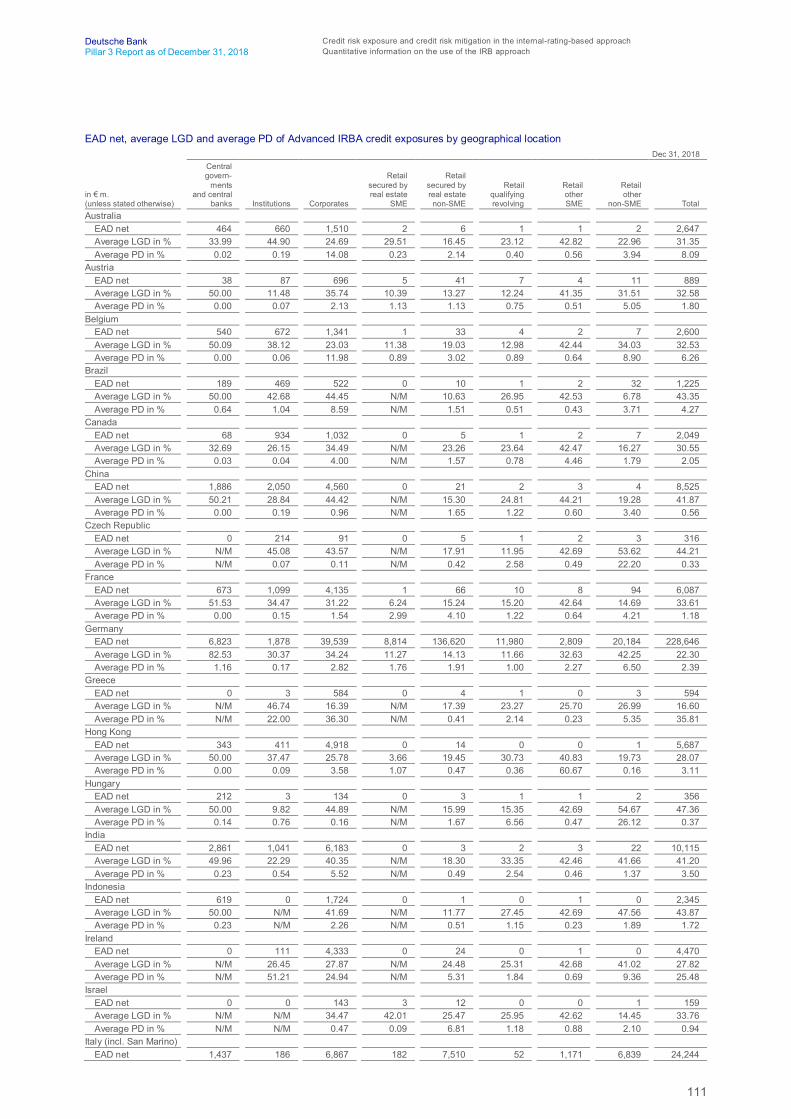
111
Deutsche Bank Credit risk exposure and credit risk mitigation in the internal-rating-based approachPillar 3 Report as of December 31, 2018 Quantitative information on the use of the IRB approach
EAD net, average LGD and average PD of Advanced IRBA credit exposures by geographical locationDec 31, 2018
in € m.(unless stated otherwise)
Centralgovern-
mentsand central
banks Institutions Corporates
Retailsecured byreal estate
SME
Retailsecured byreal estatenon-SME
Retailqualifyingrevolving
RetailotherSME
Retailother
non-SME TotalAustralia
EAD net 464 660 1,510 2 6 1 1 2 2,647Average LGD in % 33.99 44.90 24.69 29.51 16.45 23.12 42.82 22.96 31.35Average PD in % 0.02 0.19 14.08 0.23 2.14 0.40 0.56 3.94 8.09
AustriaEAD net 38 87 696 5 41 7 4 11 889Average LGD in % 50.00 11.48 35.74 10.39 13.27 12.24 41.35 31.51 32.58Average PD in % 0.00 0.07 2.13 1.13 1.13 0.75 0.51 5.05 1.80
BelgiumEAD net 540 672 1,341 1 33 4 2 7 2,600Average LGD in % 50.09 38.12 23.03 11.38 19.03 12.98 42.44 34.03 32.53Average PD in % 0.00 0.06 11.98 0.89 3.02 0.89 0.64 8.90 6.26
BrazilEAD net 189 469 522 0 10 1 2 32 1,225Average LGD in % 50.00 42.68 44.45 N/M 10.63 26.95 42.53 6.78 43.35Average PD in % 0.64 1.04 8.59 N/M 1.51 0.51 0.43 3.71 4.27
CanadaEAD net 68 934 1,032 0 5 1 2 7 2,049Average LGD in % 32.69 26.15 34.49 N/M 23.26 23.64 42.47 16.27 30.55Average PD in % 0.03 0.04 4.00 N/M 1.57 0.78 4.46 1.79 2.05
ChinaEAD net 1,886 2,050 4,560 0 21 2 3 4 8,525Average LGD in % 50.21 28.84 44.42 N/M 15.30 24.81 44.21 19.28 41.87Average PD in % 0.00 0.19 0.96 N/M 1.65 1.22 0.60 3.40 0.56
Czech RepublicEAD net 0 214 91 0 5 1 2 3 316Average LGD in % N/M 45.08 43.57 N/M 17.91 11.95 42.69 53.62 44.21Average PD in % N/M 0.07 0.11 N/M 0.42 2.58 0.49 22.20 0.33
FranceEAD net 673 1,099 4,135 1 66 10 8 94 6,087Average LGD in % 51.53 34.47 31.22 6.24 15.24 15.20 42.64 14.69 33.61Average PD in % 0.00 0.15 1.54 2.99 4.10 1.22 0.64 4.21 1.18
GermanyEAD net 6,823 1,878 39,539 8,814 136,620 11,980 2,809 20,184 228,646Average LGD in % 82.53 30.37 34.24 11.27 14.13 11.66 32.63 42.25 22.30Average PD in % 1.16 0.17 2.82 1.76 1.91 1.00 2.27 6.50 2.39
GreeceEAD net 0 3 584 0 4 1 0 3 594Average LGD in % N/M 46.74 16.39 N/M 17.39 23.27 25.70 26.99 16.60Average PD in % N/M 22.00 36.30 N/M 0.41 2.14 0.23 5.35 35.81
Hong KongEAD net 343 411 4,918 0 14 0 0 1 5,687Average LGD in % 50.00 37.47 25.78 3.66 19.45 30.73 40.83 19.73 28.07Average PD in % 0.00 0.09 3.58 1.07 0.47 0.36 60.67 0.16 3.11
HungaryEAD net 212 3 134 0 3 1 1 2 356Average LGD in % 50.00 9.82 44.89 N/M 15.99 15.35 42.69 54.67 47.36Average PD in % 0.14 0.76 0.16 N/M 1.67 6.56 0.47 26.12 0.37
IndiaEAD net 2,861 1,041 6,183 0 3 2 3 22 10,115Average LGD in % 49.96 22.29 40.35 N/M 18.30 33.35 42.46 41.66 41.20Average PD in % 0.23 0.54 5.52 N/M 0.49 2.54 0.46 1.37 3.50
IndonesiaEAD net 619 0 1,724 0 1 0 1 0 2,345Average LGD in % 50.00 N/M 41.69 N/M 11.77 27.45 42.69 47.56 43.87Average PD in % 0.23 N/M 2.26 N/M 0.51 1.15 0.23 1.89 1.72
IrelandEAD net 0 111 4,333 0 24 0 1 0 4,470Average LGD in % N/M 26.45 27.87 N/M 24.48 25.31 42.68 41.02 27.82Average PD in % N/M 51.21 24.94 N/M 5.31 1.84 0.69 9.36 25.48
IsraelEAD net 0 0 143 3 12 0 0 1 159Average LGD in % N/M N/M 34.47 42.01 25.47 25.95 42.62 14.45 33.76Average PD in % N/M N/M 0.47 0.09 6.81 1.18 0.88 2.10 0.94
Italy (incl. San Marino)EAD net 1,437 186 6,867 182 7,510 52 1,171 6,839 24,244
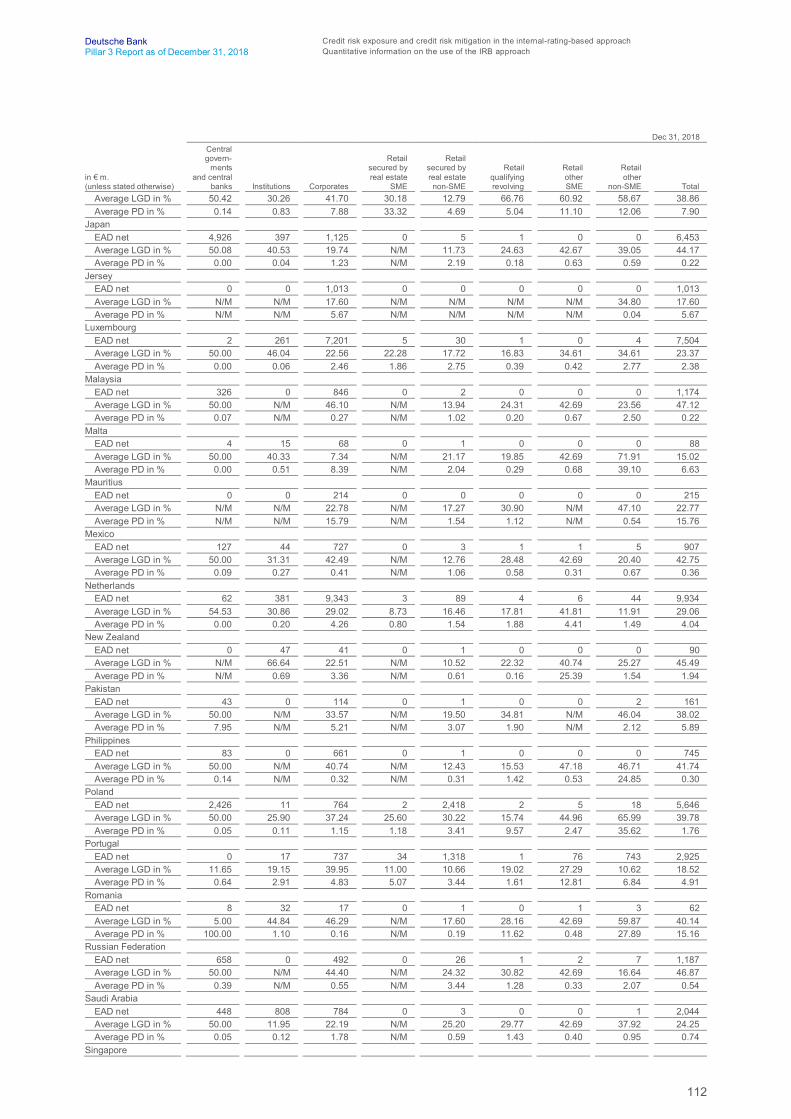
112
Deutsche Bank Credit risk exposure and credit risk mitigation in the internal-rating-based approachPillar 3 Report as of December 31, 2018 Quantitative information on the use of the IRB approach
Dec 31, 2018
in € m.(unless stated otherwise)
Centralgovern-
mentsand central
banks Institutions Corporates
Retailsecured byreal estate
SME
Retailsecured byreal estatenon-SME
Retailqualifyingrevolving
RetailotherSME
Retailother
non-SME TotalAverage LGD in % 50.42 30.26 41.70 30.18 12.79 66.76 60.92 58.67 38.86Average PD in % 0.14 0.83 7.88 33.32 4.69 5.04 11.10 12.06 7.90
JapanEAD net 4,926 397 1,125 0 5 1 0 0 6,453Average LGD in % 50.08 40.53 19.74 N/M 11.73 24.63 42.67 39.05 44.17Average PD in % 0.00 0.04 1.23 N/M 2.19 0.18 0.63 0.59 0.22
JerseyEAD net 0 0 1,013 0 0 0 0 0 1,013Average LGD in % N/M N/M 17.60 N/M N/M N/M N/M 34.80 17.60Average PD in % N/M N/M 5.67 N/M N/M N/M N/M 0.04 5.67
LuxembourgEAD net 2 261 7,201 5 30 1 0 4 7,504Average LGD in % 50.00 46.04 22.56 22.28 17.72 16.83 34.61 34.61 23.37Average PD in % 0.00 0.06 2.46 1.86 2.75 0.39 0.42 2.77 2.38
MalaysiaEAD net 326 0 846 0 2 0 0 0 1,174Average LGD in % 50.00 N/M 46.10 N/M 13.94 24.31 42.69 23.56 47.12Average PD in % 0.07 N/M 0.27 N/M 1.02 0.20 0.67 2.50 0.22
MaltaEAD net 4 15 68 0 1 0 0 0 88Average LGD in % 50.00 40.33 7.34 N/M 21.17 19.85 42.69 71.91 15.02Average PD in % 0.00 0.51 8.39 N/M 2.04 0.29 0.68 39.10 6.63
MauritiusEAD net 0 0 214 0 0 0 0 0 215Average LGD in % N/M N/M 22.78 N/M 17.27 30.90 N/M 47.10 22.77Average PD in % N/M N/M 15.79 N/M 1.54 1.12 N/M 0.54 15.76
MexicoEAD net 127 44 727 0 3 1 1 5 907Average LGD in % 50.00 31.31 42.49 N/M 12.76 28.48 42.69 20.40 42.75Average PD in % 0.09 0.27 0.41 N/M 1.06 0.58 0.31 0.67 0.36
NetherlandsEAD net 62 381 9,343 3 89 4 6 44 9,934Average LGD in % 54.53 30.86 29.02 8.73 16.46 17.81 41.81 11.91 29.06Average PD in % 0.00 0.20 4.26 0.80 1.54 1.88 4.41 1.49 4.04
New ZealandEAD net 0 47 41 0 1 0 0 0 90Average LGD in % N/M 66.64 22.51 N/M 10.52 22.32 40.74 25.27 45.49Average PD in % N/M 0.69 3.36 N/M 0.61 0.16 25.39 1.54 1.94
PakistanEAD net 43 0 114 0 1 0 0 2 161Average LGD in % 50.00 N/M 33.57 N/M 19.50 34.81 N/M 46.04 38.02Average PD in % 7.95 N/M 5.21 N/M 3.07 1.90 N/M 2.12 5.89
PhilippinesEAD net 83 0 661 0 1 0 0 0 745Average LGD in % 50.00 N/M 40.74 N/M 12.43 15.53 47.18 46.71 41.74Average PD in % 0.14 N/M 0.32 N/M 0.31 1.42 0.53 24.85 0.30
PolandEAD net 2,426 11 764 2 2,418 2 5 18 5,646Average LGD in % 50.00 25.90 37.24 25.60 30.22 15.74 44.96 65.99 39.78Average PD in % 0.05 0.11 1.15 1.18 3.41 9.57 2.47 35.62 1.76
PortugalEAD net 0 17 737 34 1,318 1 76 743 2,925Average LGD in % 11.65 19.15 39.95 11.00 10.66 19.02 27.29 10.62 18.52Average PD in % 0.64 2.91 4.83 5.07 3.44 1.61 12.81 6.84 4.91
RomaniaEAD net 8 32 17 0 1 0 1 3 62Average LGD in % 5.00 44.84 46.29 N/M 17.60 28.16 42.69 59.87 40.14Average PD in % 100.00 1.10 0.16 N/M 0.19 11.62 0.48 27.89 15.16
Russian FederationEAD net 658 0 492 0 26 1 2 7 1,187Average LGD in % 50.00 N/M 44.40 N/M 24.32 30.82 42.69 16.64 46.87Average PD in % 0.39 N/M 0.55 N/M 3.44 1.28 0.33 2.07 0.54
Saudi ArabiaEAD net 448 808 784 0 3 0 0 1 2,044Average LGD in % 50.00 11.95 22.19 N/M 25.20 29.77 42.69 37.92 24.25Average PD in % 0.05 0.12 1.78 N/M 0.59 1.43 0.40 0.95 0.74
Singapore
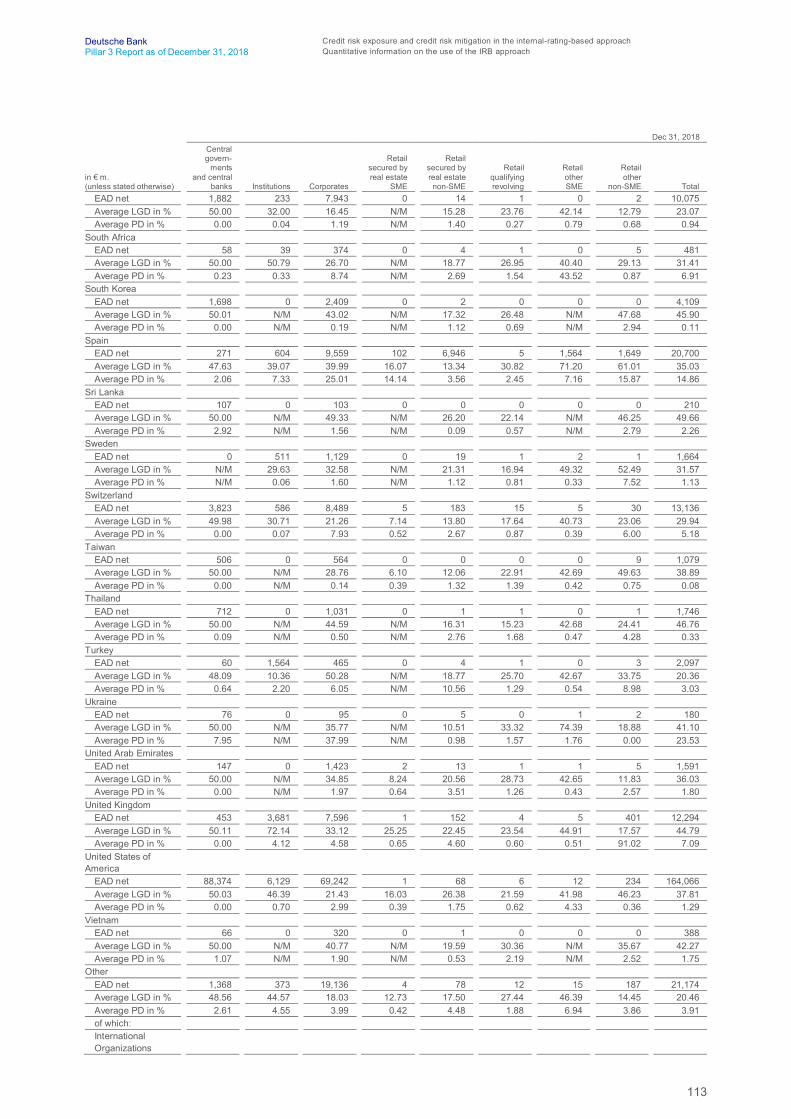
113
Deutsche Bank Credit risk exposure and credit risk mitigation in the internal-rating-based approachPillar 3 Report as of December 31, 2018 Quantitative information on the use of the IRB approach
Dec 31, 2018
in € m.(unless stated otherwise)
Centralgovern-
mentsand central
banks Institutions Corporates
Retailsecured byreal estate
SME
Retailsecured byreal estatenon-SME
Retailqualifyingrevolving
RetailotherSME
Retailother
non-SME TotalEAD net 1,882 233 7,943 0 14 1 0 2 10,075Average LGD in % 50.00 32.00 16.45 N/M 15.28 23.76 42.14 12.79 23.07Average PD in % 0.00 0.04 1.19 N/M 1.40 0.27 0.79 0.68 0.94
South AfricaEAD net 58 39 374 0 4 1 0 5 481Average LGD in % 50.00 50.79 26.70 N/M 18.77 26.95 40.40 29.13 31.41Average PD in % 0.23 0.33 8.74 N/M 2.69 1.54 43.52 0.87 6.91
South KoreaEAD net 1,698 0 2,409 0 2 0 0 0 4,109Average LGD in % 50.01 N/M 43.02 N/M 17.32 26.48 N/M 47.68 45.90Average PD in % 0.00 N/M 0.19 N/M 1.12 0.69 N/M 2.94 0.11
SpainEAD net 271 604 9,559 102 6,946 5 1,564 1,649 20,700Average LGD in % 47.63 39.07 39.99 16.07 13.34 30.82 71.20 61.01 35.03Average PD in % 2.06 7.33 25.01 14.14 3.56 2.45 7.16 15.87 14.86
Sri LankaEAD net 107 0 103 0 0 0 0 0 210Average LGD in % 50.00 N/M 49.33 N/M 26.20 22.14 N/M 46.25 49.66Average PD in % 2.92 N/M 1.56 N/M 0.09 0.57 N/M 2.79 2.26
SwedenEAD net 0 511 1,129 0 19 1 2 1 1,664Average LGD in % N/M 29.63 32.58 N/M 21.31 16.94 49.32 52.49 31.57Average PD in % N/M 0.06 1.60 N/M 1.12 0.81 0.33 7.52 1.13
SwitzerlandEAD net 3,823 586 8,489 5 183 15 5 30 13,136Average LGD in % 49.98 30.71 21.26 7.14 13.80 17.64 40.73 23.06 29.94Average PD in % 0.00 0.07 7.93 0.52 2.67 0.87 0.39 6.00 5.18
TaiwanEAD net 506 0 564 0 0 0 0 9 1,079Average LGD in % 50.00 N/M 28.76 6.10 12.06 22.91 42.69 49.63 38.89Average PD in % 0.00 N/M 0.14 0.39 1.32 1.39 0.42 0.75 0.08
ThailandEAD net 712 0 1,031 0 1 1 0 1 1,746Average LGD in % 50.00 N/M 44.59 N/M 16.31 15.23 42.68 24.41 46.76Average PD in % 0.09 N/M 0.50 N/M 2.76 1.68 0.47 4.28 0.33
TurkeyEAD net 60 1,564 465 0 4 1 0 3 2,097Average LGD in % 48.09 10.36 50.28 N/M 18.77 25.70 42.67 33.75 20.36Average PD in % 0.64 2.20 6.05 N/M 10.56 1.29 0.54 8.98 3.03
UkraineEAD net 76 0 95 0 5 0 1 2 180Average LGD in % 50.00 N/M 35.77 N/M 10.51 33.32 74.39 18.88 41.10Average PD in % 7.95 N/M 37.99 N/M 0.98 1.57 1.76 0.00 23.53
United Arab EmiratesEAD net 147 0 1,423 2 13 1 1 5 1,591Average LGD in % 50.00 N/M 34.85 8.24 20.56 28.73 42.65 11.83 36.03Average PD in % 0.00 N/M 1.97 0.64 3.51 1.26 0.43 2.57 1.80
United KingdomEAD net 453 3,681 7,596 1 152 4 5 401 12,294Average LGD in % 50.11 72.14 33.12 25.25 22.45 23.54 44.91 17.57 44.79Average PD in % 0.00 4.12 4.58 0.65 4.60 0.60 0.51 91.02 7.09
United States ofAmerica
EAD net 88,374 6,129 69,242 1 68 6 12 234 164,066Average LGD in % 50.03 46.39 21.43 16.03 26.38 21.59 41.98 46.23 37.81Average PD in % 0.00 0.70 2.99 0.39 1.75 0.62 4.33 0.36 1.29
VietnamEAD net 66 0 320 0 1 0 0 0 388Average LGD in % 50.00 N/M 40.77 N/M 19.59 30.36 N/M 35.67 42.27Average PD in % 1.07 N/M 1.90 N/M 0.53 2.19 N/M 2.52 1.75
OtherEAD net 1,368 373 19,136 4 78 12 15 187 21,174Average LGD in % 48.56 44.57 18.03 12.73 17.50 27.44 46.39 14.45 20.46Average PD in % 2.61 4.55 3.99 0.42 4.48 1.88 6.94 3.86 3.91of which:InternationalOrganizations
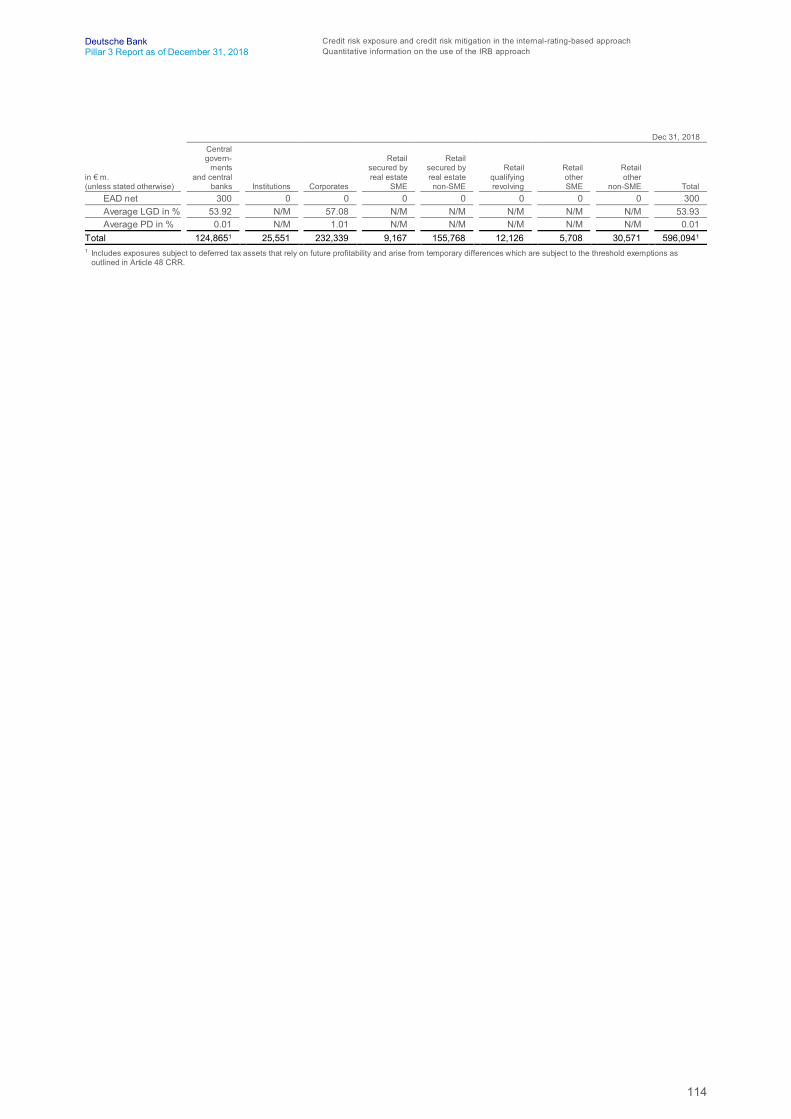
114
Deutsche Bank Credit risk exposure and credit risk mitigation in the internal-rating-based approachPillar 3 Report as of December 31, 2018 Quantitative information on the use of the IRB approach
Dec 31, 2018
in € m.(unless stated otherwise)
Centralgovern-
mentsand central
banks Institutions Corporates
Retailsecured byreal estate
SME
Retailsecured byreal estatenon-SME
Retailqualifyingrevolving
RetailotherSME
Retailother
non-SME TotalEAD net 300 0 0 0 0 0 0 0 300Average LGD in % 53.92 N/M 57.08 N/M N/M N/M N/M N/M 53.93Average PD in % 0.01 N/M 1.01 N/M N/M N/M N/M N/M 0.01
Total 124,8651 25,551 232,339 9,167 155,768 12,126 5,708 30,571 596,0941
1 Includes exposures subject to deferred tax assets that rely on future profitability and arise from temporary differences which are subject to the threshold exemptions asoutlined in Article 48 CRR.
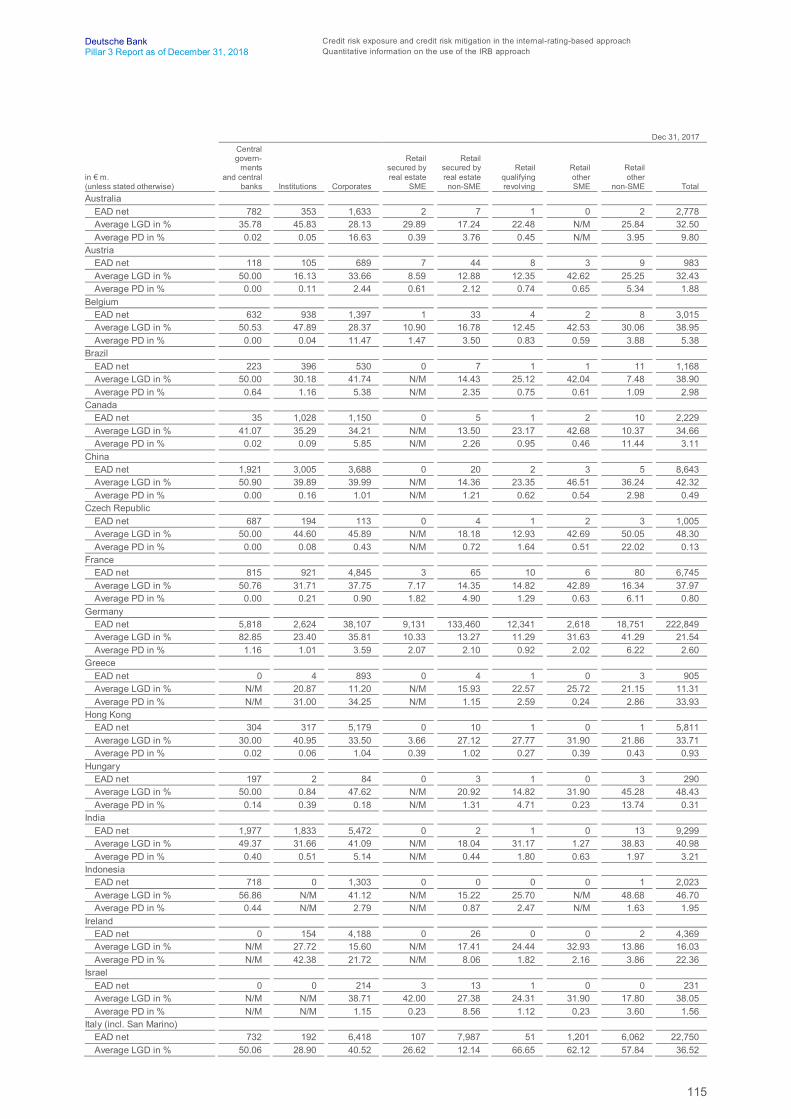
115
Deutsche Bank Credit risk exposure and credit risk mitigation in the internal-rating-based approachPillar 3 Report as of December 31, 2018 Quantitative information on the use of the IRB approach
Dec 31, 2017
in € m.(unless stated otherwise)
Centralgovern-
mentsand central
banks Institutions Corporates
Retailsecured byreal estate
SME
Retailsecured byreal estatenon-SME
Retailqualifyingrevolving
RetailotherSME
Retailother
non-SME TotalAustralia
EAD net 782 353 1,633 2 7 1 0 2 2,778Average LGD in % 35.78 45.83 28.13 29.89 17.24 22.48 N/M 25.84 32.50Average PD in % 0.02 0.05 16.63 0.39 3.76 0.45 N/M 3.95 9.80
AustriaEAD net 118 105 689 7 44 8 3 9 983Average LGD in % 50.00 16.13 33.66 8.59 12.88 12.35 42.62 25.25 32.43Average PD in % 0.00 0.11 2.44 0.61 2.12 0.74 0.65 5.34 1.88
BelgiumEAD net 632 938 1,397 1 33 4 2 8 3,015Average LGD in % 50.53 47.89 28.37 10.90 16.78 12.45 42.53 30.06 38.95Average PD in % 0.00 0.04 11.47 1.47 3.50 0.83 0.59 3.88 5.38
BrazilEAD net 223 396 530 0 7 1 1 11 1,168Average LGD in % 50.00 30.18 41.74 N/M 14.43 25.12 42.04 7.48 38.90Average PD in % 0.64 1.16 5.38 N/M 2.35 0.75 0.61 1.09 2.98
CanadaEAD net 35 1,028 1,150 0 5 1 2 10 2,229Average LGD in % 41.07 35.29 34.21 N/M 13.50 23.17 42.68 10.37 34.66Average PD in % 0.02 0.09 5.85 N/M 2.26 0.95 0.46 11.44 3.11
ChinaEAD net 1,921 3,005 3,688 0 20 2 3 5 8,643Average LGD in % 50.90 39.89 39.99 N/M 14.36 23.35 46.51 36.24 42.32Average PD in % 0.00 0.16 1.01 N/M 1.21 0.62 0.54 2.98 0.49
Czech RepublicEAD net 687 194 113 0 4 1 2 3 1,005Average LGD in % 50.00 44.60 45.89 N/M 18.18 12.93 42.69 50.05 48.30Average PD in % 0.00 0.08 0.43 N/M 0.72 1.64 0.51 22.02 0.13
FranceEAD net 815 921 4,845 3 65 10 6 80 6,745Average LGD in % 50.76 31.71 37.75 7.17 14.35 14.82 42.89 16.34 37.97Average PD in % 0.00 0.21 0.90 1.82 4.90 1.29 0.63 6.11 0.80
GermanyEAD net 5,818 2,624 38,107 9,131 133,460 12,341 2,618 18,751 222,849Average LGD in % 82.85 23.40 35.81 10.33 13.27 11.29 31.63 41.29 21.54Average PD in % 1.16 1.01 3.59 2.07 2.10 0.92 2.02 6.22 2.60
GreeceEAD net 0 4 893 0 4 1 0 3 905Average LGD in % N/M 20.87 11.20 N/M 15.93 22.57 25.72 21.15 11.31Average PD in % N/M 31.00 34.25 N/M 1.15 2.59 0.24 2.86 33.93
Hong KongEAD net 304 317 5,179 0 10 1 0 1 5,811Average LGD in % 30.00 40.95 33.50 3.66 27.12 27.77 31.90 21.86 33.71Average PD in % 0.02 0.06 1.04 0.39 1.02 0.27 0.39 0.43 0.93
HungaryEAD net 197 2 84 0 3 1 0 3 290Average LGD in % 50.00 0.84 47.62 N/M 20.92 14.82 31.90 45.28 48.43Average PD in % 0.14 0.39 0.18 N/M 1.31 4.71 0.23 13.74 0.31
IndiaEAD net 1,977 1,833 5,472 0 2 1 0 13 9,299Average LGD in % 49.37 31.66 41.09 N/M 18.04 31.17 1.27 38.83 40.98Average PD in % 0.40 0.51 5.14 N/M 0.44 1.80 0.63 1.97 3.21
IndonesiaEAD net 718 0 1,303 0 0 0 0 1 2,023Average LGD in % 56.86 N/M 41.12 N/M 15.22 25.70 N/M 48.68 46.70Average PD in % 0.44 N/M 2.79 N/M 0.87 2.47 N/M 1.63 1.95
IrelandEAD net 0 154 4,188 0 26 0 0 2 4,369Average LGD in % N/M 27.72 15.60 N/M 17.41 24.44 32.93 13.86 16.03Average PD in % N/M 42.38 21.72 N/M 8.06 1.82 2.16 3.86 22.36
IsraelEAD net 0 0 214 3 13 1 0 0 231Average LGD in % N/M N/M 38.71 42.00 27.38 24.31 31.90 17.80 38.05Average PD in % N/M N/M 1.15 0.23 8.56 1.12 0.23 3.60 1.56
Italy (incl. San Marino)EAD net 732 192 6,418 107 7,987 51 1,201 6,062 22,750Average LGD in % 50.06 28.90 40.52 26.62 12.14 66.65 62.12 57.84 36.52
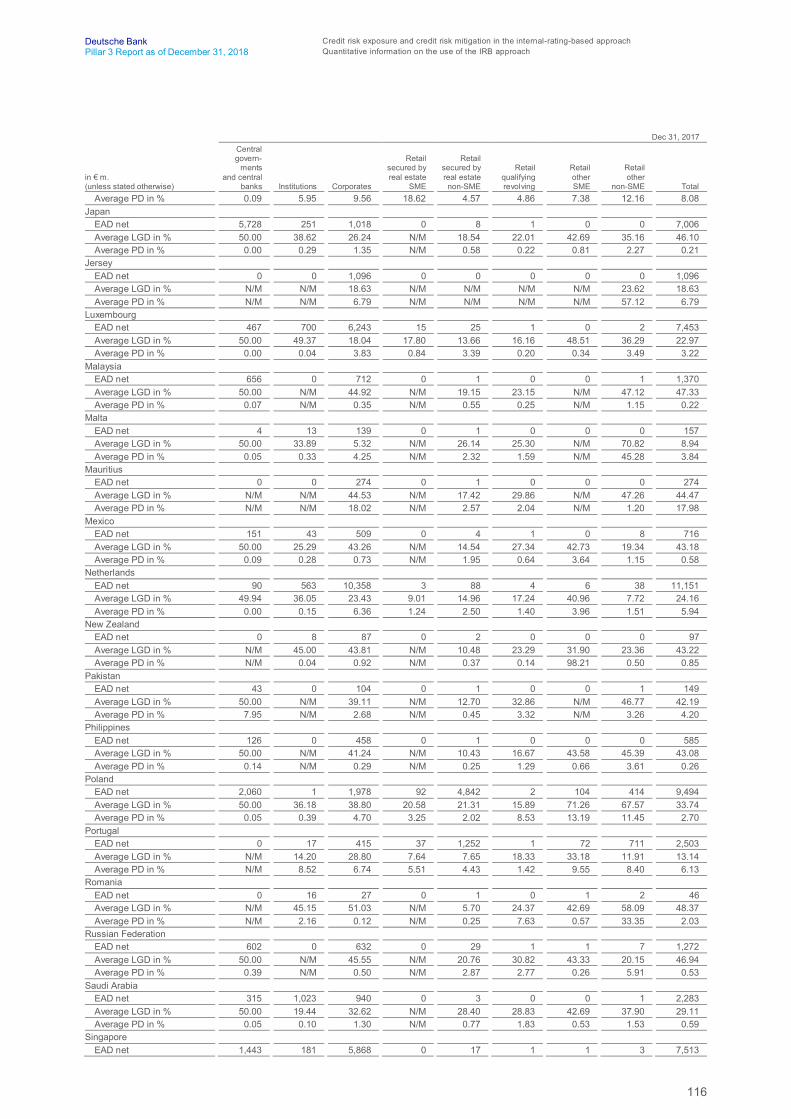
116
Deutsche Bank Credit risk exposure and credit risk mitigation in the internal-rating-based approachPillar 3 Report as of December 31, 2018 Quantitative information on the use of the IRB approach
Dec 31, 2017
in € m.(unless stated otherwise)
Centralgovern-
mentsand central
banks Institutions Corporates
Retailsecured byreal estate
SME
Retailsecured byreal estatenon-SME
Retailqualifyingrevolving
RetailotherSME
Retailother
non-SME TotalAverage PD in % 0.09 5.95 9.56 18.62 4.57 4.86 7.38 12.16 8.08
JapanEAD net 5,728 251 1,018 0 8 1 0 0 7,006Average LGD in % 50.00 38.62 26.24 N/M 18.54 22.01 42.69 35.16 46.10Average PD in % 0.00 0.29 1.35 N/M 0.58 0.22 0.81 2.27 0.21
JerseyEAD net 0 0 1,096 0 0 0 0 0 1,096Average LGD in % N/M N/M 18.63 N/M N/M N/M N/M 23.62 18.63Average PD in % N/M N/M 6.79 N/M N/M N/M N/M 57.12 6.79
LuxembourgEAD net 467 700 6,243 15 25 1 0 2 7,453Average LGD in % 50.00 49.37 18.04 17.80 13.66 16.16 48.51 36.29 22.97Average PD in % 0.00 0.04 3.83 0.84 3.39 0.20 0.34 3.49 3.22
MalaysiaEAD net 656 0 712 0 1 0 0 1 1,370Average LGD in % 50.00 N/M 44.92 N/M 19.15 23.15 N/M 47.12 47.33Average PD in % 0.07 N/M 0.35 N/M 0.55 0.25 N/M 1.15 0.22
MaltaEAD net 4 13 139 0 1 0 0 0 157Average LGD in % 50.00 33.89 5.32 N/M 26.14 25.30 N/M 70.82 8.94Average PD in % 0.05 0.33 4.25 N/M 2.32 1.59 N/M 45.28 3.84
MauritiusEAD net 0 0 274 0 1 0 0 0 274Average LGD in % N/M N/M 44.53 N/M 17.42 29.86 N/M 47.26 44.47Average PD in % N/M N/M 18.02 N/M 2.57 2.04 N/M 1.20 17.98
MexicoEAD net 151 43 509 0 4 1 0 8 716Average LGD in % 50.00 25.29 43.26 N/M 14.54 27.34 42.73 19.34 43.18Average PD in % 0.09 0.28 0.73 N/M 1.95 0.64 3.64 1.15 0.58
NetherlandsEAD net 90 563 10,358 3 88 4 6 38 11,151Average LGD in % 49.94 36.05 23.43 9.01 14.96 17.24 40.96 7.72 24.16Average PD in % 0.00 0.15 6.36 1.24 2.50 1.40 3.96 1.51 5.94
New ZealandEAD net 0 8 87 0 2 0 0 0 97Average LGD in % N/M 45.00 43.81 N/M 10.48 23.29 31.90 23.36 43.22Average PD in % N/M 0.04 0.92 N/M 0.37 0.14 98.21 0.50 0.85
PakistanEAD net 43 0 104 0 1 0 0 1 149Average LGD in % 50.00 N/M 39.11 N/M 12.70 32.86 N/M 46.77 42.19Average PD in % 7.95 N/M 2.68 N/M 0.45 3.32 N/M 3.26 4.20
PhilippinesEAD net 126 0 458 0 1 0 0 0 585Average LGD in % 50.00 N/M 41.24 N/M 10.43 16.67 43.58 45.39 43.08Average PD in % 0.14 N/M 0.29 N/M 0.25 1.29 0.66 3.61 0.26
PolandEAD net 2,060 1 1,978 92 4,842 2 104 414 9,494Average LGD in % 50.00 36.18 38.80 20.58 21.31 15.89 71.26 67.57 33.74Average PD in % 0.05 0.39 4.70 3.25 2.02 8.53 13.19 11.45 2.70
PortugalEAD net 0 17 415 37 1,252 1 72 711 2,503Average LGD in % N/M 14.20 28.80 7.64 7.65 18.33 33.18 11.91 13.14Average PD in % N/M 8.52 6.74 5.51 4.43 1.42 9.55 8.40 6.13
RomaniaEAD net 0 16 27 0 1 0 1 2 46Average LGD in % N/M 45.15 51.03 N/M 5.70 24.37 42.69 58.09 48.37Average PD in % N/M 2.16 0.12 N/M 0.25 7.63 0.57 33.35 2.03
Russian FederationEAD net 602 0 632 0 29 1 1 7 1,272Average LGD in % 50.00 N/M 45.55 N/M 20.76 30.82 43.33 20.15 46.94Average PD in % 0.39 N/M 0.50 N/M 2.87 2.77 0.26 5.91 0.53
Saudi ArabiaEAD net 315 1,023 940 0 3 0 0 1 2,283Average LGD in % 50.00 19.44 32.62 N/M 28.40 28.83 42.69 37.90 29.11Average PD in % 0.05 0.10 1.30 N/M 0.77 1.83 0.53 1.53 0.59
SingaporeEAD net 1,443 181 5,868 0 17 1 1 3 7,513
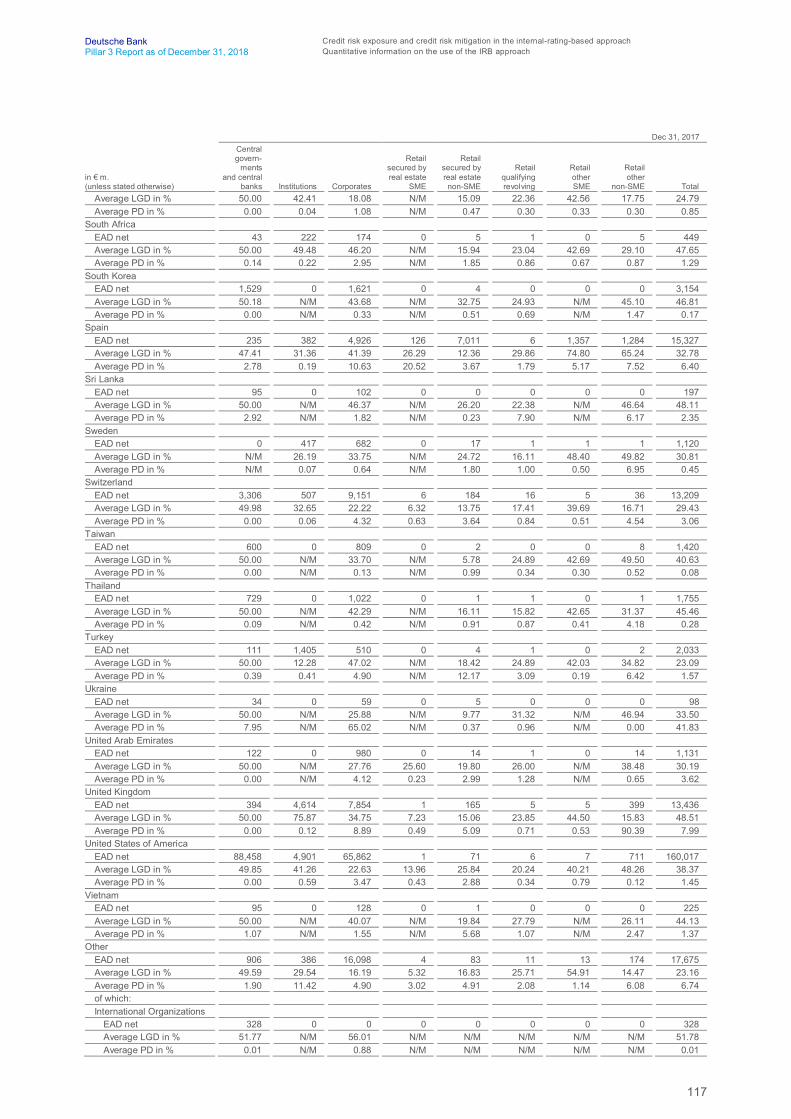
117
Deutsche Bank Credit risk exposure and credit risk mitigation in the internal-rating-based approachPillar 3 Report as of December 31, 2018 Quantitative information on the use of the IRB approach
Dec 31, 2017
in € m.(unless stated otherwise)
Centralgovern-
mentsand central
banks Institutions Corporates
Retailsecured byreal estate
SME
Retailsecured byreal estatenon-SME
Retailqualifyingrevolving
RetailotherSME
Retailother
non-SME TotalAverage LGD in % 50.00 42.41 18.08 N/M 15.09 22.36 42.56 17.75 24.79Average PD in % 0.00 0.04 1.08 N/M 0.47 0.30 0.33 0.30 0.85
South AfricaEAD net 43 222 174 0 5 1 0 5 449Average LGD in % 50.00 49.48 46.20 N/M 15.94 23.04 42.69 29.10 47.65Average PD in % 0.14 0.22 2.95 N/M 1.85 0.86 0.67 0.87 1.29
South KoreaEAD net 1,529 0 1,621 0 4 0 0 0 3,154Average LGD in % 50.18 N/M 43.68 N/M 32.75 24.93 N/M 45.10 46.81Average PD in % 0.00 N/M 0.33 N/M 0.51 0.69 N/M 1.47 0.17
SpainEAD net 235 382 4,926 126 7,011 6 1,357 1,284 15,327Average LGD in % 47.41 31.36 41.39 26.29 12.36 29.86 74.80 65.24 32.78Average PD in % 2.78 0.19 10.63 20.52 3.67 1.79 5.17 7.52 6.40
Sri LankaEAD net 95 0 102 0 0 0 0 0 197Average LGD in % 50.00 N/M 46.37 N/M 26.20 22.38 N/M 46.64 48.11Average PD in % 2.92 N/M 1.82 N/M 0.23 7.90 N/M 6.17 2.35
SwedenEAD net 0 417 682 0 17 1 1 1 1,120Average LGD in % N/M 26.19 33.75 N/M 24.72 16.11 48.40 49.82 30.81Average PD in % N/M 0.07 0.64 N/M 1.80 1.00 0.50 6.95 0.45
SwitzerlandEAD net 3,306 507 9,151 6 184 16 5 36 13,209Average LGD in % 49.98 32.65 22.22 6.32 13.75 17.41 39.69 16.71 29.43Average PD in % 0.00 0.06 4.32 0.63 3.64 0.84 0.51 4.54 3.06
TaiwanEAD net 600 0 809 0 2 0 0 8 1,420Average LGD in % 50.00 N/M 33.70 N/M 5.78 24.89 42.69 49.50 40.63Average PD in % 0.00 N/M 0.13 N/M 0.99 0.34 0.30 0.52 0.08
ThailandEAD net 729 0 1,022 0 1 1 0 1 1,755Average LGD in % 50.00 N/M 42.29 N/M 16.11 15.82 42.65 31.37 45.46Average PD in % 0.09 N/M 0.42 N/M 0.91 0.87 0.41 4.18 0.28
TurkeyEAD net 111 1,405 510 0 4 1 0 2 2,033Average LGD in % 50.00 12.28 47.02 N/M 18.42 24.89 42.03 34.82 23.09Average PD in % 0.39 0.41 4.90 N/M 12.17 3.09 0.19 6.42 1.57
UkraineEAD net 34 0 59 0 5 0 0 0 98Average LGD in % 50.00 N/M 25.88 N/M 9.77 31.32 N/M 46.94 33.50Average PD in % 7.95 N/M 65.02 N/M 0.37 0.96 N/M 0.00 41.83
United Arab EmiratesEAD net 122 0 980 0 14 1 0 14 1,131Average LGD in % 50.00 N/M 27.76 25.60 19.80 26.00 N/M 38.48 30.19Average PD in % 0.00 N/M 4.12 0.23 2.99 1.28 N/M 0.65 3.62
United KingdomEAD net 394 4,614 7,854 1 165 5 5 399 13,436Average LGD in % 50.00 75.87 34.75 7.23 15.06 23.85 44.50 15.83 48.51Average PD in % 0.00 0.12 8.89 0.49 5.09 0.71 0.53 90.39 7.99
United States of AmericaEAD net 88,458 4,901 65,862 1 71 6 7 711 160,017Average LGD in % 49.85 41.26 22.63 13.96 25.84 20.24 40.21 48.26 38.37Average PD in % 0.00 0.59 3.47 0.43 2.88 0.34 0.79 0.12 1.45
VietnamEAD net 95 0 128 0 1 0 0 0 225Average LGD in % 50.00 N/M 40.07 N/M 19.84 27.79 N/M 26.11 44.13Average PD in % 1.07 N/M 1.55 N/M 5.68 1.07 N/M 2.47 1.37
OtherEAD net 906 386 16,098 4 83 11 13 174 17,675Average LGD in % 49.59 29.54 16.19 5.32 16.83 25.71 54.91 14.47 23.16Average PD in % 1.90 11.42 4.90 3.02 4.91 2.08 1.14 6.08 6.74of which:International Organizations
EAD net 328 0 0 0 0 0 0 0 328Average LGD in % 51.77 N/M 56.01 N/M N/M N/M N/M N/M 51.78Average PD in % 0.01 N/M 0.88 N/M N/M N/M N/M N/M 0.01
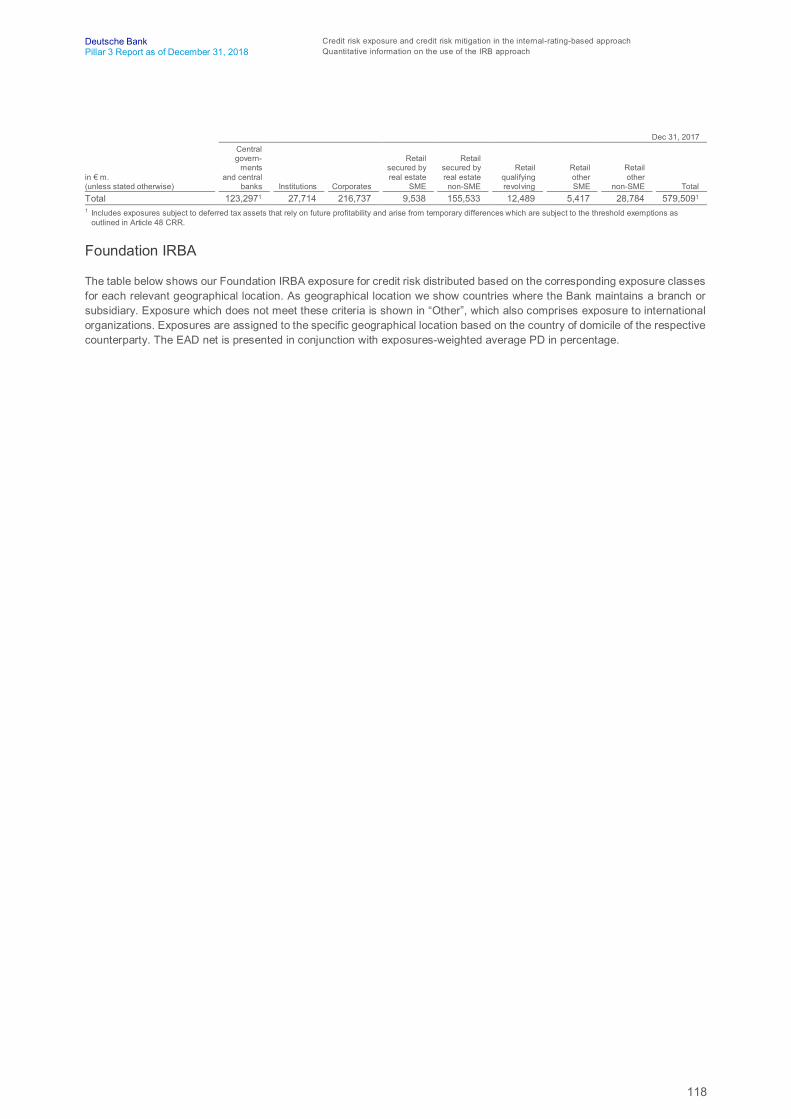
118
Deutsche Bank Credit risk exposure and credit risk mitigation in the internal-rating-based approachPillar 3 Report as of December 31, 2018 Quantitative information on the use of the IRB approach
Dec 31, 2017
in € m.(unless stated otherwise)
Centralgovern-
mentsand central
banks Institutions Corporates
Retailsecured byreal estate
SME
Retailsecured byreal estatenon-SME
Retailqualifyingrevolving
RetailotherSME
Retailother
non-SME TotalTotal 123,2971 27,714 216,737 9,538 155,533 12,489 5,417 28,784 579,5091
1 Includes exposures subject to deferred tax assets that rely on future profitability and arise from temporary differences which are subject to the threshold exemptions asoutlined in Article 48 CRR.
Foundation IRBA
The table below shows our Foundation IRBA exposure for credit risk distributed based on the corresponding exposure classesfor each relevant geographical location. As geographical location we show countries where the Bank maintains a branch orsubsidiary. Exposure which does not meet these criteria is shown in “Other”, which also comprises exposure to internationalorganizations. Exposures are assigned to the specific geographical location based on the country of domicile of the respectivecounterparty. The EAD net is presented in conjunction with exposures-weighted average PD in percentage.
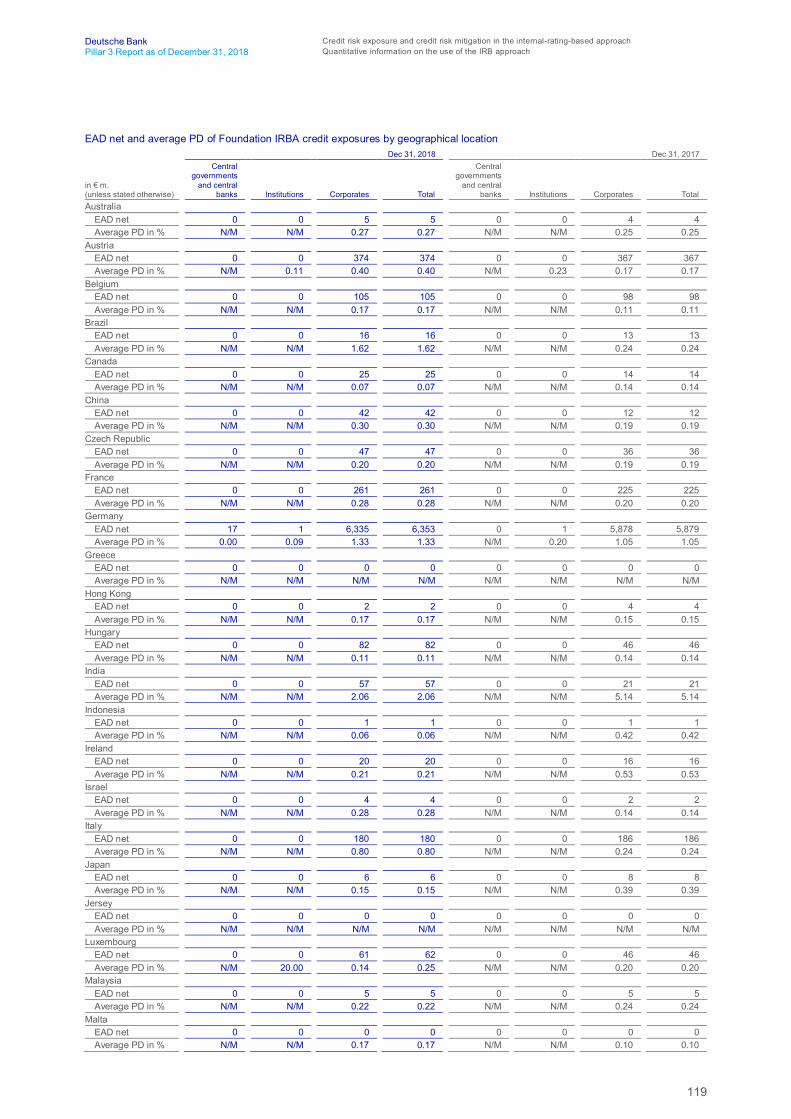
119
Deutsche Bank Credit risk exposure and credit risk mitigation in the internal-rating-based approachPillar 3 Report as of December 31, 2018 Quantitative information on the use of the IRB approach
EAD net and average PD of Foundation IRBA credit exposures by geographical locationDec 31, 2018 Dec 31, 2017
in € m.(unless stated otherwise)
Centralgovernments
and centralbanks Institutions Corporates Total
Centralgovernments
and centralbanks Institutions Corporates Total
AustraliaEAD net 0 0 5 5 0 0 4 4Average PD in % N/M N/M 0.27 0.27 N/M N/M 0.25 0.25
AustriaEAD net 0 0 374 374 0 0 367 367Average PD in % N/M 0.11 0.40 0.40 N/M 0.23 0.17 0.17
BelgiumEAD net 0 0 105 105 0 0 98 98Average PD in % N/M N/M 0.17 0.17 N/M N/M 0.11 0.11
BrazilEAD net 0 0 16 16 0 0 13 13Average PD in % N/M N/M 1.62 1.62 N/M N/M 0.24 0.24
CanadaEAD net 0 0 25 25 0 0 14 14Average PD in % N/M N/M 0.07 0.07 N/M N/M 0.14 0.14
ChinaEAD net 0 0 42 42 0 0 12 12Average PD in % N/M N/M 0.30 0.30 N/M N/M 0.19 0.19
Czech RepublicEAD net 0 0 47 47 0 0 36 36Average PD in % N/M N/M 0.20 0.20 N/M N/M 0.19 0.19
FranceEAD net 0 0 261 261 0 0 225 225Average PD in % N/M N/M 0.28 0.28 N/M N/M 0.20 0.20
GermanyEAD net 17 1 6,335 6,353 0 1 5,878 5,879Average PD in % 0.00 0.09 1.33 1.33 N/M 0.20 1.05 1.05
GreeceEAD net 0 0 0 0 0 0 0 0Average PD in % N/M N/M N/M N/M N/M N/M N/M N/M
Hong KongEAD net 0 0 2 2 0 0 4 4Average PD in % N/M N/M 0.17 0.17 N/M N/M 0.15 0.15
HungaryEAD net 0 0 82 82 0 0 46 46Average PD in % N/M N/M 0.11 0.11 N/M N/M 0.14 0.14
IndiaEAD net 0 0 57 57 0 0 21 21Average PD in % N/M N/M 2.06 2.06 N/M N/M 5.14 5.14
IndonesiaEAD net 0 0 1 1 0 0 1 1Average PD in % N/M N/M 0.06 0.06 N/M N/M 0.42 0.42
IrelandEAD net 0 0 20 20 0 0 16 16Average PD in % N/M N/M 0.21 0.21 N/M N/M 0.53 0.53
IsraelEAD net 0 0 4 4 0 0 2 2Average PD in % N/M N/M 0.28 0.28 N/M N/M 0.14 0.14
ItalyEAD net 0 0 180 180 0 0 186 186Average PD in % N/M N/M 0.80 0.80 N/M N/M 0.24 0.24
JapanEAD net 0 0 6 6 0 0 8 8Average PD in % N/M N/M 0.15 0.15 N/M N/M 0.39 0.39
JerseyEAD net 0 0 0 0 0 0 0 0Average PD in % N/M N/M N/M N/M N/M N/M N/M N/M
LuxembourgEAD net 0 0 61 62 0 0 46 46Average PD in % N/M 20.00 0.14 0.25 N/M N/M 0.20 0.20
MalaysiaEAD net 0 0 5 5 0 0 5 5Average PD in % N/M N/M 0.22 0.22 N/M N/M 0.24 0.24
MaltaEAD net 0 0 0 0 0 0 0 0Average PD in % N/M N/M 0.17 0.17 N/M N/M 0.10 0.10
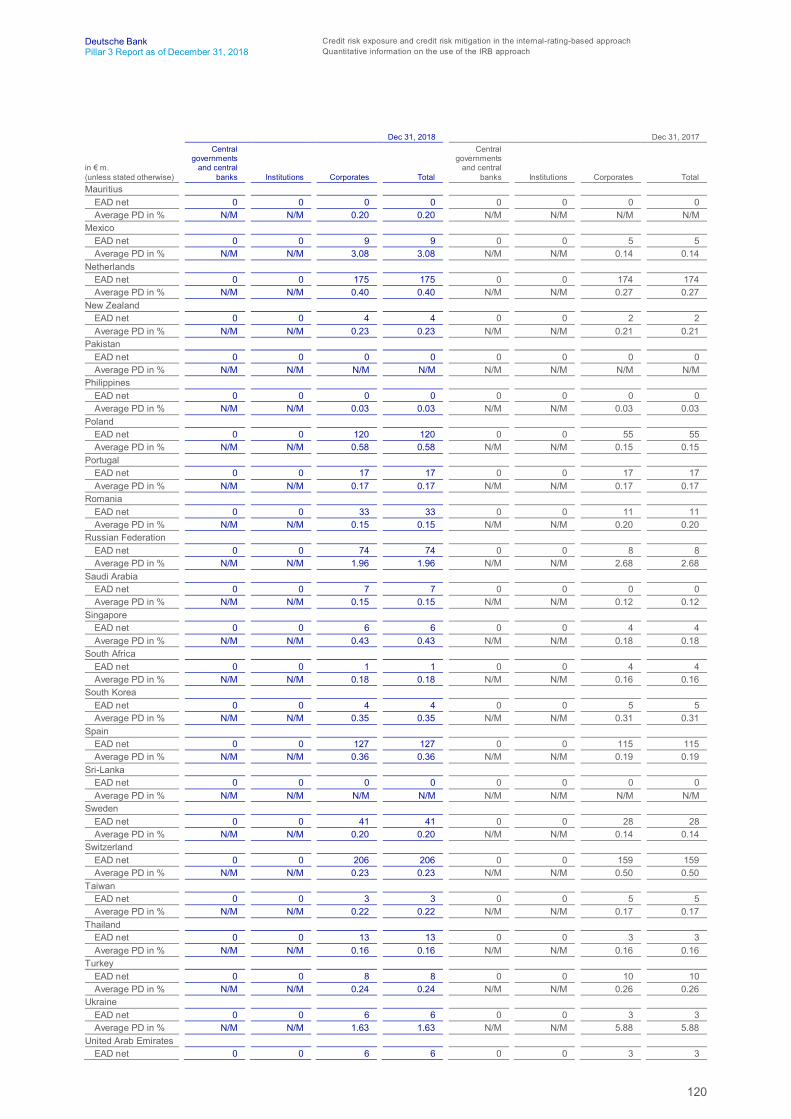
120
Deutsche Bank Credit risk exposure and credit risk mitigation in the internal-rating-based approachPillar 3 Report as of December 31, 2018 Quantitative information on the use of the IRB approach
Dec 31, 2018 Dec 31, 2017
in € m.(unless stated otherwise)
Centralgovernments
and centralbanks Institutions Corporates Total
Centralgovernments
and centralbanks Institutions Corporates Total
MauritiusEAD net 0 0 0 0 0 0 0 0Average PD in % N/M N/M 0.20 0.20 N/M N/M N/M N/M
MexicoEAD net 0 0 9 9 0 0 5 5Average PD in % N/M N/M 3.08 3.08 N/M N/M 0.14 0.14
NetherlandsEAD net 0 0 175 175 0 0 174 174Average PD in % N/M N/M 0.40 0.40 N/M N/M 0.27 0.27
New ZealandEAD net 0 0 4 4 0 0 2 2Average PD in % N/M N/M 0.23 0.23 N/M N/M 0.21 0.21
PakistanEAD net 0 0 0 0 0 0 0 0Average PD in % N/M N/M N/M N/M N/M N/M N/M N/M
PhilippinesEAD net 0 0 0 0 0 0 0 0Average PD in % N/M N/M 0.03 0.03 N/M N/M 0.03 0.03
PolandEAD net 0 0 120 120 0 0 55 55Average PD in % N/M N/M 0.58 0.58 N/M N/M 0.15 0.15
PortugalEAD net 0 0 17 17 0 0 17 17Average PD in % N/M N/M 0.17 0.17 N/M N/M 0.17 0.17
RomaniaEAD net 0 0 33 33 0 0 11 11Average PD in % N/M N/M 0.15 0.15 N/M N/M 0.20 0.20
Russian FederationEAD net 0 0 74 74 0 0 8 8Average PD in % N/M N/M 1.96 1.96 N/M N/M 2.68 2.68
Saudi ArabiaEAD net 0 0 7 7 0 0 0 0Average PD in % N/M N/M 0.15 0.15 N/M N/M 0.12 0.12
SingaporeEAD net 0 0 6 6 0 0 4 4Average PD in % N/M N/M 0.43 0.43 N/M N/M 0.18 0.18
South AfricaEAD net 0 0 1 1 0 0 4 4Average PD in % N/M N/M 0.18 0.18 N/M N/M 0.16 0.16
South KoreaEAD net 0 0 4 4 0 0 5 5Average PD in % N/M N/M 0.35 0.35 N/M N/M 0.31 0.31
SpainEAD net 0 0 127 127 0 0 115 115Average PD in % N/M N/M 0.36 0.36 N/M N/M 0.19 0.19
Sri-LankaEAD net 0 0 0 0 0 0 0 0Average PD in % N/M N/M N/M N/M N/M N/M N/M N/M
SwedenEAD net 0 0 41 41 0 0 28 28Average PD in % N/M N/M 0.20 0.20 N/M N/M 0.14 0.14
SwitzerlandEAD net 0 0 206 206 0 0 159 159Average PD in % N/M N/M 0.23 0.23 N/M N/M 0.50 0.50
TaiwanEAD net 0 0 3 3 0 0 5 5Average PD in % N/M N/M 0.22 0.22 N/M N/M 0.17 0.17
ThailandEAD net 0 0 13 13 0 0 3 3Average PD in % N/M N/M 0.16 0.16 N/M N/M 0.16 0.16
TurkeyEAD net 0 0 8 8 0 0 10 10Average PD in % N/M N/M 0.24 0.24 N/M N/M 0.26 0.26
UkraineEAD net 0 0 6 6 0 0 3 3Average PD in % N/M N/M 1.63 1.63 N/M N/M 5.88 5.88
United Arab EmiratesEAD net 0 0 6 6 0 0 3 3

121
Deutsche Bank Credit risk exposure and credit risk mitigation in the internal-rating-based approachPillar 3 Report as of December 31, 2018 Quantitative information on the use of the IRB approach
Dec 31, 2018 Dec 31, 2017
in € m.(unless stated otherwise)
Centralgovernments
and centralbanks Institutions Corporates Total
Centralgovernments
and centralbanks Institutions Corporates Total
Average PD in % N/M N/M 8.64 8.64 N/M N/M 0.27 0.27United Kingdom
EAD net 0 0 258 258 0 0 253 253Average PD in % N/M N/M 0.34 0.34 N/M N/M 0.52 0.52
United Statesof America
EAD net 0 0 223 223 0 0 104 104Average PD in % N/M N/M 1.03 1.03 N/M N/M 0.42 0.42
VietnamEAD net 0 0 6 6 0 0 0 0Average PD in % N/M N/M 9.96 9.96 N/M N/M 0.36 0.36
OtherEAD 0 15 246 261 0 0 146 146Average PD in % N/M 20.00 2.16 3.19 N/M N/M 2.32 2.32of which:InternationalOrganizations
EAD 0 0 0 0 0 0 0 0Average PD in % N/M N/M N/M N/M N/M N/M N/M N/M
Total 17 16 9,218 9,251 0 1 8,095 8,096
122
Deutsche Bank Counterparty credit risk (CCR)Pillar 3 Report as of December 31, 2018 Article 439 (a) CRR - Internal capital and credit limits for counterparty credit risk exposures
Counterparty credit risk (CCR)
Article 439 (a) CRR - Internal capital and credit limits forcounterparty credit risk exposuresCounterparty credit exposure (CCR) arises from our business activities in derivatives and securities financing transactions(SFT), it is the risk that the counterparty to a transaction may default before completing the satisfactory settlement of thetransaction. We calculate the exposure to CCR using the internal model method (IMM) and the mark-to-market method (CEM)for derivatives and the financial collateral comprehensive method for SFT respectively.
As the replacement values of derivatives portfolios fluctuate with movements in market rates and with changes in thetransactions in the portfolios, we estimate the potential future replacement costs of the portfolios over their lifetimes or, in caseof collateralized portfolios, over appropriate unwind periods. We measure the potential future exposure against a limit set forthe counterparty for this type of transactions.
Limits for CCR exposures are established on the basis of the principles for assigning credit limits as described in the sections"Credit risk framework" and “Measuring credit risk” in the Annual Report 2018 on pages 62. For the purpose of limit setting,CCR exposures are also considered in the context of the overall credit exposure to the obligor and the group of borrowersunder the one obligor principle.
We supplement the potential future exposure analysis with stress tests to estimate the immediate impact of extreme marketevents on our exposures (such as event risk in our Emerging Markets portfolio).
For the majority of derivative counterparty exposures as well as for SFT, we (without former Postbank, now part of DB Privat-und Firmenkundenbank AG (DB PFK AG)) make use of the internal model method in accordance with Article 283 et seq.CRR. In this respect SFT encompass repurchase transactions, securities or commodities lending and borrowing as well asmargin lending transactions (including prime brokerage). By applying this approach, we build our EAD calculations on a MonteCarlo simulation of the transactions’ future market values. Within this simulation process, interest and foreign exchange rates,credit spreads, equity and commodity prices are modeled by stochastic processes and each derivative and securities financingtransaction is revalued at each point of a pre-defined time grid. As a result of this process, a distribution of future market valuesfor each transaction at each time grid point is generated. From these distributions, by considering the appropriate netting andcollateral agreements, we derive the exposure measures potential future exposure (PFE), average expected exposure (AEE),expected positive exposure (EPE) and effective expected positive exposure (EEPE).
The potential future exposure measure which we use is generally given by a time profile of simulated positive market valuesof each counterparty’s derivatives portfolio, for which netting and collateralization are considered. For limit monitoring weemploy the 95th quantile of the resulting distribution of market values, internally referred to as potential future exposure. Theaverage exposure profiles generated by the same calculation process are used to derive the so-called average expectedexposure measure, which we use to reflect expected future replacement costs within our credit risk economic capital, and theexpected positive exposure measure driving our regulatory capital requirements. While AEE and EPE are generally calculatedwith respect to a time horizon of one year, the PFE is measured over the entire lifetime of a transaction or netting set foruncollateralized portfolios and over an appropriate unwind period for collateralized portfolios, respectively. We also employthe aforementioned calculation process to derive stressed exposure results for input into our credit portfolio stress testing.
The PFE profile of each counterparty is compared daily to the PFE limit profile set by the respective credit officer. PFE limitsare an integral part of the overall counterparty credit exposure management in line with other limit types. Breaches of PFElimits at any one profile time point are highlighted for action within our credit risk management process. The EPE is an inputto the Pillar 1 capital requirement (Risk Weighted Assets), whereas AEE feeds as a loan equivalent into the Group’s creditportfolio model (Economic Capital, applied under Pillar 2) where it is combined with all other credit exposure to a counterparty.
For our derivative counterparty credit risk resulting from DB PFK AG we also apply the mark-to-market method according toArticle 274 CRR, i.e., we calculate the EAD as the sum of the net positive fair value of the derivative transactions and theregulatory add-ons. As the EAD derivative position resulting from DB PFK AG is 2 % in relation to our overall counterpartycredit risk position from derivatives we consider DB PFK AG’s derivative position to be immaterial.
For further details on our counterparty credit risk, please refer to the Annual Report 2018 under sections: “Netting and collateralarrangements for derivatives and securities financing transactions”, page 68, “Derivatives - credit valuation adjustment”, and“Treatment of default situations under derivatives”, on pages 134-135 as well as “Credit exposure from derivatives”, on page120.
123
Deutsche Bank Counterparty credit risk (CCR)Pillar 3 Report as of December 31, 2018 Article 439 (f) CRR - CCR exposures by model approach
Article 439 (b) CRR - Collateral and credit reserves forcounterparty credit riskFor details regarding collateral and reserve for counterparty credit risk please refer to our Annual Report 2018 section“Managing and mitigation of credit risk” in the sub-section “Netting and collateral arrangements for derivatives and securitiesfinancing transactions”, on page 68, “Derivatives - credit valuation adjustment”, page 134 as well as “Credit exposure fromderivatives”, on page 120.
Article 439 (c) CRR - Management of wrong-way risk exposuresFor information regarding the management of wrong-way risk exposures please refer to the Annual Report 2018, section“Mitigation of credit risk on counterparty level” on page 67, “Treatment of default situations under derivatives” on page 135and “Country risk management” on page 70.
Article 439 (d) CRR - Collateral in the event of a ratingdowngradeFor details please refer to the Annual Report 2018, section “Managing and mitigation of credit risk” in the sub-section “Nettingand collateral arrangements for derivatives and securities financing transactions” on page 68. Additionally please refer to ourAnnual Report 2018 to the section “Liquidity risk exposure”, sub-section “Stress testing and scenario analysis” on page 147.
Article 439 (f) CRR - CCR exposures by model approachThe following table shows the methods used for calculating the regulatory requirements for CCR exposure including the mainparameters for each method. Exposures relevant for credit valuation adjustment (CVA) charges and exposures clearedthrough a central counterparty (CCP) are presented separately in table CCR2 and CCR8, respectively. Deutsche Bank doesnot make use of the original exposure method or the standardized approach for derivatives nor the financial collateral simplemethod for SFTs. Under the mark-to-market method the positive market values before netting and collateral, the potentialfuture exposure and the exposure at default for derivatives are shown, taking credit risk mitigation techniques into account.Under the internal model method (IMM) only the effective expected positive exposure (EEPE) and the exposure at default arepresented. Given the nature of the internal model the simulation process of futures market values across all asset classesalso includes the impact from regulatory netting and collateralization. For details regarding the calculation method under IMMincluding the estimation of the alpha factor please refer to introductory section on Counterparty Credit Risk in our annualPillar 3 Report 2018 on page 122.
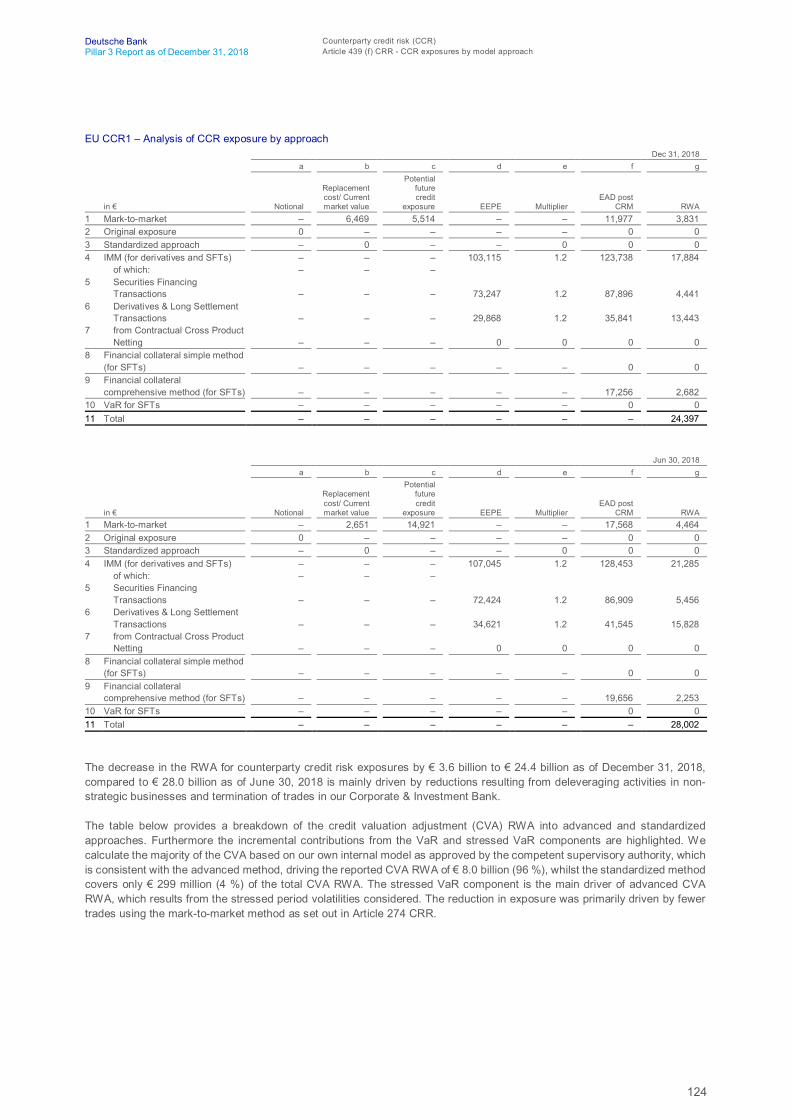
124
Deutsche Bank Counterparty credit risk (CCR)Pillar 3 Report as of December 31, 2018 Article 439 (f) CRR - CCR exposures by model approach
EU CCR1 – Analysis of CCR exposure by approachDec 31, 2018
a b c d e f g
in € Notional
Replacementcost/ Currentmarket value
Potentialfuturecredit
exposure EEPE MultiplierEAD post
CRM RWA1 Mark-to-market – 6,469 5,514 – – 11,977 3,8312 Original exposure 0 – – – – 0 03 Standardized approach – 0 – – 0 0 04 IMM (for derivatives and SFTs) – – – 103,115 1.2 123,738 17,884
of which: – – –5 Securities Financing
Transactions – – – 73,247 1.2 87,896 4,4416 Derivatives & Long Settlement
Transactions – – – 29,868 1.2 35,841 13,4437 from Contractual Cross Product
Netting – – – 0 0 0 08 Financial collateral simple method
(for SFTs) – – – – – 0 09 Financial collateral
comprehensive method (for SFTs) – – – – – 17,256 2,68210 VaR for SFTs – – – – – 0 011 Total – – – – – – 24,397
Jun 30, 2018a b c d e f g
in € Notional
Replacementcost/ Currentmarket value
Potentialfuturecredit
exposure EEPE MultiplierEAD post
CRM RWA1 Mark-to-market – 2,651 14,921 – – 17,568 4,4642 Original exposure 0 – – – – 0 03 Standardized approach – 0 – – 0 0 04 IMM (for derivatives and SFTs) – – – 107,045 1.2 128,453 21,285
of which: – – –5 Securities Financing
Transactions – – – 72,424 1.2 86,909 5,4566 Derivatives & Long Settlement
Transactions – – – 34,621 1.2 41,545 15,8287 from Contractual Cross Product
Netting – – – 0 0 0 08 Financial collateral simple method
(for SFTs) – – – – – 0 09 Financial collateral
comprehensive method (for SFTs) – – – – – 19,656 2,25310 VaR for SFTs – – – – – 0 011 Total – – – – – – 28,002
The decrease in the RWA for counterparty credit risk exposures by € 3.6 billion to € 24.4 billion as of December 31, 2018,compared to € 28.0 billion as of June 30, 2018 is mainly driven by reductions resulting from deleveraging activities in non-strategic businesses and termination of trades in our Corporate & Investment Bank.
The table below provides a breakdown of the credit valuation adjustment (CVA) RWA into advanced and standardizedapproaches. Furthermore the incremental contributions from the VaR and stressed VaR components are highlighted. Wecalculate the majority of the CVA based on our own internal model as approved by the competent supervisory authority, whichis consistent with the advanced method, driving the reported CVA RWA of € 8.0 billion (96 %), whilst the standardized methodcovers only € 299 million (4 %) of the total CVA RWA. The stressed VaR component is the main driver of advanced CVARWA, which results from the stressed period volatilities considered. The reduction in exposure was primarily driven by fewertrades using the mark-to-market method as set out in Article 274 CRR.
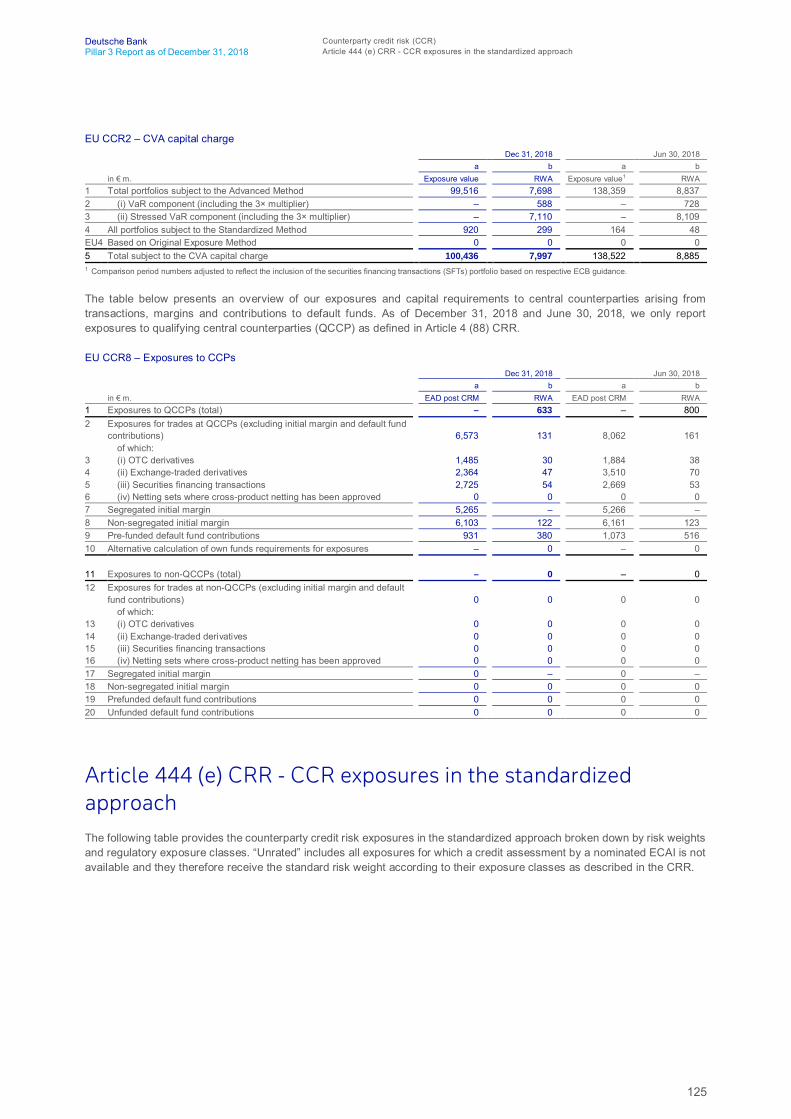
125
Deutsche Bank Counterparty credit risk (CCR)Pillar 3 Report as of December 31, 2018 Article 444 (e) CRR - CCR exposures in the standardized approach
EU CCR2 – CVA capital chargeDec 31, 2018 Jun 30, 2018
a b a bin € m. Exposure value RWA Exposure value1 RWA
1 Total portfolios subject to the Advanced Method 99,516 7,698 138,359 8,8372 (i) VaR component (including the 3× multiplier) – 588 – 7283 (ii) Stressed VaR component (including the 3× multiplier) – 7,110 – 8,1094 All portfolios subject to the Standardized Method 920 299 164 48EU4 Based on Original Exposure Method 0 0 0 05 Total subject to the CVA capital charge 100,436 7,997 138,522 8,8851 Comparison period numbers adjusted to reflect the inclusion of the securities financing transactions (SFTs) portfolio based on respective ECB guidance.
The table below presents an overview of our exposures and capital requirements to central counterparties arising fromtransactions, margins and contributions to default funds. As of December 31, 2018 and June 30, 2018, we only reportexposures to qualifying central counterparties (QCCP) as defined in Article 4 (88) CRR.
EU CCR8 – Exposures to CCPsDec 31, 2018 Jun 30, 2018
a b a bin € m. EAD post CRM RWA EAD post CRM RWA
1 Exposures to QCCPs (total) – 633 – 8002 Exposures for trades at QCCPs (excluding initial margin and default fund
contributions) 6,573 131 8,062 161of which:
3 (i) OTC derivatives 1,485 30 1,884 384 (ii) Exchange-traded derivatives 2,364 47 3,510 705 (iii) Securities financing transactions 2,725 54 2,669 536 (iv) Netting sets where cross-product netting has been approved 0 0 0 07 Segregated initial margin 5,265 – 5,266 –8 Non-segregated initial margin 6,103 122 6,161 1239 Pre-funded default fund contributions 931 380 1,073 51610 Alternative calculation of own funds requirements for exposures – 0 – 0
11 Exposures to non-QCCPs (total) – 0 – 012 Exposures for trades at non-QCCPs (excluding initial margin and default
fund contributions) 0 0 0 0of which:
13 (i) OTC derivatives 0 0 0 014 (ii) Exchange-traded derivatives 0 0 0 015 (iii) Securities financing transactions 0 0 0 016 (iv) Netting sets where cross-product netting has been approved 0 0 0 017 Segregated initial margin 0 – 0 –18 Non-segregated initial margin 0 0 0 019 Prefunded default fund contributions 0 0 0 020 Unfunded default fund contributions 0 0 0 0
Article 444 (e) CRR - CCR exposures in the standardizedapproachThe following table provides the counterparty credit risk exposures in the standardized approach broken down by risk weightsand regulatory exposure classes. “Unrated” includes all exposures for which a credit assessment by a nominated ECAI is notavailable and they therefore receive the standard risk weight according to their exposure classes as described in the CRR.
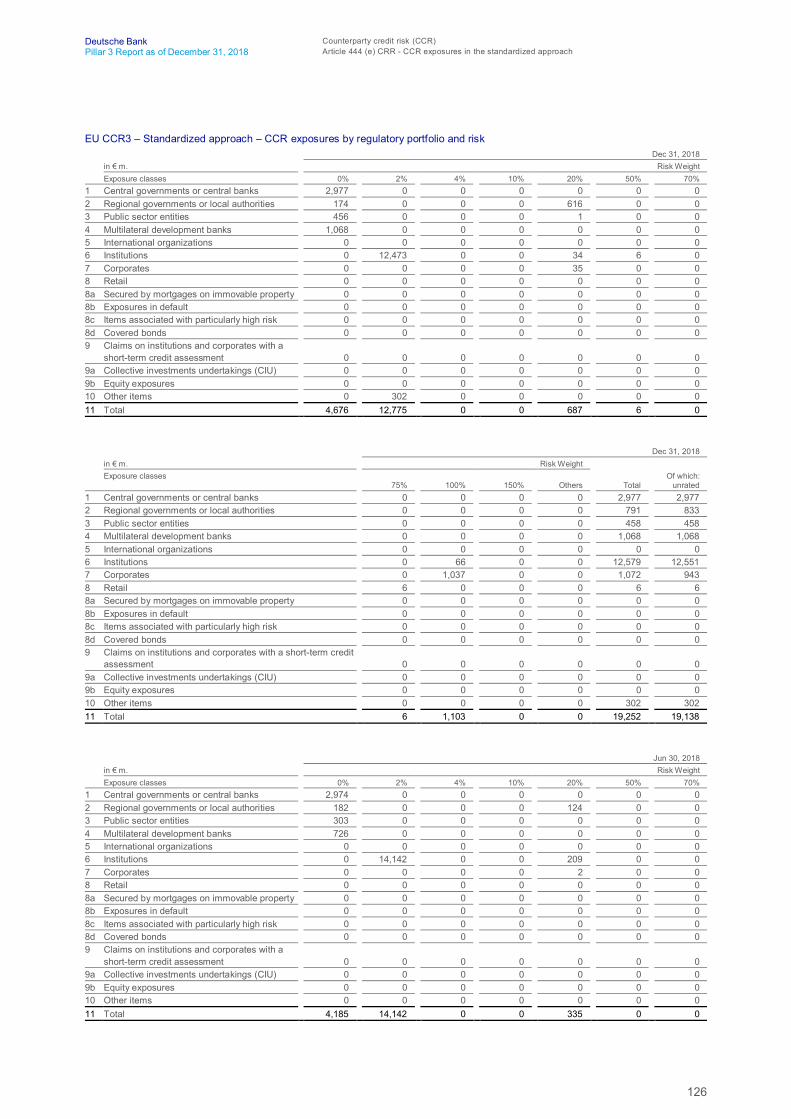
126
Deutsche Bank Counterparty credit risk (CCR)Pillar 3 Report as of December 31, 2018 Article 444 (e) CRR - CCR exposures in the standardized approach
EU CCR3 – Standardized approach – CCR exposures by regulatory portfolio and riskDec 31, 2018
in € m. Risk WeightExposure classes 0% 2% 4% 10% 20% 50% 70%
1 Central governments or central banks 2,977 0 0 0 0 0 02 Regional governments or local authorities 174 0 0 0 616 0 03 Public sector entities 456 0 0 0 1 0 04 Multilateral development banks 1,068 0 0 0 0 0 05 International organizations 0 0 0 0 0 0 06 Institutions 0 12,473 0 0 34 6 07 Corporates 0 0 0 0 35 0 08 Retail 0 0 0 0 0 0 08a Secured by mortgages on immovable property 0 0 0 0 0 0 08b Exposures in default 0 0 0 0 0 0 08c Items associated with particularly high risk 0 0 0 0 0 0 08d Covered bonds 0 0 0 0 0 0 09 Claims on institutions and corporates with a
short-term credit assessment 0 0 0 0 0 0 09a Collective investments undertakings (CIU) 0 0 0 0 0 0 09b Equity exposures 0 0 0 0 0 0 010 Other items 0 302 0 0 0 0 011 Total 4,676 12,775 0 0 687 6 0
Dec 31, 2018in € m. Risk WeightExposure classes
75% 100% 150% Others TotalOf which:
unrated1 Central governments or central banks 0 0 0 0 2,977 2,9772 Regional governments or local authorities 0 0 0 0 791 8333 Public sector entities 0 0 0 0 458 4584 Multilateral development banks 0 0 0 0 1,068 1,0685 International organizations 0 0 0 0 0 06 Institutions 0 66 0 0 12,579 12,5517 Corporates 0 1,037 0 0 1,072 9438 Retail 6 0 0 0 6 68a Secured by mortgages on immovable property 0 0 0 0 0 08b Exposures in default 0 0 0 0 0 08c Items associated with particularly high risk 0 0 0 0 0 08d Covered bonds 0 0 0 0 0 09 Claims on institutions and corporates with a short-term credit
assessment 0 0 0 0 0 09a Collective investments undertakings (CIU) 0 0 0 0 0 09b Equity exposures 0 0 0 0 0 010 Other items 0 0 0 0 302 30211 Total 6 1,103 0 0 19,252 19,138
Jun 30, 2018in € m. Risk WeightExposure classes 0% 2% 4% 10% 20% 50% 70%
1 Central governments or central banks 2,974 0 0 0 0 0 02 Regional governments or local authorities 182 0 0 0 124 0 03 Public sector entities 303 0 0 0 0 0 04 Multilateral development banks 726 0 0 0 0 0 05 International organizations 0 0 0 0 0 0 06 Institutions 0 14,142 0 0 209 0 07 Corporates 0 0 0 0 2 0 08 Retail 0 0 0 0 0 0 08a Secured by mortgages on immovable property 0 0 0 0 0 0 08b Exposures in default 0 0 0 0 0 0 08c Items associated with particularly high risk 0 0 0 0 0 0 08d Covered bonds 0 0 0 0 0 0 09 Claims on institutions and corporates with a
short-term credit assessment 0 0 0 0 0 0 09a Collective investments undertakings (CIU) 0 0 0 0 0 0 09b Equity exposures 0 0 0 0 0 0 010 Other items 0 0 0 0 0 0 011 Total 4,185 14,142 0 0 335 0 0
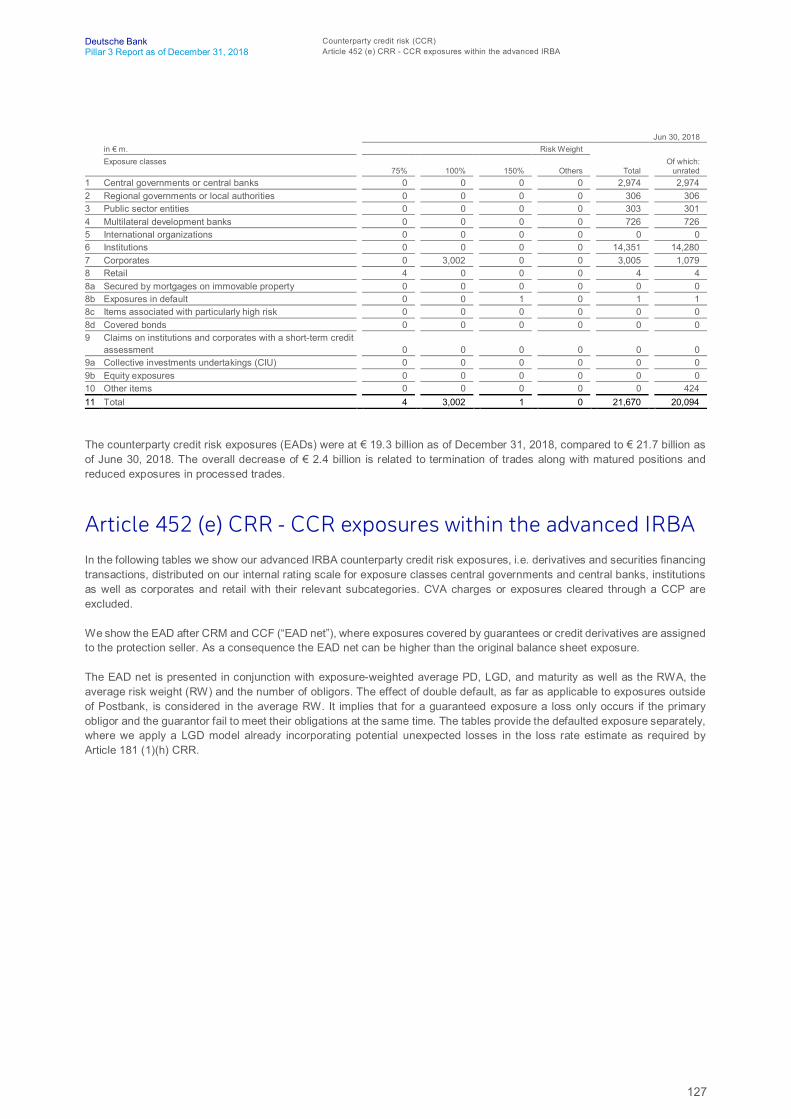
127
Deutsche Bank Counterparty credit risk (CCR)Pillar 3 Report as of December 31, 2018 Article 452 (e) CRR - CCR exposures within the advanced IRBA
Jun 30, 2018in € m. Risk WeightExposure classes
75% 100% 150% Others TotalOf which:
unrated1 Central governments or central banks 0 0 0 0 2,974 2,9742 Regional governments or local authorities 0 0 0 0 306 3063 Public sector entities 0 0 0 0 303 3014 Multilateral development banks 0 0 0 0 726 7265 International organizations 0 0 0 0 0 06 Institutions 0 0 0 0 14,351 14,2807 Corporates 0 3,002 0 0 3,005 1,0798 Retail 4 0 0 0 4 48a Secured by mortgages on immovable property 0 0 0 0 0 08b Exposures in default 0 0 1 0 1 18c Items associated with particularly high risk 0 0 0 0 0 08d Covered bonds 0 0 0 0 0 09 Claims on institutions and corporates with a short-term credit
assessment 0 0 0 0 0 09a Collective investments undertakings (CIU) 0 0 0 0 0 09b Equity exposures 0 0 0 0 0 010 Other items 0 0 0 0 0 42411 Total 4 3,002 1 0 21,670 20,094
The counterparty credit risk exposures (EADs) were at € 19.3 billion as of December 31, 2018, compared to € 21.7 billion asof June 30, 2018. The overall decrease of € 2.4 billion is related to termination of trades along with matured positions andreduced exposures in processed trades.
Article 452 (e) CRR - CCR exposures within the advanced IRBAIn the following tables we show our advanced IRBA counterparty credit risk exposures, i.e. derivatives and securities financingtransactions, distributed on our internal rating scale for exposure classes central governments and central banks, institutionsas well as corporates and retail with their relevant subcategories. CVA charges or exposures cleared through a CCP areexcluded.
We show the EAD after CRM and CCF (“EAD net”), where exposures covered by guarantees or credit derivatives are assignedto the protection seller. As a consequence the EAD net can be higher than the original balance sheet exposure.
The EAD net is presented in conjunction with exposure-weighted average PD, LGD, and maturity as well as the RWA, theaverage risk weight (RW) and the number of obligors. The effect of double default, as far as applicable to exposures outsideof Postbank, is considered in the average RW. It implies that for a guaranteed exposure a loss only occurs if the primaryobligor and the guarantor fail to meet their obligations at the same time. The tables provide the defaulted exposure separately,where we apply a LGD model already incorporating potential unexpected losses in the loss rate estimate as required byArticle 181 (1)(h) CRR.
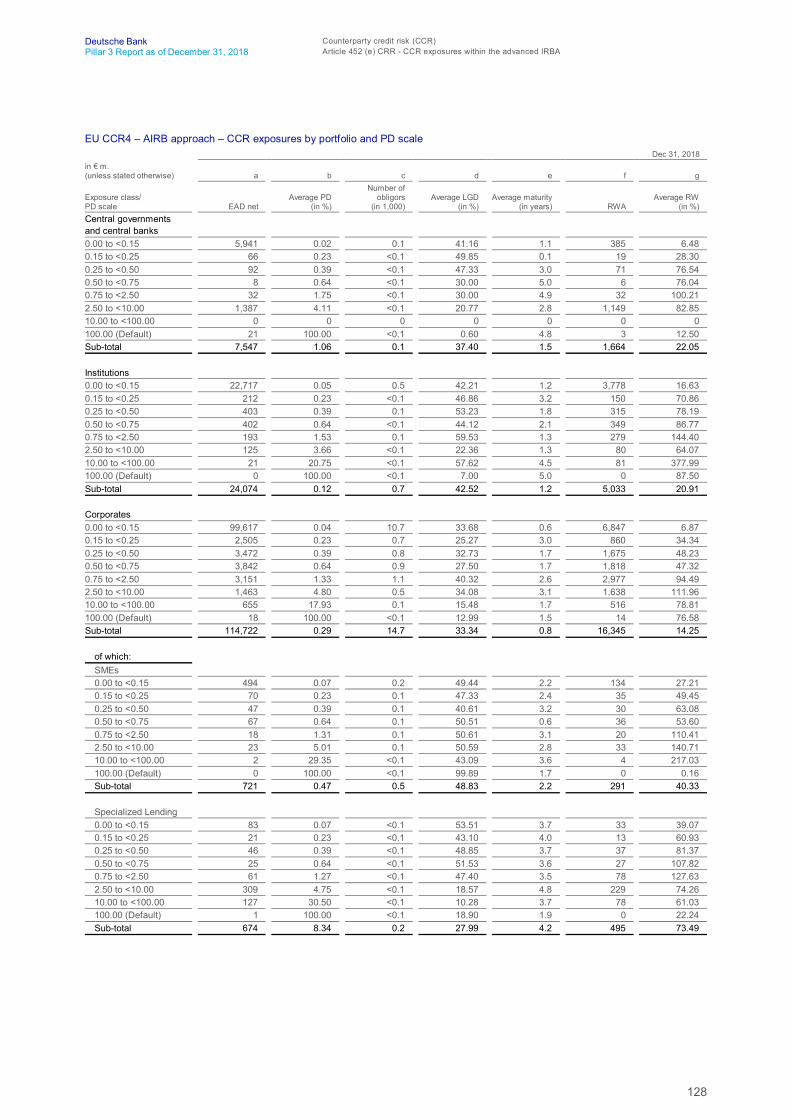
128
Deutsche Bank Counterparty credit risk (CCR)Pillar 3 Report as of December 31, 2018 Article 452 (e) CRR - CCR exposures within the advanced IRBA
EU CCR4 – AIRB approach – CCR exposures by portfolio and PD scaleDec 31, 2018
in € m.(unless stated otherwise) a b c d e f g
Exposure class/PD scale EAD net
Average PD(in %)
Number ofobligors
(in 1,000)Average LGD
(in %)Average maturity
(in years) RWAAverage RW
(in %)Central governmentsand central banks0.00 to <0.15 5,941 0.02 0.1 41.16 1.1 385 6.480.15 to <0.25 66 0.23 <0.1 49.85 0.1 19 28.300.25 to <0.50 92 0.39 <0.1 47.33 3.0 71 76.540.50 to <0.75 8 0.64 <0.1 30.00 5.0 6 76.040.75 to <2.50 32 1.75 <0.1 30.00 4.9 32 100.212.50 to <10.00 1,387 4.11 <0.1 20.77 2.8 1,149 82.8510.00 to <100.00 0 0 0 0 0 0 0100.00 (Default) 21 100.00 <0.1 0.60 4.8 3 12.50Sub-total 7,547 1.06 0.1 37.40 1.5 1,664 22.05
Institutions0.00 to <0.15 22,717 0.05 0.5 42.21 1.2 3,778 16.630.15 to <0.25 212 0.23 <0.1 46.86 3.2 150 70.860.25 to <0.50 403 0.39 0.1 53.23 1.8 315 78.190.50 to <0.75 402 0.64 <0.1 44.12 2.1 349 86.770.75 to <2.50 193 1.53 0.1 59.53 1.3 279 144.402.50 to <10.00 125 3.66 <0.1 22.36 1.3 80 64.0710.00 to <100.00 21 20.75 <0.1 57.62 4.5 81 377.99100.00 (Default) 0 100.00 <0.1 7.00 5.0 0 87.50Sub-total 24,074 0.12 0.7 42.52 1.2 5,033 20.91
Corporates0.00 to <0.15 99,617 0.04 10.7 33.68 0.6 6,847 6.870.15 to <0.25 2,505 0.23 0.7 25.27 3.0 860 34.340.25 to <0.50 3,472 0.39 0.8 32.73 1.7 1,675 48.230.50 to <0.75 3,842 0.64 0.9 27.50 1.7 1,818 47.320.75 to <2.50 3,151 1.33 1.1 40.32 2.6 2,977 94.492.50 to <10.00 1,463 4.80 0.5 34.08 3.1 1,638 111.9610.00 to <100.00 655 17.93 0.1 15.48 1.7 516 78.81100.00 (Default) 18 100.00 <0.1 12.99 1.5 14 76.58Sub-total 114,722 0.29 14.7 33.34 0.8 16,345 14.25
of which:SMEs0.00 to <0.15 494 0.07 0.2 49.44 2.2 134 27.210.15 to <0.25 70 0.23 0.1 47.33 2.4 35 49.450.25 to <0.50 47 0.39 0.1 40.61 3.2 30 63.080.50 to <0.75 67 0.64 0.1 50.51 0.6 36 53.600.75 to <2.50 18 1.31 0.1 50.61 3.1 20 110.412.50 to <10.00 23 5.01 0.1 50.59 2.8 33 140.7110.00 to <100.00 2 29.35 <0.1 43.09 3.6 4 217.03100.00 (Default) 0 100.00 <0.1 99.89 1.7 0 0.16Sub-total 721 0.47 0.5 48.83 2.2 291 40.33
Specialized Lending0.00 to <0.15 83 0.07 <0.1 53.51 3.7 33 39.070.15 to <0.25 21 0.23 <0.1 43.10 4.0 13 60.930.25 to <0.50 46 0.39 <0.1 48.85 3.7 37 81.370.50 to <0.75 25 0.64 <0.1 51.53 3.6 27 107.820.75 to <2.50 61 1.27 <0.1 47.40 3.5 78 127.632.50 to <10.00 309 4.75 <0.1 18.57 4.8 229 74.2610.00 to <100.00 127 30.50 <0.1 10.28 3.7 78 61.03100.00 (Default) 1 100.00 <0.1 18.90 1.9 0 22.24Sub-total 674 8.34 0.2 27.99 4.2 495 73.49
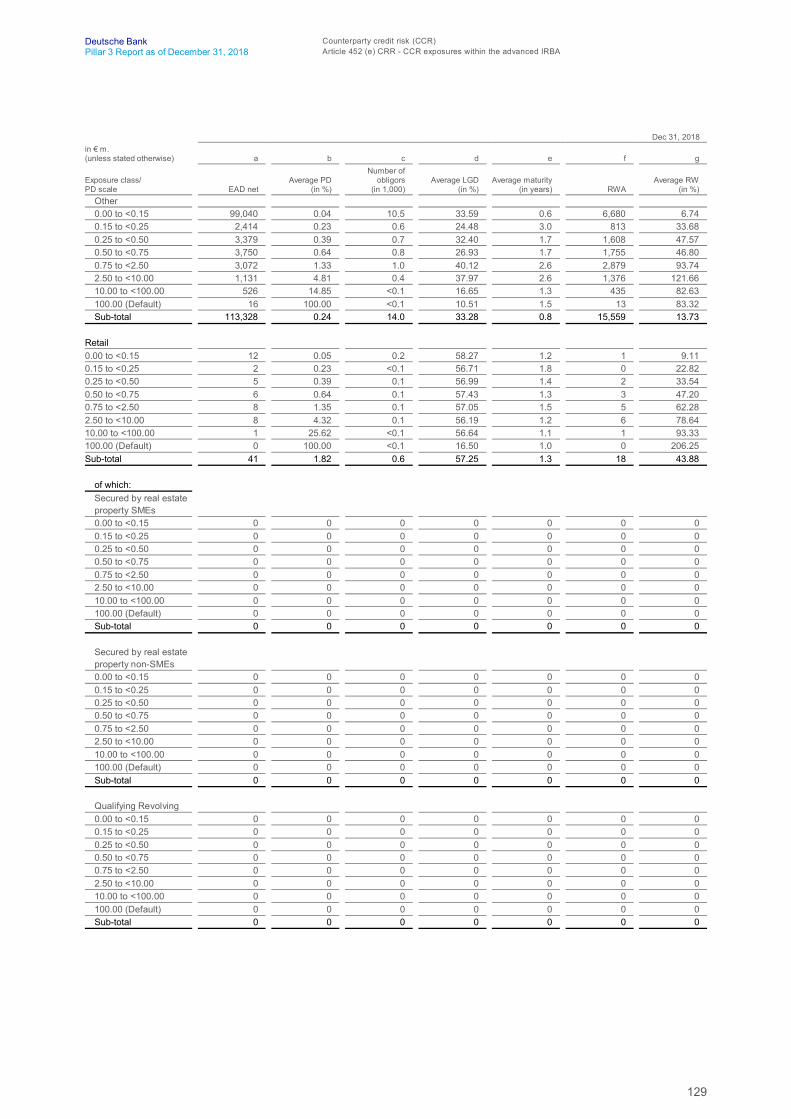
129
Deutsche Bank Counterparty credit risk (CCR)Pillar 3 Report as of December 31, 2018 Article 452 (e) CRR - CCR exposures within the advanced IRBA
Dec 31, 2018in € m.(unless stated otherwise) a b c d e f g
Exposure class/PD scale EAD net
Average PD(in %)
Number ofobligors
(in 1,000)Average LGD
(in %)Average maturity
(in years) RWAAverage RW
(in %)Other0.00 to <0.15 99,040 0.04 10.5 33.59 0.6 6,680 6.740.15 to <0.25 2,414 0.23 0.6 24.48 3.0 813 33.680.25 to <0.50 3,379 0.39 0.7 32.40 1.7 1,608 47.570.50 to <0.75 3,750 0.64 0.8 26.93 1.7 1,755 46.800.75 to <2.50 3,072 1.33 1.0 40.12 2.6 2,879 93.742.50 to <10.00 1,131 4.81 0.4 37.97 2.6 1,376 121.6610.00 to <100.00 526 14.85 <0.1 16.65 1.3 435 82.63100.00 (Default) 16 100.00 <0.1 10.51 1.5 13 83.32Sub-total 113,328 0.24 14.0 33.28 0.8 15,559 13.73
Retail0.00 to <0.15 12 0.05 0.2 58.27 1.2 1 9.110.15 to <0.25 2 0.23 <0.1 56.71 1.8 0 22.820.25 to <0.50 5 0.39 0.1 56.99 1.4 2 33.540.50 to <0.75 6 0.64 0.1 57.43 1.3 3 47.200.75 to <2.50 8 1.35 0.1 57.05 1.5 5 62.282.50 to <10.00 8 4.32 0.1 56.19 1.2 6 78.6410.00 to <100.00 1 25.62 <0.1 56.64 1.1 1 93.33100.00 (Default) 0 100.00 <0.1 16.50 1.0 0 206.25Sub-total 41 1.82 0.6 57.25 1.3 18 43.88
of which:Secured by real estateproperty SMEs0.00 to <0.15 0 0 0 0 0 0 00.15 to <0.25 0 0 0 0 0 0 00.25 to <0.50 0 0 0 0 0 0 00.50 to <0.75 0 0 0 0 0 0 00.75 to <2.50 0 0 0 0 0 0 02.50 to <10.00 0 0 0 0 0 0 010.00 to <100.00 0 0 0 0 0 0 0100.00 (Default) 0 0 0 0 0 0 0Sub-total 0 0 0 0 0 0 0
Secured by real estateproperty non-SMEs0.00 to <0.15 0 0 0 0 0 0 00.15 to <0.25 0 0 0 0 0 0 00.25 to <0.50 0 0 0 0 0 0 00.50 to <0.75 0 0 0 0 0 0 00.75 to <2.50 0 0 0 0 0 0 02.50 to <10.00 0 0 0 0 0 0 010.00 to <100.00 0 0 0 0 0 0 0100.00 (Default) 0 0 0 0 0 0 0Sub-total 0 0 0 0 0 0 0
Qualifying Revolving0.00 to <0.15 0 0 0 0 0 0 00.15 to <0.25 0 0 0 0 0 0 00.25 to <0.50 0 0 0 0 0 0 00.50 to <0.75 0 0 0 0 0 0 00.75 to <2.50 0 0 0 0 0 0 02.50 to <10.00 0 0 0 0 0 0 010.00 to <100.00 0 0 0 0 0 0 0100.00 (Default) 0 0 0 0 0 0 0Sub-total 0 0 0 0 0 0 0
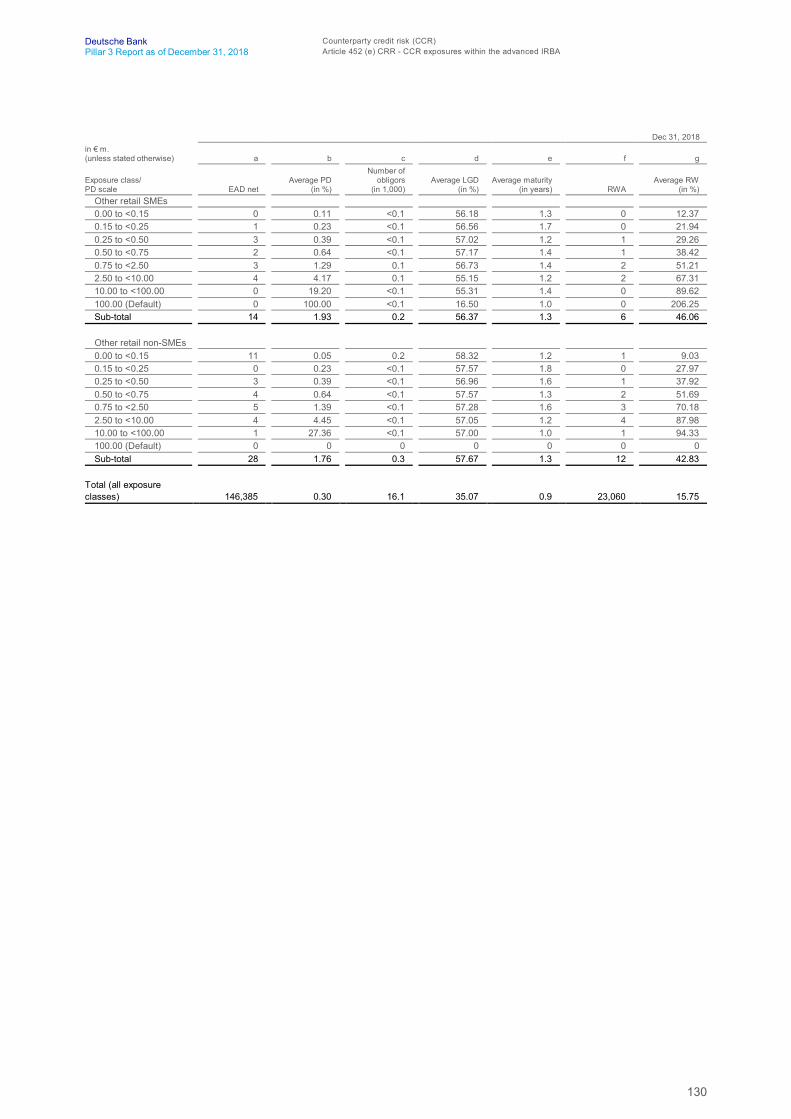
130
Deutsche Bank Counterparty credit risk (CCR)Pillar 3 Report as of December 31, 2018 Article 452 (e) CRR - CCR exposures within the advanced IRBA
Dec 31, 2018in € m.(unless stated otherwise) a b c d e f g
Exposure class/PD scale EAD net
Average PD(in %)
Number ofobligors
(in 1,000)Average LGD
(in %)Average maturity
(in years) RWAAverage RW
(in %)Other retail SMEs0.00 to <0.15 0 0.11 <0.1 56.18 1.3 0 12.370.15 to <0.25 1 0.23 <0.1 56.56 1.7 0 21.940.25 to <0.50 3 0.39 <0.1 57.02 1.2 1 29.260.50 to <0.75 2 0.64 <0.1 57.17 1.4 1 38.420.75 to <2.50 3 1.29 0.1 56.73 1.4 2 51.212.50 to <10.00 4 4.17 0.1 55.15 1.2 2 67.3110.00 to <100.00 0 19.20 <0.1 55.31 1.4 0 89.62100.00 (Default) 0 100.00 <0.1 16.50 1.0 0 206.25Sub-total 14 1.93 0.2 56.37 1.3 6 46.06
Other retail non-SMEs0.00 to <0.15 11 0.05 0.2 58.32 1.2 1 9.030.15 to <0.25 0 0.23 <0.1 57.57 1.8 0 27.970.25 to <0.50 3 0.39 <0.1 56.96 1.6 1 37.920.50 to <0.75 4 0.64 <0.1 57.57 1.3 2 51.690.75 to <2.50 5 1.39 <0.1 57.28 1.6 3 70.182.50 to <10.00 4 4.45 <0.1 57.05 1.2 4 87.9810.00 to <100.00 1 27.36 <0.1 57.00 1.0 1 94.33100.00 (Default) 0 0 0 0 0 0 0Sub-total 28 1.76 0.3 57.67 1.3 12 42.83
Total (all exposureclasses) 146,385 0.30 16.1 35.07 0.9 23,060 15.75

131
Deutsche Bank Counterparty credit risk (CCR)Pillar 3 Report as of December 31, 2018 Article 452 (e) CRR - CCR exposures within the advanced IRBA
Jun 30, 2018in € m.(unless stated otherwise) a b c d e f g
Exposure class/PD scale EAD net
Average PD(in %)
Number ofobligors
(in 1,000)Average LGD
(in %)Average maturity
(in years) RWAAverage RW
(in %)Central governmentsand central banks0.00 to <0.15 7,065 0.03 0.1 40.93 1.1 492 6.960.15 to <0.25 26 0.23 <0.1 25.42 4.7 10 39.500.25 to <0.50 369 0.39 <0.1 49.45 1.0 191 51.800.50 to <0.75 8 0.64 <0.1 30.00 5.0 6 76.210.75 to <2.50 30 1.76 <0.1 30.00 4.9 30 100.212.50 to <10.00 863 3.60 <0.1 15.97 0.6 403 46.6210.00 to <100.00 0 0 0 0 0 0 0100.00 (Default) 24 100.00 <0.1 0.90 5.0 3 12.50Sub-total 8,386 0.70 0.1 38.52 1.0 1,135 13.53
Institutions0.00 to <0.15 35,628 0.05 0.5 40.52 1.3 5,035 14.130.15 to <0.25 362 0.23 <0.1 49.51 2.9 268 74.120.25 to <0.50 362 0.39 0.1 56.51 1.6 266 73.480.50 to <0.75 442 0.64 <0.1 49.94 1.2 408 92.240.75 to <2.50 268 1.31 0.1 55.34 1.6 382 142.172.50 to <10.00 27 6.07 <0.1 47.26 2.4 41 154.4010.00 to <100.00 17 20.98 <0.1 57.92 4.5 66 376.00100.00 (Default) 0 100.00 <0.1 5.00 1.0 0 62.50Sub-total 37,107 0.09 0.7 41.00 1.4 6,466 17.42
Corporates0.00 to <0.15 95,985 0.04 10.8 33.88 0.7 7,233 7.540.15 to <0.25 3,194 0.23 0.7 29.73 2.6 1,127 35.290.25 to <0.50 4,504 0.39 0.9 26.79 1.3 1,796 39.880.50 to <0.75 3,592 0.64 1.0 34.27 1.5 2,352 65.500.75 to <2.50 4,141 1.24 1.3 38.94 2.4 3,717 89.752.50 to <10.00 2,202 4.78 0.6 28.41 2.6 2,161 98.1810.00 to <100.00 410 15.55 0.1 22.03 1.0 487 118.86100.00 (Default) 41 69.82 <0.1 9.09 1.6 22 53.61Sub-total 114,068 0.29 15.4 33.52 0.9 18,896 16.57
of which:SMEs0.00 to <0.15 499 0.07 0.2 52.23 2.2 141 28.170.15 to <0.25 69 0.23 0.1 46.82 3.2 37 52.850.25 to <0.50 50 0.39 0.1 43.32 2.4 26 52.750.50 to <0.75 64 0.64 0.1 50.55 0.8 35 54.860.75 to <2.50 25 1.50 0.1 49.69 2.3 24 93.892.50 to <10.00 38 5.90 0.1 44.18 2.7 44 115.4810.00 to <100.00 3 18.20 <0.1 49.97 2.3 6 208.99100.00 (Default) 1 100.00 <0.1 71.02 2.3 0 11.33Sub-total 750 0.64 0.7 50.50 2.2 313 41.72
Specialized Lending0.00 to <0.15 150 0.07 <0.1 52.78 4.0 61 40.780.15 to <0.25 16 0.23 <0.1 39.57 4.9 10 66.110.25 to <0.50 47 0.39 <0.1 43.91 4.4 40 84.800.50 to <0.75 30 0.64 <0.1 50.16 4.0 34 112.130.75 to <2.50 60 1.29 <0.1 48.76 4.0 83 138.512.50 to <10.00 425 4.69 0.1 16.83 4.0 269 63.2910.00 to <100.00 20 18.78 <0.1 48.83 3.9 56 279.31100.00 (Default) 1 100.00 <0.1 2.00 2.1 0 25.00Sub-total 750 3.48 0.2 30.95 4.0 554 73.91
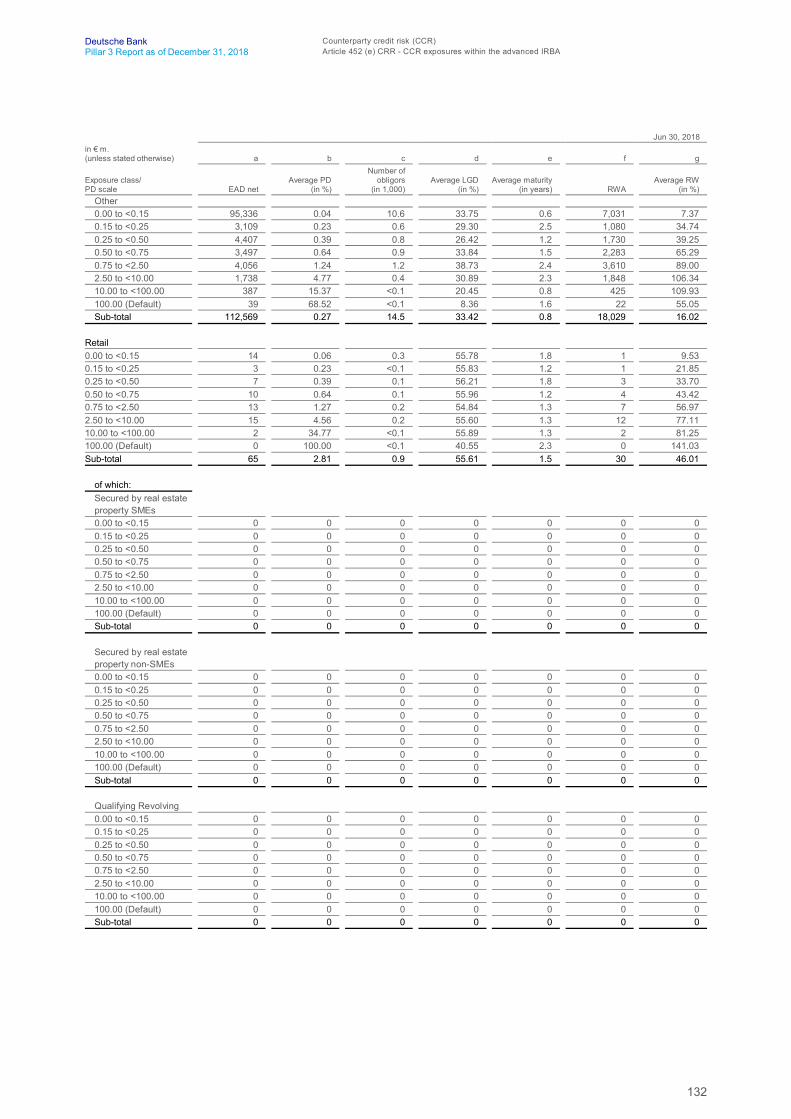
132
Deutsche Bank Counterparty credit risk (CCR)Pillar 3 Report as of December 31, 2018 Article 452 (e) CRR - CCR exposures within the advanced IRBA
Jun 30, 2018in € m.(unless stated otherwise) a b c d e f g
Exposure class/PD scale EAD net
Average PD(in %)
Number ofobligors
(in 1,000)Average LGD
(in %)Average maturity
(in years) RWAAverage RW
(in %)Other0.00 to <0.15 95,336 0.04 10.6 33.75 0.6 7,031 7.370.15 to <0.25 3,109 0.23 0.6 29.30 2.5 1,080 34.740.25 to <0.50 4,407 0.39 0.8 26.42 1.2 1,730 39.250.50 to <0.75 3,497 0.64 0.9 33.84 1.5 2,283 65.290.75 to <2.50 4,056 1.24 1.2 38.73 2.4 3,610 89.002.50 to <10.00 1,738 4.77 0.4 30.89 2.3 1,848 106.3410.00 to <100.00 387 15.37 <0.1 20.45 0.8 425 109.93100.00 (Default) 39 68.52 <0.1 8.36 1.6 22 55.05Sub-total 112,569 0.27 14.5 33.42 0.8 18,029 16.02
Retail0.00 to <0.15 14 0.06 0.3 55.78 1.8 1 9.530.15 to <0.25 3 0.23 <0.1 55.83 1.2 1 21.850.25 to <0.50 7 0.39 0.1 56.21 1.8 3 33.700.50 to <0.75 10 0.64 0.1 55.96 1.2 4 43.420.75 to <2.50 13 1.27 0.2 54.84 1.3 7 56.972.50 to <10.00 15 4.56 0.2 55.60 1.3 12 77.1110.00 to <100.00 2 34.77 <0.1 55.89 1.3 2 81.25100.00 (Default) 0 100.00 <0.1 40.55 2.3 0 141.03Sub-total 65 2.81 0.9 55.61 1.5 30 46.01
of which:Secured by real estateproperty SMEs0.00 to <0.15 0 0 0 0 0 0 00.15 to <0.25 0 0 0 0 0 0 00.25 to <0.50 0 0 0 0 0 0 00.50 to <0.75 0 0 0 0 0 0 00.75 to <2.50 0 0 0 0 0 0 02.50 to <10.00 0 0 0 0 0 0 010.00 to <100.00 0 0 0 0 0 0 0100.00 (Default) 0 0 0 0 0 0 0Sub-total 0 0 0 0 0 0 0
Secured by real estateproperty non-SMEs0.00 to <0.15 0 0 0 0 0 0 00.15 to <0.25 0 0 0 0 0 0 00.25 to <0.50 0 0 0 0 0 0 00.50 to <0.75 0 0 0 0 0 0 00.75 to <2.50 0 0 0 0 0 0 02.50 to <10.00 0 0 0 0 0 0 010.00 to <100.00 0 0 0 0 0 0 0100.00 (Default) 0 0 0 0 0 0 0Sub-total 0 0 0 0 0 0 0
Qualifying Revolving0.00 to <0.15 0 0 0 0 0 0 00.15 to <0.25 0 0 0 0 0 0 00.25 to <0.50 0 0 0 0 0 0 00.50 to <0.75 0 0 0 0 0 0 00.75 to <2.50 0 0 0 0 0 0 02.50 to <10.00 0 0 0 0 0 0 010.00 to <100.00 0 0 0 0 0 0 0100.00 (Default) 0 0 0 0 0 0 0Sub-total 0 0 0 0 0 0 0
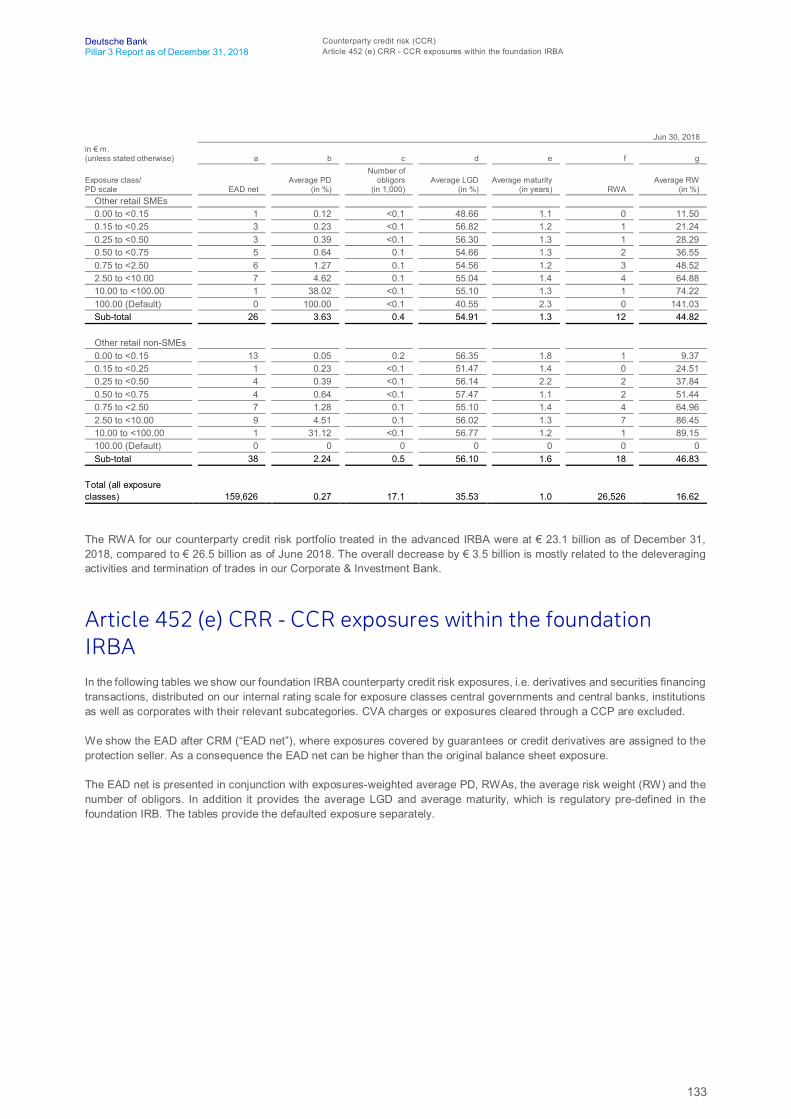
133
Deutsche Bank Counterparty credit risk (CCR)Pillar 3 Report as of December 31, 2018 Article 452 (e) CRR - CCR exposures within the foundation IRBA
Jun 30, 2018in € m.(unless stated otherwise) a b c d e f g
Exposure class/PD scale EAD net
Average PD(in %)
Number ofobligors
(in 1,000)Average LGD
(in %)Average maturity
(in years) RWAAverage RW
(in %)Other retail SMEs0.00 to <0.15 1 0.12 <0.1 48.66 1.1 0 11.500.15 to <0.25 3 0.23 <0.1 56.82 1.2 1 21.240.25 to <0.50 3 0.39 <0.1 56.30 1.3 1 28.290.50 to <0.75 5 0.64 0.1 54.66 1.3 2 36.550.75 to <2.50 6 1.27 0.1 54.56 1.2 3 48.522.50 to <10.00 7 4.62 0.1 55.04 1.4 4 64.8810.00 to <100.00 1 38.02 <0.1 55.10 1.3 1 74.22100.00 (Default) 0 100.00 <0.1 40.55 2.3 0 141.03Sub-total 26 3.63 0.4 54.91 1.3 12 44.82
Other retail non-SMEs0.00 to <0.15 13 0.05 0.2 56.35 1.8 1 9.370.15 to <0.25 1 0.23 <0.1 51.47 1.4 0 24.510.25 to <0.50 4 0.39 <0.1 56.14 2.2 2 37.840.50 to <0.75 4 0.64 <0.1 57.47 1.1 2 51.440.75 to <2.50 7 1.28 0.1 55.10 1.4 4 64.962.50 to <10.00 9 4.51 0.1 56.02 1.3 7 86.4510.00 to <100.00 1 31.12 <0.1 56.77 1.2 1 89.15100.00 (Default) 0 0 0 0 0 0 0Sub-total 38 2.24 0.5 56.10 1.6 18 46.83
Total (all exposureclasses) 159,626 0.27 17.1 35.53 1.0 26,526 16.62
The RWA for our counterparty credit risk portfolio treated in the advanced IRBA were at € 23.1 billion as of December 31,2018, compared to € 26.5 billion as of June 2018. The overall decrease by € 3.5 billion is mostly related to the deleveragingactivities and termination of trades in our Corporate & Investment Bank.
Article 452 (e) CRR - CCR exposures within the foundationIRBAIn the following tables we show our foundation IRBA counterparty credit risk exposures, i.e. derivatives and securities financingtransactions, distributed on our internal rating scale for exposure classes central governments and central banks, institutionsas well as corporates with their relevant subcategories. CVA charges or exposures cleared through a CCP are excluded.
We show the EAD after CRM (“EAD net”), where exposures covered by guarantees or credit derivatives are assigned to theprotection seller. As a consequence the EAD net can be higher than the original balance sheet exposure.
The EAD net is presented in conjunction with exposures-weighted average PD, RWAs, the average risk weight (RW) and thenumber of obligors. In addition it provides the average LGD and average maturity, which is regulatory pre-defined in thefoundation IRB. The tables provide the defaulted exposure separately.
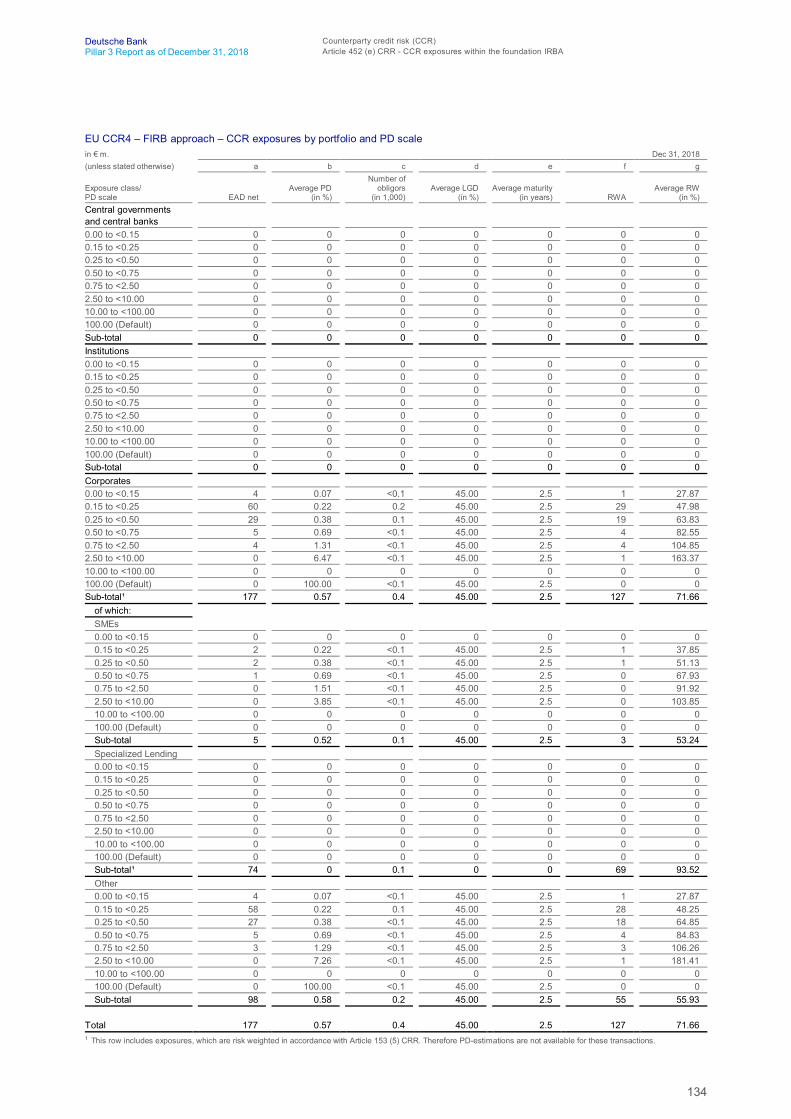
134
Deutsche Bank Counterparty credit risk (CCR)Pillar 3 Report as of December 31, 2018 Article 452 (e) CRR - CCR exposures within the foundation IRBA
EU CCR4 – FIRB approach – CCR exposures by portfolio and PD scalein € m. Dec 31, 2018(unless stated otherwise) a b c d e f g
Exposure class/PD scale EAD net
Average PD(in %)
Number ofobligors
(in 1,000)Average LGD
(in %)Average maturity
(in years) RWAAverage RW
(in %)Central governmentsand central banks0.00 to <0.15 0 0 0 0 0 0 00.15 to <0.25 0 0 0 0 0 0 00.25 to <0.50 0 0 0 0 0 0 00.50 to <0.75 0 0 0 0 0 0 00.75 to <2.50 0 0 0 0 0 0 02.50 to <10.00 0 0 0 0 0 0 010.00 to <100.00 0 0 0 0 0 0 0100.00 (Default) 0 0 0 0 0 0 0Sub-total 0 0 0 0 0 0 0Institutions0.00 to <0.15 0 0 0 0 0 0 00.15 to <0.25 0 0 0 0 0 0 00.25 to <0.50 0 0 0 0 0 0 00.50 to <0.75 0 0 0 0 0 0 00.75 to <2.50 0 0 0 0 0 0 02.50 to <10.00 0 0 0 0 0 0 010.00 to <100.00 0 0 0 0 0 0 0100.00 (Default) 0 0 0 0 0 0 0Sub-total 0 0 0 0 0 0 0Corporates0.00 to <0.15 4 0.07 <0.1 45.00 2.5 1 27.870.15 to <0.25 60 0.22 0.2 45.00 2.5 29 47.980.25 to <0.50 29 0.38 0.1 45.00 2.5 19 63.830.50 to <0.75 5 0.69 <0.1 45.00 2.5 4 82.550.75 to <2.50 4 1.31 <0.1 45.00 2.5 4 104.852.50 to <10.00 0 6.47 <0.1 45.00 2.5 1 163.3710.00 to <100.00 0 0 0 0 0 0 0100.00 (Default) 0 100.00 <0.1 45.00 2.5 0 0Sub-total¹ 177 0.57 0.4 45.00 2.5 127 71.66
of which:SMEs0.00 to <0.15 0 0 0 0 0 0 00.15 to <0.25 2 0.22 <0.1 45.00 2.5 1 37.850.25 to <0.50 2 0.38 <0.1 45.00 2.5 1 51.130.50 to <0.75 1 0.69 <0.1 45.00 2.5 0 67.930.75 to <2.50 0 1.51 <0.1 45.00 2.5 0 91.922.50 to <10.00 0 3.85 <0.1 45.00 2.5 0 103.8510.00 to <100.00 0 0 0 0 0 0 0100.00 (Default) 0 0 0 0 0 0 0Sub-total 5 0.52 0.1 45.00 2.5 3 53.24Specialized Lending0.00 to <0.15 0 0 0 0 0 0 00.15 to <0.25 0 0 0 0 0 0 00.25 to <0.50 0 0 0 0 0 0 00.50 to <0.75 0 0 0 0 0 0 00.75 to <2.50 0 0 0 0 0 0 02.50 to <10.00 0 0 0 0 0 0 010.00 to <100.00 0 0 0 0 0 0 0100.00 (Default) 0 0 0 0 0 0 0Sub-total¹ 74 0 0.1 0 0 69 93.52Other0.00 to <0.15 4 0.07 <0.1 45.00 2.5 1 27.870.15 to <0.25 58 0.22 0.1 45.00 2.5 28 48.250.25 to <0.50 27 0.38 <0.1 45.00 2.5 18 64.850.50 to <0.75 5 0.69 <0.1 45.00 2.5 4 84.830.75 to <2.50 3 1.29 <0.1 45.00 2.5 3 106.262.50 to <10.00 0 7.26 <0.1 45.00 2.5 1 181.4110.00 to <100.00 0 0 0 0 0 0 0100.00 (Default) 0 100.00 <0.1 45.00 2.5 0 0Sub-total 98 0.58 0.2 45.00 2.5 55 55.93
Total 177 0.57 0.4 45.00 2.5 127 71.661 This row includes exposures, which are risk weighted in accordance with Article 153 (5) CRR. Therefore PD-estimations are not available for these transactions.
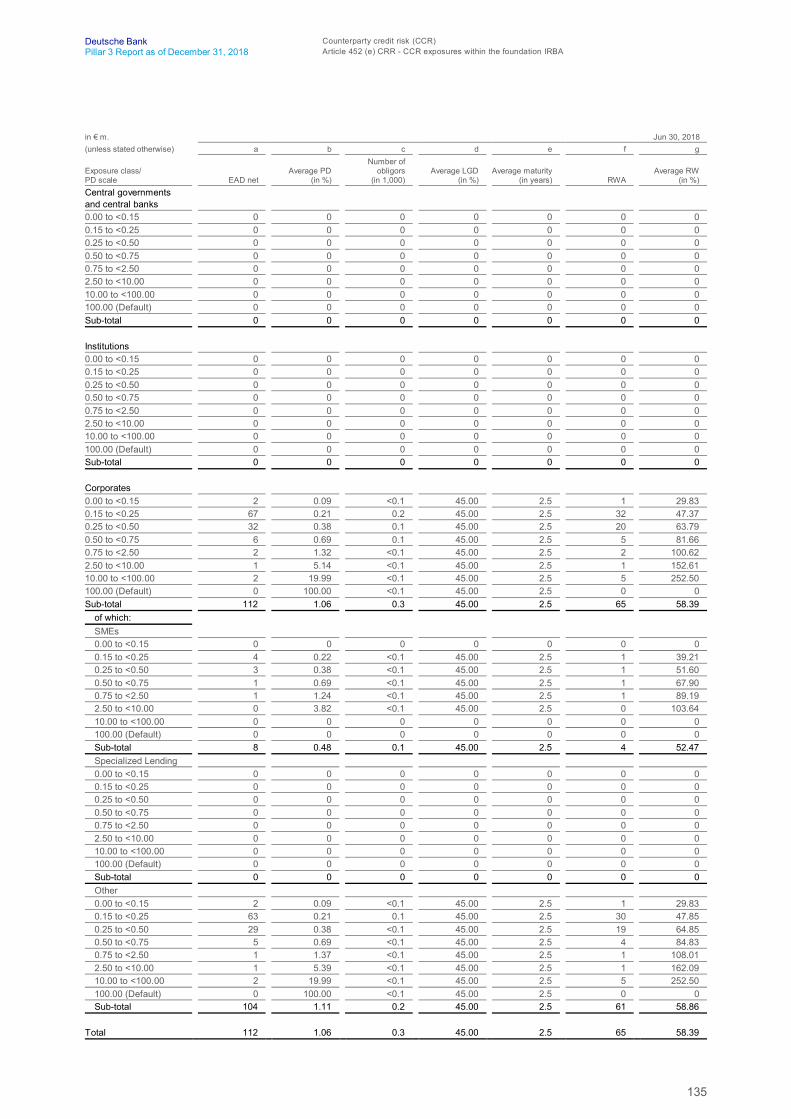
135
Deutsche Bank Counterparty credit risk (CCR)Pillar 3 Report as of December 31, 2018 Article 452 (e) CRR - CCR exposures within the foundation IRBA
in € m. Jun 30, 2018(unless stated otherwise) a b c d e f g
Exposure class/PD scale EAD net
Average PD(in %)
Number ofobligors
(in 1,000)Average LGD
(in %)Average maturity
(in years) RWAAverage RW
(in %)Central governmentsand central banks0.00 to <0.15 0 0 0 0 0 0 00.15 to <0.25 0 0 0 0 0 0 00.25 to <0.50 0 0 0 0 0 0 00.50 to <0.75 0 0 0 0 0 0 00.75 to <2.50 0 0 0 0 0 0 02.50 to <10.00 0 0 0 0 0 0 010.00 to <100.00 0 0 0 0 0 0 0100.00 (Default) 0 0 0 0 0 0 0Sub-total 0 0 0 0 0 0 0
Institutions0.00 to <0.15 0 0 0 0 0 0 00.15 to <0.25 0 0 0 0 0 0 00.25 to <0.50 0 0 0 0 0 0 00.50 to <0.75 0 0 0 0 0 0 00.75 to <2.50 0 0 0 0 0 0 02.50 to <10.00 0 0 0 0 0 0 010.00 to <100.00 0 0 0 0 0 0 0100.00 (Default) 0 0 0 0 0 0 0Sub-total 0 0 0 0 0 0 0
Corporates0.00 to <0.15 2 0.09 <0.1 45.00 2.5 1 29.830.15 to <0.25 67 0.21 0.2 45.00 2.5 32 47.370.25 to <0.50 32 0.38 0.1 45.00 2.5 20 63.790.50 to <0.75 6 0.69 0.1 45.00 2.5 5 81.660.75 to <2.50 2 1.32 <0.1 45.00 2.5 2 100.622.50 to <10.00 1 5.14 <0.1 45.00 2.5 1 152.6110.00 to <100.00 2 19.99 <0.1 45.00 2.5 5 252.50100.00 (Default) 0 100.00 <0.1 45.00 2.5 0 0Sub-total 112 1.06 0.3 45.00 2.5 65 58.39
of which:SMEs0.00 to <0.15 0 0 0 0 0 0 00.15 to <0.25 4 0.22 <0.1 45.00 2.5 1 39.210.25 to <0.50 3 0.38 <0.1 45.00 2.5 1 51.600.50 to <0.75 1 0.69 <0.1 45.00 2.5 1 67.900.75 to <2.50 1 1.24 <0.1 45.00 2.5 1 89.192.50 to <10.00 0 3.82 <0.1 45.00 2.5 0 103.6410.00 to <100.00 0 0 0 0 0 0 0100.00 (Default) 0 0 0 0 0 0 0Sub-total 8 0.48 0.1 45.00 2.5 4 52.47Specialized Lending0.00 to <0.15 0 0 0 0 0 0 00.15 to <0.25 0 0 0 0 0 0 00.25 to <0.50 0 0 0 0 0 0 00.50 to <0.75 0 0 0 0 0 0 00.75 to <2.50 0 0 0 0 0 0 02.50 to <10.00 0 0 0 0 0 0 010.00 to <100.00 0 0 0 0 0 0 0100.00 (Default) 0 0 0 0 0 0 0Sub-total 0 0 0 0 0 0 0Other0.00 to <0.15 2 0.09 <0.1 45.00 2.5 1 29.830.15 to <0.25 63 0.21 0.1 45.00 2.5 30 47.850.25 to <0.50 29 0.38 <0.1 45.00 2.5 19 64.850.50 to <0.75 5 0.69 <0.1 45.00 2.5 4 84.830.75 to <2.50 1 1.37 <0.1 45.00 2.5 1 108.012.50 to <10.00 1 5.39 <0.1 45.00 2.5 1 162.0910.00 to <100.00 2 19.99 <0.1 45.00 2.5 5 252.50100.00 (Default) 0 100.00 <0.1 45.00 2.5 0 0Sub-total 104 1.11 0.2 45.00 2.5 61 58.86
Total 112 1.06 0.3 45.00 2.5 65 58.39

136
Deutsche Bank Counterparty credit risk (CCR)Pillar 3 Report as of December 31, 2018 Article 439 (e) CRR - CCR exposures after credit risk mitigation
Article 438 (d) CRR - Development of CCR RWAThe following table provides an analysis of key drivers for RWA movements observed for counterparty credit risk exposurescalculated under the internal model method (IMM) in the current and previous reporting period. It also shows the correspondingmovements in capital requirements, derived from the RWA by an 8 % capital ratio.
EU CCR7 – RWA flow statement of counterparty credit risk exposures under the internal model methodThree months ended Dec 31, 2018 Three months ended Sep 30, 2018
a b a b
in € m. RWACapital
requirements RWACapital
requirements1 Counterparty credit risk RWA under the IMM opening balance 18,714 1,497 21,525 1,7222 Book size (768) (61) (1,852) (148)3 Book quality 81 7 (69) (6)4 Model updates 0 0 (850) (68)5 Methodology and policy 0 0 0 06 Acquisitions and disposals 0 0 0 07 Foreign exchange movements 50 4 (40) (3)8 Other 0 0 0 09 Counterparty credit risk RWA under the IMM closing balance 18,077 1,446 18,714 1,497
Organic changes in our portfolio size and composition are considered in the category “Book size”. The category “Book quality”mainly represents the effects from portfolio rating migrations, loss given default, model parameter recalibrations as well ascollateral coverage and netting activities. “Model updates” include model refinements and model roll out. RWA movementsresulting from externally, regulatory-driven changes, e.g. applying new regulations, are considered in the “Methodology andpolicy” section. “Acquisition and disposals” shows significant exposure movements which can be clearly assigned to newbusinesses or disposal-related activities. Changes that cannot be attributed to the above categories are reflected in thecategory “Other”.
The decrease in RWA for counterparty credit risk exposures under the IMM by 3.4 % or € 0.6 billion since September 30, 2018is predominantly driven by the category “Book size” reflecting termination of trades and deleveraging activities in our Corporate& Investment Bank. This was partly offset by smaller movements in the categories “Book quality” and “Foreign exchangemovements”.
Article 439 (e) CRR - CCR exposures after credit risk mitigationThe following tables present information on our counterparty credit risk (CCR) exposure and the impact of netting and collateralheld as well as the composition of collateral used in both derivatives transactions and securities financing transactions (SFT).
Table EU CCR5-A below provides the gross positive fair values before any credit risk mitigation, the impact of legallyenforceable master netting agreements as well as further reduction of our CCR exposure due to eligible collateral we havereceived. Given the nature of the internal model method (IMM) that we use for the measurement of the majority of ourderivatives and SFT, the simulation process of future market values across all asset classes includes, if applicable, the impactfrom regulatory netting and collateralization. Therefore the net credit exposure disclosed below differs from the regulatoryexposure value at default (EaD).
EU CCR5-A – Impact of netting and collateral held on exposure valuesDec 31, 2018
a b c d e
in € m.
Gross positivefair value or net
carrying amount Netting benefitsNetted current
credit exposure Collateral heldNet creditexposure
1 Derivatives 353,424 278,622 74,802 66,917 7,8852 Securities Financing Transactions 495,036 393,746 101,290 8,069 93,2213 Cross-product netting 0 0 0 0 04 Total 848,460 672,368 176,091 74,986 101,106
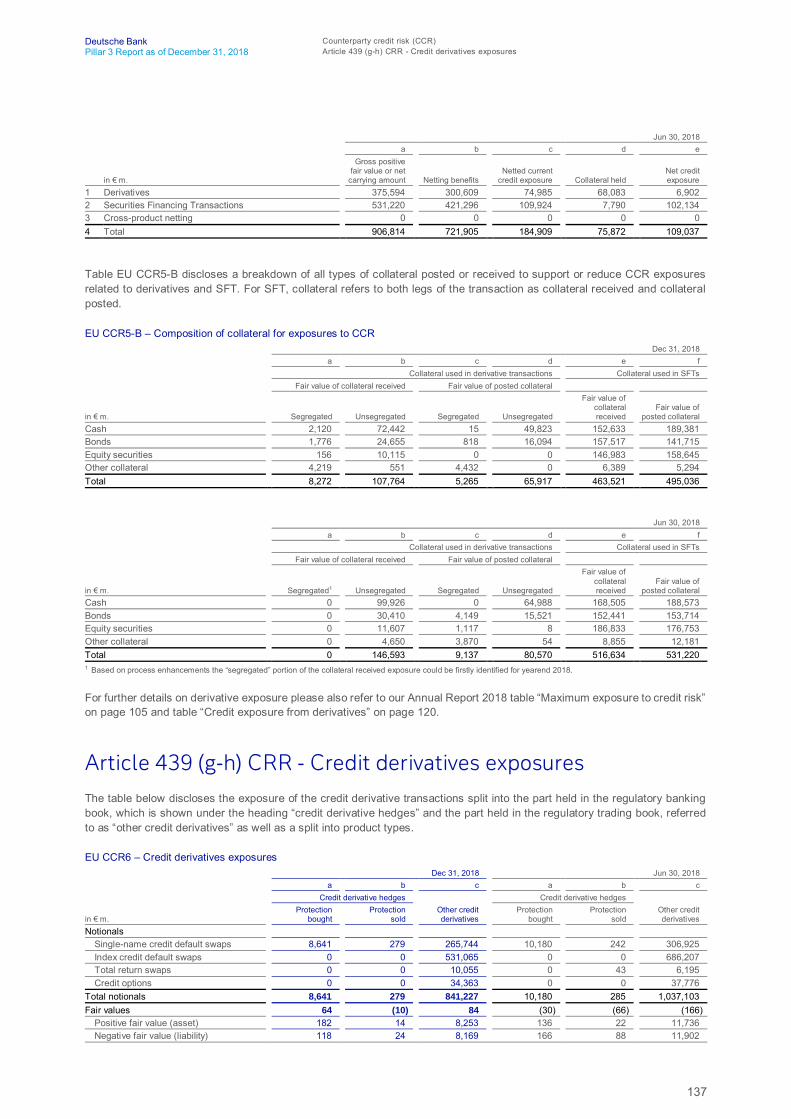
137
Deutsche Bank Counterparty credit risk (CCR)Pillar 3 Report as of December 31, 2018 Article 439 (g-h) CRR - Credit derivatives exposures
Jun 30, 2018a b c d e
in € m.
Gross positivefair value or net
carrying amount Netting benefitsNetted current
credit exposure Collateral heldNet creditexposure
1 Derivatives 375,594 300,609 74,985 68,083 6,9022 Securities Financing Transactions 531,220 421,296 109,924 7,790 102,1343 Cross-product netting 0 0 0 0 04 Total 906,814 721,905 184,909 75,872 109,037
Table EU CCR5-B discloses a breakdown of all types of collateral posted or received to support or reduce CCR exposuresrelated to derivatives and SFT. For SFT, collateral refers to both legs of the transaction as collateral received and collateralposted.
EU CCR5-B – Composition of collateral for exposures to CCRDec 31, 2018
a b c d e fCollateral used in derivative transactions Collateral used in SFTs
Fair value of collateral received Fair value of posted collateral
in € m. Segregated Unsegregated Segregated Unsegregated
Fair value ofcollateralreceived
Fair value ofposted collateral
Cash 2,120 72,442 15 49,823 152,633 189,381Bonds 1,776 24,655 818 16,094 157,517 141,715Equity securities 156 10,115 0 0 146,983 158,645Other collateral 4,219 551 4,432 0 6,389 5,294Total 8,272 107,764 5,265 65,917 463,521 495,036
Jun 30, 2018a b c d e f
Collateral used in derivative transactions Collateral used in SFTsFair value of collateral received Fair value of posted collateral
in € m. Segregated1 Unsegregated Segregated Unsegregated
Fair value ofcollateralreceived
Fair value ofposted collateral
Cash 0 99,926 0 64,988 168,505 188,573Bonds 0 30,410 4,149 15,521 152,441 153,714Equity securities 0 11,607 1,117 8 186,833 176,753Other collateral 0 4,650 3,870 54 8,855 12,181Total 0 146,593 9,137 80,570 516,634 531,2201 Based on process enhancements the “segregated” portion of the collateral received exposure could be firstly identified for yearend 2018.
For further details on derivative exposure please also refer to our Annual Report 2018 table “Maximum exposure to credit risk”on page 105 and table “Credit exposure from derivatives” on page 120.
Article 439 (g-h) CRR - Credit derivatives exposuresThe table below discloses the exposure of the credit derivative transactions split into the part held in the regulatory bankingbook, which is shown under the heading “credit derivative hedges” and the part held in the regulatory trading book, referredto as “other credit derivatives” as well as a split into product types.
EU CCR6 – Credit derivatives exposuresDec 31, 2018 Jun 30, 2018
a b c a b cCredit derivative hedges Credit derivative hedges
in € m.Protection
boughtProtection
soldOther creditderivatives
Protectionbought
Protectionsold
Other creditderivatives
NotionalsSingle-name credit default swaps 8,641 279 265,744 10,180 242 306,925Index credit default swaps 0 0 531,065 0 0 686,207Total return swaps 0 0 10,055 0 43 6,195Credit options 0 0 34,363 0 0 37,776
Total notionals 8,641 279 841,227 10,180 285 1,037,103Fair values 64 (10) 84 (30) (66) (166)
Positive fair value (asset) 182 14 8,253 136 22 11,736Negative fair value (liability) 118 24 8,169 166 88 11,902
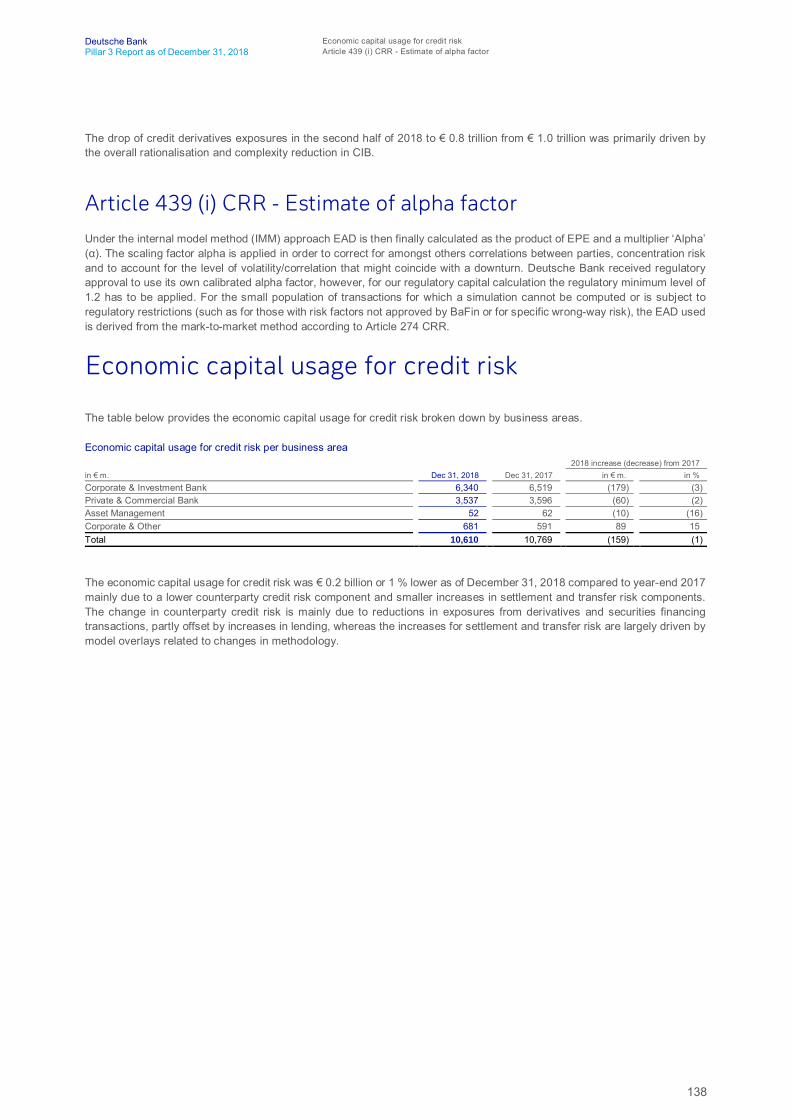
138
Deutsche Bank Economic capital usage for credit riskPillar 3 Report as of December 31, 2018 Article 439 (i) CRR - Estimate of alpha factor
The drop of credit derivatives exposures in the second half of 2018 to € 0.8 trillion from € 1.0 trillion was primarily driven bythe overall rationalisation and complexity reduction in CIB.
Article 439 (i) CRR - Estimate of alpha factorUnder the internal model method (IMM) approach EAD is then finally calculated as the product of EPE and a multiplier ‘Alpha’(α). The scaling factor alpha is applied in order to correct for amongst others correlations between parties, concentration riskand to account for the level of volatility/correlation that might coincide with a downturn. Deutsche Bank received regulatoryapproval to use its own calibrated alpha factor, however, for our regulatory capital calculation the regulatory minimum level of1.2 has to be applied. For the small population of transactions for which a simulation cannot be computed or is subject toregulatory restrictions (such as for those with risk factors not approved by BaFin or for specific wrong-way risk), the EAD usedis derived from the mark-to-market method according to Article 274 CRR.
Economic capital usage for credit risk
The table below provides the economic capital usage for credit risk broken down by business areas.
Economic capital usage for credit risk per business area 2018 increase (decrease) from 2017
in € m. Dec 31, 2018 Dec 31, 2017 in € m. in %Corporate & Investment Bank 6,340 6,519 (179) (3)Private & Commercial Bank 3,537 3,596 (60) (2)Asset Management 52 62 (10) (16)Corporate & Other 681 591 89 15Total 10,610 10,769 (159) (1)
The economic capital usage for credit risk was € 0.2 billion or 1 % lower as of December 31, 2018 compared to year-end 2017mainly due to a lower counterparty credit risk component and smaller increases in settlement and transfer risk components.The change in counterparty credit risk is mainly due to reductions in exposures from derivatives and securities financingtransactions, partly offset by increases in lending, whereas the increases for settlement and transfer risk are largely driven bymodel overlays related to changes in methodology.

139
Deutsche Bank Market riskPillar 3 Report as of December 31, 2018 Qualitative information on the internal model approach
Market risk
Own funds requirements for market risk under the standardizedapproach
Article 445 CRR - Market Risk Standardized Approach
As of December 31, 2018, the securitization positions, for which the specific interest rate risk is calculated using the marketrisk standardized approach, generated capital requirements of € 418 million corresponding to risk weighted-assets of € 5.2billion. As of June 30, 2018 these positions generated capital requirements of € 326.8 million corresponding to risk weighted-assets of € 4.1 billion. The change in the period is due to increases in inventory.
For nth-to-default credit default swaps the capital requirement was € 2.6 million corresponding to risk weighted-assets of € 33million as of December 31, 2018, compared with € 1.9 million and € 23.4 million as of June 30, 2018.
The capital requirement for Collective Investment Undertakings under the market risk standardized approach was € 14 millioncorresponding to risk weighted-assets of € 180 million as of December 31, 2018, compared with € 12 million and € 156 millionas of June 30, 2018.
The capital requirement for longevity risk under the market risk standardized approach was € 14 million corresponding to risk-weighted assets of € 180 million as of December 31, 2018, compared with € 13 million and € 167 million as of June 30, 2018.
EU MR1 – Market risk under the standardized approachDec 31, 2018 Jun 30, 2018
a b a b
in € m. RWACapital
requirements RWACapital
requirementsOutright products
1 Interest rate risk (general and specific) 0 0 0 02 Equity risk (general and specific)¹ 144 12 125 103 Foreign exchange risk² 125 10 139 114 Commodity risk 0 0 0 04a Longevity risk 180 14 167 13
Options5 Simplified approach 0 0 0 06 Delta-plus method 0 0 0 07 Scenario approach 0 0 0 08 Securitization (specific risk)³ 5,224 418 4,085 3279 Total 5,673 454 4,516 3611 Equity risk RWA of € 144 million is from collective investment undertakings.2 Foreign Exchange risk RWA includes € 89 million from the former Postbank portfolio and € 36 million from collective investment undertakings.3 Securitization RWA of € 5,224 million includes the nth to default component.
Qualitative information on the internal model approach
Article 455 (a)(i) CRR - Characteristics of the market risk models
Market risk measurement
Market Risk Management aims to accurately measure all types of market risks by a comprehensive set of risk metrics reflectingeconomic and regulatory requirements.
In accordance with economic and regulatory requirements, we measure market and related risks using several key riskmetrics:
Internally developed market risk models– Value-at-risk (“VaR”) and stressed value-at-risk (“SVaR”), including CVA VaR and SVaR– Incremental risk charge
140
Deutsche Bank Market riskPillar 3 Report as of December 31, 2018 Qualitative information on the internal model approach
– Comprehensive risk measure (decommissioned for regulatory purposes within the fourth quarter 2018 based on ECBapproval)
Market risk standardized approaches– Market Risk Standardized Approach (“MRSA”), applied to investment funds with no look through, MRSA-eligible
securitizations and positions subject to longevity risk
Stress testing measures– Portfolio stress testing– Business-level stress testing– Event risk scenarios
Economic capital measures– Market risk economic capital, including traded default risk
Other model derived and market observable metrics– Sensitivities– Market value/notional (concentration risk)– Loss given default
These measures are viewed as complementary to each other and in aggregate define the market risk framework, by which allbusinesses can be measured and monitored.
Internally developed market risk models
Value-at-Risk (VaR) at Deutsche Bank GroupVaR is a quantitative measure of the potential loss (in value) of Fair Value positions due to market movements that should notbe exceeded in a defined period of time and with a defined confidence level.
We calculate VaR using a 99 % confidence level and a one day holding period. This means we estimate there isa 1 in 100 chance that a mark-to-market loss from our trading positions will be at least as large as the reported VaR. Forregulatory purposes, which include the calculation of our risk-weighted assets, the holding period is ten days.
We use one year of historical market data as input to calculate VaR. The calculation employs a Monte Carlo Simulationtechnique, and we assume that changes in risk factors follow a well-defined distribution, e.g. normal or non-normal(t, skew-t, Skew-Normal). To determine our aggregated VaR, we use observed correlations between the risk factors duringthis one year period.
Our VaR model is designed to take into account a comprehensive set of risk factors across all asset classes. Key risk factorsare swap/government curves, index and issuer-specific credit curves, funding spreads, single equity and index prices, foreignexchange rates, commodity prices as well as their implied volatilities. To help ensure completeness in the risk coverage,second order risk factors, e.g. CDS index vs. constituent basis, money market basis, implied dividends, option-adjustedspreads and precious metals lease rates are considered in the VaR calculation.
For each business unit a separate VaR is calculated for each risk type, e.g. interest rate risk, credit spread risk, equity risk,foreign exchange risk and commodity risk. For each risk type this is achieved by deriving the sensitivities to the relevant risktype and then simulating changes in the associated risk drivers. “Diversification effect” reflects the fact that the total VaR on agiven day will be lower than the sum of the VaR relating to the individual risk types. Simply adding the VaR figures of theindividual risk types to arrive at an aggregate VaR would imply the assumption that the losses in all risk types occursimultaneously.
The model incorporates both linear and, especially for derivatives, nonlinear effects through a combination of sensitivity-basedand revaluation approaches.
The VaR measure enables us to apply a consistent measure across all of our fair value businesses and products. It allows acomparison of risk in different businesses, and also provides a means of aggregating and netting positions within a portfolioto reflect correlations and offsets between different asset classes. Furthermore, it facilitates comparisons of our market riskboth over time and against our daily trading results.
When using VaR estimates a number of considerations should be taken into account. These include:
141
Deutsche Bank Market riskPillar 3 Report as of December 31, 2018 Qualitative information on the internal model approach
– The use of historical market data may not be a good indicator of potential future events, particularly those that are extremein nature. This “backward-looking” limitation can cause VaR to understate future potential losses (as in 2008), but can alsocause it to be overstated.
– Assumptions concerning the distribution of changes in risk factors, and the correlation between different risk factors, maynot hold true, particularly during market events that are extreme in nature. The one day holding period does not fully capturethe market risk arising during periods of illiquidity, when positions cannot be closed out or hedged within one day.
– VaR does not indicate the potential loss beyond the 99th quantile.– Intra-day risk is not captured.– There may be risks in the trading or banking book that are partially or not captured by the VaR model.
We are committed to the ongoing development of our internal risk models, and we allocate substantial resources to reviewing,validating and improving them. Additionally, we have further developed and improved our process of systematically capturingand evaluating risks currently not captured in our value-at-risk model. An assessment is made to determine the level ofmateriality of these risks and material risks are prioritized for inclusion in our internal model. Risks not in value-at-risk aremonitored and assessed on a regular basis through our Risk Not In VaR (RNIV) framework.
Stressed Value-at-Risk (SVaR)We calculate a stressed value-at-risk measure using a 99 % confidence level and a holding period of one day. For regulatorypurposes, the holding period is ten days.
Our stressed value-at-risk calculation utilizes the same systems, trade information and processes as those used for thecalculation of value-at-risk. The only difference is that historical market data from a period of significant financial stress (i.e.,characterized by high volatilities) is used as an input for the Monte Carlo Simulation. The time window selection process forthe stressed value-at-risk calculation is based on the identification of a time window characterized by high levels of volatilityin the top value-at-risk contributors. The identified window is then further validated by comparing the SVaR results toneighboring windows using the complete DB Group portfolio.
CVA Value-at-Risk/ Stressed Value-at-RiskThe advanced approach CVA risk capital charge is determined by applying the VaR model. First, the exposure profiles aredetermined based on the internal model method (IMM) or the mark-to-market method. The next step consists in determiningthe synthetic CVA position based on the exposure profile and other risk parameters such as credit spreads. Based on thisinformation the credit spread sensitivity is then calculated. Eligible CVA hedges are also incorporated and the CVA risk capitalcharge is determined based on the internal market risk models VaR and Stressed VaR using a 99 % confidence level and a10-day holding period.
Article 455 (a)(ii) CRR - Incremental risk charge and comprehensive risk measure
Incremental risk charge (“IRC”)
The incremental risk charge is based on our own internal model and is intended to complement the value-at-risk modelingframework. It represents an estimate of the default and rating migration risks of unsecuritized credit products over a one-yearcapital horizon at a 99.9 % confidence level, employing a constant position approach. We use a Monte Carlo Simulation forcalculating incremental risk charge as the 99.9 % quantile of the portfolio loss distribution and for allocating contributoryincremental risk charge to individual positions. The model captures the default and migration risk in an accurate and consistentquantitative approach for all portfolios. Important parameters for the incremental risk charge calculation are exposures,recovery rates, maturity, ratings with corresponding default and migration probabilities and parameters specifying issuercorrelations.
We calculate the incremental risk charge on a weekly basis. For regulatory reporting purposes, the charge is determined asthe higher of the most recent 12 week average of incremental risk charge and the most recent incremental risk charge.
The contributory incremental risk charge of individual positions, which is calculated by expected shortfall allocation, providesthe basis for identifying risk concentrations in the portfolio.
Default and rating migration probabilities are defined by rating migration matrices which are calibrated on historical externalrating data. Taking into account the trade-off between granularity of matrices and their stability we apply a global corporatematrix and a sovereign matrix comprising the seven main rating non-default states and one default state. Accordingly, issueor issuer ratings from the rating agencies Moody’s, S&P and Fitch are assigned to each position.
To quantify a loss due to rating migration, a revaluation of a position is performed under the new rating. The probability of jointrating downgrades and defaults is determined by the migration and rating correlations of the incremental risk charge model.These correlations are specified through systematic factors that represent geographical regions and industries and are
142
Deutsche Bank Market riskPillar 3 Report as of December 31, 2018 Qualitative information on the internal model approach
calibrated on historical rating migration and equity time series. The simulation is based on the assumption of a constantposition approach where differences in maturities of long and short positions are taken into account.
As the default state is absorbing, defaulted positions do not generate any further losses from rating migrations. The price riskof defaulted debt is modeled by stochastic recoveries.
Direct validation of the incremental risk charge through back-testing methods is not possible. The charge is subject to validationprinciples such as the evaluation of conceptual soundness, ongoing monitoring and process and outcome analysis. Modelvalidation relies more on indirect methods including stress tests and sensitivity analyses. Relevant parameters are includedin the annual validation cycle established in the current regulatory framework. The incremental risk charge is part of the regulargroup-wide stress test using the stress testing functionality within our credit engine. Stressed incremental risk charge figuresare reported on group level and submitted to the Stress Test Council (STC) and the Enterprise Risk Committee (ERC).
Comprehensive risk measure (“CRM”)
Up to its decommissioning the comprehensive risk measure for the corporate correlation trading portfolio was based on ourown internal model. We calculated the comprehensive risk measure based on a Monte Carlo Simulation technique to a 99.9 %confidence level and a capital horizon of one year. Our model was applied to the eligible correlation trading positions wheretypical products include collateralized debt obligations, nth-to-default credit default swaps, and commonly traded index- andsingle-name credit default swaps. Re-securitizations or products which referenced retail claims or real estate exposures werenot eligible. Furthermore, trades subject to the comprehensive risk measure had to meet minimum liquidity standards to beeligible. The model incorporated concentrations of the portfolio and nonlinear effects via a full revaluation approach.
Comprehensive risk measure was designed to capture defaults as well as the following risk drivers: interest rates, creditspreads, recovery rates, foreign exchange rates and base correlations, index-to-constituent and base correlation basis risks.
Comprehensive risk measure was calculated on a weekly basis. Initially, the eligible trade population within the correlationtrading portfolio was identified. Secondly, the risk drivers of the P&L were simulated over a one year time horizon. The tradepopulation was then re-valued under the various Monte Carlo Simulation scenarios and the 99.9 % quantile of the lossdistribution was extracted.
The market and position data were collected from front office systems and were subject to quality control. The comprehensiverisk measure figures were closely monitored and played a significant role in the management of the correlation trading portfolio.We used three years of historical market data to estimate the risk drivers to the comprehensive risk measure.
In our comprehensive risk measure model the liquidity horizon was set to 12 months, which equals the capital horizon.
In order to maintain the quality of our comprehensive risk measure model we continually monitored the potential weaknessesof this model. Backtesting of the trade valuations and the propagation of single risk factors were carried out on a monthly basisand a quarterly recalibration of parameters was performed. In addition, a series of stress tests had been defined on thecorrelation trading portfolio where the shock sizes linked into historical distressed market conditions.
An independent model validation team reviewed all quantitative aspects of our CRM model on a regular basis. The reviewcovered, but was not limited to, model assumptions, calibration approaches for risk parameters, and model performance.
For regulatory reporting purposes, the comprehensive risk measure represented the higher of the internal model spot valueat the reporting dates, their preceding 12-week average calculation, and the floor, where the floor was equal to 8 % of theequivalent capital charge under the standardized approach securitization framework.
Market risk standardized approachMarket Risk Management monitors exposures and addresses risk issues and concentrations for certain exposures under thespecific Market Risk Standardized Approach (“MRSA”). We use the MRSA to determine the regulatory capital charge for thespecific market risk of trading book securitizations (see section “Article 449 (h) CRR - RWA calculation approaches forsecuritization positions” and therein section “Calculation of regulatory capital requirements for trading book securitizations” onpage 159).
We also use the MRSA to determine the regulatory capital charge for longevity risk as set out in CRR/CRD 4 regulations.Longevity risk is the risk of adverse changes in life expectancies resulting in a loss in value on longevity linked policies andtransactions. For risk management purposes, stress testing and economic capital allocations are also used to monitor andmanage longevity risk.
Furthermore, certain types of investment funds require a capital charge under the MRSA. For risk management purposes,these positions are also included in our internal reporting framework.

143
Deutsche Bank Market riskPillar 3 Report as of December 31, 2018 Qualitative information on the internal model approach
Article 455 (a)(iii) CRR - Market risk stress testing
Stress testing is a key risk management technique, which evaluates the potential effects of extreme market events andextreme movements in individual risk factors. It is one of the core quantitative tools used to assess the market risk of DeutscheBank’s positions and complements VaR and Economic Capital. Market Risk Management performs several types of stresstesting to capture the variety of risks: Portfolio Stress Testing, individual specific stress tests, Event Risk Scenarios, and alsocontributes to Group-wide stress testing. These are also set at varying severities ranging from extreme for capital adequacyassessment to mild for earning stability purposes.
Portfolio Stress Testing measures the profit and loss impact of potential market events based on a broad range of historicalor hypothetical macro-economic scenarios considered to be severe and plausible. It is used to manage systemic tail risk andinforms on earnings stability and capital resilience. Ad-hoc stress tests are regularly designed to manage risk in advance ofand during key events or to focus on a particular area of interest.
For individual specific stress tests, market risk managers identify relevant risk factors and develop stress scenarios relatingeither to macro-economic or business-specific developments. Specific stress tests capture idiosyncratic and basis risks.
Event risk scenario measures the profit and loss impact of historically observable events or hypothetical situations on tradingpositions for specific emerging market countries and regions. The bank’s trading book exposure to an individual country isstressed under a single scenario, which replicates market movements across that country in times of significant market crisisand reduced liquidity.
In addition, Market Risk Management participates in the Group-wide stress test process, where macro-economic scenariosare defined by ERM Risk Research and each risk department translates that same scenario to the relevant shocks requiredto apply to their portfolio. This includes credit, market and operational risks.
Tail risk or the potential for extreme loss events beyond reported value-at-risk is captured via stress testing, stressed value-at-risk, economic capital, incremental risk charge and comprehensive risk measure.
Article 455 (a)(iv) CRR - Methodology for backtesting and model validation
Regulatory backtesting of trading market risk
We continually analyze potential weaknesses of our value-at-risk model using statistical techniques, such as backtesting, andalso rely on risk management experience.
Backtesting is a procedure used to assess the predictive accuracy of the value-at-risk calculations involving the comparisonof hypothetical daily profits and losses under the buy-and-hold assumption (‘daily buy-and hold income’) to the daily value-at-risk. Under this assumption we estimate the P&L impact that would have resulted on a portfolio for a trading day valued withcurrent market prices and parameters assuming it had been left untouched for that day and compare it with the estimates fromthe value-at-risk model from the preceding day. Our calculation of hypothetical daily profits and losses (buy & hold income)excludes gains and losses from intraday trading, fees and commissions, carry (including net interest margins), reserves andother miscellaneous revenues. An outlier is a hypothetical buy-and-hold trading loss that exceeds our value-at-risk from thepreceding day. On average, we would expect a 99 % confidence level to give rise to two to three outliers representing 1 % ofapproximately 260 trading days in any one year. We analyze and document underlying reasons for outliers and classify themeither as due to market movements, risks not included in our value-at-risk model, model or process shortcomings. We use theresults for further enhancement of our value-at-risk methodology. Formal communications explaining the reasons behind anyoutlier on Group level are provided to the BaFin and the ECB.
In addition to the standard backtesting analysis at the value-at-risk quantile, the value-at-risk model performance is furtherverified by analyzing the distributional fit across the whole of the distribution (full distribution backtesting). Regular backtestingis also undertaken on hypothetical portfolios to test value-at-risk performance of particular products and their hedges.
There are various Backtesting forums, with participation from Market Risk Management, Market Risk Analysis, ModelValidation, and Finance, that regularly review backtesting results as a whole and of individual businesses. They analyzeperformance fluctuations and assess the predictive power of our value-at-risk model, which allows us to improve and adjustthe risk estimation process accordingly.
An independent model validation team reviews all quantitative aspects of our Value-at-Risk model on a regular basis. Thereview covers, but is not limited to, model assumptions, calibration approaches for risk parameters, and model performance.
144
Deutsche Bank Market riskPillar 3 Report as of December 31, 2018 Qualitative information on the internal model approach
Holistic validation process
The Holistic Validation (“HV”) process provides a comprehensive assessment of the market risk management frameworkacross four key control areas: Backtesting, Process, Model Validation, and Risks not in Model (e.g. Risks not in VaR). The HVprocess is run on a quarterly basis and consists of preparing detailed reports (HV Control Packs & Dashboards) that includeboth quantitative and qualitative Key Performance Indicator (“KPI”) based assessments across these four key control areas.Reports are produced for VaR, EC and PST across asset classes / global business areas (e.g. Core Rates, Global CreditTrading, Global Markets-Equities), capital & risk measures (CRM, CVA, IMM and IRC) and as regional cuts (APAC, Americas/ US-IHC). The associated formal quarterly HV governance framework is as follows:
– Level 1: A series of asset-class level HV Control Pack Review meetings (chaired by the respective Market RiskManagement Asset Class Head or delegate), at which the respective HV Control Pack is reviewed and the HV DashboardKPI status and associated commentary / “path-to-green” agreed across all key control areas.
– Level 2: The HV Governance Council (HVGC) chaired by the Global Head of Market Risk Management (with the MRMExCo in attendance) at which HV dashboards and key themes are presented by the respective Market Risk ManagementAsset Class Heads. Key decisions and outputs from the HVGC include finalizing the overall HV Dashboard status, executivesummaries and overall themes, and prioritizing issues for remediation and agreeing escalations, if any.
– Level 3: Top-level HV governance is achieved via the Global Head of MRM summarizing key themes to the Group RiskCommittee (GRC) on a case-by-case basis. The CRO may optionally present to the Management Board themes and resultsdeemed of sufficient importance. The Supervisory Board may also be kept informed by Office of the Chief Risk Officer(OCRO) via summarized briefings.
At yearend 2018, our value-at-risk and stressed value-at-risk multiplier was at 4.0 versus the regulatory floor of three.
Article 455 (b) CRR - Regulatory approval for market risk models
Our value-at-risk for the trading businesses is based on our own internal model. In October 1998, the German BankingSupervisory Authority (now the BaFin) approved our internal model for calculating the regulatory market risk capital for ourgeneral and specific market risks. Since then the model has been continually refined and approval has been maintained.
We also have received approval to use the other internally-developed models described above in the calculation ofregulatory capital: SVaR (including CVA VaR and SVaR), Incremental Risk Charge as well as Comprehensive RiskMeasure, where the letter has been decommissioned in 2018 based on respective ECB approval.
Article 455 (c) CRR - Trading book allocation and prudent valuation
Allocation of positions to the regulatory trading book
For European regulatory purposes all our positions must be assigned to either the trading book or the banking book. Thisclassification of a position impacts its regulatory treatment, in particular the calculation of the regulatory capital charges for theposition. We define the criteria for the allocation of positions to either the trading book or banking book in internal policydocuments, which were based on the respective requirements applicable to the Group contained in Articles 102 to 106 of theCRR.
A central function in Finance is responsible for the policy guidance and is the center of competence with regard to questionsconcerning its application. The Finance functions for the individual business areas are responsible for the classification ofpositions in line with the policy requirements.
We include positions in the trading book that are financial instruments or commodities which are held with trading intent orwhich are held for the purpose of hedging other trading book positions.
Positions included in the trading book must be free of any restrictive covenants regarding their transferability or able to behedged.
Moreover, positions assigned to the trading book must be valued daily. Further information on the valuation methodology thatwe used is provided in our Annual Report 2018, Note 13 “Financial instruments carried at fair value”, page 273.
As part of the ongoing procedures to confirm that the inclusion of positions in the trading book continues to be in line with theabove referenced internal policy guidance, the Finance functions for our trading businesses carry out a global review of theclassification of positions on a quarterly basis. The results of the review are documented and presented to the Trading BookReview Forum with representatives from Finance and Legal.
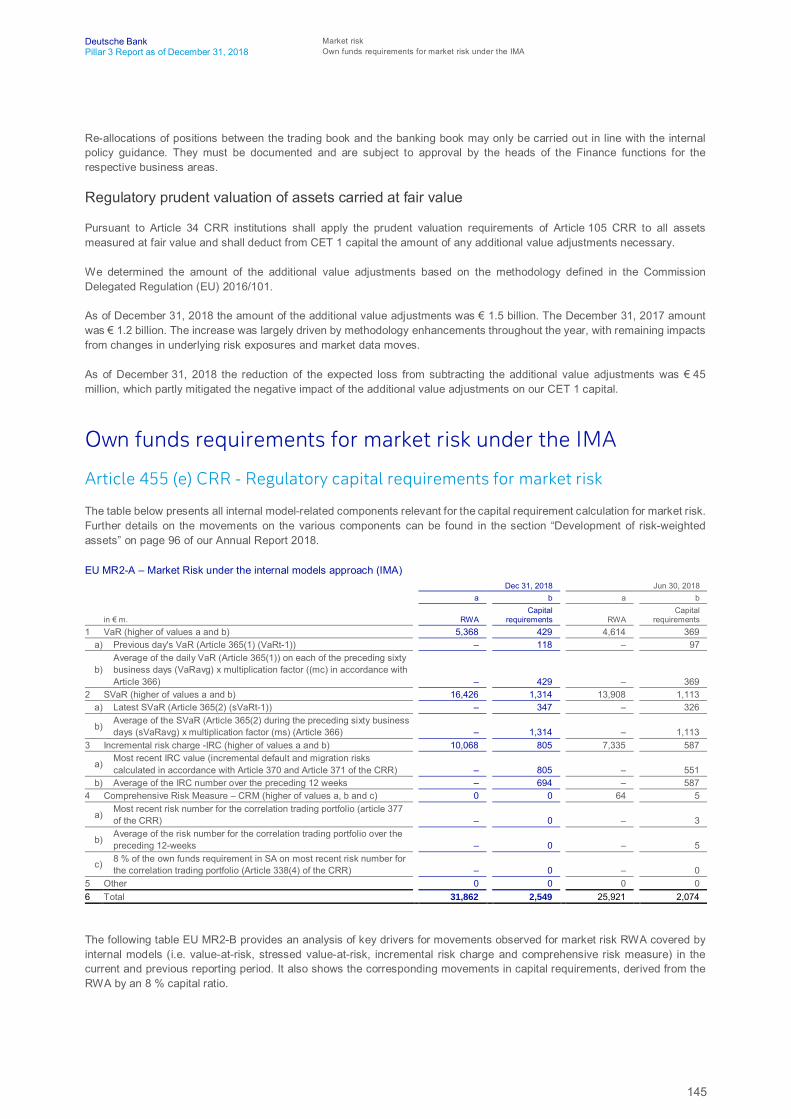
145
Deutsche Bank Market riskPillar 3 Report as of December 31, 2018 Own funds requirements for market risk under the IMA
Re-allocations of positions between the trading book and the banking book may only be carried out in line with the internalpolicy guidance. They must be documented and are subject to approval by the heads of the Finance functions for therespective business areas.
Regulatory prudent valuation of assets carried at fair value
Pursuant to Article 34 CRR institutions shall apply the prudent valuation requirements of Article 105 CRR to all assetsmeasured at fair value and shall deduct from CET 1 capital the amount of any additional value adjustments necessary.
We determined the amount of the additional value adjustments based on the methodology defined in the CommissionDelegated Regulation (EU) 2016/101.
As of December 31, 2018 the amount of the additional value adjustments was € 1.5 billion. The December 31, 2017 amountwas € 1.2 billion. The increase was largely driven by methodology enhancements throughout the year, with remaining impactsfrom changes in underlying risk exposures and market data moves.
As of December 31, 2018 the reduction of the expected loss from subtracting the additional value adjustments was € 45million, which partly mitigated the negative impact of the additional value adjustments on our CET 1 capital.
Own funds requirements for market risk under the IMA
Article 455 (e) CRR - Regulatory capital requirements for market risk
The table below presents all internal model-related components relevant for the capital requirement calculation for market risk.Further details on the movements on the various components can be found in the section “Development of risk-weightedassets” on page 96 of our Annual Report 2018.
EU MR2-A – Market Risk under the internal models approach (IMA)Dec 31, 2018 Jun 30, 2018
a b a b
in € m. RWACapital
requirements RWACapital
requirements1 VaR (higher of values a and b) 5,368 429 4,614 369
a) Previous day's VaR (Article 365(1) (VaRt-1)) – 118 – 97
b)Average of the daily VaR (Article 365(1)) on each of the preceding sixtybusiness days (VaRavg) x multiplication factor ((mc) in accordance withArticle 366) – 429 – 369
2 SVaR (higher of values a and b) 16,426 1,314 13,908 1,113a) Latest SVaR (Article 365(2) (sVaRt-1)) – 347 – 326
b) Average of the SVaR (Article 365(2) during the preceding sixty businessdays (sVaRavg) x multiplication factor (ms) (Article 366) – 1,314 – 1,113
3 Incremental risk charge -IRC (higher of values a and b) 10,068 805 7,335 587
a) Most recent IRC value (incremental default and migration riskscalculated in accordance with Article 370 and Article 371 of the CRR) – 805 – 551
b) Average of the IRC number over the preceding 12 weeks – 694 – 5874 Comprehensive Risk Measure – CRM (higher of values a, b and c) 0 0 64 5
a) Most recent risk number for the correlation trading portfolio (article 377of the CRR) – 0 – 3
b) Average of the risk number for the correlation trading portfolio over thepreceding 12-weeks – 0 – 5
c) 8 % of the own funds requirement in SA on most recent risk number forthe correlation trading portfolio (Article 338(4) of the CRR) – 0 – 0
5 Other 0 0 0 06 Total 31,862 2,549 25,921 2,074
The following table EU MR2-B provides an analysis of key drivers for movements observed for market risk RWA covered byinternal models (i.e. value-at-risk, stressed value-at-risk, incremental risk charge and comprehensive risk measure) in thecurrent and previous reporting period. It also shows the corresponding movements in capital requirements, derived from theRWA by an 8 % capital ratio.

146
Deutsche Bank Market riskPillar 3 Report as of December 31, 2018 Own funds requirements for market risk under the IMA
EU MR2-B – RWA flow statements of market risk exposures under the IMAThree months ended Dec 31, 2018
a b c d e f g
in € m. VaR SVaR IRC
Compre-hensive
risk measure Other Total RWATotal capital
requirements1 Market Risk RWA opening balance¹ 4,542 12,946 7,854 53 0 25,395 2,0321a Regulatory adjustment² (3,483) (9,989) 0 0 0 (13,471) (1,078)1b RWA at the previous quarter-end (end of
the day)³ 1,059 2,957 7,854 53 0 11,924 9542 Movement in risk levels 245 1,317 2,214 0 0 3,776 3023 Model updates/changes 80 62 0 0 0 141 114 Methodology and policy 0 0 0 (53) 0 (53) (4)5 Acquisitions and disposals 0 0 0 0 0 0 06 Foreign exchange movements 0 0 0 0 0 0 06a Market data changes and recalibrations 86 0 0 0 0 86 77 Other 0 0 0 0 0 0 08a RWA at the end of the reporting period
(end of the day)³ 1,470 4,336 10,068 0 0 15,874 1,2708b Regulatory adjustment² 3,898 12,091 0 0 0 15,988 1,2798 Market Risk RWA closing balance¹ 5,368 16,426 10,068 0 0 31,862 2,5491 Represents RWA at previous and current reporting period quarter end.2 Indicates the difference between RWA and RWA (end of day) at the beginning and end of period.3 For a given component (e.g. VaR) it refers to the RWA that would be computed if the previous or current quarter end snapshot figure of the component determines the quarter
end RWA, as opposed to a 60-day average for regulatory purposes.
Three months ended Sep 30, 2018a b c d e f g
in € m. VaR SVaR IRC
Compre-hensive
risk measure Other Total RWATotal capital
requirements1 Market Risk RWA opening balance¹ 4,614 13,908 7,335 64 0 25,921 2,0741a Regulatory adjustment² (3,403) (9,834) (451) (30) 0 (13,719) (1,098)1b RWA at the previous quarter-end (end of
the day)³ 1,211 4,074 6,883 34 0 12,202 9762 Movement in risk levels (146) (1,152) 891 19 0 (388) (31)3 Model updates/changes (10) 36 80 0 0 106 84 Methodology and policy 0 0 0 0 0 0 05 Acquisitions and disposals 0 0 0 0 0 0 06 Foreign exchange movements 0 0 0 0 0 0 06a Market data changes and recalibrations 4 0 0 0 0 4 07 Other 0 0 0 0 0 0 08a RWA at the end of the reporting period
(end of the day)³ 1,059 2,957 7,854 53 0 11,924 9548b Regulatory adjustment² 3,483 9,989 0 0 0 13,471 1,0788 Market Risk RWA closing balance¹ 4,542 12,946 7,854 53 0 25,395 2,0321 Represents RWA at previous and current reporting period quarter end.2 Indicates the difference between RWA and RWA (end of day) at the beginning and end of period.3 For a given component (e.g. VaR) it refers to the RWA that would be computed if the previous or current quarter end snapshot figure of the component determines the quarter
end RWA, as opposed to a 60-day average for regulatory purposes.
The market risk RWA movements due to position changes are represented in line “Movement in risk levels”. Changes to ourmarket risk RWA internal models, such as methodology enhancements or risk scope extensions, are included in the categoryof “Model updates/changes”. In the “Methodology and policy” category we reflect regulatory driven changes to our market riskRWA models and calculations. Significant new businesses and disposals would be assigned to the line item “Acquisition anddisposals”. The impacts of “Foreign exchange movements” are only calculated for comprehensive risk measure. For the othermeasures this is captured in “Movements in risk levels”. Changes in market data levels, volatilities, correlations, liquidity andratings are included under the “Market data changes and recalibrations” category.
As of December 31, 2018 the RWA for market risk was € 37.5 billion. The IMA (Internal Models Approach) components of thistotaled € 31.9 billion. The increase in the IMA component since September 30, 2018 was driven by an increase in risk levelscoming from the incremental risk charge and stressed value-at-risk components. The internal model comprehensive riskmeasure was decommissioned in the fourth quarter of 2018 following regulatory approval. The small remaining exposurescaptured by this model are now covered by the incremental risk charge and the market risk standardized approach.
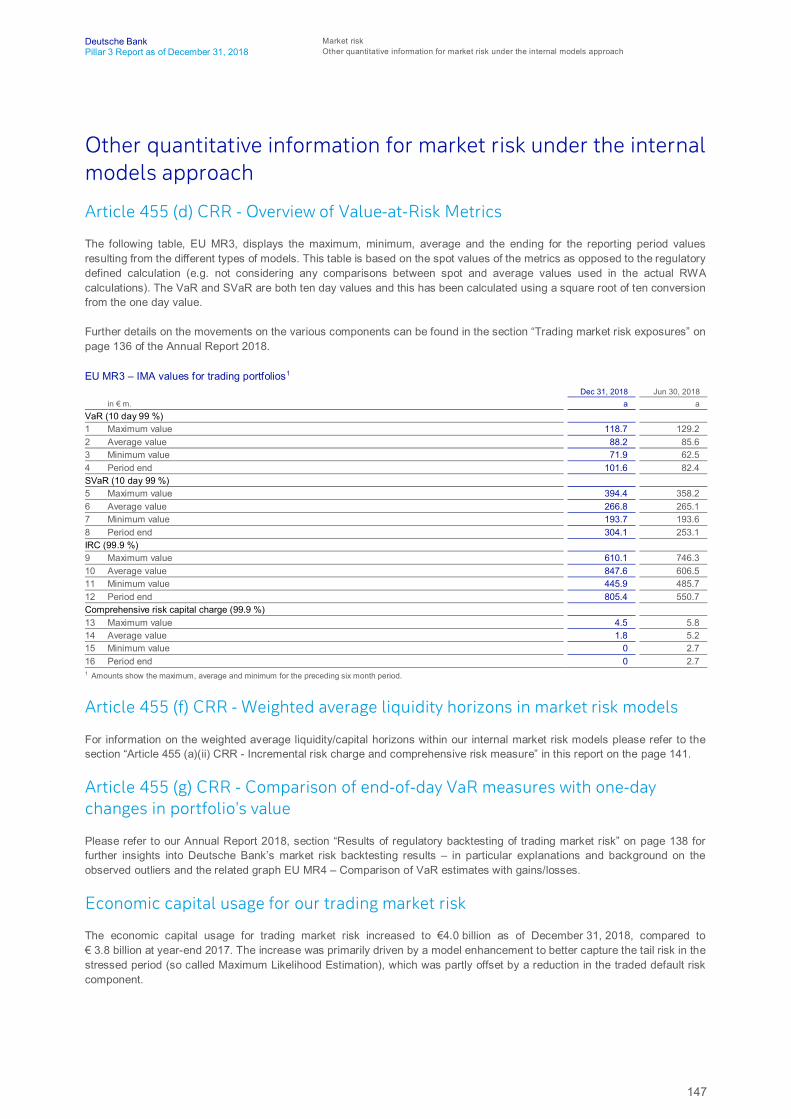
147
Deutsche Bank Market riskPillar 3 Report as of December 31, 2018 Other quantitative information for market risk under the internal models approach
Other quantitative information for market risk under the internalmodels approach
Article 455 (d) CRR - Overview of Value-at-Risk Metrics
The following table, EU MR3, displays the maximum, minimum, average and the ending for the reporting period valuesresulting from the different types of models. This table is based on the spot values of the metrics as opposed to the regulatorydefined calculation (e.g. not considering any comparisons between spot and average values used in the actual RWAcalculations). The VaR and SVaR are both ten day values and this has been calculated using a square root of ten conversionfrom the one day value.
Further details on the movements on the various components can be found in the section “Trading market risk exposures” onpage 136 of the Annual Report 2018.
EU MR3 – IMA values for trading portfolios1
Dec 31, 2018 Jun 30, 2018in € m. a a
VaR (10 day 99 %)1 Maximum value 118.7 129.22 Average value 88.2 85.63 Minimum value 71.9 62.54 Period end 101.6 82.4SVaR (10 day 99 %)5 Maximum value 394.4 358.26 Average value 266.8 265.17 Minimum value 193.7 193.68 Period end 304.1 253.1IRC (99.9 %)9 Maximum value 610.1 746.310 Average value 847.6 606.511 Minimum value 445.9 485.712 Period end 805.4 550.7Comprehensive risk capital charge (99.9 %)13 Maximum value 4.5 5.814 Average value 1.8 5.215 Minimum value 0 2.716 Period end 0 2.71 Amounts show the maximum, average and minimum for the preceding six month period.
Article 455 (f) CRR - Weighted average liquidity horizons in market risk models
For information on the weighted average liquidity/capital horizons within our internal market risk models please refer to thesection “Article 455 (a)(ii) CRR - Incremental risk charge and comprehensive risk measure” in this report on the page 141.
Article 455 (g) CRR - Comparison of end-of-day VaR measures with one-daychanges in portfolio's value
Please refer to our Annual Report 2018, section “Results of regulatory backtesting of trading market risk” on page 138 forfurther insights into Deutsche Bank’s market risk backtesting results – in particular explanations and background on theobserved outliers and the related graph EU MR4 – Comparison of VaR estimates with gains/losses.
Economic capital usage for our trading market risk
The economic capital usage for trading market risk increased to €4.0 billion as of December 31, 2018, compared to€ 3.8 billion at year-end 2017. The increase was primarily driven by a model enhancement to better capture the tail risk in thestressed period (so called Maximum Likelihood Estimation), which was partly offset by a reduction in the traded default riskcomponent.

148
Deutsche Bank Market riskPillar 3 Report as of December 31, 2018 Other quantitative information for market risk under the internal models approach
Economic capital usage for our nontrading market risk portfolios per businessarea
Economic capital usage of nontrading portfolios by business division 2018 increase (decrease) from 2017
in € m. Dec 31, 2018 Dec 31, 2017 in € m. in %Corporate & Investment Bank 725 828 (103) (12)Private & Commercial Bank 1,124 1,430 (306) (21)Asset Management 358 309 49 16Corporate & Other 4,088 4,061 27 1Total 6,295 6,628 (333) (5)
Nontrading market risk economic capital usage totaled € 6.3 billion as of December 31, 2018, which is € 0.3 billion, or 5 %,below our economic capital usage at year-end 2017.
The decrease of economic capital usage for Corporate & Investment Bank was mainly driven by accounting methodologychange due to IFRS 9 go live resulting in positions move to TMR-EC. The decrease of economic capital usage for Private &Commercial Bank was mainly driven by diversification effects. The increase in economic capital usage in Asset Managementwas largely driven by diversification effects and market performance with guaranteed funds. The economic capital usage inCorporate & Other was materially unchanged.

149
Deutsche Bank Operational riskPillar 3 Report as of December 31, 2018 Article 446 CRR - Operational risk measurement
Operational risk
Article 446 CRR - Operational risk measurementWe calculate and measure the regulatory and economic capital requirements for operational risk using the AdvancedMeasurement Approach (“AMA”) methodology. Our AMA capital calculation is based upon the loss distribution approach.Gross losses from historical internal and external loss data (Operational Riskdata eXchange Association consortium data) andexternal scenarios from a public database (IBM OpData) complemented by internal scenario data are used to estimate therisk profile (i.e., a loss frequency and a loss severity distribution). Our loss distribution approach model includes conservatismby recognizing losses on events that arise over multiple years as single events in our historical loss profile.
Within the loss distribution approach model, the frequency and severity distributions are combined in a Monte Carlo simulationto generate potential losses over a one year time horizon. Finally, the risk mitigating benefits of insurance are applied to eachloss generated in the Monte Carlo simulation. Correlation and diversification benefits are applied to the net losses in a mannercompatible with regulatory requirements to arrive at a net loss distribution at Group level, covering expected and unexpectedlosses. Capital is then allocated to each of the business divisions after considering qualitative adjustments and expected loss.
The regulatory capital requirement for operational risk is derived from the 99.9 % percentile. Since Q4 2017, the economiccapital is also set at 99.9 % percentile, see the section “Internal Capital Adequacy”. Both regulatory and economic capitalrequirements are calculated for a time horizon of one year.
The regulatory and economic capital demand calculations are performed on a quarterly basis. Non-Financial RiskManagement (NFRM) aims to ensure that for the approach for capital demand quantification appropriate development,validation and change governance processes are in place, whereby the validation is performed by an independent validationfunction and in line with the Group’s model risk management process.
Drivers for operational risk capital development
In 2018, our total operational risk losses further decreased but continued to be predominantly driven by losses and provisionsarising from civil litigation and regulatory enforcement. Such losses still make up 67 % of operational risk losses and accountfor the majority of operational risk regulatory and economic capital demand, which is more heavily reliant on our long-termloss history. For a description of our current legal and regulatory proceedings, please see section “Current IndividualProceedings” in Note 29 “Provisions” of our Annual Report 2018 on page 310. The operational risk losses from civil litigationand regulatory enforcement decreased by € 380 million or 67 % while our non-legal operational risk losses were € 86 millionor 48 % lower compared to 2017.
In view of the relevance of legal risks within our operational risk profile, we dedicate specific attention to the management andmeasurement of our open civil litigation and regulatory enforcement matters where the bank relies both on information frominternal as well as external data sources to consider developments in legal matters that affect the bank specifically but alsothe banking industry as a whole. Reflecting the multi-year nature of legal proceedings the measurement of these risksfurthermore takes into account changing levels of certainty by capturing the risks at various stages throughout the lifecycle ofa legal matter.
Conceptually, the bank measures operational risk including legal risk by determining the maximum loss that will not beexceeded with a given probability. This maximum loss amount includes a component that due to the IFRS criteria is reflectedin our financial statements and a component that is expressed as regulatory or economic capital demand beyond the amountreflected as provisions within our financial statements.
The legal losses which the bank expects with a likelihood of more than 50 % are already reflected in our IFRS group financialstatements. These losses include net changes in provisions for existing and new cases in a specific period where the loss isdeemed probable and is reliably measurable in accordance with IAS 37. The development of our legal provisions for civillitigations and regulatory enforcement is outlined in detail in Note 29 “Provisions” of our Annual Report 2018 on page 310.
Uncertain legal losses which are not reflected in our financial statements as provisions because they do not meet therecognition criteria under IAS 37 are expressed as “regulatory or economic capital demand”.
To quantify the litigation losses in the AMA model the bank takes into account historic losses, provisions, contingent liabilitiesand legal forecasts. Legal forecasts are generally comprised of ranges of potential losses from legal matters that are notdeemed probable but are reasonably possible. Reasonably possible losses may result from ongoing and new legal matterswhich are reviewed at least quarterly by the attorneys handling the legal matters.
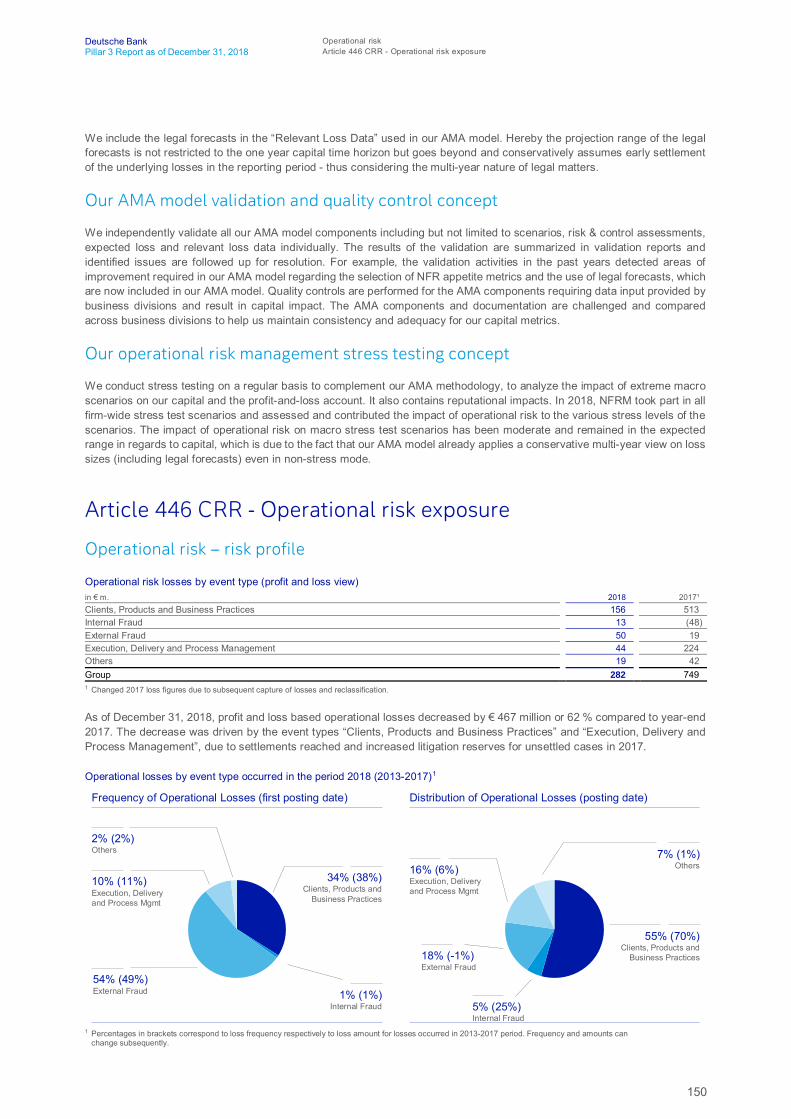
150
Deutsche Bank Operational riskPillar 3 Report as of December 31, 2018 Article 446 CRR - Operational risk exposure
We include the legal forecasts in the “Relevant Loss Data” used in our AMA model. Hereby the projection range of the legalforecasts is not restricted to the one year capital time horizon but goes beyond and conservatively assumes early settlementof the underlying losses in the reporting period - thus considering the multi-year nature of legal matters.
Our AMA model validation and quality control concept
We independently validate all our AMA model components including but not limited to scenarios, risk & control assessments,expected loss and relevant loss data individually. The results of the validation are summarized in validation reports andidentified issues are followed up for resolution. For example, the validation activities in the past years detected areas ofimprovement required in our AMA model regarding the selection of NFR appetite metrics and the use of legal forecasts, whichare now included in our AMA model. Quality controls are performed for the AMA components requiring data input provided bybusiness divisions and result in capital impact. The AMA components and documentation are challenged and comparedacross business divisions to help us maintain consistency and adequacy for our capital metrics.
Our operational risk management stress testing concept
We conduct stress testing on a regular basis to complement our AMA methodology, to analyze the impact of extreme macroscenarios on our capital and the profit-and-loss account. It also contains reputational impacts. In 2018, NFRM took part in allfirm-wide stress test scenarios and assessed and contributed the impact of operational risk to the various stress levels of thescenarios. The impact of operational risk on macro stress test scenarios has been moderate and remained in the expectedrange in regards to capital, which is due to the fact that our AMA model already applies a conservative multi-year view on losssizes (including legal forecasts) even in non-stress mode.
Article 446 CRR - Operational risk exposure
Operational risk – risk profile
Operational risk losses by event type (profit and loss view)in € m. 2018 2017¹Clients, Products and Business Practices 156 513Internal Fraud 13 (48)External Fraud 50 19Execution, Delivery and Process Management 44 224Others 19 42Group 282 7491 Changed 2017 loss figures due to subsequent capture of losses and reclassification.
As of December 31, 2018, profit and loss based operational losses decreased by € 467 million or 62 % compared to year-end2017. The decrease was driven by the event types “Clients, Products and Business Practices” and “Execution, Delivery andProcess Management”, due to settlements reached and increased litigation reserves for unsettled cases in 2017.
Operational losses by event type occurred in the period 2018 (2013-2017)1
1 Percentages in brackets correspond to loss frequency respectively to loss amount for losses occurred in 2013-2017 period. Frequency and amounts canchange subsequently.
Frequency of Operational Losses (first posting date) Distribution of Operational Losses (posting date)
2% (2%)Others
10% (11%)Execution, Deliveryand Process Mgmt
1% (1%)Internal Fraud
34% (38%)Clients, Products and
Business Practices
54% (49%)External Fraud
16% (6%)Execution, Deliveryand Process Mgmt
18% (-1%)External Fraud
5% (25%)Internal Fraud
7% (1%)Others
55% (70%)Clients, Products and
Business Practices
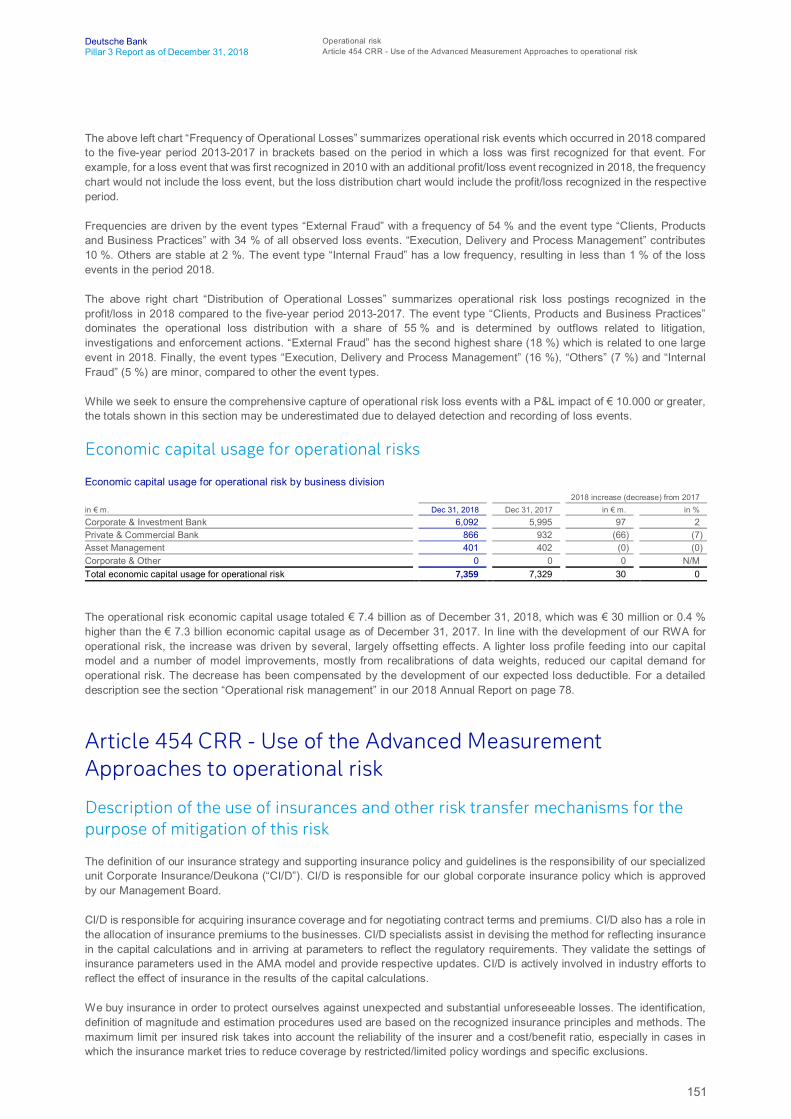
151
Deutsche Bank Operational riskPillar 3 Report as of December 31, 2018 Article 454 CRR - Use of the Advanced Measurement Approaches to operational risk
The above left chart “Frequency of Operational Losses” summarizes operational risk events which occurred in 2018 comparedto the five-year period 2013-2017 in brackets based on the period in which a loss was first recognized for that event. Forexample, for a loss event that was first recognized in 2010 with an additional profit/loss event recognized in 2018, the frequencychart would not include the loss event, but the loss distribution chart would include the profit/loss recognized in the respectiveperiod.
Frequencies are driven by the event types “External Fraud” with a frequency of 54 % and the event type “Clients, Productsand Business Practices” with 34 % of all observed loss events. “Execution, Delivery and Process Management” contributes10 %. Others are stable at 2 %. The event type “Internal Fraud” has a low frequency, resulting in less than 1 % of the lossevents in the period 2018.
The above right chart “Distribution of Operational Losses” summarizes operational risk loss postings recognized in theprofit/loss in 2018 compared to the five-year period 2013-2017. The event type “Clients, Products and Business Practices”dominates the operational loss distribution with a share of 55 % and is determined by outflows related to litigation,investigations and enforcement actions. “External Fraud” has the second highest share (18 %) which is related to one largeevent in 2018. Finally, the event types “Execution, Delivery and Process Management” (16 %), “Others” (7 %) and “InternalFraud” (5 %) are minor, compared to other the event types.
While we seek to ensure the comprehensive capture of operational risk loss events with a P&L impact of € 10.000 or greater,the totals shown in this section may be underestimated due to delayed detection and recording of loss events.
Economic capital usage for operational risks
Economic capital usage for operational risk by business division 2018 increase (decrease) from 2017
in € m. Dec 31, 2018 Dec 31, 2017 in € m. in %Corporate & Investment Bank 6,092 5,995 97 2Private & Commercial Bank 866 932 (66) (7)Asset Management 401 402 (0) (0)Corporate & Other 0 0 0 N/MTotal economic capital usage for operational risk 7,359 7,329 30 0
The operational risk economic capital usage totaled € 7.4 billion as of December 31, 2018, which was € 30 million or 0.4 %higher than the € 7.3 billion economic capital usage as of December 31, 2017. In line with the development of our RWA foroperational risk, the increase was driven by several, largely offsetting effects. A lighter loss profile feeding into our capitalmodel and a number of model improvements, mostly from recalibrations of data weights, reduced our capital demand foroperational risk. The decrease has been compensated by the development of our expected loss deductible. For a detaileddescription see the section “Operational risk management” in our 2018 Annual Report on page 78.
Article 454 CRR - Use of the Advanced MeasurementApproaches to operational risk
Description of the use of insurances and other risk transfer mechanisms for thepurpose of mitigation of this risk
The definition of our insurance strategy and supporting insurance policy and guidelines is the responsibility of our specializedunit Corporate Insurance/Deukona (“CI/D”). CI/D is responsible for our global corporate insurance policy which is approvedby our Management Board.
CI/D is responsible for acquiring insurance coverage and for negotiating contract terms and premiums. CI/D also has a role inthe allocation of insurance premiums to the businesses. CI/D specialists assist in devising the method for reflecting insurancein the capital calculations and in arriving at parameters to reflect the regulatory requirements. They validate the settings ofinsurance parameters used in the AMA model and provide respective updates. CI/D is actively involved in industry efforts toreflect the effect of insurance in the results of the capital calculations.
We buy insurance in order to protect ourselves against unexpected and substantial unforeseeable losses. The identification,definition of magnitude and estimation procedures used are based on the recognized insurance principles and methods. Themaximum limit per insured risk takes into account the reliability of the insurer and a cost/benefit ratio, especially in cases inwhich the insurance market tries to reduce coverage by restricted/limited policy wordings and specific exclusions.

152
Deutsche Bank Operational riskPillar 3 Report as of December 31, 2018 Article 454 CRR - Use of the Advanced Measurement Approaches to operational risk
We maintain two insurance companies. However, insurance contracts provided are only considered in themodeling/calculation of insurance-related reductions of operational risk capital requirements where the risk is re-insured in theexternal insurance market.
The regulatory capital figure includes a deduction for insurance coverage amounting to € 315 million as of December 31, 2018compared with € 311 million as of December 31, 2017. Currently, no other risk transfer techniques beyond insurance arerecognized in the AMA model.
CI/D selects insurance partners in strict compliance with the regulatory requirements specified in the CRR and based onrecommendations of the respective subject matter experts on the recognition of insurance in advanced measurementapproaches. The insurance portfolio, as well as CI/D activities, is audited by Group Audit on a risk-based approach.
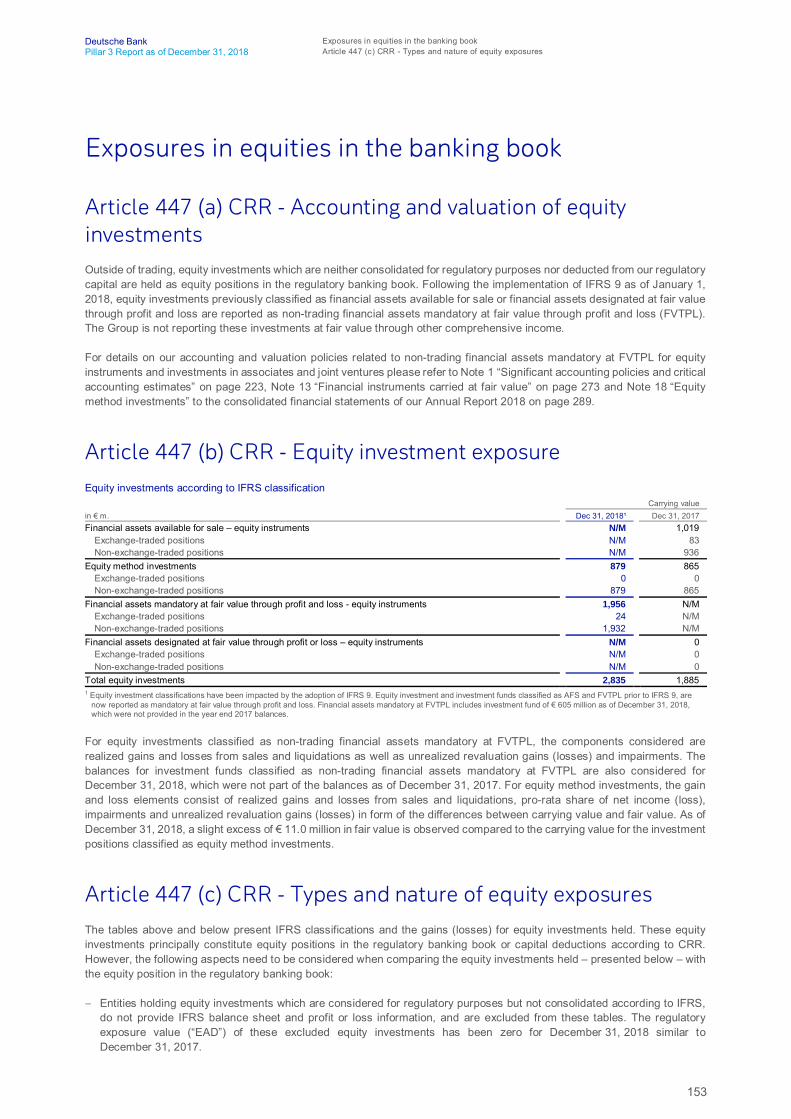
153
Deutsche Bank Exposures in equities in the banking bookPillar 3 Report as of December 31, 2018 Article 447 (c) CRR - Types and nature of equity exposures
Exposures in equities in the banking book
Article 447 (a) CRR - Accounting and valuation of equityinvestmentsOutside of trading, equity investments which are neither consolidated for regulatory purposes nor deducted from our regulatorycapital are held as equity positions in the regulatory banking book. Following the implementation of IFRS 9 as of January 1,2018, equity investments previously classified as financial assets available for sale or financial assets designated at fair valuethrough profit and loss are reported as non-trading financial assets mandatory at fair value through profit and loss (FVTPL).The Group is not reporting these investments at fair value through other comprehensive income.
For details on our accounting and valuation policies related to non-trading financial assets mandatory at FVTPL for equityinstruments and investments in associates and joint ventures please refer to Note 1 “Significant accounting policies and criticalaccounting estimates” on page 223, Note 13 “Financial instruments carried at fair value” on page 273 and Note 18 “Equitymethod investments” to the consolidated financial statements of our Annual Report 2018 on page 289.
Article 447 (b) CRR - Equity investment exposureEquity investments according to IFRS classification
Carrying valuein € m. Dec 31, 2018¹ Dec 31, 2017Financial assets available for sale – equity instruments N/M 1,019
Exchange-traded positions N/M 83Non-exchange-traded positions N/M 936
Equity method investments 879 865Exchange-traded positions 0 0Non-exchange-traded positions 879 865
Financial assets mandatory at fair value through profit and loss - equity instruments 1,956 N/MExchange-traded positions 24 N/MNon-exchange-traded positions 1,932 N/M
Financial assets designated at fair value through profit or loss – equity instruments N/M 0Exchange-traded positions N/M 0Non-exchange-traded positions N/M 0
Total equity investments 2,835 1,8851 Equity investment classifications have been impacted by the adoption of IFRS 9. Equity investment and investment funds classified as AFS and FVTPL prior to IFRS 9, are
now reported as mandatory at fair value through profit and loss. Financial assets mandatory at FVTPL includes investment fund of € 605 million as of December 31, 2018,which were not provided in the year end 2017 balances.
For equity investments classified as non-trading financial assets mandatory at FVTPL, the components considered arerealized gains and losses from sales and liquidations as well as unrealized revaluation gains (losses) and impairments. Thebalances for investment funds classified as non-trading financial assets mandatory at FVTPL are also considered forDecember 31, 2018, which were not part of the balances as of December 31, 2017. For equity method investments, the gainand loss elements consist of realized gains and losses from sales and liquidations, pro-rata share of net income (loss),impairments and unrealized revaluation gains (losses) in form of the differences between carrying value and fair value. As ofDecember 31, 2018, a slight excess of € 11.0 million in fair value is observed compared to the carrying value for the investmentpositions classified as equity method investments.
Article 447 (c) CRR - Types and nature of equity exposuresThe tables above and below present IFRS classifications and the gains (losses) for equity investments held. These equityinvestments principally constitute equity positions in the regulatory banking book or capital deductions according to CRR.However, the following aspects need to be considered when comparing the equity investments held – presented below – withthe equity position in the regulatory banking book:
– Entities holding equity investments which are considered for regulatory purposes but not consolidated according to IFRS,do not provide IFRS balance sheet and profit or loss information, and are excluded from these tables. The regulatoryexposure value (“EAD”) of these excluded equity investments has been zero for December 31, 2018 similar toDecember 31, 2017.
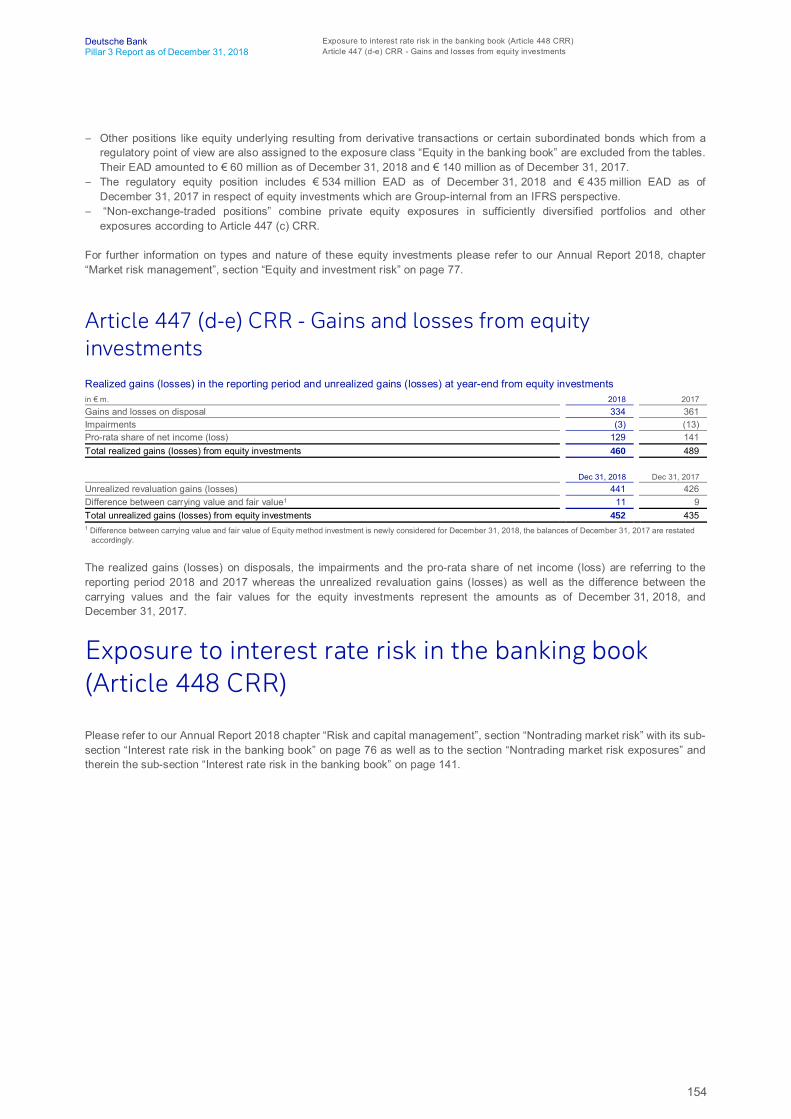
154
Deutsche Bank Exposure to interest rate risk in the banking book (Article 448 CRR)Pillar 3 Report as of December 31, 2018 Article 447 (d-e) CRR - Gains and losses from equity investments
– Other positions like equity underlying resulting from derivative transactions or certain subordinated bonds which from aregulatory point of view are also assigned to the exposure class “Equity in the banking book” are excluded from the tables.Their EAD amounted to € 60 million as of December 31, 2018 and € 140 million as of December 31, 2017.
– The regulatory equity position includes € 534 million EAD as of December 31, 2018 and € 435 million EAD as ofDecember 31, 2017 in respect of equity investments which are Group-internal from an IFRS perspective.
– “Non-exchange-traded positions” combine private equity exposures in sufficiently diversified portfolios and otherexposures according to Article 447 (c) CRR.
For further information on types and nature of these equity investments please refer to our Annual Report 2018, chapter“Market risk management”, section “Equity and investment risk” on page 77.
Article 447 (d-e) CRR - Gains and losses from equityinvestmentsRealized gains (losses) in the reporting period and unrealized gains (losses) at year-end from equity investmentsin € m. 2018 2017Gains and losses on disposal 334 361Impairments (3) (13)Pro-rata share of net income (loss) 129 141Total realized gains (losses) from equity investments 460 489
Dec 31, 2018 Dec 31, 2017Unrealized revaluation gains (losses) 441 426Difference between carrying value and fair value1 11 9Total unrealized gains (losses) from equity investments 452 4351 Difference between carrying value and fair value of Equity method investment is newly considered for December 31, 2018, the balances of December 31, 2017 are restated
accordingly.
The realized gains (losses) on disposals, the impairments and the pro-rata share of net income (loss) are referring to thereporting period 2018 and 2017 whereas the unrealized revaluation gains (losses) as well as the difference between thecarrying values and the fair values for the equity investments represent the amounts as of December 31, 2018, andDecember 31, 2017.
Exposure to interest rate risk in the banking book(Article 448 CRR)
Please refer to our Annual Report 2018 chapter “Risk and capital management”, section “Nontrading market risk” with its sub-section “Interest rate risk in the banking book” on page 76 as well as to the section “Nontrading market risk exposures” andtherein the sub-section “Interest rate risk in the banking book” on page 141.
155
Deutsche Bank Exposure to securitization positionsPillar 3 Report as of December 31, 2018 Article 449 (d-e) CRR - The roles played in the securitization process
Exposure to securitization positions
Article 449 (a) CRR - Objectives in relation to securitizationactivityWe engage in various business activities that use securitization structures. The main purposes are to provide investor clientswith access to risk and returns related to specific portfolios of assets, to provide borrowing clients with access to funding andto manage our own credit risk exposure. In order to achieve our business objectives, we act as originator, sponsor and investoron the securitization markets.
Article 4(1)(61) CRR defines which types of transactions and positions must be classified as securitization transactions andsecuritization positions for regulatory reporting.
Securitization transactions are basically defined as transactions in which the credit risk of a securitized portfolio is divided intoat least two securitization tranches and where the payments to the holders of the tranches depend on the performance of thesecuritized portfolio. The different tranches are in a subordinate relationship that determines the order and the amount ofpayments or losses assigned to the holders of the tranches (waterfall). Loss allocations to a junior tranche will not alreadylead to a termination of the entire securitization transaction, i.e., senior tranches survive loss allocations to subordinatetranches.
Securitization positions can be acquired in various forms including investments in securitization tranches, derivativetransactions for hedging interest rate and currency risks included in the waterfall, liquidity facilities, credit enhancements,unfunded credit protection or collateral for securitization tranches.
Assets originated or acquired with the intent to securitize follow the general approach for the assignment to the regulatorybanking or trading book. Further details are described in chapter “Article 455 (c) CRR - Trading book allocation and prudentvaluation”, section “Allocation of positions to the regulatory trading book” on page 144 in this report.
Article 449 (b) CRR - Nature of other risks in securitized assetsSimilar to other fixed income and credit assets, securitized trading volume is linked to global growth and geopolitical eventswhich affect liquidity and can lead to lower trading volumes, as observed during the crisis. Current changes to regulation anduncertainty over final implementation may lead to increased volatility and decreased liquidity/trading volumes acrosssecuritized products. Other potential risks that exist in securitized assets are prepayment, default, loss severity and servicerperformance. Note that trading book assets are marked to market and the previous mentioned risks are reflected in theposition’s price.
Securitization activities have an impact on our liquidity activity. On the one hand, we have entered into securitizationtransactions as part of an active liquidity risk management strategy during 2008 and 2009, some of which we replaced in 2015and 2017 with new securitization transactions. On the other hand, we are exposed to potential drawdown under the revolvingcommitments provided under some of our securitization facilities. This liquidity risk is monitored by our Treasury departmentand is included in our liquidity planning and regular stress testing.
Article 449 (d-e) CRR - The roles played in the securitizationprocessIn the banking book, we act as originator, sponsor and investor. As an originator we use securitizations primarily as a strategyto reduce credit risk, mainly through the Credit Portfolio Strategies Group (“CPSG”). CPSG uses, among other means,synthetic securitizations to manage the credit risk of loans and lending-related commitments of the Institutional CorporateCredit portfolio (primarily unsecured, investment grade corporates), Leveraged Debt Capital Markets portfolio (primarilysecured, non-investment grade corporates) and the German and Dutch MidCap portfolio. In addition CIB, through the GlobalTransaction Banking division, manages their trade finance exposures separately through synthetic securitizations. For all ofthe above portfolios, the credit risk is predominantly transferred to counterparties through synthetic securitizations mainlythrough the issuance of Credit Linked Notes providing first loss protection.
156
Deutsche Bank Exposure to securitization positionsPillar 3 Report as of December 31, 2018 Article 449 (c,f) CRR - Management of securitization positions, and risks in re-securitization activities
On a limited basis we have entered into securitization transactions as part of an active liquidity risk management strategyduring 2008 and 2009, some of which we replaced in 2015 and 2017 with new securitization transactions. These transactionsdo not transfer credit risk and are therefore not included in the quantitative part of this section.
Within our existing role as sponsor, we continue to establish and manage securitization schemes in which special purposeentities purchase exposures from third-party entities on behalf of investors. In these transactions, we have substantialinfluence on the selection of the purchased exposures and ultimate composition of the securitized portfolios.
Furthermore, we act as an investor in third party securitizations through the purchase of tranches from third party-issuedsecuritizations, or by providing liquidity, credit support or other form of financing. Additionally, we assist third partysecuritizations by providing derivatives related to securitization structures. These include currency, interest rate and creditderivatives.
Overall, the securitization positions are exposed to the performance of diverse asset classes, including primarily corporatesenior secured loans or unsecured debt, consumer debt such as auto loans or student loans, as well as residential orcommercial first and second lien mortgages. We are active across the entire capital structure with an emphasis on the moresenior tranches. The subset of re-securitization is predominantly backed by securitizations with corporate obligations in theunderlying pools.
In the trading book, we act as originator, sponsor and investor. In the role of investor, our main objective is to serve as amarket maker in the secondary market. The market making function consists of providing liquidity for our customers andproviding two way markets (buy and sell) to generate flow trading revenues. In the role of originator, we finance loans to besecuritized, predominantly in the commercial real estate business. Trading book activities where we have the role of a sponsor(excluding activities derived from multi-seller originator transactions) as described above are minimal.
Our securitization desks trade assets across all capital structures, from senior bonds with large subordination to first losssubordinate tranches, across both securitizations and re-securitizations. Securitization positions consist mostly of residentialmortgage backed securities (“RMBS”) and commercial mortgage backed securities (“CMBS”) backed by first and second lienloans, collateralized loan obligations (“CLOs”) backed by corporate senior loans and unsecured debt and consumer ABSbacked by secured and unsecured credit.
For further details about the extent of involvement in securitization roles, please also see section “Article 449 (n) CRR - Bankingand trading book securitization exposures” and tables from section “(i) - Amount of outstanding exposures securitized” onpage 161 of this Pillar 3 report.
Article 449 (c,f) CRR - Management of securitization positions,and risks in re-securitization activities
Management of banking book securitizations
Primary recourse for securitization exposures lies with the underlying assets. The related risk is mitigated by creditenhancement typically in the form of overcollateralization, subordination, reserve accounts, excess interest, or other supportarrangements. Additional protection features include performance triggers, financial covenants and events of default stipulatedin the legal documentation which, when breached, provide for the acceleration of repayment, rights of foreclosure and/or otherremediation.
The initial due diligence for new banking book exposures usually includes any or all of the following, depending on the specificsof the transaction: (a) the review of the relevant documents including term sheets, servicer reports or other historicalperformance data, third-party assessment reports such as rating agency analysis (if externally rated), etc., (b) modeling ofbase and downside scenarios through asset-class specific cash-flow models, (c) servicer reviews to assess the robustness ofthe servicer’s processes and financial strength. The result of this due diligence is summarized in a credit and rating reviewwhich requires approval by an appropriate level of credit authority, depending on the size of exposure and internal ratingassigned.
Compliance with the regulatory requirements for risk retention, due diligence and monitoring according to the applicableregulatory requirements is part of our credit review process and the relevant data is gathered for reporting purposes with thesupport of the IT systems used for the credit review process and the process for financial reporting
Ongoing regular performance reviews include checks of the periodic servicer reports against any performancetriggers/covenants in the loan documentation, as well as the overall performance trend in the context of economic, geographic,
157
Deutsche Bank Exposure to securitization positionsPillar 3 Report as of December 31, 2018 Article 449 (g) CRR - Policies with respect to hedging and unfunded protection
sector and servicer developments. Monitoring of the re-securitization subset takes into consideration the performance of thesecuritized tranches’ underlying assets, to the extent available.
For lending-related commitments an internal rating review is required at least annually. Significant negative or positive changesin asset performance can trigger an earlier review date. Full credit reviews are also required annually, or, for highly ratedexposures, every other year. Furthermore, there is a separate, usually quarterly, watch list process for exposures identified tobe at a higher risk of loss, which requires a separate assessment of asset and servicer performance. It includes a review ofthe exposure strategy and identifies next steps to be taken to mitigate loss potential. There is no difference in approach for re-securitization transactions.
Evaluation of structural integrity is another important component of risk management for securitization, focusing on thestructural protection of a securitization as defined in the legal documentation (i.e., perfection of security interest, segregationof payment flows, and rights to audit). The evaluation for each securitization is performed by a dedicated team who engagesthird-party auditors, determines audit scopes, and reviews the results of such external audits. The results of these risk reviewsand assessments complement the credit and rating review process performed by Credit Risk Management.
Management of trading book securitizations
Our Market Risk Management Governance Framework applies to all securitization positions held within the trading book. TheRisk Governance Framework applied to securitization includes policies and procedures with respect to new product approvals,new transaction approvals, risk models and measurements, as well as inventory management systems and trade entry. Allsecuritization positions held within the trading book are captured, reported and limited within the Risk Governance Frameworkat the global, regional and product levels. Any changes in credit and market risks are also reported.
The limit structure includes value-at-risk and product specific thresholds. Asset class market value limits are based onseniority/rating and liquidity, where lower rated positions or positions in less liquid asset class are given a lower tradingthreshold. The limit monitoring system captures exposures and flags any threshold breaches. Market Risk Managementapproval is required for any trades over the limit or threshold.
The Market Risk Management Governance Framework also captures issuer (credit) risk for securitization positions in thetrading book. MRM’s process manages concentration risks and sets thresholds at the position level. The limit structure isbased on asset class and rating where less liquid positions and those with lower ratings are assigned lower trading thresholds.When the limit monitoring system captures positions that exceed their respective market value thresholds on a global basis,MRM approval is required. Further due diligence is performed on positions that require trade approval; this includes analyzingthe credit performance of the security and evaluating risks of the trade. In addition collateral level stress testing andperformance monitoring is incorporated into the risk management process. The process covers both securitizations and re-securitizations.
Compliance with the CRR rules, as applicable requires that pre-trade due diligence is performed on all relevant positions. It isthe responsibility of the respective trading desk to perform the pre-trade due diligence and then record the appropriate datarecords at trade execution to indicate whether relevant due diligence items have been performed. The pre-trade due diligenceitems include confirmations of deal structural features, performance monitoring of the underlying portfolio, and any relatedretention disclosures.
Product Control group within Finance then reviews trade inputs for errors or flag changes, distributes regulatory control reportsand serves as the subject matter escalation contact. Upon validation of flag changes or trading desk errors, the Product Controlgroup within Finance will then communicate and action the changes accordingly. Further pre-trade due diligence is performedby Market Risk Management for CRR, as applicable for relevant positions exceeding predefined limits (process as describedabove). Please refer to section “Market risk management” on page 72 in our Annual Report 2018 for detailed information onthe market risk management framework.
Article 449 (g) CRR - Policies with respect to hedging andunfunded protection
Management of banking book securitizations
Management of credit risk for securitization exposures is conducted primarily through avoidance of undue risk concentrationon borrower, servicer and asset class levels. Any higher initial underwritings are de-risked to a final hold mandated in thecredit approval mainly through syndication, or sales in the secondary market. Success of de-risking is monitored and reported
158
Deutsche Bank Exposure to securitization positionsPillar 3 Report as of December 31, 2018 Article 449 (h) CRR - RWA calculation approaches for securitization positions
regularly to senior management. Credit hedging requirements, if any, are mandated in the context of the individual creditapproval. There is only very limited credit hedging activity in the banking book.
Furthermore, in the context of structuring securitization transactions, hedging usually takes place to insulate the specialpurpose entity (SPE) from interest rate and cross-currency risk – as far as required depending on the assets being included.When this hedging is provided by us, the related counterparty risk to the securitization structure is included in the Credit RiskManagement review process and reported as part of the banking book exposure. If this hedging is not provided by us, it islargely conducted with large international financial institutions with strong financial condition. Please refer to the section “Creditrisk management” in our Annual Report 2018 on pages 61 for detailed information on the credit risk management framework.
Management of trading book securitizations
The securitization desks incorporate hedges to mitigate credit and interest rate risks on the entire securitization portfolio.Duration and credit sensitivities (DV01s and CS01s) are the primary risk sensitivity measures used to calculate appropriatehedges. Some of the hedging products utilized include plain vanilla interest rate swaps, US Treasury bonds and productspecific liquid indices. The market risks of the hedges (both funded and unfunded) are incorporated and managed within ourMarket Risk Management Governance Framework as described above; and, the counterparty risks of the hedges (both fundedand unfunded), which are comprised primarily of major global financial institutions, are managed and approved through aformalized risk management process performed by Credit Risk Management.
For further details, please refer to section “Article 449 (c,f) CRR - Management of securitization positions, and risks in re-securitization activities” above in this Pillar 3 Report on page 156.
Article 449 (h) CRR - RWA calculation approaches forsecuritization positionsThe approach for the calculation of the regulatory capital requirements for banking book and trading book securitizationpositions is prescribed by the European Capital Requirements Regulation (CRR).
Calculation of regulatory capital requirements for banking book securitizations
The regulatory capital requirements for the credit risk of banking book securitizations are determined based on thesecuritization framework pursuant to Articles 242 to 270 CRR, which distinguishes between credit risk standardized approach(CRSA)-securitization positions and internal ratings based approach (IRBA)-securitization positions. The classification ofsecuritization positions as either CRSA- or IRBA-securitization positions depends on the nature of the securitized portfolio.Basically, CRSA-securitization positions are those where the securitized portfolio predominantly includes credit risk exposures,which would qualify as CRSA-exposures under the credit risk framework if they would be held by us directly. Otherwise, if themajority of the securitized portfolio would qualify as IRBA-exposures, the securitization positions qualify as IRBA-securitizationpositions.
The risk weights of CRSA-securitization positions are derived from their relevant external ratings, when applicable. Externalratings must satisfy certain eligibility criteria for being used in the risk weight calculation. Eligible external ratings are takenfrom Standard & Poor’s, Moody’s, Fitch Ratings, DBRS and Kroll. If more than one eligible rating is available for a specificsecuritization position, the relevant external rating is determined as the second best eligible rating in accordance with theprovisions set forth in Article 269 CRR.
CRSA-securitization positions with no eligible external rating receive a risk weight of 1,250 % unless they qualify for theapplication of:
– the Internal Assessment Approach according to Article 109 (1) CRR in conjunction with Article 259 (3) and (4) CRR. TheInternal Assessment Approach applies to unrated IRBA-securitization positions related to ABCP programs. As we ceasedthe use of ABCP programs in 2015, there are no securitizations positions subject to the Internal Assessment Approach asof December 31, 2018.
– the risk concentration approach pursuant to Article 253 CRR which might lead to a risk weight below 1,250 %. The riskconcentration approach is applied to a few CRSA-securitization exposures that are small compared with the total amountof our banking book securitization exposures.
The risk weight of IRBA-securitization positions is determined according to the following hierarchy:

159
Deutsche Bank Exposure to securitization positionsPillar 3 Report as of December 31, 2018 Article 449 (h) CRR - RWA calculation approaches for securitization positions
– If one or more eligible external ratings exist for the IRBA-securitization position, or if an external rating can be inferred froman eligible external rating of a benchmark securitization position, the risk weight is derived from the relevant external rating(ratings based approach).
– Otherwise, if no eligible external rating exists or can be inferred, the risk weight of the IRBA-securitization position willgenerally be determined based on the supervisory formula approach pursuant to Section 262 CRR or the internalassessment approach pursuant to Article 259 (3) and (4) CRR.
– If neither of the aforementioned approaches can be applied, the position receives a risk weight of 1,250 %.
The ratings based approach applies to approximately 6 % of our IRBA- and CRSA-securitization exposure, largely in the lower(better) risk weight bands. The majority of securitization positions with an eligible external or inferred external creditassessment are securitization positions held as investor.
Approximately 92 % of the total banking book securitization exposure is subject to the supervisory formula approach (SFA).This approach is predominantly used to rate positions backed by corporate loans, auto-related receivables and commercialreal estate loans. The risk weight of securitization positions subject to the SFA is determined based on a formula which takesas input the capital requirement of the securitized portfolio and the seniority of the securitization position in the waterfall,amongst others. When applying the SFA, we estimate the risk parameters PD and LGD for the assets included in thesecuritized portfolio, by using internally developed rating systems approved for such assets. We continue to develop newrating systems for homogenous pools of assets to be applied to assets that have not been originated by us. The rating systemsare based on historical default and loss information from comparable assets. The risk parameters PD and LGD are derivedon risk pool level.
There is no securitization position for which we have applied the special provisions for originators of securitization transactionswhich include an investor’s interest to be recognized by the originator pursuant to Article 256 CRR respectively Article 265CRR.
Calculation of regulatory capital requirements for trading book securitizations
The regulatory capital requirements for the market risk of trading book securitizations are determined based on a combinationof internal models and regulatory standard approaches pursuant to Article 337 CRR.
The capital requirement for the general market risk of trading book securitization positions is determined as the sum of (i) thevalue-at-risk based capital requirement for market risk and (ii) the stressed value-at-risk based capital requirement for marketrisk.
The capital requirement for the specific market risk of trading book securitization positions depends on whether the positionsare assigned to the regulatory correlation trading portfolio (CTP) or not.
For securitization positions that are not assigned to the CTP, the capital requirement for specific market risk is calculatedbased on the market risk standardized approach (MRSA). The MRSA risk weight for trading book securitization positions isgenerally calculated by using the same methodologies which apply to banking book securitization positions. The onlydifference relates to the use of the SFA for a small portion of trading book securitization positions, where the capitalrequirement of the securitized portfolio is determined by making use of risk parameters (probability of default and loss givendefault) that are based on the incremental risk charge model. The MRSA based capital requirement for specific risk isdetermined as the sum of the capital requirements for all net long and all net short securitization positions outside of the CTP.The securitization positions included in the MRSA calculations for specific risk are additionally included in the value-at-riskand stressed value-at-risk calculations for specific risk.
Trading book securitizations subject to MRSA treatment include various asset classes differentiated by the respectiveunderlying collateral types:
– Residential mortgage backed securities (RMBS);– Commercial mortgage backed securities (CMBS);– Collateralized loan obligations (CLO);– Collateralized debt obligations (CDO); and– Asset backed securities (incl. credit cards, auto loans and leases, student loans, equipment loans and leases, dealer
floorplan loans, etc).
They also include synthetic credit derivatives and commonly-traded indices based on the above listed instruments.
Conversely, the capital requirement for the specific market risk of securitization positions which were assigned to the CTPwas calculated based on the comprehensive risk measurement (CRM) model. The CRM model was decommissioned in thefourth quarter of 2018 following regulatory approval. The small remaining exposures captured by this model are now covered
160
Deutsche Bank Exposure to securitization positionsPillar 3 Report as of December 31, 2018 Article 449 (k) CRR - External rating agencies used for securitizations
by the incremental risk charge and the market risk standardized approach. Prior to the model decommission the capitalrequirements for the CTP were determined as the sum of (i) the value-at-risk based capital requirement for specific risk, (ii)the stressed value-at-risk based capital requirement for specific risk and (iii) the capital requirement for specific risk as derivedfrom the comprehensive risk measurement (CRM) model. The CRM based capital requirement was subject to a floor equal to8 % of the higher of the specific risk capital requirements for all net long and all net short CTP positions under the MRSA.
The CTP included securitization positions and nth-to-default credit derivatives principally held for the purpose of tradingcorrelation that satisfied the following requirements:
– all reference instruments are either single-name instruments, including single-name credit derivatives for which a liquidtwo-way market exists, or commonly-traded indices based on those reference entities;
– the positions are neither re-securitization positions, nor options on a securitization tranche, nor any other derivatives ofsecuritization exposures that do not provide a pro-rata share in the proceeds of a securitization tranche; and
– the positions do not reference a claim on a special purpose entity, claims or contingent claims on real estate property orretail.
– The CTP also comprises hedges to the securitization and nth-to-default positions in the portfolio, provided a liquid two-waymarket exists for the instrument or its underlying. Typical products assigned to the CTP are synthetic CDOs, nth-to-defaultcredit default swaps (CDS), and index and single name CDS.
Please refer to section “Article 455 (a)(i) CRR - Characteristics of the market risk models” on page 139 of this report for generalinformation on our market risk quantification approaches.
Article 449 (i) CRR - SSPEs in sponsoring activitiesWe occasionally use securitization SPEs to securitize third-party exposures in which we act as sponsor. In certain cases wealso retain some of the securitized exposure. The majority (88 %) of our € 1.4 billion sponsor positions consist of seniorsecuritization facilities backed by corporate loans.
When we act as originator or sponsor of a securitization transaction, we sell securitization tranches (or arrange for such salethrough mandated market making institutions) solely on an “execution only” basis and only to sophisticated operative corporateclients that rely on their own risk assessment. In the ordinary course of business, we do not offer such tranches to operativecorporate clients to which, at the same time, we offer investment advisory services.
Our division Asset Management (“AM”) provides asset management services to undertakings for collective investments,including mutual funds and alternative investment funds, and private individuals offering access to traditional and alternativeinvestments across all major asset classes, including securitization positions. Less than 4 % of those positions consist oftranches in securitization transactions where Deutsche Bank acted as originator or sponsor.
Article 449 (j) CRR - Accounting policies for securitizationsOur accounting policies are included in our Annual Report 2018, specifically Note 1 “Significant accounting policies and criticalaccounting estimates” on page 223. The most relevant accounting policies for the securitization programs originated by us,and where we hold assets purchased with the intent to securitize, are “Principles of consolidation” on page 224, “Financialassets” on page 229-233 and “Financial liabilities” on page 233-234 and “Derecognition of financial assets and liabilities” onpage 241, see also Note 13 “Financial instruments carried at fair value” on page 273. For measurement and quantification ofboth our banking and trading book securitizations, please refer to section “Article 449 (n) CRR - Banking and trading booksecuritization exposure” on page 161 further below in this report.
Article 449 (k) CRR - External rating agencies used forsecuritizationsPlease refer for all the used External rating agencies (ECAIs) to the section “Article 449 (h) CRR - RWA calculation approachesfor securitization positions” in this Pillar 3 report on page 158.
161
Deutsche Bank Exposure to securitization positionsPillar 3 Report as of December 31, 2018 Article 449 (n) CRR - Banking and trading book securitization exposures
Article 449 (l) CRR - Internal Assessment ApproachPlease refer for a full description of the Internal Assessment Approach to the section “Article 449 (h) CRR - RWA calculationapproaches for securitization positions” on page 158 in this Pillar 3 report.
Article 449 (m) CRR - Explanation of changes in quantitativedisclosuresExplanations of changes in quantitative disclosures can be found above and below of every quantitative table in thesecuritization section.
Article 449 (n) CRR - Banking and trading book securitizationexposures
(i) - Amount of outstanding exposures securitized
The amounts reported in the following tables provide details of our securitization exposures separately for the regulatorybanking and trading book. The details of our trading book securitization positions subject to the market risk standardizedapproach (MRSA) are included in this chapter, while the internal model comprehensive risk measure was decommissioned inthe fourth quarter of 2018. Remaining exposures captured by this model are considered by the incremental risk charge andthe market risk standardized approach as described in the section “Article 455 (e) CRR – Regulatory capital requirement formarket risk” on page 145 in this report.
We are only exposed to credit or market risks related to the exposures securitized, as shown below, to the extent that we haveretained or purchased any of the related securitization positions. The risk of the retained or purchased positions depends onthe relative position in the payment waterfall structure of the securitization transaction. For disclosure purposes, we aredeemed to be originator and additionally sponsor in case of multi-seller securitizations, which is reflected in the disclosure ofthe total outstanding exposures securitized in the sponsor column and our share of those exposures in the originator column.
The following table details the total banking book outstanding exposure split by exposure type, i.e., the overall pool size, wehave securitized in our capacity as either originator or sponsor through traditional or synthetic securitization transactions.Within the originator columns the table provides information of the underlying securitized asset pool which was either originatedfrom our balance sheet or acquired from third parties. The amounts reported are the principal notional amounts with theexception of on-balance sheet synthetic securitizations for which the carrying values as reported in our consolidated financialstatements are shown. Of the € 44.1 billion total outstanding securitized exposure reported as of December 31, 2018 in thetable below as originator, the amount retained was € 35.5 billion reflecting a decrease in both outstanding securitized as wellas retained exposures due to a positive FX impact and lower business volume in our synthetic banking book positions. ForDecember 31, 2017 these exposures amounted to € 44.8 billion and € 36.1 billion respectively.
For sponsor relationships, the total outstanding exposure securitized reported in the table below represents the principalnotional amount of outstanding exposures of the entities issuing the securities and other receivables. As of December 31,2018, our retained or re-purchased exposure of the € 10.3 billion total outstanding exposure securitized shown in the sponsorcolumns including multi-seller transactions was € 1.4 billion. The remaining exposure is held by third parties. As ofDecember 31, 2017, our total outstanding exposure securitized resulting from sponsoring activities amounted to € 9.7 billion.This included the retained or re-purchased exposure from multi-seller transactions in the amount of € 1.4 billion.
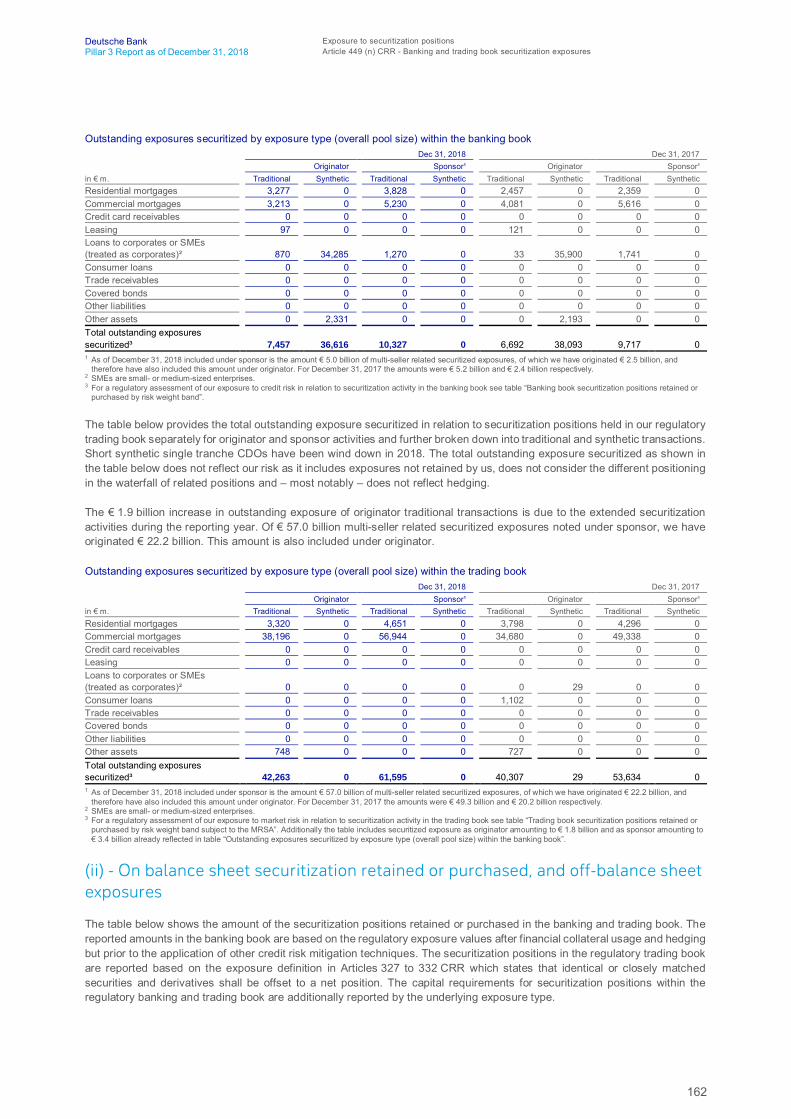
162
Deutsche Bank Exposure to securitization positionsPillar 3 Report as of December 31, 2018 Article 449 (n) CRR - Banking and trading book securitization exposures
Outstanding exposures securitized by exposure type (overall pool size) within the banking bookDec 31, 2018 Dec 31, 2017
Originator Sponsor¹ Originator Sponsor¹in € m. Traditional Synthetic Traditional Synthetic Traditional Synthetic Traditional SyntheticResidential mortgages 3,277 0 3,828 0 2,457 0 2,359 0Commercial mortgages 3,213 0 5,230 0 4,081 0 5,616 0Credit card receivables 0 0 0 0 0 0 0 0Leasing 97 0 0 0 121 0 0 0Loans to corporates or SMEs(treated as corporates)² 870 34,285 1,270 0 33 35,900 1,741 0Consumer loans 0 0 0 0 0 0 0 0Trade receivables 0 0 0 0 0 0 0 0Covered bonds 0 0 0 0 0 0 0 0Other liabilities 0 0 0 0 0 0 0 0Other assets 0 2,331 0 0 0 2,193 0 0Total outstanding exposuressecuritized³ 7,457 36,616 10,327 0 6,692 38,093 9,717 01 As of December 31, 2018 included under sponsor is the amount € 5.0 billion of multi-seller related securitized exposures, of which we have originated € 2.5 billion, and
therefore have also included this amount under originator. For December 31, 2017 the amounts were € 5.2 billion and € 2.4 billion respectively.2 SMEs are small- or medium-sized enterprises.3 For a regulatory assessment of our exposure to credit risk in relation to securitization activity in the banking book see table “Banking book securitization positions retained or
purchased by risk weight band”.
The table below provides the total outstanding exposure securitized in relation to securitization positions held in our regulatorytrading book separately for originator and sponsor activities and further broken down into traditional and synthetic transactions.Short synthetic single tranche CDOs have been wind down in 2018. The total outstanding exposure securitized as shown inthe table below does not reflect our risk as it includes exposures not retained by us, does not consider the different positioningin the waterfall of related positions and – most notably – does not reflect hedging.
The € 1.9 billion increase in outstanding exposure of originator traditional transactions is due to the extended securitizationactivities during the reporting year. Of € 57.0 billion multi-seller related securitized exposures noted under sponsor, we haveoriginated € 22.2 billion. This amount is also included under originator.
Outstanding exposures securitized by exposure type (overall pool size) within the trading bookDec 31, 2018 Dec 31, 2017
Originator Sponsor¹ Originator Sponsor¹in € m. Traditional Synthetic Traditional Synthetic Traditional Synthetic Traditional SyntheticResidential mortgages 3,320 0 4,651 0 3,798 0 4,296 0Commercial mortgages 38,196 0 56,944 0 34,680 0 49,338 0Credit card receivables 0 0 0 0 0 0 0 0Leasing 0 0 0 0 0 0 0 0Loans to corporates or SMEs(treated as corporates)² 0 0 0 0 0 29 0 0Consumer loans 0 0 0 0 1,102 0 0 0Trade receivables 0 0 0 0 0 0 0 0Covered bonds 0 0 0 0 0 0 0 0Other liabilities 0 0 0 0 0 0 0 0Other assets 748 0 0 0 727 0 0 0Total outstanding exposuressecuritized³ 42,263 0 61,595 0 40,307 29 53,634 01 As of December 31, 2018 included under sponsor is the amount € 57.0 billion of multi-seller related securitized exposures, of which we have originated € 22.2 billion, and
therefore have also included this amount under originator. For December 31, 2017 the amounts were € 49.3 billion and € 20.2 billion respectively.2 SMEs are small- or medium-sized enterprises.3 For a regulatory assessment of our exposure to market risk in relation to securitization activity in the trading book see table “Trading book securitization positions retained or
purchased by risk weight band subject to the MRSA”. Additionally the table includes securitized exposure as originator amounting to € 1.8 billion and as sponsor amounting to€ 3.4 billion already reflected in table “Outstanding exposures securitized by exposure type (overall pool size) within the banking book”.
(ii) - On balance sheet securitization retained or purchased, and off-balance sheetexposures
The table below shows the amount of the securitization positions retained or purchased in the banking and trading book. Thereported amounts in the banking book are based on the regulatory exposure values after financial collateral usage and hedgingbut prior to the application of other credit risk mitigation techniques. The securitization positions in the regulatory trading bookare reported based on the exposure definition in Articles 327 to 332 CRR which states that identical or closely matchedsecurities and derivatives shall be offset to a net position. The capital requirements for securitization positions within theregulatory banking and trading book are additionally reported by the underlying exposure type.
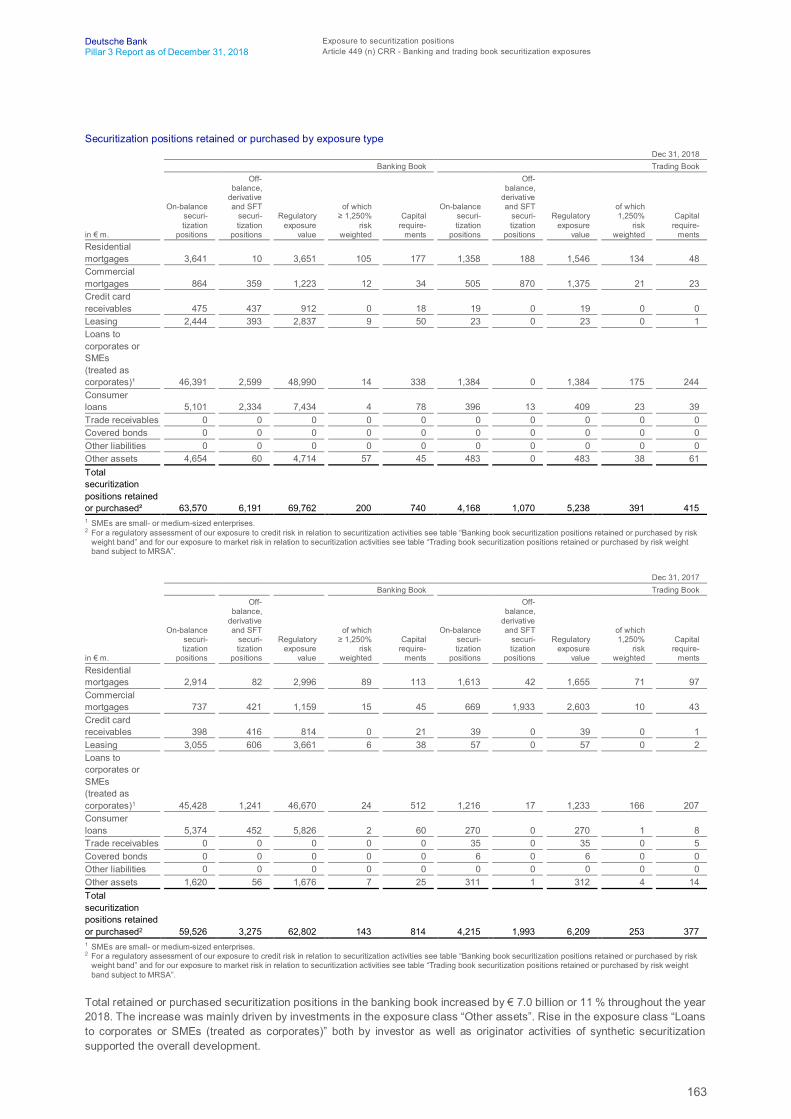
163
Deutsche Bank Exposure to securitization positionsPillar 3 Report as of December 31, 2018 Article 449 (n) CRR - Banking and trading book securitization exposures
Securitization positions retained or purchased by exposure typeDec 31, 2018
Banking Book Trading Book
in € m.
On-balancesecuri-tization
positions
Off-balance,
derivativeand SFT
securi-tization
positions
Regulatoryexposure
value
of which≥ 1,250%
riskweighted
Capitalrequire-
ments
On-balancesecuri-tization
positions
Off-balance,
derivativeand SFT
securi-tization
positions
Regulatoryexposure
value
of which1,250%
riskweighted
Capitalrequire-
mentsResidentialmortgages 3,641 10 3,651 105 177 1,358 188 1,546 134 48Commercialmortgages 864 359 1,223 12 34 505 870 1,375 21 23Credit cardreceivables 475 437 912 0 18 19 0 19 0 0Leasing 2,444 393 2,837 9 50 23 0 23 0 1Loans tocorporates orSMEs(treated ascorporates)¹ 46,391 2,599 48,990 14 338 1,384 0 1,384 175 244Consumerloans 5,101 2,334 7,434 4 78 396 13 409 23 39Trade receivables 0 0 0 0 0 0 0 0 0 0Covered bonds 0 0 0 0 0 0 0 0 0 0Other liabilities 0 0 0 0 0 0 0 0 0 0Other assets 4,654 60 4,714 57 45 483 0 483 38 61Totalsecuritizationpositions retainedor purchased² 63,570 6,191 69,762 200 740 4,168 1,070 5,238 391 4151 SMEs are small- or medium-sized enterprises.2 For a regulatory assessment of our exposure to credit risk in relation to securitization activities see table “Banking book securitization positions retained or purchased by risk
weight band” and for our exposure to market risk in relation to securitization activities see table “Trading book securitization positions retained or purchased by risk weightband subject to MRSA”.
Dec 31, 2017Banking Book Trading Book
in € m.
On-balancesecuri-tization
positions
Off-balance,
derivativeand SFT
securi-tization
positions
Regulatoryexposure
value
of which≥ 1,250%
riskweighted
Capitalrequire-
ments
On-balancesecuri-tization
positions
Off-balance,
derivativeand SFT
securi-tization
positions
Regulatoryexposure
value
of which1,250%
riskweighted
Capitalrequire-
mentsResidentialmortgages 2,914 82 2,996 89 113 1,613 42 1,655 71 97Commercialmortgages 737 421 1,159 15 45 669 1,933 2,603 10 43Credit cardreceivables 398 416 814 0 21 39 0 39 0 1Leasing 3,055 606 3,661 6 38 57 0 57 0 2Loans tocorporates orSMEs(treated ascorporates)1 45,428 1,241 46,670 24 512 1,216 17 1,233 166 207Consumerloans 5,374 452 5,826 2 60 270 0 270 1 8Trade receivables 0 0 0 0 0 35 0 35 0 5Covered bonds 0 0 0 0 0 6 0 6 0 0Other liabilities 0 0 0 0 0 0 0 0 0 0Other assets 1,620 56 1,676 7 25 311 1 312 4 14Totalsecuritizationpositions retainedor purchased2 59,526 3,275 62,802 143 814 4,215 1,993 6,209 253 3771 SMEs are small- or medium-sized enterprises.2 For a regulatory assessment of our exposure to credit risk in relation to securitization activities see table “Banking book securitization positions retained or purchased by risk
weight band” and for our exposure to market risk in relation to securitization activities see table “Trading book securitization positions retained or purchased by risk weightband subject to MRSA”.
Total retained or purchased securitization positions in the banking book increased by € 7.0 billion or 11 % throughout the year2018. The increase was mainly driven by investments in the exposure class “Other assets”. Rise in the exposure class “Loansto corporates or SMEs (treated as corporates)” both by investor as well as originator activities of synthetic securitizationsupported the overall development.
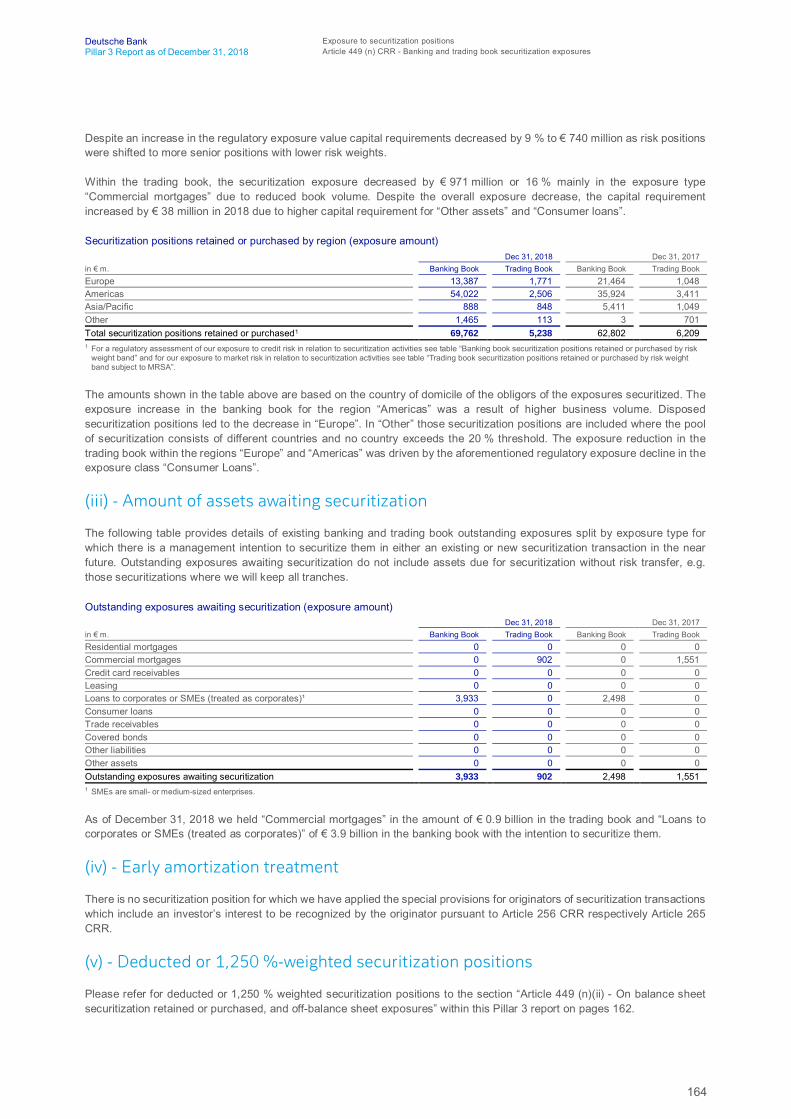
164
Deutsche Bank Exposure to securitization positionsPillar 3 Report as of December 31, 2018 Article 449 (n) CRR - Banking and trading book securitization exposures
Despite an increase in the regulatory exposure value capital requirements decreased by 9 % to € 740 million as risk positionswere shifted to more senior positions with lower risk weights.
Within the trading book, the securitization exposure decreased by € 971 million or 16 % mainly in the exposure type“Commercial mortgages” due to reduced book volume. Despite the overall exposure decrease, the capital requirementincreased by € 38 million in 2018 due to higher capital requirement for “Other assets” and “Consumer loans”.
Securitization positions retained or purchased by region (exposure amount)Dec 31, 2018 Dec 31, 2017
in € m. Banking Book Trading Book Banking Book Trading BookEurope 13,387 1,771 21,464 1,048Americas 54,022 2,506 35,924 3,411Asia/Pacific 888 848 5,411 1,049Other 1,465 113 3 701Total securitization positions retained or purchased1 69,762 5,238 62,802 6,2091 For a regulatory assessment of our exposure to credit risk in relation to securitization activities see table “Banking book securitization positions retained or purchased by risk
weight band” and for our exposure to market risk in relation to securitization activities see table “Trading book securitization positions retained or purchased by risk weightband subject to MRSA”.
The amounts shown in the table above are based on the country of domicile of the obligors of the exposures securitized. Theexposure increase in the banking book for the region “Americas” was a result of higher business volume. Disposedsecuritization positions led to the decrease in “Europe”. In “Other” those securitization positions are included where the poolof securitization consists of different countries and no country exceeds the 20 % threshold. The exposure reduction in thetrading book within the regions “Europe” and “Americas” was driven by the aforementioned regulatory exposure decline in theexposure class “Consumer Loans”.
(iii) - Amount of assets awaiting securitization
The following table provides details of existing banking and trading book outstanding exposures split by exposure type forwhich there is a management intention to securitize them in either an existing or new securitization transaction in the nearfuture. Outstanding exposures awaiting securitization do not include assets due for securitization without risk transfer, e.g.those securitizations where we will keep all tranches.
Outstanding exposures awaiting securitization (exposure amount)Dec 31, 2018 Dec 31, 2017
in € m. Banking Book Trading Book Banking Book Trading BookResidential mortgages 0 0 0 0Commercial mortgages 0 902 0 1,551Credit card receivables 0 0 0 0Leasing 0 0 0 0Loans to corporates or SMEs (treated as corporates)¹ 3,933 0 2,498 0Consumer loans 0 0 0 0Trade receivables 0 0 0 0Covered bonds 0 0 0 0Other liabilities 0 0 0 0Other assets 0 0 0 0Outstanding exposures awaiting securitization 3,933 902 2,498 1,5511 SMEs are small- or medium-sized enterprises.
As of December 31, 2018 we held “Commercial mortgages” in the amount of € 0.9 billion in the trading book and “Loans tocorporates or SMEs (treated as corporates)” of € 3.9 billion in the banking book with the intention to securitize them.
(iv) - Early amortization treatment
There is no securitization position for which we have applied the special provisions for originators of securitization transactionswhich include an investor’s interest to be recognized by the originator pursuant to Article 256 CRR respectively Article 265CRR.
(v) - Deducted or 1,250 %-weighted securitization positions
Please refer for deducted or 1,250 % weighted securitization positions to the section “Article 449 (n)(ii) - On balance sheetsecuritization retained or purchased, and off-balance sheet exposures” within this Pillar 3 report on pages 162.

165
Deutsche Bank Exposure to securitization positionsPillar 3 Report as of December 31, 2018 Article 449 (n) CRR - Banking and trading book securitization exposures
(vi) - Amount of exposures securitized and recognized gains or losses on sales
The 2018 year-end amounts in the tables below show an increase of our securitization activity in the banking book comparedwith 2017. This increased activity predominately concerned the exposure type “Loans to corporates or SMEs (treated ascorporates)” dominated by the synthetic transactions executed by the Corporate & Investment Bank. The higher exposureoriginated via synthetic securitizations in 2018 compared to 2017 in the banking book was mainly driven by a new syntheticsecuritization position with derivative exposures securitized.
Securitization activity – Total outstanding exposures securitized (i.e., the underlying pools) by exposure type within the bankingbook
Originator SponsorDec 31, 2018 2018 Dec 31, 2018
in € m. Traditional Synthetic
Realizedgains (losses)
from sales/liquidations Traditional Synthetic
Residential mortgages 147 0 1 2,465 0Commercial mortgages 0 0 0 473 0Credit card receivables 0 0 0 0 0Leasing 0 0 0 0 0Loans to corporates or SMEs (treated as corporates)¹ 0 13,935 0 483 0Consumer loans 0 0 0 0 0Trade receivables 0 0 0 0 0Covered Bonds 0 0 0 0 0Other liabilities 0 0 0 0 0Other assets 0 0 0 0 0Total Outstanding Exposures Securitized² 147 13,935 1 3,421 01 SMEs are small- or medium-sized enterprises.2 For a regulatory assessment of our exposure to credit risk in relation to securitization activity in the banking book see table “Banking book securitization positions retained or
purchased by risk weight band”.
Originator SponsorDec 31, 2017 2017 Dec 31, 2017
in € m. Traditional Synthetic
Realizedgains (losses)
from sales/liquidations Traditional Synthetic
Residential mortgages 0 0 0 362 0Commercial mortgages 310 0 0 0 0Credit card receivables 0 0 0 0 0Leasing 0 0 0 0 0Loans to corporates or SMEs (treated as corporates)¹ 0 7,970 0 450 0Consumer loans 0 0 0 0 0Trade receivables 0 0 0 0 0Covered Bonds 0 0 0 0 0Other liabilities 0 0 0 0 0Other assets 0 2,193 0 0 0Total Outstanding Exposures Securitized² 310 10,163 0 812 01 SMEs are small- or medium-sized enterprises.2 For a regulatory assessment of our exposure to credit risk in relation to securitization activity in the banking book see table “Banking book securitization positions retained or
purchased by risk weight band”.
The table below shows our securitization activities in the trading book which increased by 6 % to € 9.9 billion driven byimproved business opportunities in the US CMBS market. The origination activity was also driving the movement in sponsoredexposure as we deem ourselves originator and additionally sponsor in case of multi-seller securitizations.

166
Deutsche Bank Exposure to securitization positionsPillar 3 Report as of December 31, 2018 Article 449 (o)(i) CRR - Retained or purchased banking and trading book securitizations broken down by risk-weight
bands
Securitization activity – Total outstanding exposures securitized by exposure type within the trading bookOriginator Sponsor¹
Dec 31, 2018 2018 Dec 31, 2018
in € m. Traditional Synthetic
Realizedgains (losses)
from sales/liquidations Traditional Synthetic
Residential mortgages 2,268 0 0 784 0Commercial mortgages 7,595 0 51 19,290 0Credit card receivables 0 0 0 0 0Leasing 0 0 0 0 0Loans to corporates or SMEs (treated as corporates)² 0 0 0 0 0Consumer loans 0 0 0 0 0Trade receivables 0 0 0 0 0Covered Bonds 0 0 0 0 0Other liabilities 0 0 0 0 0Other assets 0 0 0 0 0Total Outstanding Exposures Securitized³ 9,863 0 51 20,074 01 Included under sponsor is the amount € 19.3 billion exposures securitized, of which we originated € 7.0 billion, also included under originator.2 SMEs are small- or medium-sized enterprises.3 For a regulatory assessment of our exposure to market risk in relation to securitization activity in the trading book see table “Trading book securitization positions retained or
purchased by risk weight band subject to the MRSA”.
Originator SponsorDec 31, 2017 2017 Dec 31, 2017
in € m. Traditional Synthetic
Realizedgains (losses)
from sales/liquidations Traditional Synthetic
Residential mortgages 3,005 0 12 0 0Commercial mortgages 5,170 0 27 6,990 0Credit card receivables 0 0 0 0 0Leasing 0 0 0 0 0Loans to corporates or SMEs (treated as corporates)² 0 0 0 0 0Consumer loans 1,102 0 0 0 0Trade receivables 0 0 0 0 0Covered Bonds 0 0 0 0 0Other liabilities 0 0 0 0 0Other assets 0 0 0 0 0Total Outstanding Exposures Securitized³ 9,277 0 39 6,990 01 Included under sponsor is the amount € 6.9 billion exposures securitized, of which we originated € 2.8 billion, also included under originator.2 SMEs are small- or medium-sized enterprises.3 For a regulatory assessment of our exposure to market risk in relation to securitization activity in the trading book see table “Trading book securitization positions retained or
purchased by risk weight band subject to the MRSA”.
Article 449 (o)(i) CRR - Retained or purchased banking andtrading book securitizations broken down by risk-weight bands
Banking book securitization exposure
The following table presents the retained or purchased banking book securitizations by their regulatory calculation approachand further broken down by risk-weight bands.
Banking book securitization positions retained or purchased by risk weight bandDec 31, 2018 Jun 30, 2018
in € m.Exposure
amount
Capitalrequirements
IRBA¹
Capitalrequirementsstandardized
approachExposure
amount
Capitalrequirements
IRBA¹
Capitalrequirementsstandardized
approach≤ 10 % 63,779 377 0 56,645 336 0> 10 ≤ 20 % 2,475 12 20 2,489 16 15> 20 ≤ 50 % 1,909 40 5 1,558 26 19> 50 ≤ 100 % 1,226 33 42 761 33 15> 100 ≤ 350 % 46 5 1 44 6 1> 350 ≤ 650 % 64 28 0 4 2 0> 650 < 1,250 % 63 35 29 42 27 0≥ 1,250% ≤ 1,325 % 200 112 0 150 91 15Total securitization positionsretained or purchased 69,762 643 97 61,693 537 661 After considering value adjustments according to Article 266 (1,2) CRR. Including capital requirements for maturity mismatch of synthetic securitizations by risk weight band
defined as notional weighted average risk weight of the underlying pool.
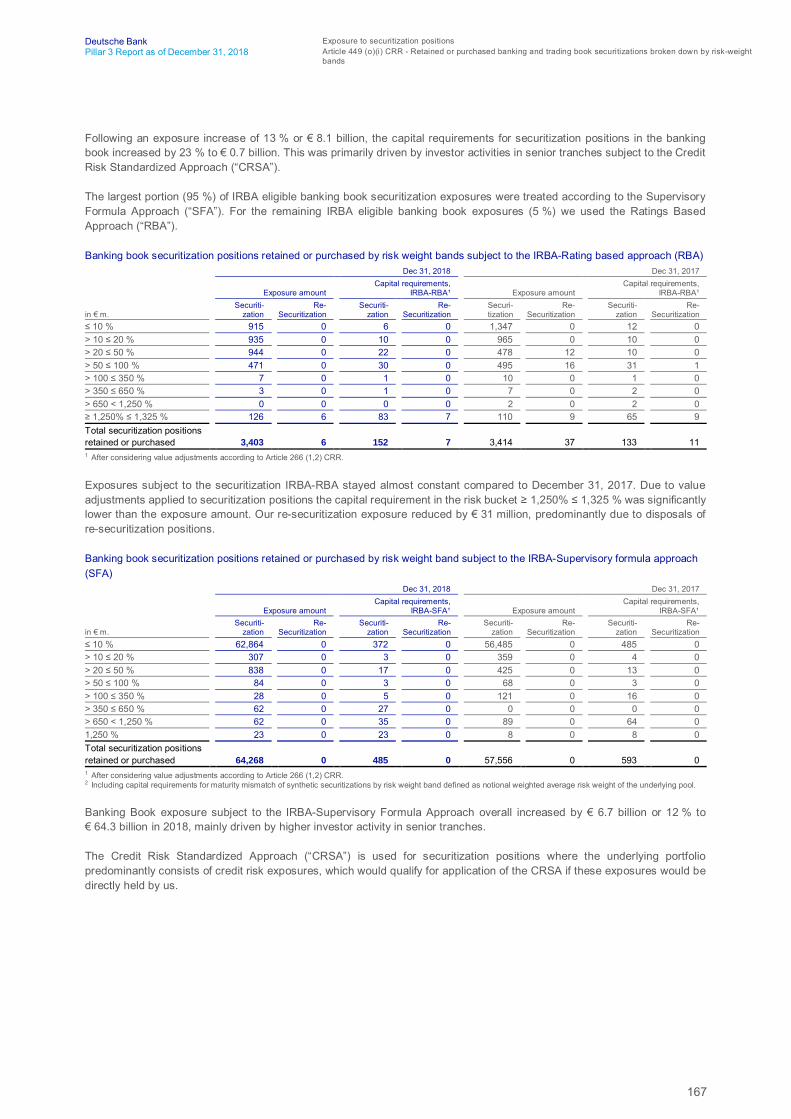
167
Deutsche Bank Exposure to securitization positionsPillar 3 Report as of December 31, 2018 Article 449 (o)(i) CRR - Retained or purchased banking and trading book securitizations broken down by risk-weight
bands
Following an exposure increase of 13 % or € 8.1 billion, the capital requirements for securitization positions in the bankingbook increased by 23 % to € 0.7 billion. This was primarily driven by investor activities in senior tranches subject to the CreditRisk Standardized Approach (“CRSA”).
The largest portion (95 %) of IRBA eligible banking book securitization exposures were treated according to the SupervisoryFormula Approach (“SFA”). For the remaining IRBA eligible banking book exposures (5 %) we used the Ratings BasedApproach (“RBA”).
Banking book securitization positions retained or purchased by risk weight bands subject to the IRBA-Rating based approach (RBA)Dec 31, 2018 Dec 31, 2017
Exposure amountCapital requirements,
IRBA-RBA¹ Exposure amountCapital requirements,
IRBA-RBA¹
in € m.Securiti-
zationRe-
SecuritizationSecuriti-
zationRe-
SecuritizationSecuri-tization
Re-Securitization
Securiti-zation
Re-Securitization
≤ 10 % 915 0 6 0 1,347 0 12 0> 10 ≤ 20 % 935 0 10 0 965 0 10 0> 20 ≤ 50 % 944 0 22 0 478 12 10 0> 50 ≤ 100 % 471 0 30 0 495 16 31 1> 100 ≤ 350 % 7 0 1 0 10 0 1 0> 350 ≤ 650 % 3 0 1 0 7 0 2 0> 650 < 1,250 % 0 0 0 0 2 0 2 0≥ 1,250% ≤ 1,325 % 126 6 83 7 110 9 65 9Total securitization positionsretained or purchased 3,403 6 152 7 3,414 37 133 111 After considering value adjustments according to Article 266 (1,2) CRR.
Exposures subject to the securitization IRBA-RBA stayed almost constant compared to December 31, 2017. Due to valueadjustments applied to securitization positions the capital requirement in the risk bucket ≥ 1,250% ≤ 1,325 % was significantlylower than the exposure amount. Our re-securitization exposure reduced by € 31 million, predominantly due to disposals ofre-securitization positions.
Banking book securitization positions retained or purchased by risk weight band subject to the IRBA-Supervisory formula approach(SFA)
Dec 31, 2018 Dec 31, 2017
Exposure amountCapital requirements,
IRBA-SFA¹ Exposure amountCapital requirements,
IRBA-SFA¹
in € m.Securiti-
zationRe-
SecuritizationSecuriti-
zationRe-
SecuritizationSecuriti-
zationRe-
SecuritizationSecuriti-
zationRe-
Securitization≤ 10 % 62,864 0 372 0 56,485 0 485 0> 10 ≤ 20 % 307 0 3 0 359 0 4 0> 20 ≤ 50 % 838 0 17 0 425 0 13 0> 50 ≤ 100 % 84 0 3 0 68 0 3 0> 100 ≤ 350 % 28 0 5 0 121 0 16 0> 350 ≤ 650 % 62 0 27 0 0 0 0 0> 650 < 1,250 % 62 0 35 0 89 0 64 01,250 % 23 0 23 0 8 0 8 0Total securitization positionsretained or purchased 64,268 0 485 0 57,556 0 593 01 After considering value adjustments according to Article 266 (1,2) CRR.2 Including capital requirements for maturity mismatch of synthetic securitizations by risk weight band defined as notional weighted average risk weight of the underlying pool.
Banking Book exposure subject to the IRBA-Supervisory Formula Approach overall increased by € 6.7 billion or 12 % to€ 64.3 billion in 2018, mainly driven by higher investor activity in senior tranches.
The Credit Risk Standardized Approach (“CRSA”) is used for securitization positions where the underlying portfoliopredominantly consists of credit risk exposures, which would qualify for application of the CRSA if these exposures would bedirectly held by us.
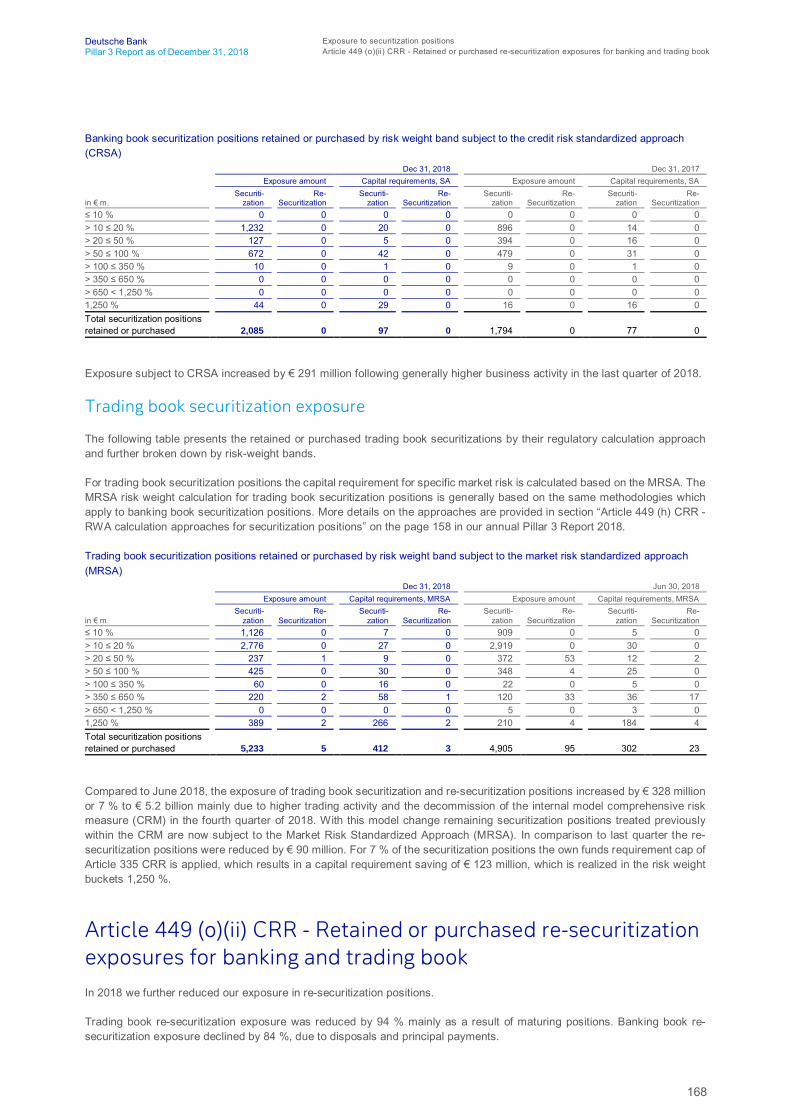
168
Deutsche Bank Exposure to securitization positionsPillar 3 Report as of December 31, 2018 Article 449 (o)(ii) CRR - Retained or purchased re-securitization exposures for banking and trading book
Banking book securitization positions retained or purchased by risk weight band subject to the credit risk standardized approach(CRSA)
Dec 31, 2018 Dec 31, 2017Exposure amount Capital requirements, SA Exposure amount Capital requirements, SA
in € m.Securiti-
zationRe-
SecuritizationSecuriti-
zationRe-
SecuritizationSecuriti-
zationRe-
SecuritizationSecuriti-
zationRe-
Securitization≤ 10 % 0 0 0 0 0 0 0 0> 10 ≤ 20 % 1,232 0 20 0 896 0 14 0> 20 ≤ 50 % 127 0 5 0 394 0 16 0> 50 ≤ 100 % 672 0 42 0 479 0 31 0> 100 ≤ 350 % 10 0 1 0 9 0 1 0> 350 ≤ 650 % 0 0 0 0 0 0 0 0> 650 < 1,250 % 0 0 0 0 0 0 0 01,250 % 44 0 29 0 16 0 16 0Total securitization positionsretained or purchased 2,085 0 97 0 1,794 0 77 0
Exposure subject to CRSA increased by € 291 million following generally higher business activity in the last quarter of 2018.
Trading book securitization exposure
The following table presents the retained or purchased trading book securitizations by their regulatory calculation approachand further broken down by risk-weight bands.
For trading book securitization positions the capital requirement for specific market risk is calculated based on the MRSA. TheMRSA risk weight calculation for trading book securitization positions is generally based on the same methodologies whichapply to banking book securitization positions. More details on the approaches are provided in section “Article 449 (h) CRR -RWA calculation approaches for securitization positions” on the page 158 in our annual Pillar 3 Report 2018.
Trading book securitization positions retained or purchased by risk weight band subject to the market risk standardized approach(MRSA)
Dec 31, 2018 Jun 30, 2018Exposure amount Capital requirements, MRSA Exposure amount Capital requirements, MRSA
in € m.Securiti-
zationRe-
SecuritizationSecuriti-
zationRe-
SecuritizationSecuriti-
zationRe-
SecuritizationSecuriti-
zationRe-
Securitization≤ 10 % 1,126 0 7 0 909 0 5 0> 10 ≤ 20 % 2,776 0 27 0 2,919 0 30 0> 20 ≤ 50 % 237 1 9 0 372 53 12 2> 50 ≤ 100 % 425 0 30 0 348 4 25 0> 100 ≤ 350 % 60 0 16 0 22 0 5 0> 350 ≤ 650 % 220 2 58 1 120 33 36 17> 650 < 1,250 % 0 0 0 0 5 0 3 01,250 % 389 2 266 2 210 4 184 4Total securitization positionsretained or purchased 5,233 5 412 3 4,905 95 302 23
Compared to June 2018, the exposure of trading book securitization and re-securitization positions increased by € 328 millionor 7 % to € 5.2 billion mainly due to higher trading activity and the decommission of the internal model comprehensive riskmeasure (CRM) in the fourth quarter of 2018. With this model change remaining securitization positions treated previouslywithin the CRM are now subject to the Market Risk Standardized Approach (MRSA). In comparison to last quarter the re-securitization positions were reduced by € 90 million. For 7 % of the securitization positions the own funds requirement cap ofArticle 335 CRR is applied, which results in a capital requirement saving of € 123 million, which is realized in the risk weightbuckets 1,250 %.
Article 449 (o)(ii) CRR - Retained or purchased re-securitizationexposures for banking and trading bookIn 2018 we further reduced our exposure in re-securitization positions.
Trading book re-securitization exposure was reduced by 94 % mainly as a result of maturing positions. Banking book re-securitization exposure declined by 84 %, due to disposals and principal payments.
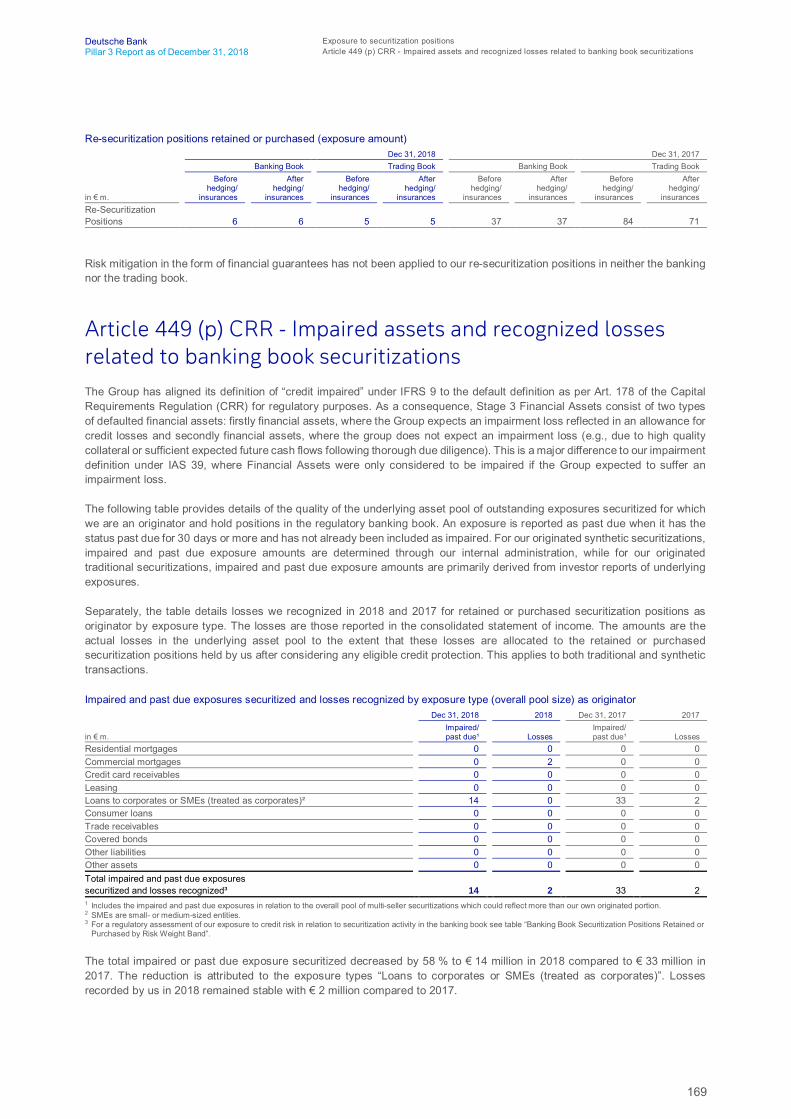
169
Deutsche Bank Exposure to securitization positionsPillar 3 Report as of December 31, 2018 Article 449 (p) CRR - Impaired assets and recognized losses related to banking book securitizations
Re-securitization positions retained or purchased (exposure amount)Dec 31, 2018 Dec 31, 2017
Banking Book Trading Book Banking Book Trading Book
in € m.
Beforehedging/
insurances
Afterhedging/
insurances
Beforehedging/
insurances
Afterhedging/
insurances
Beforehedging/
insurances
Afterhedging/
insurances
Beforehedging/
insurances
Afterhedging/
insurancesRe-SecuritizationPositions 6 6 5 5 37 37 84 71
Risk mitigation in the form of financial guarantees has not been applied to our re-securitization positions in neither the bankingnor the trading book.
Article 449 (p) CRR - Impaired assets and recognized lossesrelated to banking book securitizationsThe Group has aligned its definition of “credit impaired” under IFRS 9 to the default definition as per Art. 178 of the CapitalRequirements Regulation (CRR) for regulatory purposes. As a consequence, Stage 3 Financial Assets consist of two typesof defaulted financial assets: firstly financial assets, where the Group expects an impairment loss reflected in an allowance forcredit losses and secondly financial assets, where the group does not expect an impairment loss (e.g., due to high qualitycollateral or sufficient expected future cash flows following thorough due diligence). This is a major difference to our impairmentdefinition under IAS 39, where Financial Assets were only considered to be impaired if the Group expected to suffer animpairment loss.
The following table provides details of the quality of the underlying asset pool of outstanding exposures securitized for whichwe are an originator and hold positions in the regulatory banking book. An exposure is reported as past due when it has thestatus past due for 30 days or more and has not already been included as impaired. For our originated synthetic securitizations,impaired and past due exposure amounts are determined through our internal administration, while for our originatedtraditional securitizations, impaired and past due exposure amounts are primarily derived from investor reports of underlyingexposures.
Separately, the table details losses we recognized in 2018 and 2017 for retained or purchased securitization positions asoriginator by exposure type. The losses are those reported in the consolidated statement of income. The amounts are theactual losses in the underlying asset pool to the extent that these losses are allocated to the retained or purchasedsecuritization positions held by us after considering any eligible credit protection. This applies to both traditional and synthetictransactions.
Impaired and past due exposures securitized and losses recognized by exposure type (overall pool size) as originatorDec 31, 2018 2018 Dec 31, 2017 2017
in € m.Impaired/past due¹ Losses
Impaired/past due¹ Losses
Residential mortgages 0 0 0 0Commercial mortgages 0 2 0 0Credit card receivables 0 0 0 0Leasing 0 0 0 0Loans to corporates or SMEs (treated as corporates)² 14 0 33 2Consumer loans 0 0 0 0Trade receivables 0 0 0 0Covered bonds 0 0 0 0Other liabilities 0 0 0 0Other assets 0 0 0 0Total impaired and past due exposuressecuritized and losses recognized³ 14 2 33 21 Includes the impaired and past due exposures in relation to the overall pool of multi-seller securitizations which could reflect more than our own originated portion.2 SMEs are small- or medium-sized entities.3 For a regulatory assessment of our exposure to credit risk in relation to securitization activity in the banking book see table “Banking Book Securitization Positions Retained or
Purchased by Risk Weight Band”.
The total impaired or past due exposure securitized decreased by 58 % to € 14 million in 2018 compared to € 33 million in2017. The reduction is attributed to the exposure types “Loans to corporates or SMEs (treated as corporates)”. Lossesrecorded by us in 2018 remained stable with € 2 million compared to 2017.

170
Deutsche Bank Remuneration policy (Article 450 CRR)Pillar 3 Report as of December 31, 2018 Article 449 (r) CRR - Financial support to securitization vehicles
Article 449 (q) CRR - Trading book securitization positionsPlease refer for details about the trading book exposures to the section “Article 449 (n) CRR - Banking and trading booksecuritization exposures” in this Pillar 3 report on page 161.
Article 449 (r) CRR - Financial support to securitization vehiclesWe have not provided any implicit support to our securitization vehicles.
Remuneration policy (Article 450 CRR)
For details please refer to the section “Compensation Report” in our Annual Report 2018 on the pages 154 - 203.

171
Deutsche Bank Leverage (Article 451 CRR)Pillar 3 Report as of December 31, 2018 Leverage Ratio according to revised CRR/CRD 4 framework
Leverage (Article 451 CRR)
We manage our balance sheet on a Group level and, where applicable, locally in each region. In the allocation of financialresources we favor business portfolios with the highest positive impact on our profitability and shareholder value. We monitorand analyze balance sheet developments and track certain market-observed balance sheet ratios. Based on this we triggerdiscussion and management action by the Group Risk Committee (GRC). Following the publication of the CRR/CRD 4framework, we established a leverage ratio calculation according to that framework.
Leverage Ratio according to revised CRR/CRD 4 frameworkThe CRR/CRD 4 framework introduced a non-risk based leverage ratio that is intended to act as a supplementary measureto the risk based capital requirements. Its objectives are to constrain the build-up of leverage in the banking sector, helpingavoid destabilizing deleveraging processes which can damage the broader financial system and the economy, and to reinforcethe risk based requirements with a simple, non-risk based “backstop” measure. While the CRR/CRD 4 framework currentlydoes not provide for a mandatory minimum leverage ratio to be complied with, the legislative proposals as part of the EuropeanTrilogue include a 3 % minimum requirement but the proposed implementation dates are different. The final Basel rules thathave been published in December 2017 also include an additional leverage ratio buffer requirement for banks identified asglobal systemically important institution (“G-SII”) of 50 % of the G-SII buffer. Details of the implementation and the timing ofthe application of this additional leverage ratio buffer remain subject to finalization of the legislative process.
We calculate our leverage ratio exposure on a fully loaded basis in accordance with Article 429 of the CRR as per DelegatedRegulation (EU) 2015/62 of October 10, 2014 published in the Official Journal of the European Union on January 17, 2015amending Regulation (EU) No 575/2013. In addition, we provide the leverage ratio on a phase-in basis as displayed below inthe tables.
Our total leverage ratio exposure includes derivatives, securities financing transactions (SFTs), off-balance sheet exposureand other on-balance sheet exposure (excluding derivatives and SFTs).
The leverage exposure for derivatives is calculated by using the regulatory mark-to-market method for derivatives comprisingthe current replacement cost plus a regulatory defined add-on for the potential future exposure. Variation margin received incash from counterparties is deducted from the current replacement cost portion of the leverage ratio exposure measure andvariation margin paid to counterparties is deducted from the leverage ratio exposure measure related to receivablesrecognized as an asset on the balance sheet, provided certain conditions are met. Deductions of receivables for cash variationmargin provided in derivatives transactions are shown under derivative exposure in the table “Leverage ratio commondisclosure” below. The effective notional amount of written credit derivatives, i.e., the notional reduced by any negative fairvalue changes that have been incorporated in Tier 1 capital is included in the leverage ratio exposure measure; the resultingexposure measure is further reduced by the effective notional amount of purchased credit derivative protection on the samereference name provided certain conditions are met.
The securities financing transaction (SFT) component includes the gross receivables for SFTs, which are netted with SFTpayables if specific conditions are met. In addition to the gross exposure a regulatory add-on for the counterparty credit risk isincluded.
The off-balance sheet exposure component follows the credit risk conversion factors (CCF) of the standardized approach forcredit risk (0 %, 20 %, 50 %, or 100 %), which depend on the risk category subject to a floor of 10 %.
The other on-balance sheet exposure component (excluding derivatives and SFTs) reflects the accounting values of the assets(excluding derivatives and SFTs) as well as regulatory adjustments for asset amounts deducted in determining Tier 1 capital.
The following tables show the leverage ratio exposure and the leverage ratio, both on a fully loaded basis, in accordance withthe disclosure tables of the implementing technical standards (ITS) which were adopted by the European Commission viaCommission Implementing Regulation (EU) 2016/200 published in the Official Journal of the European Union on February 16,2016. For additional information, they also contain the phase-in figures.
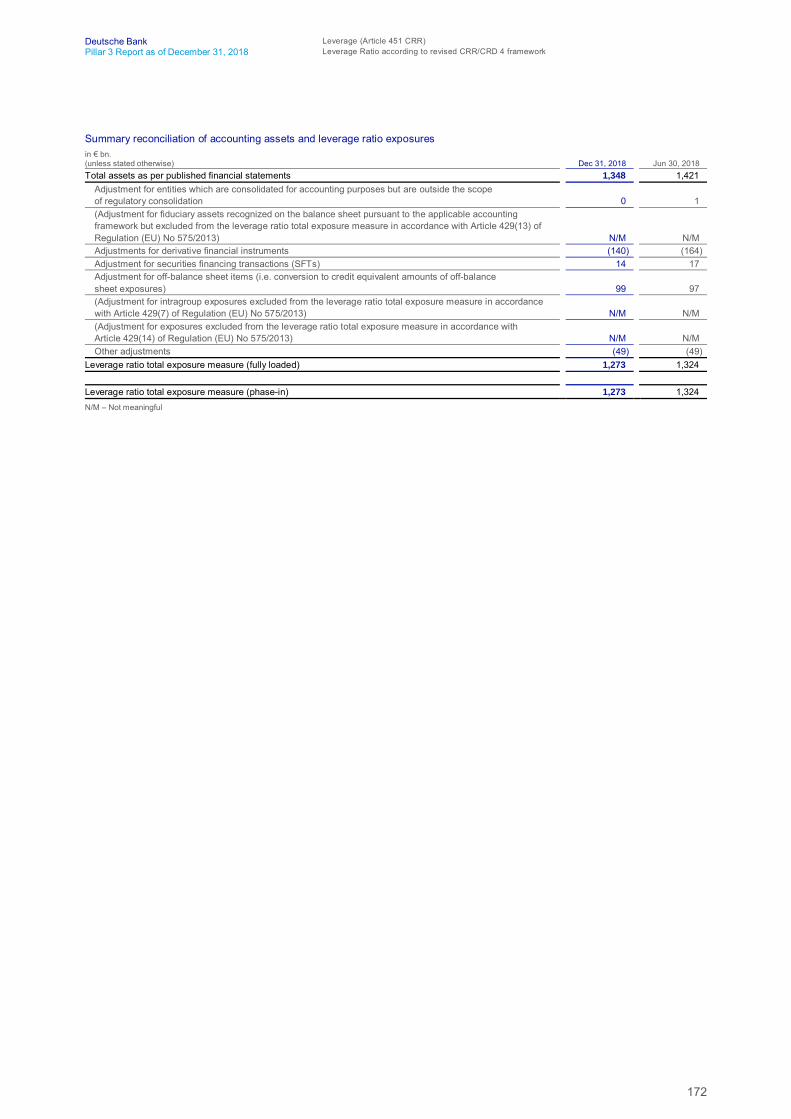
172
Deutsche Bank Leverage (Article 451 CRR)Pillar 3 Report as of December 31, 2018 Leverage Ratio according to revised CRR/CRD 4 framework
Summary reconciliation of accounting assets and leverage ratio exposuresin € bn.(unless stated otherwise) Dec 31, 2018 Jun 30, 2018Total assets as per published financial statements 1,348 1,421
Adjustment for entities which are consolidated for accounting purposes but are outside the scopeof regulatory consolidation 0 1(Adjustment for fiduciary assets recognized on the balance sheet pursuant to the applicable accountingframework but excluded from the leverage ratio total exposure measure in accordance with Article 429(13) ofRegulation (EU) No 575/2013) N/M N/MAdjustments for derivative financial instruments (140) (164)Adjustment for securities financing transactions (SFTs) 14 17Adjustment for off-balance sheet items (i.e. conversion to credit equivalent amounts of off-balancesheet exposures) 99 97(Adjustment for intragroup exposures excluded from the leverage ratio total exposure measure in accordancewith Article 429(7) of Regulation (EU) No 575/2013) N/M N/M(Adjustment for exposures excluded from the leverage ratio total exposure measure in accordance withArticle 429(14) of Regulation (EU) No 575/2013) N/M N/MOther adjustments (49) (49)
Leverage ratio total exposure measure (fully loaded) 1,273 1,324
Leverage ratio total exposure measure (phase-in) 1,273 1,324N/M – Not meaningful

173
Deutsche Bank Leverage (Article 451 CRR)Pillar 3 Report as of December 31, 2018 Leverage Ratio according to revised CRR/CRD 4 framework
Leverage ratio common disclosurein € bn.(unless stated otherwise) Dec 31, 2018 Jun 30, 2018On-balance sheet exposures (excluding derivatives and SFTs)On-balance sheet items (excluding derivatives, SFTs and fiduciary assets, but including collateral) 925 984(Asset amounts deducted in determining Tier 1 capital) (13) (14)Total on-balance sheet exposures (excluding derivatives, SFTs and fiduciary assets) 911 970
Derivative exposuresReplacement cost associated with all derivatives transactions (i.e. net of eligible cash variation margin) 36 37Add-on amounts for PFE associated with all derivatives transactions (mark-to-market method) 141 152Exposure determined under Original Exposure Method N/M N/MGross-up for derivatives collateral provided where deducted from the balance sheet assets pursuant tothe applicable accounting framework 0 0(Deductions of receivables assets for cash variation margin provided in derivatives transactions) (25) (27)(Exempted CCP leg of client-cleared trade exposures) (11) (14)Adjusted effective notional amount of written credit derivatives 393 489(Adjusted effective notional offsets and add-on deductions for written credit derivatives) (376) (477)Total derivatives exposures 159 160
SFT exposuresGross SFT assets (with no recognition of netting), after adjusting for sales accounting transactions 144 136(Netted amounts of cash payables and cash receivables of gross SFT assets) (54) (54)Counterparty credit risk exposure for SFT assets 11 15Derogation for SFTs: Counterparty credit risk exposure in accordance with Articles 429b(4) and 222 ofRegulation (EU) No 575/2013 N/M N/MAgent transaction exposures 1 1(Exempted CCP leg of client-cleared SFT exposure) 0 0Total securities financing transaction exposures 103 97
Other off-balance sheet exposuresOff-balance sheet exposures at gross notional amount 280 276(Adjustments for conversion to credit equivalent amounts) (180) (179)Other off-balance sheet exposures 99 97
Exempted exposures in accordance with Article 429 (7) and (14) of Regulation (EU) No 575/2013 (onand off balance sheet)(Intragroup exposures (solo basis) exempted in accordance with Article 429(7) of Regulation (EU)No 575/2013 (on and off balance sheet)) N/M N/M(Exposures exempted in accordance with Article 429 (14) of Regulation (EU) No 575/2013 (on and offbalance sheet)) N/M N/M
Capital and total exposure measureTier 1 capital (fully loaded) 52.1 52.5Leverage ratio total exposure measure (fully loaded) 1,273 1,324Leverage ratio (fully loaded, in %) 4.1 4.0
Tier 1 capital (phase-in) 55.1 55.5Leverage ratio total exposure measure (phase-in) 1,273 1,324Leverage ratio (phase-in, in %) 4.3 4.2N/M – Not meaningful
Breakdown of on-balance sheet exposures (excluding derivatives and SFTs)in € bn.(unless stated otherwise) Dec 31, 2018 Jun 30, 2018Total on-balance sheet exposures (excluding derivatives, SFTs, and exempted exposures) 925 984
of which:Trading book exposures 196 215Banking book exposures 728 769
of which:Covered bonds 1 2Exposures treated as sovereigns 245 262Exposures to regional governments, MDB, international organizations and PSE not treated as sovereigns 1 1Institutions 17 20Secured by mortgages of immovable properties 187 187Retail exposures 35 35Corporate 168 158Exposures in default 6 7Other exposures (e.g. equity, securitizations, and other non-credit obligation assets) 68 96
174
Deutsche Bank Leverage (Article 451 CRR)Pillar 3 Report as of December 31, 2018 Factors that had an impact on the leverage ratio in the second half of 2018
Process used to manage the risk of excessive leverageAs described in the section “Risk management principles” and “Risk governance” on pages 50-51 of our Annual Report 2018,the Group Risk Committee (GRC) is mandated to oversee, control and monitor integrated planning our risk profile and capitalcapacity. The Group Asset and Liability Committee (ALCO) actively manages leverage exposure capacity within the RiskAppetite Framework via a limit setting process
– to allocate group leverage exposure capacity to businesses,– to support business achievement of strategic performance plans,– to provide a firm basis for achieving the target leverage ratio,– to incentivize businesses to make appropriate decisions on their portfolios, with consideration to asset maturity and
encumbrance amongst others, and– to maintain risk discipline.
In the case of limit excess the respective business is charged. The limit excess charges are calculated in accordance with theGroup-wide limit-setting framework for leverage.
For further details please also refer to the “Capital management” section contained in chapter “Risk and capital management”on page 60 of our Annual Report 2018.
Factors that had an impact on the leverage ratio in the secondhalf of 2018As of December 31, 2018, our fully loaded CRR/CRD 4 leverage ratio was 4.1 % compared to 4.0 % as of June 30, 2018,taking into account as of December 31, 2018 a fully loaded Tier 1 capital of € 52.1 billion over an applicable exposure measureof € 1,273 billion (€ 52.5 billion and € 1,324 billion as of June 30, 2018, respectively).
Our CRR/CRD 4 leverage ratio according to transitional provisions was 4.3 % as of December 31, 2018 (4.2 % as of June 30,2018), calculated as Tier 1 capital according to transitional rules of € 55.1 billion over an applicable exposure measure of€ 1,273 billion (€ 55.5 billion and € 1,324 billion as of June 30, 2018, respectively).
Over the second half 2018, our leverage ratio exposure decreased by € 51 billion to € 1,273 billion. This is primarily driven bythe € 59 billion reduction in Other Assets which reflects the development on our balance sheet, in particular for pendingsettlements which decreased seasonally by € 30 billion, cash and central bank / interbank balances which decreased by € 21billion and non-derivative trading assets which decreased by € 8 billion. Net loans increased by € 10 billion and SFTs increasedby € 6 billion, reflecting an increase on the balance sheet in the SFT related items (securities purchased under resaleagreements, securities borrowed and receivables from prime brokerage). Derivatives decreased by € 1 billion from lower add-ons for the potential future exposure, partly offset by higher exposures for written credit protection. Off-balance sheetexposures slightly increased by € 2 billion corresponding to higher notional amounts for irrevocable lending commitments.
The decrease of the leverage ratio exposure in the second half 2018 includes a positive foreign exchange impact of € 10 billionmainly due to the depreciation of the Euro against the U.S. dollar.
Our leverage ratio calculated as the ratio of total assets under IFRS to total equity under IFRS was 20 as of December 31,2018 compared to 21 as of June 30, 2018.
For main drivers of the Tier 1 capital development please refer to section “Own funds” on page 23 in this report.
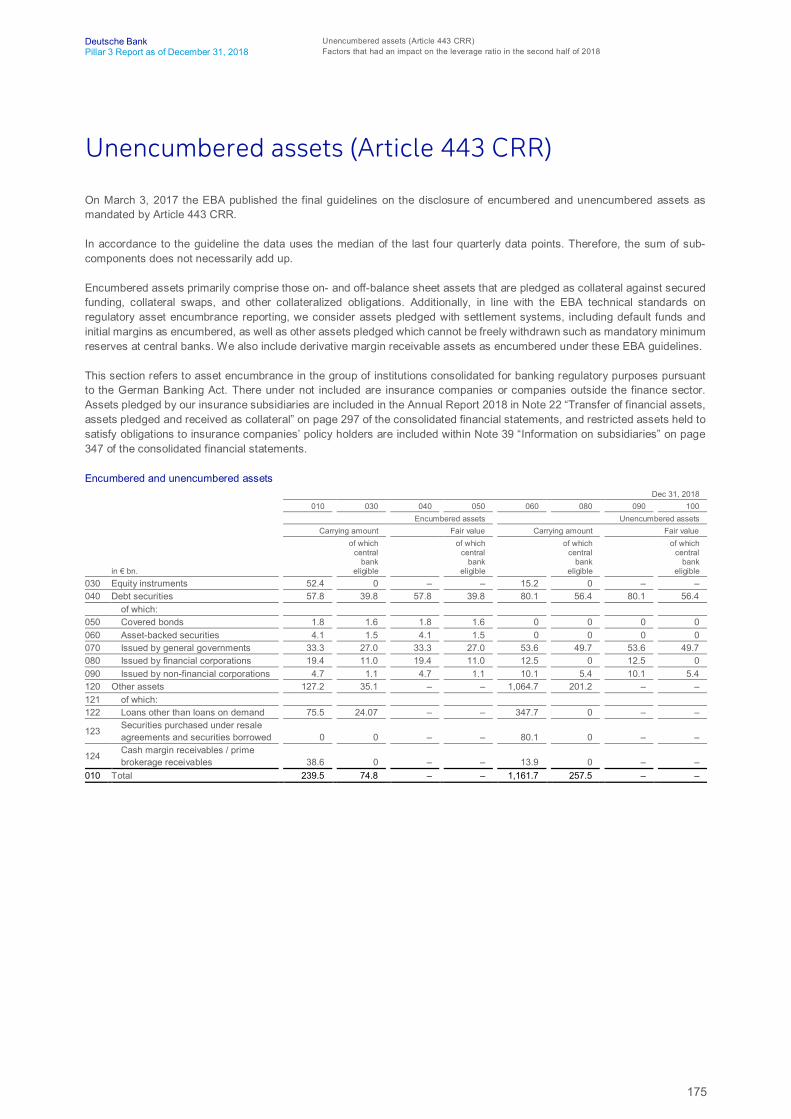
175
Deutsche Bank Unencumbered assets (Article 443 CRR)Pillar 3 Report as of December 31, 2018 Factors that had an impact on the leverage ratio in the second half of 2018
Unencumbered assets (Article 443 CRR)
On March 3, 2017 the EBA published the final guidelines on the disclosure of encumbered and unencumbered assets asmandated by Article 443 CRR.
In accordance to the guideline the data uses the median of the last four quarterly data points. Therefore, the sum of sub-components does not necessarily add up.
Encumbered assets primarily comprise those on- and off-balance sheet assets that are pledged as collateral against securedfunding, collateral swaps, and other collateralized obligations. Additionally, in line with the EBA technical standards onregulatory asset encumbrance reporting, we consider assets pledged with settlement systems, including default funds andinitial margins as encumbered, as well as other assets pledged which cannot be freely withdrawn such as mandatory minimumreserves at central banks. We also include derivative margin receivable assets as encumbered under these EBA guidelines.
This section refers to asset encumbrance in the group of institutions consolidated for banking regulatory purposes pursuantto the German Banking Act. There under not included are insurance companies or companies outside the finance sector.Assets pledged by our insurance subsidiaries are included in the Annual Report 2018 in Note 22 “Transfer of financial assets,assets pledged and received as collateral” on page 297 of the consolidated financial statements, and restricted assets held tosatisfy obligations to insurance companies’ policy holders are included within Note 39 “Information on subsidiaries” on page347 of the consolidated financial statements.
Encumbered and unencumbered assetsDec 31, 2018
010 030 040 050 060 080 090 100Encumbered assets Unencumbered assets
Carrying amount Fair value Carrying amount Fair value
in € bn.
of whichcentral
bankeligible
of whichcentral
bankeligible
of whichcentral
bankeligible
of whichcentral
bankeligible
030 Equity instruments 52.4 0 – – 15.2 0 – –040 Debt securities 57.8 39.8 57.8 39.8 80.1 56.4 80.1 56.4
of which:050 Covered bonds 1.8 1.6 1.8 1.6 0 0 0 0060 Asset-backed securities 4.1 1.5 4.1 1.5 0 0 0 0070 Issued by general governments 33.3 27.0 33.3 27.0 53.6 49.7 53.6 49.7080 Issued by financial corporations 19.4 11.0 19.4 11.0 12.5 0 12.5 0090 Issued by non-financial corporations 4.7 1.1 4.7 1.1 10.1 5.4 10.1 5.4120 Other assets 127.2 35.1 – – 1,064.7 201.2 – –121 of which:122 Loans other than loans on demand 75.5 24.07 – – 347.7 0 – –
123 Securities purchased under resaleagreements and securities borrowed 0 0 – – 80.1 0 – –
124 Cash margin receivables / primebrokerage receivables 38.6 0 – – 13.9 0 – –
010 Total 239.5 74.8 – – 1,161.7 257.5 – –
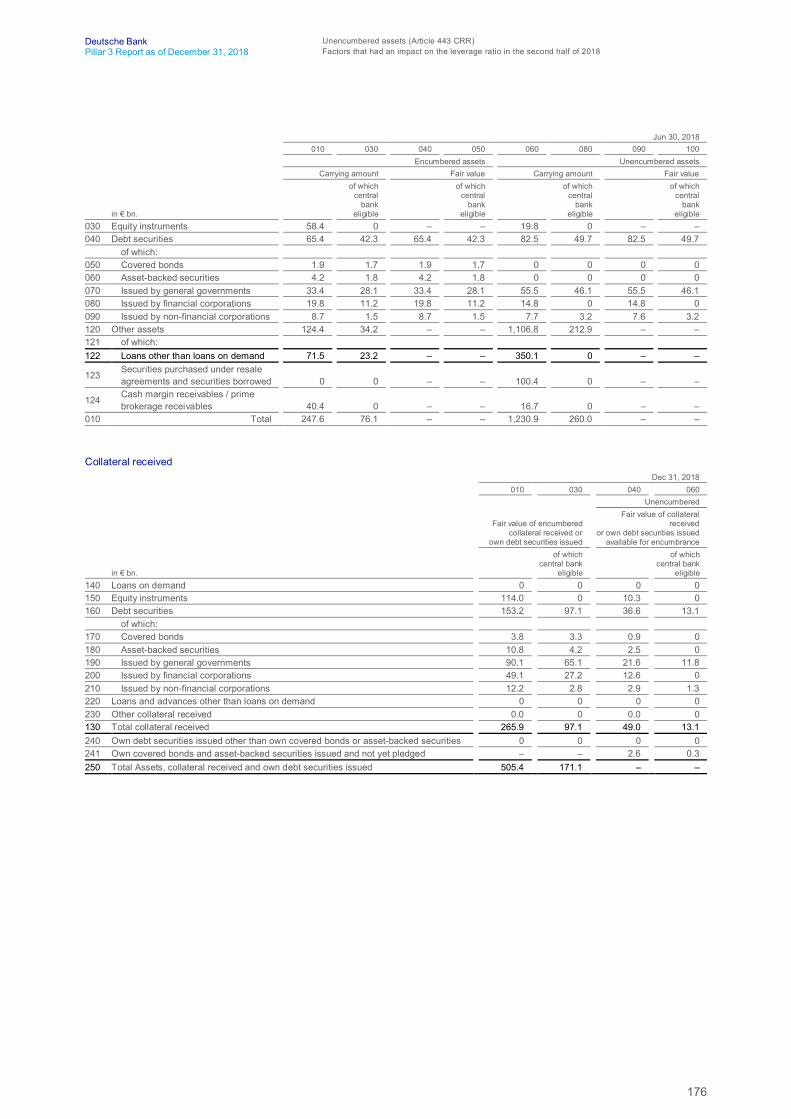
176
Deutsche Bank Unencumbered assets (Article 443 CRR)Pillar 3 Report as of December 31, 2018 Factors that had an impact on the leverage ratio in the second half of 2018
Jun 30, 2018010 030 040 050 060 080 090 100
Encumbered assets Unencumbered assetsCarrying amount Fair value Carrying amount Fair value
in € bn.
of whichcentral
bankeligible
of whichcentral
bankeligible
of whichcentral
bankeligible
of whichcentral
bankeligible
030 Equity instruments 58.4 0 – – 19.8 0 – –040 Debt securities 65.4 42.3 65.4 42.3 82.5 49.7 82.5 49.7
of which:050 Covered bonds 1.9 1.7 1.9 1.7 0 0 0 0060 Asset-backed securities 4.2 1.8 4.2 1.8 0 0 0 0070 Issued by general governments 33.4 28.1 33.4 28.1 55.5 46.1 55.5 46.1080 Issued by financial corporations 19.8 11.2 19.8 11.2 14.8 0 14.8 0090 Issued by non-financial corporations 8.7 1.5 8.7 1.5 7.7 3.2 7.6 3.2120 Other assets 124.4 34.2 – – 1,106.8 212.9 – –121 of which:122 Loans other than loans on demand 71.5 23.2 – – 350.1 0 – –
123 Securities purchased under resaleagreements and securities borrowed 0 0 – – 100.4 0 – –
124 Cash margin receivables / primebrokerage receivables 40.4 0 – – 16.7 0 – –
010 Total 247.6 76.1 – – 1,230.9 260.0 – –
Collateral receivedDec 31, 2018
010 030 040 060Unencumbered
Fair value of encumberedcollateral received or
own debt securities issued
Fair value of collateralreceived
or own debt securities issuedavailable for encumbrance
in € bn.
of whichcentral bank
eligible
of whichcentral bank
eligible140 Loans on demand 0 0 0 0150 Equity instruments 114.0 0 10.3 0160 Debt securities 153.2 97.1 36.6 13.1
of which:170 Covered bonds 3.8 3.3 0.9 0180 Asset-backed securities 10.8 4.2 2.5 0190 Issued by general governments 90.1 65.1 21.6 11.8200 Issued by financial corporations 49.1 27.2 12.6 0210 Issued by non-financial corporations 12.2 2.8 2.9 1.3220 Loans and advances other than loans on demand 0 0 0 0230 Other collateral received 0.0 0 0.0 0130 Total collateral received 265.9 97.1 49.0 13.1240 Own debt securities issued other than own covered bonds or asset-backed securities 0 0 0 0241 Own covered bonds and asset-backed securities issued and not yet pledged – – 2.6 0.3250 Total Assets, collateral received and own debt securities issued 505.4 171.1 – –
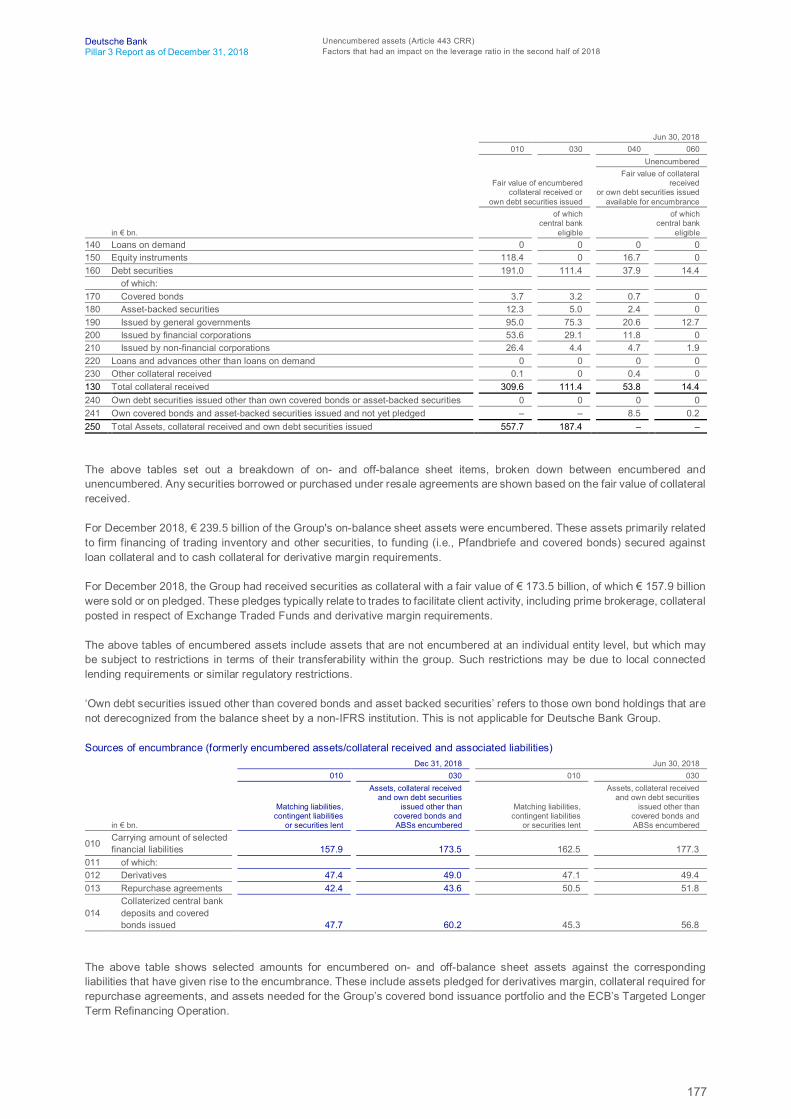
177
Deutsche Bank Unencumbered assets (Article 443 CRR)Pillar 3 Report as of December 31, 2018 Factors that had an impact on the leverage ratio in the second half of 2018
Jun 30, 2018010 030 040 060
Unencumbered
Fair value of encumberedcollateral received or
own debt securities issued
Fair value of collateralreceived
or own debt securities issuedavailable for encumbrance
in € bn.
of whichcentral bank
eligible
of whichcentral bank
eligible140 Loans on demand 0 0 0 0150 Equity instruments 118.4 0 16.7 0160 Debt securities 191.0 111.4 37.9 14.4
of which:170 Covered bonds 3.7 3.2 0.7 0180 Asset-backed securities 12.3 5.0 2.4 0190 Issued by general governments 95.0 75.3 20.6 12.7200 Issued by financial corporations 53.6 29.1 11.8 0210 Issued by non-financial corporations 26.4 4.4 4.7 1.9220 Loans and advances other than loans on demand 0 0 0 0230 Other collateral received 0.1 0 0.4 0130 Total collateral received 309.6 111.4 53.8 14.4240 Own debt securities issued other than own covered bonds or asset-backed securities 0 0 0 0241 Own covered bonds and asset-backed securities issued and not yet pledged – – 8.5 0.2250 Total Assets, collateral received and own debt securities issued 557.7 187.4 – –
The above tables set out a breakdown of on- and off-balance sheet items, broken down between encumbered andunencumbered. Any securities borrowed or purchased under resale agreements are shown based on the fair value of collateralreceived.
For December 2018, € 239.5 billion of the Group's on-balance sheet assets were encumbered. These assets primarily relatedto firm financing of trading inventory and other securities, to funding (i.e., Pfandbriefe and covered bonds) secured againstloan collateral and to cash collateral for derivative margin requirements.
For December 2018, the Group had received securities as collateral with a fair value of € 173.5 billion, of which € 157.9 billionwere sold or on pledged. These pledges typically relate to trades to facilitate client activity, including prime brokerage, collateralposted in respect of Exchange Traded Funds and derivative margin requirements.
The above tables of encumbered assets include assets that are not encumbered at an individual entity level, but which maybe subject to restrictions in terms of their transferability within the group. Such restrictions may be due to local connectedlending requirements or similar regulatory restrictions.
‘Own debt securities issued other than covered bonds and asset backed securities’ refers to those own bond holdings that arenot derecognized from the balance sheet by a non-IFRS institution. This is not applicable for Deutsche Bank Group.
Sources of encumbrance (formerly encumbered assets/collateral received and associated liabilities)Dec 31, 2018 Jun 30, 2018
010 030 010 030
in € bn.
Matching liabilities,contingent liabilities
or securities lent
Assets, collateral receivedand own debt securities
issued other thancovered bonds andABSs encumbered
Matching liabilities,contingent liabilities
or securities lent
Assets, collateral receivedand own debt securities
issued other thancovered bonds andABSs encumbered
010 Carrying amount of selectedfinancial liabilities 157.9 173.5 162.5 177.3
011 of which:012 Derivatives 47.4 49.0 47.1 49.4013 Repurchase agreements 42.4 43.6 50.5 51.8
014Collaterized central bankdeposits and coveredbonds issued 47.7 60.2 45.3 56.8
The above table shows selected amounts for encumbered on- and off-balance sheet assets against the correspondingliabilities that have given rise to the encumbrance. These include assets pledged for derivatives margin, collateral required forrepurchase agreements, and assets needed for the Group’s covered bond issuance portfolio and the ECB’s Targeted LongerTerm Refinancing Operation.
178
Deutsche Bank LiquidityPillar 3 Report as of December 31, 2018 Factors that had an impact on the leverage ratio in the second half of 2018
Liquidity
As part of the Basel 3 rules, the Basel Committee on Banking Supervision specified two minimum liquidity standards for banks:
The Liquidity Coverage Ratio (LCR):The LCR is intended to promote the short-term resilience of a bank’s liquidity risk profile over a 30 day stress scenario. Theratio is defined as the amount of High Quality Liquid Assets (“HQLA”) that could be used to raise liquidity, measured againstthe total volume of net cash outflows, arising from both contractual and modelled exposures, in a stressed scenario.
This requirement has been implemented into European law, via the Commission Delegated Regulation (EU) 2015/61, adoptedin October 2014. Compliance with the LCR was required in the EU from October 1, 2015.
Our average LCR of 145 % (twelve months average) has been calculated in accordance with the Commission DelegatedRegulation (EU) 2015/61 and the EBA Guidelines on LCR disclosure to complement the disclosure of liquidity riskmanagement under Article 435 CRR.
The year-end LCR as of December 31, 2018 stands at 140.37 % compared to 139.70 % as of December 31, 2017.
Concentration of funding and liquidity sources:For an overview of the concentration of funding and liquidity sources please refer to the section “Liquidity risk exposure” in theAnnual Report 2018 on page 143. The information is outlined in the sub-section “Funding diversification”, “Composition ofexternal funding sources”.
Derivative exposures and potential collateral calls:The majority of outflows related to derivative exposures and other collateral requirements shown in item 11 are in relation toderivative contractual cashflows that are offset by Other cash inflows shown in item 19.
Other significant outflows relate to the impact of an adverse market scenario on derivatives based on the 24 month historicallook back approach, and the posting of additional collateral as a result of a 3 notch downgrade of DB’s credit rating.
There are also some smaller outflows assumed in relation to callable excess margin collateral and to margin collateral postedthat might need to be upgraded to level 1 collateral under an LCR scenario.
Currency mismatch in the LCR:The LCR is calculated in all major currencies that make up at least 5% of the total Balance Sheet (EUR, USD, GBP andaggregated in EUR). No explicit LCR risk appetite is set for specific currencies, however, all results are monitored.
Approach to centralized group liquidity management and individual legal entity liquidity management:Please refer to the section “Liquidity risk management” on page 83 in the Annual Report 2018.
Other items in the LCR calculation that are not captured in the LCR disclosure template but that the institution considersrelevant for its liquidity profile:The Pillar 3 disclosure obligations require Banks to disclose the 12 months rolling averages for each quarter. We do notconsider anything else relevant for disclosure.
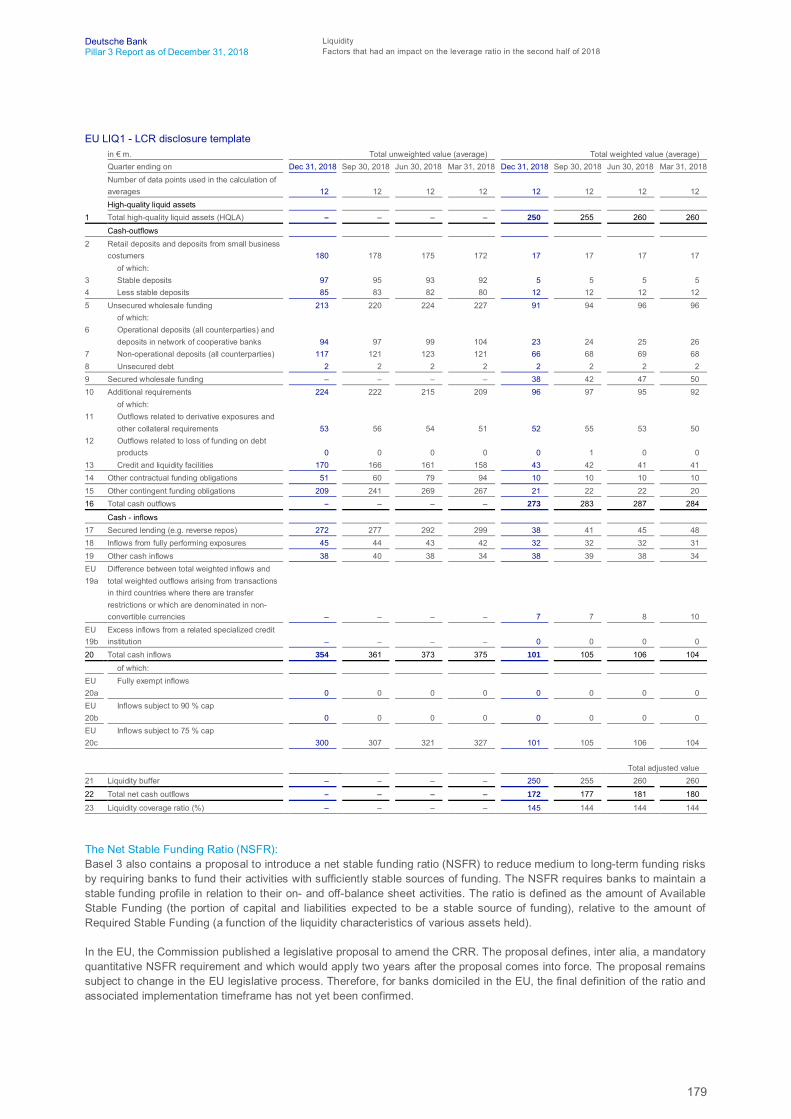
179
Deutsche Bank LiquidityPillar 3 Report as of December 31, 2018 Factors that had an impact on the leverage ratio in the second half of 2018
EU LIQ1 - LCR disclosure templatein € m. Total unweighted value (average) Total weighted value (average)Quarter ending on Dec 31, 2018 Sep 30, 2018 Jun 30, 2018 Mar 31, 2018 Dec 31, 2018 Sep 30, 2018 Jun 30, 2018 Mar 31, 2018Number of data points used in the calculation ofaverages 12 12 12 12 12 12 12 12High-quality liquid assets
1 Total high-quality liquid assets (HQLA) – – – – 250 255 260 260
Cash-outflows2 Retail deposits and deposits from small business
costumers 180 178 175 172 17 17 17 17of which:
3 Stable deposits 97 95 93 92 5 5 5 54 Less stable deposits 85 83 82 80 12 12 12 125 Unsecured wholesale funding 213 220 224 227 91 94 96 96
of which:6 Operational deposits (all counterparties) and
deposits in network of cooperative banks 94 97 99 104 23 24 25 267 Non-operational deposits (all counterparties) 117 121 123 121 66 68 69 688 Unsecured debt 2 2 2 2 2 2 2 29 Secured wholesale funding – – – – 38 42 47 5010 Additional requirements 224 222 215 209 96 97 95 92
of which:11 Outflows related to derivative exposures and
other collateral requirements 53 56 54 51 52 55 53 5012 Outflows related to loss of funding on debt
products 0 0 0 0 0 1 0 013 Credit and liquidity facilities 170 166 161 158 43 42 41 4114 Other contractual funding obligations 51 60 79 94 10 10 10 1015 Other contingent funding obligations 209 241 269 267 21 22 22 2016 Total cash outflows – – – – 273 283 287 284
Cash - inflows17 Secured lending (e.g. reverse repos) 272 277 292 299 38 41 45 4818 Inflows from fully performing exposures 45 44 43 42 32 32 32 3119 Other cash inflows 38 40 38 34 38 39 38 34EU19a
Difference between total weighted inflows andtotal weighted outflows arising from transactionsin third countries where there are transferrestrictions or which are denominated in non-convertible currencies – – – – 7 7 8 10
EU19b
Excess inflows from a related specialized creditinstitution – – – – 0 0 0 0
20 Total cash inflows 354 361 373 375 101 105 106 104
of which:EU20a
Fully exempt inflows0 0 0 0 0 0 0 0
EU20b
Inflows subject to 90 % cap0 0 0 0 0 0 0 0
EU20c
Inflows subject to 75 % cap300 307 321 327 101 105 106 104
Total adjusted value21 Liquidity buffer – – – – 250 255 260 260
22 Total net cash outflows – – – – 172 177 181 180
23 Liquidity coverage ratio (%) – – – – 145 144 144 144
The Net Stable Funding Ratio (NSFR):Basel 3 also contains a proposal to introduce a net stable funding ratio (NSFR) to reduce medium to long-term funding risksby requiring banks to fund their activities with sufficiently stable sources of funding. The NSFR requires banks to maintain astable funding profile in relation to their on- and off-balance sheet activities. The ratio is defined as the amount of AvailableStable Funding (the portion of capital and liabilities expected to be a stable source of funding), relative to the amount ofRequired Stable Funding (a function of the liquidity characteristics of various assets held).
In the EU, the Commission published a legislative proposal to amend the CRR. The proposal defines, inter alia, a mandatoryquantitative NSFR requirement and which would apply two years after the proposal comes into force. The proposal remainssubject to change in the EU legislative process. Therefore, for banks domiciled in the EU, the final definition of the ratio andassociated implementation timeframe has not yet been confirmed.

180
Deutsche Bank Business riskPillar 3 Report as of December 31, 2018 Factors that had an impact on the leverage ratio in the second half of 2018
Business risk
Business risk economic capital methodology captures a tax risk component, a capital charge for deferred tax on temporarydifferences and strategic risk, which also implicitly includes elements of non-standard risks including refinancing andreputational risk.
Economic capital usage for business risk by business division 2018 increase (decrease) from 2017
in € m. Dec 31, 2018 Dec 31, 2017 in € m. in %Corporate & Investment Bank 3,521 4,435 (914) (21)Private & Commercial Bank 29 10 19 202Asset Management 0 99 (99) (100)Corporate & Other 1,208 1,133 75 7Total 4,758 5,677 (918) (16)
Economic capital usage for business risk as of December 31, 2018 was € 4.76 billion, representing a € 0.9 billion(16 %) decrease compared to December 31, 2017. Strategic risk economic capital of € 3.39 billion was down from € 4.48billion in 2017, with the decrease being driven by a better earnings outlook in our plan for 2019 compared to the one for 2018in the previous year. Economic capital usage related to tax matters was broadly flat year on year.
The strategic risk economic capital model calculates potential unexpected operating losses under extreme adverse scenariosdue to decreases in operating revenues that cannot be compensated by cost reductions. To avoid double-counting, revenueor cost fluctuations related to market risk, credit risk or operational risk are not considered. The model reflects business-specific, historical revenue volatilities as well as the business 12-month earnings forecasts. Key macro-economic or financialrevenue drivers are included to model dependencies between business units.
Strategic risk economic capital is managed via the Strategic and Capital plan, which is developed annually and presented tothe Management Board for discussion and approval. The final plan is then presented to the Supervisory Board. During theyear, execution of business strategies is regularly monitored to assess the performance against strategic objectives and toensure we remain on track to achieve targets.

181
Deutsche Bank List of tablesPillar 3 Report as of December 31, 2018
List of tables
Main Pillar 3 disclosures in our Annual Report ................................................................................................................................................................... 9
EU LI1 – Differences between accounting and regulatory scopes of consolidation and the mapping of financial statement categories withregulatory risk categories ................................................................................................................................................................................................... 17
EU LI2 – Main sources of differences between regulatory exposure amounts and carrying values in financial statements ..................................... 20
Own funds template (incl. RWA and capital ratios) .......................................................................................................................................................... 24
Reconciliation of shareholders’ equity to regulatory capital ........................................................................................................................................... 28
Development of regulatory capital .................................................................................................................................................................................... 29
EU OV1 – Overview of RWA ................................................................................................................................................................................................ 36
EU CR10 – IRB (specialized lending and equities) ............................................................................................................................................................. 37
Credit risk exposures of other non-credit obligation assets ............................................................................................................................................ 38
Overview total capital requirements and capital buffers ................................................................................................................................................. 39
Geographical distribution of credit exposures relevant for the calculation of the countercyclical capital buffer ...................................................... 40
Institution-specific countercyclical capital buffer ............................................................................................................................................................. 44
EU CRB-B – Total and average net amount of exposures ................................................................................................................................................. 46
EU CRB-C – Geographical breakdown of exposures ......................................................................................................................................................... 47
EU CRB-D – Concentration of exposures by industry or counterparty types .................................................................................................................. 55
EU CRB-E – Maturity of exposures ..................................................................................................................................................................................... 61
EU CR1-A – Credit quality of exposures by exposure class and instrument.................................................................................................................... 63
EU CR1-B – Credit quality of exposures by industry ......................................................................................................................................................... 65
EU CR1-C – Credit quality of exposures by geography ..................................................................................................................................................... 67
EU CR1-D – Ageing of past-due exposures ........................................................................................................................................................................ 68
EU CR1-E – Non-performing and forborne exposures ...................................................................................................................................................... 69
NPL1 – Credit quality of forborne exposures .................................................................................................................................................................... 69
NPL4 - Performing and non-performing exposures and related provisions ................................................................................................................... 70
NPL3 - Credit quality of performing and non-performing exposures by past due days ................................................................................................. 71
EU CR2-A – Changes in the stock of general and specific credit risk adjustments ......................................................................................................... 72
EU CR2-B – Changes in the stock of defaulted and impaired loans and debt securities ................................................................................................ 72
EU CR3 – CRM techniques – Overview .............................................................................................................................................................................. 74
CRM techniques by exposure class .................................................................................................................................................................................... 75
EU CR4 – Standardized approach – credit risk exposure and credit risk mitigation (CRM) effects ............................................................................... 78
EU CR5 – Standardized approach ....................................................................................................................................................................................... 79
EAD within the group covered by the standardized, FIRB and AIRB approaches by exposure class ............................................................................ 81
Internal Ratings and Probability of Defaults ...................................................................................................................................................................... 82
EU CR6 – AIRB approach – Credit risk exposures by exposure class and PD range ........................................................................................................ 86
EU CR6 – FIRB approach – Credit risk exposures by exposure class and PD range ........................................................................................................ 95
EU CR7 – IRB approach – Effect on the RWAs of credit derivatives used as CRM techniques ...................................................................................... 99
EU CR8 – RWA flow statement of credit risk exposures under the IRB approach .......................................................................................................... 99
Validation results for risk parameters used in our advanced IRBA................................................................................................................................ 100
EU CR9 IRB backtesting of PD per exposure class for Advanced IRBA........................................................................................................................... 102
Validation results of risk parameters used in our Foundation IRBA at Postbank ......................................................................................................... 106
EU CR9 IRB backtesting of PD per exposure class for Foundation IRBA ........................................................................................................................ 107
Comparison of expected loss estimates for loans, commitments and contingent liabilities with actual losses recorded by regulatory exposureclass for advanced IRBA exposures .................................................................................................................................................................................. 109
Year-to-year comparison of the actual loss by IRBA exposure class ............................................................................................................................. 110
EAD net, average LGD and average PD of Advanced IRBA credit exposures by geographical location ...................................................................... 111
182
Deutsche Bank List of tablesPillar 3 Report as of December 31, 2018
EAD net and average PD of Foundation IRBA credit exposures by geographical location........................................................................................... 119
EU CCR1 – Analysis of CCR exposure by approach .......................................................................................................................................................... 124
EU CCR2 – CVA capital charge .......................................................................................................................................................................................... 125
EU CCR8 – Exposures to CCPs ........................................................................................................................................................................................... 125
EU CCR3 – Standardized approach – CCR exposures by regulatory portfolio and risk ................................................................................................ 126
EU CCR4 – AIRB approach – CCR exposures by portfolio and PD scale ......................................................................................................................... 128
EU CCR4 – FIRB approach – CCR exposures by portfolio and PD scale.......................................................................................................................... 134
EU CCR7 – RWA flow statement of counterparty credit risk exposures under the internal model method.............................................................. 136
EU CCR5-A – Impact of netting and collateral held on exposure values ....................................................................................................................... 136
EU CCR5-B – Composition of collateral for exposures to CCR........................................................................................................................................ 137
EU CCR6 – Credit derivatives exposures .......................................................................................................................................................................... 137
Economic capital usage for credit risk per business area ............................................................................................................................................... 138
EU MR1 – Market risk under the standardized approach .............................................................................................................................................. 139
EU MR2-A – Market Risk under the internal models approach (IMA)........................................................................................................................... 145
EU MR2-B – RWA flow statements of market risk exposures under the IMA .............................................................................................................. 146
EU MR3 – IMA values for trading portfolios1 .................................................................................................................................................................. 147
Economic capital usage of nontrading portfolios by business division ......................................................................................................................... 148
Operational risk losses by event type (profit and loss view) .......................................................................................................................................... 150
Operational losses by event type occurred in the period 2018 (2013-2017)1 .............................................................................................................. 150
Economic capital usage for operational risk by business division ................................................................................................................................. 151
Equity investments according to IFRS classification ....................................................................................................................................................... 153
Realized gains (losses) in the reporting period and unrealized gains (losses) at year-end from equity investments ............................................... 154
Outstanding exposures securitized by exposure type (overall pool size) within the banking book ........................................................................... 162
Outstanding exposures securitized by exposure type (overall pool size) within the trading book............................................................................. 162
Securitization positions retained or purchased by exposure type ................................................................................................................................ 163
Securitization positions retained or purchased by region (exposure amount) ............................................................................................................ 164
Outstanding exposures awaiting securitization (exposure amount) ............................................................................................................................. 164
Securitization activity – Total outstanding exposures securitized (i.e., the underlying pools) by exposure type within the banking book............ 165
Securitization activity – Total outstanding exposures securitized by exposure type within the trading book .......................................................... 166
Banking book securitization positions retained or purchased by risk weight band ..................................................................................................... 166
Banking book securitization positions retained or purchased by risk weight bands subject to the IRBA-Rating based approach (RBA) ................ 167
Banking book securitization positions retained or purchased by risk weight band subject to the IRBA-Supervisory formula approach (SFA) ...... 167
Banking book securitization positions retained or purchased by risk weight band subject to the credit risk standardized approach (CRSA) ....... 168
Trading book securitization positions retained or purchased by risk weight band subject to the market risk standardized approach (MRSA) .... 168
Re-securitization positions retained or purchased (exposure amount) ........................................................................................................................ 169
Impaired and past due exposures securitized and losses recognized by exposure type (overall pool size) as originator ........................................ 169
Summary reconciliation of accounting assets and leverage ratio exposures ............................................................................................................... 172
Leverage ratio common disclosure .................................................................................................................................................................................. 173
Breakdown of on-balance sheet exposures (excluding derivatives and SFTs) .............................................................................................................. 173
Encumbered and unencumbered assets ......................................................................................................................................................................... 175
Collateral received ............................................................................................................................................................................................................. 176
Sources of encumbrance (formerly encumbered assets/collateral received and associated liabilities) .................................................................... 177
EU LIQ1 - LCR disclosure template ................................................................................................................................................................................... 179
Economic capital usage for business risk by business division ...................................................................................................................................... 180