Embed Size (px)
Citation preview
1 MANAGEMENT REPORTBasel 3 Pillar 3 disclosures
BASEL 3 PILLAR 3 DISCLOSURES
Regulation EU 575/2013 (EU) of 26 June 2013 requires relevant Crédit Agricole Corporate and Investment Bank also disclosesfinancial institutions (notably credit institutions and investment detailed information on Pillar 3 requirements on a sub-consolidatedfirms) to disclose quantitative and qualitative information on their basis in its registration document.risk management activities. Crédit Agricole Group’s risk In May 2012, the Financial Stability Board sponsored the creation ofmanagement system and exposure levels are presented in this an international working group, the Enhanced Disclosure Tasksection and in the section entitled “Risk Factors”. Crédit Agricole Force (EDTF). The EDTF, which draws its members from theGroup has chosen to disclose its Pillar 3 Prudential information in a private sector, producers and users of financial information,separate section from its Risk Factors in order to present published a report in October 2012 that contained 32separately the requirements coming from prudential rules. This recommendations for enhancing bank communication, in particularsection provides information on capital requirements, constituents with respect to risk governance, capital adequacy, and exposure toof capital and exposures to credit risk, market risk and operational liquidity and funding, market, credit and other risks. Two progressrisk. reports published in August 2013 and September 2014 provideCommission Implementing Regulation (EU) no. 1423/2013 of further details on some of these recommendations.20 December 2013 lays down implementing technical standards In response to these recommendations, Crédit Agricole Groupwith regard to disclosure of capital requirements for institutions further improved the content of its financial communications. Theaccording to Regulation (EU) no. 575/2013 of the European table below presents an overview of the actions taken in responseParliament and of the Council. to the EDTF’s recommendations and lists the relevant sections in
this document.
80 CRÉDIT AGRICOLE S.A. UPDATE A01 OF THE 2014 REGISTRATION DOCUMENT
MANAGEMENT REPORTBasel 3 Pillar 3 disclosures
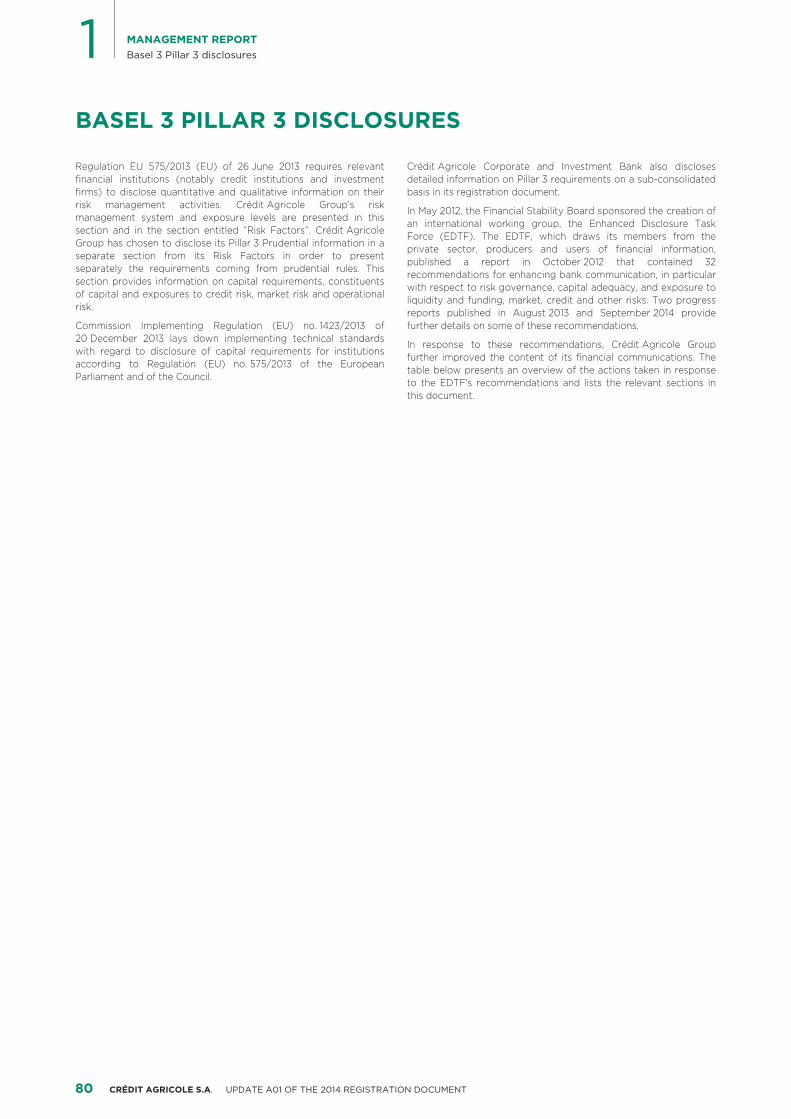
EDTF CROSS-REFERENCE TABLEUpdate A01
Management ConsolidatedRiskreport financial
Recommendation Pillar 3and others factors statements 1Introduction 1 Cross-reference table p. 81
2 Terminology and risk measures, key parameters used p. 44 to 79 p. 117 and 118 p. 162 to 165,177 to 190
3 Presentation of the main and/or emerging risks p. 44 to 79 p. 177 to 190
4 New regulatory framework covering solvency p. 68 p. 84 to 96 p. 190and the Group’s objectives
Risk management 5 Organisation of risk management and control p. 34 to 42 p. 44 and 45governance and strategy
6 Risk management strategy and implementation p. 34 to 42 p. 44 to 79 p. 93 to 94, 112
7 Risk mapping by business line p. 116 to 117
8 Governance and management of internal credit and p. 45, 46 tomarket stress testing process 48, 55 to 57
Capital requirements 9 Minimum Capital requirements p. 86 to 90and risk weighted assets
10a Detail of capital composition p. 91, 97 to 110 (1)
10b Reconciliation of accounting and regulatory balance p. 83, 111sheets and of accounting equity and regulatory capital
11 Change in regulatory capital p. 91 to 92, 113
12 Capital planning and targeted ratios under CRD 4 p. 86 to 96, 113
13 Risk weighted assets by business line and by type of risk p. 114 to 116,120 to 121
14 Risk weighted assets and capital requirements by method p. 49 p. 114 to 144and type of exposure
15 Exposure to credit risk by type of exposure and internal p. 47, 49, 53 p. 120 to 132rating
16 Trends in risk weighted assets by type of risk p. 116 to 117
17 Description of back-testing models and their p. 46 to 47, p. 118 to 120,reliability 55, 77 134
Liquidity 18 Management of liquidity and cash balance sheet p. 65 to 69
19 Asset encumbrance p. 94 to 95
20 Breakdown of financial assets and financial liabilities p 124 p. 183 to 188,by contractual maturity 238
21 Management of liquidity and funding risks p. 65 to 70
22 Market risk measurement p. 54 to 59 p. 144 p. 161 to 167,to 24 183 to 186,
Market risk 248 to 261
25 Market risk management techniques p. 54 to 59
26 Maximum exposure, breakdown and diversification of p. 45 to 53 p. 117 to 136 p. 177 to 182Credit risk credit risks
27 and 28 Impairment and risk coverage policy p. 53 p. 163, 182, 195
29 Derivative instruments: notional amounts, counterparty p. 38 p. 48, 50, 53, p. 84 to 85, 114 p. 164 to 165,risk and offsetting 56 to 57 to 115, 121 183 to 186,
219 to 221, 251
30 Credit risk mitigation mechanisms p. 50 to 51 p. 135 and 136 p. 245 and246
31 Other risks: risks in the insurance sector, operational risks p. 34 to 42 p. 70 to 77 p. 144 p. 189, 233 toand legal risks, security of IT systems and business 235
Other risks continuity plans
32 Stated risks and ongoing actions with respect to p. 233 to 235 p. 234 tooperational and legal risks of the Crédit 235
Agricole S.A.registration
document
Details of debt issues are available on the website: (1)www.credit-agricole.com/en/Investor-and-shareholder/Financial-reporting/Pillar-3-and-other-regulatory-information.
81CRÉDIT AGRICOLE S.A. UPDATE A01 OF THE 2014 REGISTRATION DOCUMENT
1 MANAGEMENT REPORTBasel 3 Pillar 3 disclosures
REGULATORY BACKGROUND AND SCOPE
Scope of application of the capital I. Regulatory scopeII.requirements for the purposes
Difference between the accounting of regulatory supervisionand regulatory scopes of consolidation
Credit institutions and certain investment activities permitted toprovide services and investment activities referred to in Annex 1 of Entities consolidated for accounting purposes, but excluded fromdirective 2004/39/EC are subject to solvency and large exposure the regulatory scope of consolidation of credit institutions on aratios on an individual and, where applicable, sub-consolidated consolidated basis predominantly comprise insurance companiesbasis, although they may be exempted under the provisions of and several ad hoc entities that are equity-accounted for regulatoryArticle 7 of Regulation (EU) no. 575/2013 of the European purposes. In addition, entities consolidated on an accounting basisParliament and of the Council of 26 June 2013 (CRR). using proportional consolidation at 31 December 2013 and now
equity-accounted in accordance with IFRS 11, are still consolidatedThe French Prudential and Resolution Supervisory Authorityproportionally for regulatory purposes. Information on these(Autorité de contrôle prudentiel et de résolution – ACPR) hasentities and their consolidation method for accounting purposes isagreed that some of the Group’s subsidiaries may benefit fromprovided in the consolidated financial statements, “Scope ofexemption on an individual or, where applicable, sub-consolidatedconsolidation at 31 December 2014”.basis. As such, Crédit Agricole S.A. has been exempted by the
ACPR on an individual basis.
The transition to CRR/CRD 4 does not call into question theindividual exemptions granted by the ACPR prior to 1 January 2014,based on pre-existing regulatory provisions.
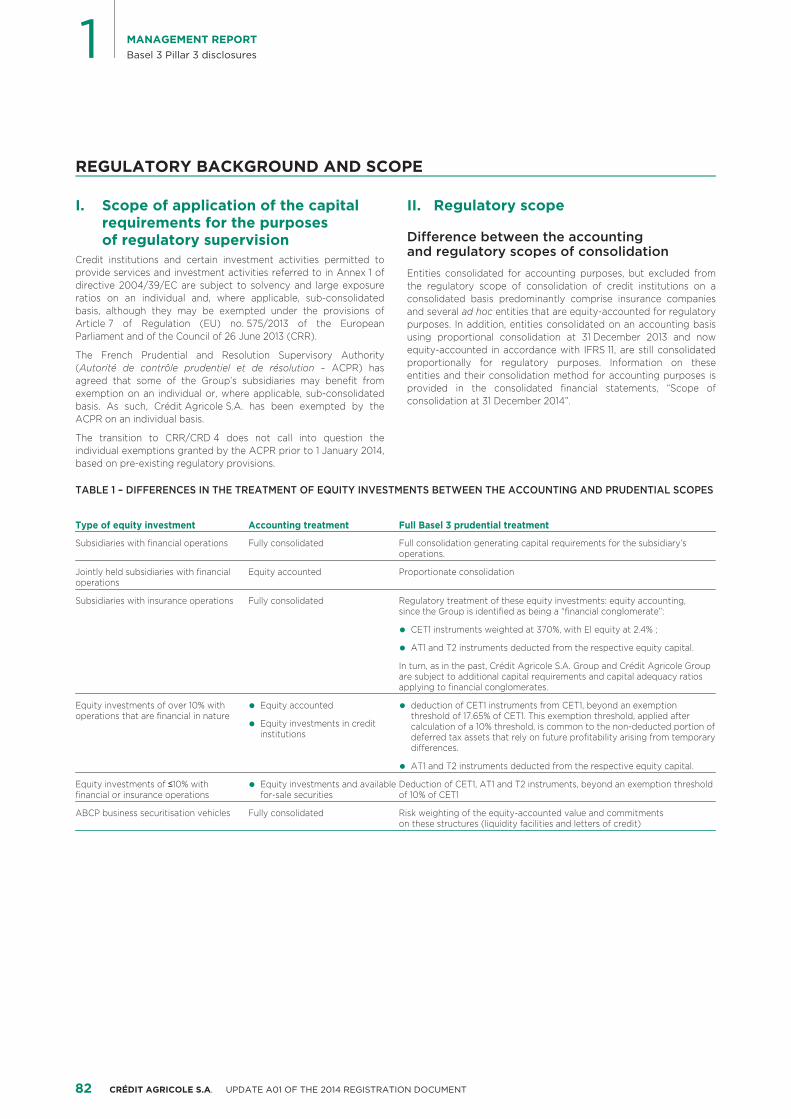
TABLE 1 – DIFFERENCES IN THE TREATMENT OF EQUITY INVESTMENTS BETWEEN THE ACCOUNTING AND PRUDENTIAL SCOPES
Type of equity investment Accounting treatment Full Basel 3 prudential treatment
Subsidiaries with financial operations Fully consolidated Full consolidation generating capital requirements for the subsidiary’s operations.
Jointly held subsidiaries with financial Equity accounted Proportionate consolidationoperations
Subsidiaries with insurance operations Fully consolidated Regulatory treatment of these equity investments: equity accounting, since the Group is identified as being a “financial conglomerate”:
CET1 instruments weighted at 370%, with El equity at 2.4% ;•AT1 and T2 instruments deducted from the respective equity capital.•
In turn, as in the past, Crédit Agricole S.A. Group and Crédit Agricole Group are subject to additional capital requirements and capital adequacy ratios applying to financial conglomerates.
Equity investments of over 10% with Equity accounted• deduction of CET1 instruments from CET1, beyond an exemption •operations that are financial in nature threshold of 17.65% of CET1. This exemption threshold, applied after
Equity investments in credit • calculation of a 10% threshold, is common to the non-deducted portion of institutions deferred tax assets that rely on future profitability arising from temporary
differences.
AT1 and T2 instruments deducted from the respective equity capital.•Equity investments of ≤10% with Equity investments and available • Deduction of CET1, AT1 and T2 instruments, beyond an exemption threshold financial or insurance operations for-sale securities of 10% of CET1
ABCP business securitisation vehicles Fully consolidated Risk weighting of the equity-accounted value and commitments on these structures (liquidity facilities and letters of credit)
82 CRÉDIT AGRICOLE S.A. UPDATE A01 OF THE 2014 REGISTRATION DOCUMENT
MANAGEMENT REPORTBasel 3 Pillar 3 disclosures
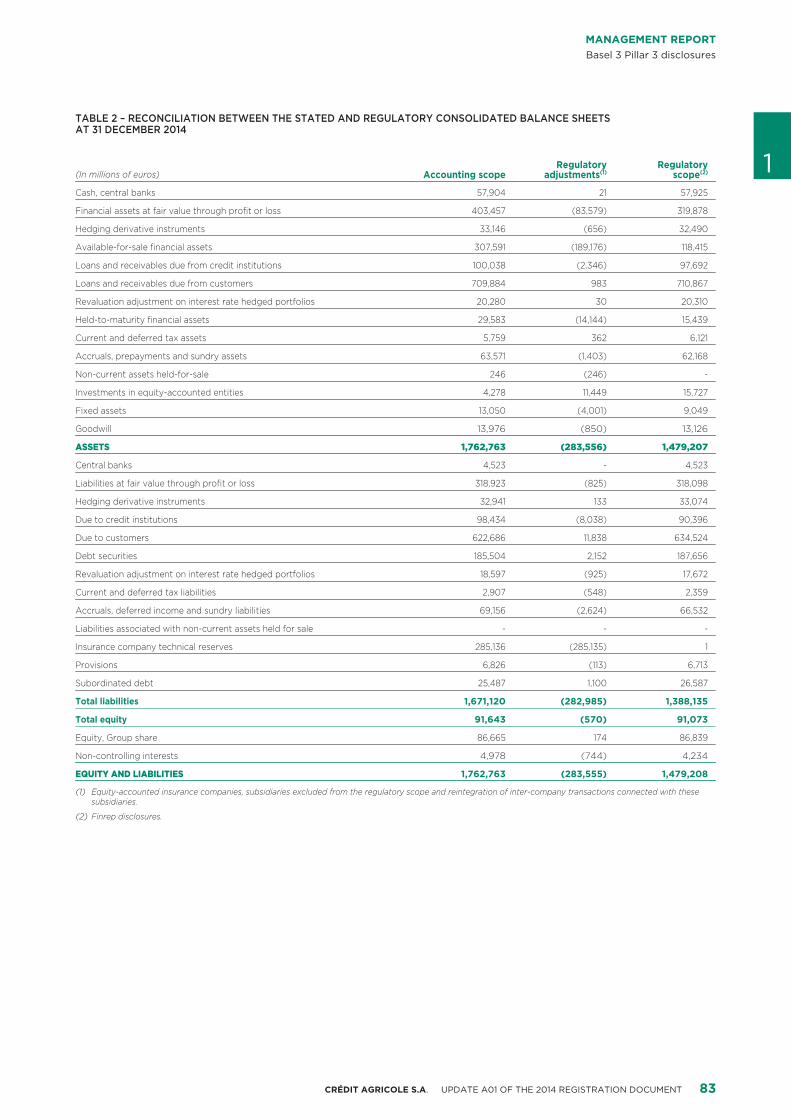
TABLE 2 – RECONCILIATION BETWEEN THE STATED AND REGULATORY CONSOLIDATED BALANCE SHEETS AT 31 DECEMBER 2014
1Regulatory RegulatoryAccounting scope(In millions of euros) adjustments(1) scope(2)
Cash, central banks 57,904 21 57,925
Financial assets at fair value through profit or loss 403,457 (83,579) 319,878
Hedging derivative instruments 33,146 (656) 32,490
Available-for-sale financial assets 307,591 (189,176) 118,415
Loans and receivables due from credit institutions 100,038 (2,346) 97,692
Loans and receivables due from customers 709,884 983 710,867
Revaluation adjustment on interest rate hedged portfolios 20,280 30 20,310
Held-to-maturity financial assets 29,583 (14,144) 15,439
Current and deferred tax assets 5,759 362 6,121
Accruals, prepayments and sundry assets 63,571 (1,403) 62,168
Non-current assets held-for-sale 246 (246) -
Investments in equity-accounted entities 4,278 11,449 15,727
Fixed assets 13,050 (4,001) 9,049
Goodwill 13,976 (850) 13,126
ASSETS 1,762,763 (283,556) 1,479,207
Central banks 4,523 - 4,523
Liabilities at fair value through profit or loss 318,923 (825) 318,098
Hedging derivative instruments 32,941 133 33,074
Due to credit institutions 98,434 (8,038) 90,396
Due to customers 622,686 11,838 634,524
Debt securities 185,504 2,152 187,656
Revaluation adjustment on interest rate hedged portfolios 18,597 (925) 17,672
Current and deferred tax liabilities 2,907 (548) 2,359
Accruals, deferred income and sundry liabilities 69,156 (2,624) 66,532
Liabilities associated with non-current assets held for sale - - -
Insurance company technical reserves 285,136 (285,135) 1
Provisions 6,826 (113) 6,713
Subordinated debt 25,487 1,100 26,587
Total liabilities 1,671,120 (282,985) 1,388,135
Total equity 91,643 (570) 91,073
Equity, Group share 86,665 174 86,839
Non-controlling interests 4,978 (744) 4,234
EQUITY AND LIABILITIES 1,762,763 (283,555) 1,479,208
Equity-accounted insurance companies, subsidiaries excluded from the regulatory scope and reintegration of inter-company transactions connected with these (1)subsidiaries.
Finrep disclosures.(2)
83CRÉDIT AGRICOLE S.A. UPDATE A01 OF THE 2014 REGISTRATION DOCUMENT
1 MANAGEMENT REPORTBasel 3 Pillar 3 disclosures
Reform of solvency ratiosIII. threshold of 10% of CET1, is common to the non-deductedportion of CET1 instruments held in significant financial stakes
Summary of the major changes introduced (over 10%). Items not deducted are included in risk-weightedassets (250% weighting);
by Basel 3 (CRR/CRD 4) compared with deduction from the CET1 of the CET1 instruments held in6.Basel 2 significant financial stakes (over 10%, significant investments)beyond an exemption threshold of 17.65% of CET1 capital, withTightening up the regulatory framework, Basel 3 enhances thetreatment identical to that described in the previous point:quality and level of regulatory capital required and adds new risk
categories to the regulatory framework. The legislation concerning the deduction relates to direct investments of over 10% and■the regulatory requirements applicable to credit institutions and indirect investments (in particular via UCITS). These are nowinvestment firms was published in the Official Journal of the treated as a deduction and not anymore as risk-weightedEuropean Union on 26 June 2013 (directive 2013/36/EU, transposed assets. Their amount is added to that of the aforementionednotably by Order no. 2014-158 of 20 February 2014 and Regulation financial-sector direct investments should they be identified(EU) no. 575/2013 of the European Parliament and of the Council) as financial-sector entities. Otherwise, the equity portion, orand entered into force on 1 January 2014, in accordance with the even the full amount of the UCITS portfolio is deducted fromtransitional provisions specified in the legislation. the CET1 without the exemption being applied,
SOLVENCY RATIO NUMERATORA. with regard to insurance-sector equity investments, they are■
treated as risk weighted assets weighted at 370% if they areBasel 3 defines three levels of capital:part of the conglomerate. If not, they are consolidated with
Common Equity Tier 1 capital (CET1);■ other financial-sector investments and are thereforededucted from CET1 for the portion in excess of the doubleTier 1 capital, which consists of Common Equity Tier 1 capital■exemption threshold mechanism described above;and Additional Tier 1 capital (AT1);
restriction of the Tier 1 and Tier 2 capital to hybrid debt7.total capital consisting of Tier 1 capital and Tier 2 capital.■instruments satisfying the inclusion criteria for Basel 3 eligibility;
Capital at 31 December 2014, calculated on a fully loaded Basel 3(1)
value adjustments arising from the prudent valuation laid down8.basis, takes into account the following changes compared within the regulatory framework: institutions must apply the prudent31 December 2013 on a Basel 2.5 basis:valuation principle and adjust the amount of their assets
elimination of most prudential filters, in particular as regards1. measured at fair value and deduct any value adjustment.unrealised capital gains and losses on equity instruments and
In addition, some of these items will be introduced progressively oravailable-for-sale debt securities. As an exception, capital gainsphased-in as described below in point IV.and losses on cash flow hedges and those arising from changes
in the institution’s credit rating (liabilities held at fair value)SOLVENCY RATIO DENOMINATORB.remain filtered. Unrealised capital gains and losses on sovereign
Basel 3 introduces changes to the calculation of credit anddebt securities are not filtered in the tables presented below,counterparty risk-weighted assets, and in particular factors in:which are projected to 2022, when IAS 39 will no longer be in
force. In addition, a filter is introduced in respect of the DVA the risk of market price movements in derivatives transactions■(debit valuation adjustment reflecting changes in the credit linked to the credit rating quality of the counterparty (CVA -rating of the institution related to derivatives held as liabilities on Credit Valuation Adjustment);the balance sheet);
central counterparty risks (clearing houses);■partial derecognition of minority interests and other equity2.
external ratings, the reference of which is modified for the■instruments issued by eligible subsidiaries(2) in excess of thecalculation of the weighting of financial counterparties under theamount of capital required to cover the subsidiary’s capitalstandardised method;requirements. This partial derecognition applies to each tier of
capital. Furthermore, ineligible minority interests are excluded; an increase in the correlation of default of large financial-sector■entities for treatment under the internal ratings-based approach;deduction from the CET1 of deferred tax assets (DTAs) that rely3.
on future profitability arising from tax loss carryforwards; strengthening of detection measures and monitoring of the■correlation risk;deduction from the CET1 of negative amounts resulting from4.
any shortfall of provisions relative to expected losses (EL), preferential treatment of exposures on small and medium-sized■calculated with a distinction between performing and firms (SMEs).non-performing loans;
Furthermore, risk-weighted assets include the equity-accounteddeduction from the CET1 of deferred tax assets (DTAs) that rely5. value of insurance investments for the validated conglomerateon future profitability arising from temporary differences above scope, pursuant to Article 49 of the CRR. For Crédit Agricolean exemption threshold of 17.65% of CET1. This exemption Group, the weighting stands at 370% since Crédit Agricolethreshold, applied after application of an initial exemption Assurances (CAA) is not listed.
As they would be calculated in 2022 after the transition period.(1)
Credit institution and contain investment activities.(2)
84 CRÉDIT AGRICOLE S.A. UPDATE A01 OF THE 2014 REGISTRATION DOCUMENT
MANAGEMENT REPORTBasel 3 Pillar 3 disclosures
Pursuant to Regulation (EU) no. 575/2013 of 26 June 2013, two particular, the development of “internal rating” methods has led toapproaches are used to measure exposure to credit risk: the systematic collection of reliable data in respect of historical
default and loss for the majority of Group entities. The collection ofthe standardised approach, which is based on external credit■
1historical data of this nature now makes it possible to quantifyratings and fixed weightings for each Basel exposure class;credit risk by giving each rating an average probability of default
the Internal Ratings Based approach (IRB), which is based on■ (PD) and, for “advanced internal rating” approaches, the loss giventhe bank’s own internal rating system. default (LGD).
There are two subsets of the IRB approach: In addition, the parameters of the “internal rating” models are usedin the definition, implementation and monitoring of entities’ risk andthe “Foundation Internal Ratings-Based” approach, under■credit policies. On the scope of large customers, the Group’s uniquewhich institutions may use exclusively their own defaultrating system (identical methods and tools, shared data), in placeprobability estimates,for many years, has contributed to strengthening and standardising
the “Advanced Internal Ratings-Based” approach, under■ the use of ratings and the associated risk parameters within thewhich institutions may use all their internal estimates of risk entities. The uniqueness of ratings in the Large customers’ scopecomponents: probability of default, loss given default, thereby provides a shared framework on which to base standardsexposure given default and maturity. and procedures, management tools, provisioning and risk-hedging
policies, as well as alerts and close monitoring procedures. Due toSince late 2007, the ACPR has authorised Crédit Agricole Group totheir role in the monitoring and managing of risk within the varioususe its internal rating systems to calculate regulatory capitalentities, ratings are subject to quality controls and regularrequirements for credit risk on Retail and Large customermonitoring at all stages of the rating process.exposures throughout almost all of its consolidation scope. After
the transition to the advanced IRB approach for all the “Retail Internal models for measuring risks accordingly promote thebanking” portfolios of Cariparma and FriulAdria in Italy in 2013, the development of sound risk-management practices among GroupGroup was granted authorisation in 2014 to use the IRB approach entities and improve the efficiency of the process of capitalfor the “Corporate” portfolios of LCL and the Regional Banks, allocation by allowing a more accurate measurement of itseffective as of 1 October 2014. consumption by business line and by entity.
In addition, the ACPR has since 1 January 2008 authorisedSOLVENCY RATIOS UNDER CRR/CRD 4C.Crédit Agricole Group’s main entities to use the Advanced
Overall under Basel 3, three levels of solvency ratio are calculated:Measurement Approach (AMA) to calculate their regulatory capitalrequirements for operational risk. The Group’s other entities use the the Common Equity Tier (CET1) ratio;■standardised approach, in accordance with regulations.
the Tier 1 (T1) ratio;■The main Group entities or portfolios still using the standardised
the total capital ratio.■method for measuring credit and/or operational risk at31 December 2014 were as follows: These ratios are to be phased-in so that the transition from the
Basel 2 calculation rules to the Basel 3 rules can be handledthe Cariparma Group portfolios still not validated (non-retail■progressively.banking portfolios and Carispezia scope) as well as all other
entities in the International retail banking division; In addition to the mandatory minimum ratio levels, “capital buffers”consisting solely of Common Equity Tier 1 capital, will be applied toCrédit Agricole Leasing & Factoring group;■the ratios (see Minimum Requirements in point V below) to
some portfolios and foreign subsidiaries of Crédit Agricole■ strengthen the resilience of the banking sector:Consumer Finance group;
the capital conservation buffer;■the real estate professionals portfolio.■
the countercyclical buffer;■Pursuant to the Group’s commitment to phase in the advanced
the global systemically important financial institutions (G-SIB)■method, agreed with the ACPR in May 2007 (rollout plan), work onbuffer, (only for Crédit Agricole Group, and not forthe main entities or portfolios still under the standardised methodCrédit Agricole S.A.); andcontinues. An update of the rollout plan is sent annually to the
competent authority. the systemic risk buffer requirement.■The use of internal models for calculating solvency ratios hasstrengthened Crédit Agricole Group’s risk management. In
85CRÉDIT AGRICOLE S.A. UPDATE A01 OF THE 2014 REGISTRATION DOCUMENT
1 MANAGEMENT REPORTBasel 3 Pillar 3 disclosures
Transitional implementation phaseIV. The hybrid debt instruments that were eligible to capital under7.Basel 2 and which are no longer eligible as capital owing to the
To facilitate compliance by credit institutions with the CRR/CRD 4, entry into force of the new regulation can, under certainless stringent transitional provisions have been provided for: conditions, be eligible to the grandfathering clause. Innotably the progressive introduction of new capital components: accordance with this clause, these instruments are gradually
excluded over a period of 8 years, with a reduction of 10% pertransitional application of the treatment of prudential filters on1.annum. In 2014, 80% of the overall base reported atunrealised gains and losses on available-for-sale financial31 December 2012 is recognised, then 70% in 2015, etc. Theassets: unrealised gains will still be excluded from CET1 in 2014,derecognised portion may be recognised in the lowest tier ofand will subsequently be integrated on a gradual basis (40% incapital (from AT1 to Tier 2, for example) if it satisfies the2015; 60% in 2016; 80% in 2017 and 100% in subsequent years).corresponding criteria.Conversely, unrealised capital losses are to be included from
2014. In addition, unrealised capital gains and losses on Lastly, intangible assets (including goodwill) are to be deducted insovereign debt securities remain excluded from capital until full from CET1 from 2014, in accordance with the nationalsuch time as IFRS 9 is adopted by the EU; transposition of the transitional provisions.progressive deduction of the partial derecognition or exclusion2.
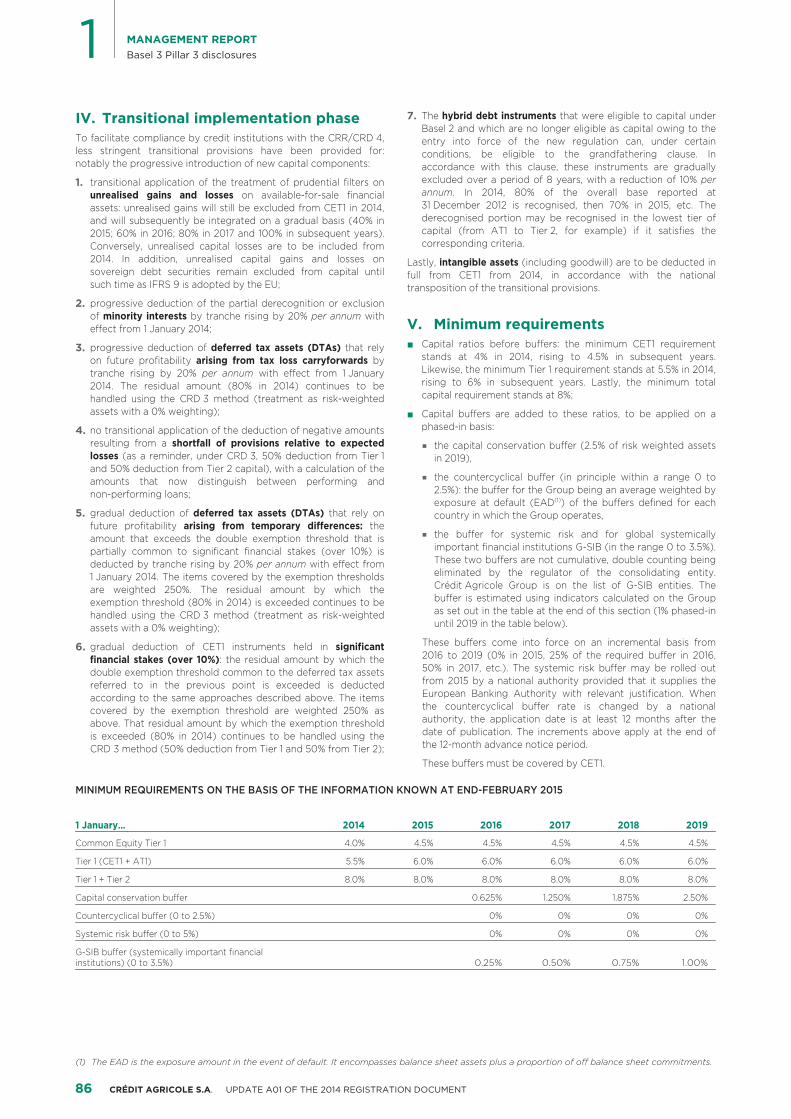
Minimum requirementsV.of minority interests by tranche rising by 20% per annum witheffect from 1 January 2014;
Capital ratios before buffers: the minimum CET1 requirement■progressive deduction of deferred tax assets (DTAs) that rely3.stands at 4% in 2014, rising to 4.5% in subsequent years.on future profitability arising from tax loss carryforwards byLikewise, the minimum Tier 1 requirement stands at 5.5% in 2014,tranche rising by 20% per annum with effect from 1 Januaryrising to 6% in subsequent years. Lastly, the minimum total2014. The residual amount (80% in 2014) continues to becapital requirement stands at 8%;handled using the CRD 3 method (treatment as risk-weighted
assets with a 0% weighting); Capital buffers are added to these ratios, to be applied on a■phased-in basis:no transitional application of the deduction of negative amounts4.
resulting from a shortfall of provisions relative to expected the capital conservation buffer (2.5% of risk weighted assets■losses (as a reminder, under CRD 3, 50% deduction from Tier 1 in 2019),and 50% deduction from Tier 2 capital), with a calculation of the
the countercyclical buffer (in principle within a range 0 to■amounts that now distinguish between performing and2.5%): the buffer for the Group being an average weighted bynon-performing loans;exposure at default (EAD(1)) of the buffers defined for each
gradual deduction of deferred tax assets (DTAs) that rely on5. country in which the Group operates,future profitability arising from temporary differences: the
the buffer for systemic risk and for global systemically■amount that exceeds the double exemption threshold that isimportant financial institutions G-SIB (in the range 0 to 3.5%).partially common to significant financial stakes (over 10%) isThese two buffers are not cumulative, double counting beingdeducted by tranche rising by 20% per annum with effect fromeliminated by the regulator of the consolidating entity.1 January 2014. The items covered by the exemption thresholdsCrédit Agricole Group is on the list of G-SIB entities. Theare weighted 250%. The residual amount by which thebuffer is estimated using indicators calculated on the Groupexemption threshold (80% in 2014) is exceeded continues to beas set out in the table at the end of this section (1% phased-inhandled using the CRD 3 method (treatment as risk-weighteduntil 2019 in the table below).assets with a 0% weighting);
These buffers come into force on an incremental basis fromgradual deduction of CET1 instruments held in significant6.2016 to 2019 (0% in 2015, 25% of the required buffer in 2016,financial stakes (over 10%): the residual amount by which the50% in 2017, etc.). The systemic risk buffer may be rolled outdouble exemption threshold common to the deferred tax assetsfrom 2015 by a national authority provided that it supplies thereferred to in the previous point is exceeded is deductedEuropean Banking Authority with relevant justification. Whenaccording to the same approaches described above. The itemsthe countercyclical buffer rate is changed by a nationalcovered by the exemption threshold are weighted 250% asauthority, the application date is at least 12 months after theabove. That residual amount by which the exemption thresholddate of publication. The increments above apply at the end ofis exceeded (80% in 2014) continues to be handled using thethe 12-month advance notice period.CRD 3 method (50% deduction from Tier 1 and 50% from Tier 2);These buffers must be covered by CET1.
MINIMUM REQUIREMENTS ON THE BASIS OF THE INFORMATION KNOWN AT END-FEBRUARY 2015
1 January… 2014 2015 2016 2017 2018 2019
Common Equity Tier 1 4.0% 4.5% 4.5% 4.5% 4.5% 4.5%
Tier 1 (CET1 + AT1) 5.5% 6.0% 6.0% 6.0% 6.0% 6.0%
Tier 1 + Tier 2 8.0% 8.0% 8.0% 8.0% 8.0% 8.0%
Capital conservation buffer 0.625% 1.250% 1.875% 2.50%
Countercyclical buffer (0 to 2.5%) 0% 0% 0% 0%
Systemic risk buffer (0 to 5%) 0% 0% 0% 0%
G-SIB buffer (systemically important financial 0.25% 0.50% 0.75% 1.00%institutions) (0 to 3.5%)
The EAD is the exposure amount in the event of default. It encompasses balance sheet assets plus a proportion of off balance sheet commitments.(1)
86 CRÉDIT AGRICOLE S.A. UPDATE A01 OF THE 2014 REGISTRATION DOCUMENT
MANAGEMENT REPORTBasel 3 Pillar 3 disclosures
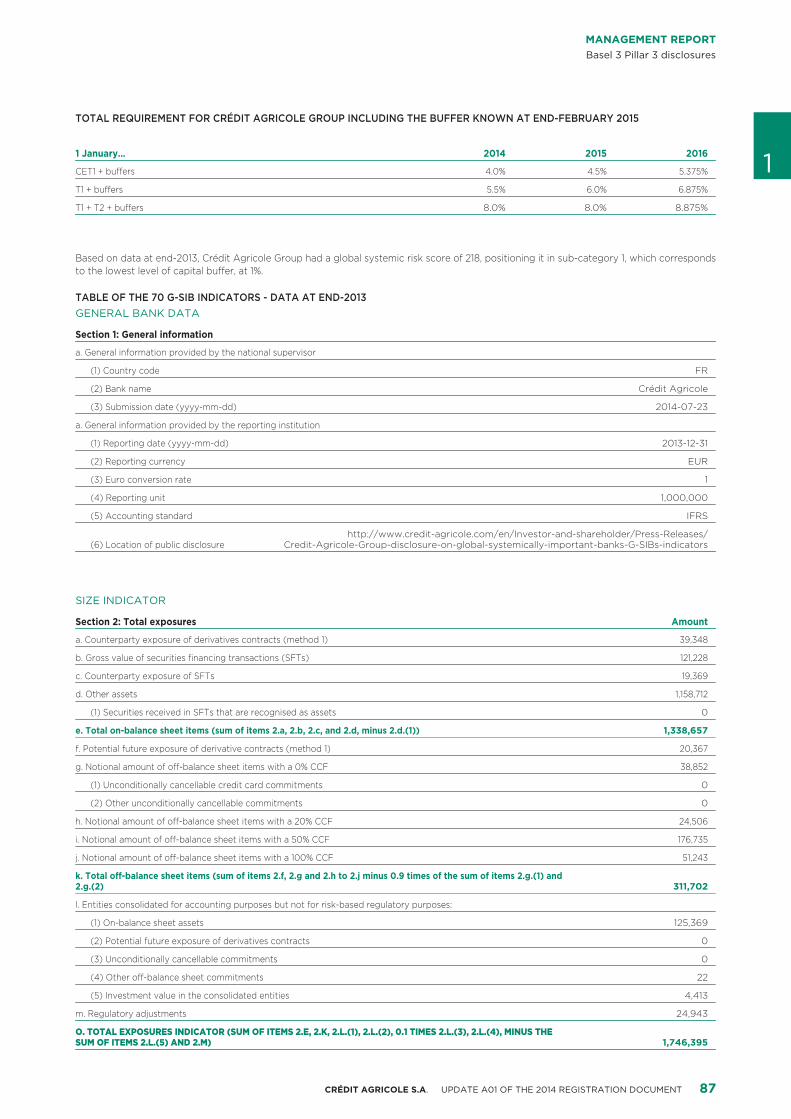
TOTAL REQUIREMENT FOR CRÉDIT AGRICOLE GROUP INCLUDING THE BUFFER KNOWN AT END-FEBRUARY 2015
1 January… 2014 2015 2016 1CET1 + buffers 4.0% 4.5% 5.375%
T1 + buffers 5.5% 6.0% 6.875%
T1 + T2 + buffers 8.0% 8.0% 8.875%
Based on data at end-2013, Crédit Agricole Group had a global systemic risk score of 218, positioning it in sub-category 1, which correspondsto the lowest level of capital buffer, at 1%.
TABLE OF THE 70 G-SIB INDICATORS - DATA AT END-2013GENERAL BANK DATA
Section 1: General information
a. General information provided by the national supervisor
(1) Country code FR
(2) Bank name Crédit Agricole
(3) Submission date (yyyy-mm-dd) 2014-07-23
a. General information provided by the reporting institution
(1) Reporting date (yyyy-mm-dd) 2013-12-31
(2) Reporting currency EUR
(3) Euro conversion rate 1
(4) Reporting unit 1,000,000
(5) Accounting standard IFRS
http://www.credit-agricole.com/en/Investor-and-shareholder/Press-Releases/(6) Location of public disclosure Credit-Agricole-Group-disclosure-on-global-systemically-important-banks-G-SIBs-indicators
SIZE INDICATOR
Section 2: Total exposures Amount
a. Counterparty exposure of derivatives contracts (method 1) 39,348
b. Gross value of securities financing transactions (SFTs) 121,228
c. Counterparty exposure of SFTs 19,369
d. Other assets 1,158,712
(1) Securities received in SFTs that are recognised as assets 0
e. Total on-balance sheet items (sum of items 2.a, 2.b, 2.c, and 2.d, minus 2.d.(1)) 1,338,657
f. Potential future exposure of derivative contracts (method 1) 20,367
g. Notional amount of off-balance sheet items with a 0% CCF 38,852
(1) Unconditionally cancellable credit card commitments 0
(2) Other unconditionally cancellable commitments 0
h. Notional amount of off-balance sheet items with a 20% CCF 24,506
i. Notional amount of off-balance sheet items with a 50% CCF 176,735
j. Notional amount of off-balance sheet items with a 100% CCF 51,243
k. Total off-balance sheet items (sum of items 2.f, 2.g and 2.h to 2.j minus 0.9 times of the sum of items 2.g.(1) and 311,7022.g.(2)
l. Entities consolidated for accounting purposes but not for risk-based regulatory purposes:
(1) On-balance sheet assets 125,369
(2) Potential future exposure of derivatives contracts 0
(3) Unconditionally cancellable commitments 0
(4) Other off-balance sheet commitments 22
(5) Investment value in the consolidated entities 4,413
m. Regulatory adjustments 24,943
O. TOTAL EXPOSURES INDICATOR (SUM OF ITEMS 2.E, 2.K, 2.L.(1), 2.L.(2), 0.1 TIMES 2.L.(3), 2.L.(4), MINUS THE 1,746,395SUM OF ITEMS 2.L.(5) AND 2.M)
87CRÉDIT AGRICOLE S.A. UPDATE A01 OF THE 2014 REGISTRATION DOCUMENT
1 MANAGEMENT REPORTBasel 3 Pillar 3 disclosures
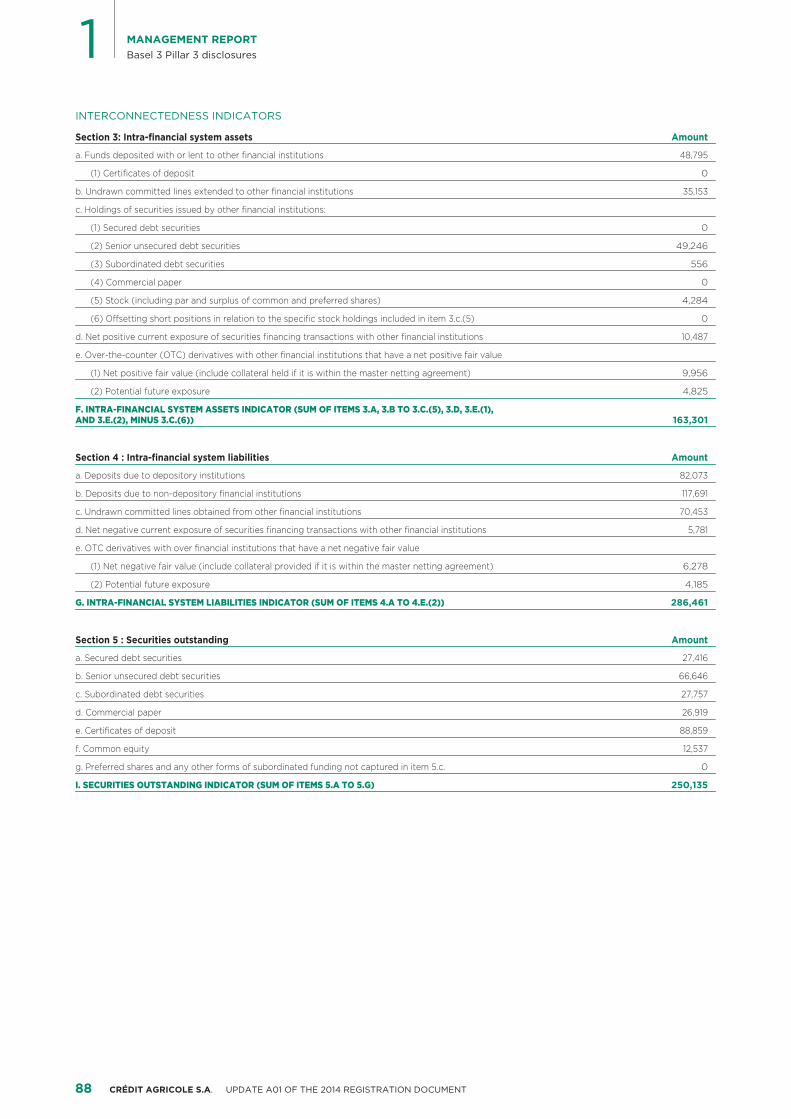
INTERCONNECTEDNESS INDICATORS
Section 3: Intra-financial system assets Amount
a. Funds deposited with or lent to other financial institutions 48,795
(1) Certificates of deposit 0
b. Undrawn committed lines extended to other financial institutions 35,153
c. Holdings of securities issued by other financial institutions:
(1) Secured debt securities 0
(2) Senior unsecured debt securities 49,246
(3) Subordinated debt securities 556
(4) Commercial paper 0
(5) Stock (including par and surplus of common and preferred shares) 4,284
(6) Offsetting short positions in relation to the specific stock holdings included in item 3.c.(5) 0
d. Net positive current exposure of securities financing transactions with other financial institutions 10,487
e. Over-the-counter (OTC) derivatives with other financial institutions that have a net positive fair value
(1) Net positive fair value (include collateral held if it is within the master netting agreement) 9,956
(2) Potential future exposure 4,825
F. INTRA-FINANCIAL SYSTEM ASSETS INDICATOR (SUM OF ITEMS 3.A, 3.B TO 3.C.(5), 3.D, 3.E.(1), 163,301AND 3.E.(2), MINUS 3.C.(6))
Section 4 : Intra-financial system liabilities Amount
a. Deposits due to depository institutions 82,073
b. Deposits due to non-depository financial institutions 117,691
c. Undrawn committed lines obtained from other financial institutions 70,453
d. Net negative current exposure of securities financing transactions with other financial institutions 5,781
e. OTC derivatives with over financial institutions that have a net negative fair value
(1) Net negative fair value (include collateral provided if it is within the master netting agreement) 6,278
(2) Potential future exposure 4,185
G. INTRA-FINANCIAL SYSTEM LIABILITIES INDICATOR (SUM OF ITEMS 4.A TO 4.E.(2)) 286,461
Section 5 : Securities outstanding Amount
a. Secured debt securities 27,416
b. Senior unsecured debt securities 66,646
c. Subordinated debt securities 27,757
d. Commercial paper 26,919
e. Certificates of deposit 88,859
f. Common equity 12,537
g. Preferred shares and any other forms of subordinated funding not captured in item 5.c. 0
I. SECURITIES OUTSTANDING INDICATOR (SUM OF ITEMS 5.A TO 5.G) 250,135
88 CRÉDIT AGRICOLE S.A. UPDATE A01 OF THE 2014 REGISTRATION DOCUMENT
MANAGEMENT REPORTBasel 3 Pillar 3 disclosures
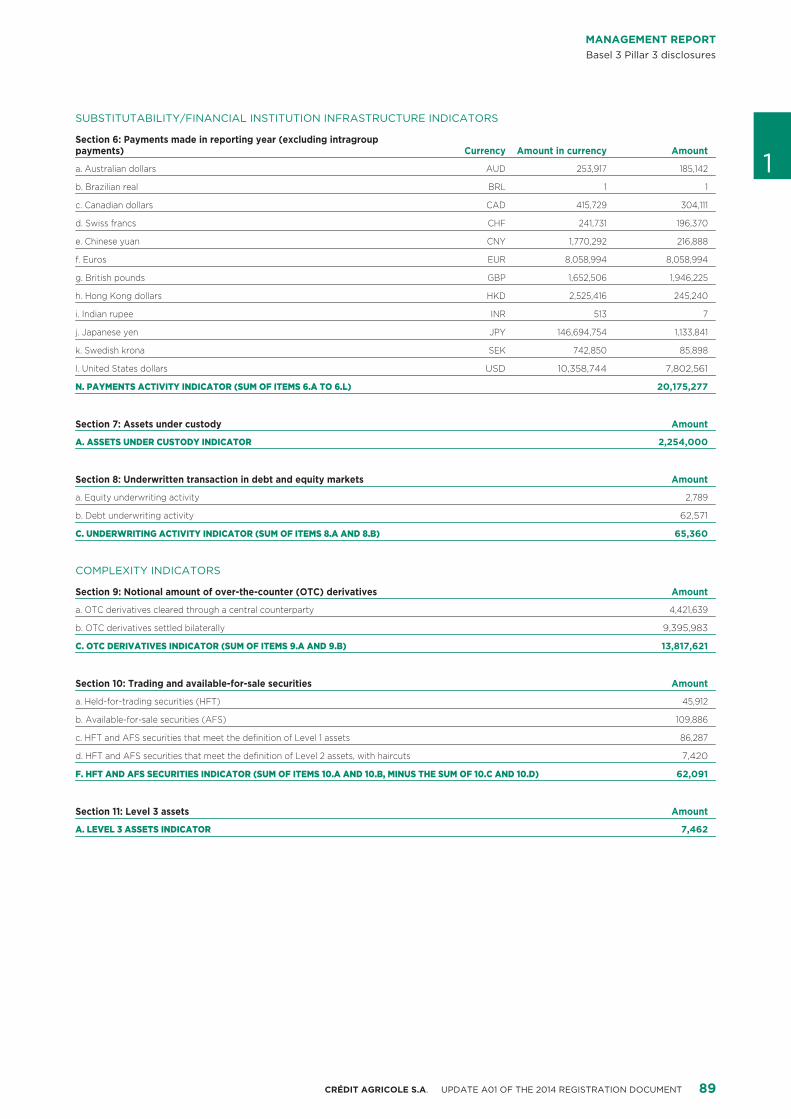
SUBSTITUTABILITY/FINANCIAL INSTITUTION INFRASTRUCTURE INDICATORS
Section 6: Payments made in reporting year (excluding intragroup Currency Amount in currency Amountpayments)
1a. Australian dollars AUD 253,917 185,142
b. Brazilian real BRL 1 1
c. Canadian dollars CAD 415,729 304,111
d. Swiss francs CHF 241,731 196,370
e. Chinese yuan CNY 1,770,292 216,888
f. Euros EUR 8,058,994 8,058,994
g. British pounds GBP 1,652,506 1,946,225
h. Hong Kong dollars HKD 2,525,416 245,240
i. Indian rupee INR 513 7
j. Japanese yen JPY 146,694,754 1,133,841
k. Swedish krona SEK 742,850 85,898
l. United States dollars USD 10,358,744 7,802,561
N. PAYMENTS ACTIVITY INDICATOR (SUM OF ITEMS 6.A TO 6.L) 20,175,277
Section 7: Assets under custody Amount
A. ASSETS UNDER CUSTODY INDICATOR 2,254,000
Section 8: Underwritten transaction in debt and equity markets Amount
a. Equity underwriting activity 2,789
b. Debt underwriting activity 62,571
C. UNDERWRITING ACTIVITY INDICATOR (SUM OF ITEMS 8.A AND 8.B) 65,360
COMPLEXITY INDICATORS
Section 9: Notional amount of over-the-counter (OTC) derivatives Amount
a. OTC derivatives cleared through a central counterparty 4,421,639
b. OTC derivatives settled bilaterally 9,395,983
C. OTC DERIVATIVES INDICATOR (SUM OF ITEMS 9.A AND 9.B) 13,817,621
Section 10: Trading and available-for-sale securities Amount
a. Held-for-trading securities (HFT) 45,912
b. Available-for-sale securities (AFS) 109,886
c. HFT and AFS securities that meet the definition of Level 1 assets 86,287
d. HFT and AFS securities that meet the definition of Level 2 assets, with haircuts 7,420
F. HFT AND AFS SECURITIES INDICATOR (SUM OF ITEMS 10.A AND 10.B, MINUS THE SUM OF 10.C AND 10.D) 62,091
Section 11: Level 3 assets Amount
A. LEVEL 3 ASSETS INDICATOR 7,462
89CRÉDIT AGRICOLE S.A. UPDATE A01 OF THE 2014 REGISTRATION DOCUMENT
1 MANAGEMENT REPORTBasel 3 Pillar 3 disclosures
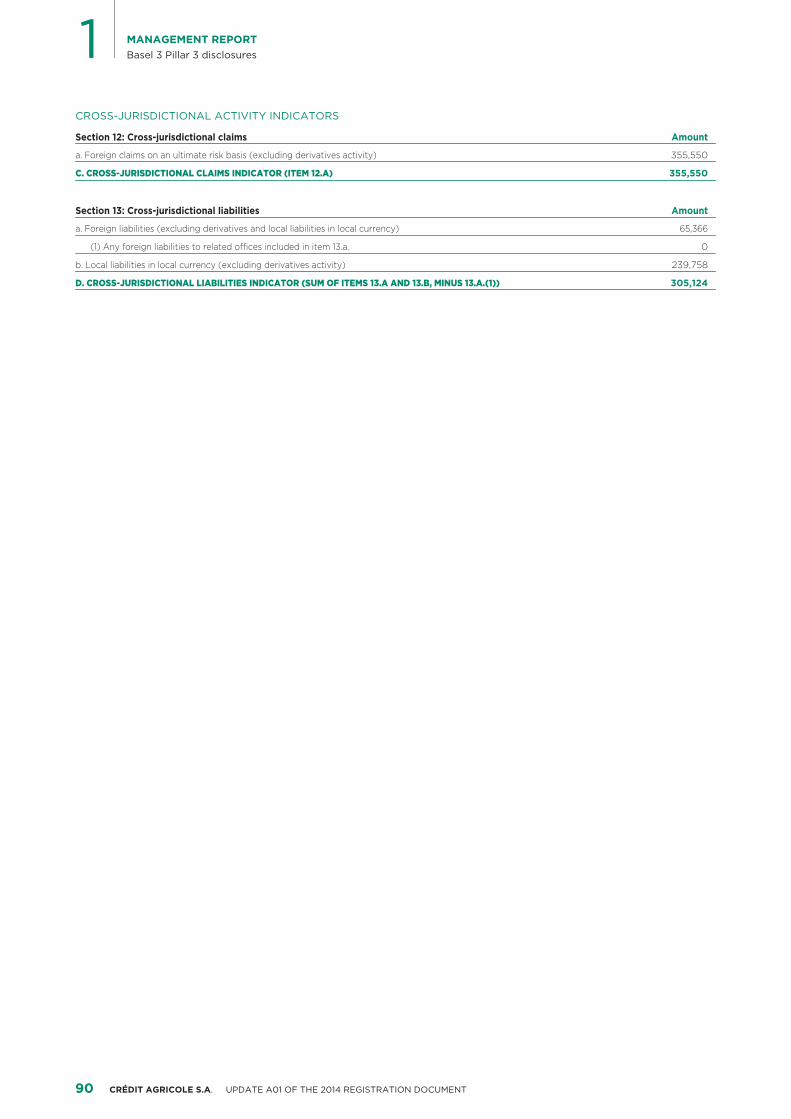
CROSS-JURISDICTIONAL ACTIVITY INDICATORS
Section 12: Cross-jurisdictional claims Amount
a. Foreign claims on an ultimate risk basis (excluding derivatives activity) 355,550
C. CROSS-JURISDICTIONAL CLAIMS INDICATOR (ITEM 12.A) 355,550
Section 13: Cross-jurisdictional liabilities Amount
a. Foreign liabilities (excluding derivatives and local liabilities in local currency) 65,366
(1) Any foreign liabilities to related offices included in item 13.a. 0
b. Local liabilities in local currency (excluding derivatives activity) 239,758
D. CROSS-JURISDICTIONAL LIABILITIES INDICATOR (SUM OF ITEMS 13.A AND 13.B, MINUS 13.A.(1)) 305,124
90 CRÉDIT AGRICOLE S.A. UPDATE A01 OF THE 2014 REGISTRATION DOCUMENT
MANAGEMENT REPORTBasel 3 Pillar 3 disclosures
INDICATORS AND REGULATORY RATIOS
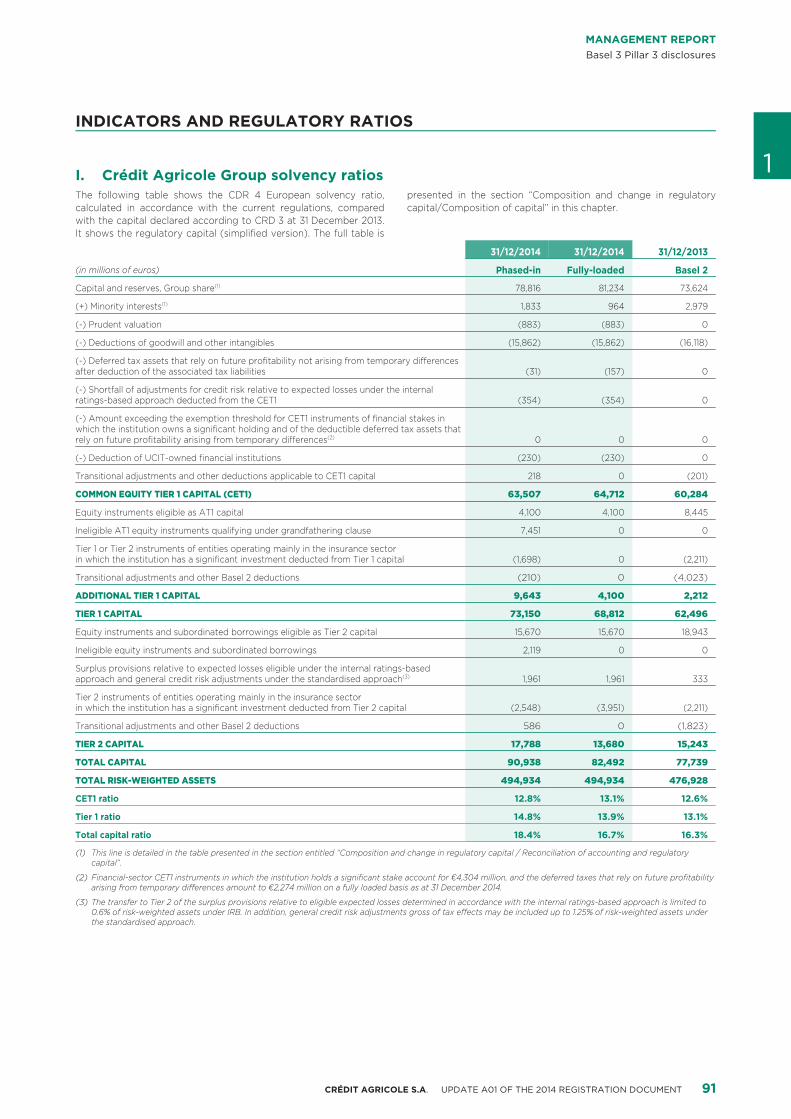
1Crédit Agricole Group solvency ratiosI.The following table shows the CDR 4 European solvency ratio, presented in the section “Composition and change in regulatorycalculated in accordance with the current regulations, compared capital/Composition of capital” in this chapter.with the capital declared according to CRD 3 at 31 December 2013.It shows the regulatory capital (simplified version). The full table is
31/12/2014 31/12/2014 31/12/2013
Phased-in Fully-loaded Basel 2(in millions of euros)
Capital and reserves, Group share(1) 78,816 81,234 73,624
(+) Minority interests(1) 1,833 964 2,979
(-) Prudent valuation (883) (883) 0
(-) Deductions of goodwill and other intangibles (15,862) (15,862) (16,118)
(-) Deferred tax assets that rely on future profitability not arising from temporary differences (31) (157) 0after deduction of the associated tax liabilities
(-) Shortfall of adjustments for credit risk relative to expected losses under the internal (354) (354) 0ratings-based approach deducted from the CET1
(-) Amount exceeding the exemption threshold for CET1 instruments of financial stakes in which the institution owns a significant holding and of the deductible deferred tax assets that
0 0 0rely on future profitability arising from temporary differences(2)
(-) Deduction of UCIT-owned financial institutions (230) (230) 0
Transitional adjustments and other deductions applicable to CET1 capital 218 0 (201)
COMMON EQUITY TIER 1 CAPITAL (CET1) 63,507 64,712 60,284
Equity instruments eligible as AT1 capital 4,100 4,100 8,445
Ineligible AT1 equity instruments qualifying under grandfathering clause 7,451 0 0
Tier 1 or Tier 2 instruments of entities operating mainly in the insurance sector (1,698) 0 (2,211)in which the institution has a significant investment deducted from Tier 1 capital
Transitional adjustments and other Basel 2 deductions (210) 0 (4,023)
ADDITIONAL TIER 1 CAPITAL 9,643 4,100 2,212
TIER 1 CAPITAL 73,150 68,812 62,496
Equity instruments and subordinated borrowings eligible as Tier 2 capital 15,670 15,670 18,943
Ineligible equity instruments and subordinated borrowings 2,119 0 0
Surplus provisions relative to expected losses eligible under the internal ratings-based 1,961 1,961 333approach and general credit risk adjustments under the standardised approach(3)
Tier 2 instruments of entities operating mainly in the insurance sector (2,548) (3,951) (2,211)in which the institution has a significant investment deducted from Tier 2 capital
Transitional adjustments and other Basel 2 deductions 586 0 (1,823)
TIER 2 CAPITAL 17,788 13,680 15,243
TOTAL CAPITAL 90,938 82,492 77,739
TOTAL RISK-WEIGHTED ASSETS 494,934 494,934 476,928
CET1 ratio 12.8% 13.1% 12.6%
Tier 1 ratio 14.8% 13.9% 13.1%
Total capital ratio 18.4% 16.7% 16.3%
This line is detailed in the table presented in the section entitled “Composition and change in regulatory capital / Reconciliation of accounting and regulatory (1)capital”.
Financial-sector CET1 instruments in which the institution holds a significant stake account for €4,304 million, and the deferred taxes that rely on future profitability (2)arising from temporary differences amount to €2,274 million on a fully loaded basis as at 31 December 2014.
The transfer to Tier 2 of the surplus provisions relative to eligible expected losses determined in accordance with the internal ratings-based approach is limited to (3)0.6% of risk-weighted assets under IRB. In addition, general credit risk adjustments gross of tax effects may be included up to 1.25% of risk-weighted assets under the standardised approach.
91CRÉDIT AGRICOLE S.A. UPDATE A01 OF THE 2014 REGISTRATION DOCUMENT
1 MANAGEMENT REPORTBasel 3 Pillar 3 disclosures
The fully loaded Common Equity Tier 1 (CET1) capital stood at deferred tax assets that rely on future profitability arising from■€64.7 billion at 31 December 2014, up €4.4 billion compared with temporary differences amounted to €2.3 billion at 31 Decemberyear-end 2013. The phased-in CET1 capital is €1.2 billion below the 2014. Under Basel 3, they are subject to the calculation of anfully loaded CET1 capital. exemption threshold, but they did not exceed this amount at
31 December 2014. Accordingly, they are treated as riskMajor events with an impact on CET1 capital in 2014 include theweighted assets and weighted at 250%;payment of the 2013 scrip dividend for the share outside of the
Group, which impacts issued capital and reserves (+€0.3 billion), Fully loaded Tier 1 capital, at €68.8 billion euros, came in €6.3 billionthe loss of control of Crelan S.A. which caused minority interests to above its 31 December 2013 level, while the phased-in Tier 1 capitaldecrease by €0.7 billion and the acquisition of 5% of Amundi’s was €10.7 billion above its 31 December 2013 level. This includes theminority interests, which decreases the minority interests by CET1 capital described above and the Additional Tier 1 capital,€0.2 billion. The adjustment of the BES equity-accounted value, which underwent the following changes:which went down to zero at 30 June 2014, had a limited effect on the hybrid securities included in Tier 1 capital eligible under■CET1 at -10 basis points, the lower exemption threshold weighting Basel 3 amounted to €4.1 billion following the issues completedrelated to this financial stake partially offsetting its negative impact during 2014;on profit:
the entire stock prior to 1 January 2014 was ineligible on a fully■capital and reserves, Group share used to calculate the fully■ loaded basis. On a phased-in basis, the grandfathering provisionloaded ratio rose by €7.6 billion compared with the 2013 makes it possible to include, above the Basel 3-eligibleyear-end, in particular with a retained net profit amounting to instruments, an amount of debt equivalent to a maximum of€4.4 billion for the financial year, payment of the scrip dividend 80% of the base at 31 December 2012, i.e. €7.5 billion, taking intoon 2013 results for the share outside the Group, the issue of account the calls of instruments ineligible under Basel 3 ormutual shares net of repayments for a total of €0.5 billion, and falling outside the scope, for a total of €1.5 billion in 2014;the significant increase in unrealised gains and losses, as the
on a phased-in basis, subordinated loans and receivables from■elimination of some of the prudential filters resulted in capturingcredit institutions and insurance companies, all representative ofgains. Phased-in capital and reserves, Group share wereTier 2 instruments, were deducted for their share of the€2.4 billion less than the fully loaded capital and reserves due todeduction from Tier 1 in the amount of €1.7 billion. Under Basel 2,filtering of unrealised gains on the banking scope;the deduction was €2.2 billion.
fully loaded minority interests amounted to €1.0 billion, lower■At €13.7 billion, fully loaded Tier 2 capital was €1.6 billion lower thanthan the phased-in amount which benefits from theat 31 December 2013. Phased-in Tier 2 capital was €2.5 billionreintegration of 80% of the derecognised minority interests, i.e.higher than at 31 December 2013:€0.9 billion;
the hybrid securities included in Tier 2 capital eligible for Basel 3■the deduction for Prudent valuation was €0.9 billion, deducted■amounted to €15.7 billion following the €0.6 billion datedfrom CET1;subordinated debt issue completed in 2014. They include both
the deductions from capital for goodwill and other intangibles■ dated subordinated debt (TSR), undated subordinated debtamounted to €15.9 billion on both a fully loaded and phased-in (TSDI) and a participating note. On a phased-in basis, thebasis, a reduction of €0.3 billion, primarily due to the effective grandfathering provision also makes it possible to include andisposal of Crédit Agricole Consumer Finance Nordic entities; amount of ineligible debt equivalent to a maximum of 80% ofdeferred tax assets that rely on future profitability arising from■ the ineligible base at 31 December 2012. At 31 December 2014,tax loss carryforwards are an element that is now eliminated this amount consisted of the actual amount of Tier 2 debt,from capital. On a fully loaded basis, they amounted to €2.1 billion;€0.2 billion and 20% of this amount is deducted in the phased-in as under Basel 2.5, this capital tier also includes surplus■figure; provisions relative to expected losses eligible under the internalthe provision shortfall relative to the expected loss on IRB■ ratings-based approach and, now, general credit riskexposures amounted to €0.4 billion at 31 December 2014 on adjustments under the standardised approach. This item cameboth a phased-in and fully loaded basis. Under Basel 3, this to €2.0 billion at 31 December 2014. It was €0.3 billion atamount is now deducted from the CET1; 31 December 2013 for the internal ratings-based approach;
CET1 instruments of significant financial stakes (over 10%) are■ subordinated loans and receivables from credit institutions and■lower than under Basel 2 because the latter no longer include insurance companies, all representative of Tier 2 instruments,the largest part of CET1 investments in the insurance sector or were deducted for their share of the deduction from Tier 2 inthe subordinated insurance claims, which are Tier 2 instruments the amount of €4.0 billion on a fully loaded basis and €2.5 billion(at 31 December 2013, they were 50% deducted from Tier 1 and on a phased-in basis.50% deducted from Tier 2 capital). The CET1 instruments In all, fully loaded total capital at 31 December 2014 stood atamounted to €4.3 billion. They are subject to the calculation of €82.5 billion, a rise of €4.8 billion from the total at 31 Decemberan exemption threshold, without exceeding the latter. 2013. Phased-in total capital was €90.9 billion.
92 CRÉDIT AGRICOLE S.A. UPDATE A01 OF THE 2014 REGISTRATION DOCUMENT
MANAGEMENT REPORTBasel 3 Pillar 3 disclosures
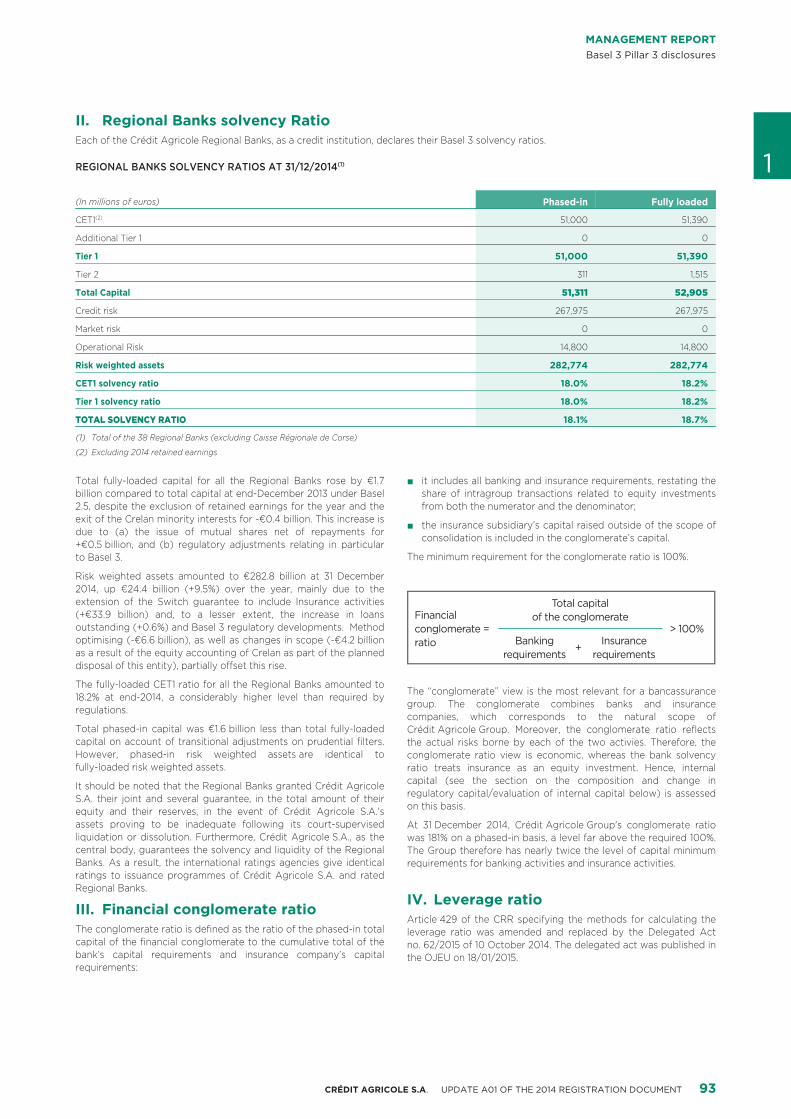
Regional Banks solvency RatioII.Each of the Crédit Agricole Regional Banks, as a credit institution, declares their Basel 3 solvency ratios.
1REGIONAL BANKS SOLVENCY RATIOS AT 31/12/2014(1)
Phased-in Fully loaded(In millions of euros)
CET1(2) 51,000 51,390
Additional Tier 1 0 0
Tier 1 51,000 51,390
Tier 2 311 1,515
Total Capital 51,311 52,905
Credit risk 267,975 267,975
Market risk 0 0
Operational Risk 14,800 14,800
Risk weighted assets 282,774 282,774
CET1 solvency ratio 18.0% 18.2%
Tier 1 solvency ratio 18.0% 18.2%
TOTAL SOLVENCY RATIO 18.1% 18.7%
Total of the 38 Regional Banks (excluding Caisse Régionale de Corse)(1)
Excluding 2014 retained earnings(2)
Total fully-loaded capital for all the Regional Banks rose by €1.7 it includes all banking and insurance requirements, restating the■billion compared to total capital at end-December 2013 under Basel share of intragroup transactions related to equity investments2.5, despite the exclusion of retained earnings for the year and the from both the numerator and the denominator;exit of the Crelan minority interests for -€0.4 billion. This increase is the insurance subsidiary’s capital raised outside of the scope of■due to (a) the issue of mutual shares net of repayments for consolidation is included in the conglomerate’s capital.+€0.5 billion, and (b) regulatory adjustments relating in particular
The minimum requirement for the conglomerate ratio is 100%.to Basel 3.
Risk weighted assets amounted to €282.8 billion at 31 December2014, up €24.4 billion (+9.5%) over the year, mainly due to the
Financial conglomerate ratio
=
Total capital of the conglomerate
Banking requirements
+Insurance
requirements
extension of the Switch guarantee to include Insurance activities(+€33.9 billion) and, to a lesser extent, the increase in loansoutstanding (+0.6%) and Basel 3 regulatory developments. Methodoptimising (-€6.6 billion), as well as changes in scope (-€4.2 billionas a result of the equity accounting of Crelan as part of the planneddisposal of this entity), partially offset this rise.
The fully-loaded CET1 ratio for all the Regional Banks amounted toThe “conglomerate” view is the most relevant for a bancassurance18.2% at end-2014, a considerably higher level than required bygroup. The conglomerate combines banks and insuranceregulations.companies, which corresponds to the natural scope of
Total phased-in capital was €1.6 billion less than total fully-loaded Crédit Agricole Group. Moreover, the conglomerate ratio reflectscapital on account of transitional adjustments on prudential filters. the actual risks borne by each of the two activies. Therefore, theHowever, phased-in risk weighted assets are identical to conglomerate ratio view is economic, whereas the bank solvencyfully-loaded risk weighted assets. ratio treats insurance as an equity investment. Hence, internal
capital (see the section on the composition and change inIt should be noted that the Regional Banks granted Crédit Agricoleregulatory capital/evaluation of internal capital below) is assessedS.A. their joint and several guarantee, in the total amount of theiron this basis.equity and their reserves, in the event of Crédit Agricole S.A.'s
assets proving to be inadequate following its court-supervised At 31 December 2014, Crédit Agricole Group's conglomerate ratioliquidation or dissolution. Furthermore, Crédit Agricole S.A., as the was 181% on a phased-in basis, a level far above the required 100%.central body, guarantees the solvency and liquidity of the Regional The Group therefore has nearly twice the level of capital minimumBanks. As a result, the international ratings agencies give identical requirements for banking activities and insurance activities.ratings to issuance programmes of Crédit Agricole S.A. and rated
Leverage ratioIV.Regional Banks.
Financial conglomerate ratioIII.Article 429 of the CRR specifying the methods for calculating the
The conglomerate ratio is defined as the ratio of the phased-in total leverage ratio was amended and replaced by the Delegated Actcapital of the financial conglomerate to the cumulative total of the no. 62/2015 of 10 October 2014. The delegated act was published inbank’s capital requirements and insurance company’s capital the OJEU on 18/01/2015.requirements:
93CRÉDIT AGRICOLE S.A. UPDATE A01 OF THE 2014 REGISTRATION DOCUMENT
1 MANAGEMENT REPORTBasel 3 Pillar 3 disclosures
Publication of the ratio at least once a year is mandatory as of recent consultation, the FSB has proposed the calculation of a ratio01/01/2015. Institutions can choose to publish a fully loaded ratio, a aimed at estimating the adequacy of the loss absorbing andphased-in ratio or both ratios. recapitalisation capacities of Global Systemically Important Banks
(G-SIBs). Once finalised, this new “Total loss absorbing capacity”If the institution decides to change its publication choice, at theratio will provide resolution authorities with the means to assesstime of first publication it must reconcile the data for all of thewhether G-SIBs have sufficient loss absorbing capacity before andratios previously published with the data for the new ratios selectedduring resolution. As a result, the resolution authorities will be ablefor publication.to implement an ordered resolution strategy that minimises impacts
An observation period has been introduced for the leverage ratio on financial stability, ensures the continuity of the G-SIBs’ criticalrunning from 01/01/2014 to 01/01/2017 to monitor the components economic functions and limits the use of taxpayers’ money.and the behaviour of the ratio relative to the requirements based
According to the FSB’s current proposals, the minimum level of theon risk. The European Commission must then report to theTLAC ratio would correspond to twice the minimum regulatoryEuropean Parliament and Council and put forward a regulatoryrequirement (i.e. the maximum between twice the leverage ratioproposal covering the methods for applying and calculating theand 16% to 20% of the risk weighted assets plus the applicableratio. The indicative benchmark set by the Basel Committee for theregulatory buffers). This minimum level could be increased by theleverage ratio is 3%.resolution authorities.
At present, a Pillar 1 requirement is maintained for 01/01/2018.This ratio will apply solely to Global Systemically Important
The leverage ratio is defined as the Tier 1 capital divided by the Institutions, and thus to Crédit Agricole Group, starting in 2019.exposure measure, i.e. balance sheet and off-balance-sheet assets Crédit Agricole S.A. will not be subject to this ratio, as it is notafter certain restatements of derivatives, intragroup transactions, classified as a G-SIB by the FSB.securities financing transactions, items deducted from the
The elements that could absorb losses are made up of equity,numerator, and off-balance-sheet items.subordinated notes and debts to which the resolution authority can
At end-2014, Crédit Agricole Group’s leverage ratio stood at 5.2% apply the bail-in.on a phased-in Tier 1 basis.
As we understand the FSB’s current proposals, Crédit Agricole
MREL/TLAC ratioV.Group would have to comply with a TLAC ratio of more than 19.5%(including a capital conservation buffer of 2.5% and a G-SIB bufferof 1%). Crédit Agricole Group aims to comply with these
MREL ratioTLAC requirements by 2019, excluding senior debt, subject tochanges in methods of calculating risk weighted assets. As at31 December 2014, the TLAC to risk weighted assets ratio is
The MREL (or Minimum Requirement for Own Funds and Eligibleestimated at 18.7% for Crédit Agricole Group, excluding eligible
Liabilities) ratio, is defined in the European “Bank Recovery andsenior debt.
Resolution Directive” (BRRD) published on 12 June 2014 and
Asset encumbranceVI.effective starting 1 January 2015 (except for provisions on bail-inand MREL, which will take effect no later than 1 January 2016).
More generally, the BRRD establishes a framework for the Crédit Agricole S.A. monitors and manages the assets pledged inresolution of banks throughout the European Union and with the Crédit Agricole Group.aim of equipping resolution authorities with shared instruments and
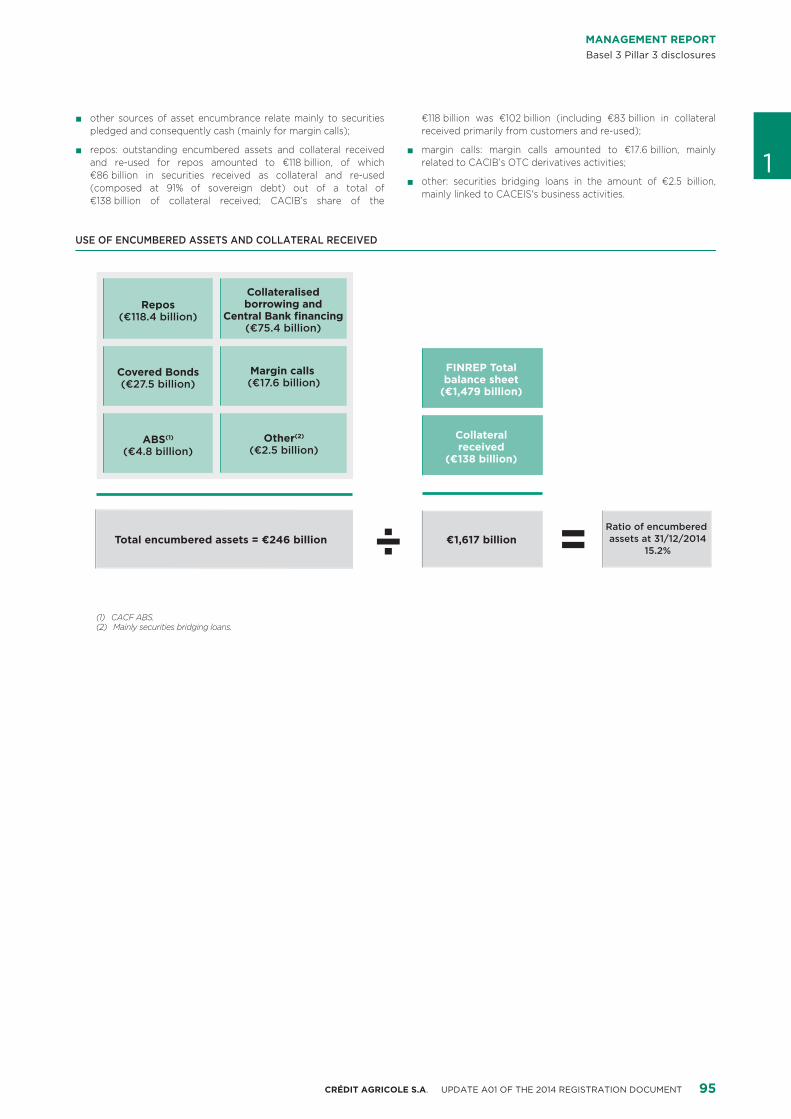
The total asset encumbrance ratio stands at 15.2% at 31 Decemberpowers to pre-emptively tackle banking crises, preserve financial2014:stability and reduce taxpayers’ exposure to losses.
on loans and receivables due from private customers, assets are■The MREL ratio corresponds to the minimum requirement of ownpledged to obtain refinancing under advantageous conditions orfunds and eligible liabilities in order to absorb losses in the event ofto constitute reserves that can easily be made liquid if needed.resolution. This minimum requirement is calculated as being theThe policy of Crédit Agricole S.A. aims to both diversify theamount of own funds and eligible liabilities expressed as ainstruments used to improve resistance to liquidity stress, whichpercentage of the institution’s total liabilities and capital. In thiscould affect individual markets differently, and to limit the sharecalculation, total liabilities takes into account the full recognition ofof assets pledged in order to retain good quality assets that cannetting rights applicable to derivatives. Regulatory own funds,be easily liquidated in the market through existing mechanismssubordinated notes with a residual maturity of more than one yearin case of stress:(including prudentially ineligible own fund instruments and the
amortised portion of Tier 2) and certain senior debts with residual covered bonds: assets and collateral received from the■maturities of more than one year qualify for inclusion in MREL. Regional Banks are pledged through three issue mechanisms:
Crédit Agricole Home Loan SFH, Crédit Agricole PublicThe MREL ratio calibrates an eligible liabilities requirement but doesSector SCF and Cariparma (€24 billion invested andnot specify which debt would be called upon to absorb losses inoutstanding for €27.5 billion in encumbered assets andthe event of resolution.re-used collateral received),
Crédit Agricole Group is targeting MREL of 8% excluding seniorcollateralised borrowings: encumbered assets and collateral■debt, which would enable recourse to European resolution fundreceived stem mainly from the financing activities with thebefore applying the bail-in to senior debt, creating an additionalCaisse de refinancement de l’habitat (CRH) and with Frenchlayer of protection for senior investors. The achievement of thisor supranational organisations, funds drawn from the ECBtarget is based on organic growth of own funds andunder T-LTROs and Crédit Agricole CIB’s ESTERcomplementary issuance of Tier 2, partially substituting for seniorsecuritisation conduit (€49.6 billion of refinancing forunsecured debt issues. Crédit Agricole Group, like€69.3 billion in encumbered assets and re-used collateralCrédit Agricole S.A., will be subject to MREL target defined by thereceived),supervisor, which could be different from the Group’s target of 8%.
securitisations: assets are pledged for securitisation■
TLAC ratio transactions by CA Consumer Finance and placed in themarket (€4.8 billion);
This ratio, which is still being defined, was established by theFinancial Stability Board (FSB) at the request of the G20. In its
94 CRÉDIT AGRICOLE S.A. UPDATE A01 OF THE 2014 REGISTRATION DOCUMENT
MANAGEMENT REPORTBasel 3 Pillar 3 disclosures
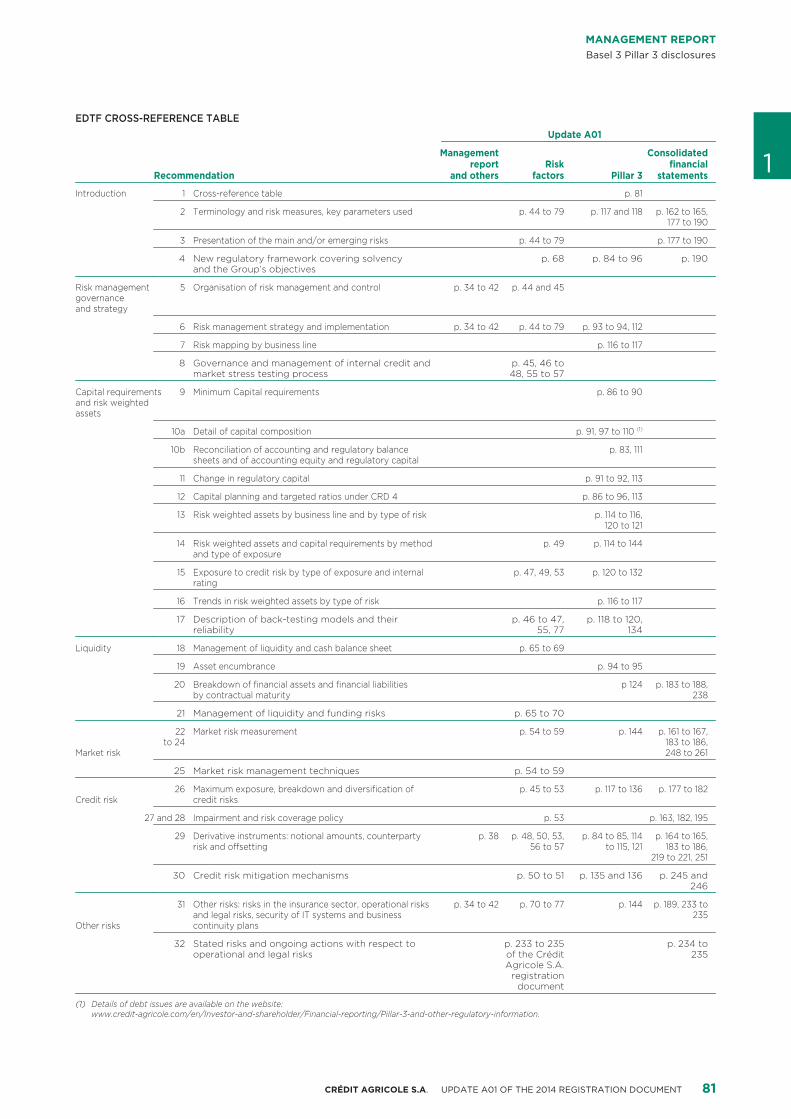
other sources of asset encumbrance relate mainly to securities■ €118 billion was €102 billion (including €83 billion in collateralpledged and consequently cash (mainly for margin calls); received primarily from customers and re-used);
repos: outstanding encumbered assets and collateral received■ margin calls: margin calls amounted to €17.6 billion, mainly■
1and re-used for repos amounted to €118 billion, of which related to CACIB’s OTC derivatives activities;€86 billion in securities received as collateral and re-used other: securities bridging loans in the amount of €2.5 billion,■(composed at 91% of sovereign debt) out of a total of mainly linked to CACEIS's business activities.€138 billion of collateral received; CACIB’s share of the
USE OF ENCUMBERED ASSETS AND COLLATERAL RECEIVED
€1,617 billionTotal encumbered assets = €246 billion
FINREP Totalbalance sheet
(€1,479 billion)
Collateralreceived
(€138 billion)
÷ =(1) CACF ABS. (2) Mainly securities bridging loans.
Repos(€118.4 billion)
Collateralisedborrowing and
Central Bank financing(€75.4 billion)
Covered Bonds(€27.5 billion)
Margin calls (€17.6 billion)
ABS(1)
(€4.8 billion)Other(2)
(€2.5 billion)
Ratio of encumbered assets at 31/12/2014
15.2%
95CRÉDIT AGRICOLE S.A. UPDATE A01 OF THE 2014 REGISTRATION DOCUMENT
1 MANAGEMENT REPORTBasel 3 Pillar 3 disclosures
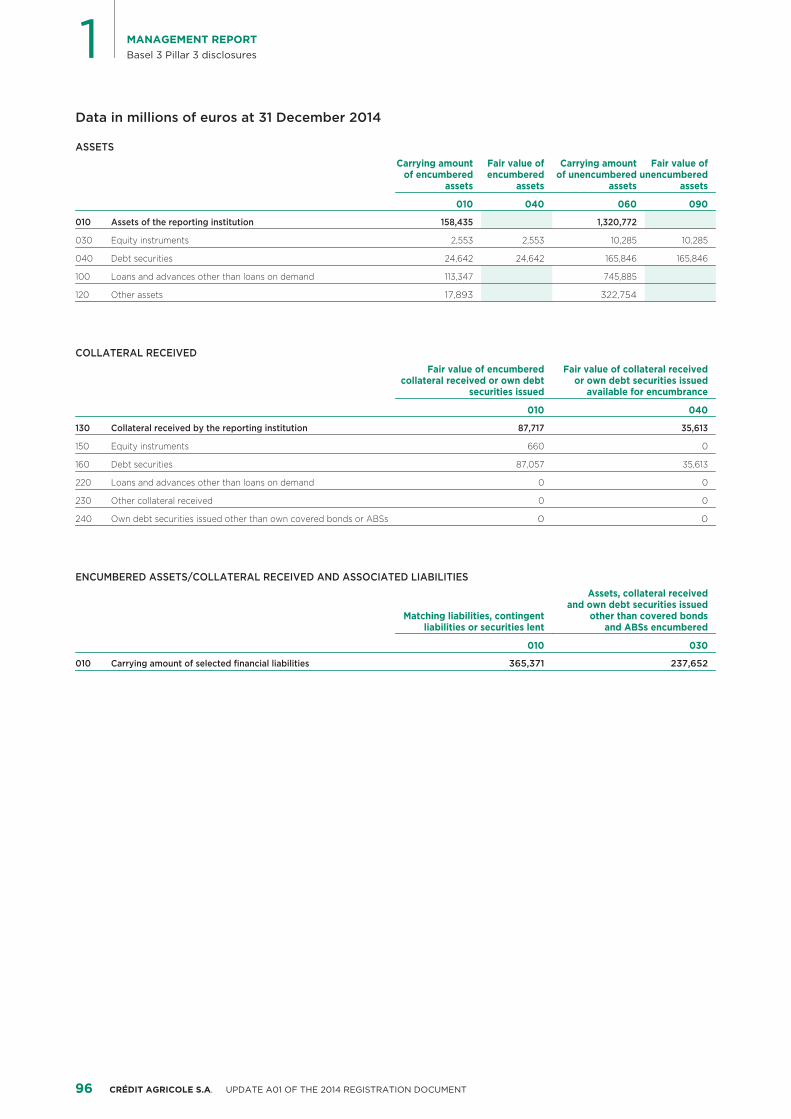
Data in millions of euros at 31 December 2014
ASSETSCarrying amount Fair value of Carrying amount Fair value of
of encumbered encumbered of unencumbered unencumberedassets assets assets assets
010 040 060 090
010 Assets of the reporting institution 158,435 1,320,772
030 Equity instruments 2,553 2,553 10,285 10,285
040 Debt securities 24,642 24,642 165,846 165,846
100 Loans and advances other than loans on demand 113,347 745,885
120 Other assets 17,893 322,754
COLLATERAL RECEIVEDFair value of encumbered Fair value of collateral received
collateral received or own debt or own debt securities issuedsecurities issued available for encumbrance
010 040
130 Collateral received by the reporting institution 87,717 35,613
150 Equity instruments 660 0
160 Debt securities 87,057 35,613
220 Loans and advances other than loans on demand 0 0
230 Other collateral received 0 0
240 Own debt securities issued other than own covered bonds or ABSs 0 0
ENCUMBERED ASSETS/COLLATERAL RECEIVED AND ASSOCIATED LIABILITIESAssets, collateral received
and own debt securities issuedMatching liabilities, contingent other than covered bonds
liabilities or securities lent and ABSs encumbered
010 030
010 Carrying amount of selected financial liabilities 365,371 237,652
96 CRÉDIT AGRICOLE S.A. UPDATE A01 OF THE 2014 REGISTRATION DOCUMENT
MANAGEMENT REPORTBasel 3 Pillar 3 disclosures
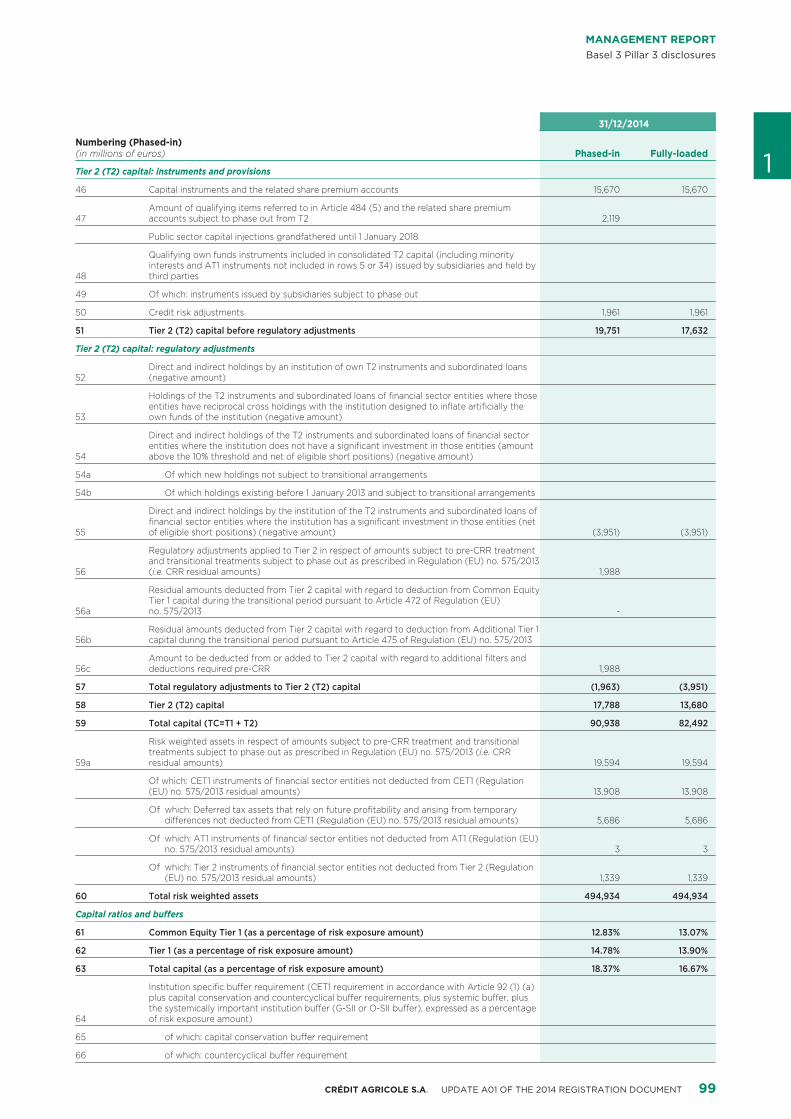
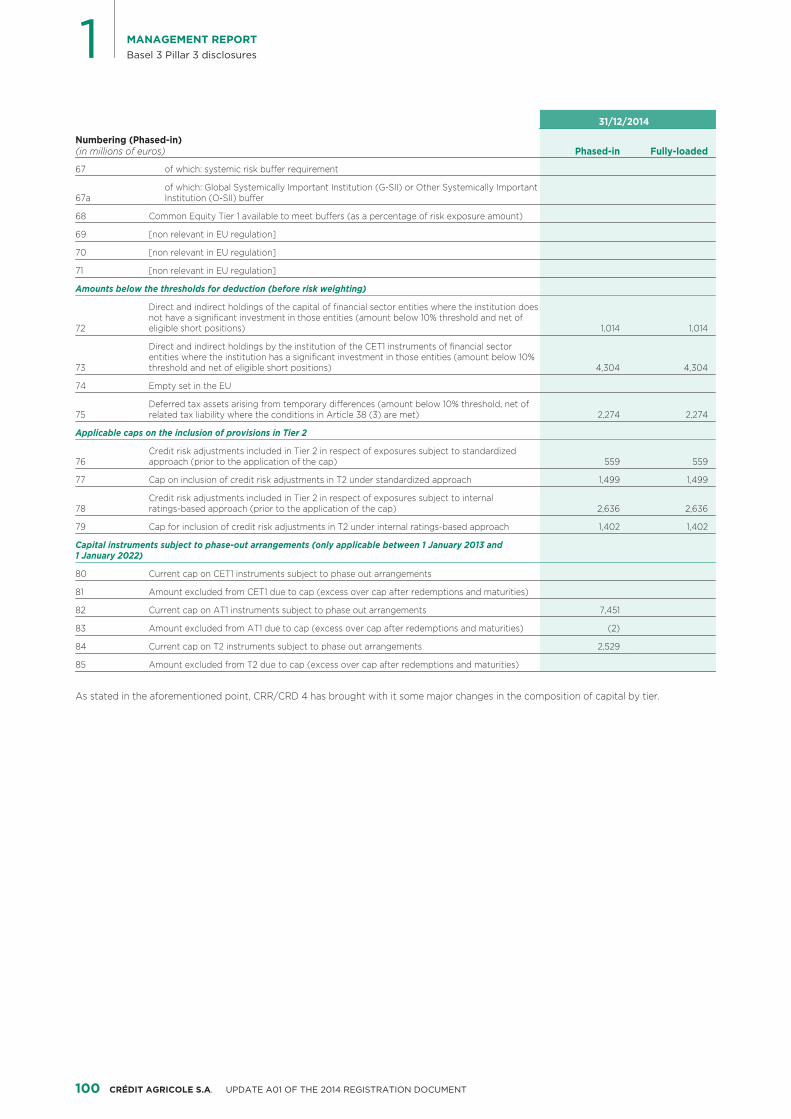
COMPOSITION AND CHANGE IN REGULATORY CAPITAL
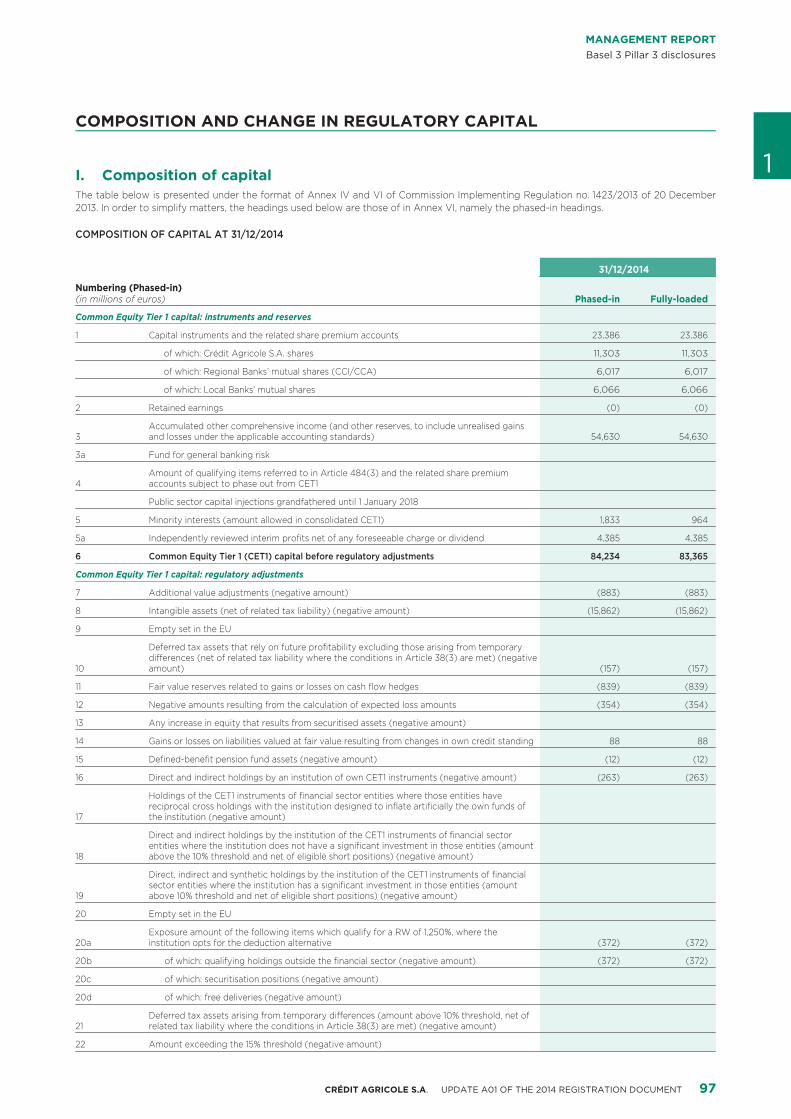
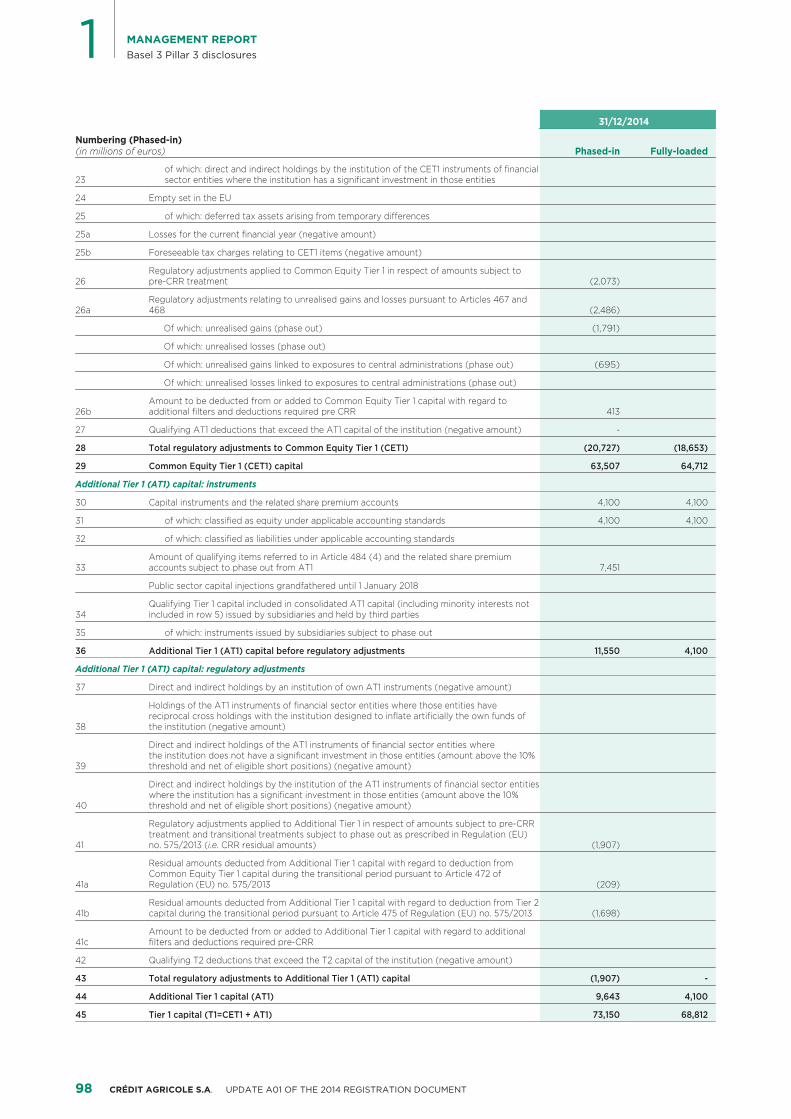
1Composition of capitalI.The table below is presented under the format of Annex IV and VI of Commission Implementing Regulation no. 1423/2013 of 20 December2013. In order to simplify matters, the headings used below are those of in Annex VI, namely the phased-in headings.
COMPOSITION OF CAPITAL AT 31/12/2014
31/12/2014
Numbering (Phased-in) Phased-in Fully-loaded(in millions of euros)
Common Equity Tier 1 capital: instruments and reserves
1 Capital instruments and the related share premium accounts 23,386 23,386
of which: Crédit Agricole S.A. shares 11,303 11,303
of which: Regional Banks’ mutual shares (CCI/CCA) 6,017 6,017
of which: Local Banks’ mutual shares 6,066 6,066
2 Retained earnings (0) (0)
Accumulated other comprehensive income (and other reserves, to include unrealised gains 3 54,630 54,630and losses under the applicable accounting standards)
3a Fund for general banking risk
Amount of qualifying items referred to in Article 484(3) and the related share premium 4 accounts subject to phase out from CET1
Public sector capital injections grandfathered until 1 January 2018
5 Minority interests (amount allowed in consolidated CET1) 1,833 964
5a Independently reviewed interim profits net of any foreseeable charge or dividend 4,385 4,385
6 Common Equity Tier 1 (CET1) capital before regulatory adjustments 84,234 83,365
Common Equity Tier 1 capital: regulatory adjustments
7 Additional value adjustments (negative amount) (883) (883)
8 Intangible assets (net of related tax liability) (negative amount) (15,862) (15,862)
9 Empty set in the EU
Deferred tax assets that rely on future profitability excluding those arising from temporary differences (net of related tax liability where the conditions in Article 38(3) are met) (negative
10 (157) (157)amount)
11 Fair value reserves related to gains or losses on cash flow hedges (839) (839)
12 Negative amounts resulting from the calculation of expected loss amounts (354) (354)
13 Any increase in equity that results from securitised assets (negative amount)
14 Gains or losses on liabilities valued at fair value resulting from changes in own credit standing 88 88
15 Defined-benefit pension fund assets (negative amount) (12) (12)
16 Direct and indirect holdings by an institution of own CET1 instruments (negative amount) (263) (263)
Holdings of the CET1 instruments of financial sector entities where those entities have reciprocal cross holdings with the institution designed to inflate artificially the own funds of
17 the institution (negative amount)
Direct and indirect holdings by the institution of the CET1 instruments of financial sector entities where the institution does not have a significant investment in those entities (amount
18 above the 10% threshold and net of eligible short positions) (negative amount)
Direct, indirect and synthetic holdings by the institution of the CET1 instruments of financial sector entities where the institution has a significant investment in those entities (amount
19 above 10% threshold and net of eligible short positions) (negative amount)
20 Empty set in the EU
Exposure amount of the following items which qualify for a RW of 1,250%, where the 20a (372) (372)institution opts for the deduction alternative
20b of which: qualifying holdings outside the financial sector (negative amount) (372) (372)
20c of which: securitisation positions (negative amount)
20d of which: free deliveries (negative amount)
Deferred tax assets arising from temporary differences (amount above 10% threshold, net of 21 related tax liability where the conditions in Article 38(3) are met) (negative amount)
22 Amount exceeding the 15% threshold (negative amount)
97CRÉDIT AGRICOLE S.A. UPDATE A01 OF THE 2014 REGISTRATION DOCUMENT
1 MANAGEMENT REPORTBasel 3 Pillar 3 disclosures
31/12/2014
Numbering (Phased-in) Phased-in Fully-loaded(in millions of euros)
of which: direct and indirect holdings by the institution of the CET1 instruments of financial 23 sector entities where the institution has a significant investment in those entities
24 Empty set in the EU
25 of which: deferred tax assets arising from temporary differences
25a Losses for the current financial year (negative amount)
25b Foreseeable tax charges relating to CET1 items (negative amount)
Regulatory adjustments applied to Common Equity Tier 1 in respect of amounts subject to 26 (2,073)pre-CRR treatment
Regulatory adjustments relating to unrealised gains and losses pursuant to Articles 467 and 26a (2,486)468
Of which: unrealised gains (phase out) (1,791)
Of which: unrealised losses (phase out)
Of which: unrealised gains linked to exposures to central administrations (phase out) (695)
Of which: unrealised losses linked to exposures to central administrations (phase out)
Amount to be deducted from or added to Common Equity Tier 1 capital with regard to 26b 413additional filters and deductions required pre CRR
27 Qualifying AT1 deductions that exceed the AT1 capital of the institution (negative amount) -
28 Total regulatory adjustments to Common Equity Tier 1 (CET1) (20,727) (18,653)
29 Common Equity Tier 1 (CET1) capital 63,507 64,712
Additional Tier 1 (AT1) capital: instruments
30 Capital instruments and the related share premium accounts 4,100 4,100
31 of which: classified as equity under applicable accounting standards 4,100 4,100
32 of which: classified as liabilities under applicable accounting standards
Amount of qualifying items referred to in Article 484 (4) and the related share premium 33 7,451accounts subject to phase out from AT1
Public sector capital injections grandfathered until 1 January 2018
Qualifying Tier 1 capital included in consolidated AT1 capital (including minority interests not 34 included in row 5) issued by subsidiaries and held by third parties
35 of which: instruments issued by subsidiaries subject to phase out
36 Additional Tier 1 (AT1) capital before regulatory adjustments 11,550 4,100
Additional Tier 1 (AT1) capital: regulatory adjustments
37 Direct and indirect holdings by an institution of own AT1 instruments (negative amount)
Holdings of the AT1 instruments of financial sector entities where those entities have reciprocal cross holdings with the institution designed to inflate artificially the own funds of
38 the institution (negative amount)
Direct and indirect holdings of the AT1 instruments of financial sector entities where the institution does not have a significant investment in those entities (amount above the 10%
39 threshold and net of eligible short positions) (negative amount)
Direct and indirect holdings by the institution of the AT1 instruments of financial sector entities where the institution has a significant investment in those entities (amount above the 10%
40 threshold and net of eligible short positions) (negative amount)
Regulatory adjustments applied to Additional Tier 1 in respect of amounts subject to pre-CRR treatment and transitional treatments subject to phase out as prescribed in Regulation (EU)
41 (1,907)no. 575/2013 (i.e. CRR residual amounts)
Residual amounts deducted from Additional Tier 1 capital with regard to deduction from Common Equity Tier 1 capital during the transitional period pursuant to Article 472 of
41a (209)Regulation (EU) no. 575/2013
Residual amounts deducted from Additional Tier 1 capital with regard to deduction from Tier 2 41b (1,698)capital during the transitional period pursuant to Article 475 of Regulation (EU) no. 575/2013
Amount to be deducted from or added to Additional Tier 1 capital with regard to additional 41c filters and deductions required pre-CRR
42 Qualifying T2 deductions that exceed the T2 capital of the institution (negative amount)
43 Total regulatory adjustments to Additional Tier 1 (AT1) capital (1,907) -
44 Additional Tier 1 capital (AT1) 9,643 4,100
45 Tier 1 capital (T1=CET1 + AT1) 73,150 68,812
98 CRÉDIT AGRICOLE S.A. UPDATE A01 OF THE 2014 REGISTRATION DOCUMENT
MANAGEMENT REPORTBasel 3 Pillar 3 disclosures
31/12/2014
Numbering (Phased-in) Phased-in Fully-loaded(in millions of euros) 1Tier 2 (T2) capital: instruments and provisions
46 Capital instruments and the related share premium accounts 15,670 15,670
Amount of qualifying items referred to in Article 484 (5) and the related share premium 47 2,119accounts subject to phase out from T2
Public sector capital injections grandfathered until 1 January 2018
Qualifying own funds instruments included in consolidated T2 capital (including minority interests and AT1 instruments not included in rows 5 or 34) issued by subsidiaries and held by
48 third parties
49 Of which: instruments issued by subsidiaries subject to phase out
50 Credit risk adjustments 1,961 1,961
51 Tier 2 (T2) capital before regulatory adjustments 19,751 17,632
Tier 2 (T2) capital: regulatory adjustments
Direct and indirect holdings by an institution of own T2 instruments and subordinated loans 52 (negative amount)
Holdings of the T2 instruments and subordinated loans of financial sector entities where those entities have reciprocal cross holdings with the institution designed to inflate artificially the
53 own funds of the institution (negative amount)
Direct and indirect holdings of the T2 instruments and subordinated loans of financial sector entities where the institution does not have a significant investment in those entities (amount
54 above the 10% threshold and net of eligible short positions) (negative amount)
54a Of which new holdings not subject to transitional arrangements
54b Of which holdings existing before 1 January 2013 and subject to transitional arrangements
Direct and indirect holdings by the institution of the T2 instruments and subordinated loans of financial sector entities where the institution has a significant investment in those entities (net
55 (3,951) (3,951)of eligible short positions) (negative amount)
Regulatory adjustments applied to Tier 2 in respect of amounts subject to pre-CRR treatment and transitional treatments subject to phase out as prescribed in Regulation (EU) no. 575/2013
56 1,988(i.e. CRR residual amounts)
Residual amounts deducted from Tier 2 capital with regard to deduction from Common Equity Tier 1 capital during the transitional period pursuant to Article 472 of Regulation (EU)
56a -no. 575/2013
Residual amounts deducted from Tier 2 capital with regard to deduction from Additional Tier 1 56b capital during the transitional period pursuant to Article 475 of Regulation (EU) no. 575/2013
Amount to be deducted from or added to Tier 2 capital with regard to additional filters and 56c 1,988deductions required pre-CRR
57 Total regulatory adjustments to Tier 2 (T2) capital (1,963) (3,951)
58 Tier 2 (T2) capital 17,788 13,680
59 Total capital (TC=T1 + T2) 90,938 82,492
Risk weighted assets in respect of amounts subject to pre-CRR treatment and transitional treatments subject to phase out as prescribed in Regulation (EU) no. 575/2013 (i.e. CRR
59a 19,594 19,594residual amounts)
Of which: CET1 instruments of financial sector entities not deducted from CET1 (Regulation 13,908 13,908(EU) no. 575/2013 residual amounts)
which: Deferred tax assets that rely on future profitability and arising from temporary Of5,686 5,686differences not deducted from CET1 (Regulation (EU) no. 575/2013 residual amounts)
which: AT1 instruments of financial sector entities not deducted from AT1 (Regulation (EU) Of3 3no. 575/2013 residual amounts)
which: Tier 2 instruments of financial sector entities not deducted from Tier 2 (Regulation Of1,339 1,339(EU) no. 575/2013 residual amounts)
60 Total risk weighted assets 494,934 494,934
Capital ratios and buffers
61 Common Equity Tier 1 (as a percentage of risk exposure amount) 12.83% 13.07%
62 Tier 1 (as a percentage of risk exposure amount) 14.78% 13.90%
63 Total capital (as a percentage of risk exposure amount) 18.37% 16.67%
Institution specific buffer requirement (CET1 requirement in accordance with Article 92 (1) (a) plus capital conservation and countercyclical buffer requirements, plus systemic buffer, plus the systemically important institution buffer (G-SII or O-SII buffer), expressed as a percentage
64 of risk exposure amount)
65 of which: capital conservation buffer requirement
66 of which: countercyclical buffer requirement
99CRÉDIT AGRICOLE S.A. UPDATE A01 OF THE 2014 REGISTRATION DOCUMENT
1 MANAGEMENT REPORTBasel 3 Pillar 3 disclosures
31/12/2014
Numbering (Phased-in) Phased-in Fully-loaded(in millions of euros)
67 of which: systemic risk buffer requirement
of which: Global Systemically Important Institution (G-SII) or Other Systemically Important 67a Institution (O-SII) buffer
68 Common Equity Tier 1 available to meet buffers (as a percentage of risk exposure amount)
69 [non relevant in EU regulation]
70 [non relevant in EU regulation]
71 [non relevant in EU regulation]
Amounts below the thresholds for deduction (before risk weighting)
Direct and indirect holdings of the capital of financial sector entities where the institution does not have a significant investment in those entities (amount below 10% threshold and net of
72 1,014 1,014eligible short positions)
Direct and indirect holdings by the institution of the CET1 instruments of financial sector entities where the institution has a significant investment in those entities (amount below 10%
73 4,304 4,304threshold and net of eligible short positions)
74 Empty set in the EU
Deferred tax assets arising from temporary differences (amount below 10% threshold, net of 75 2,274 2,274related tax liability where the conditions in Article 38 (3) are met)
Applicable caps on the inclusion of provisions in Tier 2
Credit risk adjustments included in Tier 2 in respect of exposures subject to standardized 76 559 559approach (prior to the application of the cap)
77 Cap on inclusion of credit risk adjustments in T2 under standardized approach 1,499 1,499
Credit risk adjustments included in Tier 2 in respect of exposures subject to internal 78 2,636 2,636ratings-based approach (prior to the application of the cap)
79 Cap for inclusion of credit risk adjustments in T2 under internal ratings-based approach 1,402 1,402
Capital instruments subject to phase-out arrangements (only applicable between 1 January 2013 and 1 January 2022)
80 Current cap on CET1 instruments subject to phase out arrangements
81 Amount excluded from CET1 due to cap (excess over cap after redemptions and maturities)
82 Current cap on AT1 instruments subject to phase out arrangements 7,451
83 Amount excluded from AT1 due to cap (excess over cap after redemptions and maturities) (2)
84 Current cap on T2 instruments subject to phase out arrangements 2,529
85 Amount excluded from T2 due to cap (excess over cap after redemptions and maturities)
As stated in the aforementioned point, CRR/CRD 4 has brought with it some major changes in the composition of capital by tier.
100 CRÉDIT AGRICOLE S.A. UPDATE A01 OF THE 2014 REGISTRATION DOCUMENT
MANAGEMENT REPORTBasel 3 Pillar 3 disclosures
Tier 1 capital1.1This includes Common Equity Tier 1 (CET1) and Additional Tier 1 The following table shows the stock of AT1 with the four issues
capital (AT1): eligible for Basel 3 completed in 2014, and those in the stock at31 December 2013, after maturities and redemptions, but excluding
COMMON EQUITY TIER 1 (CET1)A. the impact of the cap resulting from the grandfathering provision.They include: The four Basel 3 eligible issues have two loss absorption
mechanisms that are triggered when:issued capital;■Crédit Agricole S.A. Group’s phased-in CET1 ratio drops below■reserves, including share premiums, retained earnings, net■5.125%,income after dividend payments (or provision for dividend
payments) and accumulated other comprehensive income, Crédit Agricole Group’s phased-in CET1 ratio falls below 7%.■including unrealised capital gains and losses on
At 31 December 2014, the phased in ratios of Crédit Agricole Groupavailable-for-sale financial assets, as described in sectionand of Crédit Agricole S.A. were 12.8% and 10.4% respectively. They“Regulatory background and scope/Reform of solvency ratios”;thus represent a capital buffer of €28.9 (for the Crédit Agricole
minority interests, which, as stated in the point on the reform of■ Group threshold) and of €15.4 billion (for the Crédit Agricole S.A.solvency ratios, are now partially derecognised or even threshold) in capital relative to the loss absorption thresholds.excluded, depending on whether or not the subsidiary is an
At 31 December 2014, there was no applicable restriction on theeligible credit institution;payment of coupons.
the deductions, apart from the ones stated above in the point■At 31 December 2014, the potentially distributable items ofon the reform of solvency ratios, include the following items:Crédit Agricole S.A. totalled €25.8 billion, including net income,
treasury shares held and valued at their net carrying amount,■ distributable reserves and €21.3 billion in share premiums.intangible assets, including start-up costs and goodwill.■
Additional Tier 1 capital eligible in phased-inADDITIONAL TIER 1 CAPITAL (AT1)B. During the transitional phase, the amount of Tier 1 included in the
ratios representsAdditional Tier 1 capital eligible under Basel 3
Additional Tier 1 capital eligible under Basel 3 (AT1); and■in fully loadedAdditional Tier 1 (AT1) capital eligible under Basel 3 consists of a fraction of the ineligible Tier 1, equal to the lower of:■perpetual debt instruments without any redemption incentive or
the actual amount of ineligible Tier 1 instruments on the■obligation (in particular step-up features).closing date (after amortization, any calls, redemptions, etc.),
AT1 instruments are subject to a loss absorption mechanism including preferred shares,triggered when the CET1 ratio is below a threshold that must be set
80% (threshold for 2014) of the Tier 1 stock at 31 December■at no lower than 5.125%. Instruments may be converted into equity2012. The Tier 1 stock at 31 December 2012 stood ator suffer a reduction in their nominal value. Payments must be€9,314 million, with a maximum amount of €7,451 milliontotally flexible: no automatic remuneration mechanisms, suspensionpossibly being recognised.of coupon payments at the issuer’s discretion permitted.
The Tier 1 amount exceeding this regulatory threshold is included inInvestments in financial-sector entities related to this tier (AT1) arephased-in Tier 2, up to the regulatory threshold applicable to Tier 2deducted, as are those resulting from the transitional regime rules.itself.
101CRÉDIT AGRICOLE S.A. UPDATE A01 OF THE 2014 REGISTRATION DOCUMENT
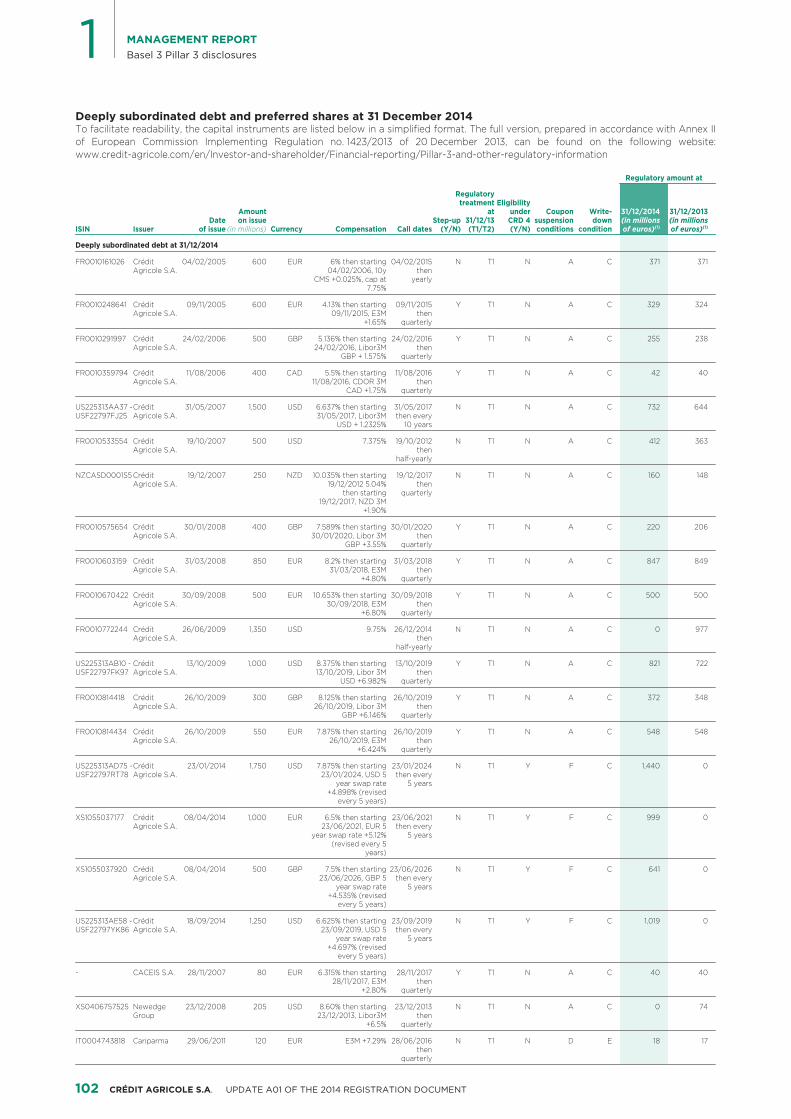
1 MANAGEMENT REPORTBasel 3 Pillar 3 disclosures
Deeply subordinated debt and preferred shares at 31 December 2014To facilitate readability, the capital instruments are listed below in a simplified format. The full version, prepared in accordance with Annex IIof European Commission Implementing Regulation no. 1423/2013 of 20 December 2013, can be found on the following website:www.credit-agricole.com/en/Investor-and-shareholder/Financial-reporting/Pillar-3-and-other-regulatory-information
Regulatory amount at
RegulatoryEligibilitytreatment
Amount Coupon Write- 31/12/2014 31/12/2013at underDate Step-upon issue 31/12/13 CRD 4 suspension down (in millions (in millions
ISIN Issuer Currency Compensation Call datesof issue (in millions) (Y/N) (T1/T2) (Y/N) conditions condition of euros)(1) of euros)(1)
Deeply subordinated debt at 31/12/2014
FR0010161026 Crédit 04/02/2005 600 EUR 6% then starting 04/02/2015 N T1 N A C 371 371Agricole S.A. 04/02/2006, 10y then
CMS +0.025%, cap at yearly7.75%
FR0010248641 Crédit 09/11/2005 600 EUR 4.13% then starting 09/11/2015 Y T1 N A C 329 324Agricole S.A. 09/11/2015, E3M then
+1.65% quarterly
FR0010291997 Crédit 24/02/2006 500 GBP 5.136% then starting 24/02/2016 Y T1 N A C 255 238Agricole S.A. 24/02/2016, Libor3M then
GBP + 1.575% quarterly
FR0010359794 Crédit 11/08/2006 400 CAD 5.5% then starting 11/08/2016 Y T1 N A C 42 40Agricole S.A. 11/08/2016, CDOR 3M then
CAD +1.75% quarterly
US225313AA37 - Crédit 31/05/2007 1,500 USD 6.637% then starting 31/05/2017 N T1 N A C 732 644USF22797FJ25 Agricole S.A. 31/05/2017, Libor3M then every
USD + 1.2325% 10 years
FR0010533554 Crédit 19/10/2007 500 USD 7.375% 19/10/2012 N T1 N A C 412 363Agricole S.A. then
half-yearly
NZCASD0001S5 Crédit 19/12/2007 250 NZD 10.035% then starting 19/12/2017 N T1 N A C 160 148Agricole S.A. 19/12/2012 5.04% then
then starting quarterly19/12/2017, NZD 3M
+1.90%
FR0010575654 Crédit 30/01/2008 400 GBP 7.589% then starting 30/01/2020 Y T1 N A C 220 206Agricole S.A. 30/01/2020, Libor 3M then
GBP +3.55% quarterly
FR0010603159 Crédit 31/03/2008 850 EUR 8.2% then starting 31/03/2018 Y T1 N A C 847 849Agricole S.A. 31/03/2018, E3M then
+4.80% quarterly
FR0010670422 Crédit 30/09/2008 500 EUR 10.653% then starting 30/09/2018 Y T1 N A C 500 500Agricole S.A. 30/09/2018, E3M then
+6.80% quarterly
FR0010772244 Crédit 26/06/2009 1,350 USD 9.75% 26/12/2014 N T1 N A C 0 977Agricole S.A. then
half-yearly
US225313AB10 - Crédit 13/10/2009 1,000 USD 8.375% then starting 13/10/2019 Y T1 N A C 821 722USF22797FK97 Agricole S.A. 13/10/2019, Libor 3M then
USD +6.982% quarterly
FR0010814418 Crédit 26/10/2009 300 GBP 8.125% then starting 26/10/2019 Y T1 N A C 372 348Agricole S.A. 26/10/2019, Libor 3M then
GBP +6.146% quarterly
FR0010814434 Crédit 26/10/2009 550 EUR 7.875% then starting 26/10/2019 Y T1 N A C 548 548Agricole S.A. 26/10/2019, E3M then
+6.424% quarterly
US225313AD75 - Crédit 23/01/2014 1,750 USD 7.875% then starting 23/01/2024 N T1 Y F C 1,440 0USF22797RT78 Agricole S.A. 23/01/2024, USD 5 then every
year swap rate 5 years+4.898% (revised
every 5 years)
XS1055037177 Crédit 08/04/2014 1,000 EUR 6.5% then starting 23/06/2021 N T1 Y F C 999 0Agricole S.A. 23/06/2021, EUR 5 then every
year swap rate +5.12% 5 years(revised every 5
years)
XS1055037920 Crédit 08/04/2014 500 GBP 7.5% then starting 23/06/2026 N T1 Y F C 641 0Agricole S.A. 23/06/2026, GBP 5 then every
year swap rate 5 years+4.535% (revised
every 5 years)
US225313AE58 - Crédit 18/09/2014 1,250 USD 6.625% then starting 23/09/2019 N T1 Y F C 1,019 0USF22797YK86 Agricole S.A. 23/09/2019, USD 5 then every
year swap rate 5 years+4.697% (revised
every 5 years)
- CACEIS S.A. 28/11/2007 80 EUR 6.315% then starting 28/11/2017 Y T1 N A C 40 4028/11/2017, E3M then
+2.80% quarterly
XS0406757525 Newedge 23/12/2008 205 USD 8.60% then starting 23/12/2013 N T1 N A C 0 74Group 23/12/2013, Libor3M then
+6.5% quarterly
IT0004743818 Cariparma 29/06/2011 120 EUR E3M +7.29% 28/06/2016 N T1 N D E 18 17then
quarterly
102 CRÉDIT AGRICOLE S.A. UPDATE A01 OF THE 2014 REGISTRATION DOCUMENT
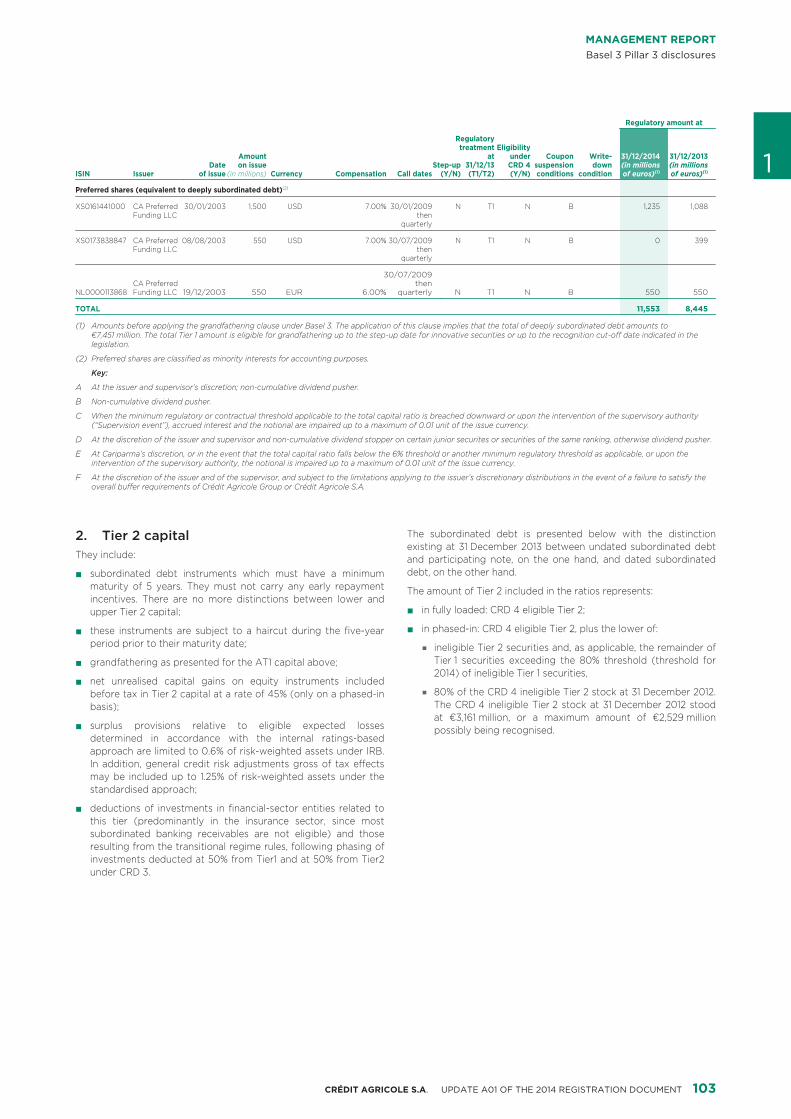
MANAGEMENT REPORTBasel 3 Pillar 3 disclosures
Regulatory amount at
RegulatoryEligibilitytreatment
Amount Coupon Write- 31/12/2014 31/12/2013at underDate Step-upon issue 31/12/13 CRD 4 suspension down (in millions (in millions
ISIN Issuer Currency Compensation Call datesof issue (in millions) (Y/N) (T1/T2) (Y/N) conditions condition of euros)(1) of euros)(1) 1Preferred shares (equivalent to deeply subordinated debt)(2)
XS0161441000 CA Preferred 30/01/2003 1,500 USD 7.00% 30/01/2009 N T1 N B 1,235 1,088Funding LLC then
quarterly
XS0173838847 CA Preferred 08/08/2003 550 USD 7.00% 30/07/2009 N T1 N B 0 399Funding LLC then
quarterly
30/07/2009CA Preferred then
NL0000113868 19/12/2003 550 EUR 6.00% N T1 N B 550 550Funding LLC quarterly
TOTAL 11,553 8,445
Amounts before applying the grandfathering clause under Basel 3. The application of this clause implies that the total of deeply subordinated debt amounts to (1)€7,451 million. The total Tier 1 amount is eligible for grandfathering up to the step-up date for innovative securities or up to the recognition cut-off date indicated in the legislation.
Preferred shares are classified as minority interests for accounting purposes.(2)
Key:
At the issuer and supervisor’s discretion; non-cumulative dividend pusher.A
Non-cumulative dividend pusher.B
When the minimum regulatory or contractual threshold applicable to the total capital ratio is breached downward or upon the intervention of the supervisory authority C(“Supervision event”), accrued interest and the notional are impaired up to a maximum of 0.01 unit of the issue currency.
At the discretion of the issuer and supervisor and non-cumulative dividend stopper on certain junior securites or securities of the same ranking, otherwise dividend pusher.D
At Cariparma’s discretion, or in the event that the total capital ratio falls below the 6% threshold or another minimum regulatory threshold as applicable, or upon the Eintervention of the supervisory authority, the notional is impaired up to a maximum of 0.01 unit of the issue currency.
At the discretion of the issuer and of the supervisor, and subject to the limitations applying to the issuer’s discretionary distributions in the event of a failure to satisfy the Foverall buffer requirements of Crédit Agricole Group or Crédit Agricole S.A.
Tier 2 capital2. The subordinated debt is presented below with the distinctionexisting at 31 December 2013 between undated subordinated debt
They include: and participating note, on the one hand, and dated subordinateddebt, on the other hand.subordinated debt instruments which must have a minimum■
maturity of 5 years. They must not carry any early repayment The amount of Tier 2 included in the ratios represents:incentives. There are no more distinctions between lower and
in fully loaded: CRD 4 eligible Tier 2;■upper Tier 2 capital;
in phased-in: CRD 4 eligible Tier 2, plus the lower of:■these instruments are subject to a haircut during the five-year■period prior to their maturity date; ineligible Tier 2 securities and, as applicable, the remainder of■
Tier 1 securities exceeding the 80% threshold (threshold forgrandfathering as presented for the AT1 capital above;■2014) of ineligible Tier 1 securities,
net unrealised capital gains on equity instruments included■80% of the CRD 4 ineligible Tier 2 stock at 31 December 2012.■before tax in Tier 2 capital at a rate of 45% (only on a phased-inThe CRD 4 ineligible Tier 2 stock at 31 December 2012 stoodbasis);at €3,161 million, or a maximum amount of €2,529 million
surplus provisions relative to eligible expected losses■ possibly being recognised.determined in accordance with the internal ratings-basedapproach are limited to 0.6% of risk-weighted assets under IRB.In addition, general credit risk adjustments gross of tax effectsmay be included up to 1.25% of risk-weighted assets under thestandardised approach;
deductions of investments in financial-sector entities related to■this tier (predominantly in the insurance sector, since mostsubordinated banking receivables are not eligible) and thoseresulting from the transitional regime rules, following phasing ofinvestments deducted at 50% from Tier1 and at 50% from Tier2under CRD 3.
103CRÉDIT AGRICOLE S.A. UPDATE A01 OF THE 2014 REGISTRATION DOCUMENT
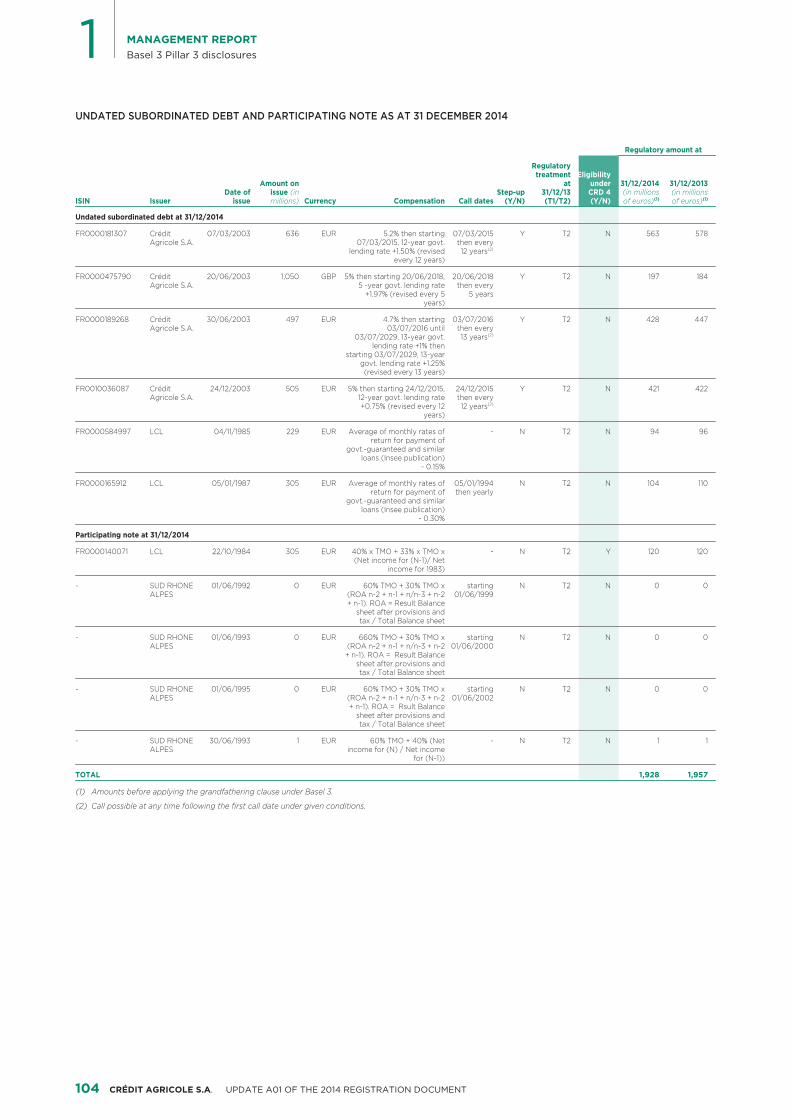
1 MANAGEMENT REPORTBasel 3 Pillar 3 disclosures
UNDATED SUBORDINATED DEBT AND PARTICIPATING NOTE AS AT 31 DECEMBER 2014
Regulatory amount at
RegulatoryEligibilitytreatment
Amount on 31/12/2014 31/12/2013at underDate of Step-upissue (in 31/12/13 CRD 4 (in millions (in millions
ISIN Issuer Currency Compensation Call datesissue millions) (Y/N) (T1/T2) (Y/N) of euros)(1) of euros)(1)
Undated subordinated debt at 31/12/2014
FR0000181307 Crédit 07/03/2003 636 EUR 5.2% then starting 07/03/2015 Y T2 N 563 578Agricole S.A. 07/03/2015, 12-year govt. then every
lending rate +1.50% (revised 12 years(2)
every 12 years)
FR0000475790 Crédit 20/06/2003 1,050 GBP 5% then starting 20/06/2018, 20/06/2018 Y T2 N 197 184Agricole S.A. 5 -year govt. lending rate then every
+1.97% (revised every 5 5 yearsyears)
FR0000189268 Crédit 30/06/2003 497 EUR 4.7% then starting 03/07/2016 Y T2 N 428 447Agricole S.A. 03/07/2016 until then every
03/07/2029, 13-year govt. 13 years(2)
lending rate +1% thenstarting 03/07/2029, 13-year
govt. lending rate +1.25%(revised every 13 years)
FR0010036087 Crédit 24/12/2003 505 EUR 5% then starting 24/12/2015, 24/12/2015 Y T2 N 421 422Agricole S.A. 12-year govt. lending rate then every
+0.75% (revised every 12 12 years(2)
years)
FR0000584997 LCL 04/11/1985 229 EUR Average of monthly rates of - N T2 N 94 96return for payment of
govt.-guaranteed and similarloans (Insee publication)
- 0.15%
FR0000165912 LCL 05/01/1987 305 EUR Average of monthly rates of 05/01/1994 N T2 N 104 110return for payment of then yearly
govt.-guaranteed and similarloans (Insee publication)
- 0.30%
Participating note at 31/12/2014
FR0000140071 LCL 22/10/1984 305 EUR 40% x TMO + 33% x TMO x - N T2 Y 120 120(Net income for (N-1)/ Net
income for 1983)
- SUD RHONE 01/06/1992 0 EUR 60% TMO + 30% TMO x starting N T2 N 0 0ALPES (ROA n-2 + n-1 + n/n-3 + n-2 01/06/1999
+ n-1). ROA = Result Balancesheet after provisions andtax / Total Balance sheet
- SUD RHONE 01/06/1993 0 EUR 660% TMO + 30% TMO x starting N T2 N 0 0ALPES (ROA n-2 + n-1 + n/n-3 + n-2 01/06/2000
+ n-1). ROA = Result Balancesheet after provisions andtax / Total Balance sheet
- SUD RHONE 01/06/1995 0 EUR 60% TMO + 30% TMO x starting N T2 N 0 0ALPES (ROA n-2 + n-1 + n/n-3 + n-2 01/06/2002
+ n-1). ROA = Rsult Balancesheet after provisions andtax / Total Balance sheet
- SUD RHONE 30/06/1993 1 EUR 60% TMO + 40% (Net - N T2 N 1 1ALPES income for (N) / Net income
for (N-1))
TOTAL 1,928 1,957
Amounts before applying the grandfathering clause under Basel 3.(1)
Call possible at any time following the first call date under given conditions.(2)
104 CRÉDIT AGRICOLE S.A. UPDATE A01 OF THE 2014 REGISTRATION DOCUMENT
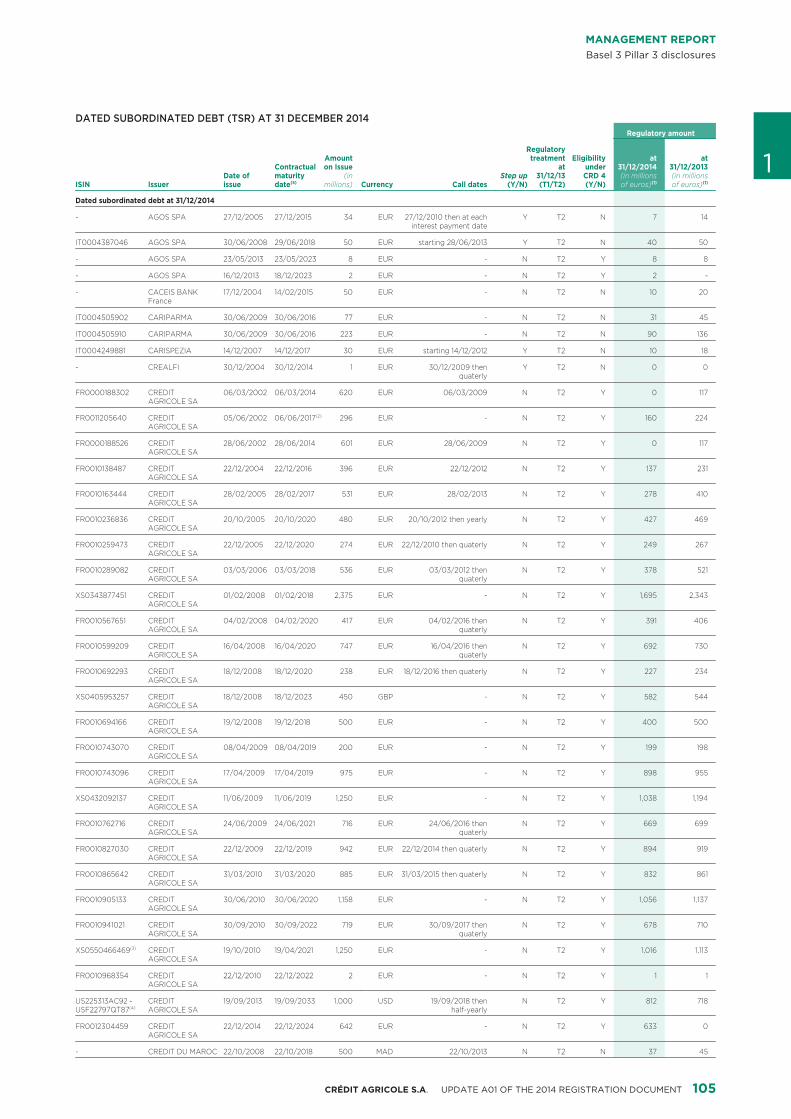
MANAGEMENT REPORTBasel 3 Pillar 3 disclosures
DATED SUBORDINATED DEBT (TSR) AT 31 DECEMBER 2014Regulatory amount
RegulatoryAmount Eligibility at attreatment
Contractual on Issue at under 31/12/2014 31/12/2013Date of Step upmaturity (in 31/12/13 CRD 4 (in millions (in millions
ISIN Issuer Currency Call datesissue date(5) millions) (Y/N) (T1/T2) (Y/N) of euros)(1) of euros)(1)
1Dated subordinated debt at 31/12/2014
- AGOS SPA 27/12/2005 27/12/2015 34 EUR 27/12/2010 then at each Y T2 N 7 14interest payment date
IT0004387046 AGOS SPA 30/06/2008 29/06/2018 50 EUR starting 28/06/2013 Y T2 N 40 50
- AGOS SPA 23/05/2013 23/05/2023 8 EUR - N T2 Y 8 8
- AGOS SPA 16/12/2013 18/12/2023 2 EUR - N T2 Y 2 -
- CACEIS BANK 17/12/2004 14/02/2015 50 EUR - N T2 N 10 20France
IT0004505902 CARIPARMA 30/06/2009 30/06/2016 77 EUR - N T2 N 31 45
IT0004505910 CARIPARMA 30/06/2009 30/06/2016 223 EUR - N T2 N 90 136
IT0004249881 CARISPEZIA 14/12/2007 14/12/2017 30 EUR starting 14/12/2012 Y T2 N 10 18
- CREALFI 30/12/2004 30/12/2014 1 EUR 30/12/2009 then Y T2 N 0 0quaterly
FR0000188302 CREDIT 06/03/2002 06/03/2014 620 EUR 06/03/2009 N T2 Y 0 117AGRICOLE SA
FR0011205640 CREDIT 05/06/2002 06/06/2017(2) 296 EUR - N T2 Y 160 224AGRICOLE SA
FR0000188526 CREDIT 28/06/2002 28/06/2014 601 EUR 28/06/2009 N T2 Y 0 117AGRICOLE SA
FR0010138487 CREDIT 22/12/2004 22/12/2016 396 EUR 22/12/2012 N T2 Y 137 231AGRICOLE SA
FR0010163444 CREDIT 28/02/2005 28/02/2017 531 EUR 28/02/2013 N T2 Y 278 410AGRICOLE SA
FR0010236836 CREDIT 20/10/2005 20/10/2020 480 EUR 20/10/2012 then yearly N T2 Y 427 469AGRICOLE SA
FR0010259473 CREDIT 22/12/2005 22/12/2020 274 EUR 22/12/2010 then quaterly N T2 Y 249 267AGRICOLE SA
FR0010289082 CREDIT 03/03/2006 03/03/2018 536 EUR 03/03/2012 then N T2 Y 378 521AGRICOLE SA quaterly
XS0343877451 CREDIT 01/02/2008 01/02/2018 2,375 EUR - N T2 Y 1,695 2,343AGRICOLE SA
FR0010567651 CREDIT 04/02/2008 04/02/2020 417 EUR 04/02/2016 then N T2 Y 391 406AGRICOLE SA quaterly
FR0010599209 CREDIT 16/04/2008 16/04/2020 747 EUR 16/04/2016 then N T2 Y 692 730AGRICOLE SA quaterly
FR0010692293 CREDIT 18/12/2008 18/12/2020 238 EUR 18/12/2016 then quaterly N T2 Y 227 234AGRICOLE SA
XS0405953257 CREDIT 18/12/2008 18/12/2023 450 GBP - N T2 Y 582 544AGRICOLE SA
FR0010694166 CREDIT 19/12/2008 19/12/2018 500 EUR - N T2 Y 400 500AGRICOLE SA
FR0010743070 CREDIT 08/04/2009 08/04/2019 200 EUR - N T2 Y 199 198AGRICOLE SA
FR0010743096 CREDIT 17/04/2009 17/04/2019 975 EUR - N T2 Y 898 955AGRICOLE SA
XS0432092137 CREDIT 11/06/2009 11/06/2019 1,250 EUR - N T2 Y 1,038 1,194AGRICOLE SA
FR0010762716 CREDIT 24/06/2009 24/06/2021 716 EUR 24/06/2016 then N T2 Y 669 699AGRICOLE SA quaterly
FR0010827030 CREDIT 22/12/2009 22/12/2019 942 EUR 22/12/2014 then quaterly N T2 Y 894 919AGRICOLE SA
FR0010865642 CREDIT 31/03/2010 31/03/2020 885 EUR 31/03/2015 then quaterly N T2 Y 832 861AGRICOLE SA
FR0010905133 CREDIT 30/06/2010 30/06/2020 1,158 EUR - N T2 Y 1,056 1,137AGRICOLE SA
FR0010941021 CREDIT 30/09/2010 30/09/2022 719 EUR 30/09/2017 then N T2 Y 678 710AGRICOLE SA quaterly
XS0550466469(3) CREDIT 19/10/2010 19/04/2021 1,250 EUR - N T2 Y 1,016 1,113AGRICOLE SA
FR0010968354 CREDIT 22/12/2010 22/12/2022 2 EUR - N T2 Y 1 1AGRICOLE SA
US225313AC92 - CREDIT 19/09/2013 19/09/2033 1,000 USD 19/09/2018 then N T2 Y 812 718USF22797QT87(4) AGRICOLE SA half-yearly
FR0012304459 CREDIT 22/12/2014 22/12/2024 642 EUR - N T2 Y 633 0AGRICOLE SA
- CREDIT DU MAROC 22/10/2008 22/10/2018 500 MAD 22/10/2013 N T2 N 37 45
105CRÉDIT AGRICOLE S.A. UPDATE A01 OF THE 2014 REGISTRATION DOCUMENT
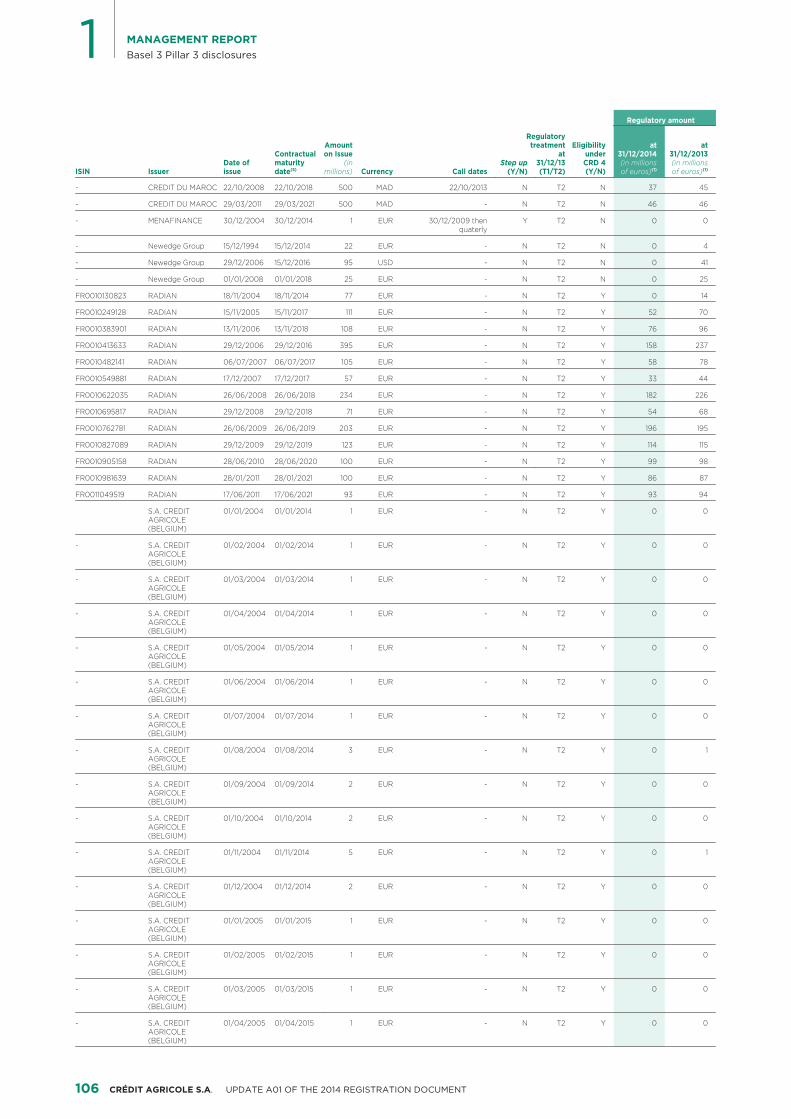
1 MANAGEMENT REPORTBasel 3 Pillar 3 disclosures
Regulatory amount
RegulatoryAmount Eligibility at attreatment
Contractual on Issue at under 31/12/2014 31/12/2013Date of Step upmaturity (in 31/12/13 CRD 4 (in millions (in millions
ISIN Issuer Currency Call datesissue date(5) millions) (Y/N) (T1/T2) (Y/N) of euros)(1) of euros)(1)
- CREDIT DU MAROC 22/10/2008 22/10/2018 500 MAD 22/10/2013 N T2 N 37 45
- CREDIT DU MAROC 29/03/2011 29/03/2021 500 MAD - N T2 N 46 46
- MENAFINANCE 30/12/2004 30/12/2014 1 EUR 30/12/2009 then Y T2 N 0 0quaterly
- Newedge Group 15/12/1994 15/12/2014 22 EUR - N T2 N 0 4
- Newedge Group 29/12/2006 15/12/2016 95 USD - N T2 N 0 41
- Newedge Group 01/01/2008 01/01/2018 25 EUR - N T2 N 0 25
FR0010130823 RADIAN 18/11/2004 18/11/2014 77 EUR - N T2 Y 0 14
FR0010249128 RADIAN 15/11/2005 15/11/2017 111 EUR - N T2 Y 52 70
FR0010383901 RADIAN 13/11/2006 13/11/2018 108 EUR - N T2 Y 76 96
FR0010413633 RADIAN 29/12/2006 29/12/2016 395 EUR - N T2 Y 158 237
FR0010482141 RADIAN 06/07/2007 06/07/2017 105 EUR - N T2 Y 58 78
FR0010549881 RADIAN 17/12/2007 17/12/2017 57 EUR - N T2 Y 33 44
FR0010622035 RADIAN 26/06/2008 26/06/2018 234 EUR - N T2 Y 182 226
FR0010695817 RADIAN 29/12/2008 29/12/2018 71 EUR - N T2 Y 54 68
FR0010762781 RADIAN 26/06/2009 26/06/2019 203 EUR - N T2 Y 196 195
FR0010827089 RADIAN 29/12/2009 29/12/2019 123 EUR - N T2 Y 114 115
FR0010905158 RADIAN 28/06/2010 28/06/2020 100 EUR - N T2 Y 99 98
FR0010981639 RADIAN 28/01/2011 28/01/2021 100 EUR - N T2 Y 86 87
FR0011049519 RADIAN 17/06/2011 17/06/2021 93 EUR - N T2 Y 93 94
S.A. CREDIT 01/01/2004 01/01/2014 1 EUR - N T2 Y 0 0AGRICOLE (BELGIUM)
- S.A. CREDIT 01/02/2004 01/02/2014 1 EUR - N T2 Y 0 0AGRICOLE (BELGIUM)
- S.A. CREDIT 01/03/2004 01/03/2014 1 EUR - N T2 Y 0 0AGRICOLE (BELGIUM)
- S.A. CREDIT 01/04/2004 01/04/2014 1 EUR - N T2 Y 0 0AGRICOLE (BELGIUM)
- S.A. CREDIT 01/05/2004 01/05/2014 1 EUR - N T2 Y 0 0AGRICOLE (BELGIUM)
- S.A. CREDIT 01/06/2004 01/06/2014 1 EUR - N T2 Y 0 0AGRICOLE (BELGIUM)
- S.A. CREDIT 01/07/2004 01/07/2014 1 EUR - N T2 Y 0 0AGRICOLE (BELGIUM)
- S.A. CREDIT 01/08/2004 01/08/2014 3 EUR - N T2 Y 0 1AGRICOLE (BELGIUM)
- S.A. CREDIT 01/09/2004 01/09/2014 2 EUR - N T2 Y 0 0AGRICOLE (BELGIUM)
- S.A. CREDIT 01/10/2004 01/10/2014 2 EUR - N T2 Y 0 0AGRICOLE (BELGIUM)
- S.A. CREDIT 01/11/2004 01/11/2014 5 EUR - N T2 Y 0 1AGRICOLE (BELGIUM)
- S.A. CREDIT 01/12/2004 01/12/2014 2 EUR - N T2 Y 0 0AGRICOLE (BELGIUM)
- S.A. CREDIT 01/01/2005 01/01/2015 1 EUR - N T2 Y 0 0AGRICOLE (BELGIUM)
- S.A. CREDIT 01/02/2005 01/02/2015 1 EUR - N T2 Y 0 0AGRICOLE (BELGIUM)
- S.A. CREDIT 01/03/2005 01/03/2015 1 EUR - N T2 Y 0 0AGRICOLE (BELGIUM)
- S.A. CREDIT 01/04/2005 01/04/2015 1 EUR - N T2 Y 0 0AGRICOLE (BELGIUM)
106 CRÉDIT AGRICOLE S.A. UPDATE A01 OF THE 2014 REGISTRATION DOCUMENT
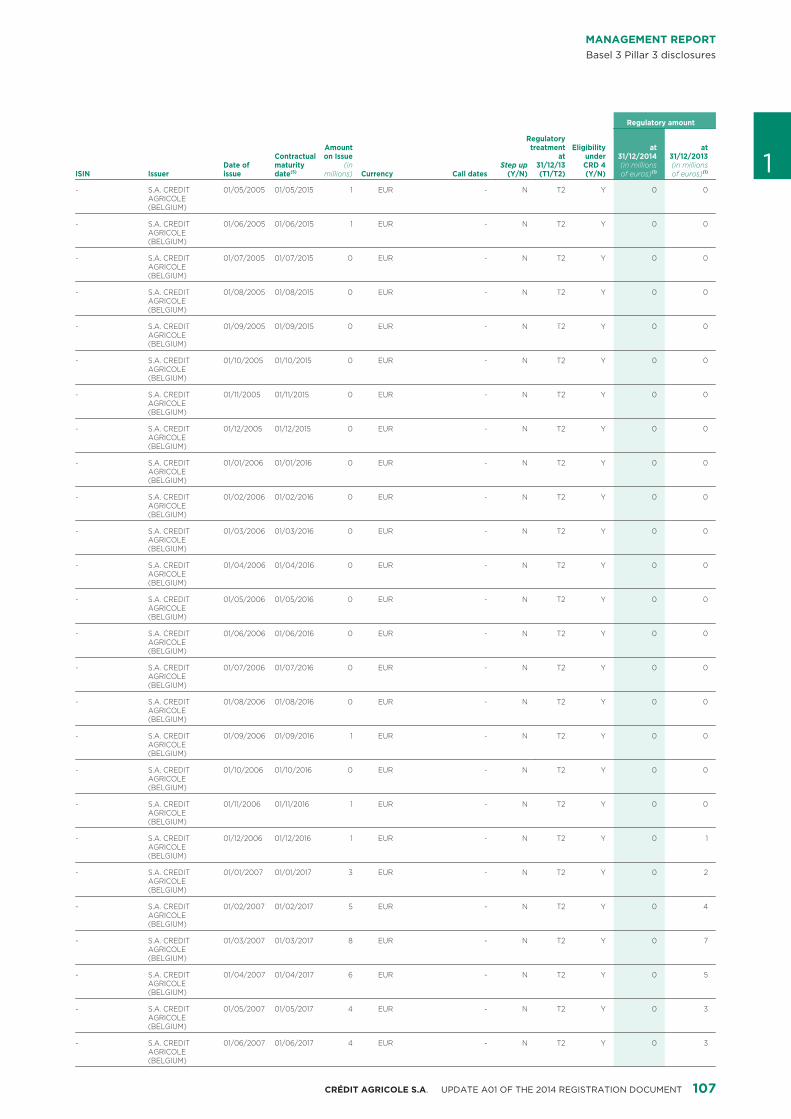
MANAGEMENT REPORTBasel 3 Pillar 3 disclosures
Regulatory amount
RegulatoryAmount Eligibility at attreatment
Contractual on Issue at under 31/12/2014 31/12/2013Date of Step upmaturity (in 31/12/13 CRD 4 (in millions (in millions
ISIN Issuer Currency Call datesissue date(5) millions) (Y/N) (T1/T2) (Y/N) of euros)(1) of euros)(1) 1- S.A. CREDIT 01/05/2005 01/05/2015 1 EUR - N T2 Y 0 0
AGRICOLE (BELGIUM)
- S.A. CREDIT 01/06/2005 01/06/2015 1 EUR - N T2 Y 0 0AGRICOLE (BELGIUM)
- S.A. CREDIT 01/07/2005 01/07/2015 0 EUR - N T2 Y 0 0AGRICOLE (BELGIUM)
- S.A. CREDIT 01/08/2005 01/08/2015 0 EUR - N T2 Y 0 0AGRICOLE (BELGIUM)
- S.A. CREDIT 01/09/2005 01/09/2015 0 EUR - N T2 Y 0 0AGRICOLE (BELGIUM)
- S.A. CREDIT 01/10/2005 01/10/2015 0 EUR - N T2 Y 0 0AGRICOLE (BELGIUM)
- S.A. CREDIT 01/11/2005 01/11/2015 0 EUR - N T2 Y 0 0AGRICOLE (BELGIUM)
- S.A. CREDIT 01/12/2005 01/12/2015 0 EUR - N T2 Y 0 0AGRICOLE (BELGIUM)
- S.A. CREDIT 01/01/2006 01/01/2016 0 EUR - N T2 Y 0 0AGRICOLE (BELGIUM)
- S.A. CREDIT 01/02/2006 01/02/2016 0 EUR - N T2 Y 0 0AGRICOLE (BELGIUM)
- S.A. CREDIT 01/03/2006 01/03/2016 0 EUR - N T2 Y 0 0AGRICOLE (BELGIUM)
- S.A. CREDIT 01/04/2006 01/04/2016 0 EUR - N T2 Y 0 0AGRICOLE (BELGIUM)
- S.A. CREDIT 01/05/2006 01/05/2016 0 EUR - N T2 Y 0 0AGRICOLE (BELGIUM)
- S.A. CREDIT 01/06/2006 01/06/2016 0 EUR - N T2 Y 0 0AGRICOLE (BELGIUM)
- S.A. CREDIT 01/07/2006 01/07/2016 0 EUR - N T2 Y 0 0AGRICOLE (BELGIUM)
- S.A. CREDIT 01/08/2006 01/08/2016 0 EUR - N T2 Y 0 0AGRICOLE (BELGIUM)
- S.A. CREDIT 01/09/2006 01/09/2016 1 EUR - N T2 Y 0 0AGRICOLE (BELGIUM)
- S.A. CREDIT 01/10/2006 01/10/2016 0 EUR - N T2 Y 0 0AGRICOLE (BELGIUM)
- S.A. CREDIT 01/11/2006 01/11/2016 1 EUR - N T2 Y 0 0AGRICOLE (BELGIUM)
- S.A. CREDIT 01/12/2006 01/12/2016 1 EUR - N T2 Y 0 1AGRICOLE (BELGIUM)
- S.A. CREDIT 01/01/2007 01/01/2017 3 EUR - N T2 Y 0 2AGRICOLE (BELGIUM)
- S.A. CREDIT 01/02/2007 01/02/2017 5 EUR - N T2 Y 0 4AGRICOLE (BELGIUM)
- S.A. CREDIT 01/03/2007 01/03/2017 8 EUR - N T2 Y 0 7AGRICOLE (BELGIUM)
- S.A. CREDIT 01/04/2007 01/04/2017 6 EUR - N T2 Y 0 5AGRICOLE (BELGIUM)
- S.A. CREDIT 01/05/2007 01/05/2017 4 EUR - N T2 Y 0 3AGRICOLE (BELGIUM)
- S.A. CREDIT 01/06/2007 01/06/2017 4 EUR - N T2 Y 0 3AGRICOLE (BELGIUM)
107CRÉDIT AGRICOLE S.A. UPDATE A01 OF THE 2014 REGISTRATION DOCUMENT
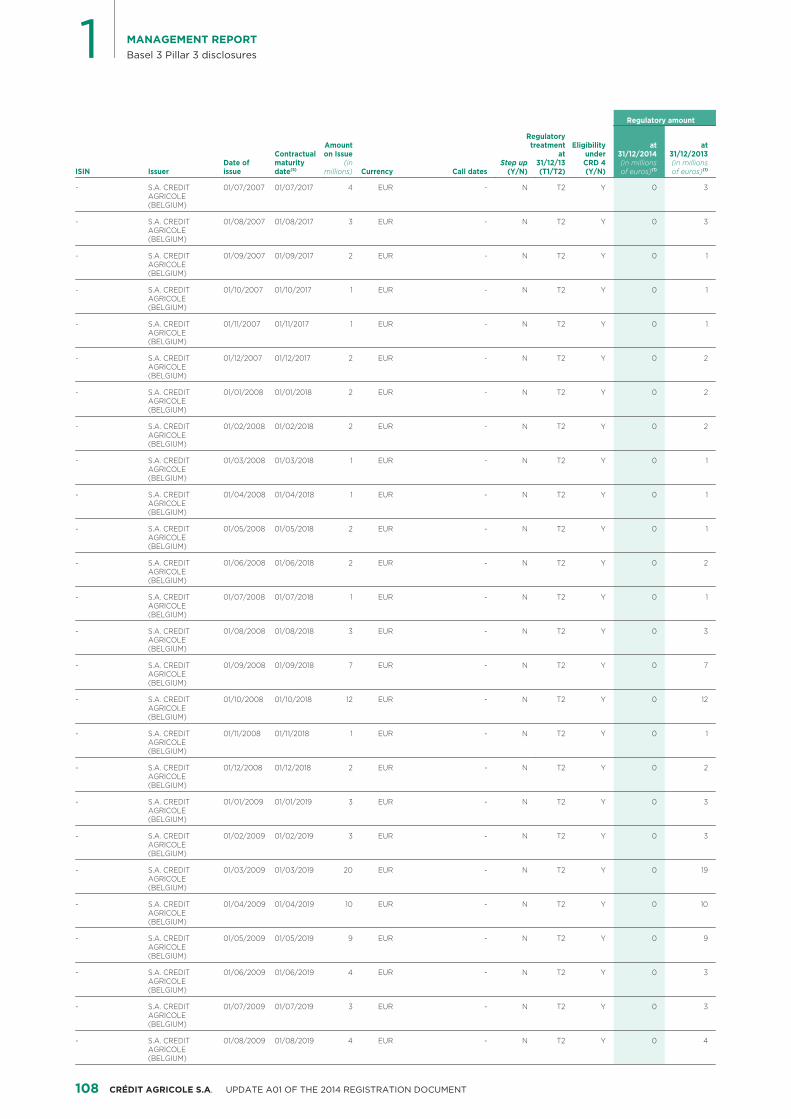
1 MANAGEMENT REPORTBasel 3 Pillar 3 disclosures
Regulatory amount
RegulatoryAmount Eligibility at attreatment
Contractual on Issue at under 31/12/2014 31/12/2013Date of Step upmaturity (in 31/12/13 CRD 4 (in millions (in millions
ISIN Issuer Currency Call datesissue date(5) millions) (Y/N) (T1/T2) (Y/N) of euros)(1) of euros)(1)
- S.A. CREDIT 01/07/2007 01/07/2017 4 EUR - N T2 Y 0 3AGRICOLE (BELGIUM)
- S.A. CREDIT 01/08/2007 01/08/2017 3 EUR - N T2 Y 0 3AGRICOLE (BELGIUM)
- S.A. CREDIT 01/09/2007 01/09/2017 2 EUR - N T2 Y 0 1AGRICOLE (BELGIUM)
- S.A. CREDIT 01/10/2007 01/10/2017 1 EUR - N T2 Y 0 1AGRICOLE (BELGIUM)
- S.A. CREDIT 01/11/2007 01/11/2017 1 EUR - N T2 Y 0 1AGRICOLE (BELGIUM)
- S.A. CREDIT 01/12/2007 01/12/2017 2 EUR - N T2 Y 0 2AGRICOLE (BELGIUM)
- S.A. CREDIT 01/01/2008 01/01/2018 2 EUR - N T2 Y 0 2AGRICOLE (BELGIUM)
- S.A. CREDIT 01/02/2008 01/02/2018 2 EUR - N T2 Y 0 2AGRICOLE (BELGIUM)
- S.A. CREDIT 01/03/2008 01/03/2018 1 EUR - N T2 Y 0 1AGRICOLE (BELGIUM)
- S.A. CREDIT 01/04/2008 01/04/2018 1 EUR - N T2 Y 0 1AGRICOLE (BELGIUM)
- S.A. CREDIT 01/05/2008 01/05/2018 2 EUR - N T2 Y 0 1AGRICOLE (BELGIUM)
- S.A. CREDIT 01/06/2008 01/06/2018 2 EUR - N T2 Y 0 2AGRICOLE (BELGIUM)
- S.A. CREDIT 01/07/2008 01/07/2018 1 EUR - N T2 Y 0 1AGRICOLE (BELGIUM)
- S.A. CREDIT 01/08/2008 01/08/2018 3 EUR - N T2 Y 0 3AGRICOLE (BELGIUM)
- S.A. CREDIT 01/09/2008 01/09/2018 7 EUR - N T2 Y 0 7AGRICOLE (BELGIUM)
- S.A. CREDIT 01/10/2008 01/10/2018 12 EUR - N T2 Y 0 12AGRICOLE (BELGIUM)
- S.A. CREDIT 01/11/2008 01/11/2018 1 EUR - N T2 Y 0 1AGRICOLE (BELGIUM)
- S.A. CREDIT 01/12/2008 01/12/2018 2 EUR - N T2 Y 0 2AGRICOLE (BELGIUM)
- S.A. CREDIT 01/01/2009 01/01/2019 3 EUR - N T2 Y 0 3AGRICOLE (BELGIUM)
- S.A. CREDIT 01/02/2009 01/02/2019 3 EUR - N T2 Y 0 3AGRICOLE (BELGIUM)
- S.A. CREDIT 01/03/2009 01/03/2019 20 EUR - N T2 Y 0 19AGRICOLE (BELGIUM)
- S.A. CREDIT 01/04/2009 01/04/2019 10 EUR - N T2 Y 0 10AGRICOLE (BELGIUM)
- S.A. CREDIT 01/05/2009 01/05/2019 9 EUR - N T2 Y 0 9AGRICOLE (BELGIUM)
- S.A. CREDIT 01/06/2009 01/06/2019 4 EUR - N T2 Y 0 3AGRICOLE (BELGIUM)
- S.A. CREDIT 01/07/2009 01/07/2019 3 EUR - N T2 Y 0 3AGRICOLE (BELGIUM)
- S.A. CREDIT 01/08/2009 01/08/2019 4 EUR - N T2 Y 0 4AGRICOLE (BELGIUM)
108 CRÉDIT AGRICOLE S.A. UPDATE A01 OF THE 2014 REGISTRATION DOCUMENT

MANAGEMENT REPORTBasel 3 Pillar 3 disclosures
Regulatory amount
RegulatoryAmount Eligibility at attreatment
Contractual on Issue at under 31/12/2014 31/12/2013Date of Step upmaturity (in 31/12/13 CRD 4 (in millions (in millions
ISIN Issuer Currency Call datesissue date(5) millions) (Y/N) (T1/T2) (Y/N) of euros)(1) of euros)(1) 1- S.A. CREDIT 01/09/2009 01/09/2019 3 EUR - N T2 Y 0 3
AGRICOLE (BELGIUM)
- S.A. CREDIT 01/10/2009 01/10/2019 1 EUR - N T2 Y 0 1AGRICOLE (BELGIUM)
- S.A. CREDIT 01/11/2009 01/11/2019 1 EUR - N T2 Y 0 1AGRICOLE (BELGIUM)
- S.A. CREDIT 01/12/2009 01/12/2019 3 EUR - N T2 Y 0 3AGRICOLE (BELGIUM)
- S.A. CREDIT 01/01/2010 01/01/2020 2 EUR - N T2 Y 0 2AGRICOLE (BELGIUM)
- S.A. CREDIT 01/02/2010 01/02/2020 2 EUR - N T2 Y 0 2AGRICOLE (BELGIUM)
- S.A. CREDIT 01/03/2010 01/03/2020 3 EUR - N T2 Y 0 3AGRICOLE (BELGIUM)
- S.A. CREDIT 01/04/2010 01/04/2020 2 EUR - N T2 Y 0 2AGRICOLE (BELGIUM)
- S.A. CREDIT 01/05/2010 01/05/2020 1 EUR - N T2 Y 0 1AGRICOLE (BELGIUM)
- S.A. CREDIT 01/06/2010 01/06/2020 2 EUR - N T2 Y 0 2AGRICOLE (BELGIUM)
- S.A. CREDIT 01/07/2010 01/07/2020 1 EUR - N T2 Y 0 1AGRICOLE (BELGIUM)
- S.A. CREDIT 01/08/2010 01/08/2020 2 EUR - N T2 Y 0 2AGRICOLE (BELGIUM)
- S.A. CREDIT 01/09/2010 01/09/2020 24 EUR - N T2 Y 0 24AGRICOLE (BELGIUM)
- S.A. CREDIT 01/10/2010 01/10/2020 55 EUR - N T2 Y 0 54AGRICOLE ((BELGIUM)
- S.A. CREDIT 01/11/2010 01/11/2020 5 EUR - N T2 Y 0 5AGRICOLE (BELGIUM)
- S.A. CREDIT 01/12/2010 01/12/2020 1 EUR - N T2 Y 0 1AGRICOLE (BELGIUM)
- S.A. CREDIT 01/01/2011 01/01/2021 1 EUR - N T2 Y 0 1AGRICOLE (BELGIUM)
- S.A. CREDIT 01/02/2011 01/02/2021 1 EUR - N T2 Y 0 1AGRICOLE (BELGIUM)
- S.A. CREDIT 01/03/2011 01/03/2021 12 EUR - N T2 Y 0 12AGRICOLE (BELGIUM)
- S.A. CREDIT 01/04/2011 01/04/2021 5 EUR - N T2 Y 0 5AGRICOLE (BELGIUM)
- S.A. CREDIT 01/05/2011 01/05/2021 9 EUR - N T2 Y 0 9AGRICOLE (BELGIUM)
- S.A. CREDIT 01/06/2011 01/06/2021 3 EUR - N T2 Y 0 3AGRICOLE (BELGIUM)
- S.A. CREDIT 01/07/2011 01/07/2021 3 EUR - N T2 Y 0 3AGRICOLE (BELGIUM)
- S.A. CREDIT 01/08/2011 01/08/2021 4 EUR - N T2 Y 0 4AGRICOLE (BELGIUM)
- S.A. CREDIT 01/09/2011 01/09/2021 2 EUR - N T2 Y 0 2AGRICOLE (BELGIUM)
- S.A. CREDIT 01/10/2011 01/10/2021 3 EUR - N T2 Y 0 2AGRICOLE (BELGIUM)
109CRÉDIT AGRICOLE S.A. UPDATE A01 OF THE 2014 REGISTRATION DOCUMENT
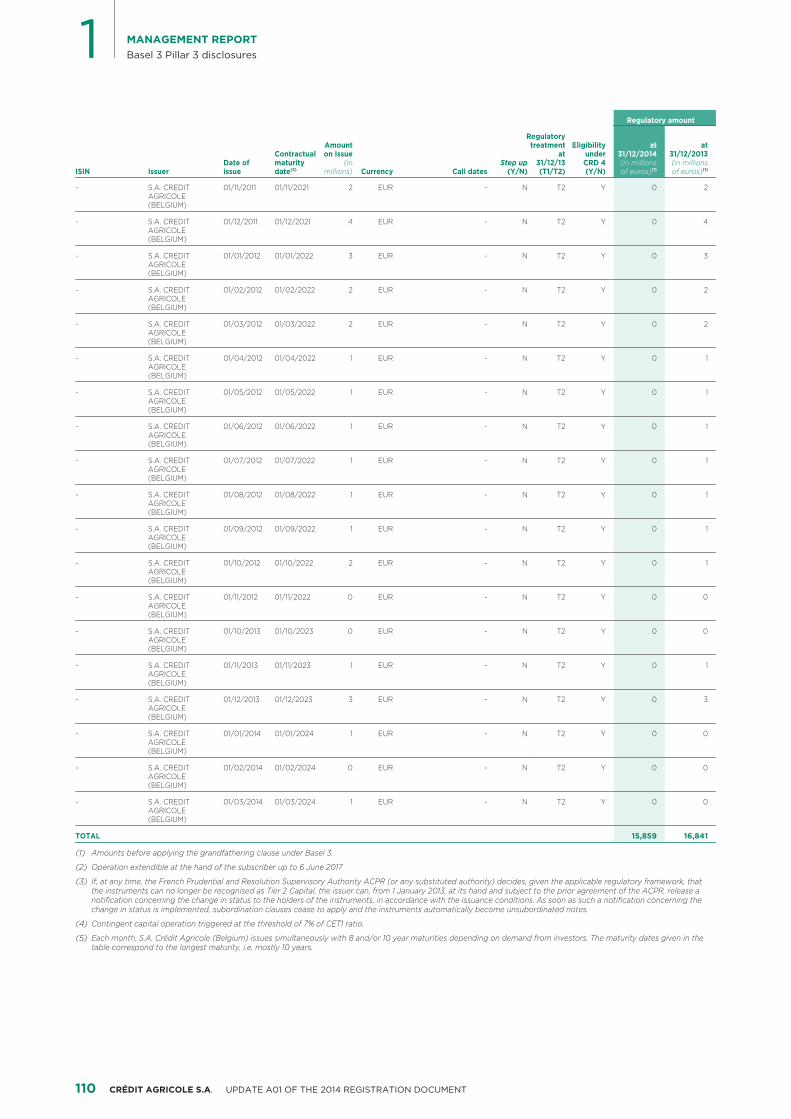
1 MANAGEMENT REPORTBasel 3 Pillar 3 disclosures
Regulatory amount
RegulatoryAmount Eligibility at attreatment
Contractual on Issue at under 31/12/2014 31/12/2013Date of Step upmaturity (in 31/12/13 CRD 4 (in millions (in millions
ISIN Issuer Currency Call datesissue date(5) millions) (Y/N) (T1/T2) (Y/N) of euros)(1) of euros)(1)
- S.A. CREDIT 01/11/2011 01/11/2021 2 EUR - N T2 Y 0 2AGRICOLE (BELGIUM)
- S.A. CREDIT 01/12/2011 01/12/2021 4 EUR - N T2 Y 0 4AGRICOLE (BELGIUM)
- S.A. CREDIT 01/01/2012 01/01/2022 3 EUR - N T2 Y 0 3AGRICOLE (BELGIUM)
- S.A. CREDIT 01/02/2012 01/02/2022 2 EUR - N T2 Y 0 2AGRICOLE (BELGIUM)
- S.A. CREDIT 01/03/2012 01/03/2022 2 EUR - N T2 Y 0 2AGRICOLE (BELGIUM)
- S.A. CREDIT 01/04/2012 01/04/2022 1 EUR - N T2 Y 0 1AGRICOLE (BELGIUM)
- S.A. CREDIT 01/05/2012 01/05/2022 1 EUR - N T2 Y 0 1AGRICOLE (BELGIUM)
- S.A. CREDIT 01/06/2012 01/06/2022 1 EUR - N T2 Y 0 1AGRICOLE (BELGIUM)
- S.A. CREDIT 01/07/2012 01/07/2022 1 EUR - N T2 Y 0 1AGRICOLE (BELGIUM)
- S.A. CREDIT 01/08/2012 01/08/2022 1 EUR - N T2 Y 0 1AGRICOLE (BELGIUM)
- S.A. CREDIT 01/09/2012 01/09/2022 1 EUR - N T2 Y 0 1AGRICOLE (BELGIUM)
- S.A. CREDIT 01/10/2012 01/10/2022 2 EUR - N T2 Y 0 1AGRICOLE (BELGIUM)
- S.A. CREDIT 01/11/2012 01/11/2022 0 EUR - N T2 Y 0 0AGRICOLE (BELGIUM)
- S.A. CREDIT 01/10/2013 01/10/2023 0 EUR - N T2 Y 0 0AGRICOLE (BELGIUM)
- S.A. CREDIT 01/11/2013 01/11/2023 1 EUR - N T2 Y 0 1AGRICOLE (BELGIUM)
- S.A. CREDIT 01/12/2013 01/12/2023 3 EUR - N T2 Y 0 3AGRICOLE (BELGIUM)
- S.A. CREDIT 01/01/2014 01/01/2024 1 EUR - N T2 Y 0 0AGRICOLE (BELGIUM)
- S.A. CREDIT 01/02/2014 01/02/2024 0 EUR - N T2 Y 0 0AGRICOLE (BELGIUM)
- S.A. CREDIT 01/03/2014 01/03/2024 1 EUR - N T2 Y 0 0AGRICOLE (BELGIUM)
TOTAL 15,859 16,841
Amounts before applying the grandfathering clause under Basel 3.(1)
Operation extendible at the hand of the subscriber up to 6 June 2017(2)
If, at any time, the French Prudential and Resolution Supervisory Authority ACPR (or any substituted authority) decides, given the applicable regulatory framework, that (3)the instruments can no longer be recognised as Tier 2 Capital, the issuer can, from 1 January 2013, at its hand and subject to the prior agreement of the ACPR, release a notification concerning the change in status to the holders of the instruments, in accordance with the issuance conditions. As soon as such a notification concerning the change in status is implemented, subordination clauses cease to apply and the instruments automatically become unsubordinated notes.
Contingent capital operation triggered at the threshold of 7% of CET1 ratio.(4)
Each month, S.A. Crédit Agricole (Belgium) issues simultaneously with 8 and/or 10 year maturities depending on demand from investors. The maturity dates given in the (5)table correspond to the longest maturity, i.e. mostly 10 years.
110 CRÉDIT AGRICOLE S.A. UPDATE A01 OF THE 2014 REGISTRATION DOCUMENT
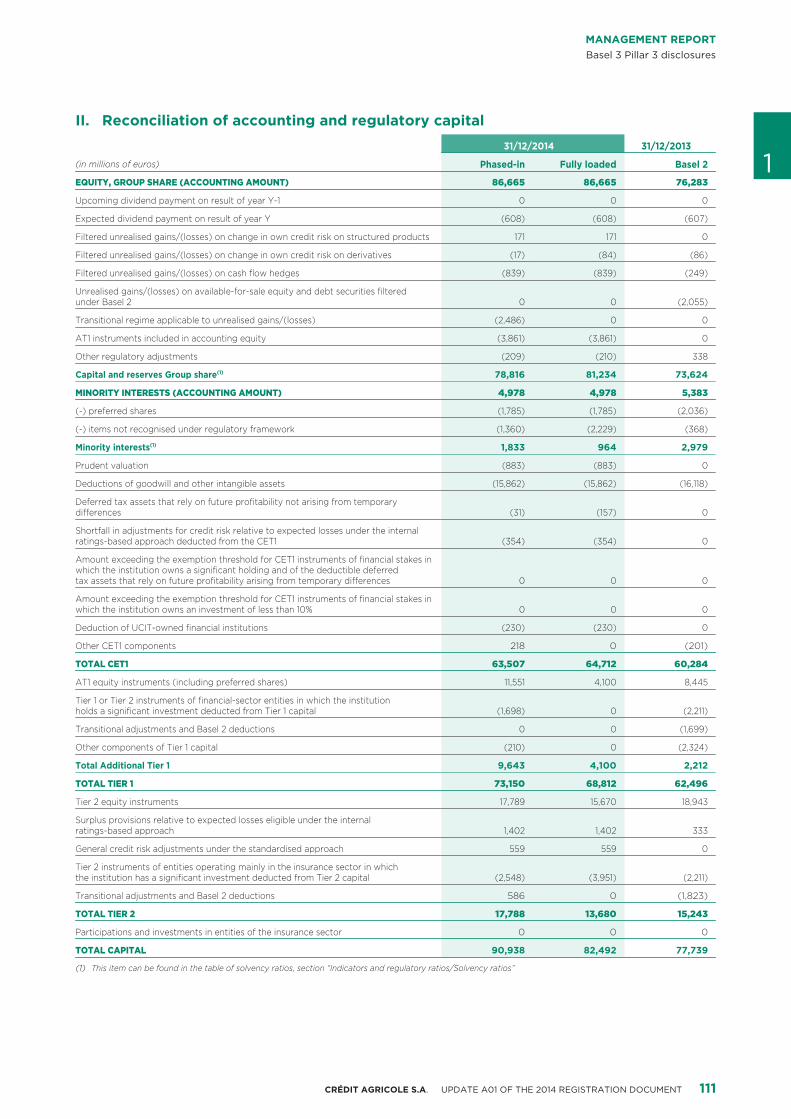
MANAGEMENT REPORTBasel 3 Pillar 3 disclosures
Reconciliation of accounting and regulatory capitalII.
31/12/2014 31/12/2013
1Phased-in Fully loaded Basel 2(in millions of euros)
EQUITY, GROUP SHARE (ACCOUNTING AMOUNT) 86,665 86,665 76,283
Upcoming dividend payment on result of year Y-1 0 0 0
Expected dividend payment on result of year Y (608) (608) (607)
Filtered unrealised gains/(losses) on change in own credit risk on structured products 171 171 0
Filtered unrealised gains/(losses) on change in own credit risk on derivatives (17) (84) (86)
Filtered unrealised gains/(losses) on cash flow hedges (839) (839) (249)
Unrealised gains/(losses) on available-for-sale equity and debt securities filtered 0 0 (2,055)under Basel 2
Transitional regime applicable to unrealised gains/(losses) (2,486) 0 0
AT1 instruments included in accounting equity (3,861) (3,861) 0
Other regulatory adjustments (209) (210) 338
Capital and reserves Group share(1) 78,816 81,234 73,624
MINORITY INTERESTS (ACCOUNTING AMOUNT) 4,978 4,978 5,383
(-) preferred shares (1,785) (1,785) (2,036)
(-) items not recognised under regulatory framework (1,360) (2,229) (368)
Minority interests(1) 1,833 964 2,979
Prudent valuation (883) (883) 0
Deductions of goodwill and other intangible assets (15,862) (15,862) (16,118)
Deferred tax assets that rely on future profitability not arising from temporary (31) (157) 0differences
Shortfall in adjustments for credit risk relative to expected losses under the internal (354) (354) 0ratings-based approach deducted from the CET1
Amount exceeding the exemption threshold for CET1 instruments of financial stakes in which the institution owns a significant holding and of the deductible deferred
0 0 0tax assets that rely on future profitability arising from temporary differences
Amount exceeding the exemption threshold for CET1 instruments of financial stakes in 0 0 0which the institution owns an investment of less than 10%
Deduction of UCIT-owned financial institutions (230) (230) 0
Other CET1 components 218 0 (201)
TOTAL CET1 63,507 64,712 60,284
AT1 equity instruments (including preferred shares) 11,551 4,100 8,445
Tier 1 or Tier 2 instruments of financial-sector entities in which the institution (1,698) 0 (2,211)holds a significant investment deducted from Tier 1 capital
Transitional adjustments and Basel 2 deductions 0 0 (1,699)
Other components of Tier 1 capital (210) 0 (2,324)
Total Additional Tier 1 9,643 4,100 2,212
TOTAL TIER 1 73,150 68,812 62,496
Tier 2 equity instruments 17,789 15,670 18,943
Surplus provisions relative to expected losses eligible under the internal 1,402 1,402 333ratings-based approach
General credit risk adjustments under the standardised approach 559 559 0
Tier 2 instruments of entities operating mainly in the insurance sector in which (2,548) (3,951) (2,211)the institution has a significant investment deducted from Tier 2 capital
Transitional adjustments and Basel 2 deductions 586 0 (1,823)
TOTAL TIER 2 17,788 13,680 15,243
Participations and investments in entities of the insurance sector 0 0 0
TOTAL CAPITAL 90,938 82,492 77,739
This item can be found in the table of solvency ratios, section “Indicators and regulatory ratios/Solvency ratios”(1)
111CRÉDIT AGRICOLE S.A. UPDATE A01 OF THE 2014 REGISTRATION DOCUMENT
1 MANAGEMENT REPORTBasel 3 Pillar 3 disclosures
Assessment of internal capital III. Internal capital exposure to retail banking credit risk is calculatedon the basis of measurements based on macro-economic scenarios,adequacy the severity of which is graded in line with the Group’s target rating.This approach is being progressively extended to entities locatedThe Group has implemented an internal capital adequacyoutside France.assessment system covering Crédit Agricole Group,
Crédit Agricole S.A. Group and the Group’s main French and For market risk, which is monitored through VaR, internal capitalforeign entities. This approach is designed to meet the fully integrates regulatory developments under Pillar 1 (stressedrequirements of Pillar 2 of the Basel agreement, and more VaR, IRC). The horizon of capital measurement is made consistentparticularly the Internal Capital Adequacy Assessment Process with that used for other risks.(ICAAP), implemented under the responsibility of individual
In calculating internal capital for interest rate risk in the bankinginstitutions.portfolio, Crédit Agricole S.A. Group applies interest rate and
Its main purpose is to ensure that the Group’s capital, calculated at inflation shocks, the severity of which is graded in line with thethe level of the financial conglomerate, and that of its main entities, Group’s target rating. In respect of the interest rate shocks applied,is adequate for the risks incurred, while ensuring the quality of risk impacts on all directional, optional and behavioural risks arecontrols and checks. measured for each of the significant currencies. The calculation of
internal capital also includes the offsetting impact provided by theThe risks quantified for the purposes of internal capital are:lesser of (i) annual net interest margin and (ii) annual gross
risks covered by Pillar 1 (credit and counterparty risk, market risk■ operating income, capped at 20% of equity.and operational risk);
Insurance risks are taken into account in the Group’s internal capitalrisks covered by Pillar 2 (interest-rate risk in the banking■ based on the measures taken under the current and future regimesportfolio and credit concentration risk); applicable to insurance companies (Solvency 1, Solvency 2).insurance risks.■ Diversification between risks is measured by an internal model to
quantify the correlations between the different classes of risk. TheyWith respect to liquidity risk, the Group ensures the quality of thewere updated in 2013 to reflect the sovereign debt crisis in thesystems used to manage and supervise this risk, as well as theEurozone.appropriateness of its liquidity continuity plan.
A prospective approach is implemented to measure internal capitalIn addition to these risks, the internal capital approach requiresrequirements, so as to integrate the effects of the Basel 3 reform,banks to ensure that their capital requirements calculated underboth for the calculation of available capital and for measuringPillar 1 adequately cover all residual risk related to risk mitigationcapital requirements.techniques and securitisation transactions. Failing that, for internal
capital purposes, a risk adjustment to Pillar 1 requirements must be Crédit Agricole Group entities subject to the requirement tomade by any entities exposed to these risks. measure internal capital within their scope are responsible for doing
so in accordance with standards and methodologies defined by theThe quantitative approach used to calculate internal capital isGroup. More specifically, they must ensure that their Icaap isincremental compared with Pillar 1 requirements. Measuresappropriately organised and managed. Internal capital determinedimplemented refer to the target rating of the Group. This approachby the entities is reported in detail to Crédit Agricole S.A.consists in:
In addition to the quantitative aspect, the Group’s approach reliesadjusting capital requirements calculated under Pillar 1 so that■on a qualitative component supplementing the calculation ofinternal capital adequately reflects, from an economicinternal capital with indicators of the business lines’ exposure to riskstandpoint, all the risks in each business activity;and their permanent controls. The qualitative part of the ICAAP has
supplementing Pillar 1 requirements to take Pillar 2 risks into■ three objectives:account;
regularly assess the appropriateness of the risk management■taking into account, on a prudent basis, the impacts of■ and control mechanisms of the Group’s most significant entities;diversification resulting from the broad spread of business
continuously improve the system of risk management and■activities within the same group, including between banking andpermanent control in the business lines;insurance.
complete the analyses in the quantitative section of the ICAAP.■Internal capital for credit risk exposures excluding retail banking isbased on an internal economic capital model, enabling in particulara better comprehension of concentrations in credit portfolios.
112 CRÉDIT AGRICOLE S.A. UPDATE A01 OF THE 2014 REGISTRATION DOCUMENT
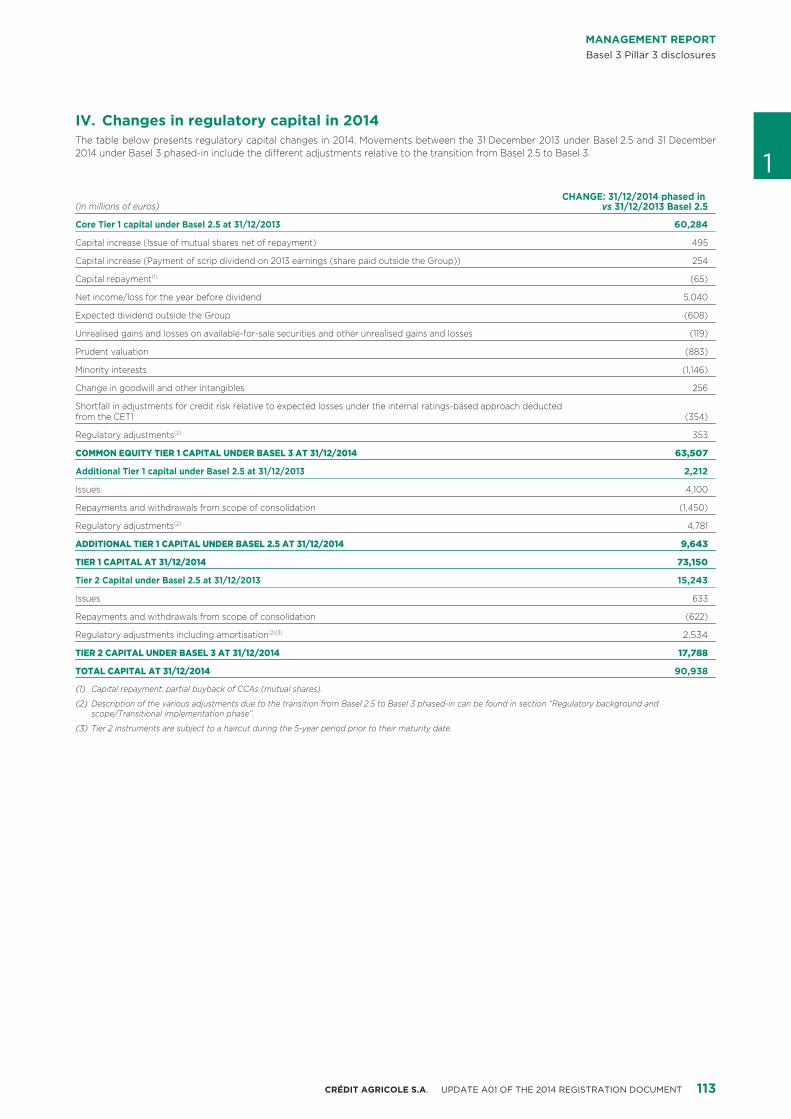
MANAGEMENT REPORTBasel 3 Pillar 3 disclosures
Changes in regulatory capital in 2014IV.The table below presents regulatory capital changes in 2014. Movements between the 31 December 2013 under Basel 2.5 and 31 December2014 under Basel 3 phased-in include the different adjustments relative to the transition from Basel 2.5 to Basel 3. 1
CHANGE: 31/12/2014 phased in (in millions of euros) vs 31/12/2013 Basel 2.5
Core Tier 1 capital under Basel 2.5 at 31/12/2013 60,284
Capital increase (Issue of mutual shares net of repayment) 495
Capital increase (Payment of scrip dividend on 2013 earnings (share paid outside the Group)) 254
Capital repayment(1) (65)
Net income/loss for the year before dividend 5,040
Expected dividend outside the Group (608)
Unrealised gains and losses on available-for-sale securities and other unrealised gains and losses (119)
Prudent valuation (883)
Minority interests (1,146)
Change in goodwill and other intangibles 256
Shortfall in adjustments for credit risk relative to expected losses under the internal ratings-based approach deducted (354)from the CET1
Regulatory adjustments(2) 353
COMMON EQUITY TIER 1 CAPITAL UNDER BASEL 3 AT 31/12/2014 63,507
Additional Tier 1 capital under Basel 2.5 at 31/12/2013 2,212
Issues 4,100
Repayments and withdrawals from scope of consolidation (1,450)
Regulatory adjustments(2) 4,781
ADDITIONAL TIER 1 CAPITAL UNDER BASEL 2.5 AT 31/12/2014 9,643
TIER 1 CAPITAL AT 31/12/2014 73,150
Tier 2 Capital under Basel 2.5 at 31/12/2013 15,243
Issues 633
Repayments and withdrawals from scope of consolidation (622)
Regulatory adjustments including amortisation(2)(3) 2,534
TIER 2 CAPITAL UNDER BASEL 3 AT 31/12/2014 17,788
TOTAL CAPITAL AT 31/12/2014 90,938
Capital repayment: partial buyback of CCAs (mutual shares).(1)
Description of the various adjustments due to the transition from Basel 2.5 to Basel 3 phased-in can be found in section “Regulatory background and (2)scope/Transitional implementation phase”.
Tier 2 instruments are subject to a haircut during the 5-year period prior to their maturity date.(3)
113CRÉDIT AGRICOLE S.A. UPDATE A01 OF THE 2014 REGISTRATION DOCUMENT
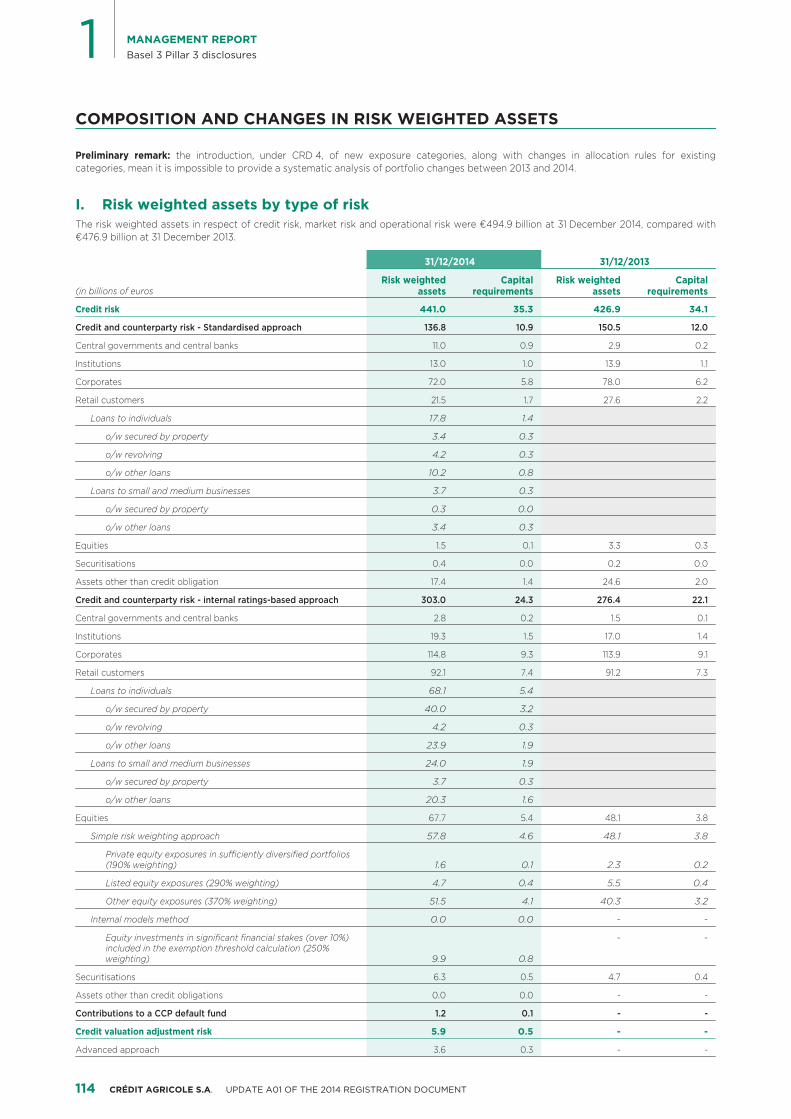
1 MANAGEMENT REPORTBasel 3 Pillar 3 disclosures
COMPOSITION AND CHANGES IN RISK WEIGHTED ASSETS
Preliminary remark: the introduction, under CRD 4, of new exposure categories, along with changes in allocation rules for existingcategories, mean it is impossible to provide a systematic analysis of portfolio changes between 2013 and 2014.
Risk weighted assets by type of riskI.The risk weighted assets in respect of credit risk, market risk and operational risk were €494.9 billion at 31 December 2014, compared with€476.9 billion at 31 December 2013.
31/12/2014 31/12/2013
Risk weighted Capital Risk weighted Capital(in billions of euros assets requirements assets requirements
Credit risk 441.0 35.3 426.9 34.1
Credit and counterparty risk - Standardised approach 136.8 10.9 150.5 12.0
Central governments and central banks 11.0 0.9 2.9 0.2
Institutions 13.0 1.0 13.9 1.1
Corporates 72.0 5.8 78.0 6.2
Retail customers 21.5 1.7 27.6 2.2
Loans to individuals 17.8 1.4
o/w secured by property 3.4 0.3
o/w revolving 4.2 0.3
o/w other loans 10.2 0.8
Loans to small and medium businesses 3.7 0.3
o/w secured by property 0.3 0.0
o/w other loans 3.4 0.3
Equities 1.5 0.1 3.3 0.3
Securitisations 0.4 0.0 0.2 0.0
Assets other than credit obligation 17.4 1.4 24.6 2.0
Credit and counterparty risk - internal ratings-based approach 303.0 24.3 276.4 22.1
Central governments and central banks 2.8 0.2 1.5 0.1
Institutions 19.3 1.5 17.0 1.4
Corporates 114.8 9.3 113.9 9.1
Retail customers 92.1 7.4 91.2 7.3
Loans to individuals 68.1 5.4
o/w secured by property 40.0 3.2
o/w revolving 4.2 0.3
o/w other loans 23.9 1.9
Loans to small and medium businesses 24.0 1.9
o/w secured by property 3.7 0.3
o/w other loans 20.3 1.6
Equities 67.7 5.4 48.1 3.8
Simple risk weighting approach 57.8 4.6 48.1 3.8
Private equity exposures in sufficiently diversified portfolios (190% weighting) 1.6 0.1 2.3 0.2
Listed equity exposures (290% weighting) 4.7 0.4 5.5 0.4
Other equity exposures (370% weighting) 51.5 4.1 40.3 3.2
Internal models method 0.0 0.0 - -
Equity investments in significant financial stakes (over 10%) - -included in the exemption threshold calculation (250% weighting) 9.9 0.8
Securitisations 6.3 0.5 4.7 0.4
Assets other than credit obligations 0.0 0.0 - -
Contributions to a CCP default fund 1.2 0.1 - -
Credit valuation adjustment risk 5.9 0.5 - -
Advanced approach 3.6 0.3 - -
114 CRÉDIT AGRICOLE S.A. UPDATE A01 OF THE 2014 REGISTRATION DOCUMENT
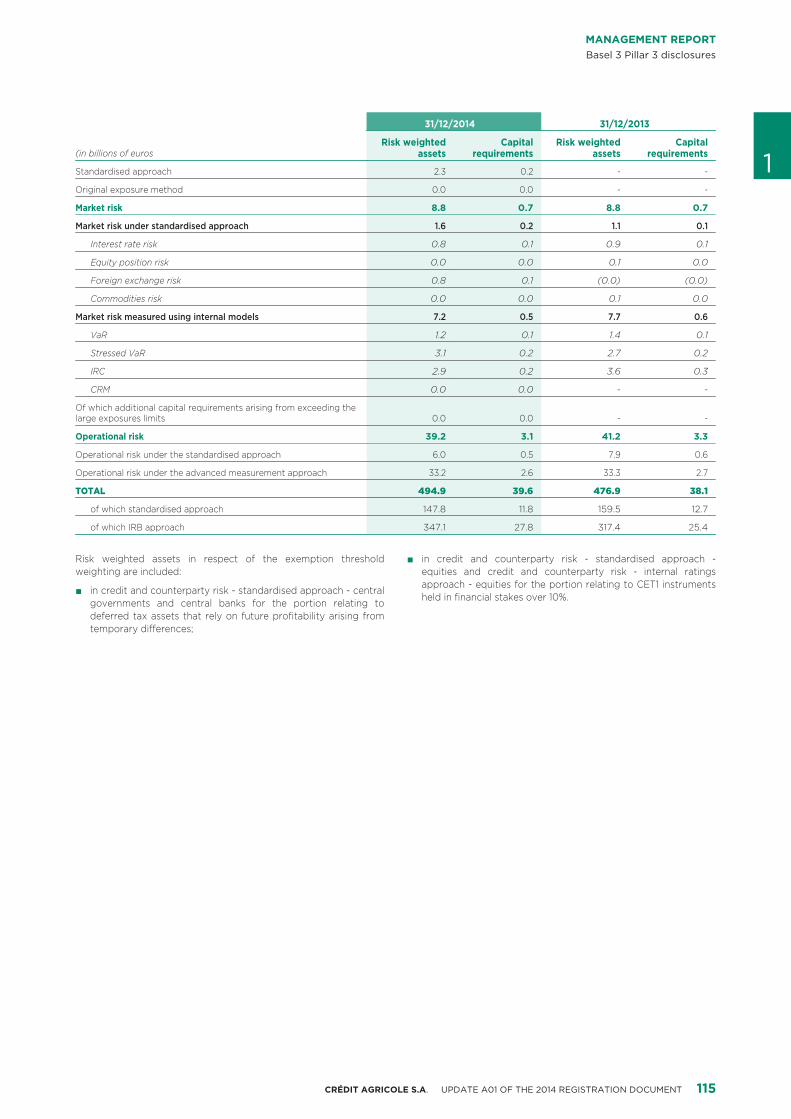
MANAGEMENT REPORTBasel 3 Pillar 3 disclosures
31/12/2014 31/12/2013
Risk weighted Capital Risk weighted Capital(in billions of euros assets requirements assets requirements 1Standardised approach 2.3 0.2 - -
Original exposure method 0.0 0.0 - -
Market risk 8.8 0.7 8.8 0.7
Market risk under standardised approach 1.6 0.2 1.1 0.1
Interest rate risk 0.8 0.1 0.9 0.1
Equity position risk 0.0 0.0 0.1 0.0
Foreign exchange risk 0.8 0.1 (0.0) (0.0)
Commodities risk 0.0 0.0 0.1 0.0
Market risk measured using internal models 7.2 0.5 7.7 0.6
VaR 1.2 0.1 1.4 0.1
Stressed VaR 3.1 0.2 2.7 0.2
IRC 2.9 0.2 3.6 0.3
CRM 0.0 0.0 - -
Of which additional capital requirements arising from exceeding the 0.0 0.0 - -large exposures limits
Operational risk 39.2 3.1 41.2 3.3
Operational risk under the standardised approach 6.0 0.5 7.9 0.6
Operational risk under the advanced measurement approach 33.2 2.6 33.3 2.7
TOTAL 494.9 39.6 476.9 38.1
of which standardised approach 147.8 11.8 159.5 12.7
of which IRB approach 347.1 27.8 317.4 25.4
Risk weighted assets in respect of the exemption threshold in credit and counterparty risk - standardised approach -■weighting are included: equities and credit and counterparty risk - internal ratings
approach - equities for the portion relating to CET1 instrumentsin credit and counterparty risk - standardised approach - central■held in financial stakes over 10%.governments and central banks for the portion relating to
deferred tax assets that rely on future profitability arising fromtemporary differences;
115CRÉDIT AGRICOLE S.A. UPDATE A01 OF THE 2014 REGISTRATION DOCUMENT
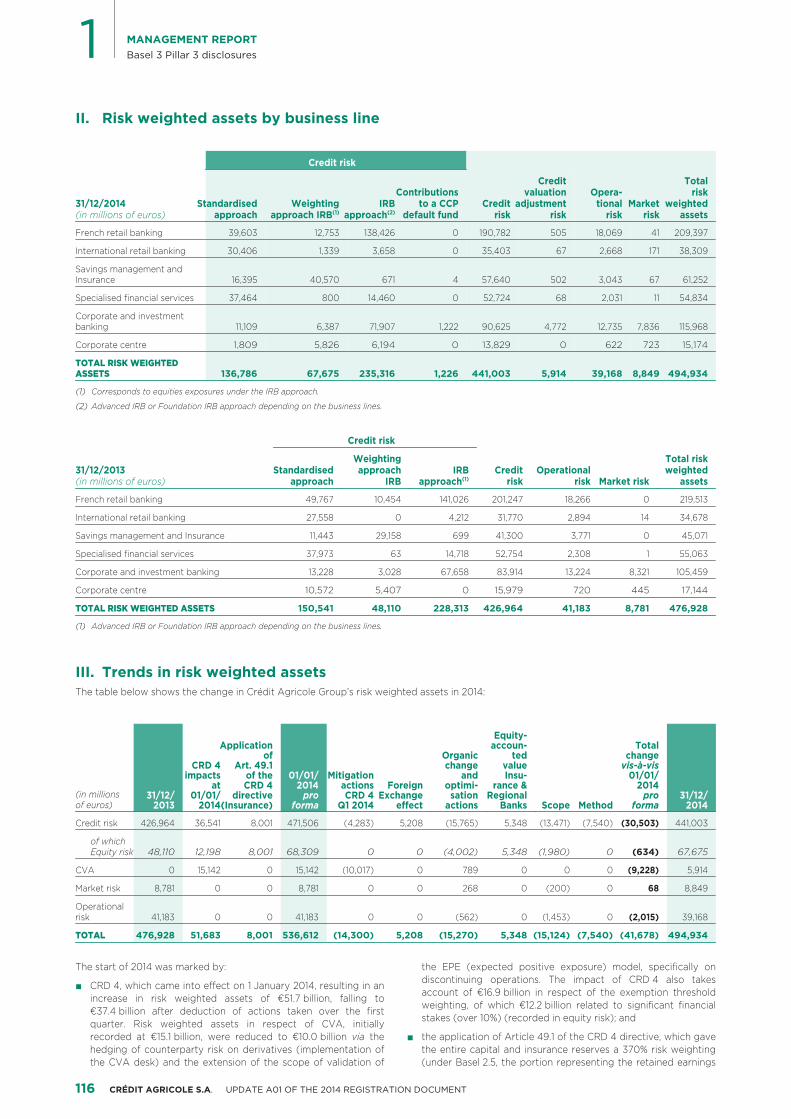
1 MANAGEMENT REPORTBasel 3 Pillar 3 disclosures
Risk weighted assets by business lineII.
Credit risk
Credit TotalContributions Opera-valuation risk
31/12/2014 Standardised Weighting IRB Credit Marketto a CCP adjustment tional weighted(in millions of euros) approach approach IRB(1) approach(2) default fund risk risk risk risk assets
French retail banking 39,603 12,753 138,426 0 190,782 505 18,069 41 209,397
International retail banking 30,406 1,339 3,658 0 35,403 67 2,668 171 38,309
Savings management and 16,395 40,570 671 4 57,640 502 3,043 67 61,252Insurance
Specialised financial services 37,464 800 14,460 0 52,724 68 2,031 11 54,834
Corporate and investment 11,109 6,387 71,907 1,222 90,625 4,772 12,735 7,836 115,968banking
Corporate centre 1,809 5,826 6,194 0 13,829 0 622 723 15,174
TOTAL RISK WEIGHTED 136,786 67,675 235,316 1,226 441,003 5,914 39,168 8,849 494,934ASSETS
Corresponds to equities exposures under the IRB approach.(1)
Advanced IRB or Foundation IRB approach depending on the business lines.(2)
Credit risk
Weighting Total risk31/12/2013 Standardised IRB Credit Operationalapproach weighted
Market risk(in millions of euros) approach IRB approach(1) risk risk assets
French retail banking 49,767 10,454 141,026 201,247 18,266 0 219,513
International retail banking 27,558 0 4,212 31,770 2,894 14 34,678
Savings management and Insurance 11,443 29,158 699 41,300 3,771 0 45,071
Specialised financial services 37,973 63 14,718 52,754 2,308 1 55,063
Corporate and investment banking 13,228 3,028 67,658 83,914 13,224 8,321 105,459
Corporate centre 10,572 5,407 0 15,979 720 445 17,144
TOTAL RISK WEIGHTED ASSETS 150,541 48,110 228,313 426,964 41,183 8,781 476,928
Advanced IRB or Foundation IRB approach depending on the business lines.(1)
Trends in risk weighted assetsIII.The table below shows the change in Crédit Agricole Group’s risk weighted assets in 2014:
Equity-Application Totalaccoun-
Organicof ted changeCRD 4 Art. 49.1 change value vis-à-vis
01/01/ Mitigationimpacts of the and Insu- 01/01/Foreignat CRD 4 2014 actions optimi- rance & 2014
(in millions 31/12/ 31/12/01/01/ directive pro CRD 4 Exchange sation Regional proScope Method2013 2014(Insurance) forma Q1 2014 effect actions Banks forma 2014of euros)
Credit risk 426,964 36,541 8,001 471,506 (4,283) 5,208 (15,765) 5,348 (13,471) (7,540) (30,503) 441,003
of which 48,110 12,198 8,001 68,309 0 0 (4,002) 5,348 (1,980) 0 (634) 67,675Equity risk
CVA 0 15,142 0 15,142 (10,017) 0 789 0 0 0 (9,228) 5,914
Market risk 8,781 0 0 8,781 0 0 268 0 (200) 0 68 8,849
Operational 41,183 0 0 41,183 0 0 (562) 0 (1,453) 0 (2,015) 39,168risk
TOTAL 476,928 51,683 8,001 536,612 (14,300) 5,208 (15,270) 5,348 (15,124) (7,540) (41,678) 494,934
The start of 2014 was marked by: the EPE (expected positive exposure) model, specifically ondiscontinuing operations. The impact of CRD 4 also takesCRD 4, which came into effect on 1 January 2014, resulting in an■account of €16.9 billion in respect of the exemption thresholdincrease in risk weighted assets of €51.7 billion, falling toweighting, of which €12.2 billion related to significant financial€37.4 billion after deduction of actions taken over the firststakes (over 10%) (recorded in equity risk); andquarter. Risk weighted assets in respect of CVA, initially
recorded at €15.1 billion, were reduced to €10.0 billion via the the application of Article 49.1 of the CRD 4 directive, which gave■hedging of counterparty risk on derivatives (implementation of the entire capital and insurance reserves a 370% risk weightingthe CVA desk) and the extension of the scope of validation of (under Basel 2.5, the portion representing the retained earnings
116 CRÉDIT AGRICOLE S.A. UPDATE A01 OF THE 2014 REGISTRATION DOCUMENT
MANAGEMENT REPORTBasel 3 Pillar 3 disclosures
was not weighted but deducted from Tier 1), leading to an the disposal of Newedge, BNI Madagascar, Crédit Agricole■
impact of +€8.0 billion. Bulgaria and CAL Hellas for a total impact of -€6.2 billion;
As such, pro forma risk weighted assets at 1 January 2014 stood at Crelan equity-accounting in the context of the planned■
1€536.6 billion. disposal of this entity for an impact of -€6.9 billion;
Since 1 January 2014, and following the actions taken in the first the deconsolidation of BES and the impact of the■
quarter, Basel 3 risk weighted assets fell by €27.4 billion, to stand at depreciation of its equity-accounted value to zero for an€494.9 billion at 31 December 2014. This 5.2% fall is due in essence impact of -€2 billion;to: the increase in the equity-accounted value of investments, of■
the appreciation of the US Dollar, leading to an increase in risk■ which €5.3 billion in respect of insurance ; andweighted assets of €5.2 billion; methodological developments with a global impact of■organic change that incorporates impacts due to amortisation of■ -€7.5 billion (switch to Foundation IRB in Regional Banks' andCrédit Agricole CIB’s discontinuing operations and all regulatory LCL’s SMEs portfolio and changes to the probability of defaultoptimisation measures; on the Corporates portfolio in Corporate and investment
banking).changes in scope : ■
CREDIT RISK
Exposure to credit riskI. Exposures using the IRB approachCredit exposures are classified by counterparty type and financialDefinitions:product type, based on the seven exposure classes shown in the
probability of default (PD): the probability that a counterparty■ table below and set out in Article 147 of Regulation (EU) 575/2013will default within a period of one year; of 26 June 2013 on capital requirements applicable to credit
institutions and investment firms:exposure at default (EAD): exposure amount in the event of■default. The concept of exposure encompasses balance sheet in addition to exposures to Central governments or central■assets plus a proportion of off-balance sheet commitments; banks, the Central government or central banks class includes
exposures to certain regional and local authorities and publicloss given default (LGD): ratio between the loss incurred upon■sector agencies that are treated as central governmentcounterparty default and the amount of the exposure at theagencies, as well as multilateral development banks andtime of default;international organisations;
gross exposure: amount of the exposure (balance sheet■the Institutions class comprises exposure to credit institutions■+ off-balance sheet), after the impacts of netting and before theand investment firms, including those recognised in otherapplication of any credit risk mitigation techniques (guaranteescountries. It also includes some exposures to regional and localand collateral) and the credit conversion factor (CCF);authorities, public sector agencies and multilateral development
credit conversion factor (CCF): ratio between the unused■ banks that are not classified under central governments;portion of a commitment that will be drawn and at risk at the
the Corporates class is divided into large corporates and small■time of default and the unused portion of the commitmentand medium-sized businesses, which are subject to differentcalculated on the basis of the authorised limit or, whereregulatory treatments;applicable, the unauthorised limit if higher;
the Retail customer class is broken down into loans secured by■expected losses (EL): the amount of the average loss the bank■property granted to individuals and to small and mediumexpects to have to recognise in its loan book within one year;businesses, revolving credits, other loans granted to individuals
risk weighted assets (RWA): risk weighted assets are calculated■ and to small and medium businesses;by applying a weighting ratio to each exposure. The ratio is a
the Equity class comprises exposures that convey a residual,■function of the characteristics of the exposure and thesubordinated claim on the assets or income of the issuer or havecalculation method used (IRB or standardised);a similar economic substance;
valuation adjustments: impairment losses on a specific asset■the Securitisation class includes exposures to securitisation■due to credit risk, recognised either through a partialoperations or structures, including those resulting from interestwrite-down or a deduction from the carrying amount of therate or exchange rate derivatives, independently of theasset;institution’s role (whether it is the originator, sponsor or
external credit ratings: credit ratings provided by an external■ investor);credit rating agency recognised by Regulation (EC)
the Assets other than credit obligations class does not currently■no. 1060/2009.show any assets using the internal rating-based (IRB) approach.
Exposures using the standardised approach In accordance with the regulatory rules in effect, risk weightedThe exposure classes under the standardised approach are assets in the Central governments and central banks, Institutions,classified by counterparty type and financial product type, in one of Corporate and Retail customers classes are calculated by applyingthe 17 classes set out in Article 112 of Regulation (EU) 575/2013 of a prescribed formula, the main parameters of which are the EAD,26 June 2013. The weightings applied to these same assets are PD, LGD and the maturity associated with each exposure:calculated in accordance with Articles 114 to 134 of said Regulation.
for exposures to Large customers (Central governments and■In the tables below, 17 standardised exposure classes are then central banks, Institutions and Corporates), the formula is givenpooled to ensure presentation in alignment with IRB exposures. in Article 153 of EU Regulation 575/2013 of 26 June 2013;
117CRÉDIT AGRICOLE S.A. UPDATE A01 OF THE 2014 REGISTRATION DOCUMENT
1 MANAGEMENT REPORTBasel 3 Pillar 3 disclosures
for exposures to Retail customers, the formula is given in■ position in the cycle: as GDP growth cycles are not synchronous■Article 154 of EU Regulation 575/2013 of 26 June 2013. in all countries in which the Group operates, the PD and LGD
parameters do not necessarily follow the same trend for allRisk weighted assets in the Equities category are calculated bysubsidiaries; for instance, PD and LGD estimates on home loansapplying standardised weightings to the carrying amount of thewill tend to increase for subsidiaries operating in marketsexposures. These weightings, prescribed in Article 155 of Regulationexperiencing or having experienced a real estate crisis, while(EU) 575/2013 of 26 June 2013, are a function of the nature of theremaining stable elsewhere;relevant equities: 190% for private equity exposures in the case of a
diversified portfolio, 290% for exposures to listed equities and demographic and cultural differences: the place of private■370% for all other “Equities” excluding stakes in financial companies property in the culture of a country, the level of per capitaof over 10% included in the exemption threshold calculation (250% income and demographic characteristics are other factorsweighting). influencing risk parameters; accordingly, for instance,
subsidiaries operating in countries in which the population isThe calculation of risk weighted assets in respect of Securitisationbetter off tend to have lower risk weighted assets thanexposures is set out in the dedicated section below.elsewhere, due to the fact that debt-to-income ratios will tend
Risk weighted assets of “Assets other than credit obligations” to be lower.exposures are calculated in accordance with Article 156 of
Products marketed may also vary from one subsidiary to another orRegulation (EU) 575/2013 of 26 June 2013. Parameters used in thefrom one country to another, potentially resulting in divergent riskformulas cited above are estimated using historical default and lossparameters and risk weighted assets for the same type ofdata collected internally by Crédit Agricole Group. It should becustomer. The type of products marketed can influence risknoted that the definition of default used for the calculation of theseparameters in various ways:parameters has a significant influence on the value thereof.
nature of the products: products marketed may be very■Exposure at Default (EAD) is the amount of exposure to adifferent in nature; as such, home loans may vary from onecounterparty at the time of said counterparty’s default. For balancecountry to another as a function of their average maturity or thesheet items, EAD corresponds to exposure net of provisions foraverage ratio between the amount of the loan and the value ofitems covered by the standardised approach to credit risk, and tothe financed property (loan-to-value ratio, LTV); the longer thegross amounts for items covered by internal ratings. In the case ofmaturity or the higher the LTV, the higher the risk parameterslimits and financing commitments not used by the counterparty, aand risk weighted assets;fraction of the total commitment is taken into account by applying
a credit conversion factor (CCF). The CCF is estimated using an business model: Crédit Agricole Group’s business model consists■internal method validated by the supervisory authority for retail in holding loans granted to customers to maturity, whereasbanking portfolios. The Internal CCF is estimated on the basis of the other banking models consist in selling large portions of theiraverage CCF observed in cases of default by class of exposure. For outstanding loans to securitisation vehicles; Crédit Agricoleother portfolios, a standard CCF of 20%, 50% or 100% is applied, Group consequently keeps all home loans on its balance sheet,depending on the nature of the commitment and its term. where they are generally assigned lower risk parameters and
risk weighted assets than other asset classes, resulting in aFor Large customers, default is defined on a customer-by-customerstructurally lower level of average risk weighted assets than forbasis. As a result, it factors in the principle of contagion: anbanks that sell this type of loan;exposure to a defaulting customer causes the classification under
default of all of the said customer’s loans within the entity collateral: loans granted can be secured by collateral or personal■responsible for the uniformity of the rating and all of its loans within guarantees, the value and quality of which will be reflected inCrédit Agricole Group. lower risk parameters than those of unsecured loans.
For Retail customers, the default can be recorded at the level of the In addition, the customer type may also vary significantlytransaction. When applied to the debtor, it factors in the principle depending on the distribution channel used: in the case of revolvingof contagion. Contagion rules are defined and precisely credit, for instance, the customer (and the associated riskdocumented by the entity (joint account, outstandings of parameters) will differ depending on whether the products areindividuals or professionals, notion of risk group, etc.). marketed by Crédit Agricole Group Regional Banks to their
customers or through subsidiaries specialising in consumer credit.Moreover, the historical default and loss data are themselves highlydependent on the characteristics of the products marketed and the The pertinence and reliability of the rating data used aremarkets in which the Group’s various subsidiaries operate. As such, guaranteed by a process consisting in the initial validation andit may be difficult or misleading to compare these parameters subsequent maintenance of internal models based on a structuredbetween each other or to compare risk weighted assets calculated and documented organisation implemented throughout the Groupusing these parameters for a given class of exposure. and involving entities, the Risk Management and Permanent
Controls department and the Audit Group function.Differences in market characteristics may be of various kinds:The set of internal models used in Crédit Agricole Group wasmaturity of the market: risk parameters in respect of Large■presented for approval to the Standards and Methodologycustomers vary significantly depending on whether theCommittee before internal validation by the Group Control function.customer or its reference shareholder is located in a developedThe internal validation is deemed to be a pre-validation, as itor an emerging country; in the former, the rating of thepre-dates the application for formal approval to the Frenchcounterparty will depend solely on the specific characteristics ofPrudential and Resolution Supervisory Authority. The process ofthe customer or its reference shareholder; in the latter, theconstructing and validating an internal rating model requires workrating of the country will be an important factor in the ratingover a period generally spanning three to five years, involving(the rating of a counterparty may only be greater than that ofseveral on-site pre-validation and validation assignments.the country in which it is based in very specific cases; therefore,
the ratings of companies located in emerging markets are After validation, systems governing internal ratings and thegenerally capped by the rating of the country in question); calculation of risk parameters are subject to permanent and
periodic control within each Group entity.structure of the market: as risk parameters vary depending on■the type of products marketed, the risk weighted assets In the following paragraphs, back-testing covers all the methodscalculated on certain products (e.g. home loans) are structurally and procedures used to verify the performance and stability of thelower than those calculated on other products (e.g. consumer internal risk models, specifically by comparing forecasts with actualloans) for the same rating class; consequently, in some countries results.where home loans account for a very significant part of With regard to permanent control, a back-testing Committee hasoutstandings, the risk weighted assets of subsidiaries located in been established within each entity. This Committee (which may,these countries tend to be below the Group average; for some entities, be a specific agenda item for the Risk
118 CRÉDIT AGRICOLE S.A. UPDATE A01 OF THE 2014 REGISTRATION DOCUMENT
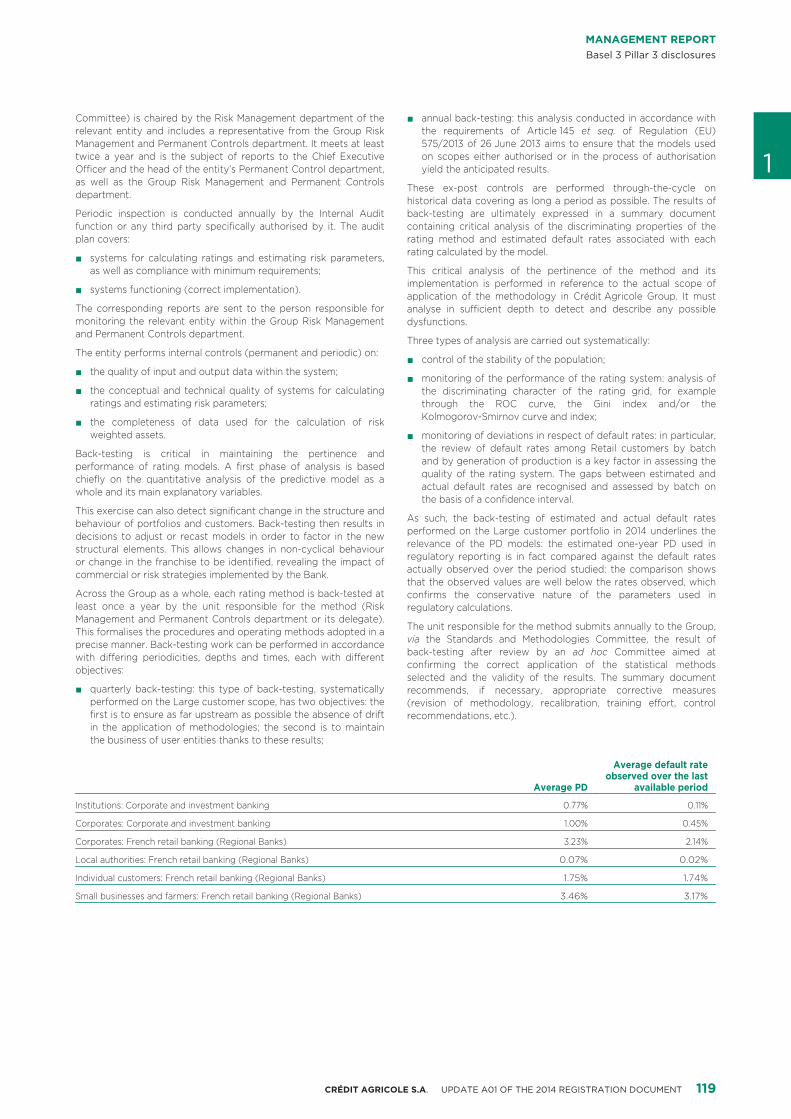
MANAGEMENT REPORTBasel 3 Pillar 3 disclosures
Committee) is chaired by the Risk Management department of the annual back-testing: this analysis conducted in accordance with■relevant entity and includes a representative from the Group Risk the requirements of Article 145 et seq. of Regulation (EU)Management and Permanent Controls department. It meets at least 575/2013 of 26 June 2013 aims to ensure that the models used
1twice a year and is the subject of reports to the Chief Executive on scopes either authorised or in the process of authorisationOfficer and the head of the entity’s Permanent Control department, yield the anticipated results.as well as the Group Risk Management and Permanent Controls These ex-post controls are performed through-the-cycle ondepartment. historical data covering as long a period as possible. The results ofPeriodic inspection is conducted annually by the Internal Audit back-testing are ultimately expressed in a summary documentfunction or any third party specifically authorised by it. The audit containing critical analysis of the discriminating properties of theplan covers: rating method and estimated default rates associated with each
rating calculated by the model.systems for calculating ratings and estimating risk parameters,■as well as compliance with minimum requirements; This critical analysis of the pertinence of the method and its
implementation is performed in reference to the actual scope ofsystems functioning (correct implementation).■application of the methodology in Crédit Agricole Group. It must
The corresponding reports are sent to the person responsible for analyse in sufficient depth to detect and describe any possiblemonitoring the relevant entity within the Group Risk Management dysfunctions.and Permanent Controls department.
Three types of analysis are carried out systematically:The entity performs internal controls (permanent and periodic) on:
control of the stability of the population;■the quality of input and output data within the system;■
monitoring of the performance of the rating system: analysis of■the conceptual and technical quality of systems for calculating■ the discriminating character of the rating grid, for exampleratings and estimating risk parameters; through the ROC curve, the Gini index and/or the
Kolmogorov-Smirnov curve and index;the completeness of data used for the calculation of risk■weighted assets. monitoring of deviations in respect of default rates: in particular,■
the review of default rates among Retail customers by batchBack-testing is critical in maintaining the pertinence andand by generation of production is a key factor in assessing theperformance of rating models. A first phase of analysis is basedquality of the rating system. The gaps between estimated andchiefly on the quantitative analysis of the predictive model as aactual default rates are recognised and assessed by batch onwhole and its main explanatory variables.the basis of a confidence interval.
This exercise can also detect significant change in the structure andAs such, the back-testing of estimated and actual default ratesbehaviour of portfolios and customers. Back-testing then results inperformed on the Large customer portfolio in 2014 underlines thedecisions to adjust or recast models in order to factor in the newrelevance of the PD models: the estimated one-year PD used instructural elements. This allows changes in non-cyclical behaviourregulatory reporting is in fact compared against the default ratesor change in the franchise to be identified, revealing the impact ofactually observed over the period studied: the comparison showscommercial or risk strategies implemented by the Bank.that the observed values are well below the rates observed, which
Across the Group as a whole, each rating method is back-tested at confirms the conservative nature of the parameters used inleast once a year by the unit responsible for the method (Risk regulatory calculations.Management and Permanent Controls department or its delegate).
The unit responsible for the method submits annually to the Group,This formalises the procedures and operating methods adopted in avia the Standards and Methodologies Committee, the result ofprecise manner. Back-testing work can be performed in accordanceback-testing after review by an ad hoc Committee aimed atwith differing periodicities, depths and times, each with differentconfirming the correct application of the statistical methodsobjectives:selected and the validity of the results. The summary document
quarterly back-testing: this type of back-testing, systematically■ recommends, if necessary, appropriate corrective measuresperformed on the Large customer scope, has two objectives: the (revision of methodology, recalibration, training effort, controlfirst is to ensure as far upstream as possible the absence of drift recommendations, etc.).in the application of methodologies; the second is to maintainthe business of user entities thanks to these results;
Average default rateobserved over the last
Average PD available period
Institutions: Corporate and investment banking 0.77% 0.11%
Corporates: Corporate and investment banking 1.00% 0.45%
Corporates: French retail banking (Regional Banks) 3.23% 2.14%
Local authorities: French retail banking (Regional Banks) 0.07% 0.02%
Individual customers: French retail banking (Regional Banks) 1.75% 1.74%
Small businesses and farmers: French retail banking (Regional Banks) 3.46% 3.17%
119CRÉDIT AGRICOLE S.A. UPDATE A01 OF THE 2014 REGISTRATION DOCUMENT
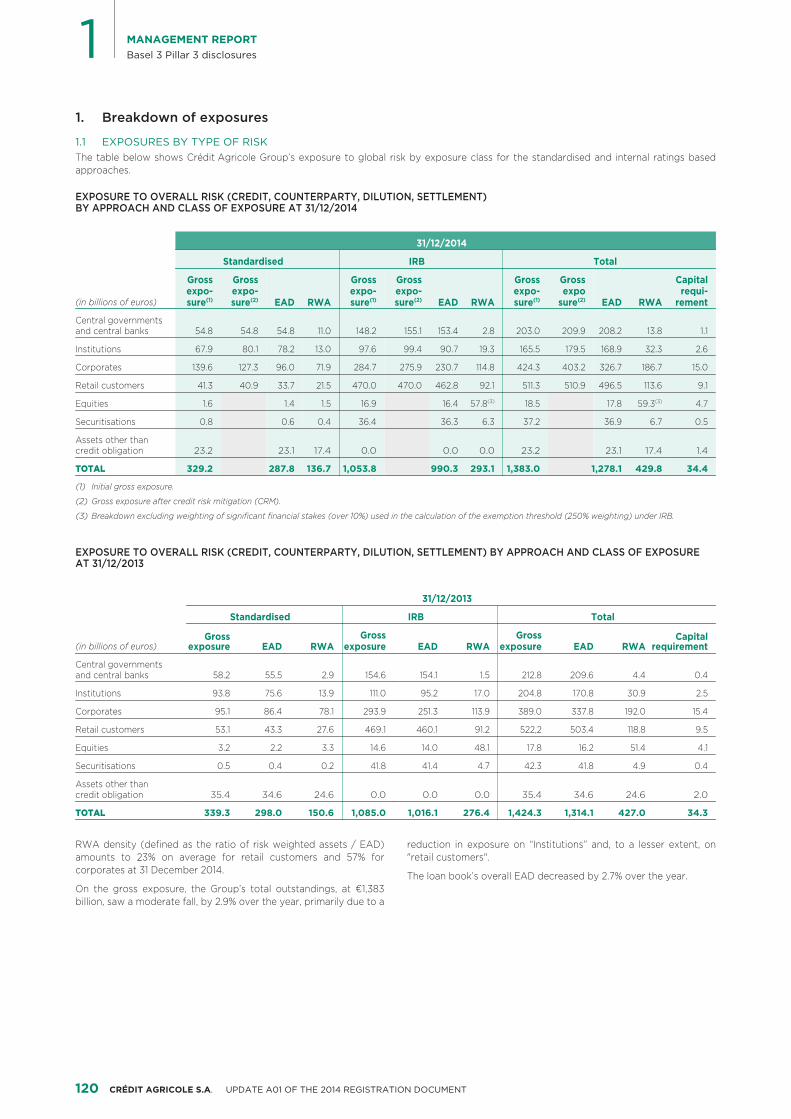
1 MANAGEMENT REPORTBasel 3 Pillar 3 disclosures
Breakdown of exposures1.
EXPOSURES BY TYPE OF RISK1.1The table below shows Crédit Agricole Group’s exposure to global risk by exposure class for the standardised and internal ratings basedapproaches.
EXPOSURE TO OVERALL RISK (CREDIT, COUNTERPARTY, DILUTION, SETTLEMENT) BY APPROACH AND CLASS OF EXPOSURE AT 31/12/2014
31/12/2014
Standardised IRB Total
Gross Gross Gross Gross Gross Gross Capitalexpo- expo- expo- expo- expo- expo requi-
EAD RWA EAD RWA EAD RWA(in billions of euros) sure(1) sure(2) sure(1) sure(2) sure(1) sure(2) rement
Central governments 54.8 54.8 54.8 11.0 148.2 155.1 153.4 2.8 203.0 209.9 208.2 13.8 1.1and central banks
Institutions 67.9 80.1 78.2 13.0 97.6 99.4 90.7 19.3 165.5 179.5 168.9 32.3 2.6
Corporates 139.6 127.3 96.0 71.9 284.7 275.9 230.7 114.8 424.3 403.2 326.7 186.7 15.0
Retail customers 41.3 40.9 33.7 21.5 470.0 470.0 462.8 92.1 511.3 510.9 496.5 113.6 9.1
Equities 1.6 1.4 1.5 16.9 16.4 57.8(3) 18.5 17.8 59.3(3) 4.7
Securitisations 0.8 0.6 0.4 36.4 36.3 6.3 37.2 36.9 6.7 0.5
Assets other than 23.2 23.1 17.4 0.0 0.0 0.0 23.2 23.1 17.4 1.4credit obligation
TOTAL 329.2 287.8 136.7 1,053.8 990.3 293.1 1,383.0 1,278.1 429.8 34.4
Initial gross exposure.(1)
Gross exposure after credit risk mitigation (CRM).(2)
Breakdown excluding weighting of significant financial stakes (over 10%) used in the calculation of the exemption threshold (250% weighting) under IRB.(3)
EXPOSURE TO OVERALL RISK (CREDIT, COUNTERPARTY, DILUTION, SETTLEMENT) BY APPROACH AND CLASS OF EXPOSURE AT 31/12/2013
31/12/2013
Standardised IRB Total
Gross GrossGross CapitalEAD RWA EAD RWA EAD RWA(in billions of euros) exposure exposure exposure requirement
Central governments 58.2 55.5 2.9 154.6 154.1 1.5 212.8 209.6 4.4 0.4and central banks
Institutions 93.8 75.6 13.9 111.0 95.2 17.0 204.8 170.8 30.9 2.5
Corporates 95.1 86.4 78.1 293.9 251.3 113.9 389.0 337.8 192.0 15.4
Retail customers 53.1 43.3 27.6 469.1 460.1 91.2 522,2 503.4 118.8 9.5
Equities 3.2 2.2 3.3 14.6 14.0 48.1 17.8 16.2 51.4 4.1
Securitisations 0.5 0.4 0.2 41.8 41.4 4.7 42.3 41.8 4.9 0.4
Assets other than 35.4 34.6 24.6 0.0 0.0 0.0 35.4 34.6 24.6 2.0credit obligation
TOTAL 339.3 298.0 150.6 1,085.0 1,016.1 276.4 1,424.3 1,314.1 427.0 34.3
RWA density (defined as the ratio of risk weighted assets / EAD) reduction in exposure on “Institutions” and, to a lesser extent, onamounts to 23% on average for retail customers and 57% for "retail customers".corporates at 31 December 2014. The loan book’s overall EAD decreased by 2.7% over the year.On the gross exposure, the Group’s total outstandings, at €1,383billion, saw a moderate fall, by 2.9% over the year, primarily due to a
120 CRÉDIT AGRICOLE S.A. UPDATE A01 OF THE 2014 REGISTRATION DOCUMENT
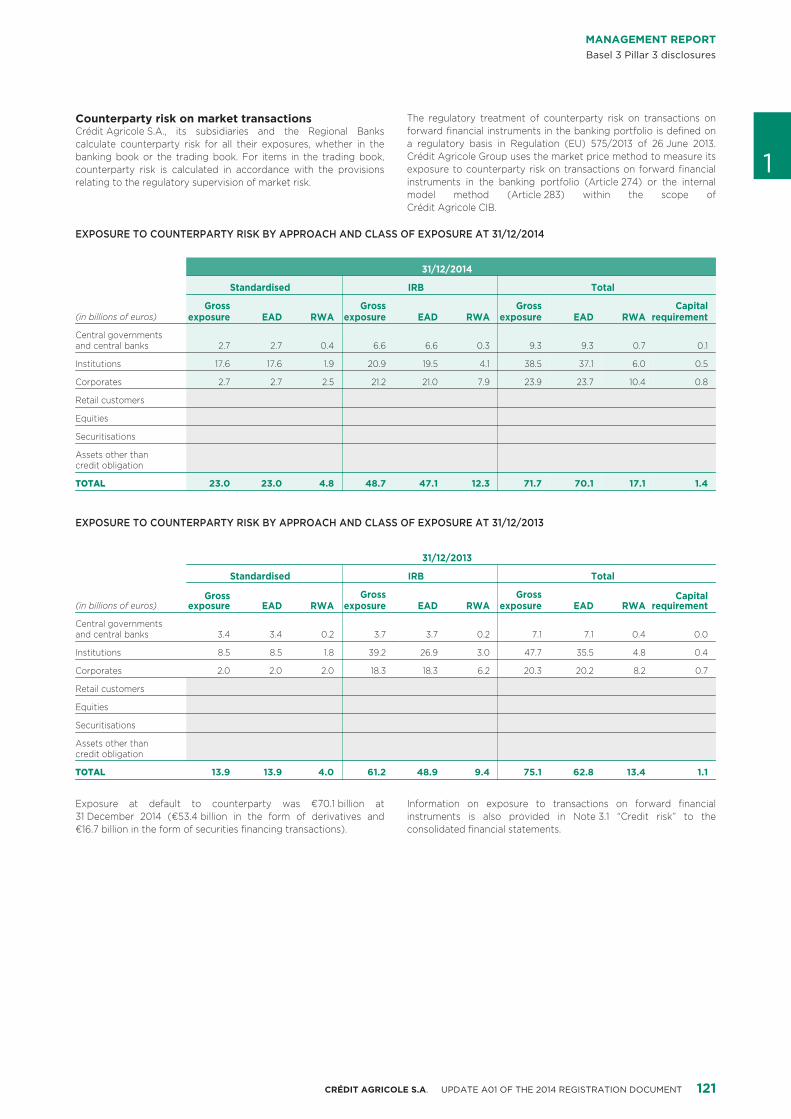
MANAGEMENT REPORTBasel 3 Pillar 3 disclosures
Counterparty risk on market transactions The regulatory treatment of counterparty risk on transactions onforward financial instruments in the banking portfolio is defined onCrédit Agricole S.A., its subsidiaries and the Regional Banksa regulatory basis in Regulation (EU) 575/2013 of 26 June 2013.calculate counterparty risk for all their exposures, whether in the
1Crédit Agricole Group uses the market price method to measure itsbanking book or the trading book. For items in the trading book,exposure to counterparty risk on transactions on forward financialcounterparty risk is calculated in accordance with the provisionsinstruments in the banking portfolio (Article 274) or the internalrelating to the regulatory supervision of market risk.model method (Article 283) within the scope ofCrédit Agricole CIB.
EXPOSURE TO COUNTERPARTY RISK BY APPROACH AND CLASS OF EXPOSURE AT 31/12/2014
31/12/2014
Standardised IRB Total
Gross Gross Gross CapitalEAD RWA EAD RWA EAD RWA(in billions of euros) exposure exposure exposure requirement
Central governments 2.7 2.7 0.4 6.6 6.6 0.3 9.3 9.3 0.7 0.1and central banks
Institutions 17.6 17.6 1.9 20.9 19.5 4.1 38.5 37.1 6.0 0.5
Corporates 2.7 2.7 2.5 21.2 21.0 7.9 23.9 23.7 10.4 0.8
Retail customers
Equities
Securitisations
Assets other than credit obligation
TOTAL 23.0 23.0 4.8 48.7 47.1 12.3 71.7 70.1 17.1 1.4
EXPOSURE TO COUNTERPARTY RISK BY APPROACH AND CLASS OF EXPOSURE AT 31/12/2013
31/12/2013
Standardised IRB Total
Gross GrossGross CapitalEAD RWA EAD RWA EAD RWA(in billions of euros) exposure exposure exposure requirement
Central governments 3.4 3.4 0.2 3.7 3.7 0.2 7.1 7.1 0.4 0.0and central banks
Institutions 8.5 8.5 1.8 39.2 26.9 3.0 47.7 35.5 4.8 0.4
Corporates 2.0 2.0 2.0 18.3 18.3 6.2 20.3 20.2 8.2 0.7
Retail customers
Equities
Securitisations
Assets other than credit obligation
TOTAL 13.9 13.9 4.0 61.2 48.9 9.4 75.1 62.8 13.4 1.1
Exposure at default to counterparty was €70.1 billion at Information on exposure to transactions on forward financial31 December 2014 (€53.4 billion in the form of derivatives and instruments is also provided in Note 3.1 “Credit risk” to the€16.7 billion in the form of securities financing transactions). consolidated financial statements.
121CRÉDIT AGRICOLE S.A. UPDATE A01 OF THE 2014 REGISTRATION DOCUMENT
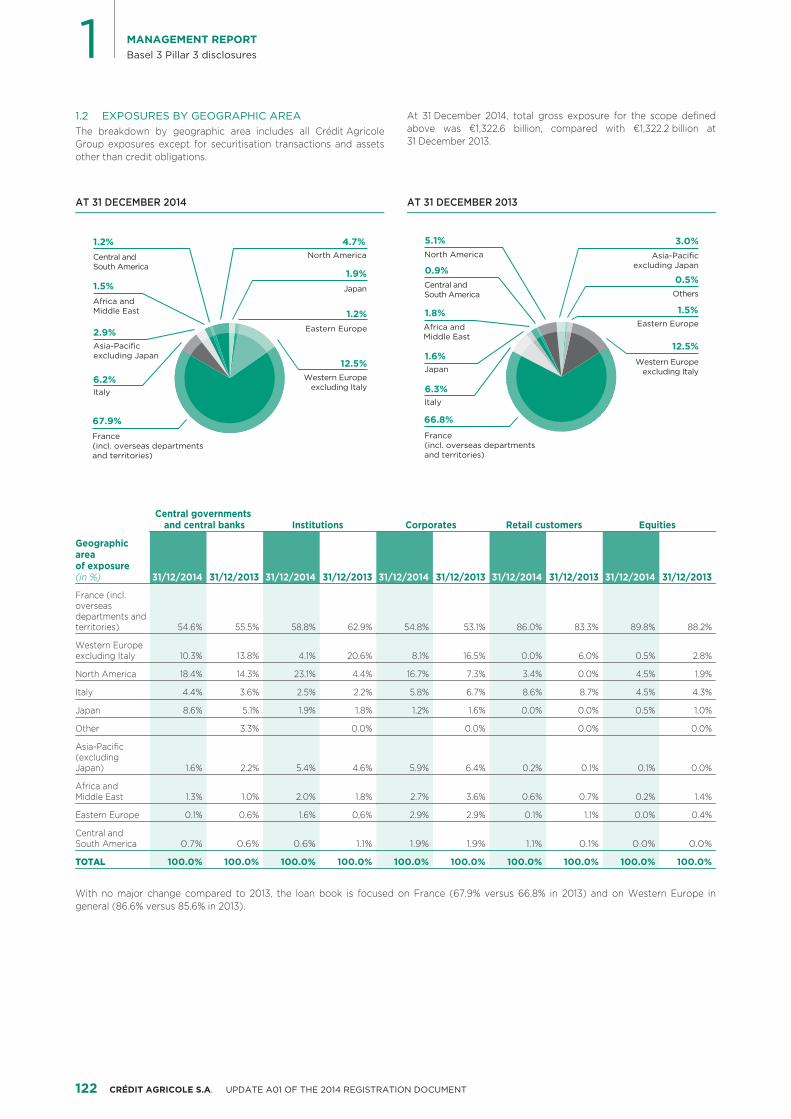
1 MANAGEMENT REPORTBasel 3 Pillar 3 disclosures
EXPOSURES BY GEOGRAPHIC AREA1.2 At 31 December 2014, total gross exposure for the scope definedabove was €1,322.6 billion, compared with €1,322.2 billion atThe breakdown by geographic area includes all Crédit Agricole31 December 2013.Group exposures except for securitisation transactions and assets
other than credit obligations.
AT 31 DECEMBER 2014 AT 31 DECEMBER 2013
2.9%Asia-Pacificexcluding Japan
1.2%
Western Europeexcluding Italy
12.5%
Eastern Europe
1.9%Japan1.5%
Africa andMiddle East
1.2%Central andSouth America
67.9%France(incl. overseas departmentsand territories)
4.7%North America
6.2%Italy
3.0%
12.5%
0.5%Others
1.5%
1.6%
1.8%
0.9%
66.8%
5.1%
6.3%
Japan
Africa andMiddle East
Central andSouth America
France(incl. overseas departmentsand territories)
North America
Italy
Asia-Pacificexcluding Japan
Western Europeexcluding Italy
Eastern Europe
Central governments Institutions Corporates Retail customers Equitiesand central banks
Geographic area of exposure
31/12/2014 31/12/2013 31/12/2014 31/12/2013 31/12/2014 31/12/2013 31/12/2014 31/12/2013 31/12/2014 31/12/2013(in %)
France (incl. overseas departments and
54.6% 55.5% 58.8% 62.9% 54.8% 53.1% 86.0% 83.3% 89.8% 88.2%territories)
Western Europe 10.3% 13.8% 4.1% 20.6% 8.1% 16.5% 0.0% 6.0% 0.5% 2.8%excluding Italy
North America 18.4% 14.3% 23.1% 4.4% 16.7% 7.3% 3.4% 0.0% 4.5% 1.9%
Italy 4.4% 3.6% 2.5% 2.2% 5.8% 6.7% 8.6% 8.7% 4.5% 4.3%
Japan 8.6% 5.1% 1.9% 1.8% 1.2% 1.6% 0.0% 0.0% 0.5% 1.0%
Other 3.3% 0.0% 0.0% 0.0% 0.0%
Asia-Pacific(excluding
1.6% 2.2% 5.4% 4.6% 5.9% 6.4% 0.2% 0.1% 0.1% 0.0%Japan)
Africa and 1.3% 1.0% 2.0% 1.8% 2.7% 3.6% 0.6% 0.7% 0.2% 1.4%Middle East
Eastern Europe 0.1% 0.6% 1.6% 0,6% 2.9% 2.9% 0.1% 1.1% 0.0% 0.4%
Central and 0.7% 0.6% 0.6% 1.1% 1.9% 1.9% 1.1% 0.1% 0.0% 0.0%South America
TOTAL 100.0% 100.0% 100.0% 100.0% 100.0% 100.0% 100.0% 100.0% 100.0% 100.0%
With no major change compared to 2013, the loan book is focused on France (67.9% versus 66.8% in 2013) and on Western Europe ingeneral (86.6% versus 85.6% in 2013).
122 CRÉDIT AGRICOLE S.A. UPDATE A01 OF THE 2014 REGISTRATION DOCUMENT
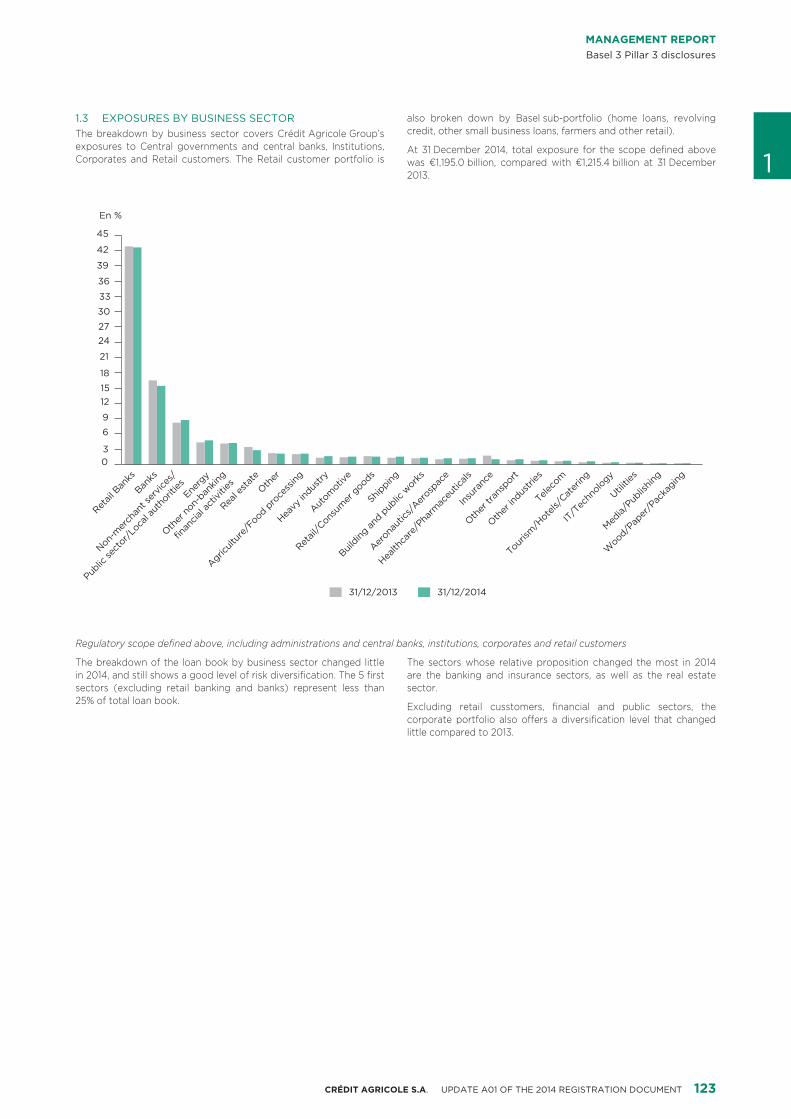
MANAGEMENT REPORTBasel 3 Pillar 3 disclosures
EXPOSURES BY BUSINESS SECTOR1.3 also broken down by Basel sub-portfolio (home loans, revolvingcredit, other small business loans, farmers and other retail).The breakdown by business sector covers Crédit Agricole Group’s
exposures to Central governments and central banks, Institutions, At 31 December 2014, total exposure for the scope defined above
1Corporates and Retail customers. The Retail customer portfolio is was €1,195.0 billion, compared with €1,215.4 billion at 31 December2013.
03
6
9
1215
18
21
2427
30
33
36
39
42
45
En %
31/12/201431/12/2013
Energ
y
Woo
d/Pap
er/P
acka
ging
Banks
Retail
Ban
ks
Other
Real e
state
Ship
ping
Agricult
ure/
Food p
roce
ssing
Other
non
-ban
king
finan
cial a
ctivi
ties
Retail
/Con
sum
er g
oods
Heavy
indus
try
Aeron
autic
s/Aer
ospac
e
Insu
ranc
e
Autom
otive
Building
and p
ublic
wor
ks
Other
tran
spor
t
Telec
om
Other
indus
tries
Tour
ism/H
otels
/Cat
ering
Health
care
/Pha
rmac
eutic
als
IT/T
echn
olog
y
Media/
Publis
hing
Utiliti
es
Non-m
erch
ant s
ervic
es/
Public
sect
or/L
ocal
auth
oriti
es
Regulatory scope defined above, including administrations and central banks, institutions, corporates and retail customers
The breakdown of the loan book by business sector changed little The sectors whose relative proposition changed the most in 2014in 2014, and still shows a good level of risk diversification. The 5 first are the banking and insurance sectors, as well as the real estatesectors (excluding retail banking and banks) represent less than sector.25% of total loan book. Excluding retail cusstomers, financial and public sectors, the
corporate portfolio also offers a diversification level that changedlittle compared to 2013.
123CRÉDIT AGRICOLE S.A. UPDATE A01 OF THE 2014 REGISTRATION DOCUMENT
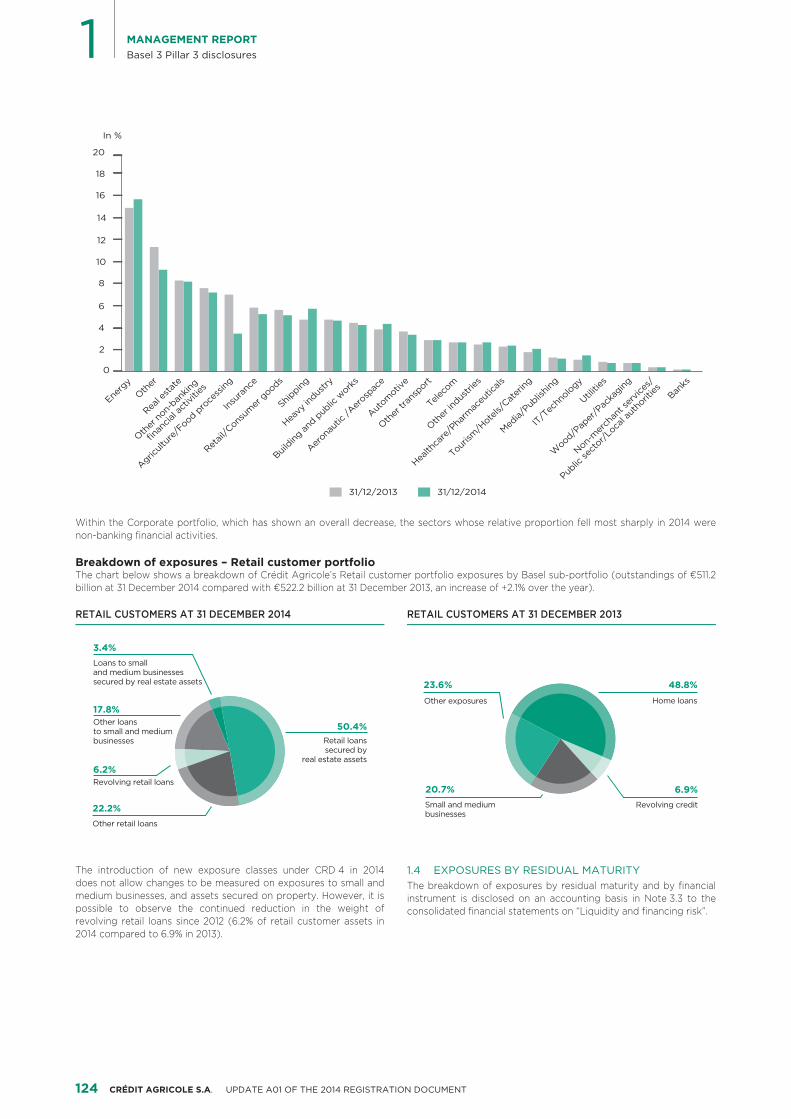
1 MANAGEMENT REPORTBasel 3 Pillar 3 disclosures
Energ
y
Wood/P
aper
/Pac
kaging
Other
Real e
state
Shipping
Agricult
ure/
Food pro
cess
ing
Other
non-
bankin
g
finan
cial a
ctivi
ties
Retail
/Cons
umer
goods
Heavy
indus
try
Aerona
utic
/Aer
ospac
e
Insur
ance
Aut
omotiv
e
Building
and p
ublic
work
s
Other
tran
sport
Teleco
m
Other
indus
tries
Tourism
/Hote
ls/Cat
ering
Health
care
/Pha
rmac
eutic
als
IT/T
echn
ology
Media/
Publis
hing
Utilitie
s0
2
4
6
8
10
12
14
16
18
20
In %
N
on-m
erch
ant s
ervic
es/
Public
sect
or/Loca
l aut
horit
ies
31/12/201431/12/2013
Banks
Within the Corporate portfolio, which has shown an overall decrease, the sectors whose relative proportion fell most sharply in 2014 werenon-banking financial activities.
Breakdown of exposures – Retail customer portfolioThe chart below shows a breakdown of Crédit Agricole’s Retail customer portfolio exposures by Basel sub-portfolio (outstandings of €511.2billion at 31 December 2014 compared with €522.2 billion at 31 December 2013, an increase of +2.1% over the year).
RETAIL CUSTOMERS AT 31 DECEMBER 2014 RETAIL CUSTOMERS AT 31 DECEMBER 2013
50.4%
3.4%
22.2%
6.2%
17.8%
Other retail loans
Revolving retail loans
Other loansto small and mediumbusinesses
Loans to smalland medium businessessecured by real estate assets
Retail loanssecured by
real estate assets
23.6%
Small and mediumbusinesses
Other exposures
20.7%
Home loans
6.9%
48.8%
Revolving credit
The introduction of new exposure classes under CRD 4 in 2014 EXPOSURES BY RESIDUAL MATURITY1.4does not allow changes to be measured on exposures to small and The breakdown of exposures by residual maturity and by financialmedium businesses, and assets secured on property. However, it is instrument is disclosed on an accounting basis in Note 3.3 to thepossible to observe the continued reduction in the weight of consolidated financial statements on “Liquidity and financing risk”.revolving retail loans since 2012 (6.2% of retail customer assets in2014 compared to 6.9% in 2013).
124 CRÉDIT AGRICOLE S.A. UPDATE A01 OF THE 2014 REGISTRATION DOCUMENT
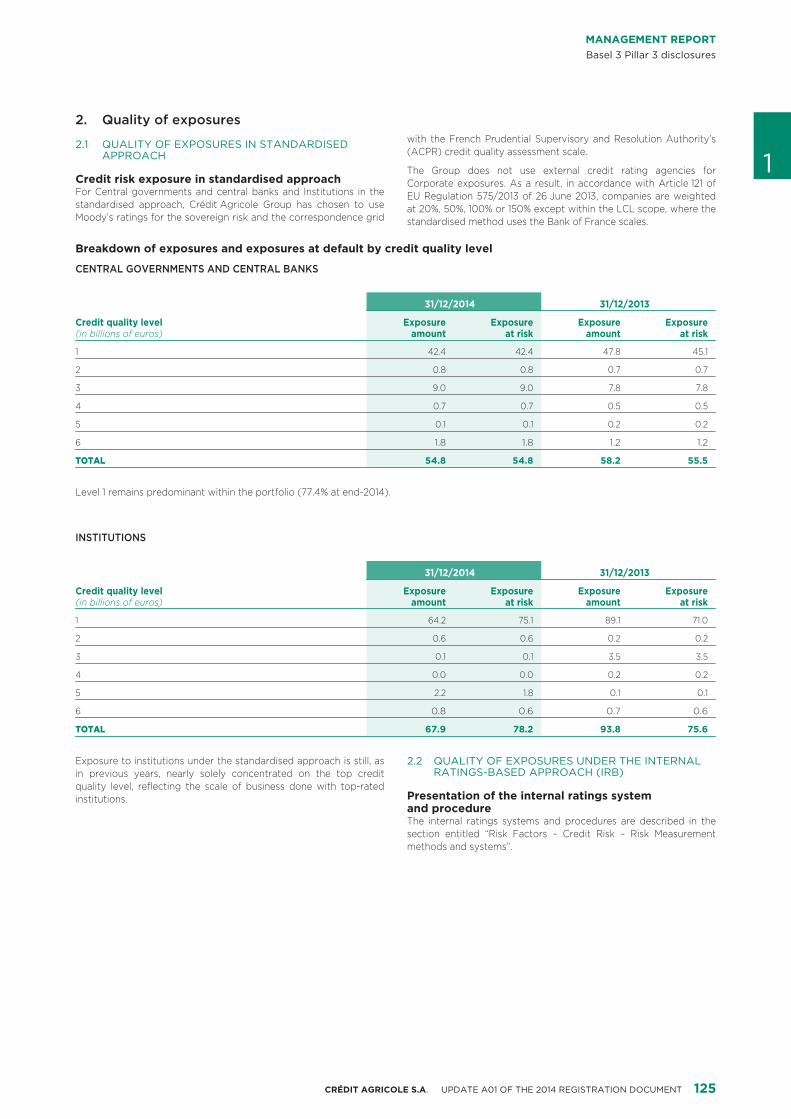
MANAGEMENT REPORTBasel 3 Pillar 3 disclosures
Quality of exposures2.
QUALITY OF EXPOSURES IN STANDARDISED 2.1 with the French Prudential Supervisory and Resolution Authority’s(ACPR) credit quality assessment scale.
1APPROACHThe Group does not use external credit rating agencies for
Credit risk exposure in standardised approach Corporate exposures. As a result, in accordance with Article 121 ofFor Central governments and central banks and Institutions in the EU Regulation 575/2013 of 26 June 2013, companies are weightedstandardised approach, Crédit Agricole Group has chosen to use at 20%, 50%, 100% or 150% except within the LCL scope, where theMoody’s ratings for the sovereign risk and the correspondence grid standardised method uses the Bank of France scales.
Breakdown of exposures and exposures at default by credit quality level
CENTRAL GOVERNMENTS AND CENTRAL BANKS
31/12/2014 31/12/2013
Credit quality level Exposure Exposure Exposure Exposure(in billions of euros) amount at risk amount at risk
1 42.4 42.4 47.8 45.1
2 0.8 0.8 0.7 0.7
3 9.0 9.0 7.8 7.8
4 0.7 0.7 0.5 0.5
5 0.1 0.1 0.2 0.2
6 1.8 1.8 1.2 1.2
TOTAL 54.8 54.8 58.2 55.5
Level 1 remains predominant within the portfolio (77.4% at end-2014).
INSTITUTIONS
31/12/2014 31/12/2013
Credit quality level Exposure Exposure Exposure Exposure(in billions of euros) amount at risk amount at risk
1 64.2 75.1 89.1 71.0
2 0.6 0.6 0.2 0.2
3 0.1 0.1 3.5 3.5
4 0.0 0.0 0.2 0.2
5 2.2 1.8 0.1 0.1
6 0.8 0.6 0.7 0.6
TOTAL 67.9 78.2 93.8 75.6
Exposure to institutions under the standardised approach is still, as QUALITY OF EXPOSURES UNDER THE INTERNAL 2.2RATINGS-BASED APPROACH (IRB)in previous years, nearly solely concentrated on the top credit
quality level, reflecting the scale of business done with top-ratedPresentation of the internal ratings system institutions.and procedureThe internal ratings systems and procedures are described in thesection entitled “Risk Factors – Credit Risk – Risk Measurementmethods and systems”.
125CRÉDIT AGRICOLE S.A. UPDATE A01 OF THE 2014 REGISTRATION DOCUMENT
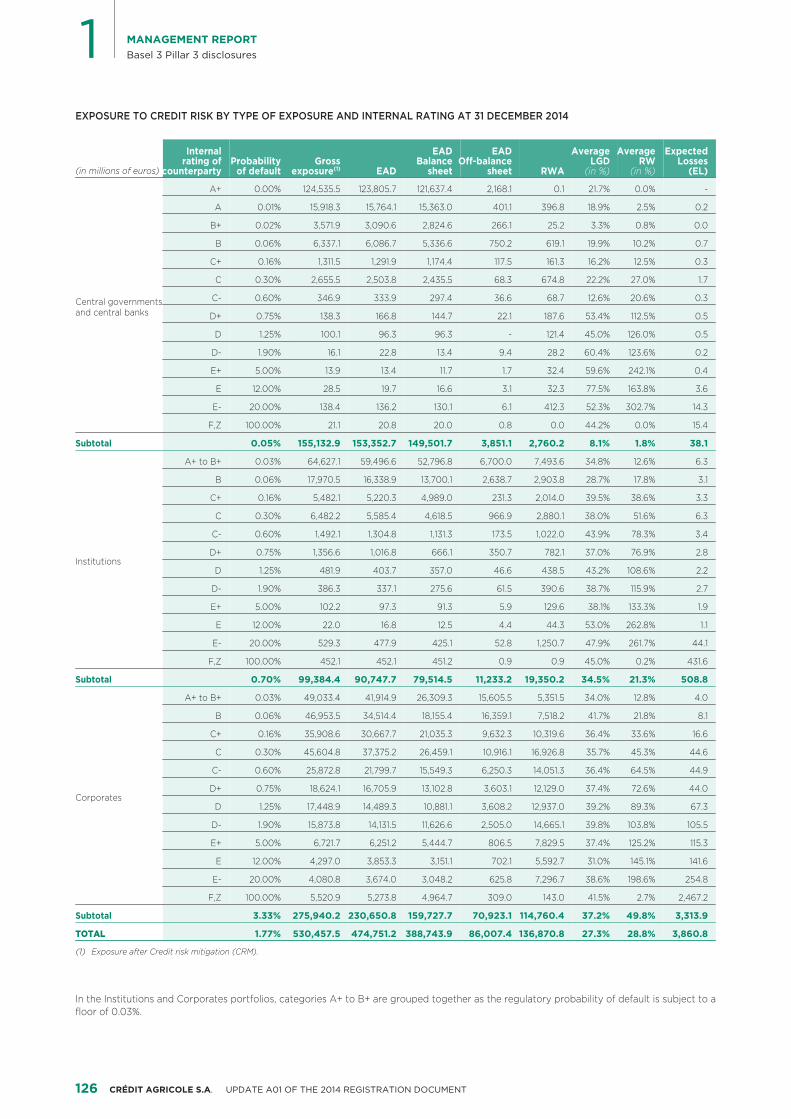
1 MANAGEMENT REPORTBasel 3 Pillar 3 disclosures
EXPOSURE TO CREDIT RISK BY TYPE OF EXPOSURE AND INTERNAL RATING AT 31 DECEMBER 2014
Internal EAD EAD Average Average ExpectedProbability Grossrating of Balance Off-balance LGD RW Losses
EAD RWA(in millions of euros) counterparty of default exposure(1) sheet sheet (in %) (in %) (EL)
A+ 0.00% 124,535.5 123,805.7 121,637.4 2,168.1 0.1 21.7% 0.0% -
Central governments and central banks
A 0.01% 15,918.3 15,764.1 15,363.0 401.1 396.8 18.9% 2.5% 0.2
B+ 0.02% 3,571.9 3,090.6 2,824.6 266.1 25.2 3.3% 0.8% 0.0
B 0.06% 6,337.1 6,086.7 5,336.6 750.2 619.1 19.9% 10.2% 0.7
C+ 0.16% 1,311.5 1,291.9 1,174.4 117.5 161.3 16.2% 12.5% 0.3
C 0.30% 2,655.5 2,503.8 2,435.5 68.3 674.8 22.2% 27.0% 1.7
C- 0.60% 346.9 333.9 297.4 36.6 68.7 12.6% 20.6% 0.3
D+ 0.75% 138.3 166.8 144.7 22.1 187.6 53.4% 112.5% 0.5
D 1.25% 100.1 96.3 96.3 - 121.4 45.0% 126.0% 0.5
D- 1.90% 16.1 22.8 13.4 9.4 28.2 60.4% 123.6% 0.2
E+ 5.00% 13.9 13.4 11.7 1.7 32.4 59.6% 242.1% 0.4
E 12.00% 28.5 19.7 16.6 3.1 32.3 77.5% 163.8% 3.6
E- 20.00% 138.4 136.2 130.1 6.1 412.3 52.3% 302.7% 14.3
F,Z 100.00% 21.1 20.8 20.0 0.8 0.0 44.2% 0.0% 15.4
Subtotal 0.05% 155,132.9 153,352.7 149,501.7 3,851.1 2,760.2 8.1% 1.8% 38.1
A+ to B+ 0.03% 64,627.1 59,496.6 52,796.8 6,700.0 7,493.6 34.8% 12.6% 6.3
Institutions
B 0.06% 17,970.5 16,338.9 13,700.1 2,638.7 2,903.8 28.7% 17.8% 3.1
C+ 0.16% 5,482.1 5,220.3 4,989.0 231.3 2,014.0 39.5% 38.6% 3.3
C 0.30% 6,482.2 5,585.4 4,618.5 966.9 2,880.1 38.0% 51.6% 6.3
C- 0.60% 1,492.1 1,304.8 1,131.3 173.5 1,022.0 43.9% 78.3% 3.4
D+ 0.75% 1,356.6 1,016.8 666.1 350.7 782.1 37.0% 76.9% 2.8
D 1.25% 481.9 403.7 357.0 46.6 438.5 43.2% 108.6% 2.2
D- 1.90% 386.3 337.1 275.6 61.5 390.6 38.7% 115.9% 2.7
E+ 5.00% 102.2 97.3 91.3 5.9 129.6 38.1% 133.3% 1.9
E 12.00% 22.0 16.8 12.5 4.4 44.3 53.0% 262.8% 1.1
E- 20.00% 529.3 477.9 425.1 52.8 1,250.7 47.9% 261.7% 44.1
F,Z 100.00% 452.1 452.1 451.2 0.9 0.9 45.0% 0.2% 431.6
Subtotal 0.70% 99,384.4 90,747.7 79,514.5 11,233.2 19,350.2 34.5% 21.3% 508.8
A+ to B+ 0.03% 49,033.4 41,914.9 26,309.3 15,605.5 5,351.5 34.0% 12.8% 4.0
Corporates
B 0.06% 46,953.5 34,514.4 18,155.4 16,359.1 7,518.2 41.7% 21.8% 8.1
C+ 0.16% 35,908.6 30,667.7 21,035.3 9,632.3 10,319.6 36.4% 33.6% 16.6
C 0.30% 45,604.8 37,375.2 26,459.1 10,916.1 16,926.8 35.7% 45.3% 44.6
C- 0.60% 25,872.8 21,799.7 15,549.3 6,250.3 14,051.3 36.4% 64.5% 44.9
D+ 0.75% 18,624.1 16,705.9 13,102.8 3,603.1 12,129.0 37.4% 72.6% 44.0
D 1.25% 17,448.9 14,489.3 10,881.1 3,608.2 12,937.0 39.2% 89.3% 67.3
D- 1.90% 15,873.8 14,131.5 11,626.6 2,505.0 14,665.1 39.8% 103.8% 105.5
E+ 5.00% 6,721.7 6,251.2 5,444.7 806.5 7,829.5 37.4% 125.2% 115.3
E 12.00% 4,297.0 3,853.3 3,151.1 702.1 5,592.7 31.0% 145.1% 141.6
E- 20.00% 4,080.8 3,674.0 3,048.2 625.8 7,296.7 38.6% 198.6% 254.8
F,Z 100.00% 5,520.9 5,273.8 4,964.7 309.0 143.0 41.5% 2.7% 2,467.2
Subtotal 3.33% 275,940.2 230,650.8 159,727.7 70,923.1 114,760.4 37.2% 49.8% 3,313.9
TOTAL 1.77% 530,457.5 474,751.2 388,743.9 86,007.4 136,870.8 27.3% 28.8% 3,860.8
Exposure after Credit risk mitigation (CRM).(1)
In the Institutions and Corporates portfolios, categories A+ to B+ are grouped together as the regulatory probability of default is subject to afloor of 0.03%.
126 CRÉDIT AGRICOLE S.A. UPDATE A01 OF THE 2014 REGISTRATION DOCUMENT
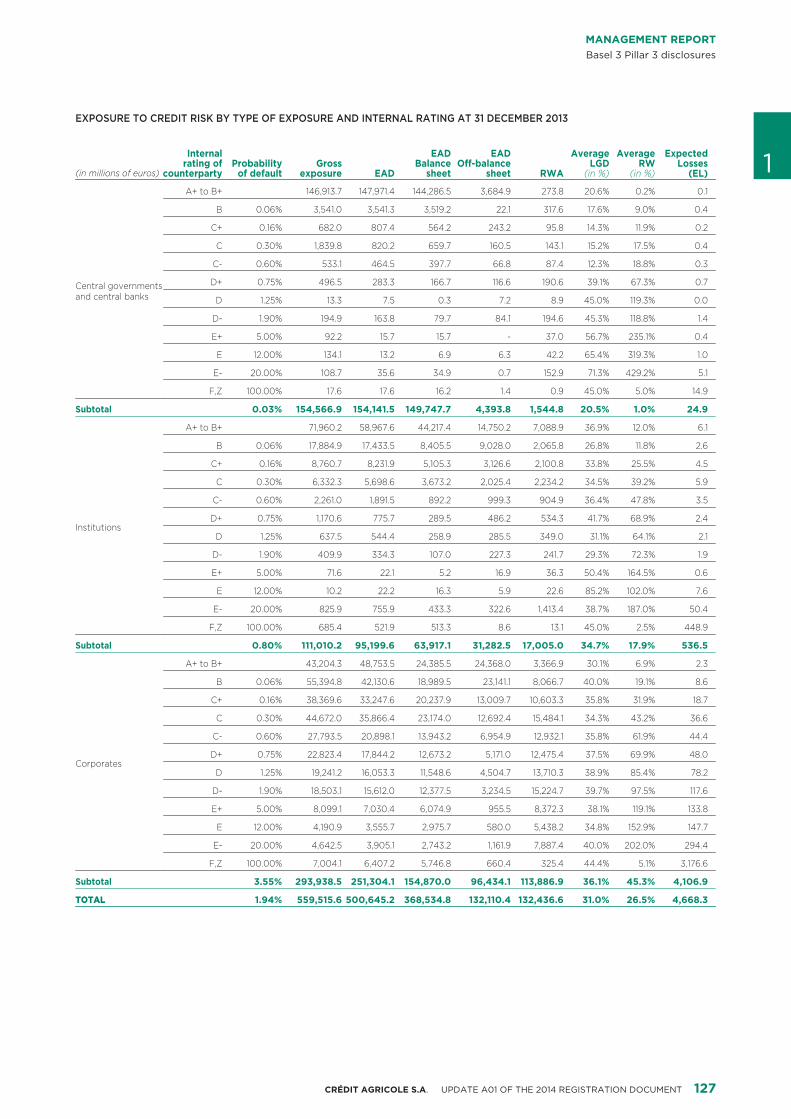
MANAGEMENT REPORTBasel 3 Pillar 3 disclosures
EXPOSURE TO CREDIT RISK BY TYPE OF EXPOSURE AND INTERNAL RATING AT 31 DECEMBER 2013
Internal EAD EAD Average Average ExpectedProbability Grossrating of Balance Off-balance LGD RW Losses
EAD RWA(in millions of euros) counterparty of default exposure sheet sheet (in %) (in %) (EL) 1A+ to B+ 146,913.7 147,971.4 144,286.5 3,684.9 273.8 20.6% 0.2% 0.1
Central governments and central banks
B 0.06% 3,541.0 3,541.3 3,519.2 22.1 317.6 17.6% 9.0% 0.4
C+ 0.16% 682.0 807.4 564.2 243.2 95.8 14.3% 11.9% 0.2
C 0.30% 1,839.8 820.2 659.7 160.5 143.1 15.2% 17.5% 0.4
C- 0.60% 533.1 464.5 397.7 66.8 87.4 12.3% 18.8% 0.3
D+ 0.75% 496.5 283.3 166.7 116.6 190.6 39.1% 67.3% 0.7
D 1.25% 13.3 7.5 0.3 7.2 8.9 45.0% 119.3% 0.0
D- 1.90% 194.9 163.8 79.7 84.1 194.6 45.3% 118.8% 1.4
E+ 5.00% 92.2 15.7 15.7 - 37.0 56.7% 235.1% 0.4
E 12.00% 134.1 13.2 6.9 6.3 42.2 65.4% 319.3% 1.0
E- 20.00% 108.7 35.6 34.9 0.7 152.9 71.3% 429.2% 5.1
F,Z 100.00% 17.6 17.6 16.2 1.4 0.9 45.0% 5.0% 14.9
Subtotal 0.03% 154,566.9 154,141.5 149,747.7 4,393.8 1,544.8 20.5% 1.0% 24.9
A+ to B+ 71,960.2 58,967.6 44,217.4 14,750.2 7,088.9 36.9% 12.0% 6.1
Institutions
B 0.06% 17,884.9 17,433.5 8,405.5 9,028.0 2,065.8 26.8% 11.8% 2.6
C+ 0.16% 8,760.7 8,231.9 5,105.3 3,126.6 2,100.8 33.8% 25.5% 4.5
C 0.30% 6,332.3 5,698.6 3,673.2 2,025.4 2,234.2 34.5% 39.2% 5.9
C- 0.60% 2,261.0 1,891.5 892.2 999.3 904.9 36.4% 47.8% 3.5
D+ 0.75% 1,170.6 775.7 289.5 486.2 534.3 41.7% 68.9% 2.4
D 1.25% 637.5 544.4 258.9 285.5 349.0 31.1% 64.1% 2.1
D- 1.90% 409.9 334.3 107.0 227.3 241.7 29.3% 72.3% 1.9
E+ 5.00% 71.6 22.1 5.2 16.9 36.3 50.4% 164.5% 0.6
E 12.00% 10.2 22.2 16.3 5.9 22.6 85.2% 102.0% 7.6
E- 20.00% 825.9 755.9 433.3 322.6 1,413.4 38.7% 187.0% 50.4
F,Z 100.00% 685.4 521.9 513.3 8.6 13.1 45.0% 2.5% 448.9
Subtotal 0.80% 111,010.2 95,199.6 63,917.1 31,282.5 17,005.0 34.7% 17.9% 536.5
A+ to B+ 43,204.3 48,753.5 24,385.5 24,368.0 3,366.9 30.1% 6.9% 2.3
Corporates
B 0.06% 55,394.8 42,130.6 18,989.5 23,141.1 8,066.7 40.0% 19.1% 8.6
C+ 0.16% 38,369.6 33,247.6 20,237.9 13,009.7 10,603.3 35.8% 31.9% 18.7
C 0.30% 44,672.0 35,866.4 23,174.0 12,692.4 15,484.1 34.3% 43.2% 36.6
C- 0.60% 27,793.5 20,898.1 13,943.2 6,954.9 12,932.1 35.8% 61.9% 44.4
D+ 0.75% 22,823.4 17,844.2 12,673.2 5,171.0 12,475.4 37.5% 69.9% 48.0
D 1.25% 19,241.2 16,053.3 11,548.6 4,504.7 13,710.3 38.9% 85.4% 78.2
D- 1.90% 18,503.1 15,612.0 12,377.5 3,234.5 15,224.7 39.7% 97.5% 117.6
E+ 5.00% 8,099.1 7,030.4 6,074.9 955.5 8,372.3 38.1% 119.1% 133.8
E 12.00% 4,190.9 3,555.7 2,975.7 580.0 5,438.2 34.8% 152.9% 147.7
E- 20.00% 4,642.5 3,905.1 2,743.2 1,161.9 7,887.4 40.0% 202.0% 294.4
F,Z 100.00% 7,004.1 6,407.2 5,746.8 660.4 325.4 44.4% 5.1% 3,176.6
Subtotal 3.55% 293,938.5 251,304.1 154,870.0 96,434.1 113,886.9 36.1% 45.3% 4,106.9
TOTAL 1.94% 559,515.6 500,645.2 368,534.8 132,110.4 132,436.6 31.0% 26.5% 4,668.3
127CRÉDIT AGRICOLE S.A. UPDATE A01 OF THE 2014 REGISTRATION DOCUMENT
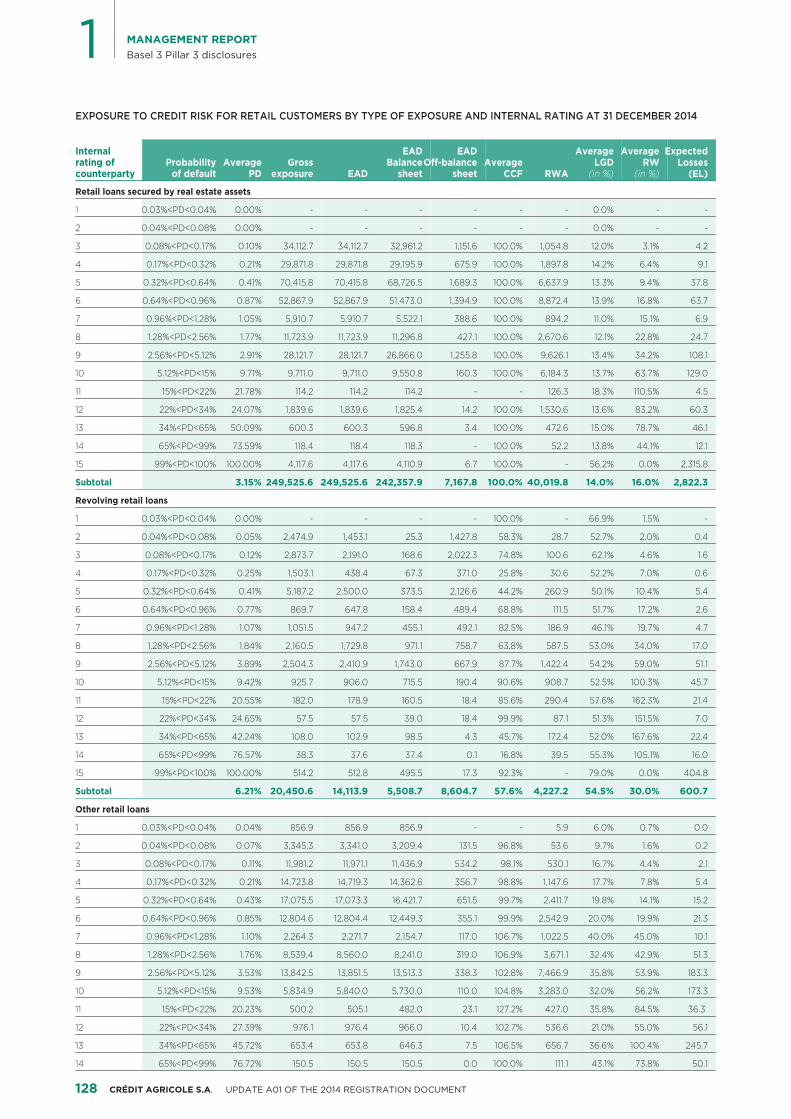
1 MANAGEMENT REPORTBasel 3 Pillar 3 disclosures
EXPOSURE TO CREDIT RISK FOR RETAIL CUSTOMERS BY TYPE OF EXPOSURE AND INTERNAL RATING AT 31 DECEMBER 2014
Internal EAD EAD Average Average ExpectedProbability Average Gross Averagerating of BalanceOff-balance LGD RW Losses
EAD RWAcounterparty of default PD exposure sheet sheet CCF (in %) (in %) (EL)
Retail loans secured by real estate assets
1 0.03%<PD<0.04% 0.00% - - - - - - 0.0% - -
2 0.04%<PD<0.08% 0.00% - - - - - - 0.0% - -
3 0.08%<PD<0.17% 0.10% 34,112.7 34,112.7 32,961.2 1,151.6 100.0% 1,054.8 12.0% 3.1% 4.2
4 0.17%<PD<0.32% 0.21% 29,871.8 29,871.8 29,195.9 675.9 100.0% 1,897.8 14.2% 6.4% 9.1
5 0.32%<PD<0.64% 0.41% 70,415.8 70,415.8 68,726.5 1,689.3 100.0% 6,637.9 13.3% 9.4% 37.8
6 0.64%<PD<0.96% 0.87% 52,867.9 52,867.9 51,473.0 1,394.9 100.0% 8,872.4 13.9% 16.8% 63.7
7 0.96%<PD<1.28% 1.05% 5,910.7 5,910.7 5,522.1 388.6 100.0% 894.2 11.0% 15.1% 6.9
8 1.28%<PD<2.56% 1.77% 11,723.9 11,723.9 11,296.8 427.1 100.0% 2,670.6 12.1% 22.8% 24.7
9 2.56%<PD<5.12% 2.91% 28,121.7 28,121.7 26,866.0 1,255.8 100.0% 9,626.1 13.4% 34.2% 108.1
10 5.12%<PD<15% 9.71% 9,711.0 9,711.0 9,550.8 160.3 100.0% 6,184.3 13.7% 63.7% 129.0
11 15%<PD<22% 21.78% 114.2 114.2 114.2 - - 126.3 18.3% 110.5% 4.5
12 22%<PD<34% 24.07% 1,839.6 1,839.6 1,825.4 14.2 100.0% 1,530.6 13.6% 83.2% 60.3
13 34%<PD<65% 50.09% 600.3 600.3 596.8 3.4 100.0% 472.6 15.0% 78.7% 46.1
14 65%<PD<99% 73.59% 118.4 118.4 118.3 - 100.0% 52.2 13.8% 44.1% 12.1
15 99%<PD<100% 100.00% 4,117.6 4,117.6 4,110.9 6.7 100.0% - 56.2% 0.0% 2,315.8
Subtotal 3.15% 249,525.6 249,525.6 242,357.9 7,167.8 100.0% 40,019.8 14.0% 16.0% 2,822.3
Revolving retail loans
1 0.03%<PD<0.04% 0.00% - - - - 100.0% - 66.9% 1.5% -
2 0.04%<PD<0.08% 0.05% 2,474.9 1,453.1 25.3 1,427.8 58.3% 28.7 52.7% 2.0% 0.4
3 0.08%<PD<0.17% 0.12% 2,873.7 2,191.0 168.6 2,022.3 74.8% 100.6 62.1% 4.6% 1.6
4 0.17%<PD<0.32% 0.25% 1,503.1 438.4 67.3 371.0 25.8% 30.6 52.2% 7.0% 0.6
5 0.32%<PD<0.64% 0.41% 5,187.2 2,500.0 373.5 2,126.6 44.2% 260.9 50.1% 10.4% 5.4
6 0.64%<PD<0.96% 0.77% 869.7 647.8 158.4 489.4 68.8% 111.5 51.7% 17.2% 2.6
7 0.96%<PD<1.28% 1.07% 1,051.5 947.2 455.1 492.1 82.5% 186.9 46.1% 19.7% 4.7
8 1.28%<PD<2.56% 1.84% 2,160.5 1,729.8 971.1 758.7 63.8% 587.5 53.0% 34.0% 17.0
9 2.56%<PD<5.12% 3.89% 2,504.3 2,410.9 1,743.0 667.9 87.7% 1,422.4 54.2% 59.0% 51.1
10 5.12%<PD<15% 9.42% 925.7 906.0 715.5 190.4 90.6% 908.7 52.5% 100.3% 45.7
11 15%<PD<22% 20.55% 182.0 178.9 160.5 18.4 85.6% 290.4 57.6% 162.3% 21.4
12 22%<PD<34% 24.65% 57.5 57.5 39.0 18.4 99.9% 87.1 51.3% 151.5% 7.0
13 34%<PD<65% 42.24% 108.0 102.9 98.5 4.3 45.7% 172.4 52.0% 167.6% 22.4
14 65%<PD<99% 76.57% 38.3 37.6 37.4 0.1 16.8% 39.5 55.3% 105.1% 16.0
15 99%<PD<100% 100.00% 514.2 512.8 495.5 17.3 92.3% - 79.0% 0.0% 404.8
Subtotal 6.21% 20,450.6 14,113.9 5,508.7 8,604.7 57.6% 4,227.2 54.5% 30.0% 600.7
Other retail loans
1 0.03%<PD<0.04% 0.04% 856.9 856.9 856.9 - - 5.9 6.0% 0.7% 0.0
2 0.04%<PD<0.08% 0.07% 3,345.3 3,341.0 3,209.4 131.5 96.8% 53.6 9.7% 1.6% 0.2
3 0.08%<PD<0.17% 0.11% 11,981.2 11,971.1 11,436.9 534.2 98.1% 530.1 16.7% 4.4% 2.1
4 0.17%<PD<0.32% 0.21% 14,723.8 14,719.3 14,362.6 356.7 98.8% 1,147.6 17.7% 7.8% 5.4
5 0.32%<PD<0.64% 0.43% 17,075.5 17,073.3 16,421.7 651.5 99.7% 2,411.7 19.8% 14.1% 15.2
6 0.64%<PD<0.96% 0.85% 12,804.6 12,804.4 12,449.3 355.1 99.9% 2,542.9 20.0% 19.9% 21.3
7 0.96%<PD<1.28% 1.10% 2,264.3 2,271.7 2,154.7 117.0 106.7% 1,022.5 40.0% 45.0% 10.1
8 1.28%<PD<2.56% 1.76% 8,539.4 8,560.0 8,241.0 319.0 106.9% 3,671.1 32.4% 42.9% 51.3
9 2.56%<PD<5.12% 3.53% 13,842.5 13,851.5 13,513.3 338.3 102.8% 7,466.9 35.8% 53.9% 183.3
10 5.12%<PD<15% 9.53% 5,834.9 5,840.0 5,730.0 110.0 104.8% 3,283.0 32.0% 56.2% 173.3
11 15%<PD<22% 20.23% 500.2 505.1 482.0 23.1 127.2% 427.0 35.8% 84.5% 36.3
12 22%<PD<34% 27.39% 976.1 976.4 966.0 10.4 102.7% 536.6 21.0% 55.0% 56.1
13 34%<PD<65% 45.72% 653.4 653.8 646.3 7.5 106.5% 656.7 36.6% 100.4% 245.7
14 65%<PD<99% 76.72% 150.5 150.5 150.5 0.0 100.0% 111.1 43.1% 73.8% 50.1
128 CRÉDIT AGRICOLE S.A. UPDATE A01 OF THE 2014 REGISTRATION DOCUMENT
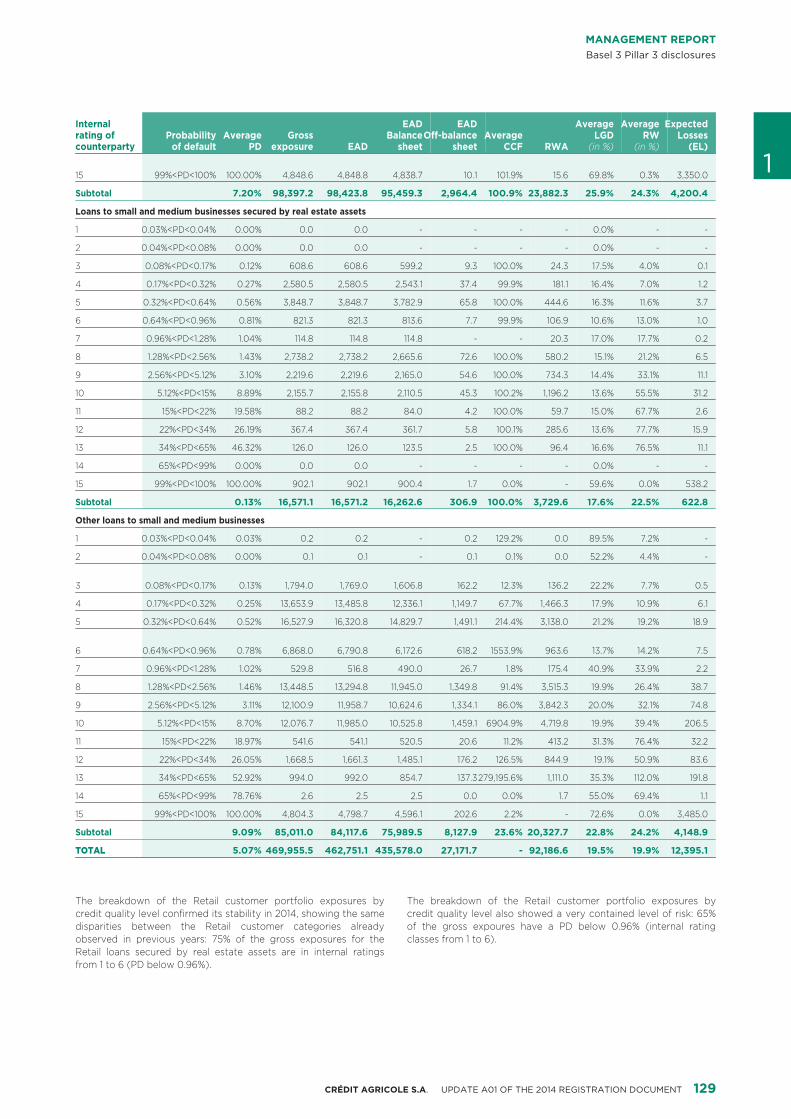
MANAGEMENT REPORTBasel 3 Pillar 3 disclosures
Internal EAD EAD Average Average ExpectedProbability Average Gross Averagerating of BalanceOff-balance LGD RW Losses
EAD RWAcounterparty of default PD exposure sheet sheet CCF (in %) (in %) (EL)
115 99%<PD<100% 100.00% 4,848.6 4,848.8 4,838.7 10.1 101.9% 15.6 69.8% 0.3% 3,350.0
Subtotal 7.20% 98,397.2 98,423.8 95,459.3 2,964.4 100.9% 23,882.3 25.9% 24.3% 4,200.4
Loans to small and medium businesses secured by real estate assets
1 0.03%<PD<0.04% 0.00% 0.0 0.0 - - - - 0.0% - -
2 0.04%<PD<0.08% 0.00% 0.0 0.0 - - - - 0.0% - -
3 0.08%<PD<0.17% 0.12% 608.6 608.6 599.2 9.3 100.0% 24.3 17.5% 4.0% 0.1
4 0.17%<PD<0.32% 0.27% 2,580.5 2,580.5 2,543.1 37.4 99.9% 181.1 16.4% 7.0% 1.2
5 0.32%<PD<0.64% 0.56% 3,848.7 3,848.7 3,782.9 65.8 100.0% 444.6 16.3% 11.6% 3.7
6 0.64%<PD<0.96% 0.81% 821.3 821.3 813.6 7.7 99.9% 106.9 10.6% 13.0% 1.0
7 0.96%<PD<1.28% 1.04% 114.8 114.8 114.8 - - 20.3 17.0% 17.7% 0.2
8 1.28%<PD<2.56% 1.43% 2,738.2 2,738.2 2,665.6 72.6 100.0% 580.2 15.1% 21.2% 6.5
9 2.56%<PD<5.12% 3.10% 2,219.6 2,219.6 2,165.0 54.6 100.0% 734.3 14.4% 33.1% 11.1
10 5.12%<PD<15% 8.89% 2,155.7 2,155.8 2,110.5 45.3 100.2% 1,196.2 13.6% 55.5% 31.2
11 15%<PD<22% 19.58% 88.2 88.2 84.0 4.2 100.0% 59.7 15.0% 67.7% 2.6
12 22%<PD<34% 26.19% 367.4 367.4 361.7 5.8 100.1% 285.6 13.6% 77.7% 15.9
13 34%<PD<65% 46.32% 126.0 126.0 123.5 2.5 100.0% 96.4 16.6% 76.5% 11.1
14 65%<PD<99% 0.00% 0.0 0.0 - - - - 0.0% - -
15 99%<PD<100% 100.00% 902.1 902.1 900.4 1.7 0.0% - 59.6% 0.0% 538.2
Subtotal 0.13% 16,571.1 16,571.2 16,262.6 306.9 100.0% 3,729.6 17.6% 22.5% 622.8
Other loans to small and medium businesses
1 0.03%<PD<0.04% 0.03% 0.2 0.2 - 0.2 129.2% 0.0 89.5% 7.2% -
2 0.04%<PD<0.08% 0.00% 0.1 0.1 - 0.1 0.1% 0.0 52.2% 4.4% -
3 0.08%<PD<0.17% 0.13% 1,794.0 1,769.0 1,606.8 162.2 12.3% 136.2 22.2% 7.7% 0.5
4 0.17%<PD<0.32% 0.25% 13,653.9 13,485.8 12,336.1 1,149.7 67.7% 1,466.3 17.9% 10.9% 6.1
5 0.32%<PD<0.64% 0.52% 16,527.9 16,320.8 14,829.7 1,491.1 214.4% 3,138.0 21.2% 19.2% 18.9
6 0.64%<PD<0.96% 0.78% 6,868.0 6,790.8 6,172.6 618.2 1553.9% 963.6 13.7% 14.2% 7.5
7 0.96%<PD<1.28% 1.02% 529.8 516.8 490.0 26.7 1.8% 175.4 40.9% 33.9% 2.2
8 1.28%<PD<2.56% 1.46% 13,448.5 13,294.8 11,945.0 1,349.8 91.4% 3,515.3 19.9% 26.4% 38.7
9 2.56%<PD<5.12% 3.11% 12,100.9 11,958.7 10,624.6 1,334.1 86.0% 3,842.3 20.0% 32.1% 74.8
10 5.12%<PD<15% 8.70% 12,076.7 11,985.0 10,525.8 1,459.1 6904.9% 4,719.8 19.9% 39.4% 206.5
11 15%<PD<22% 18.97% 541.6 541.1 520.5 20.6 11.2% 413.2 31.3% 76.4% 32.2
12 22%<PD<34% 26.05% 1,668.5 1,661.3 1,485.1 176.2 126.5% 844.9 19.1% 50.9% 83.6
13 34%<PD<65% 52.92% 994.0 992.0 854.7 137.3279,195.6% 1,111.0 35.3% 112.0% 191.8
14 65%<PD<99% 78.76% 2.6 2.5 2.5 0.0 0.0% 1.7 55.0% 69.4% 1.1
15 99%<PD<100% 100.00% 4,804.3 4,798.7 4,596.1 202.6 2.2% - 72.6% 0.0% 3,485.0
Subtotal 9.09% 85,011.0 84,117.6 75,989.5 8,127.9 23.6% 20,327.7 22.8% 24.2% 4,148.9
TOTAL 5.07% 469,955.5 462,751.1 435,578.0 27,171.7 - 92,186.6 19.5% 19.9% 12,395.1
The breakdown of the Retail customer portfolio exposures by The breakdown of the Retail customer portfolio exposures bycredit quality level confirmed its stability in 2014, showing the same credit quality level also showed a very contained level of risk: 65%disparities between the Retail customer categories already of the gross expoures have a PD below 0.96% (internal ratingobserved in previous years: 75% of the gross exposures for the classes from 1 to 6).Retail loans secured by real estate assets are in internal ratingsfrom 1 to 6 (PD below 0.96%).
129CRÉDIT AGRICOLE S.A. UPDATE A01 OF THE 2014 REGISTRATION DOCUMENT
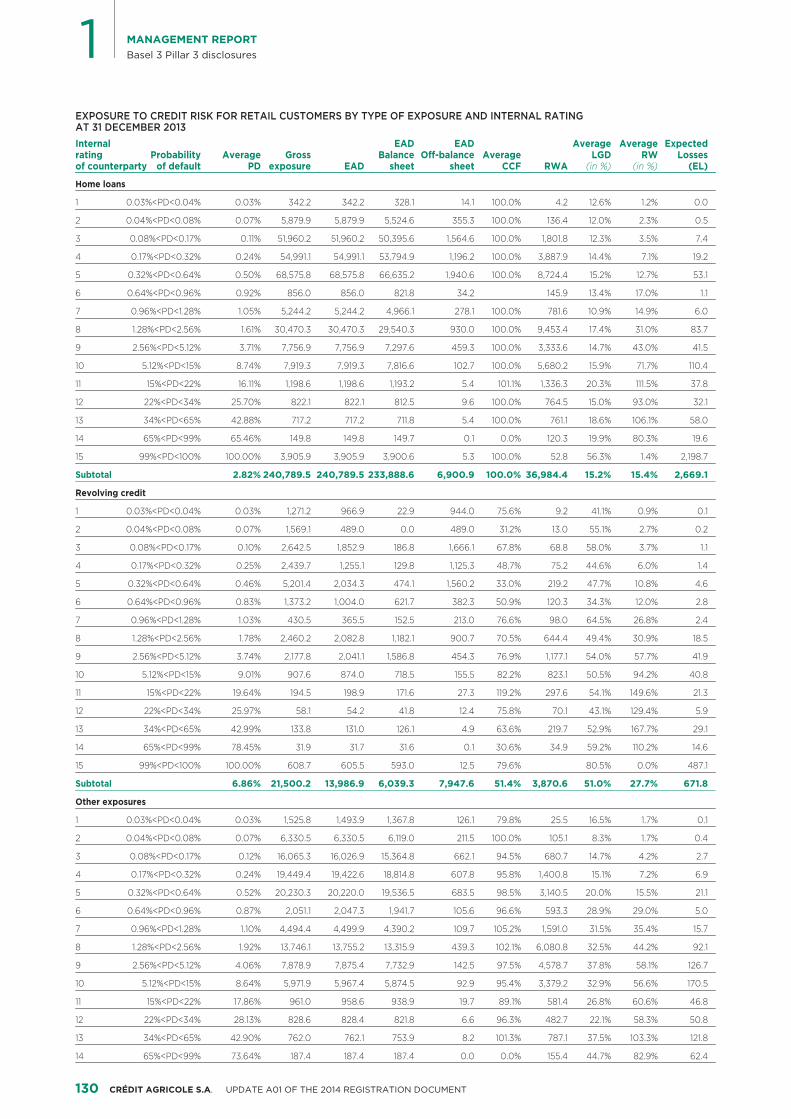
1 MANAGEMENT REPORTBasel 3 Pillar 3 disclosures
EXPOSURE TO CREDIT RISK FOR RETAIL CUSTOMERS BY TYPE OF EXPOSURE AND INTERNAL RATING AT 31 DECEMBER 2013Internal EAD EAD Average Average Expected
Probability Average Gross Averagerating Balance Off-balance LGD RW LossesEAD RWAof counterparty of default PD exposure sheet sheet CCF (in %) (in %) (EL)
Home loans
1 0.03%<PD<0.04% 0.03% 342.2 342.2 328.1 14.1 100.0% 4.2 12.6% 1.2% 0.0
2 0.04%<PD<0.08% 0.07% 5,879.9 5,879.9 5,524.6 355.3 100.0% 136.4 12.0% 2.3% 0.5
3 0.08%<PD<0.17% 0.11% 51,960.2 51,960.2 50,395.6 1,564.6 100.0% 1,801.8 12.3% 3.5% 7.4
4 0.17%<PD<0.32% 0.24% 54,991.1 54,991.1 53,794.9 1,196.2 100.0% 3,887.9 14.4% 7.1% 19.2
5 0.32%<PD<0.64% 0.50% 68,575.8 68,575.8 66,635.2 1,940.6 100.0% 8,724.4 15.2% 12.7% 53.1
6 0.64%<PD<0.96% 0.92% 856.0 856.0 821.8 34.2 145.9 13.4% 17.0% 1.1
7 0.96%<PD<1.28% 1.05% 5,244.2 5,244.2 4,966.1 278.1 100.0% 781.6 10.9% 14.9% 6.0
8 1.28%<PD<2.56% 1.61% 30,470.3 30,470.3 29,540.3 930.0 100.0% 9,453.4 17.4% 31.0% 83.7
9 2.56%<PD<5.12% 3.71% 7,756.9 7,756.9 7,297.6 459.3 100.0% 3,333.6 14.7% 43.0% 41.5
10 5.12%<PD<15% 8.74% 7,919.3 7,919.3 7,816.6 102.7 100.0% 5,680.2 15.9% 71.7% 110.4
11 15%<PD<22% 16.11% 1,198.6 1,198.6 1,193.2 5.4 101.1% 1,336.3 20.3% 111.5% 37.8
12 22%<PD<34% 25.70% 822.1 822.1 812.5 9.6 100.0% 764.5 15.0% 93.0% 32.1
13 34%<PD<65% 42.88% 717.2 717.2 711.8 5.4 100.0% 761.1 18.6% 106.1% 58.0
14 65%<PD<99% 65.46% 149.8 149.8 149.7 0.1 0.0% 120.3 19.9% 80.3% 19.6
15 99%<PD<100% 100.00% 3,905.9 3,905.9 3,900.6 5.3 100.0% 52.8 56.3% 1.4% 2,198.7
Subtotal 2.82% 240,789.5 240,789.5 233,888.6 6,900.9 100.0% 36,984.4 15.2% 15.4% 2,669.1
Revolving credit
1 0.03%<PD<0.04% 0.03% 1,271.2 966.9 22.9 944.0 75.6% 9.2 41.1% 0.9% 0.1
2 0.04%<PD<0.08% 0.07% 1,569.1 489.0 0.0 489.0 31.2% 13.0 55.1% 2.7% 0.2
3 0.08%<PD<0.17% 0.10% 2,642.5 1,852.9 186.8 1,666.1 67.8% 68.8 58.0% 3.7% 1.1
4 0.17%<PD<0.32% 0.25% 2,439.7 1,255.1 129.8 1,125.3 48.7% 75.2 44.6% 6.0% 1.4
5 0.32%<PD<0.64% 0.46% 5,201.4 2,034.3 474.1 1,560.2 33.0% 219.2 47.7% 10.8% 4.6
6 0.64%<PD<0.96% 0.83% 1,373.2 1,004.0 621.7 382.3 50.9% 120.3 34.3% 12.0% 2.8
7 0.96%<PD<1.28% 1.03% 430.5 365.5 152.5 213.0 76.6% 98.0 64.5% 26.8% 2.4
8 1.28%<PD<2.56% 1.78% 2,460.2 2,082.8 1,182.1 900.7 70.5% 644.4 49.4% 30.9% 18.5
9 2.56%<PD<5.12% 3.74% 2,177.8 2,041.1 1,586.8 454.3 76.9% 1,177.1 54.0% 57.7% 41.9
10 5.12%<PD<15% 9.01% 907.6 874.0 718.5 155.5 82.2% 823.1 50.5% 94.2% 40.8
11 15%<PD<22% 19.64% 194.5 198.9 171.6 27.3 119.2% 297.6 54.1% 149.6% 21.3
12 22%<PD<34% 25.97% 58.1 54.2 41.8 12.4 75.8% 70.1 43.1% 129.4% 5.9
13 34%<PD<65% 42.99% 133.8 131.0 126.1 4.9 63.6% 219.7 52.9% 167.7% 29.1
14 65%<PD<99% 78.45% 31.9 31.7 31.6 0.1 30.6% 34.9 59.2% 110.2% 14.6
15 99%<PD<100% 100.00% 608.7 605.5 593.0 12.5 79.6% 80.5% 0.0% 487.1
Subtotal 6.86% 21,500.2 13,986.9 6,039.3 7,947.6 51.4% 3,870.6 51.0% 27.7% 671.8
Other exposures
1 0.03%<PD<0.04% 0.03% 1,525.8 1,493.9 1,367.8 126.1 79.8% 25.5 16.5% 1.7% 0.1
2 0.04%<PD<0.08% 0.07% 6,330.5 6,330.5 6,119.0 211.5 100.0% 105.1 8.3% 1.7% 0.4
3 0.08%<PD<0.17% 0.12% 16,065.3 16,026.9 15,364.8 662.1 94.5% 680.7 14.7% 4.2% 2.7
4 0.17%<PD<0.32% 0.24% 19,449.4 19,422.6 18,814.8 607.8 95.8% 1,400.8 15.1% 7.2% 6.9
5 0.32%<PD<0.64% 0.52% 20,230.3 20,220.0 19,536.5 683.5 98.5% 3,140.5 20.0% 15.5% 21.1
6 0.64%<PD<0.96% 0.87% 2,051.1 2,047.3 1,941.7 105.6 96.6% 593.3 28.9% 29.0% 5.0
7 0.96%<PD<1.28% 1.10% 4,494.4 4,499.9 4,390.2 109.7 105.2% 1,591.0 31.5% 35.4% 15.7
8 1.28%<PD<2.56% 1.92% 13,746.1 13,755.2 13,315.9 439.3 102.1% 6,080.8 32.5% 44.2% 92.1
9 2.56%<PD<5.12% 4.06% 7,878.9 7,875.4 7,732.9 142.5 97.5% 4,578.7 37.8% 58.1% 126.7
10 5.12%<PD<15% 8.64% 5,971.9 5,967.4 5,874.5 92.9 95.4% 3,379.2 32.9% 56.6% 170.5
11 15%<PD<22% 17.86% 961.0 958.6 938.9 19.7 89.1% 581.4 26.8% 60.6% 46.8
12 22%<PD<34% 28.13% 828.6 828.4 821.8 6.6 96.3% 482.7 22.1% 58.3% 50.8
13 34%<PD<65% 42.90% 762.0 762.1 753.9 8.2 101.3% 787.1 37.5% 103.3% 121.8
14 65%<PD<99% 73.64% 187.4 187.4 187.4 0.0 0.0% 155.4 44.7% 82.9% 62.4
130 CRÉDIT AGRICOLE S.A. UPDATE A01 OF THE 2014 REGISTRATION DOCUMENT
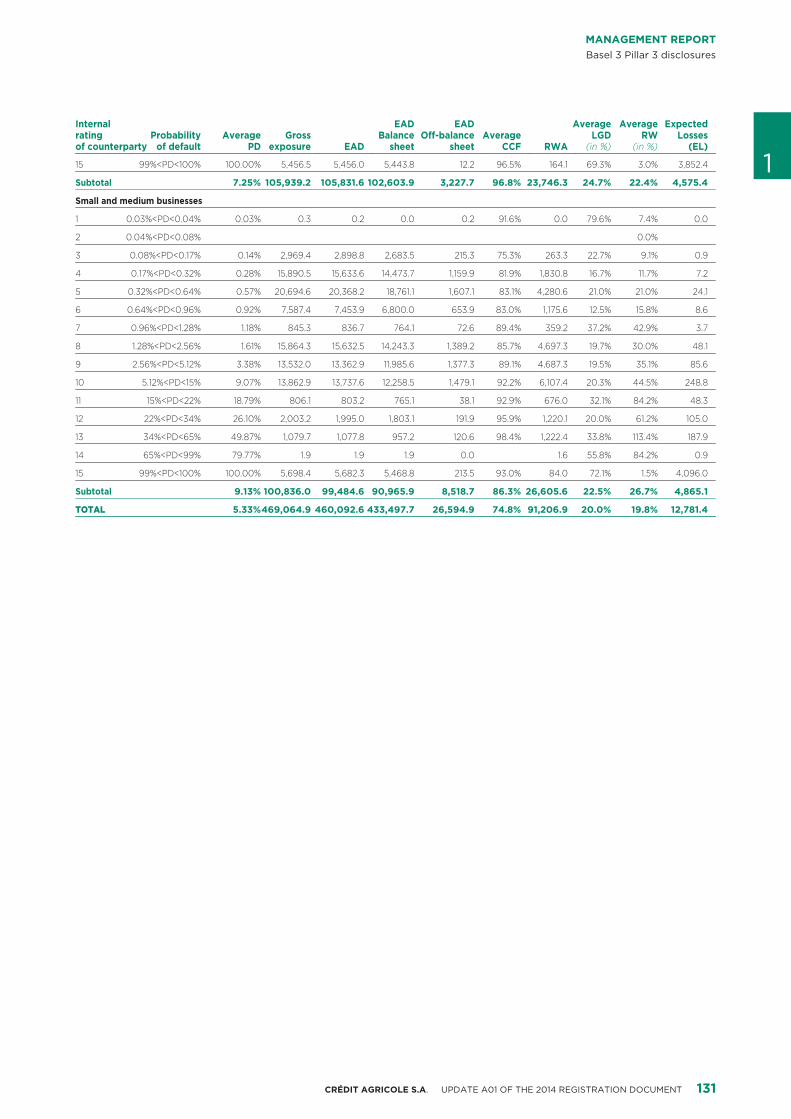
MANAGEMENT REPORTBasel 3 Pillar 3 disclosures
Internal EAD EAD Average Average ExpectedProbability Average Gross Averagerating Balance Off-balance LGD RW Losses
EAD RWAof counterparty of default PD exposure sheet sheet CCF (in %) (in %) (EL)
115 99%<PD<100% 100.00% 5,456.5 5,456.0 5,443.8 12.2 96.5% 164.1 69.3% 3.0% 3,852.4
Subtotal 7.25% 105,939.2 105,831.6 102,603.9 3,227.7 96.8% 23,746.3 24.7% 22.4% 4,575.4
Small and medium businesses
1 0.03%<PD<0.04% 0.03% 0.3 0.2 0.0 0.2 91.6% 0.0 79.6% 7.4% 0.0
2 0.04%<PD<0.08% 0.0%
3 0.08%<PD<0.17% 0.14% 2,969.4 2,898.8 2,683.5 215.3 75.3% 263.3 22.7% 9.1% 0.9
4 0.17%<PD<0.32% 0.28% 15,890.5 15,633.6 14,473.7 1,159.9 81.9% 1,830.8 16.7% 11.7% 7.2
5 0.32%<PD<0.64% 0.57% 20,694.6 20,368.2 18,761.1 1,607.1 83.1% 4,280.6 21.0% 21.0% 24.1
6 0.64%<PD<0.96% 0.92% 7,587.4 7,453.9 6,800.0 653.9 83.0% 1,175.6 12.5% 15.8% 8.6
7 0.96%<PD<1.28% 1.18% 845.3 836.7 764.1 72.6 89.4% 359.2 37.2% 42.9% 3.7
8 1.28%<PD<2.56% 1.61% 15,864.3 15,632.5 14,243.3 1,389.2 85.7% 4,697.3 19.7% 30.0% 48.1
9 2.56%<PD<5.12% 3.38% 13,532.0 13,362.9 11,985.6 1,377.3 89.1% 4,687.3 19.5% 35.1% 85.6
10 5.12%<PD<15% 9.07% 13,862.9 13,737.6 12,258.5 1,479.1 92.2% 6,107.4 20.3% 44.5% 248.8
11 15%<PD<22% 18.79% 806.1 803.2 765.1 38.1 92.9% 676.0 32.1% 84.2% 48.3
12 22%<PD<34% 26.10% 2,003.2 1,995.0 1,803.1 191.9 95.9% 1,220.1 20.0% 61.2% 105.0
13 34%<PD<65% 49.87% 1,079.7 1,077.8 957.2 120.6 98.4% 1,222.4 33.8% 113.4% 187.9
14 65%<PD<99% 79.77% 1.9 1.9 1.9 0.0 1.6 55.8% 84.2% 0.9
15 99%<PD<100% 100.00% 5,698.4 5,682.3 5,468.8 213.5 93.0% 84.0 72.1% 1.5% 4,096.0
Subtotal 9.13% 100,836.0 99,484.6 90,965.9 8,518.7 86.3% 26,605.6 22.5% 26.7% 4,865.1
TOTAL 5.33%469,064.9 460,092.6 433,497.7 26,594.9 74.8% 91,206.9 20.0% 19.8% 12,781.4
131CRÉDIT AGRICOLE S.A. UPDATE A01 OF THE 2014 REGISTRATION DOCUMENT
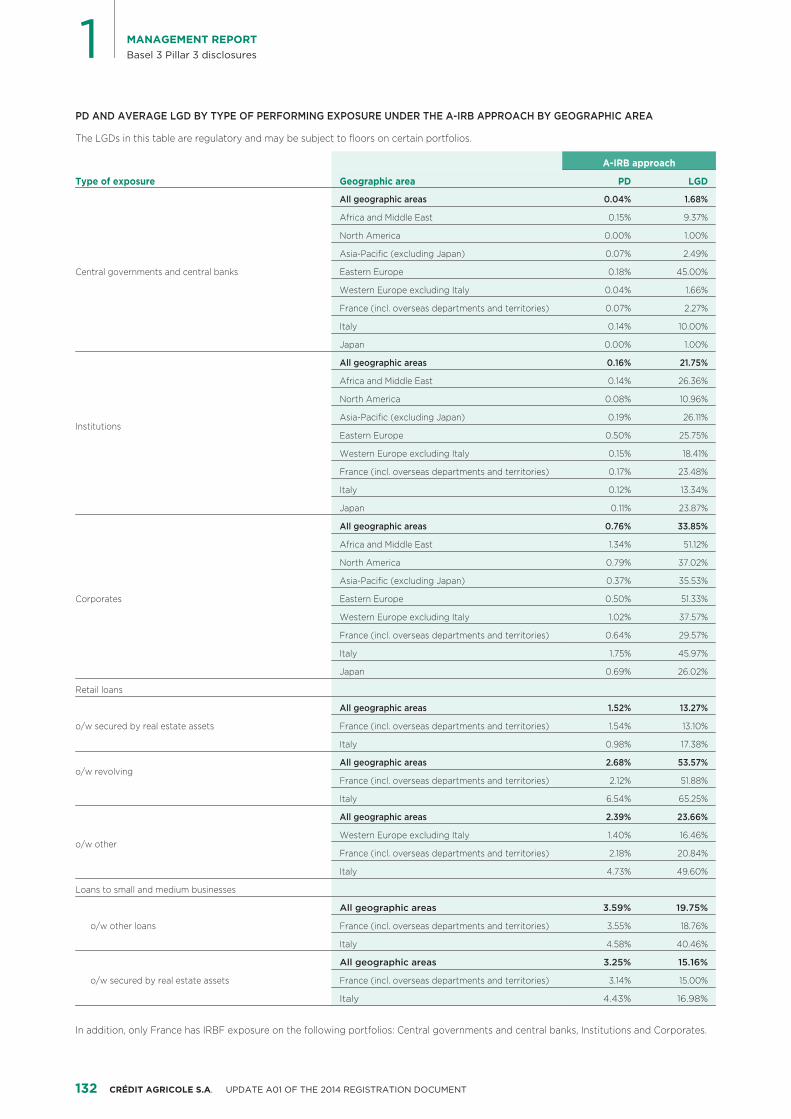
1 MANAGEMENT REPORTBasel 3 Pillar 3 disclosures
PD AND AVERAGE LGD BY TYPE OF PERFORMING EXPOSURE UNDER THE A-IRB APPROACH BY GEOGRAPHIC AREA
The LGDs in this table are regulatory and may be subject to floors on certain portfolios.
A-IRB approach
Type of exposure Geographic area PD LGD
All geographic areas 0.04% 1.68%
Central governments and central banks
Africa and Middle East 0.15% 9.37%
North America 0.00% 1.00%
Asia-Pacific (excluding Japan) 0.07% 2.49%
Eastern Europe 0.18% 45.00%
Western Europe excluding Italy 0.04% 1.66%
France (incl. overseas departments and territories) 0.07% 2.27%
Italy 0.14% 10.00%
Japan 0.00% 1.00%
All geographic areas 0.16% 21.75%
Institutions
Africa and Middle East 0.14% 26.36%
North America 0.08% 10.96%
Asia-Pacific (excluding Japan) 0.19% 26.11%
Eastern Europe 0.50% 25.75%
Western Europe excluding Italy 0.15% 18.41%
France (incl. overseas departments and territories) 0.17% 23.48%
Italy 0.12% 13.34%
Japan 0.11% 23.87%
All geographic areas 0.76% 33.85%
Corporates
Africa and Middle East 1.34% 51.12%
North America 0.79% 37.02%
Asia-Pacific (excluding Japan) 0.37% 35.53%
Eastern Europe 0.50% 51.33%
Western Europe excluding Italy 1.02% 37.57%
France (incl. overseas departments and territories) 0.64% 29.57%
Italy 1.75% 45.97%
Japan 0.69% 26.02%
Retail loans
All geographic areas 1.52% 13.27%
o/w secured by real estate assets France (incl. overseas departments and territories) 1.54% 13.10%
Italy 0.98% 17.38%
All geographic areas 2.68% 53.57%o/w revolving
France (incl. overseas departments and territories) 2.12% 51.88%
Italy 6.54% 65.25%
All geographic areas 2.39% 23.66%
o/w otherWestern Europe excluding Italy 1.40% 16.46%
France (incl. overseas departments and territories) 2.18% 20.84%
Italy 4.73% 49.60%
Loans to small and medium businesses
All geographic areas 3.59% 19.75%
o/w other loans France (incl. overseas departments and territories) 3.55% 18.76%
Italy 4.58% 40.46%
All geographic areas 3.25% 15.16%
o/w secured by real estate assets France (incl. overseas departments and territories) 3.14% 15.00%
Italy 4.43% 16.98%
In addition, only France has IRBF exposure on the following portfolios: Central governments and central banks, Institutions and Corporates.
132 CRÉDIT AGRICOLE S.A. UPDATE A01 OF THE 2014 REGISTRATION DOCUMENT
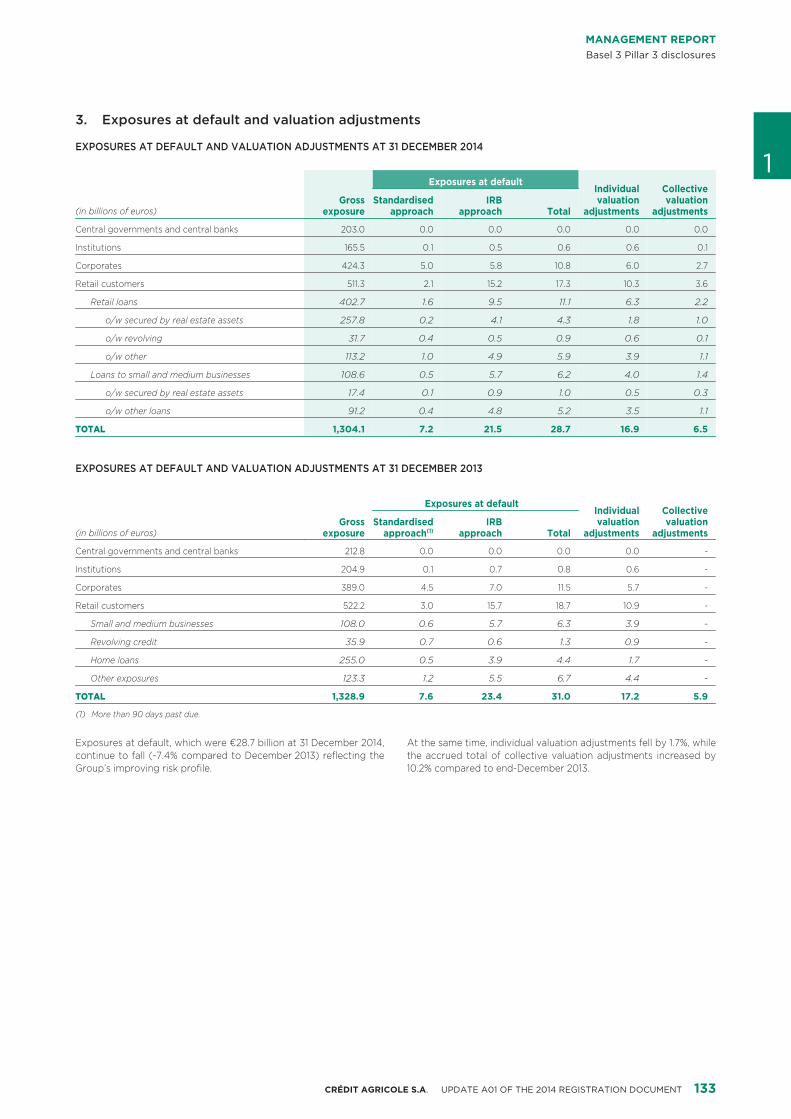
MANAGEMENT REPORTBasel 3 Pillar 3 disclosures
Exposures at default and valuation adjustments3.
EXPOSURES AT DEFAULT AND VALUATION ADJUSTMENTS AT 31 DECEMBER 2014
1Exposures at default
Individual CollectiveGross valuation valuation
exposure adjustments adjustmentsStandardised IRB
Total(in billions of euros) approach approach
Central governments and central banks 203.0 0.0 0.0 0.0 0.0 0.0
Institutions 165.5 0.1 0.5 0.6 0.6 0.1
Corporates 424.3 5.0 5.8 10.8 6.0 2.7
Retail customers 511.3 2.1 15.2 17.3 10.3 3.6
Retail loans 402.7 1.6 9.5 11.1 6.3 2.2
o/w secured by real estate assets 257.8 0.2 4.1 4.3 1.8 1.0
o/w revolving 31.7 0.4 0.5 0.9 0.6 0.1
o/w other 113.2 1.0 4.9 5.9 3.9 1.1
Loans to small and medium businesses 108.6 0.5 5.7 6.2 4.0 1.4
o/w secured by real estate assets 17.4 0.1 0.9 1.0 0.5 0.3
o/w other loans 91.2 0.4 4.8 5.2 3.5 1.1
TOTAL 1,304.1 7.2 21.5 28.7 16.9 6.5
EXPOSURES AT DEFAULT AND VALUATION ADJUSTMENTS AT 31 DECEMBER 2013
Exposures at defaultIndividual Collective
Gross valuation valuationexposure adjustments adjustments
Standardised IRBTotal(in billions of euros) approach(1) approach
Central governments and central banks 212.8 0.0 0.0 0.0 0.0 -
Institutions 204.9 0.1 0.7 0.8 0.6 -
Corporates 389.0 4.5 7.0 11.5 5.7 -
Retail customers 522.2 3.0 15.7 18.7 10.9 -
Small and medium businesses 108.0 0.6 5.7 6.3 3.9 -
Revolving credit 35.9 0.7 0.6 1.3 0.9 -
Home loans 255.0 0.5 3.9 4.4 1.7 -
Other exposures 123.3 1.2 5.5 6.7 4.4 -
TOTAL 1,328.9 7.6 23.4 31.0 17.2 5.9
More than 90 days past due.(1)
Exposures at default, which were €28.7 billion at 31 December 2014, At the same time, individual valuation adjustments fell by 1.7%, whilecontinue to fall (-7.4% compared to December 2013) reflecting the the accrued total of collective valuation adjustments increased byGroup’s improving risk profile. 10.2% compared to end-December 2013.
133CRÉDIT AGRICOLE S.A. UPDATE A01 OF THE 2014 REGISTRATION DOCUMENT
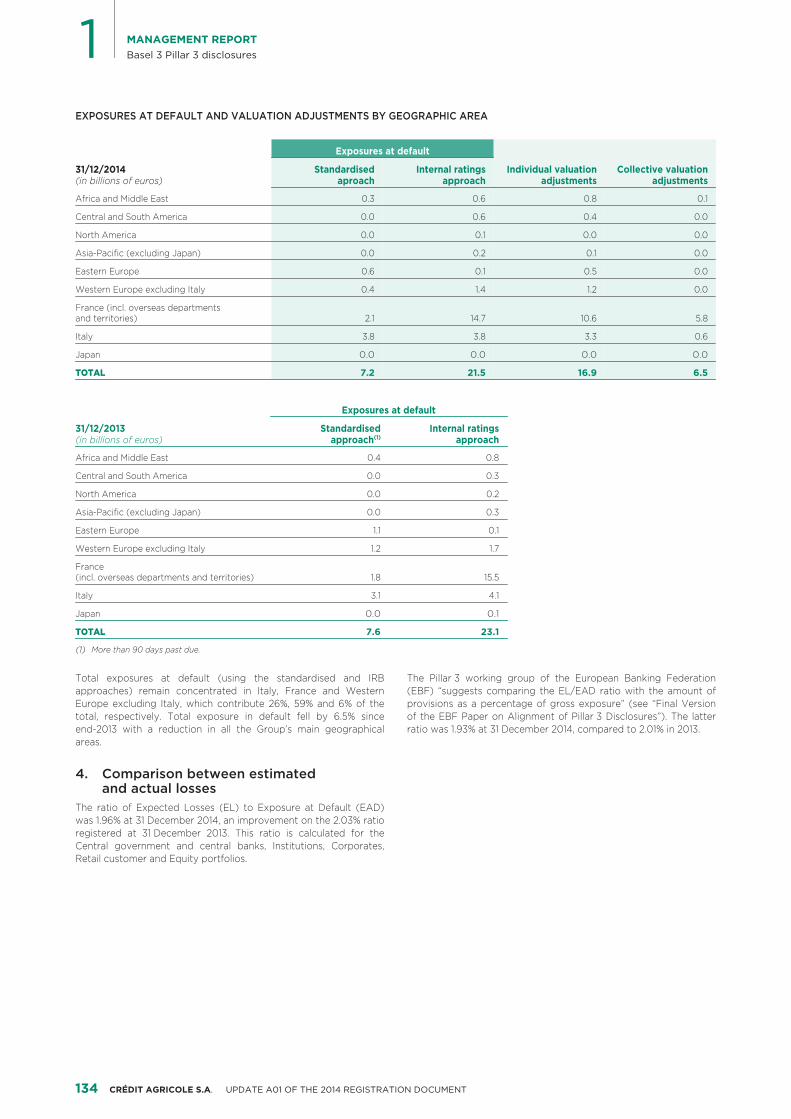
1 MANAGEMENT REPORTBasel 3 Pillar 3 disclosures
EXPOSURES AT DEFAULT AND VALUATION ADJUSTMENTS BY GEOGRAPHIC AREA
Exposures at default
31/12/2014 Individual valuation Collective valuation(in billions of euros) adjustments adjustments
Standardised Internal ratingsaproach approach
Africa and Middle East 0.3 0.6 0.8 0.1
Central and South America 0.0 0.6 0.4 0.0
North America 0.0 0.1 0.0 0.0
Asia-Pacific (excluding Japan) 0.0 0.2 0.1 0.0
Eastern Europe 0.6 0.1 0.5 0.0
Western Europe excluding Italy 0.4 1.4 1.2 0.0
France (incl. overseas departments 2.1 14.7 10.6 5.8and territories)
Italy 3.8 3.8 3.3 0.6
Japan 0.0 0.0 0.0 0.0
TOTAL 7.2 21.5 16.9 6.5
Exposures at default
31/12/2013 (in billions of euros)
Standardised Internal ratingsapproach(1) approach
Africa and Middle East 0.4 0.8
Central and South America 0.0 0.3
North America 0.0 0.2
Asia-Pacific (excluding Japan) 0.0 0.3
Eastern Europe 1.1 0.1
Western Europe excluding Italy 1.2 1.7
France 1.8 15.5(incl. overseas departments and territories)
Italy 3.1 4.1
Japan 0.0 0.1
TOTAL 7.6 23.1
More than 90 days past due.(1)
Total exposures at default (using the standardised and IRB The Pillar 3 working group of the European Banking Federationapproaches) remain concentrated in Italy, France and Western (EBF) “suggests comparing the EL/EAD ratio with the amount ofEurope excluding Italy, which contribute 26%, 59% and 6% of the provisions as a percentage of gross exposure” (see “Final Versiontotal, respectively. Total exposure in default fell by 6.5% since of the EBF Paper on Alignment of Pillar 3 Disclosures”). The latterend-2013 with a reduction in all the Group’s main geographical ratio was 1.93% at 31 December 2014, compared to 2.01% in 2013.areas.
Comparison between estimated 4.and actual losses
The ratio of Expected Losses (EL) to Exposure at Default (EAD)was 1.96% at 31 December 2014, an improvement on the 2.03% ratioregistered at 31 December 2013. This ratio is calculated for theCentral government and central banks, Institutions, Corporates,Retail customer and Equity portfolios.
134 CRÉDIT AGRICOLE S.A. UPDATE A01 OF THE 2014 REGISTRATION DOCUMENT
MANAGEMENT REPORTBasel 3 Pillar 3 disclosures
Credit risk mitigation techniquesII. denominated in different currencies. Additional haircuts are appliedwhen the size of the stocks position implies a block sale or when
Definitions: the borrower and the issuer of the collateral securities belong to
1the same risk group.collateral: a security interest giving the bank the right to■liquidate, keep or obtain title to certain amounts or assets in the The initial value of real estate assets granted as collateral is basedevent of default or other specific credit events affecting the on acquisition or construction cost. It may subsequently becounterparty, thereby reducing the credit risk on an exposure; revalued using a statistical approach based on market indices, or on
the basis of an expert appraisal performed at least annually.personal guarantee: undertaking by a third party to pay the■sum due in the event of the counterparty’s default or other For retail banking (LCL, Cariparma), revaluation is automatic basedspecific credit events, therefore reducing the credit risks on an on changes in the property market indices. Conversely, forexposure. project-type property financing, assets are mainly revalued on the
basis of an expert appraisal combining various approaches (asset
Collateral management system1. value, rental value, etc.) and including external benchmarks.
For minimum coverage ratios (or the haircut applied to theThe main categories of collateral taken by the bank are described incollateral value under Basel 2), Crédit Agricole CIB projects thethe section entitled “Risk Factors – Credit Risk – Collateral andvalue of the real estate asset between the revaluation date and theguarantees received”.date on which the collateral is realised by modelling the asset value,
When a credit is granted, collateral is analysed to assess the value and includes the repossession costs over that period. Assumptionsof the asset, its volatility and the correlation between the value of regarding liquidation periods depend on the type of financingthe collateral and the quality of the counterparty financed. (project, property investment companies, property developers,Whatever the collateral quality, the first criterion in the lending etc.).decision is always the borrower’s ability to repay sums due from
Other types of asset may also be pledged as non recourse financialcash flow generated by its operating activities, except for specificassets. This is notably the case for certain activities such as aircraft,trade finance transactions.shipping or commodities financing. These businesses are
For financial collateral, a minimum exposure coverage ratio is conducted by middle offices, which have specific expertise inusually included in loan contracts, with readjustment clauses. valuing the assets financed.Financial collateral is revalued according to the frequency of
Protection providers2.margin calls and the variability of the underlying value of financialassets transferred as collateral or quarterly, as a minimum.
Two major types of guarantee are mainly used (other thanThe minimum coverage ratio (or the haircut applied to the value ofintra-Group guarantees): export credit insurance taken out by thethe collateral under Basel 2) is determined by measuring theBank and unconditional payment guarantees.pseudo-maximum deviation of the value of the securities on the
revaluation date. This measurement is calculated with a 99% The main guarantee providers (excluding credit derivatives – seeconfidence interval over a time horizon covering the period section below) are export credit agencies, most of which enjoy abetween each revaluation, the period between the default date and good quality sovereign rating. The most important ones are Cofacethe date on which asset liquidation starts, and the duration of the (France), Sace S.p.A. (Italy), Euler Hermes (Germany) and Korealiquidation period. This haircut also applies for currency mismatch Export Insur (Korea).risk when the securities and the collateralised exposure are
FINANCIAL HEALTH RATINGS AVAILABLE FROM EXPORT CREDIT AGENCIES
Moody’s Standard & Poor’s Fitch Ratings
Rating [outlook] Rating [outlook] Rating [outlook]
Coface S.A. A2 [stable] AA- [stable]
Euler Hermès Aa3 [stable] AA- [stable]
Sace S.p.A. A- [stable]
Moreover, the guarantees received from mutual guarantee insurance company, CAMCA (rated A- by Fitch). The guarantorscompanies cover a substantial portion of the loans in the Group’s themselves are supervised by the French Prudential and Resolution“residential real estate” portfolio in France (see table hereinafter). Supervisory Authority (ACPR) and are subject to prudentialThese outstandings are backed by guarantees granted by Crédit regulation applying to either financing companies, for CréditLogement (rated Aa3 by Moody’s) or by the Group’s subsidiary Logement, or insurance companies (Solvency 1 and 2), for CAMCA.
135CRÉDIT AGRICOLE S.A. UPDATE A01 OF THE 2014 REGISTRATION DOCUMENT
1 MANAGEMENT REPORTBasel 3 Pillar 3 disclosures
AMOUNTS IN OUTSTANDING PROPERTY LOANS GUARANTEED BY CAMCA AND CRÉDIT LOGEMENT
Outstandings at 31/12/2014 Outstandings at 31/12/2013
% of guaranteed % of guaranteedloans in the loans in the“residential “residential
Amount Amounthome loans” home loans”in outstandings portfolio in outstandings portfolio
(in millions of euros) guaranteed in France guaranteed in France
Coverage by financial guarantee insurance companies 137,584 56.5% 132,467 55.1%(Crédit Logement, CAMCA)
Where Crédit Logement is concerned, the guarantee granted with the difference that the payments made by CAMCA withcovers, with no deductible, the payment of all amounts legally due respect to the guarantee arise once the bank’s means of recourseby defaulting borrowers in principal, interest, insurance premiums against the borrower have been exhausted. In the end, theseand costs. When the guarantee is granted, the guarantor applies an guarantee provisions significantly enhance the quality of the homeindependent selection policy in addition to that already loans guaranteed and constitute a full transfer of risk in respect ofimplemented by the bank. Where CAMCA is concerned, the these outstandings.guarantee mechanism is broadly similar to that of Crédit Logement,
Use of credit derivatives for hedging purposes3.Credit derivatives used for hedging purposes are described in the listed and non-listed equities and shares in investment funds;■section entitled “Risk Factors – Credit Risk – Credit Risk Mitigation options implicit in convertible, redeemable or exchangeable■Mechanisms – Use of Credit Derivatives”. bonds;
Securitisation transactionsIII.stock options;■
deeply subordinated securities.■The credit risk on securitisation transactions is presented in the
Non-consolidated equity interests are acquired for managementSecuritisation chapter below.
purposes (financial assets at fair value through profit or loss or
Equity exposures in the banking IV.designated as at fair value through profit or loss or held-for-trading,available-for-sale financial assets, held-to-maturity financial assetsloans and receivables) as described in Note 1.3 to the financial
portfolio statements entitled “Accounting policies and principles”.
Crédit Agricole Group’s equity exposures, excluding the trading The accounting policies and valuation methods used are describedbook, consist of securities “that convey residual, subordinated in Note 1.3 to the financial statements “Accounting policies andclaims on the assets or income of the issuer or have a similar principles”.economic substance”. These mainly include:
GROSS EXPOSURE AND EXPOSURE AT DEFAULT BY EXPOSURE CLASS
31/12/2014 31/12/2013
Exposure at Exposure atGross exposure Gross exposure(in billions of euros) default default
Equity exposures under the internal ratings-based approach 16.9 16.4 14.6 14.0
Private equity exposures in sufficiently diversified portfolios 0.8 0.8 1.2 1.2
Listed equity exposures 1.7 1.6 2.1 1.9
Other equity exposures 14.4 14.0 11.3 10.9
Equity exposures under the standardised approach 1.6 1.4 3.2 2.2
TOTAL EQUITY EXPOSURE 18.5 17.8 17.8 16.2
Equity exposures under the internal ratings-based approach mainly The cumulative amount of realised gains or losses on sales andconsist of the portfolios of Crédit Agricole S.A., Crédit Agricole CIB settlements over the period under review is presented in Note 4 toand Crédit Agricole Investissement et Finance. the financial statements “Notes to the income statement”.
The value of the equity exposures under the internal ratings basedapproach amounted to €16.9 billion at 31 December 2014(compared with €14.6 billion at 31 December 2013).
136 CRÉDIT AGRICOLE S.A. UPDATE A01 OF THE 2014 REGISTRATION DOCUMENT
MANAGEMENT REPORTBasel 3 Pillar 3 disclosures
SECURITISATION
1DefinitionsI. Purpose and strategyII.Crédit Agricole Group carries out securitisation transactions as an
Securitisation transactions on own 1.originator, arranger or as an investor according to the Basel 3criteria. accountThe securitisation transactions, listed below, consist of transactions Crédit Agricole Group’s securitisation transactions on own accountdefined in the CRD 4 and CRR in force since 1 January 2014. The are the following:directive and regulations incorporate into European law the
COLLATERALISED FINANCING TRANSACTIONSinternational Basel 3 reforms (issued in December 2010)introducing, among other things, new requirements for bank These transactions are designed for the issue of securities and,solvency and oversight of liquidity risk. They cover transactions or where appropriate, can be wholly or partially placed with investors,schemes under which the credit risk associated with an exposure or sold under repurchase agreements or kept on the issuer’s balancepool of exposures is sub-divided into tranches with the following sheet as liquid securities reserves that can be used to managefeatures: refinancing. This activity relates to several of the Group’s entities,
mainly CA Consumer Finance and its subsidiaries.payments depend on the performance of the underlying■exposure or pool of exposures;
ACTIVE MANAGEMENT OF CRÉDIT AGRICOLE CIB’S the subordination of tranches determines how losses are■ CORPORATE FINANCING PORTFOLIOdistributed over the life of the transaction or scheme. This activity consists of using securitisations and credit derivatives
to manage the credit risk of Crédit Agricole CIB’s corporateSecuritisation transactions include:financing portfolio. It entails purchasing credit derivatives on single
traditional securitisations: imply the economic transfer of the■ exposures (see section on “Risk factors” – “Credit risks” sectionsecuritised exposures. This means the transfer of ownership of – “Use of credit derivatives”) and protections on asset portfoliothe securitised exposures by the reporting originating institution tranches to reduce the risk. It also entails selling credit derivativesdirectly to a securitisation vehicle or via a vehicle’s and senior tranches for the purpose of diversification and to reducesub-investment in the securitised exposures. Notes issued by the sensitivity of the protection portfolio.the securitisation vehicle do not constitute payment obligations
Such credit risk management aims at reducing the concentration offor the reporting originating institution;outstanding loans to companies, freeing up resources to favour
synthetic securitisations: the credit risk is transferred through■ origination and cutting loss levels. This business is managed bythe use of credit derivatives or guarantees and the pool of Crédit Agricole CIB’s Credit Portfolio Management team. Thesecuritised exposures is kept on the balance sheet of the approach used to calculate the risk weighted exposures onreporting originating institution. proprietary securitisation positions is the regulatory formula
approach. In this business, the bank does not systematicallyThe securitisation exposures detailed below cover all securitisationpurchase protection on all tranches of a portfolio, as theexposures (recorded on or off-balance sheet) that generate riskmanagement goal is to cover some of the more risky financingweighted assets (RWA) and capital requirements with respect toportfolio tranches whilst keeping part of the overall risk.the Group’s regulatory portfolio, according to the following
typologies:CRÉDIT AGRICOLE CIB DISCONTINUING ACTIVITIES
originator programmes, deemed efficient under Basel 3 insofar■These consist of investments in securitisation tranches that areas there is a significant transfer of risks;either managed in run-off, or exposures for which the risk is
programmes as arranger/sponsor, in which the Group has■ considered to be low and that Crédit Agricole CIB is willing to carrymaintained positions; for the long term. These were segregated into a dedicated
regulatory banking book in 2009. These activities generate noprogrammes issued by third parties in which the Group has■market risk.invested;
Securitisation transactions carried 2.securitisation swap positions (exchange or interest rate hedges)■offered to securitisation vehicles.
out on behalf of customers as The securitisation transactions on own account carried out as part arranger/sponsor, intermediary or of non-derecognised collateralised financing operations, are not originatordescribed below. Their impact on the consolidated financialstatements is detailed in Notes 12.1.3 and 6.7 “Securitisation Within Crédit Agricole Group, only Crédit Agricole CIB carries outtransactions and dedicated funds” and “Transferred assets not securitisation transactions on behalf of customers.derecognised or derecognised with continuing involvement” to the
Securitisation transactions on behalf of customers within Globalfinancial statements.Markets activities allow Crédit Agricole CIB to raise funds or
It should be noted that most securitisation transactions on behalf of manage a risk exposure on behalf of its customers. When carryingEuropean customers involve Ester Finance Titrisation, a fully-owned out these activities, Crédit Agricole CIB can act as an originator,banking subsidiary of Crédit Agricole CIB, which finances the sponsor/arranger or investor:purchase of receivables. By definition, securitisation transactions
as a sponsor/arranger, Crédit Agricole CIB structures and■on behalf of customers using this structure are classified under themanages securitisation programmes that refinance assets of therole of originator.bank’s customers, mainly via the ABCP (Asset BackedCommercial Paper) conduits, LMA in Europe and Atlantic in theUnited States. These special purpose vehicles arebankruptcy-remote and consolidated at Group level sinceIFRS 10 came into effect on 1 January 2014. The roles ofCrédit Agricole CIB Group as a sponsor of the conduits and amanager and provider of liquidity facilities bestow it with powerdirectly linked to the variability of the activity’s yields. Theliquidity facilities protect the investors against credit risk andguarantee the liquidity of the conduits;
137CRÉDIT AGRICOLE S.A. UPDATE A01 OF THE 2014 REGISTRATION DOCUMENT
1 MANAGEMENT REPORTBasel 3 Pillar 3 disclosures
as an originator, Crédit Agricole CIB participates directly or■ ACTIVITIES CARRIED OUT AS INVESTOR2.2indirectly in the original agreement on the assets, which are As part of its sponsor activities, the Group can grant guaranteessubsequently used as underlyings for the securitisation and liquidity facilities to securitisation vehicles or act as atransaction, mainly for the purpose of refinancing. This is the counterparty for derivatives in ad hoc securitisation transactions.case for the securitisation programmes involving Ester Finance These are mainly exchange rate swaps provided to the ABCPTitrisation; conduits and interest rate swaps for some ABS issues. These
activities are recorded in the banking portfolio as investor activities.as an investor, the Group invests directly in certain securitisation■exposures and is a liquidity provider or counterparty of Moreover, Crédit Agricole CIB may be called upon to directlyderivative exposures (i.e. exchange or interest rate swaps). finance on its balance sheet some securitisation transactions on
behalf of its customers. In this case, Crédit Agricole CIB is deemedACTIVITIES CARRIED OUT AS 2.1 to be an investor. Overall, this activity corresponded toARRANGER/SPONSOR, INTERMEDIARY OR outstandings of €1.5 billion at 31 December 2014 (€1.8 billion atORIGINATOR
31 December 2013), including €1.2 billion in acquired securities.Crédit Agricole CIB carries out securitisation transactions on behalf
INTERMEDIATION TRANSACTIONS2.3of its customers. At 31 December 2014, there were two activeconsolidated multi-seller vehicles (LMA and Atlantic), structured by Crédit Agricole CIB participates in pre-securitisation financing, inthe Group on behalf of third parties. This ABCP conduits activity the structuring and in the placement of securities, backed by clientfinances the working capital requirements of some of the Group’s asset pools and to be placed with investors.customers by backing short term financing with traditional assets,
In this business, the bank retains a relatively low risk via the possiblesuch as commercial or financial loans. The amount of the assetscontribution of back-up lines to securitisation vehicles or via a shareheld by these vehicles and financed through the issuance ofof the notes issued.marketable securities amounted to €16.1 billion at 31 December 2014
(€14.1 billion at 31 December 2013).
Risk monitoring and recognitionIII.The default risk on the assets held by these vehicles is borne by thesellers of the underlying receivables through credit enhancement or
Risk monitoring1.by insurers for certain types of risk upstream of the ABCP conduits.Crédit Agricole CIB bears the risk for the two ABCP conduits via€21.9 billion of liquidity facilities at 31 December 2014 (€18.5 billion The management of risks related to securitisation transactionsat 31 December 2013). It should be noted that the Securitisation follows the rules established by the Group, according to whichbusiness has never sponsored any SIVs (Structured Investment these assets are recorded in the banking portfolio (credit andVehicles). counterparty risk) or in the trading book (market and counterparty
risk).Activities carried out as arranger/sponsor2.1.1
Outside Crédit Agricole CIB, the Group’s only securitisationThe conduits activity was sustained throughout 2014 and the newlytransactions are traditional securitisations that the Group carriessecuritised outstandings mainly relate to commercial and financialout on own account as an originator, as part of collateralisedloans.financing transactions. The monitoring of the risk in respect of the
For part of this conduits activity, Crédit Agricole CIB acts as the underlying assets is not modified by these transactions.originator insofar as the structures involve the entity Ester Finance
The development, sizing and targeting of securitisation transactionsTitrisation, which is a consolidated Group entity.are periodically reviewed by Portfolio Strategy Committees specific
Thus, by excluding this part of the transactions, the amount to those activities and the countries to which they relate.committed to liquidity facilities granted to LMA and Atlantic, as
Risks on securitisation transactions are measured against thearrangers and sponsors, amounted to €11.5 billion at 31 Decembercapacity of the assets transferred over to financing structures to2014 (€11.2 billion at 31 December 2013).generate sufficient flows to cover the costs, mainly, financial of
Activities carried out as originator2.1.2these structures.
Crédit Agricole CIB’s securitisation exposures are treated inThis activity relates to all securitisation programmes on behalf ofaccordance with the IRB-securitisation framework approach, i.e.:customers for which the underlying receivables are transferred to
Ester Finance Titrisation, which is a consolidated Group entity. Ratings-Based Approach (RBA) for exposures with a public■Although the financing is carried out via ABCP conduits, as external rating (directly or inferred) from an agency approveddescribed above, the fact that the receivables are accounted for by the Committee of European Banking Supervisors (CEBS).through the Group’s balance sheet allows Crédit Agricole to be The external agencies used are Standard & Poor’s, Moody’s,classed as an originator for these transactions. Fitch Ratings and Dominion Bond Rating Services (DBRS);
This activity is carried out in Europe only and the exposure amount Internal Assessment Approach (IAA): internal rating■was €10.4 billion at 31 December 2014 (€7.3 billion at 31 December methodology approved by Crédit Agricole S.A. ’s Standards and2013). Methodology Committee for the main asset classes (particularly
commercial loans) when there are no agency ratings for theexposure under consideration;
Supervisory Formula Approach (SFA): in residual cases where■there are neither public external ratings nor any possibility ofapplying the IAA method for exposures with no public externalrating.
138 CRÉDIT AGRICOLE S.A. UPDATE A01 OF THE 2014 REGISTRATION DOCUMENT
MANAGEMENT REPORTBasel 3 Pillar 3 disclosures
These ratings cover all types of risks generated by these Moreover, investments made in securitisation instruments (cash orsecuritisation transactions: intrinsic risks on receivables (debtor synthetic) are recognised according to their classification and theinsolvency, payment delays, dilution, offsetting of receivables) or associated valuation method.
1risks on the structuring of transactions (legal risks, risks relating to These elements are presented in Note 1.3 to the consolidatedthe receivables collection circuit, risks relating to the quality of financial statements, on accounting principles and methods.information supplied periodically by managers of transferred
The securitisation exposures can be classified in the followingreceivables, etc.).accounting categories:
These critically examined ratings are only a tool for making“Loans and receivables”: these securitisation exposures are■decisions pertaining to these transactions; such decisions are takenmeasured following initial recognition at amortised cost basedby Credit Committees at various levels.on the effective interest rate and may, if necessary, be impaired;
Credit decisions relate to transactions that are reviewed at least“Available-for-sale financial assets”: these securitisation■once a year by the same Committees. Committee decisionsexposures are remeasured at fair value on the closing date andincorporate varying limits according to the evolution of theany changes in fair value are recognised in other comprehensiveacquired portfolio (arrears rate, loss rate, rate of sector-based orincome;geographical concentration, rate of dilution of receivables or
periodic valuation of assets by independent experts, etc.); “Financial assets at fair value through profit or loss”: these■non-compliance with these limits may cause the structure to securitisation exposures are remeasured at fair value on thebecome stricter or place the transaction in early amortisation. closing date and any changes in fair value are recognised
through profit or loss under “Net gains (losses) on financialThese credit decisions also include, in liaison with the Bank’s otherinstruments at fair value through profit or loss”.Credit Committees, an assessment focusing on the risk generated
by the sellers of the receivables and the possibility of substituting Gains (losses) on the disposal of these securitisation exposures arethe manager by a new one in the event of a failure in the recognised in accordance with the rules of the original category ofmanagement of those receivables. the exposures sold.Like all credit decisions, these decisions include aspects of So, for exposures classified under loans and receivables and undercompliance and “country risk”. available-for-sale financial assets, gains (losses) on disposal are
recognised through profit or loss on the “Net gains (losses) onThe liquidity risk associated with securitisation activities isavailable-for-sale financial assets” respectively on the “Gainsmonitored by the business lines in charge, but also centrally by(losses) on disposal of loans and receivables” and “Gains (losses)Crédit Agricole CIB’s Market Risk and Asset and Liabilityon disposal of available-for-sale financial assets” lines.Management departments. The impact of these activities is
incorporated into the Internal Liquidity Model indicators, mainly For exposures classified at market value through profit or loss,stress scenarios, liquidity ratios and liquidity gaps. The gains (losses) on disposal are recognised under “Net gains (losses)management of liquidity risk is described in more detail in the on financial instruments at fair value through profit or loss”.paragraph entitled “Liquidity and financing risk” of the “Risk
At 31 December 2014, Crédit Agricole CIB had no assets awaitingFactors” section in this chapter.securitisation.
The management of structural currency risk with respect to
Summary of activity on behalf IV.securitisation activities does not differ from that of the Group’sother assets. As regards interest rate risk management, securitisedassets are refinanced through ad hoc vehicles according to interest of customers in 2014rate matching rules similar to those applying to other assets.
Crédit Agricole CIB’s Securitisation activity in 2014 wasFor assets managed in run-off mode, each transfer of position ischaracterised by:first approved by Crédit Agricole CIB’s Market Risk department.
support of the development of the public ABS market in the■Crédit Agricole CIB had no secondary securitisation positions atUnited States and its reopening in Europe. Crédit Agricole CIB31 December 2014 and therefore carries out no specific monitoringstructured and organised the placement (arranger andof this activity.bookrunner) of a significant number of primary ABS issues on
Accounting policies2.behalf of its major “Financial institution” customers, in particularin the car industry and consumer financing;
Under securitisation transactions, a derecognition test is carried out on the ABCP conduits market, Crédit Agricole CIB maintained its■with respect to IAS 39. ranking as one of the leaders on this segment, both in Europe
and in the American market. This was achieved via the renewalIn the case of synthetic securitisations, the assets are notand implementation of new securitisation operations forderecognised in that they remain under the control of thecommercial or financial loans on behalf of its mainly Corporateinstitution. The assets are still recognised according to theircustomers, while ensuring that the profile of risks borne by theclassification and original valuation method.Bank remained good. The strategy of Crédit Agricole CIB,
The traditional securitisations of its financial assets that the Group focused on the financing of its customers, is well perceived bycarries out on own account are performed as part of collateralised investors and resulted in financing conditions that remainedfinancing operations that are not derecognised (neither from an competitive.accounting nor a regulatory perspective). Their impact on the
At 31 December 2014, Crédit Agricole CIB had no early-redemptionconsolidated financial statements is detailed in Notes 12.1.3 and 6.7securitisation programmes, no assets awaiting securitisation and noto the financial statements “Securitisation transactions andre-securitisation exposures.dedicated funds” and “Transferred assets not derecognised
or derecognised with continuing involvement”. At 31 December 2014, Crédit Agricole CIB did not support anysecuritisation programmes within the meaning of Article 248paragraph 1, of Regulation (EU) no. 575/2013 of 26 June 2013.
139CRÉDIT AGRICOLE S.A. UPDATE A01 OF THE 2014 REGISTRATION DOCUMENT
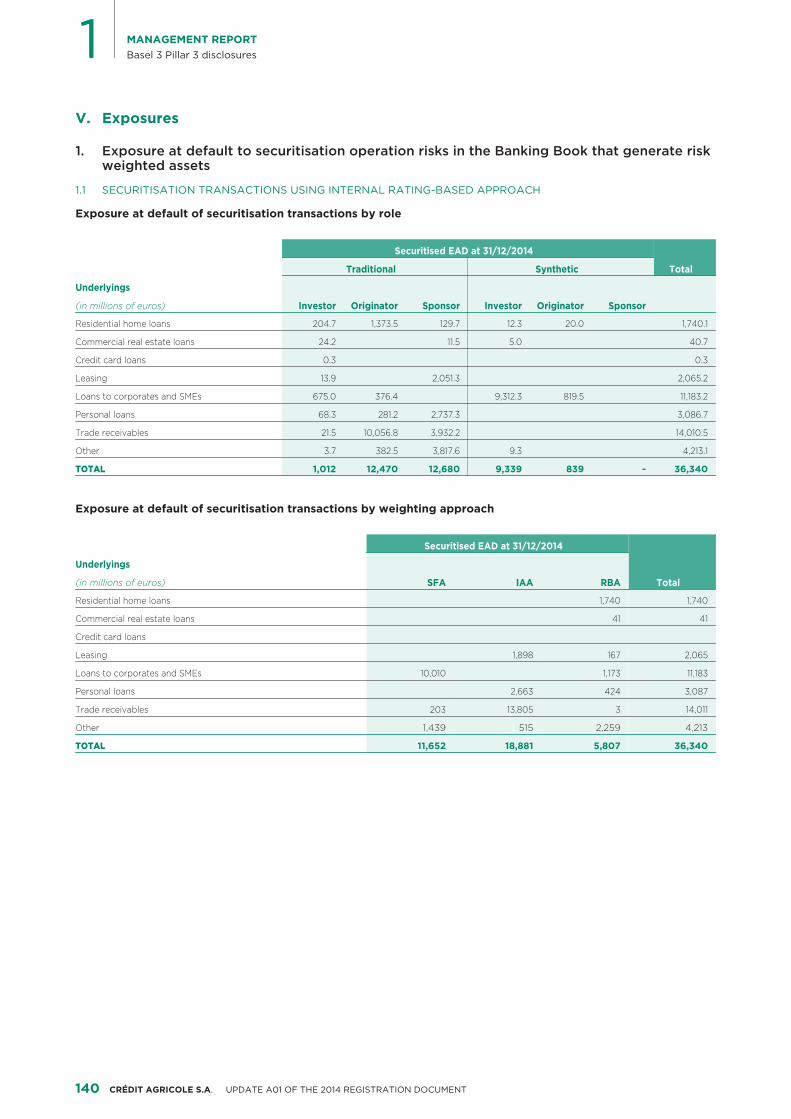
1 MANAGEMENT REPORTBasel 3 Pillar 3 disclosures
ExposuresV.
Exposure at default to securitisation operation risks in the Banking Book that generate risk 1.weighted assets
SECURITISATION TRANSACTIONS USING INTERNAL RATING-BASED APPROACH1.1
Exposure at default of securitisation transactions by role
Securitised EAD at 31/12/2014
TotalTraditional Synthetic
Underlyings
(in millions of euros) Investor Originator Sponsor Investor Originator Sponsor
Residential home loans 204.7 1,373.5 129.7 12.3 20.0 1,740.1
Commercial real estate loans 24.2 11.5 5.0 40.7
Credit card loans 0.3 0.3
Leasing 13.9 2,051.3 2,065.2
Loans to corporates and SMEs 675.0 376.4 9,312.3 819.5 11,183.2
Personal loans 68.3 281.2 2,737.3 3,086.7
Trade receivables 21.5 10,056.8 3,932.2 14,010.5
Other 3.7 382.5 3,817.6 9.3 4,213.1
TOTAL 1,012 12,470 12,680 9,339 839 - 36,340
Exposure at default of securitisation transactions by weighting approach
Securitised EAD at 31/12/2014
Total
Underlyings
(in millions of euros) SFA IAA RBA
Residential home loans 1,740 1,740
Commercial real estate loans 41 41
Credit card loans
Leasing 1,898 167 2,065
Loans to corporates and SMEs 10,010 1,173 11,183
Personal loans 2,663 424 3,087
Trade receivables 203 13,805 3 14,011
Other 1,439 515 2,259 4,213
TOTAL 11,652 18,881 5,807 36,340
140 CRÉDIT AGRICOLE S.A. UPDATE A01 OF THE 2014 REGISTRATION DOCUMENT
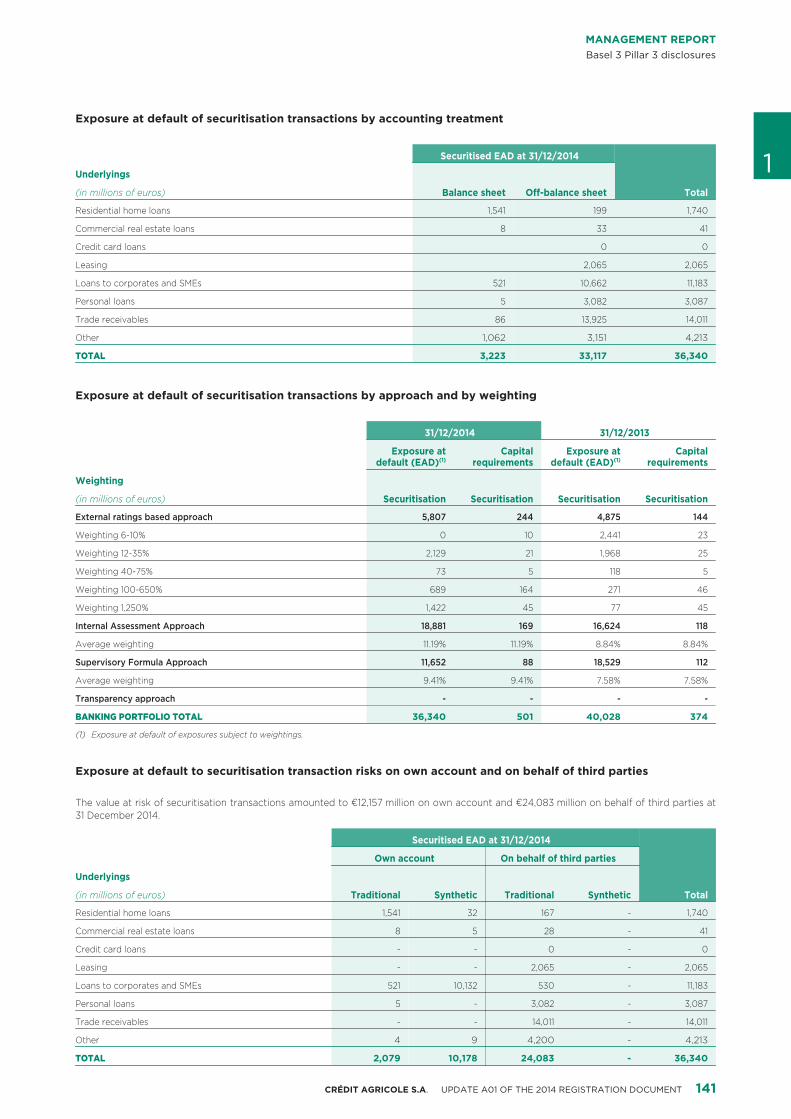
MANAGEMENT REPORTBasel 3 Pillar 3 disclosures
Exposure at default of securitisation transactions by accounting treatment
Securitised EAD at 31/12/2014
Total
1Underlyings
(in millions of euros) Balance sheet Off-balance sheet
Residential home loans 1,541 199 1,740
Commercial real estate loans 8 33 41
Credit card loans 0 0
Leasing 2,065 2,065
Loans to corporates and SMEs 521 10,662 11,183
Personal loans 5 3,082 3,087
Trade receivables 86 13,925 14,011
Other 1,062 3,151 4,213
TOTAL 3,223 33,117 36,340
Exposure at default of securitisation transactions by approach and by weighting
31/12/2014 31/12/2013
Exposure at Capital Exposure at Capitaldefault (EAD)(1) requirements default (EAD)(1) requirements
Weighting
(in millions of euros) Securitisation Securitisation Securitisation Securitisation
External ratings based approach 5,807 244 4,875 144
Weighting 6-10% 0 10 2,441 23
Weighting 12-35% 2,129 21 1,968 25
Weighting 40-75% 73 5 118 5
Weighting 100-650% 689 164 271 46
Weighting 1,250% 1,422 45 77 45
Internal Assessment Approach 18,881 169 16,624 118
Average weighting 11.19% 11.19% 8.84% 8.84%
Supervisory Formula Approach 11,652 88 18,529 112
Average weighting 9.41% 9.41% 7.58% 7.58%
Transparency approach - - - -
BANKING PORTFOLIO TOTAL 36,340 501 40,028 374
Exposure at default of exposures subject to weightings.(1)
Exposure at default to securitisation transaction risks on own account and on behalf of third parties
The value at risk of securitisation transactions amounted to €12,157 million on own account and €24,083 million on behalf of third parties at31 December 2014.
Securitised EAD at 31/12/2014
Total
Own account On behalf of third parties
Underlyings
(in millions of euros) Traditional Synthetic Traditional Synthetic
Residential home loans 1,541 32 167 - 1,740
Commercial real estate loans 8 5 28 - 41
Credit card loans - - 0 - 0
Leasing - - 2,065 - 2,065
Loans to corporates and SMEs 521 10,132 530 - 11,183
Personal loans 5 - 3,082 - 3,087
Trade receivables - - 14,011 - 14,011
Other 4 9 4,200 - 4,213
TOTAL 2,079 10,178 24,083 - 36,340
141CRÉDIT AGRICOLE S.A. UPDATE A01 OF THE 2014 REGISTRATION DOCUMENT
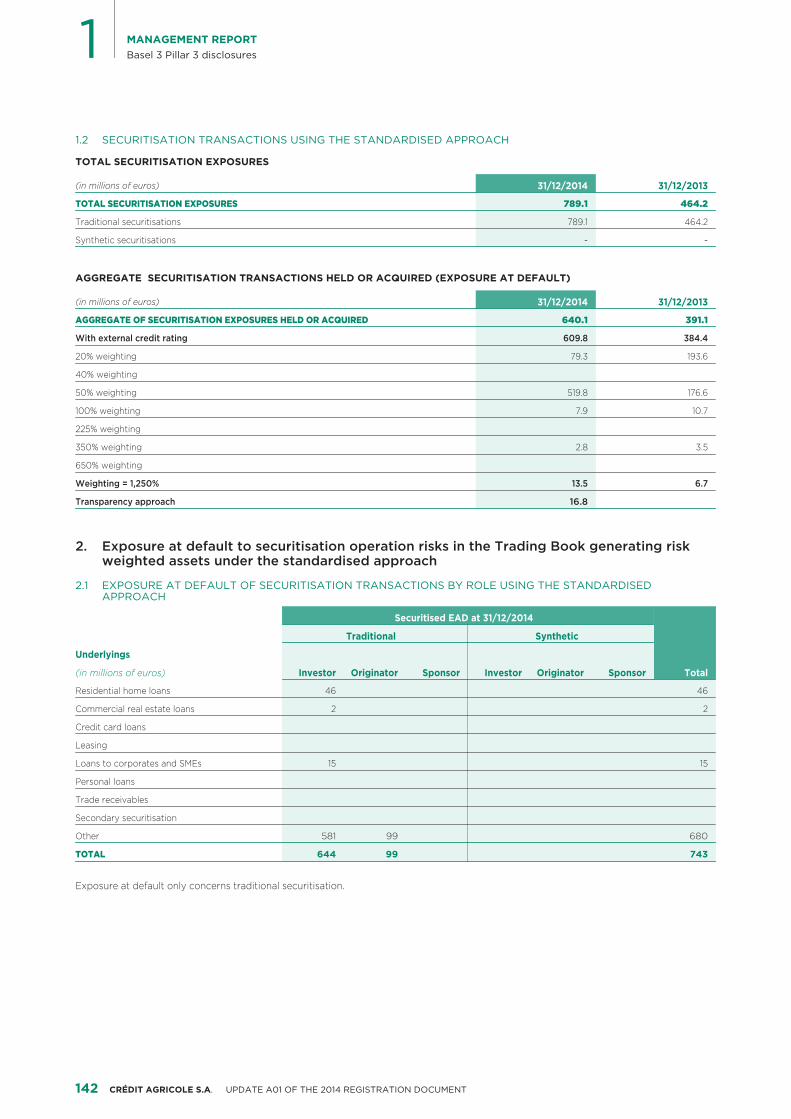
1 MANAGEMENT REPORTBasel 3 Pillar 3 disclosures
SECURITISATION TRANSACTIONS USING THE STANDARDISED APPROACH1.2
TOTAL SECURITISATION EXPOSURES
31/12/2014 31/12/2013(in millions of euros)
TOTAL SECURITISATION EXPOSURES 789.1 464.2
Traditional securitisations 789.1 464.2
Synthetic securitisations - -
AGGREGATE SECURITISATION TRANSACTIONS HELD OR ACQUIRED (EXPOSURE AT DEFAULT)
31/12/2014 31/12/2013(in millions of euros)
AGGREGATE OF SECURITISATION EXPOSURES HELD OR ACQUIRED 640.1 391.1
With external credit rating 609.8 384.4
20% weighting 79.3 193.6
40% weighting
50% weighting 519.8 176.6
100% weighting 7.9 10.7
225% weighting
350% weighting 2.8 3.5
650% weighting
Weighting = 1,250% 13.5 6.7
Transparency approach 16.8
Exposure at default to securitisation operation risks in the Trading Book generating risk 2.weighted assets under the standardised approach
EXPOSURE AT DEFAULT OF SECURITISATION TRANSACTIONS BY ROLE USING THE STANDARDISED 2.1APPROACH
Securitised EAD at 31/12/2014
Total
Traditional Synthetic
Underlyings
(in millions of euros) Investor Originator Sponsor Investor Originator Sponsor
Residential home loans 46 46
Commercial real estate loans 2 2
Credit card loans
Leasing
Loans to corporates and SMEs 15 15
Personal loans
Trade receivables
Secondary securitisation
Other 581 99 680
TOTAL 644 99 743
Exposure at default only concerns traditional securitisation.
142 CRÉDIT AGRICOLE S.A. UPDATE A01 OF THE 2014 REGISTRATION DOCUMENT
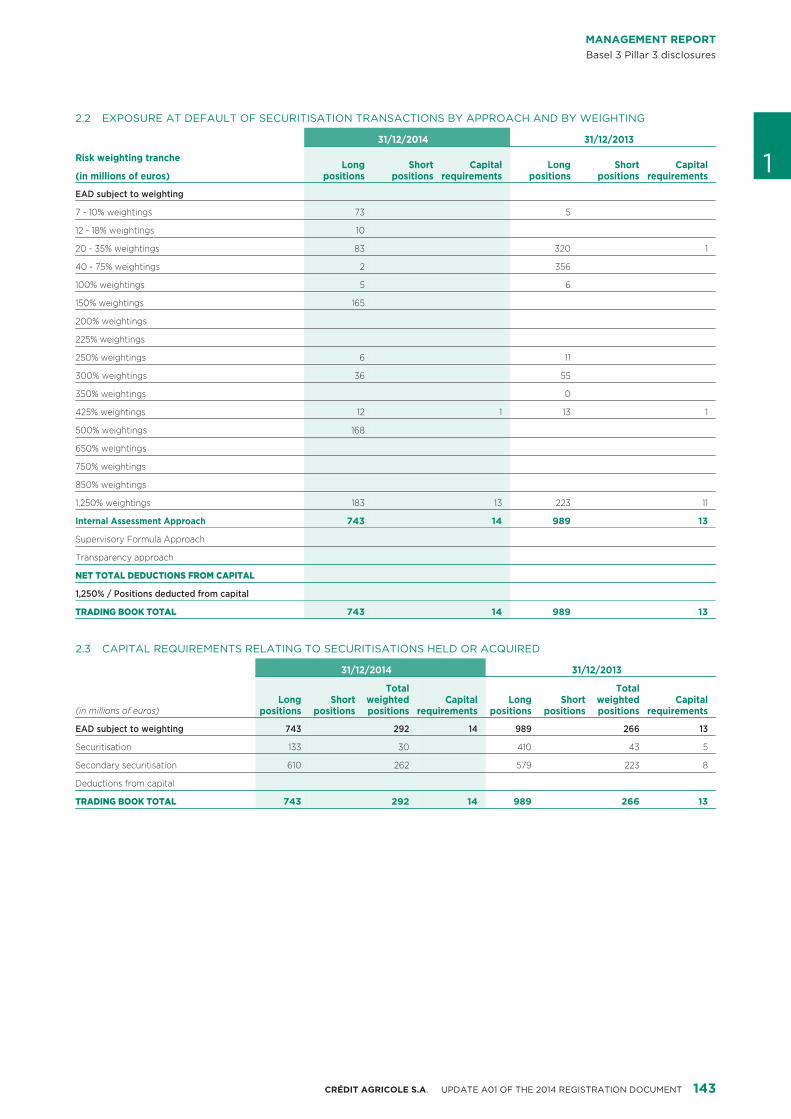
MANAGEMENT REPORTBasel 3 Pillar 3 disclosures
EXPOSURE AT DEFAULT OF SECURITISATION TRANSACTIONS BY APPROACH AND BY WEIGHTING2.2
31/12/2014 31/12/2013
Risk weighting trancheLong Short Capital Long Short Capital
(in millions of euros) positions positions requirements positions positions requirements1
EAD subject to weighting
7 - 10% weightings 73 5
12 - 18% weightings 10
20 - 35% weightings 83 320 1
40 - 75% weightings 2 356
100% weightings 5 6
150% weightings 165
200% weightings
225% weightings
250% weightings 6 11
300% weightings 36 55
350% weightings 0
425% weightings 12 1 13 1
500% weightings 168
650% weightings
750% weightings
850% weightings
1,250% weightings 183 13 223 11
Internal Assessment Approach 743 14 989 13
Supervisory Formula Approach
Transparency approach
NET TOTAL DEDUCTIONS FROM CAPITAL
1,250% / Positions deducted from capital
TRADING BOOK TOTAL 743 14 989 13
CAPITAL REQUIREMENTS RELATING TO SECURITISATIONS HELD OR ACQUIRED2.3
31/12/2014 31/12/2013
Total TotalLong Short Capital Long Short Capitalweighted weighted
(in millions of euros) positions positions positions requirements positions positions positions requirements
EAD subject to weighting 743 292 14 989 266 13
Securitisation 133 30 410 43 5
Secondary securitisation 610 262 579 223 8
Deductions from capital
TRADING BOOK TOTAL 743 292 14 989 266 13
143CRÉDIT AGRICOLE S.A. UPDATE A01 OF THE 2014 REGISTRATION DOCUMENT
1 MANAGEMENT REPORTBasel 3 Pillar 3 disclosures
MARKET RISK
Internal model market risk I. Measurement models are reviewed periodically as described in thesection entitled “Risk factors – Market risk – Market riskmeasurement and management measurement and management methodology”.
methodology
Interest rate risk from transactions III.Market risk measurement and management internal methods aredescribed in the section entitled “Risk factors – Market risk – Market
other than those included risk measurement and management methodology”.
in the trading book – Global interest Rules and procedures for valuing II. rate riskthe trading book The nature of interest rate risk, the main underlying assumptions
retained and the frequency of interest rate risk measurements areThe rules for valuing the various items in the trading book are described in the section entitled “Risk factors – Asset/Liabilitydescribed in Note 1.3 to the financial statements, “Accounting Management - Global interest rate risk”.policies and principles”.
OPERATIONAL RISK
Advanced measurement approachI. Insurance techniques for reducing II.operational riskThe scope of application of the advanced measurement and
standardised approaches and a description of the advanced The insurance techniques used to reduce operational risk aremeasurement approach methodology are provided in the section described in the section entitled “Risk factors - Operational riskentitled “Risk factors – Operational risk - Methodology”. Insurance and coverage of operational risks”.
COMPENSATION POLICY
The information on the compensation policy required pursuant toEU Regulation 575-2013 (CRR) can be found in Chapter 3 of the2014 Registration document.
144 CRÉDIT AGRICOLE S.A. UPDATE A01 OF THE 2014 REGISTRATION DOCUMENT