Embed Size (px)
Citation preview

Picturing Public Health Law Research: Using Causal Diagrams to Model and Test Theory
A Methods Monograph
PUBLIC HEALTH LAW RESEARCH
October 27, 2011

1
Pic
turi
ng P
ub
lic H
ea
lth
La
w R
ese
arc
h:
Usin
g C
au
sa
l D
iag
ram
s t
o M
od
el a
nd
Te
st
Th
eo
ry |
10
/2
7/2
01
1
Picturing Public Health Law Research: Using Causal Diagrams to
Model and Test Theory
A Methods Monograph
for the Public Health Law Research Program (PHLR)
Temple University Beasley School of Law
By:
Jeffrey Swanson, PhD Professor
School of Medicine Duke University
Jennifer Ibrahim, PhD, MPH, MA Associate Professor
College of Health Professions and Social Work Temple University
PHLR is a national program of the Robert Wood Johnson Foundation

2
Pic
turi
ng P
ub
lic H
ea
lth
La
w R
ese
arc
h:
Usin
g C
au
sa
l D
iag
ram
s t
o M
od
el a
nd
Te
st
Th
eo
ry |
1
0/2
7/2
01
1
Summary
Given the multidisciplinary perspectives of Public Health Law Research (PHLR) and the wide range
of topics included in PHLR, the use of commonly-understood pictures to illustrate the ways in
which law and health interact can be invaluable (Burris et al., 2010). Ranging from laws that prohibit
individual behaviors, to laws that provide authority to act, to laws that regulate organizational
practices, PHLR seeks to understand the mechanisms by which laws can improve health; visualizing
these mechanisms in diagrams is an important tool for achieving such an understanding. The
purpose of this monograph is to review some basic conventions used to create visual models,
evaluate relevant examples of models in published PHLR studies, and offer recommendations for
constructing clear and informative models.
Causal diagrams can do important work in PHLR, insofar as they answer several kinds of
questions. They can help to describe (“how things are now…”), classify (“why things go
together…”), explain (“how things really work…”), predict (“what will happen if…”), and decide
(“what you should do now…”) As conceptual models, CDs not only map the steps by which law
may impact health, but also allow a researcher to more carefully consider the set of measures to be
used in developing a methodologically rigorous study. Models that exhibit valid correspondence and
are appropriately complex yet clear will help PHLR researchers plan and carry out their work.
Images that accurately represent the topic at hand may also be useful for policymakers in
understanding new evidence for the many ways that laws may improve population health.

3
Pic
turi
ng P
ub
lic H
ea
lth
La
w R
ese
arc
h:
Usin
g C
au
sa
l D
iag
ram
s t
o M
od
el a
nd
Te
st
Th
eo
ry |
10
/2
7/2
01
1
Introduction
“One picture is worth ten thousand words.” – Frederick Barnard
In 1927, New York publicist Frederick Barnard published a misattributed “Chinese proverb”
that captured an obvious, yet profound idea. Barnard was trying to sell advertising space on
streetcars, but the phrase aptly expressed a core truth about human cognition and learning: that we
naturally use symbolic pictures to apprehend, organize, summarize, remember, and convey complex
information.
Whether it is worth ten thousand or one thousand words (as today’s shortened version of
Barnard’s adage has it), the reason we can trade all that language for “a picture” is that we
understand the world around us largely through a process of simplifying representation (Dansereau
& Simpson, 2009). We organize complex information into small chunks that can be visualized and
recalled. We build mental models of the world—of what the chunks stand for, how they fit together
and causally affect each other—and we unconsciously test and adapt such models to accommodate
new, corresponding observations and experiences over a lifetime.
These images of our surroundings and of “how things work” are useful for what they
include, but also for what they leave out; they enable us to ignore a vast amount of distracting
information and to focus our attention on what is most relevant for a particular purpose. Models
also allow us to understand a larger context, as they provide an overall orientation and a “place to
stand,” from which we can focus in on smaller sections of the picture.
Given the multidisciplinary perspectives of Public Health Law Research (PHLR) and the
wide range of topics included in PHLR, the use of commonly-understood pictures to illustrate the
ways in which law and health interact can be invaluable (Burris et al., 2010). Ranging from laws that

4
Pic
turi
ng P
ub
lic H
ea
lth
La
w R
ese
arc
h:
Usin
g C
au
sa
l D
iag
ram
s t
o M
od
el a
nd
Te
st
Th
eo
ry |
1
0/2
7/2
01
1
prohibit individual behaviors, to laws that provide authority to act, to laws that regulate
organizational practices, PHLR seeks to understand the mechanisms by which laws can improve
health; visualizing these mechanisms in diagrams is an important tool for achieving such an
understanding. The purpose of this monograph is to review some basic conventions used to create
visual models, evaluate relevant examples of models in published PHLR studies, and offer
recommendations for constructing clear and informative models.
Varieties of Visual Representation
Academic disciplines—from the sciences to medicine, law, engineering, business management, and
education—have long used formal schematic pictures to efficiently represent complex processes and
to articulate theories about phenomena of interest (Coryn & Scriven, 2008; Ellermann, Kataoka-
Yahiro, & Wong, 2006; Hamilton, Bronte-Tinkew, & Child Trends Inc., 2007; Jordan, 2010; Misue,
Eades, Lai, & Sugiyama, 1995; Recker, Rosemann, Indulska, & Green, 2009; Wright, 1934). Various
knowledge enterprises have given many names to their pet graphic images, as schematic pictures
have become a key currency of technical information. Molecular diagrams depict basic structures of
matter in chemistry (Daudel & Daudel, 1948). System flow charts illustrate how computer programs,
court proceedings, and organizations work (U.S. Bureau of Justice, 2011). A business process model
can show how a particular firm produces goods and services, sells a product and makes a profit
(Recker et al., 2009). Logic models illustrate plans for public health or policy interventions and lay
out criteria for evaluating whether these interventions function as designed and produce desired
outcomes (W. K. Kellogg Foundation, 2004). Concept mapping or concept webbing can elicit and
clarify culturally divergent views of health and disease (Novak & Cañas, 2008). Statistical path
analysis schematizes and guides empirical testing of theories of the component causes of social-
5
Pic
turi
ng P
ub
lic H
ea
lth
La
w R
ese
arc
h:
Usin
g C
au
sa
l D
iag
ram
s t
o M
od
el a
nd
Te
st
Th
eo
ry |
10
/2
7/2
01
1
behavioral phenomena in populations, drawing out ways in which causal factors sometimes interact,
or may take meandering detours in route to their effect (Duncan, 1966; Land, 1969; Wright, 1934).
Regardless of the specific type of model and the associated discipline, all of these approaches are
working to do the same thing: tell a story in a single image.
For their part, public health law researchers can use representational diagrams to derive
specific research questions and hypotheses from a relevant theoretical framework, and then design
an appropriate study to test such hypotheses. An overarching model may encompass a broad
agenda for research on a PHLR topic, thus allowing the investigator to locate and sequence
particular research questions and projects, while understanding how they fit into a “big picture.”
Diagrams can also be used to help policymakers and the general public to understand a complex
PHLR topic. By viewing a diagram that clearly depicts a law’s effect in, for example, modifying
individual health behaviors or risks in the environment, stakeholders can understand how law is
supposed to work.
Our purpose in this monograph is not to comprehensively review all of the various graphical
devices that have been used to corral knowledge across fields of human inquiry. Neither is it our
purpose to endorse one discipline’s particular modeling conventions or to propose some new
iconography unique to PHLR. Rather, in what follows, we set forth a few general principles—
suggest modest guidelines—for drafting graphic models that are likely to prove useful in
conceptualizing, implementing, and critically evaluating innovative PHLR projects. We describe and
illustrate several specific purposes that causal diagrams may serve, as they guide research on the
effects of law and legal practices on population health.
What do we call these pictures for PHLR? Without taking it too seriously, we use the term
causal diagram (CD). We suppose that causal is a key element, insofar as the depiction of

6
Pic
turi
ng P
ub
lic H
ea
lth
La
w R
ese
arc
h:
Usin
g C
au
sa
l D
iag
ram
s t
o M
od
el a
nd
Te
st
Th
eo
ry |
1
0/2
7/2
01
1
determining relationships between variables is a main point of these devices; if nothing else, they
show how one thing leads (or could lead) predictably to another. Second, diagram seems to work
because its Greek meaning is, roughly, “to mark out by lines.”
Elements and Conventions of Causal Diagrams
What are the basic components and rules of causal diagrams? Novak and Cañas (2008) provide a
useful description of “concept maps” that applies generally to CDs at the simplest level:
“…graphical tools for organizing and representing knowledge. They include concepts, usually
enclosed in circles or boxes of some type, and relationships between concepts indicated by a
connecting line linking two concepts….We define concept as a perceived regularity in events or
objects, or records of events or objects, designated by a label” (p.1).
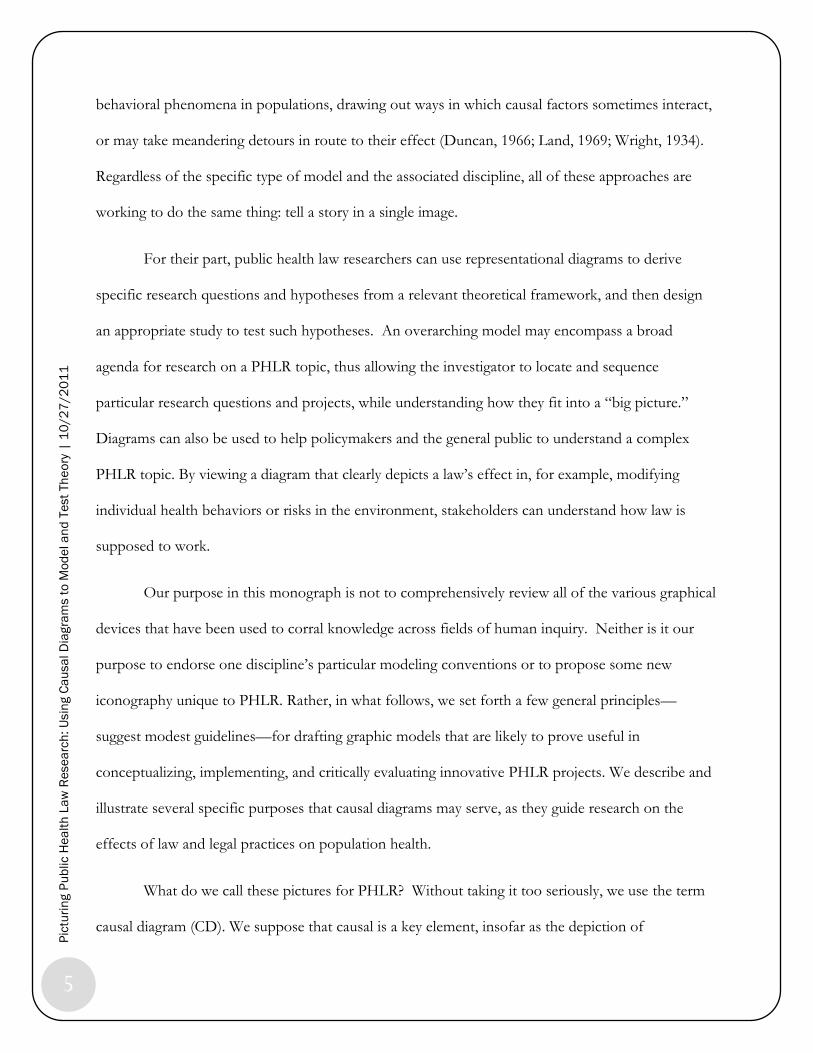
For the most part, the concepts represented in CDs are variables—characteristics or
quantities with changeable values, which may be either observed, observable in principle, or
theoretically postulated. CDs have a dynamic quality, using arrows to depict temporal processes,
relationships, and sequences of events. Figure 1 adapts the main ideas of traditional statistical path
analysis (Duncan, 1966; Land, 1969; Wright, 1934) to illustrate some of the key components and
representational conventions that are common to many CDs.
CDs of this kind can be “read chronologically” from left to right in the manner that one
might read a complex grammatical sentence. The diagrams “tell a story” with a beginning, middle,
and end; there are things that happen first (causes, inputs), things that happen last (effects,
outcomes), and a variety of things that happen in the middle (mediators, pathways, interactions,
arguments.) The “middle” involves a sequence of smaller steps or stages. Thus, depending on the

7
Pic
turi
ng P
ub
lic H
ea
lth
La
w R
ese
arc
h:
Usin
g C
au
sa
l D
iag
ram
s t
o M
od
el a
nd
Te
st
Th
eo
ry |
10
/2
7/2
01
1
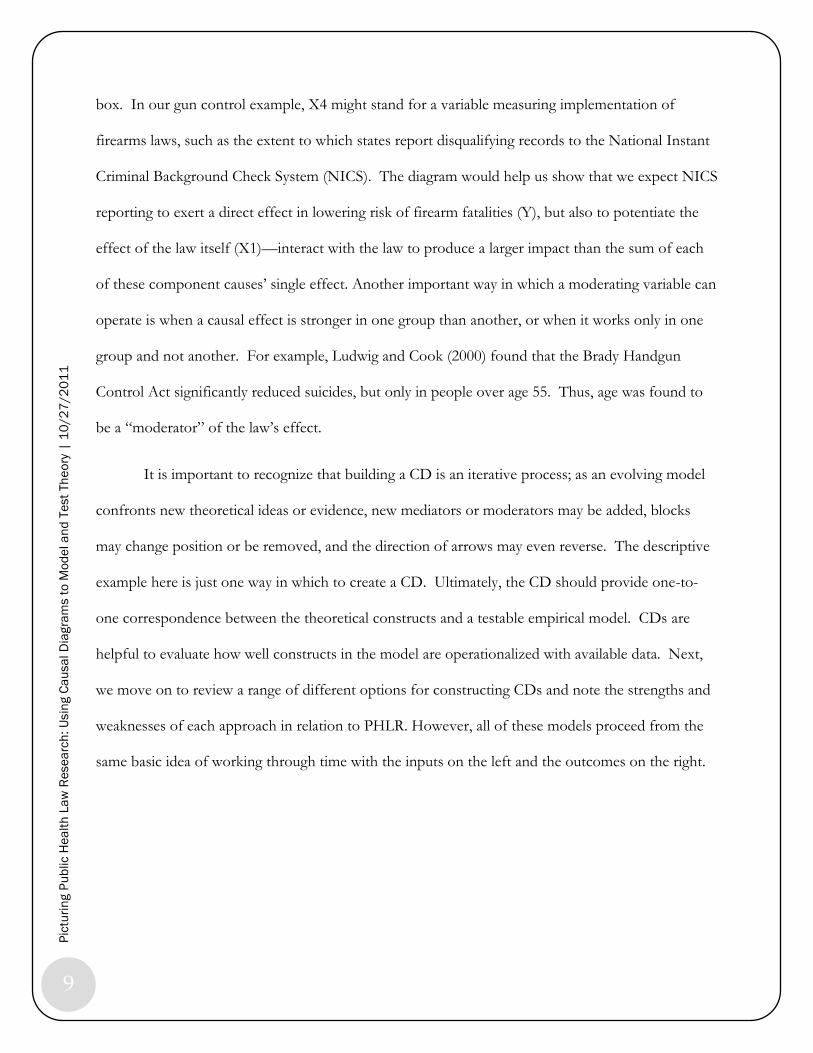
Figure 1. Some Conventions for Causal Diagrams
What happens first.
X1
Y
X2
X3
X4
What happens
in the end.
What happens on the way.
Time
focus of a particular study or analysis, the “dependent variable” may also function as an intervening
output in the overarching PHLR model.
In Figure 1, the boxes labeled X1…X4 could be considered antecedents or hypothesized
component causes of Y. In turn, Y is the consequence, the thing to be explained, or the problem to
be solved by an intervention. Boxes depicted on the left edge of the diagram are often referred to as
exogenous or independent variables, meaning “of outside origin” and not affected by anything
internal to the system. Variables configured to the right, within the system, are termed endogenous.
In some CDs, a double-headed arrow is drawn between two independent variables, as with the
arrow connecting X1 and X2 in Figure 1. Here the curved arrow represents a pre-existing
correlation—a reciprocal association between two exogenous causes.
Figure 1. Conventions of causal diagrams.

8
Pic
turi
ng P
ub
lic H
ea
lth
La
w R
ese
arc
h:
Usin
g C
au
sa
l D
iag
ram
s t
o M
od
el a
nd
Te
st
Th
eo
ry |
1
0/2
7/2
01
1
To put some flesh on the skeleton, let us consider a hypothetical CD depicting the effects of
state firearms laws on the rate of gun-related fatalities. If we were to assign relevant labels to the
boxes in Figure 1, variable X1 might represent the household gun ownership rate while variable X2
might stand for the restrictiveness of a state’s gun laws. In a test of a PHLR theory of gun control
effectiveness, these two variables predictably would be correlated with each other, as indicated by
the curved arrow connecting X1 and X2, and both would be expected ultimately to affect the risk of
gun violence in the community (Y).
The box labeled X3 in the diagram is a mediator—a variable that comes between the main
cause(s) and the effect in question (Edwards & Lambert, 2007). To qualify as a true mediator, a
variable must be related significantly both to the preceding cause and to the effect that follows, and
must thereby explain some of the bivariate association between the first cause and its ultimate result;
the mediator explains how it happens. In our gun laws example, X3 might capture a key mediating
variable such as the frequency of crimes involving handguns. Logically, if there are more guns in the
population (X1), then whenever a crime occurs it may be more likely to involve a gun (X3); in turn,
when guns are used in crimes, it is more likely that a fatal injury will occur (Y). Exogenous predictor
variables are also sometimes referred to as distal causes, while mediating variables that immediately
precede the outcome of interest are termed proximal causes (Greenland & Brumback, 2002). In the
current example, an intervention aimed a distal cause of firearm fatalities might focus on reducing
the number of guns in the population, while an intervention targeting a more proximal cause might
focus on reducing violent crime.
Finally, the box labeled X4 represents both a moderating variable and one that interacts with
another causal factor in the system. As depicted, this variable exerts a direct effect on Y, but also
modifies the pathway between X1 and Y; hence, the arrow leads to another arrow, rather than to a
9
Pic
turi
ng P
ub
lic H
ea
lth
La
w R
ese
arc
h:
Usin
g C
au
sa
l D
iag
ram
s t
o M
od
el a
nd
Te
st
Th
eo
ry |
10
/2
7/2
01
1
box. In our gun control example, X4 might stand for a variable measuring implementation of
firearms laws, such as the extent to which states report disqualifying records to the National Instant
Criminal Background Check System (NICS). The diagram would help us show that we expect NICS
reporting to exert a direct effect in lowering risk of firearm fatalities (Y), but also to potentiate the
effect of the law itself (X1)—interact with the law to produce a larger impact than the sum of each
of these component causes’ single effect. Another important way in which a moderating variable can
operate is when a causal effect is stronger in one group than another, or when it works only in one
group and not another. For example, Ludwig and Cook (2000) found that the Brady Handgun
Control Act significantly reduced suicides, but only in people over age 55. Thus, age was found to
be a “moderator” of the law’s effect.
It is important to recognize that building a CD is an iterative process; as an evolving model
confronts new theoretical ideas or evidence, new mediators or moderators may be added, blocks
may change position or be removed, and the direction of arrows may even reverse. The descriptive
example here is just one way in which to create a CD. Ultimately, the CD should provide one-to-
one correspondence between the theoretical constructs and a testable empirical model. CDs are
helpful to evaluate how well constructs in the model are operationalized with available data. Next,
we move on to review a range of different options for constructing CDs and note the strengths and
weaknesses of each approach in relation to PHLR. However, all of these models proceed from the
same basic idea of working through time with the inputs on the left and the outcomes on the right.

10
Pic
turi
ng P
ub
lic H
ea
lth
La
w R
ese
arc
h:
Usin
g C
au
sa
l D
iag
ram
s t
o M
od
el a
nd
Te
st
Th
eo
ry |
1
0/2
7/2
01
1
Variations on the Theme
Several different types of causal diagrams may be useful in PHLR. These serve distinct but
complementary purposes, and some of them follow the conventions we have just described more
closely than others. There is no one-size-fits-all approach and it is important for the researcher to
modify the CD according to the features and complexity of the specific study.
A Common Understanding
The first purpose of CDs is descriptive classification, addressing the need for a specific, common
understanding of the thing to be studied. For example, suppose we wish to examine whether
involuntary outpatient commitment laws improve population health and safety. As a general
definition, outpatient commitment is a civil court order requiring that a person with mental illness
meeting certain criteria participate in outpatient psychiatric treatment.
However, there are several types of legal outpatient commitment (Swartz, Swanson, Kim, &
Petrila, 2006); without understanding these types and distinguishing them from each other, it would
be difficult to proceed with an informative study of outpatient commitment. Figure 2 illustrates how
a CD can be used to define and graphically describe the different types of outpatient commitment
laws (OPC), showing the pathways by which someone in a mental health crisis may qualify for each
type.
A Process Blueprint
A variation on the descriptive purpose of CDs is process modeling for a specific legal intervention,
policy, or program. The goal of process modeling in PHLR is to provide a detailed blueprint of a
given legal intervention and how it is designed to function. By analogy, if a generic descriptive CD
defines an automobile and distinguishes generally between cars and trucks and buses, a process
model CD would “lift the hood” of a particular vehicle and show how the engine works.

11
Pic
turi
ng P
ub
lic H
ea
lth
La
w R
ese
arc
h:
Usin
g C
au
sa
l D
iag
ram
s t
o M
od
el a
nd
Te
st
Th
eo
ry |
10
/2
7/2
01
1
Figure 2. Types of involuntary outpatient commitment.
Figure 3 illustrates such a diagram for a program of legal outpatient commitment, New York’s
Assisted Outpatient Treatment Program (AOT) (New York State Office of Mental Health, 2011).
This type of model can also be used as an action map or decision guide for system actors who are
involved with the AOT program. The CD moves from referral to investigation to assessment and
service delivery, highlighting the range of potential mechanisms involving clinical and legal actors.

12
Pic
turi
ng P
ub
lic H
ea
lth
La
w R
ese
arc
h:
Usin
g C
au
sa
l D
iag
ram
s t
o M
od
el a
nd
Te
st
Th
eo
ry |
1
0/2
7/2
01
1
Figure 3. Schematic representation of AOT processes in nine areas of New York State.
Sometimes the same information can be conveyed using different types of CDs to reach different
audiences. While graphical boxes labeled with different types of actors and organizations may be
useful for program administrators, these images may be meaningless to the general public or
policymakers. As an alternative, Figure 4 presents a CD on the same New York AOT program, but
directed towards a general lay audience (Pataki & Carpinello, 2005); this CD is centered on the
perspective of an individual trying to navigate the system.

13
Pic
turi
ng P
ub
lic H
ea
lth
La
w R
ese
arc
h:
Usin
g C
au
sa
l D
iag
ram
s t
o M
od
el a
nd
Te
st
Th
eo
ry |
10
/2
7/2
01
1
Figure 4. New York State Office of Mental Health diagram explaining AOT to the public.
Mapping Multiple Interventions
The CD can also be used to map the cumulative and interacting effects of a range of interventions
that address a specific health topic. Figure 5 provides an example of a model depicting ways to
curtail youth consumption of alcohol, such as reducing economic and physical access to alcohol,
enforcing societal norms, and exercising other social control mechanisms. The model combines
theoretical elements from several disciplines, including social and behavioral sciences and
economics, and engages the issue of underage drinking from the perspectives of several key actors,
including the minor who would consume alcohol, the retailer who would sell alcohol to minors, and
the law enforcement officer who would detain the minor (Wagenaar & Perry, 1994). While this is a
complex model, it represents an inherently complex set of interconnecting phenomena, and does so

14
Pic
turi
ng P
ub
lic H
ea
lth
La
w R
ese
arc
h:
Usin
g C
au
sa
l D
iag
ram
s t
o M
od
el a
nd
Te
st
Th
eo
ry |
1
0/2
7/2
01
1
in a comprehensible way that provides an opportunity to consider multiple points of potential
modification to existing laws and legal practices.
Figure 5. An integrated theory of drinking behavior (Adapted from Wagenaar & Perry, 1994).
Theoretical Foundations
A fourth important purpose of CDs is theoretical explanation or the articulation of a causal theory.
Here, the diagram identifies a particular phenomenon to be explained, sets forth a proposed cause or
multiple component causes of the phenomenon, and specifies the pathways of association—patterns
of common, sequential occurrence—which theoretically connect the causal factors to the effect of
interest. Figure 6 draws from behavioral theory and applies the Theory of Planned Behavior (TPB)

15
Pic
turi
ng P
ub
lic H
ea
lth
La
w R
ese
arc
h:
Usin
g C
au
sa
l D
iag
ram
s t
o M
od
el a
nd
Te
st
Th
eo
ry |
10
/2
7/2
01
1
to explain how a law restricting or prohibiting cell phone use while driving can result in a behavior
change and improvements in health outcomes.
Figure 6. Use of theory of planned behavior to frame distracted driving behaviors.
In this model, we offer three potential hypotheses for how TPB can be used to explain
mechanisms for expected legal effects on population health and safety. The diagram clarifies
theoretical mechanisms by which legally restricting cell phone use while driving can be expected to
change driving practices, and potentially reduce mortality associated with distracted driving. This
specific example demonstrates the integration of a classic behavioral sciences theory with classic
legal theory on deterrence.
First, a “fear hypothesis” (path A in the model) would posit that fear of being caught and
punished – deterrence, in legal terms – inhibits the individual’s independent action of using a cell
phone while driving. A second option is the “guilt hypothesis” (path B in the model), which posits
that negative social sanctions attaching to the behavior of using cell phones while driving affects the
actor’s attitude towards these behaviors and persons who engage in them. Finally, the “shame
Cease Use of Cell Phone While
Driving
Societal Norm About
Cell Phone Use While Driving
Attitudes towards
Costs and Benefits of Cell
Phone Use While Driving
Intent to Modify Cell Phone Use
While Driving
Perceived or Actual
Control over Cell Phone Use While Driving
Cell
Phone Laws
Law Enforcement
Decreased Auto-Related Morbidity and
Mortality
A
B
C

16
Pic
turi
ng P
ub
lic H
ea
lth
La
w R
ese
arc
h:
Usin
g C
au
sa
l D
iag
ram
s t
o M
od
el a
nd
Te
st
Th
eo
ry |
1
0/2
7/2
01
1
hypothesis” (path C in the model) posits that laws and law enforcement activities can induce in the
actor a sense that others look down upon the sanctioned behavior, in this case that fellow drivers
will be annoyed and irritated by someone using a cell phone while driving. These attitudes
determine the intention to use a cell phone while driving.
If the law is working, one or more of these mediating mechanisms will modify the subjects’
intention and behavior, and eventually the risky practice of driving while using a cell phone will
decrease across the population. Given valid measures and sufficient observations of data from a
representative sample, such an effect would be detected as predicted by the model. We could also
expand the model to include mediators and moderators of the relationship between the intent to
modify the behavior of using a cell phone while driving and actually stopping the behavior.
However, it is best to keep the CD focused on a few elements that are both theoretically relevant
and empirically testable, rather than to include any number of extraneous variables that might
possibly co-vary with the law and correlate with its outcome.
Moving from Pictures to Measures
A fifth purpose of CDs in public health law research is to guide tests of direct and indirect causal
effects of laws on public health outcomes (Rothman & Greenland, 2005). To illustrate, Figure 7
articulates testable mechanisms by which various tobacco control policies could modify smoking
behavior (Fong et al., 2006). Any policy’s effect is likely to be moderated by individual
characteristics—from sociodemographic descriptors to personality features and previous smoking
behaviors—and mediated by psychosocial factors such as shared beliefs and attitudes, group norms,
and perceptions of risk. The model allows us to think about the specific measures and sources of
data that would be necessary to test alternative and complementary hypotheses. While the model
was created mainly as a general framework for tobacco control policy efforts, it also provides

17
Pic
turi
ng P
ub
lic H
ea
lth
La
w R
ese
arc
h:
Usin
g C
au
sa
l D
iag
ram
s t
o M
od
el a
nd
Te
st
Th
eo
ry |
10
/2
7/2
01
1
sources of data that would be necessary to test alternative and complementary hypotheses. While the
model was created mainly as a general framework for tobacco control policy efforts, it also provides
a useful catalogue of mediating variables that specific policies might target, and which could be
measured to test these policies’ effects.
Figure 7. Conceptual model of the impact of tobacco control policies over time (Fong et al. 2006).
A final purpose of CDs in public health law research is to depict and guide the process of
research or evaluation itself. An extensive literature exists which explains the use of “logic models”
in public health program evaluation (W. K. Kellogg Foundation, 2004). The main distinguishing
feature of these types of CDs is a depiction of programs’ “theory of change,” including “resources,
inputs, activities, and outputs” in order to demonstrate and evaluate effectiveness. Beyond use for
research or evaluation, CDs may also be deployed as a tool for policymaking and analysis,
particularly in cases where policymakers must make decisions without the benefit of strong evidence
for the likely effectiveness or adverse consequences of a course of action. By graphically unpacking a

18
Pic
turi
ng P
ub
lic H
ea
lth
La
w R
ese
arc
h:
Usin
g C
au
sa
l D
iag
ram
s t
o M
od
el a
nd
Te
st
Th
eo
ry |
1
0/2
7/2
01
1
policy’s potential requirements, goals, and expected pathways of effect, the CD provides an
opportunity to consider hidden assumptions, barriers, or unintended “side effects” that might not
otherwise be debated.
What Makes a “Good” Causal Diagram?
Scholars have described several criteria to evaluate the adequacy of representational diagrams used in
process modeling, particularly in the context of business and information sciences (Recker et al.,
2009). The ideas underlying several of these criteria can be adapted to evaluate CDs for public health
law research and to identify specific problems that may arise with these models. We propose related
criteria that can be summarized as the “3 C’s”: correspondence, comprehensiveness, and clarity.
Correspondence
The first criterion for evaluating CDs is correspondence, meaning that a given concept or construct in
the model must correspond in a valid, specific way to the particular phenomena or set of
observations that it purports to describe in the real world. Since the basic premise of the model is to
explain real world phenomena to facilitate research, it is important that each box has a clearly
defined connection to some element directly or indirectly observed in reality.
To illustrate this criterion, consider a CD that is designed to illustrate a test of whether
states’ laws against driving while using a mobile communications device prevent motor vehicle
crashes and injuries. Imagine that the CD depicted in Figure 6 had included separate boxes labeled
“distracted driving laws” and “laws against texting and driving.” The first problem with such a
model would be poor correspondence between at least one of the constructs and the real-world
phenomena of interest.
19
Pic
turi
ng P
ub
lic H
ea
lth
La
w R
ese
arc
h:
Usin
g C
au
sa
l D
iag
ram
s t
o M
od
el a
nd
Te
st
Th
eo
ry |
10
/2
7/2
01
1
Specifically, the box labeled “distracted driving laws” would suffer from what Recker and
colleagues (2009) call “construct overload.” As they explain (in the context of business process
modeling), construct overload occurs when a term “…provides language constructs that appear to
have multiple real-world meanings and, thus, can be used to describe various real-world phenomena.
These cases are undesirable, as they require users to bring to bear knowledge external to the model
in order to understand the capacity in which such a construct is used in a particular scenario” (p.
349). In short, “distracted driving laws” could refer to distractions such as eating, doing make-up,
reading, and a whole host of other activities that individuals may do while driving, rather than the
intended focus on the use of mobile communications devices while driving.
Second, the inclusion of two boxes labeled with slightly different definitions of the law, and
with varying degrees of specificity, would also show poor correspondence. The logical deficit here
could be called concept redundancy. A PHLR model containing constructs with overlapping meanings
and real-world referents is difficult to understand, impossible to test, and hopeless to apply to
policymaking. As mentioned earlier, it is possible to create a CD which includes multiple legal
interventions to address a particular public health issue, but it is imperative that each box has a
mutually exclusive definition within that model, and that hypothesized interactions are depicted with
appropriate precision.
Comprehensiveness
A useful CD should incorporate all necessary elements to achieve its specific purpose—whether
description, classification, explanation, testing, or evaluation. Thus, the model must include
sufficient detail to adequately represent the hypothesized legal causes, hypothesized mediators, and
health effects to be examined in a PHLR project; it should not omit relevant variables and pathways.
At the same time, the model should not be made more complex than necessary in an attempt to

20
Pic
turi
ng P
ub
lic H
ea
lth
La
w R
ese
arc
h:
Usin
g C
au
sa
l D
iag
ram
s t
o M
od
el a
nd
Te
st
Th
eo
ry |
1
0/2
7/2
01
1
“represent the whole world.” Just as a figure that is too basic invites misinterpretation, a diagram
that is too complicated may create confusion. The goal is to construct a model that strikes an
appropriate balance between the bare-bones and the byzantine.
Figure 8 is a CD designed to explain the ways in which laws and regulations influence the
behaviors of the public and government and private entities, resulting in a change in health
outcomes (Mello, Powlowski, Nañagas, & Bossert, 2006). The model provides an example of a CD
that avoids the clutter of irrelevant details, yet does not oversimplify its relevant constructs and
connections. The model is thus able to achieve its goal of visually representing, and thus
illuminating, the link between theoretical and actual effects of law on public health outcomes.
Moreover, while the model provides an overall picture, it is possible to segment out one section of
the model – for example, government actors only – and create a more granular version which
elaborates on the mediating and moderating factors. The comprehensiveness criterion is also related
to the term parsimony as used to evaluate theories in philosophy of science: all things considered,
the simplest explanation is the best.
Figure 8. Conceptual model: Effect of law on public health outcomes.

21
Pic
turi
ng P
ub
lic H
ea
lth
La
w R
ese
arc
h:
Usin
g C
au
sa
l D
iag
ram
s t
o M
od
el a
nd
Te
st
Th
eo
ry |
10
/2
7/2
01
1
Clarity
The final CD criterion that we will mention here is clarity, which refers both to visual intelligibility
and conceptual lucidity. Clarity means, in essence, that a CD’s images and accompanying labels
should be easy to read, and they should make the concepts they stand for easy to understand. While
this is related to considerations of correspondence and comprehensiveness, the clarity criterion
expresses the model’s intuitive logical appeal, and the extent to which it conveys an intended
message with sufficient detail in definition—the elements in sharp focus with a minimum of
surrounding “fog.” The diagram must also be visually appealing and easy to follow; the reader
should spend time thinking about the ideas, not figuring out how to interpret the boxes and arrows.
It is possible for a model to be relatively simple, even to have good correspondence between
constructs and their real-world referents, and still not be clear. For example, consider a model
designed to depict the population health effects of regulatory action on pharmaceutical companies’
innovation in developing new antimicrobial medications. Imagine a series of boxes labeled
“regulation,” “innovation,” “incentives,” “overutilization,” “resistance,” “effectiveness,” and
“population health,” with multiple arrows connecting the boxes. The main problem with such a
model would be lack of clarity: What does it mean? How do these elements fit together according
to some logical scheme?
Figure 9 presents a model of clarity using the same basic concepts, but lays out the logic for
two different approaches to solving the public health problem of antibiotic resistance—innovation
and conservation—and shows how strengthening patent law could plausibly work through both
mechanisms simultaneously (adapted from Outterson, 2005). The picture is clear and it is easy to see
potential research questions, hypotheses to be tested and measures to represent each box. This is the
ultimate goal of CDs.

22
Pic
turi
ng P
ub
lic H
ea
lth
La
w R
ese
arc
h:
Usin
g C
au
sa
l D
iag
ram
s t
o M
od
el a
nd
Te
st
Th
eo
ry |
1
0/2
7/2
01
1
Figure 9. How stronger patent laws could improve antimicrobial effectiveness by increasing
pharmaceutical innovation while reducing overutilization of existing drugs.
How to Create an Effective Causal Diagram
An informative and effective CD begins with careful preparation. The creative activity of sketching
boxes and arrows should follow from, not precede, a solid understanding of the substantive topic at
hand. Thus, the first step should be to selectively review current academic literature on several
facets of the subject: the basic dimensions of the public health problem at hand; its established or
putative causes; contours of the law, policy, or regulatory scheme whose possible effects on health
are the subject of inquiry; and what may already be known about the mechanisms of these laws’
effect on health. This selective literature review should be carried out with the purpose of extracting
key constructs, ideas, and causal relationships that recur in the literature across relevant fields of
study, or that seem to bridge parallel understandings in diverse disciplines—from the health sciences
to social sciences and the law.

23
Pic
turi
ng P
ub
lic H
ea
lth
La
w R
ese
arc
h:
Usin
g C
au
sa
l D
iag
ram
s t
o M
od
el a
nd
Te
st
Th
eo
ry |
10
/2
7/2
01
1
The selective literature review should be driven by several basic theoretical questions that
could also become research questions: What are the major causes of this public health problem?
How could law, policy, or regulation conceivably affect the problem? What factors could modify or
strengthen the law’s effect on the health problem? Are there reasons to posit a fairly direct link
between law and health in this instance? Or is it more likely that complex processes—
environmental change, structural change, behavioral change, or all three—would intervene as
foreseeable mechanisms of effect?
Armed with a basic understanding of key concepts and how they might fit together, there are
many ways to actually draw a CD. Here is one: Start by sketching a box that represents the health
problem—the main outcome to be affected—on the right-hand side of a sheet of paper (or its
computer-screen equivalent.) Next, sketch a box representing the legal intervention on the left of
the drawing space. Connect the two boxes with a long arrow from left to right; keep in mind, the
diagram “moves” chronologically from left to right. Next, stop and ponder: What other important
variables could influence the health problem, and how might they be affected by the law as well?
Add these variables to the diagram in the form of labeled boxes positioned above or below the
central horizontal arrow, and suspended between the legal intervention on the left and the health
outcome on the right. Connect these middle boxes with diagonal arrows coming from the law and
proceeding to the health outcome.
The final step involves revising the diagram with an eye to the whole picture—repositioning
boxes, adding or subtracting arrows—until the CD begins to forms a clear, legible, and intelligible
portrait of a health problem, its potential legal solution, along with any necessary “scaffolding” to
make it work. While described here in few steps, in practice this is an iterative process. The final
result should be a CD that is sufficiently detailed to convey all the information that is necessary to

24
Pic
turi
ng P
ub
lic H
ea
lth
La
w R
ese
arc
h:
Usin
g C
au
sa
l D
iag
ram
s t
o M
od
el a
nd
Te
st
Th
eo
ry |
1
0/2
7/2
01
1
represent the theory or research problem at hand, but without extraneous conceptual or visual
clutter.
Conclusion
Causal models have become increasingly common in the presentation of theory-driven research
schemes across a variety of disciplines. However, there are few clear conventions in current practice
of graphic representation of variables, associations, interactions, and time which allow such pictures
to be understood across disciplines. In this monograph, we have described a set of simple
conventions for using causal diagrams as heuristic models to visually represent key independent and
dependent variables, hypothesized mediators, moderators, direct and indirect pathways of effect.
The use of these models in PHLR can yield powerful insights into the intended and unintended
effects of laws on population health, as well as the social and institutional contexts in which they
occur.
Causal diagrams can do important work in PHLR, insofar as they answer several kinds of
questions. They can help to describe (“how things are now…”), classify (“why things go
together…”), explain (“how things really work…”), predict (“what will happen if…”), and decide
(“what you should do now…”) As conceptual models, CDs not only map the steps by which law
may impact health, but also allow a researcher to more carefully consider the set of measures to be
used in developing a methodologically rigorous study. Models that exhibit valid correspondence and
are appropriately complex yet clear will help PHLR researchers plan and carry out their work.
Images that accurately represent the topic at hand may also be useful for policymakers in
understanding new evidence for the many ways that laws may improve population health.

25
Pic
turi
ng P
ub
lic H
ea
lth
La
w R
ese
arc
h:
Usin
g C
au
sa
l D
iag
ram
s t
o M
od
el a
nd
Te
st
Th
eo
ry |
10
/2
7/2
01
1
List of Figures
1 Conventions of causal diagrams.
2 Types of involuntary outpatient commitment.
3 Schematic representation of AOT processes in nine areas of New York State.
4 New York State Office of Mental Health diagram explaining AOT to the public.
5 An integrated theory of drinking behavior.
6 Use of theory of planned behavior to frame distracted driving behaviors.
7 Conceptual model of the impact of tobacco control policies over time.
8 Conceptual model: Effect of law on public health outcomes.
9 How stronger patent laws could improve antimicrobial effectiveness by increasing
pharmaceutical innovation while reducing overutilization of existing drugs.

26
Pic
turi
ng P
ub
lic H
ea
lth
La
w R
ese
arc
h:
Usin
g C
au
sa
l D
iag
ram
s t
o M
od
el a
nd
Te
st
Th
eo
ry |
1
0/2
7/2
01
1
References
Burris, S., Wagenaar, A. C., Swanson, J., Ibrahim, J. K., Wood, J., & Mello, M. M. (2010). Making the
case for laws that improve health: A framework for public health law research. Milbank
Quarterly, 88(2), 169-210.
Coryn, C. L. S., & Scriven, M. (2008). The logic of research evaluation. In C. L. S. Coryn & M. M.
Scriven (Eds.), Reforming the evaluation of research (Vol. 118, pp. 89-105). Vancouver, BC:
Jossey-Bass and American Evaluation Association.
Dansereau, D. F., & Simpson, D. D. (2009). A picture is worth a thousand words: The case for
graphic representations. Professional Psychology: Research and Practice Professional Psychology: Research
and Practice, 40(1), 104-110.
Daudel, P., & Daudel, R. (1948). The molecular diagram method. The Journal of Chemical Physics, 16(7),
639-643.
Duncan, O. D. (1966). Path analysis : Sociological examples. Indianapolis, IN: Bobbs-Merrill.
Edwards, J. R., & Lambert, L. S. (2007). Methods for integrating moderation and mediation: A
general analytical framework using moderated path analysis. Psychological Methods, 12(1), 1-22.
Ellermann, C. R., Kataoka-Yahiro, M. R., & Wong, L. C. (2006). Logic models used to enhance
critical thinking. The Journal of Nursing Education, 45(6), 220-227.
Fong, G. T., Cummings, K. M., Borland, R., Hastings, G., Hyland, A., Giovino, G. A., et al. (2006).
The conceptual framework of the international tobacco control (itc) policy evaluation
project. Tobacco Control, 15(Suppl 3), iii3-11.
Greenland, S., & Brumback, B. (2002). An overview of relations among causal modelling methods.
International Journal of Epidemiology, 31(5), 1030-1037.
Hamilton, J., Bronte-Tinkew, J., & Child Trends Inc. (2007). Logic models in out-of-school time programs:
What are they and why are they important? Publication #2007-01: Child Trends.
Jordan, G. B. (2010). A theory-based logic model for innovation policy and evaluation. Research
Evaluation, 19(4), 263-273.
Land, K. C. (1969). Principles of path analysis. Sociological Methodology, 1, 3-37.
Ludwig, J., & Cook, P. J. (2000). Homicide and suicide rates associated with implementation of the
brady handgun violence prevention act. The Journal of the American Medical Association, 284(5),
585-591.
Mello, M. M., Powlowski, M., Nañagas, J. M. P., & Bossert, T. (2006). The role of law in public
health: The case of family planning in the philippines. Social Science & Medicine, 63(2), 384-
396.

27
Pic
turi
ng P
ub
lic H
ea
lth
La
w R
ese
arc
h:
Usin
g C
au
sa
l D
iag
ram
s t
o M
od
el a
nd
Te
st
Th
eo
ry |
10
/2
7/2
01
1
Misue, K., Eades, P., Lai, W., & Sugiyama, K. (1995). Layout adjustment and the mental map. Journal
of Visual Languages & Computing, 6(2), 183-210.
New York State Office of Mental Health (2011). Implementation of assisted outpatient treatment.
Retrieved October 1, 2011, from
http://www.omh.ny.gov/omhweb/Kendra_web/interimreport/implementation.htm
Novak, J. D., & Cañas, A. J. (2008). The theory underlying concept maps and how to construct and use them.
Ponta Grossa, Puerto Rico: Universidade Estadual de Ponta Grossa. Retrieved October 1,
2011, from
http://www.revistas2.uepg.br/index.php/praxiseducativa/article/view/1298/944.
Outterson, K. (2005). The vanishing public domain: Antibiotic resistance, pharmaceutical innovation
and global public health. University of Pittsburgh Law Review, 67, 67-123.
Pataki, G. E., & Carpinello, S. E. (2005). Kendra's law: Final report on the status of assisted outpatient
treatment. New York State Office of Mental Health. Retrieved October 1, 2011, from
http://www.omh.state.ny.us/omhweb/kendra_web/finalreport/AOTFinal2005.pdf.
Recker, J., Rosemann, M., Indulska, M., & Green, P. (2009). Business process modeling: A
comparative analysis. Journal of the Association of Information Systems, 10(4), 333-363.
Rothman, K. J., & Greenland, S. (2005). Causation and causal inference in epidemiology. American
Journal of Public Health, 95, 144-150.
Swartz, M. S., Swanson, J. W., Kim, M., & Petrila, J. (2006). Use of outpatient commitment or
related civil court treatment orders in five u.S. Communities. Psychiatr Serv, 57(3), 343-349.
U.S. Bureau of Justice (2011). Criminal justice system flowchart Retrieved October 1, 2011, from
http://bjs.ojp.usdoj.gov/content/largechart.cfm#prosecution
W. K. Kellogg Foundation (2004). Logic model development guide. Battle Creek, MI: W.K. Kellogg
Foundation.
Wagenaar, A. C., & Perry, C. L. (1994). Community strategies for the reduction of youth drinking:
Theory and application. Journal of Research on Adolescence, 4(2), 319-345.
Wright, S. (1934). The method of path coefficients. Annals of Mathematical Statistics, 5, 161-215.
__________________________
Please cite this document as:
Swanson, J. & Ibrahim, J. (2011). Picturing public health law research: Using causal diagrams to
model and test theory. PHLR Methods Monograph Series.