Embed Size (px)
Citation preview

Picture Placeholder
For Institutional Investor Use Only. Not for Use With or Distribution to the Public.
2For Institutional Investor Use Only. Not for Use With or Distribution to the Public.
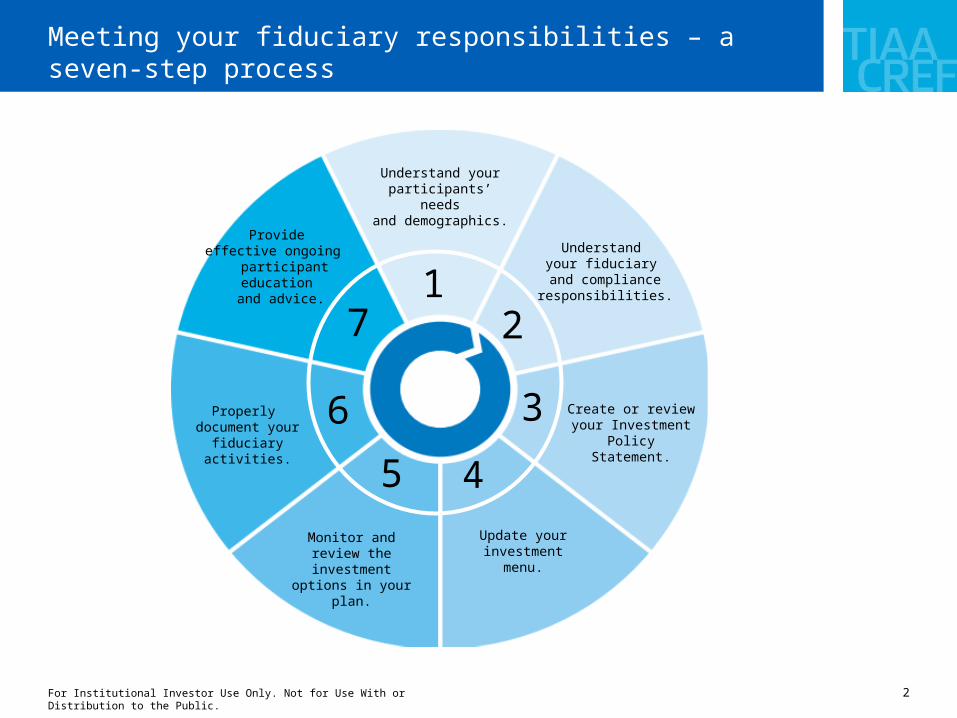
Meeting your fiduciary responsibilities – a seven-step process
Provide effective ongoing
participant education
and advice.
Understand your fiduciary
and compliance responsibilities.
Create or review your Investment Policy
Statement.
Update your investment menu.
Monitor and review the investment options in
your plan.
Properly document your
fiduciary activities.
Understand your participants’ needsand demographics.
6
71
2
3
45
3For Institutional Investor Use Only. Not for Use With or Distribution to the Public.
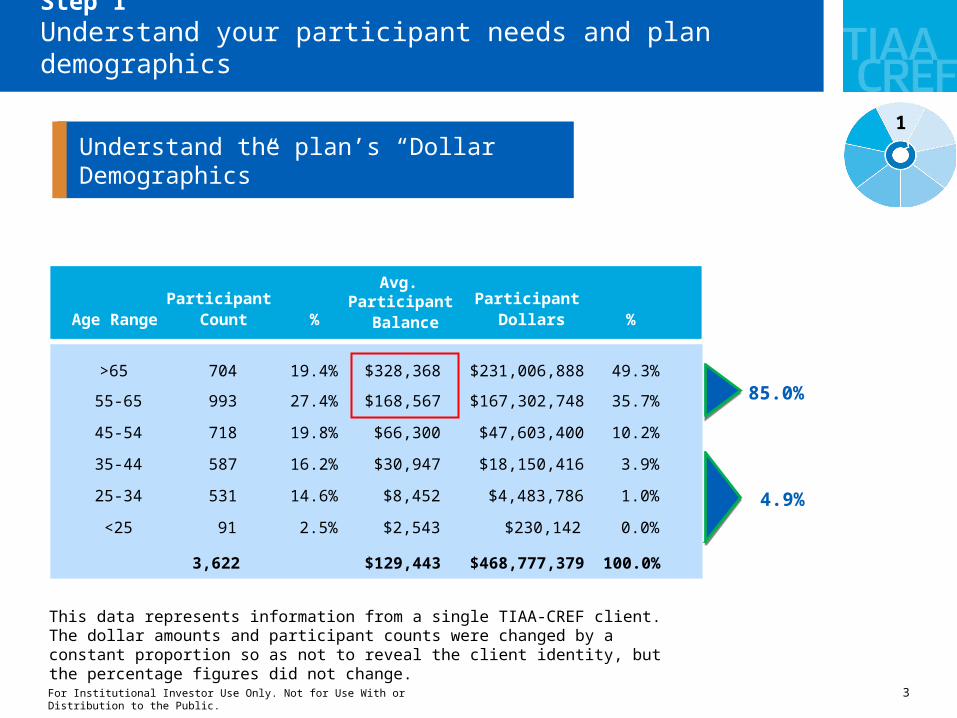
>65 704 19.4% $328,368 $231,006,888 49.3%
55-65 993 27.4% $168,567 $167,302,748 35.7%
45-54 718 19.8% $66,300 $47,603,400 10.2%
35-44 587 16.2% $30,947 $18,150,416 3.9%
25-34 531 14.6% $8,452 $4,483,786 1.0%
<25 91 2.5% $2,543 $230,142 0.0%
3,622 $129,443 $468,777,379 100.0%
Age RangeParticipant
Count %Participant
Balance
Participant Dollars %
Avg.
Step 1Understand your participant needs and plan demographics
This data represents information from a single TIAA-CREF client. The dollar amounts and participant counts were changed by a constant proportion so as not to reveal the client identity, but the percentage figures did not change.
4.9%
85.0%
Age RangeParticipant
Count %Participant
Balance
Participant Dollars %
Avg.
Understand the plan’s “Dollar Demographics”
1
4For Institutional Investor Use Only. Not for Use With or Distribution to the Public.
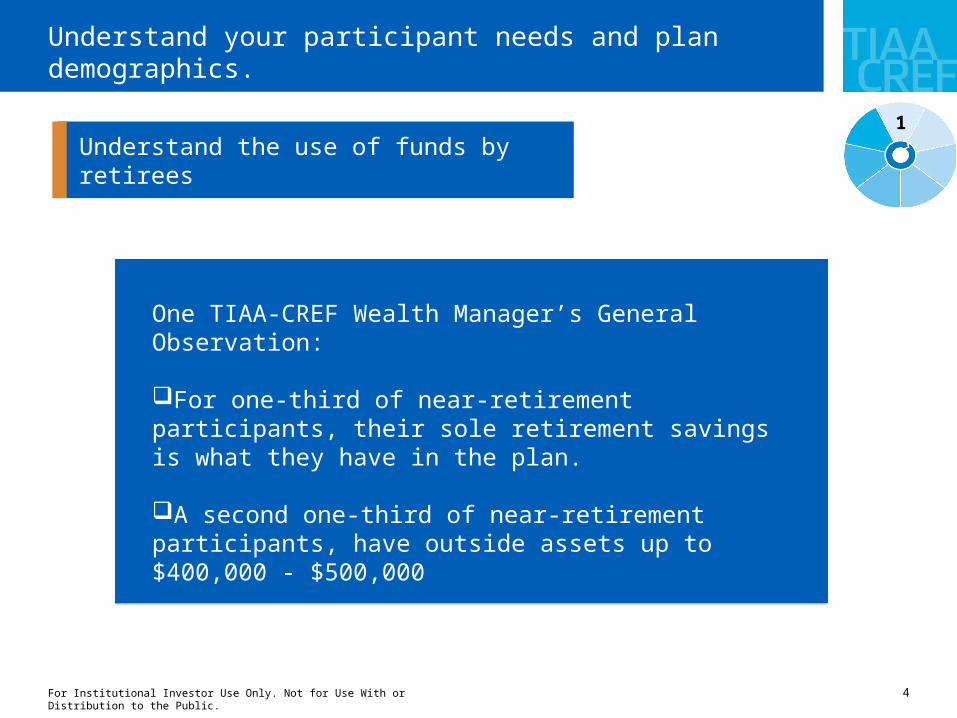
Understand your participant needs and plan demographics.
Understand the use of funds by retirees
1
One TIAA-CREF Wealth Manager’s General Observation:
For one-third of near-retirement participants, their sole retirement savings is what they have in the plan.
A second one-third of near-retirement participants, have outside assets up to $400,000 - $500,000
A final one-third have greater outside savings.
5For Institutional Investor Use Only. Not for Use With or Distribution to the Public.
Understand your participant needs and plan demographics.
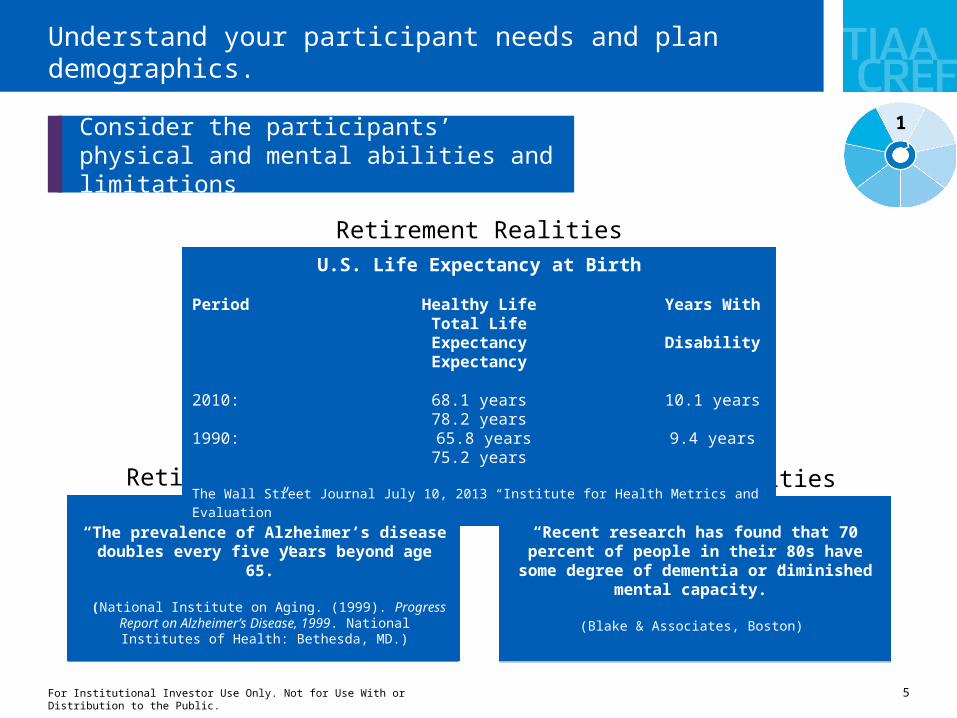
Consider the participants’ physical and mental abilities and limitations
1
Retirement Realities
Retirement Realities Retirement Realities
U.S. Life Expectancy at Birth
Period Healthy Life Years WithTotal Life
Expectancy DisabilityExpectancy
2010: 68.1 years 10.1 years78.2 years
1990: 65.8 years 9.4 years75.2 years
The Wall Street Journal July 10, 2013 “Institute for Health Metrics and Evaluation”
“The prevalence of Alzheimer’s disease doubles every five years beyond age 65.”
(National Institute on Aging. (1999). Progress Report on Alzheimer’s Disease, 1999. National Institutes of Health:
Bethesda, MD.)
“Recent research has found that 70 percent of people in their 80s have some degree of
dementia or diminished mental capacity.”
(Blake & Associates, Boston)
6For Institutional Investor Use Only. Not for Use With or Distribution to the Public.
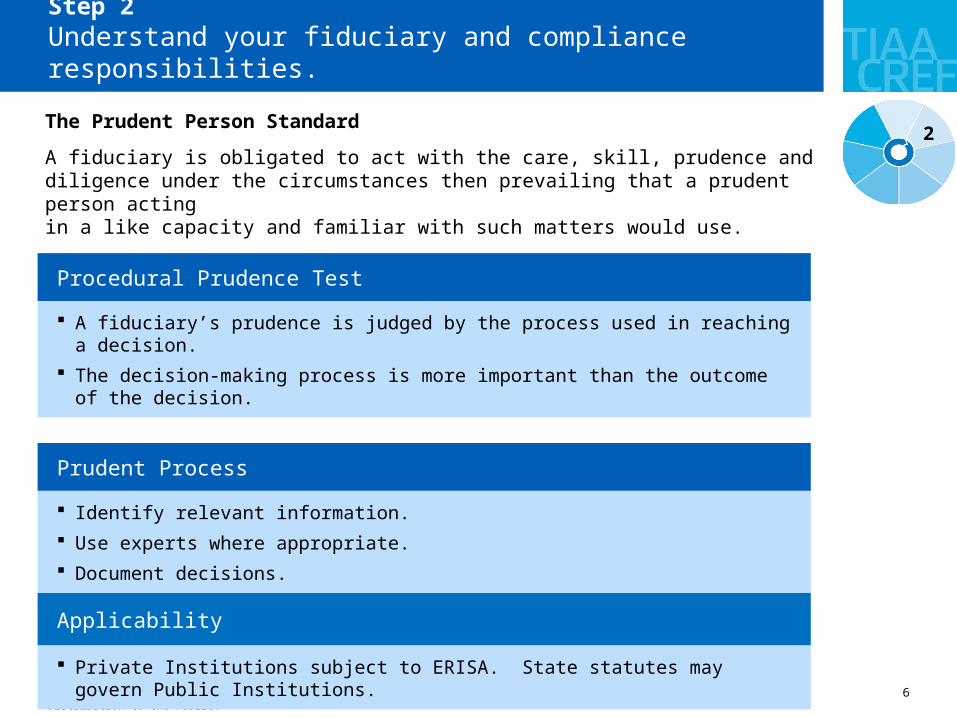
The Prudent Person Standard
A fiduciary is obligated to act with the care, skill, prudence and diligence under the circumstances then prevailing that a prudent person acting in a like capacity and familiar with such matters would use.
Step 2Understand your fiduciary and compliance responsibilities.
Procedural Prudence Test
A fiduciary’s prudence is judged by the process used in reaching a decision.
The decision-making process is more important than the outcome of the decision.
Prudent Process
Identify relevant information.
Use experts where appropriate.
Document decisions.
Applicability
Private Institutions subject to ERISA. State statutes may govern Public Institutions.
2
7For Institutional Investor Use Only. Not for Use With or Distribution to the Public.
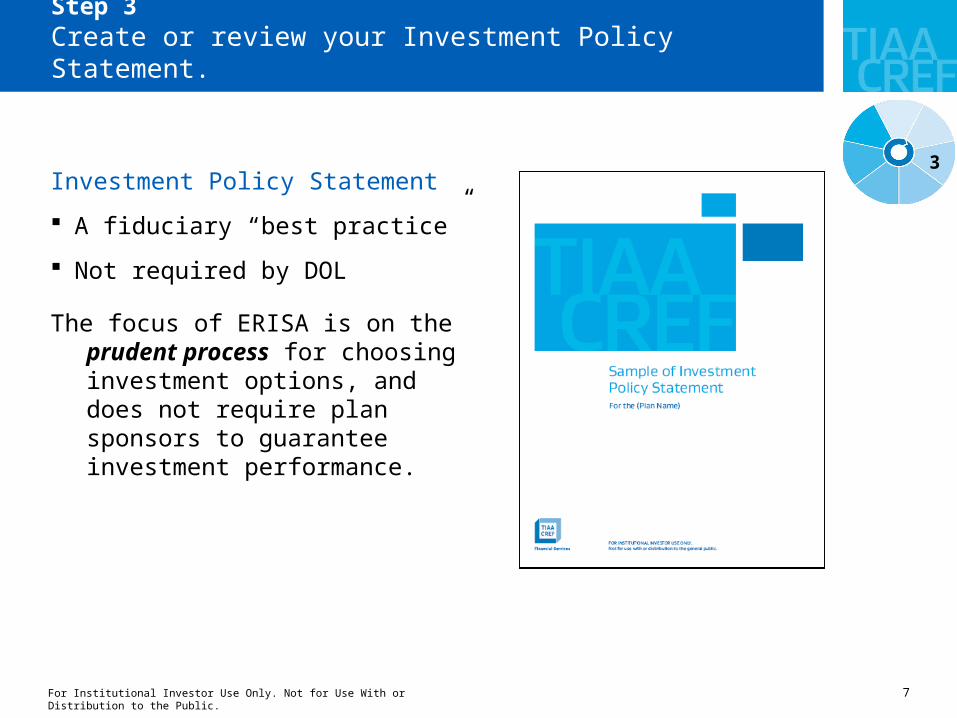
Step 3Create or review your Investment Policy Statement.
Investment Policy Statement
A fiduciary “best practice”
Not required by DOL
The focus of ERISA is on the prudent process for choosing investment options, and does not require plan sponsors to guarantee investment performance.
3
8For Institutional Investor Use Only. Not for Use With or Distribution to the Public.
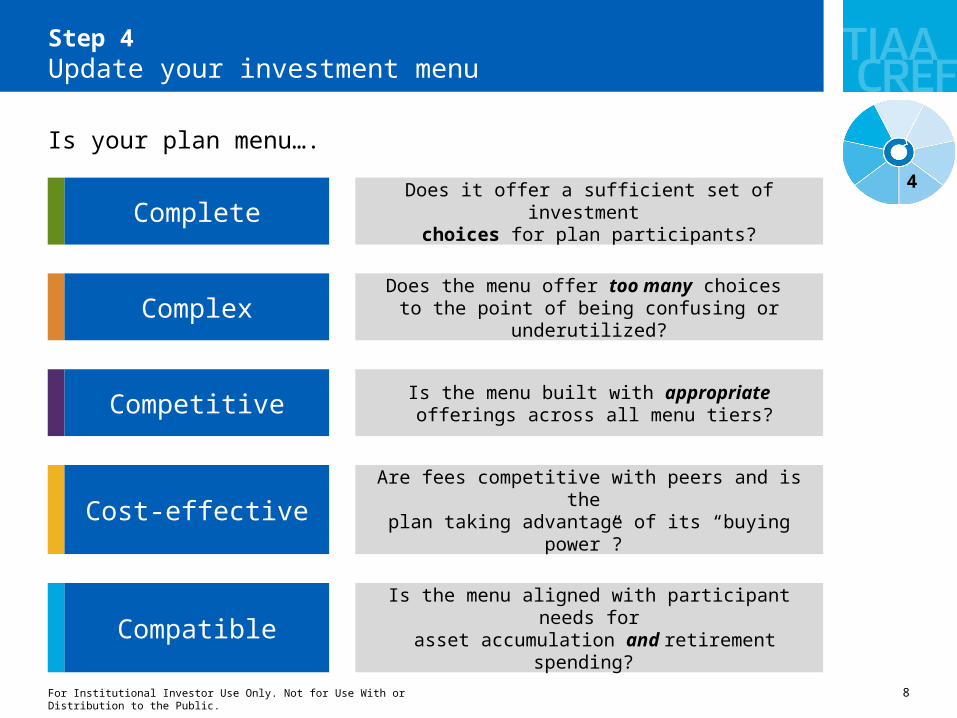
Step 4Update your investment menu
Is your plan menu….
Complete Does it offer a sufficient set of investment choices for plan participants?
Complex Does the menu offer too many choices to the point of being confusing or underutilized?
Competitive Is the menu built with appropriate offerings across all menu tiers?
Cost-effective Are fees competitive with peers and is the plan taking advantage of its “buying power”?
Compatible Is the menu aligned with participant needs for asset accumulation and retirement spending?
4
9For Institutional Investor Use Only. Not for Use With or Distribution to the Public.
Appendix
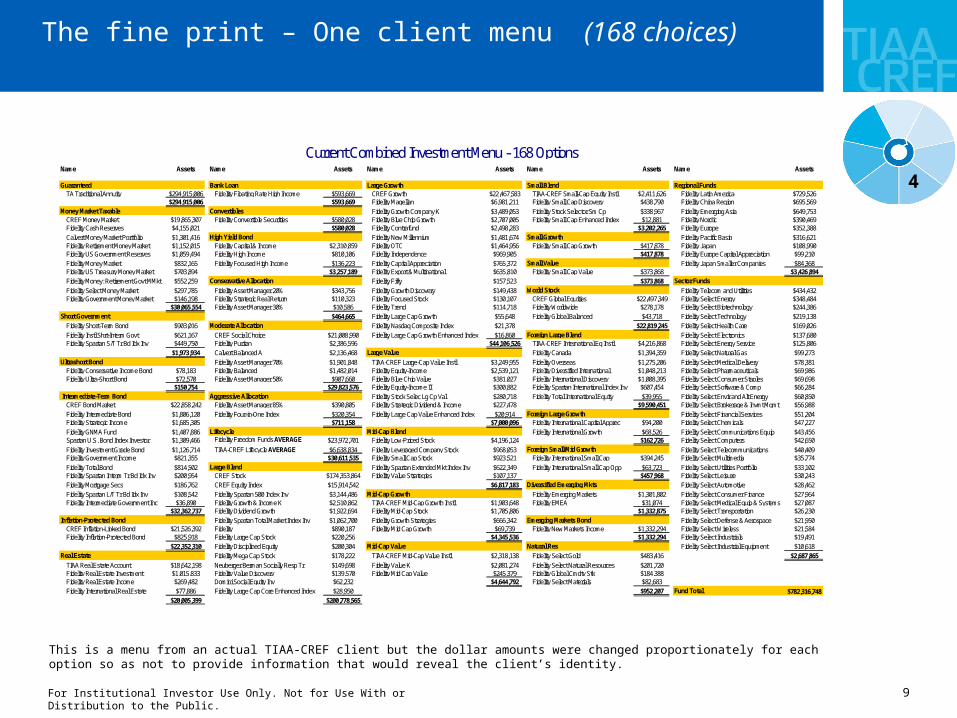
The fine print – One client menu (168 choices)
Assets Assets Assets Assets Assets
TA Traditional Annuity $294,915,006 Fidelity Floating Rate High Income $593,669 CREF Growth $22,467,583 TIAA-CREF Small-Cap Equity Instl $2,411,626 Fidelity Latin America $729,526$294,915,006 $593,669 Fidelity Magellan $6,981,211 Fidelity Small Cap Discovery $438,790 Fidelity China Region $695,569
Fidelity Growth Company K $3,489,053 Fidelity Stock Selector Sm Cp $338,967 Fidelity Emerging Asia $649,753CREF Money Market $19,865,307 Fidelity Convertible Securities $580,028 Fidelity Blue Chip Growth $2,707,005 Fidelity Small Cap Enhanced Index $12,881 Fidelity Nordic $390,469Fidelity Cash Reserves $4,155,021 $580,028 Fidelity Contrafund $2,498,283 $3,202,265 Fidelity Europe $352,388Calvert Money Market Portfolio $1,301,416 Fidelity New Millennium $1,481,674 Fidelity Pacific Basin $316,621Fidelity Retirement Money Market $1,152,015 Fidelity Capital & Income $2,310,859 Fidelity OTC $1,464,956 Fidelity Small Cap Growth $417,878 Fidelity Japan $108,990Fidelity US Government Reserves $1,059,494 Fidelity High Income $810,106 Fidelity Independence $969,905 $417,878 Fidelity Europe Capital Appreciation $99,210Fidelity Money Market $832,165 Fidelity Focused High Income $136,223 Fidelity Capital Appreciation $765,372 Fidelity Japan Smaller Companies $84,368Fidelity US Treasury Money Market $703,894 $3,257,189 Fidelity Export & Multinational $635,810 Fidelity Small Cap Value $373,868 $3,426,894Fidelity Money: Retirement Govt MMkt $552,259 Fidelity Fifty $157,523 $373,868Fidelity Select Money Market $297,785 Fidelity Asset Manager 20% $343,756 Fidelity Growth Discovery $149,438 Fidelity Telecom and Utilities $434,432Fidelity Government Money Market $146,198 Fidelity Strategic Real Return $110,323 Fidelity Focused Stock $130,107 CREF Global Equities $22,497,349 Fidelity Select Energy $348,484
$30,065,554 Fidelity Asset Manager 30% $10,586 Fidelity Trend $114,718 Fidelity Worldwide $278,178 Fidelity Select Biotechnology $244,386$464,665 Fidelity Large Cap Growth $55,648 Fidelity Global Balanced $43,718 Fidelity Select Technology $219,138
Fidelity Short-Term Bond $903,016 Fidelity Nasdaq Composite Index $21,378 $22,819,245 Fidelity Select Health Care $169,026Fidelity Instl Shrt-Interm Govt $621,167 CREF Social Choice $21,008,990 Fidelity Large Cap Growth Enhanced Index $16,860 Fidelity Select Electronics $137,680Fidelity Spartan S/T Tr Bd Idx Inv $449,750 Fidelity Puritan $2,386,596 $44,106,526 TIAA-CREF International Eq Instl $4,216,868 Fidelity Select Energy Service $125,806
$1,973,934 Calvert Balanced A $2,136,468 Fidelity Canada $1,394,359 Fidelity Select Natural Gas $99,273Fidelity Asset Manager 70% $1,901,848 TIAA-CREF Large-Cap Value Instl $3,249,955 Fidelity Overseas $1,275,206 Fidelity Select Medical Delivery $78,381
Fidelity Conservative Income Bond $78,183 Fidelity Balanced $1,482,014 Fidelity Equity-Income $2,539,121 Fidelity Diversified International $1,048,213 Fidelity Select Pharmaceuticals $69,986Fidelity Ultra-Short Bond $72,570 Fidelity Asset Manager 50% $907,660 Fidelity Blue Chip Value $381,027 Fidelity International Discovery $1,008,395 Fidelity Select Consumer Staples $69,698
$150,754 $29,823,576 Fidelity Equity-Income II $300,882 Fidelity Spartan International Index Inv $607,454 Fidelity Select Software & Comp $66,284Fidelity Stock Selec Lg Cp Val $280,718 Fidelity Total International Equity $39,955 Fidelity Select Envir and Alt Energy $60,850
CREF Bond Market $22,858,242 Fidelity Asset Manager 85% $390,805 Fidelity Strategic Dividend & Income $227,478 $9,590,451 Fidelity Select Brokerage & Invmt Mgmt $56,988Fidelity Intermediate Bond $1,806,120 Fidelity Four-in-One Index $320,354 Fidelity Large Cap Value Enhanced Index $20,914 Fidelity Select Financial Services $51,204Fidelity Strategic Income $1,685,305 $711,158 $7,000,096 Fidelity International Capital Apprec $94,200 Fidelity Select Chemicals $47,227Fidelity GNMA Fund $1,407,886 Fidelity International Growth $68,526 Fidelity Select Communications Equip $43,456Spartan U.S. Bond Index Investor $1,309,466 Fidelity Freedom Funds AVERAGE $23,972,701 Fidelity Low-Priced Stock $4,196,124 $162,726 Fidelity Select Computers $42,650Fidelity Investment Grade Bond $1,126,714 TIAA-CREF Lifecycle AVERAGE $6,638,834 Fidelity Leveraged Company Stock $968,053 Fidelity Select Telecommunications $40,409Fidelity Government Income $821,355 $30,611,535 Fidelity Small Cap Stock $923,521 Fidelity International Small Cap $394,245 Fidelity Select Multimedia $35,774Fidelity Total Bond $814,502 Fidelity Spartan Extended Mkt Index Inv $622,349 Fidelity International Small Cap Opp $63,723 Fidelity Select Utilities Portfolio $33,102Fidelity Spartan Interm Tr Bd Idx Inv $200,954 CREF Stock $174,353,864 Fidelity Value Strategies $107,137 $457,968 Fidelity Select Leisure $30,243Fidelity Mortgage Secs $186,762 CREF Equity Index $15,914,542 $6,817,183 Fidelity Select Automotive $28,462Fidelity Spartan L/T Tr Bd Idx Inv $108,542 Fidelity Spartan 500 Index Inv $3,144,486 Fidelity Emerging Markets $1,301,802 Fidelity Select Consumer Finance $27,964Fidelity Intermediate Government Inc $36,890 Fidelity Growth & Income K $2,510,862 TIAA-CREF Mid-Cap Growth Instl $1,903,648 Fidelity EMEA $31,074 Fidelity Select Medical Equip & Systems $27,087
$32,362,737 Fidelity Dividend Growth $1,922,694 Fidelity Mid-Cap Stock $1,705,806 $1,332,875 Fidelity Select Transportation $26,230Fidelity Spartan Total Market Index Inv $1,062,700 Fidelity Growth Strategies $666,342 Fidelity Select Defense & Aerospace $21,950
CREF Inflation-Linked Bond $21,526,392 Fidelity $890,187 Fidelity Mid Cap Growth $69,739 Fidelity New Markets Income $1,332,294 Fidelity Select Wireless $21,584Fidelity Inflation-Protected Bond $825,918 Fidelity Large Cap Stock $220,256 $4,345,536 $1,332,294 Fidelity Select Industrials $19,491
$22,352,310 Fidelity Disciplined Equity $200,304 Fidelity Select Industrial Equipment $10,618Fidelity Mega Cap Stock $178,222 TIAA-CREF Mid-Cap Value Instl $2,318,138 Fidelity Select Gold $483,416 $2,687,865
TIAA Real Estate Account $18,642,198 Neuberger Berman Socially Resp Tr $149,698 Fidelity Value K $2,081,274 Fidelity Select Natural Resources $201,720Fidelity Real Estate Investment $1,015,833 Fidelity Value Discovery $139,570 Fidelity Mid Cap Value $245,379 Fidelity Global Cmdty Stk $184,388Fidelity Real Estate Income $269,482 Domini Social Equity Inv $62,232 $4,644,792 Fidelity Select Materials $82,683Fidelity International Real Estate $77,886 Fidelity Large Cap Core Enhanced Index $28,950 $952,207 $782,316,748
$20,005,399 $200,778,565
Mid-Cap Value Natural ResReal Estate
Fund Total
Diversified Emerging MktsMid-Cap Growth
Inflation-Protected Bond Emerging Markets Bond
Lifecycle Mid-Cap Blend
Foreign Small/Mid Growth
Large Blend
Ultrashort Bond
Intermediate-Term Bond Aggressive Allocation
Foreign Large Growth
Short GovernmentModerate Allocation
Foreign Large Blend
Large Value
Small Value
Conservative Allocation Sector FundsWorld Stock
Regional Funds
Money Market Taxable Convertibles
High Yield Bond Small Growth
Guaranteed Bank Loan Large Growth Small Blend
Current Combined Investment Menu - 168 OptionsName Name Name Name Name
This is a menu from an actual TIAA-CREF client but the dollar amounts were changed proportionately for each option so as not to provide information that would reveal the client’s identity.
4
10For Institutional Investor Use Only. Not for Use With or Distribution to the Public.
Appendix
BBB ORGANIZATIONStable Value Multisector Bond Aggressive Allocation Large Growth Mid-Cap Growth Foreign Large Blend Sector Funds1 TIAA Traditional $365,284,758 56 Fidelity Strategic Income $11,298,808 100 Vanguard LifeStrategy Growth Inv $6,421,188 149 Fidelity Contrafund $88,935,519 211 Fidelity Mid-Cap Stock $12,963,236 261 Fidelity Diversified International $21,278,860 308 Vanguard Energy Inv $7,127,3882 Fixed Account Plus $5,352,299 57 VALIC Company II Strategic Bond $734,116 101 Fidelity Asset Manager 85% $1,821,289 150 CREF Growth $50,981,281 212 Fidelity New Millennium $6,000,346 262 Fidelity International Discovery $8,836,657 309 Vanguard Health Care Inv $6,930,3043 Fixed Account Plus Enhanced $427,922 2 Total: $12,032,924 102 VALIC Company II Agrsv Growth Lifestyle $220,833 151 Fidelity Magellan $33,045,494 213 Fidelity Growth Strategies $4,636,415 263 Fidelity Canada $7,914,178 310 Fidelity Select Energy $3,586,8994 TIAA Stable Rtn Annuity $125,590 103 Vanguard LifeStrategy Growth Inv $145,780 152 Fidelity Growth Company $30,039,966 214 Fidelity Mid Cap Growth $1,469,989 264 Fidelity Overseas $7,300,130 311 Fidelity Select Biotechnology $3,080,9114 Total: $371,190,568 Ultrashort Bond 4 Total: $8,609,090 153 Fidelity Blue Chip Growth $28,239,032 215 Vanguard Mid Cap Growth Inv $1,180,993 265 Vanguard International Growth Inv $7,280,870 312 Fidelity Select Technology $2,694,465
58 Fidelity Ultra-Short Bond $347,561 154 Vanguard PRIMECAP Inv $17,018,966 216 VALIC Company I Mid Cap Strategic Gr $885,230 266 Vanguard Total Intl Stock Index Inv $7,276,922 313 Fidelity Select Energy Service $2,646,379Money Market 1 Total: $347,561 Target Date 155 Fidelity OTC $11,812,204 217 Vanguard Mid-Cap Growth Index Inv $724,325 267 Fidelity Spartan International Index Inv $4,541,960 314 Fidelity Select Health Care $2,349,4535 CREF Money Market $80,092,874 104 Vanguard Target Retirement Total $140,943,164 156 Vanguard Capital Opportunity Inv $9,308,851 218 Managers Cadence Mid Cap Admin $652,701 268 Vanguard Developed Markets Index Inv $2,626,663 315 Fidelity Select Medical Equip & Systems $2,195,8276 Fidelity Retirement Money Market $54,125,827 Long Government 105 Fidelity Freedom Funds Total $135,059,505 157 Fidelity Capital Appreciation $7,486,899 219 VALIC Company II Mid Cap Growth $390,642 269 VALIC Company I International Equities $1,514,164 316 Fidelity Select Medical Delivery $1,435,5287 Fidelity Cash Reserves $28,376,476 59 Vanguard Long-Term Treasury Inv $1,533,156 106 TIAA-CREF Lifecycle Total $9,337,705 158 Fidelity Independence $7,042,548 220 Alger Mid Cap Growth A $1,082 270 Vanguard FTSE All-World ex-US Index Inv $337,670 317 Fidelity Select Natural Gas $1,342,3088 Fidelity Money Market $6,238,445 60 Vanguard Long-Term Bond Index Inv $1,413,946 107 Fidelity Freedom Income $2,308,277 159 Vanguard Growth Index Inv $6,285,305 10 Total: $28,904,960 271 Fidelity Total International Equity $148,341 318 Fidelity Select Chemicals $1,314,3139 Fidelity Select Money Market $4,973,807 61 Vanguard Long-Term Investment-Grade Inv$1,401,722 108 2020 Hi Watermark $12,404 160 Fidelity Export & Multinational $4,657,562 272 Fidelity International Enhanced Index $106,864 319 Fidelity Select Electronics $1,175,189
10 Fidelity US Treasury Money Market $4,035,504 62 Fidelity Spartan L/T Tr Bd Idx Inv $452,395 5 Total: $287,661,055 161 Vanguard US Growth Inv $3,339,398 Mid-Cap Value 273 Morgan Stanley Active Intl Alloc $884 320 Fidelity Select Defense & Aerospace $965,77311 Fidelity US Government Reserves $2,447,313 63 Vanguard Long-Term Investment-Grade Inv $415,131 162 Vanguard Morgan Growth Inv $3,326,870 221 Fidelity Value $14,046,256 13 Total: $69,164,163 321 Fidelity Select Software & Comp $817,61412 Vanguard Admiral Trsy Money Mkt $1,348,286 64 Vanguard Long-Term Treasury Inv $134,641 Real Estate 163 Fidelity Growth Discovery $1,743,557 222 Fidelity Mid Cap Value $2,398,617 322 Fidelity Select Communications Equip $763,83013 Fidelity Government Money Market $1,265,859 6 Total: $5,350,992 109 TIAA Real Estate Account $27,953,145 164 Fidelity Fifty $1,413,665 223 Vanguard Selected Value Inv $1,909,357 Foreign Large Growth 323 Fidelity Select Consumer Staples $734,86414 Vanguard Federal Money Market Inv $1,022,955 110 Vanguard REIT Index Inv $4,098,577 165 American Century Ultra A $1,350,505 224 VALIC Company II Mid Cap Value $406,113 274 Putnam International Growth A $1,315,574 324 Fidelity Select Transportation $592,07815 VALIC Company I Money Market I $912,198 Bank Loan 111 Fidelity Real Estate Investment $3,734,107 166 Vanguard PRIMECAP Core Inv $1,075,165 225 Vanguard Mid-Cap Value Index Inv $219,029 275 Fidelity International Capital Apprec $1,035,885 325 Fidelity Select Banking $574,90116 VALIC Company II Money Market II $109,601 65 Fidelity Floating Rate High Income $1,571,149 112 Fidelity Real Estate Income $1,644,138 167 Vanguard Growth Equity Inv $1,069,637 226 Perkins Mid Cap Value T $10,560 276 VALIC Company I International Growth I $215,948 326 Fidelity Select Air Transportation $509,63812 Total: $184,949,145 1 Total: $1,571,149 113 VALIC Company I Global Real Estate $517,212 168 Fidelity Large Cap Stock $976,989 6 Total: $18,989,932 277 Fidelity International Growth $175,007 327 Fidelity Select Financial Services $488,140
5 Total: $37,947,179 169 Fidelity Large Cap Growth $802,220 4 Total: $2,742,415 328 Fidelity Select Wireless $461,138Short-Term Bond High Yield Bond 170 T. Rowe Price Blue Chip Growth $547,743 Small Blend 329 Fidelity Select Brokerage & Invmt Mgmt $456,10117 Fidelity Spartan S/T Tr Bd Idx Inv $5,875,504 66 Fidelity Capital & Income $6,855,580 Global Real Estate 171 Fidelity Focused Stock $520,695 227 Fidelity Small Cap Stock $9,680,857 Foreign Large Value 330 Fidelity Telecom and Utilities $430,85318 Fidelity Short-Term Bond $4,767,055 67 Fidelity High Income $3,491,722 114 Fidelity International Real Estate $827,870 172 Fidelity Nasdaq Composite Index $458,580 228 Vanguard Small Cap Index Inv $5,128,842 278 Vanguard International Value Inv $3,303,165 331 Fidelity Select Retailing $397,67719 Vanguard Short-Term Investment-Grade Inv$2,860,405 68 Vanguard High-Yield Corporate Inv $2,317,493 1 Total: $827,870 173 Fidelity Trend $421,125 229 Fidelity Small Cap Discovery $2,940,122 279 VALIC Company I Foreign Value $1,580,652 332 Fidelity Select Telecommunications $396,52220 Vanguard Short-Term Bond Index Inv $1,772,388 69 Fidelity Focused High Income $359,520 174 Fidelity Stock Selector All Cap $410,872 230 VALIC Company I Small Cap Index $685,129 280 Fidelity International Value $622,385 333 Fidelity Select Pharmaceuticals $378,07921 Vanguard Short-Term Treasury Inv $1,342,057 70 VALIC Company II High Yield Bond $131,342 Convertibles 175 Vanguard FTSE Social Index Inv $306,771 231 Fidelity Small Cap Enhanced Index $525,906 281 Templeton Foreign A $2,620 334 Fidelity Select Utilities Portfolio $343,50122 Fidelity Spartan S/T Tr Bd Idx Inv $1,034,023 71 PIMCO High Yield Admin $35,209 115 Fidelity Convertible Securities $2,169,707 176 VALIC Company I Large Capital Growth $274,160 232 Royce Low Priced Stock Svc $518,727 4 Total: $5,508,822 335 VALIC Company I Science & Technology $298,99323 Short Term Fixed $498,517 6 Total: $13,190,866 116 Vanguard Convertible Securities Inv $594,825 177 Fidelity Large Cap Growth Enhanced Index $225,696 233 T. Rowe Price Small-Cap Stock $254,507 336 Fidelity Select Leisure $283,01424 PIMCO Low Duration Admin $497,053 2 Total: $2,764,532 178 VALIC Company I Large Cap Core $104,938 234 Vanguard Strategic Small-Cap Equity Inv $87,625 Foreign Small/Mid Growth 337 Fidelity Select Envir and Alt Energy $263,18525 Vanguard Short-Term Federal Inv $377,649 World Bond 179 VALIC Company I NASDAQ-100 Index $48,817 235 TIAA-CREF Small-Cap Blend Idx Retire $3,888 282 Fidelity International Small Cap $4,559,650 338 Fidelity Select Automotive $246,85026 Fidelity Instl Shrt-Interm Govt $362,975 72 Templeton Global Bond A $207,043 Large Blend 180 Lou Holland Growth A $7,602 9 Total: $19,825,604 283 Vanguard International Explorer Inv $3,524,550 339 Fidelity Select Computers $226,64527 Wfa Shrtterm Bnd Inv $302,287 73 VALIC Company I Intl Govt Bond $53,921 117 CREF Stock $238,874,776 181 VALIC Company II Capital Appreciation $7,565 284 Fidelity International Small Cap Opp $923,856 340 Fidelity Select Industrials $200,37111 Total: $19,689,913 2 Total: $260,964 118 CREF Equity Index $36,937,022 182 Alger Capital Appreciation A $1,919 Small Growth 285 Vanguard FTSE All-Wld ex-US SmCp Idx Inv $125,329 341 Fidelity Select Consumer Finance $150,224
119 Vanguard 500 Index Investor $31,963,940 183 Morgan Stanley Capital Growth $670 236 Vanguard Explorer Inv $8,083,793 4 Total: $9,133,385 342 Fidelity Select Multimedia $137,427Inflation-Protected Bond Emerging Markets Bond 120 Fidelity Spartan 500 Index Inv $27,897,191 35 Total: $313,288,789 237 Fidelity Small Cap Growth $4,365,037 343 Fidelity Select Construction & Housing $125,20928 CREF Inflation-Linked Bond $21,021,259 74 Fidelity New Markets Income $5,103,407 121 Vanguard Total Stock Mkt Idx Inv $14,592,045 238 Vanguard Small Cap Growth Index Inv $3,567,727 Foreign Small/Mid Value 344 Fidelity Select Industrial Equipment $83,70629 Fidelity Inflation-Protected Bond $9,522,153 1 Total: $5,103,407 122 Fidelity Disciplined Equity $4,283,823 Large Value 239 Fidelity Stock Selector Sm Cp $2,421,110 286 Templeton Foreign Smaller Companies A $1,613 345 Fidelity Select Consumer Discretionary $73,92830 Vanguard Inflation-Protected Secs Inv $7,083,423 123 Vanguard Growth & Income Inv $4,189,264 184 Fidelity Equity-Income $14,620,030 240 VALIC Company II Small Cap Growth $535,965 1 Total: $1,613 346 Fidelity Select Insurance $61,47831 VALIC Company I Inflation Protected $168,177 Conservative Allocation 124 Fidelity $3,763,264 185 Vanguard Windsor II Investor $10,324,692 241 Morgan Stanley Small Company Growth $278,932 347 Fidelity Select IT Services $57,1494 Total: $37,795,012 75 Vanguard Wellesley Income Inv $5,613,546 125 VALIC Company I Stock Index $2,111,236 186 Vanguard Windsor Investor $7,440,801 242 Franklin Small Cap Growth A $78,899 Diversified Emerging Mkts 348 VALIC Company I Health Sciences $28,413
76 Fidelity Strategic Real Return $2,168,369 126 Vanguard Dividend Growth Inv $1,918,556 187 Fidelity Large Cap Value $3,020,722 243 VALIC Company I Small Cap Agrsv Gr $66,296 287 Vanguard Emerging Mkts Stock Idx $8,629,369 41 Total: $46,426,264Intermediate Government 77 Fidelity Asset Manager 20% $1,693,391 127 VALIC Company II Socially Responsible $1,690,716 188 Vanguard Equity-Income Inv $2,301,607 244 Columbia Acorn USA Z $13,528 288 Fidelity China Region $7,712,00332 CREF Bond Market $32,160,970 78 Vanguard LifeStrategy Cnsrv Gr Inv $850,487 128 Fidelity Value Discovery $1,491,638 189 Vanguard Windsor II Investor $1,709,780 245 Baron Growth Instl $800 289 Fidelity Emerging Markets $7,622,35433 Vanguard Total Bond Market Index Inv $13,930,341 79 Fidelity Asset Manager 40% $540,153 129 Fidelity Mega Cap Stock $1,333,250 190 Fidelity Blue Chip Value $1,566,170 10 Total: $19,412,087 290 Fidelity Latin America $6,781,38834 Fidelity Intermediate Bond $11,840,722 80 Vanguard LifeStrategy Income Inv $476,977 130 Fidelity Four-in-One Index $1,332,153 191 Vanguard US Value Inv $1,108,310 291 Fidelity Pacific Basin $2,740,37135 Fidelity US Bond Index $8,855,021 81 Fidelity Asset Manager 30% $92,547 131 Vanguard Dividend Appreciation Idx Inv $923,058 192 Fidelity Large Cap Value Enhanced Index $370,617 Small Value 292 Fidelity Emerging Asia $2,142,77036 Fidelity Investment Grade Bond $7,982,835 82 Vanguard LifeStrategy Cnsrv Gr Inv $50,663 132 Fidelity Strategic Dividend & Income $820,017 193 Vanguard High Dividend Yield Index Inv $222,915 246 Fidelity Small Cap Value $6,431,813 293 Vanguard Pacific Stock Index Inv $1,366,77737 Fidelity Total Bond $6,438,290 83 VALIC Company II Cnsrv Gr Lifestyle $20,672 133 Vanguard Capital Value Inv $774,549 194 VALIC Company II Large Cap Value $181,178 247 Vanguard Small Cap Value Index Inv $3,231,435 294 Fidelity EMEA $1,010,60338 Fidelity GNMA Fund $6,065,760 9 Total: $11,506,805 134 Vanguard Large Cap Index Inv $616,364 195 American Century Income & Growth A $65,529 248 VALIC Company II Small Cap Value $701,729 295 Templeton Developing Markets A $16,21839 Fidelity Government Income $5,698,915 135 Vanguard 500 Index Signal $354,702 196 VALIC Company I Value $50,250 249 VALIC Company I Small Cap Special Val $58,730 296 USAA Emerging Markets $688
40 Vanguard GNMA Inv $4,306,503 Moderate Allocation 136 Vanguard Diversified Equity Inv $165,666 197 ING Van Kampen Growth & Income I $32,665 250 Wfa Sm Cap Val Inv $8,385 10 Total: $38,022,54041 Vanguard Interm-Term Bond Index Inv $2,925,505 84 CREF Social Choice $26,698,222 137 Fidelity Large Cap Core Enhanced Index $157,702 198 USAA Income Stock $18,358 5 Total: $10,432,093
42 Fidelity Intermediate Government Inc $2,634,087 85 Fidelity Balanced $22,318,251 138 Oakmark I $96,255 199 VALIC Company I Broad Cap Value Income $17,177 Natural Res
43 Vanguard Interm-Term Treasury Inv $2,212,922 86 Fidelity Puritan $19,689,618 139 VALIC Company I Growth & Income $53,218 200 Abf Lg Cap Val Inv $1,457 World Allocation 297 Fidelity Select Gold $8,774,18844 Vanguard Interm-Term Invmt-Grade Inv $1,858,278 87 Vanguard Wellington Inv $14,570,257 140 VALIC Company I Core Equity $42,950 201 Mutual Shares A $1,203 251 Fidelity Global Balanced $2,204,681 298 Vanguard Precious Metals and Mining Inv $2,373,686
45 Wfa Govt Securty Inv $1,052,782 88 Fidelity Asset Manager 70% $7,924,144 141 Fidelity $33,812 18 Total: $43,053,461 252 VALIC Company I Global Strategy $180,586 299 Fidelity Select Natural Resources $2,124,275
46 Fidelity Spartan Interm Tr Bd Idx Inv $1,009,224 89 Vanguard Balanced Index Inv $2,311,196 142 Wfa Common Stock Inv $12,580 2 Total: $2,385,267 300 Fidelity Select Materials $1,097,069
47 Fidelity Mortgage Secs $592,600 90 Vanguard Asset Allocation Inv $2,076,655 143 Fidelity Mip II Cl $3,224 Mid-Cap Blend 301 Fidelity Global Cmdty Stk $911,26948 Fidelity Government Income $588,138 91 Fidelity Mgd Inc Port $2,037,242 144 MFS Massachusetts Investors Tr A $2,317 202 Fidelity Low-Priced Stock $35,598,601 World Stock 5 Total: $15,280,48749 PIMCO Total Return Admin $343,502 92 Fidelity Dynamic Strategies $1,795,052 145 Old Mutual Focused Z $1,190 203 Fidelity Leveraged Company Stock $13,003,527 253 CREF Global Equities $59,578,18050 VALIC Company I Government Securities $316,035 93 Vanguard Wellington Inv $1,789,859 146 Wfa Opportunity Inv $836 204 Fidelity Spartan Extended Mkt Index Inv $6,436,169 254 Vanguard Global Equity Inv $4,061,742 Europe Stock51 VALIC Company II Core Bond $211,666 94 Fidelity Asset Manager 60% $389,277 147 Domini Social Equity Inv $832 205 Vanguard Extended Market Idx Inv $2,790,231 255 Fidelity Worldwide $1,472,931 302 Fidelity Europe $3,493,22052 Fidelity Corporate Bond $145,915 95 Vanguard LifeStrategy Moderate Gr Inv $309,930 148 Oakmark Select I $809 206 VALIC Company I Mid Cap Index $1,665,437 256 Janus Worldwide A $472,400 303 Vanguard European Stock Index Inv $1,848,179
53 VALIC Company I Capital Conservation $84,357 96 VALIC Company II Moderate Gr Lifestyle $199,293 32 Total: $376,438,952 207 Fidelity Value Strategies $1,281,281 257 VALIC Company I Global Equity $289,426 304 Fidelity Europe Capital Appreciation $1,533,63554 Janus Flexible Bond A $60,793 97 MFS Total Return A $42,177 208 Ariel $580,873 258 Vanguard Total World Stock Index Inv $95,527 305 Fidelity Nordic $1,077,984
55 Wa Core Bond Fi $25,161 98 VALIC Company I Asset Allocation $31,697 209 Ariel Appreciation $531,704 259 VALIC Company I Global Social Awareness $82,194 306 Fidelity Japan Smaller Companies $540,575
24 Total: $111,340,322 99 Oakmark Equity & Income I $7,877 210 Fidelity Mid Cap Enhanced Index $367,905 260 Mutual Global Discovery A $15,426 307 Fidelity Japan $245,74316 Total: $102,190,748 9 Total: $62,255,728 8 Total: $66,067,825 6 Total: $8,739,337
Menu Options
PLAN TOTAL
$2,370,403,827Total Plan Assets
348
Current Combined Investment Menu - 348 Options
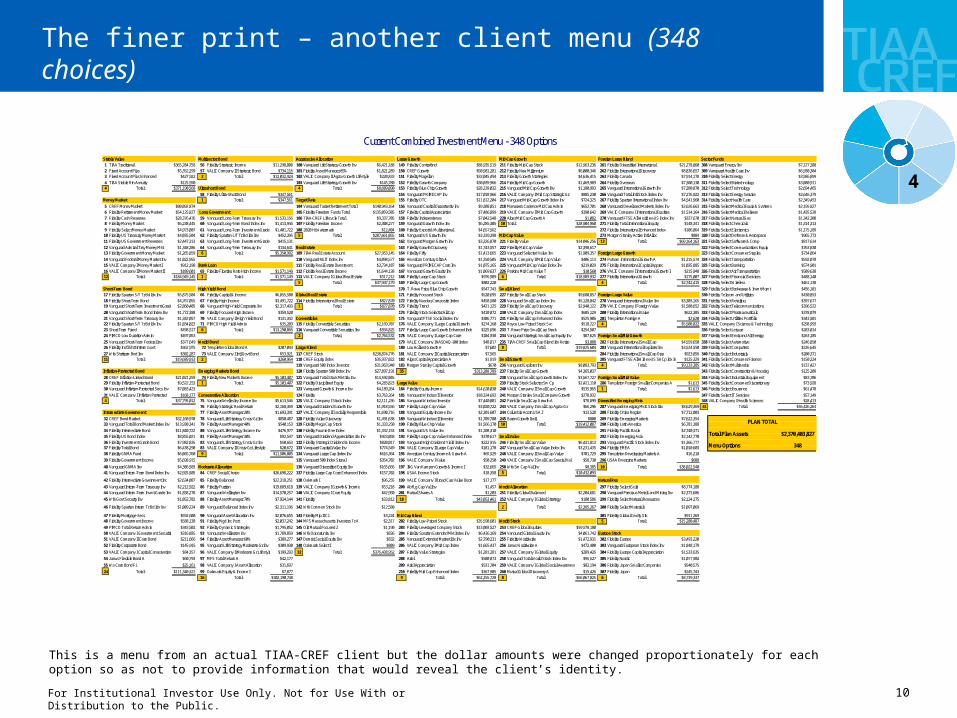
The finer print – another client menu (348 choices)
This is a menu from an actual TIAA-CREF client but the dollar amounts were changed proportionately for each option so as not to provide information that would reveal the client’s identity.
4
11For Institutional Investor Use Only. Not for Use With or Distribution to the Public.
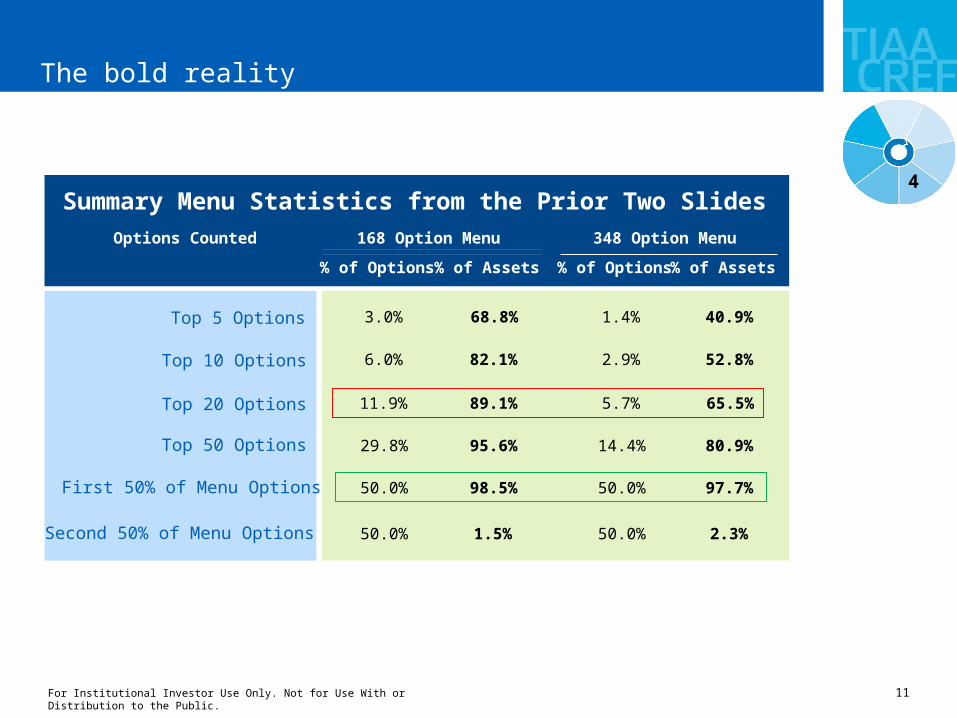
The bold reality
Options Counted
% of Options % of Assets % of Options % of Assets
Top 5 Options 3.0% 68.8% 1.4% 40.9%
Top 10 Options 6.0% 82.1% 2.9% 52.8%
Top 20 Options 11.9% 89.1% 5.7% 65.5%
Top 50 Options 29.8% 95.6% 14.4% 80.9%
First 50% of Menu Options 50.0% 98.5% 50.0% 97.7%
Second 50% of Menu Options 50.0% 1.5% 50.0% 2.3%
168 Option Menu 348 Option Menu
Summary Menu Statistics from the Prior Two Slides4
12For Institutional Investor Use Only. Not for Use With or Distribution to the Public.
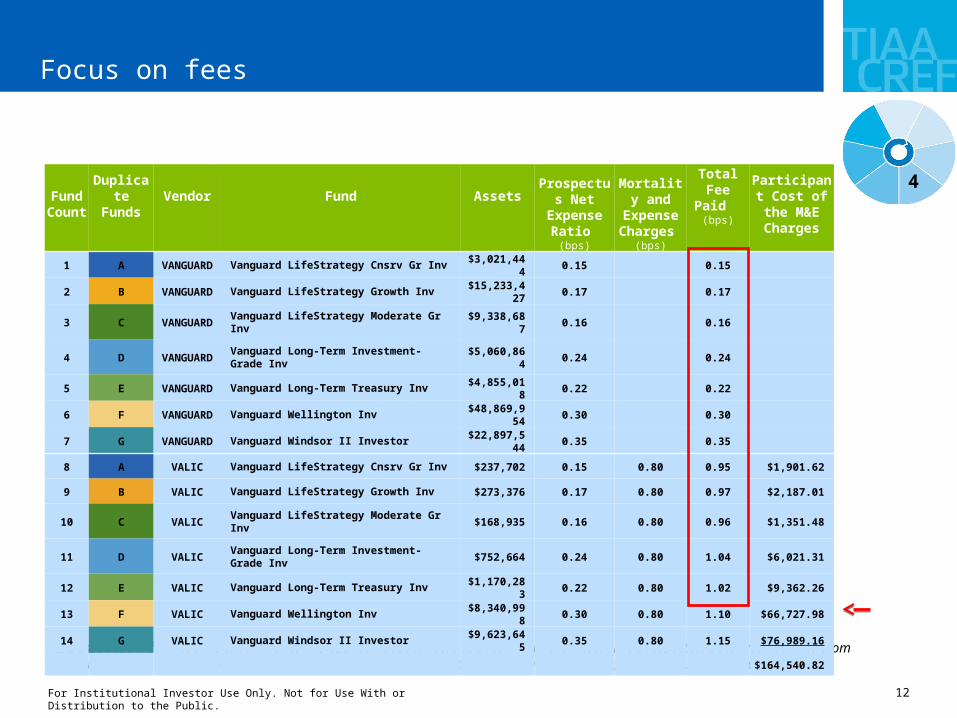
Focus on fees
Expense ratio information is shown net of any applicable fee waivers as provided in each Account’s prospectus. Data was obtained from Morningstar. Please note expense comparison may mask important differences in performance, portfolio qualities, and access.
Fund Count
Duplicate Funds
Vendor Fund AssetsProspectus
Net Expense
Ratio (bps)
Mortality and
Expense Charges
(bps)
Total Fee Paid
(bps)
Participant Cost of the
M&E Charges
1 A VANGUARD Vanguard LifeStrategy Cnsrv Gr Inv $3,021,444 0.15 0.15
2 B VANGUARD Vanguard LifeStrategy Growth Inv $15,233,427 0.17 0.17
3 C VANGUARD Vanguard LifeStrategy Moderate Gr Inv $9,338,687 0.16 0.16
4 D VANGUARD Vanguard Long-Term Investment-Grade Inv $5,060,864 0.24 0.24
5 E VANGUARD Vanguard Long-Term Treasury Inv $4,855,018 0.22 0.22
6 F VANGUARD Vanguard Wellington Inv $48,869,954 0.30 0.30
7 G VANGUARD Vanguard Windsor II Investor $22,897,544 0.35 0.35
8 A VALIC Vanguard LifeStrategy Cnsrv Gr Inv $237,702 0.15 0.80 0.95 $1,901.62
9 B VALIC Vanguard LifeStrategy Growth Inv $273,376 0.17 0.80 0.97 $2,187.01
10 C VALIC Vanguard LifeStrategy Moderate Gr Inv $168,935 0.16 0.80 0.96 $1,351.48
11 D VALIC Vanguard Long-Term Investment-Grade Inv $752,664 0.24 0.80 1.04 $6,021.31
12 E VALIC Vanguard Long-Term Treasury Inv $1,170,283 0.22 0.80 1.02 $9,362.26
13 F VALIC Vanguard Wellington Inv $8,340,998 0.30 0.80 1.10 $66,727.98
14 G VALIC Vanguard Windsor II Investor $9,623,645 0.35 0.80 1.15 $76,989.16
$164,540.82
4
13For Institutional Investor Use Only. Not for Use With or Distribution to the Public.
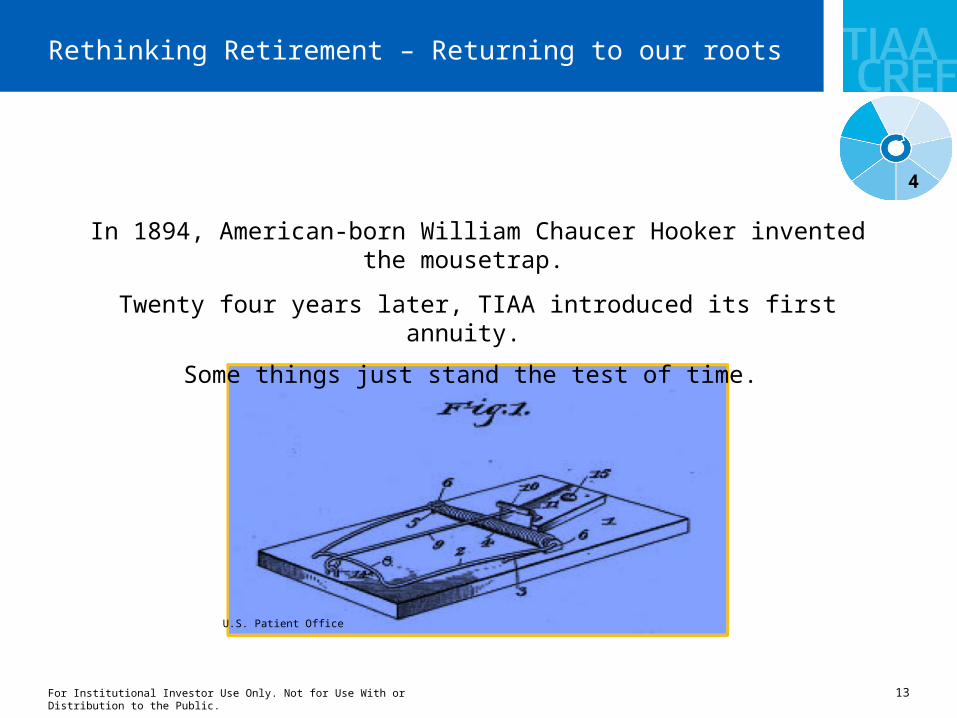
Rethinking Retirement – Returning to our roots
In 1894, American-born William Chaucer Hooker invented the mousetrap.
Twenty four years later, TIAA introduced its first annuity.
Some things just stand the test of time.
4
U.S. Patient Office
14For Institutional Investor Use Only. Not for Use With or Distribution to the Public.
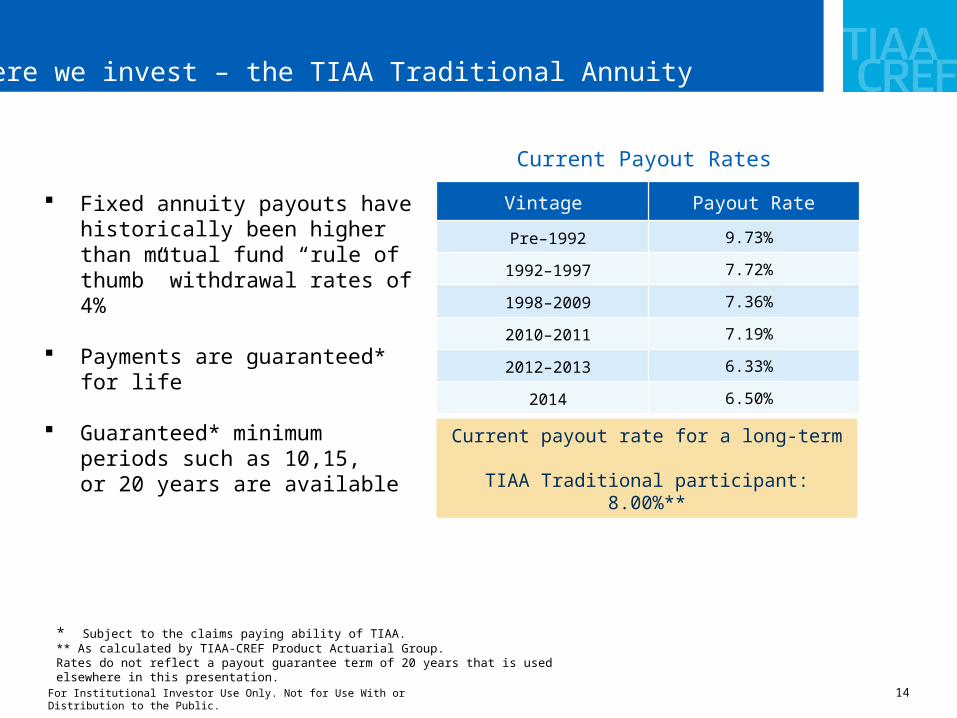
Where we invest – the TIAA Traditional Annuity
Current payout rate for a long-term TIAA Traditional participant: 8.00%**
Current Payout Rates
Vintage Payout Rate
Pre–1992 9.73%
1992–1997 7.72%
1998–2009 7.36%
2010–2011 7.19%
2012–2013 6.33%
2014 6.50%
Fixed annuity payouts have historically been higher than mutual fund “rule of thumb” withdrawal rates of 4%
Payments are guaranteed* for life
Guaranteed* minimum periods such as 10,15, or 20 years are available
* Subject to the claims paying ability of TIAA.** As calculated by TIAA-CREF Product Actuarial Group. Rates do not reflect a payout guarantee term of 20 years that is used elsewhere in this presentation.
15For Institutional Investor Use Only. Not for Use With or Distribution to the Public.
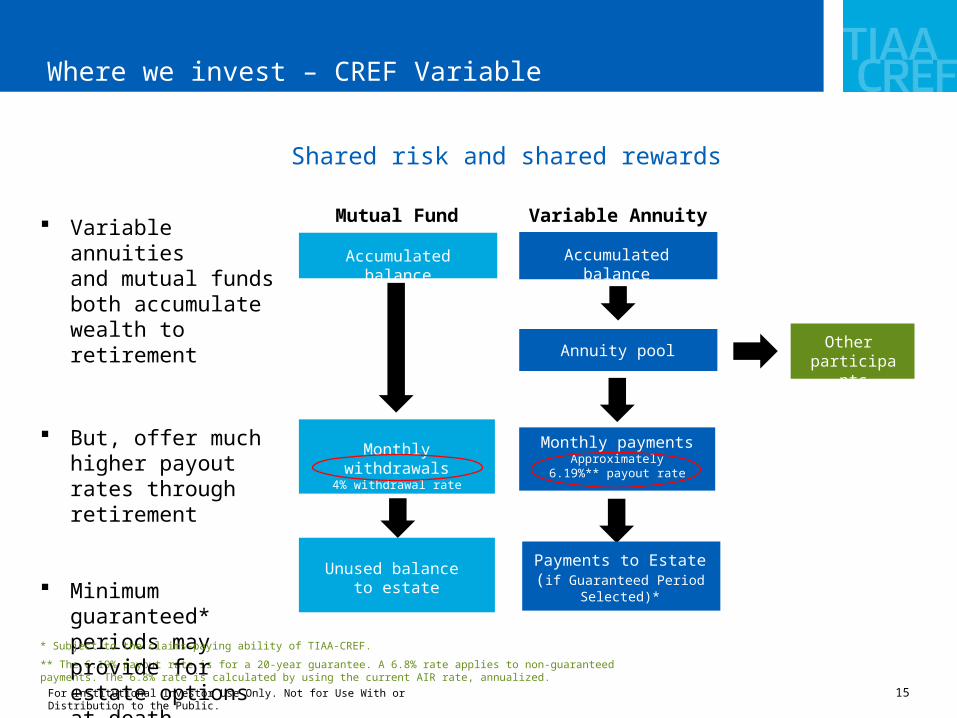
Where we invest – CREF Variable Annuities
Shared risk and shared rewards
Accumulated balance
Mutual Fund
Monthly withdrawals4% withdrawal rate
Unused balance to estate
Variable Annuity
Accumulated balance
Annuity pool Other participants
Monthly paymentsApproximately
6.19%** payout rate
** The 6.19% payout rate is for a 20-year guarantee. A 6.8% rate applies to non-guaranteed payments. The 6.8% rate is calculated by using the current AIR rate, annualized.
Variable annuities and mutual funds both accumulate wealth to retirement
But, offer much higher payout rates through retirement
Minimum guaranteed* periods may provide for estate options at death
* Subject to the claims-paying ability of TIAA-CREF.
Payments to Estate(if Guaranteed Period
Selected)*
16For Institutional Investor Use Only. Not for Use With or Distribution to the Public.
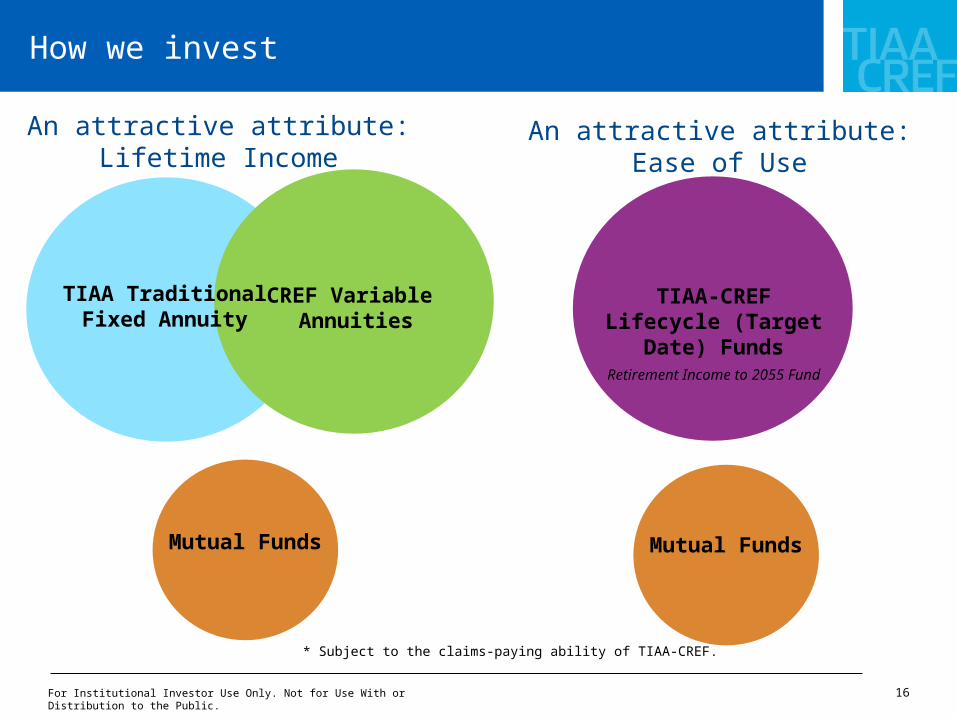
How we invest
TIAA TraditionalFixed Annuity
CREF Variable Annuities
TIAA-CREF Lifecycle (Target Date) Funds
Retirement Income to 2055 Fund
Mutual Funds
An attractive attribute:Lifetime Income
An attractive attribute:Ease of Use
* Subject to the claims-paying ability of TIAA-CREF.
Mutual Funds
17For Institutional Investor Use Only. Not for Use With or Distribution to the Public.
US Equity Fund XX%
Non-US Equity Fund XX%
US Bond Fund XX%
Non-US Bond Fund XX%
US Equity Annuity XX%
Non-US Equity Annuity XX%
Fixed Annuity XX%
Non-US Bond Fund XX%
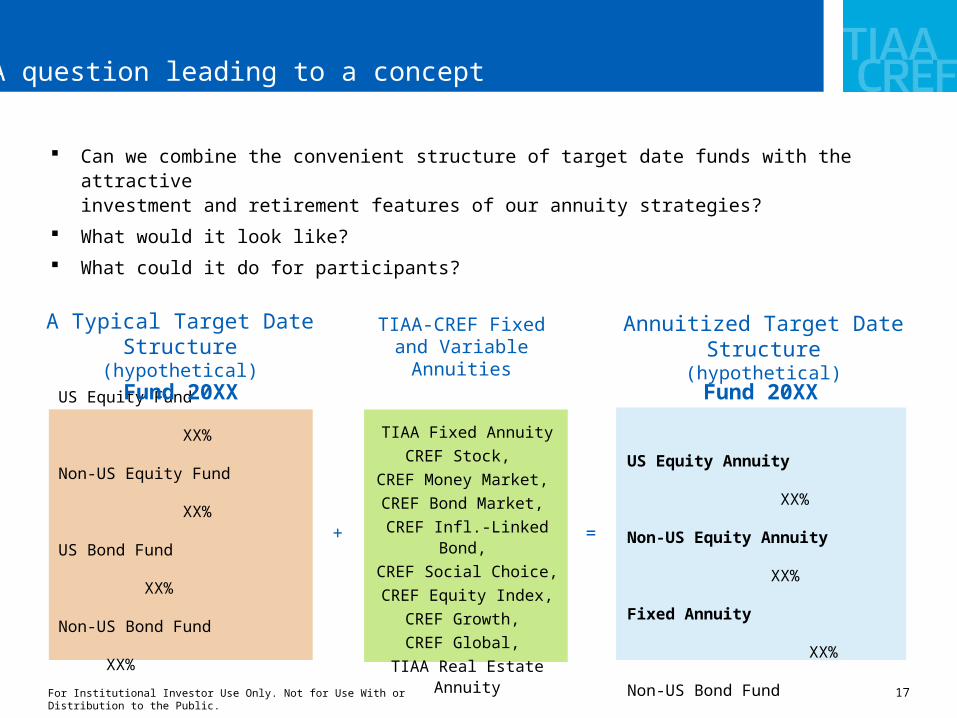
Annuitized Target Date Structure(hypothetical)
A question leading to a concept
A Typical Target Date Structure
(hypothetical)
Can we combine the convenient structure of target date funds with the attractive investment and retirement features of our annuity strategies?
What would it look like?
What could it do for participants?
TIAA-CREF Fixed and Variable Annuities
TIAA Fixed Annuity
CREF Stock,
CREF Money Market,
CREF Bond Market,
CREF Infl.-Linked Bond,
CREF Social Choice,
CREF Equity Index,
CREF Growth,
CREF Global,
TIAA Real Estate Annuity
+ =
Fund 20XX Fund 20XX
18For Institutional Investor Use Only. Not for Use With or Distribution to the Public.
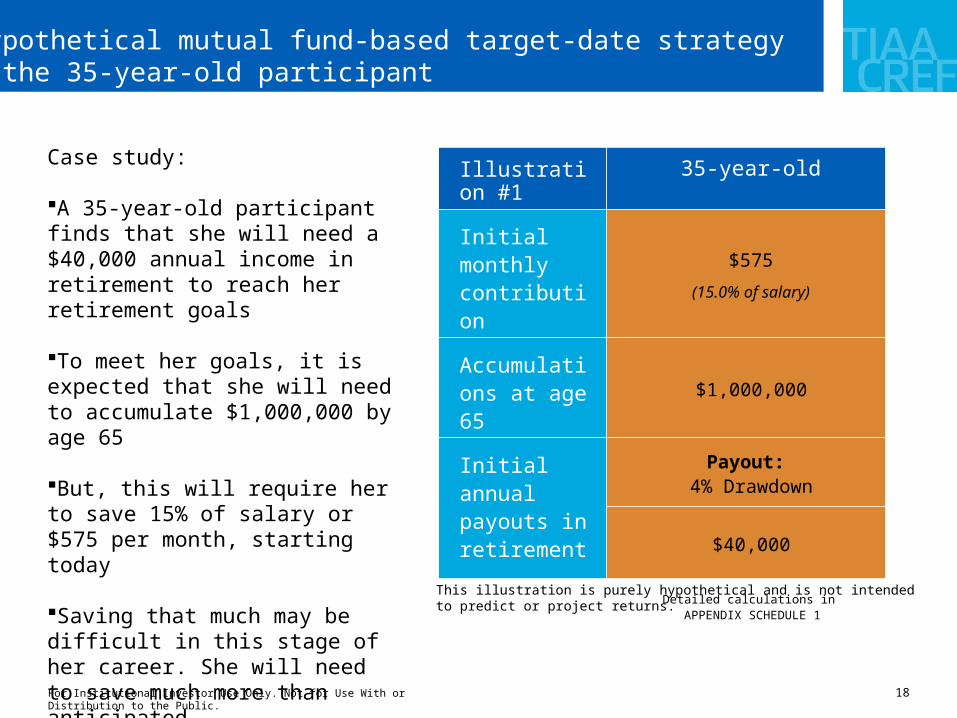
Illustration #1 35-year-old
Initial monthly contribution
$575
(15.0% of salary)
Accumulations at age 65
$1,000,000
Initial annual payouts in retirement
Payout: 4% Drawdown
$40,000
Detailed calculations in APPENDIX SCHEDULE 1
A hypothetical mutual fund-based target-date strategy for the 35-year-old participant
Case study:
A 35-year-old participant finds that she will need a $40,000 annual income in retirement to reach her retirement goals
To meet her goals, it is expected that she will need to accumulate $1,000,000 by age 65
But, this will require her to save 15% of salary or $575 per month, starting today
Saving that much may be difficult in this stage of her career. She will need to save much more than anticipated
This illustration is purely hypothetical and is not intendedto predict or project returns.
19For Institutional Investor Use Only. Not for Use With or Distribution to the Public.
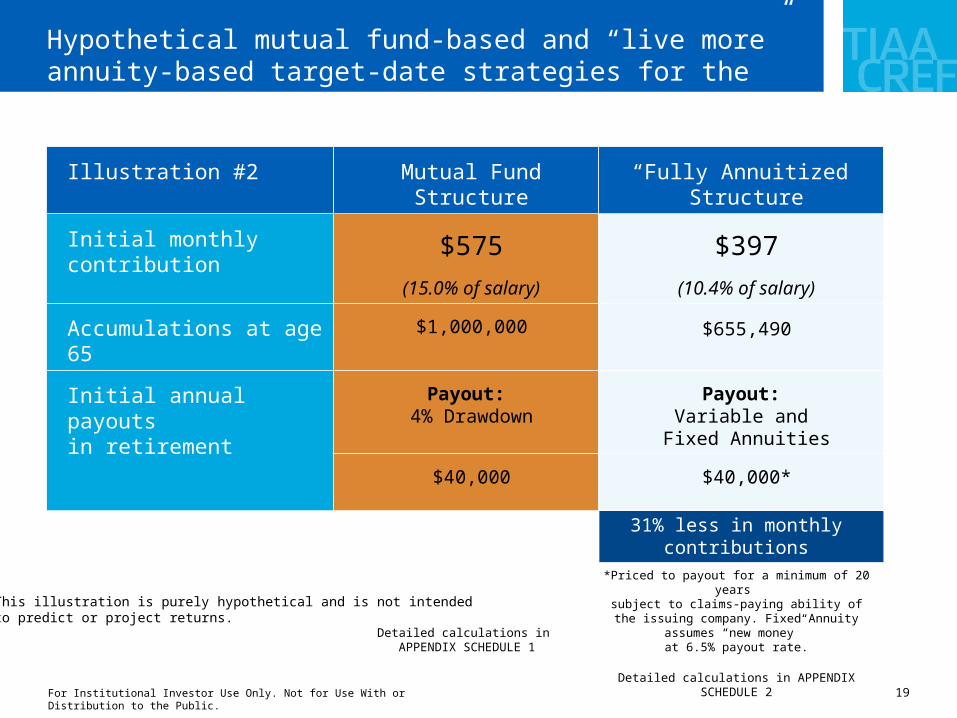
Illustration #2 Mutual Fund Structure “Fully Annuitized” Structure
Initial monthly contribution $575
(15.0% of salary)
$397
(10.4% of salary)
Accumulations at age 65 $1,000,000 $655,490
Initial annual payouts in retirement
Payout: 4% Drawdown
Payout: Variable and
Fixed Annuities
$40,000 $40,000*
31% less in monthly contributions
Detailed calculations in APPENDIX SCHEDULE 1
*Priced to payout for a minimum of 20 years subject to claims-paying ability of the issuing
company. Fixed Annuity assumes “new money” at 6.5% payout rate.
Detailed calculations in APPENDIX SCHEDULE 2
Hypothetical mutual fund-based and “live more” annuity-based target-date strategies for the 35-year-old
This illustration is purely hypothetical and is not intendedto predict or project returns.
20For Institutional Investor Use Only. Not for Use With or Distribution to the Public.
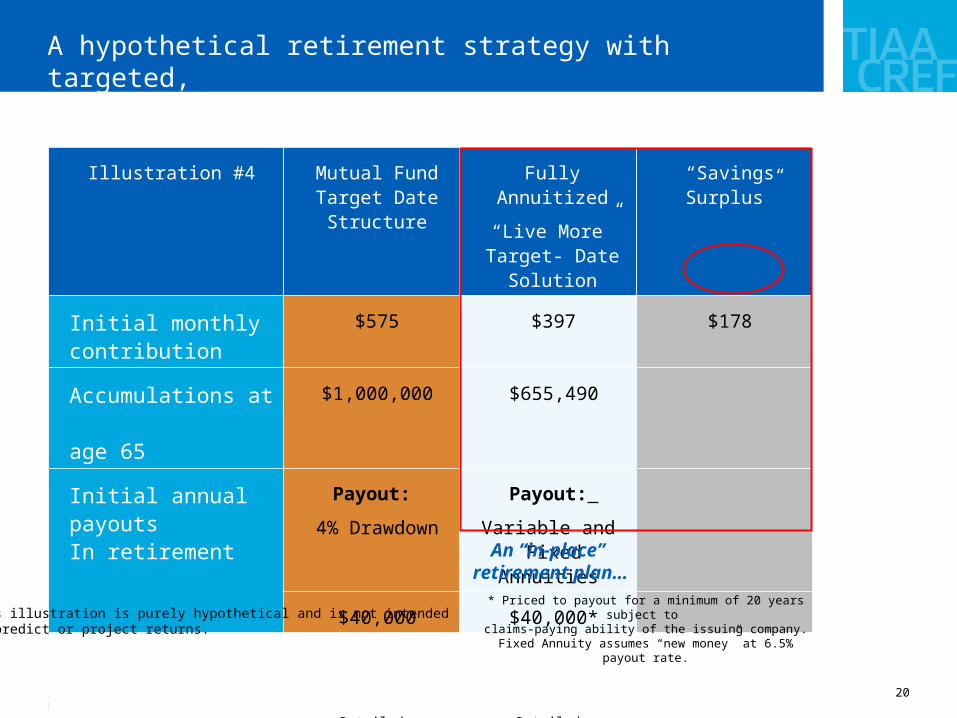
Illustration #4 Mutual Fund Target Date
Structure
Fully Annuitized
“Live More” Target- Date Solution
“Savings Surplus”
Initial monthly contribution
$575 $397 $178
Accumulations at age 65
$1,000,000 $655,490
Initial annual payouts In retirement
Payout:
4% Drawdown
Payout:
Variable and Fixed Annuities
$40,000 $40,000*
Detailed calculations in APPENDIX SCHEDULE 1
Detailed calculations in APPENDIX SCHEDULE 2
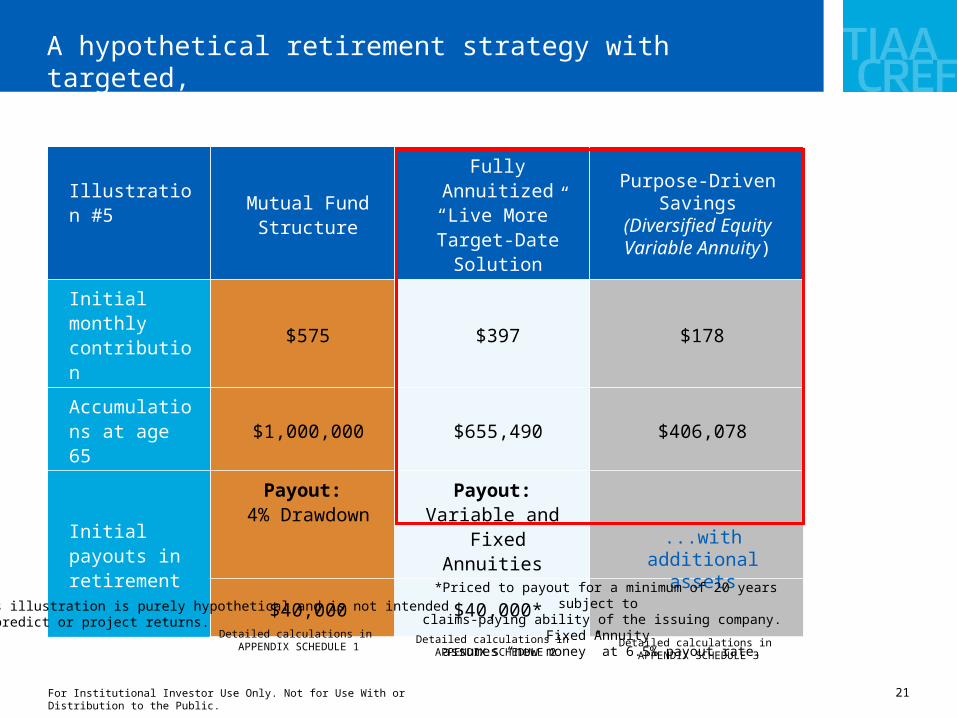
A hypothetical retirement strategy with targeted, purpose-driven savings
An “in-place” retirement plan…
* Priced to payout for a minimum of 20 years subject to claims-paying ability of the issuing company. Fixed Annuity
assumes “new money” at 6.5% payout rate.This illustration is purely hypothetical and is not intendedto predict or project returns.
21For Institutional Investor Use Only. Not for Use With or Distribution to the Public.
An “in-place” retirement plan…
Illustration #5 Mutual Fund Structure
Fully Annuitized“Live More” Target-
Date Solution
Purpose-Driven Savings
(Diversified Equity Variable Annuity)
Initial monthly contribution
$575 $397 $178
Accumulations at age 65
$1,000,000 $655,490 $406,078
Initial payouts in retirement
Payout: 4% Drawdown
Payout: Variable and
Fixed Annuities
$40,000 $40,000*
A hypothetical retirement strategy with targeted, purpose-driven savings
...with additional assets
Detailed calculations in APPENDIX SCHEDULE 1
Detailed calculations in APPENDIX SCHEDULE 2
*Priced to payout for a minimum of 20 years subject to claims-paying ability of the issuing company. Fixed Annuity
assumes “new money” at 6.5% payout rate.
Detailed calculations in APPENDIX SCHEDULE 3
This illustration is purely hypothetical and is not intendedto predict or project returns.
22For Institutional Investor Use Only. Not for Use With or Distribution to the Public.
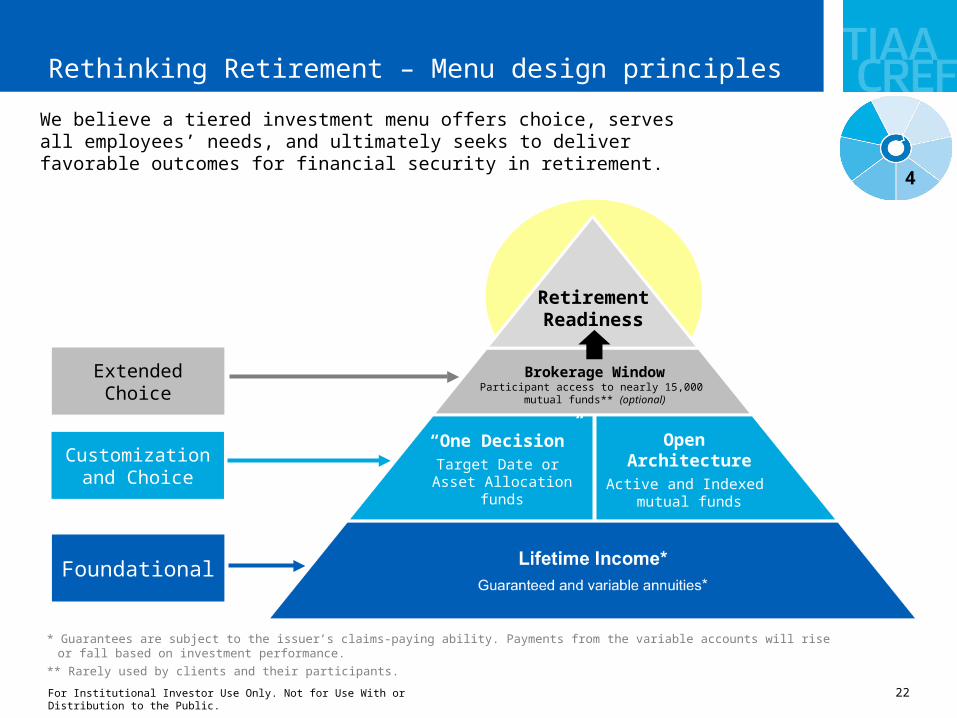
Rethinking Retirement – Menu design principles
We believe a tiered investment menu offers choice, serves all employees’ needs, and ultimately seeks to deliver favorable outcomes for financial security in retirement.
Customization and Choice
Extended Choice
Foundational
Open Architecture
Active and Indexed mutual funds
“One Decision”Target Date or
Asset Allocation funds
RetirementReadiness
Brokerage WindowParticipant access to nearly 15,000
mutual funds** (optional)
* Guarantees are subject to the issuer’s claims-paying ability. Payments from the variable accounts will rise or fall based on investment performance.
** Rarely used by clients and their participants.
4
23For Institutional Investor Use Only. Not for Use With or Distribution to the Public.
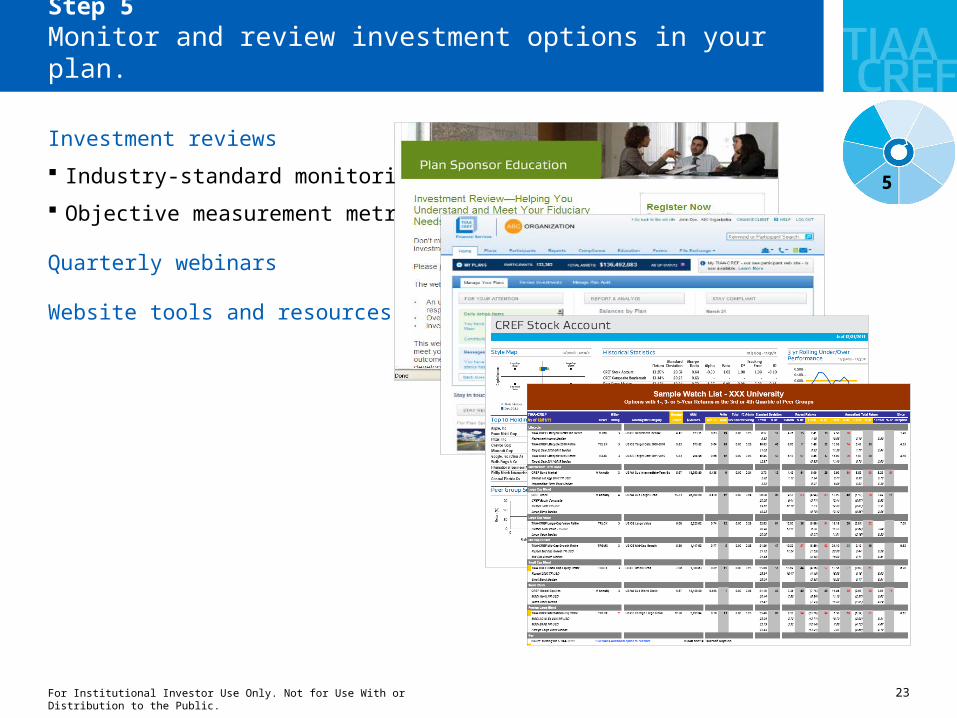
Step 5Monitor and review investment options in your plan.
Investment reviews
Industry-standard monitoring
Objective measurement metrics
Quarterly webinars
Website tools and resources
5
24For Institutional Investor Use Only. Not for Use With or Distribution to the Public.
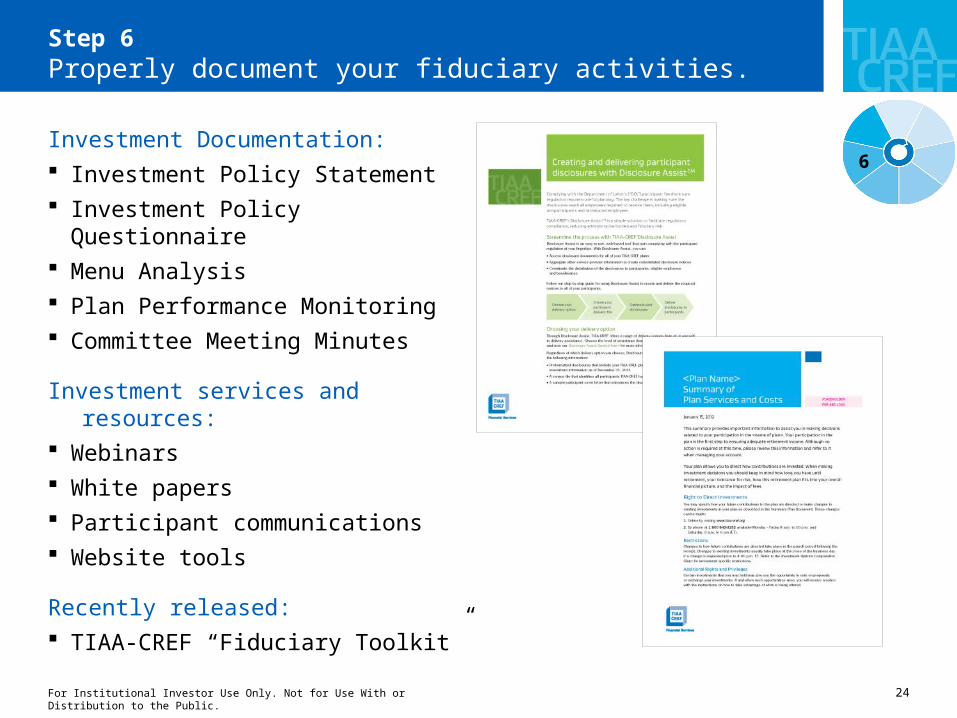
Step 6Properly document your fiduciary activities.
Investment Documentation: Investment Policy Statement Investment Policy Questionnaire Menu Analysis Plan Performance Monitoring Committee Meeting Minutes
Investment services and resources: Webinars White papers Participant communications Website tools
Recently released: TIAA-CREF “Fiduciary Toolkit”
6
25For Institutional Investor Use Only. Not for Use With or Distribution to the Public.
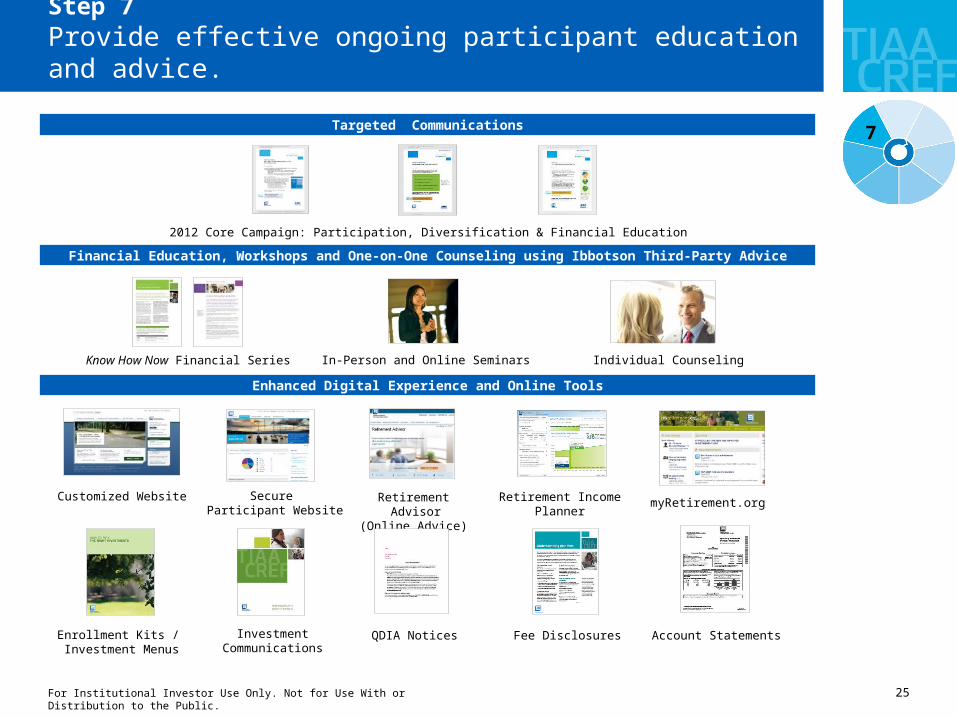
Step 7Provide effective ongoing participant education and advice.
Enrollment Kits / Investment Menus
InvestmentCommunications
QDIA Notices Fee Disclosures Account Statements
Financial Education, Workshops and One-on-One Counseling using Ibbotson Third-Party Advice
myRetirement.orgRetirement Income Planner
Retirement Advisor (Online Advice)
Enhanced Digital Experience and Online Tools
Targeted Communications
In-Person and Online Seminars Individual Counseling
2012 Core Campaign: Participation, Diversification & Financial Education
Know How Now Financial Series
Customized Website Secure Participant Website
7
26For Institutional Investor Use Only. Not for Use With or Distribution to the Public.
Appendix
For Institutional Investor Use Only. Not for Use With or Distribution to the Public.
27For Institutional Investor Use Only. Not for Use With or Distribution to the Public.
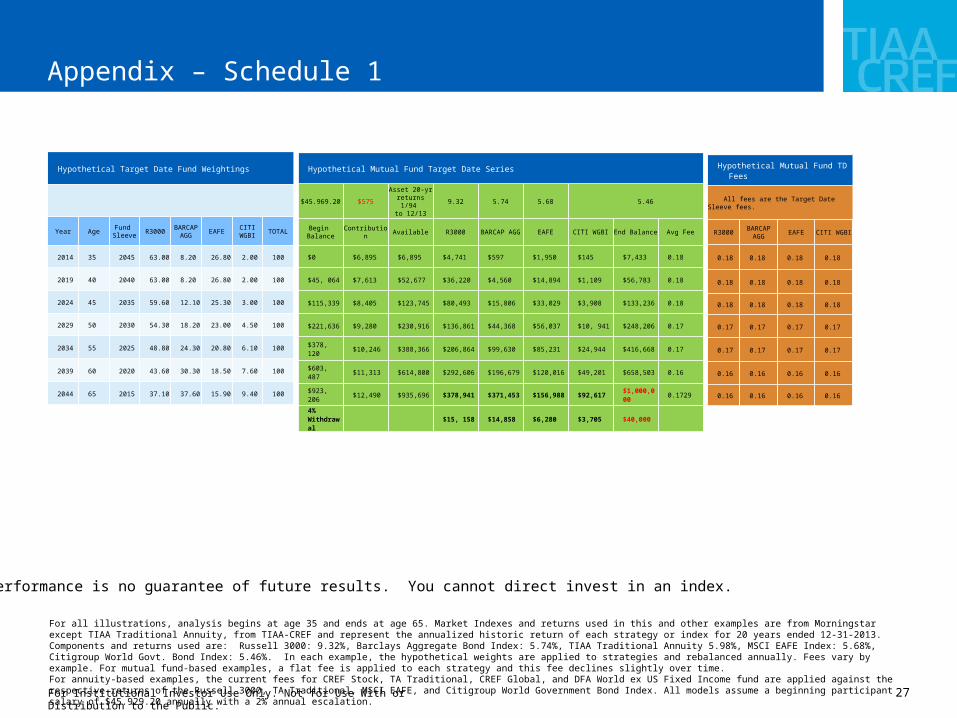
Appendix – Schedule 1
Hypothetical Target Date Fund Weightings
Year AgeFund Sleeve
R3000BARCAP
AGGEAFE
CITI WGBI
TOTAL
2014 35 2045 63.00 8.20 26.80 2.00 100
2019 40 2040 63.00 8.20 26.80 2.00 100
2024 45 2035 59.60 12.10 25.30 3.00 100
2029 50 2030 54.30 18.20 23.00 4.50 100
2034 55 2025 48.80 24.30 20.80 6.10 100
2039 60 2020 43.60 30.30 18.50 7.60 100
2044 65 2015 37.10 37.60 15.90 9.40 100
Hypothetical Mutual Fund Target Date Series
$45.969.20 $575Asset 20-yr
returns 1/94 to 12/13
9.32 5.74 5.68 5.46
Begin Balance
Contribution Available R3000 BARCAP AGG EAFE CITI WGBI End Balance Avg Fee
$0 $6,895 $6,895 $4,741 $597 $1,950 $145 $7,433 0.18
$45, 064 $7,613 $52,677 $36,220 $4,560 $14,894 $1,109 $56,783 0.18
$115,339 $8,405 $123,745 $80,493 $15,806 $33,029 $3,908 $133,236 0.18
$221,636 $9,280 $230,916 $136,861 $44,368 $56,037 $10, 941 $248,206 0.17
$378, 120 $10,246 $388,366 $206,864 $99,630 $85,231 $24,944 $416,668 0.17
$603, 487 $11,313 $614,800 $292,606 $196,679 $120,016 $49,201 $658,503 0.16
$923, 206 $12,490 $935,696 $378,941 $371,453 $156,988 $92,617 $1,000,000 0.1729
4% Withdrawal
$15, 158 $14,858 $6,280 $3,705 $40,000
For all illustrations, analysis begins at age 35 and ends at age 65. Market Indexes and returns used in this and other examples are from Morningstar except TIAA Traditional Annuity, from TIAA-CREF and represent the annualized historic return of each strategy or index for 20 years ended 12-31-2013. Components and returns used are: Russell 3000: 9.32%, Barclays Aggregate Bond Index: 5.74%, TIAA Traditional Annuity 5.98%, MSCI EAFE Index: 5.68%, Citigroup World Govt. Bond Index: 5.46%. In each example, the hypothetical weights are applied to strategies and rebalanced annually. Fees vary by example. For mutual fund-based examples, a flat fee is applied to each strategy and this fee declines slightly over time. For annuity-based examples, the current fees for CREF Stock, TA Traditional, CREF Global, and DFA World ex US Fixed Income fund are applied against the respective returns of the Russell 3000, TA Traditional, MSCI EAFE, and Citigroup World Government Bond Index. All models assume a beginning participant salary of $45.929.20 annually with a 2% annual escalation.
Hypothetical Mutual Fund TD Fees
All fees are the Target Date Sleeve fees.
R3000BARCAP
AGGEAFE CITI WGBI
0.18 0.18 0.18 0.18
0.18 0.18 0.18 0.18
0.18 0.18 0.18 0.18
0.17 0.17 0.17 0.17
0.17 0.17 0.17 0.17
0.16 0.16 0.16 0.16
0.16 0.16 0.16 0.16
Past performance is no guarantee of future results. You cannot direct invest in an index.
28For Institutional Investor Use Only. Not for Use With or Distribution to the Public.
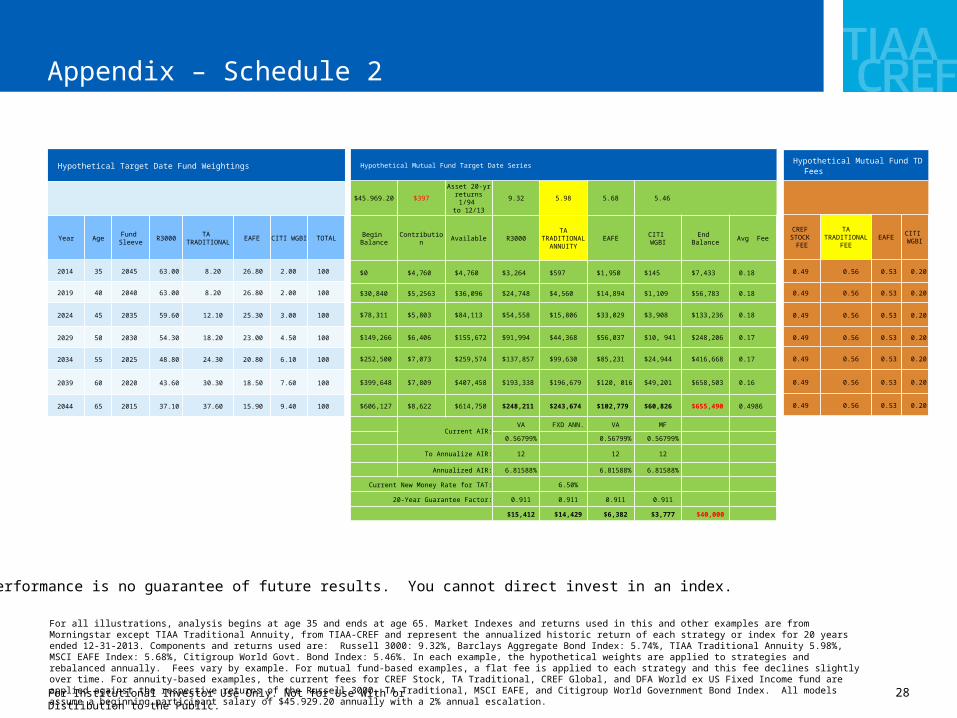
Appendix – Schedule 2
Hypothetical Target Date Fund Weightings
Year AgeFund Sleeve
R3000TA
TRADITIONALEAFE CITI WGBI TOTAL
2014 35 2045 63.00 8.20 26.80 2.00 100
2019 40 2040 63.00 8.20 26.80 2.00 100
2024 45 2035 59.60 12.10 25.30 3.00 100
2029 50 2030 54.30 18.20 23.00 4.50 100
2034 55 2025 48.80 24.30 20.80 6.10 100
2039 60 2020 43.60 30.30 18.50 7.60 100
2044 65 2015 37.10 37.60 15.90 9.40 100
Hypothetical Mutual Fund Target Date Series
$45.969.20 $397Asset 20-yr
returns 1/94 to 12/13
9.32 5.98 5.68 5.46
Begin Balance
Contribution Available R3000TA
TRADITIONAL ANNUITY
EAFECITI WGBI
End Balance
Avg Fee
$0 $4,760 $4,760 $3,264 $597 $1,950 $145 $7,433 0.18
$30,840 $5,2563 $36,096 $24,748 $4,560 $14,894 $1,109 $56,783 0.18
$78,311 $5,803 $84,113 $54,558 $15,806 $33,029 $3,908 $133,236 0.18
$149,266 $6,406 $155,672 $91,994 $44,368 $56,037 $10, 941 $248,206 0.17
$252,500 $7,073 $259,574 $137,857 $99,630 $85,231 $24,944 $416,668 0.17
$399,648 $7,809 $407,458 $193,338 $196,679 $120, 016 $49,201 $658,503 0.16
$606,127 $8,622 $614,750 $248,211 $243,674 $102,779 $60,826 $655,490 0.4986
Current AIR:VA FXD ANN. VA MF
0.56799% 0.56799% 0.56799%
To Annualize AIR: 12 12 12
Annualized AIR: 6.81588% 6.81588% 6.81588%
Current New Money Rate for TAT: 6.50%
20-Year Guarantee Factor: 0.911 0.911 0.911 0.911
$15,412 $14,429 $6,382 $3,777 $40,000
Hypothetical Mutual Fund TD Fees
CREF STOCK
FEE
TA TRADITIONAL
FEEEAFE
CITI WGBI
0.49 0.56 0.53 0.20
0.49 0.56 0.53 0.20
0.49 0.56 0.53 0.20
0.49 0.56 0.53 0.20
0.49 0.56 0.53 0.20
0.49 0.56 0.53 0.20
0.49 0.56 0.53 0.20
For all illustrations, analysis begins at age 35 and ends at age 65. Market Indexes and returns used in this and other examples are from Morningstar except TIAA Traditional Annuity, from TIAA-CREF and represent the annualized historic return of each strategy or index for 20 years ended 12-31-2013. Components and returns used are: Russell 3000: 9.32%, Barclays Aggregate Bond Index: 5.74%, TIAA Traditional Annuity 5.98%, MSCI EAFE Index: 5.68%, Citigroup World Govt. Bond Index: 5.46%. In each example, the hypothetical weights are applied to strategies and rebalanced annually. Fees vary by example. For mutual fund-based examples, a flat fee is applied to each strategy and this fee declines slightly over time. For annuity-based examples, the current fees for CREF Stock, TA Traditional, CREF Global, and DFA World ex US Fixed Income fund are applied against the respective returns of the Russell 3000, TA Traditional, MSCI EAFE, and Citigroup World Government Bond Index. All models assume a beginning participant salary of $45.929.20 annually with a 2% annual escalation.
Past performance is no guarantee of future results. You cannot direct invest in an index.
29For Institutional Investor Use Only. Not for Use With or Distribution to the Public.
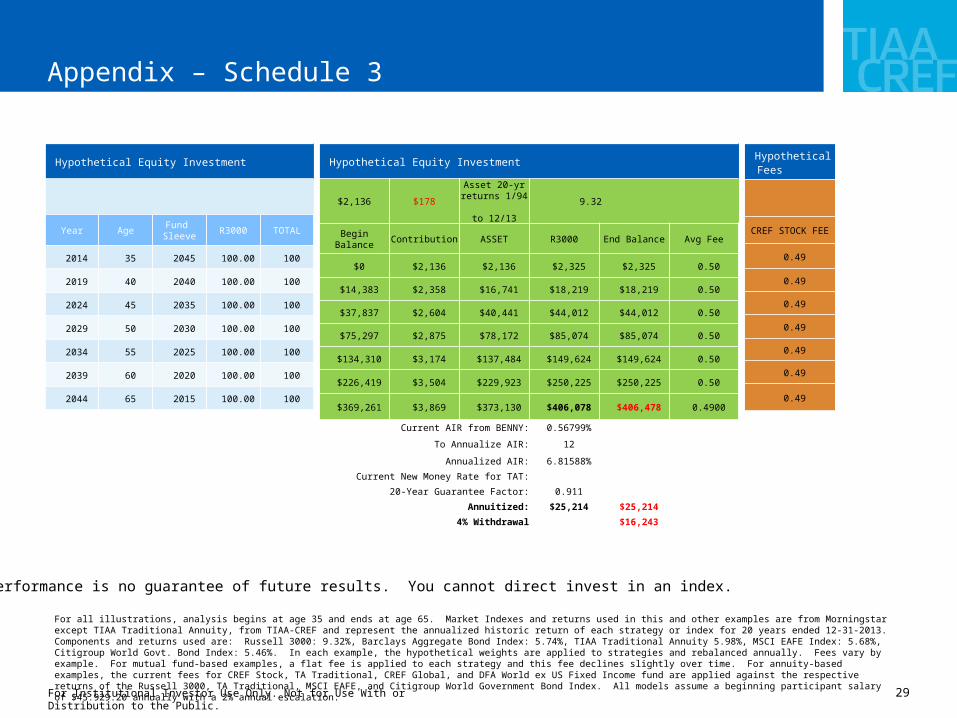
Appendix – Schedule 3
Hypothetical Equity Investment
Year AgeFund Sleeve
R3000 TOTAL
2014 35 2045 100.00 100
2019 40 2040 100.00 100
2024 45 2035 100.00 100
2029 50 2030 100.00 100
2034 55 2025 100.00 100
2039 60 2020 100.00 100
2044 65 2015 100.00 100
Hypothetical Equity Investment
$2,136 $178Asset 20-yr returns 1/94
to 12/13 9.32
Begin Balance Contribution ASSET R3000 End Balance Avg Fee
$0 $2,136 $2,136 $2,325 $2,325 0.50
$14,383 $2,358 $16,741 $18,219 $18,219 0.50
$37,837 $2,604 $40,441 $44,012 $44,012 0.50
$75,297 $2,875 $78,172 $85,074 $85,074 0.50
$134,310 $3,174 $137,484 $149,624 $149,624 0.50
$226,419 $3,504 $229,923 $250,225 $250,225 0.50
$369,261 $3,869 $373,130 $406,078 $406,478 0.4900
Current AIR from BENNY: 0.56799%
To Annualize AIR: 12
Annualized AIR: 6.81588%
Current New Money Rate for TAT:
20-Year Guarantee Factor: 0.911
Annuitized: $25,214 $25,214
4% Withdrawal $16,243
Hypothetical Fees
CREF STOCK FEE
0.49
0.49
0.49
0.49
0.49
0.49
0.49
For all illustrations, analysis begins at age 35 and ends at age 65. Market Indexes and returns used in this and other examples are from Morningstar except TIAA Traditional Annuity, from TIAA-CREF and represent the annualized historic return of each strategy or index for 20 years ended 12-31-2013. Components and returns used are: Russell 3000: 9.32%, Barclays Aggregate Bond Index: 5.74%, TIAA Traditional Annuity 5.98%, MSCI EAFE Index: 5.68%, Citigroup World Govt. Bond Index: 5.46%. In each example, the hypothetical weights are applied to strategies and rebalanced annually. Fees vary by example. For mutual fund-based examples, a flat fee is applied to each strategy and this fee declines slightly over time. For annuity-based examples, the current fees for CREF Stock, TA Traditional, CREF Global, and DFA World ex US Fixed Income fund are applied against the respective returns of the Russell 3000, TA Traditional, MSCI EAFE, and Citigroup World Government Bond Index. All models assume a beginning participant salary of $45.929.20 annually with a 2% annual escalation.
Past performance is no guarantee of future results. You cannot direct invest in an index.
30For Institutional Investor Use Only. Not for Use With or Distribution to the Public.
Disclosures
This material is approved for a private presentation by authorized individuals only and, accordingly, this material is not to be reproduced in whole or in part or used for any purpose except as authorized by TIAA-CREF Institutional Sales and Services. This material is to be treated as strictly confidential and not disclosed directly or indirectly to any party other than the recipient. This material is not approved for public use or distribution.
The material is for informational purposes only and should not be regarded as a recommendation or an offer to buy or sell any product or service to which this information may relate. Certain products and services may not be available to all entities or persons.
Investment, insurance and annuity products are not FDIC insured, are not bank guaranteed, are not deposits, are not insured by any federal government agency, are not a condition to any banking service or activity, and may lose value.
TIAA-CREF products may be subject to market and other risk factors. See the applicable product literature, or visit tiaa-cref.org. for details. Past performance is not indicative of future results.
You should consider the investment objectives, risks, charges and expenses carefully before investing. Please call 877 518-9161, or go to tiaa-cref.org for a current prospectus that contains this and other information. Please read the prospectus carefully before investing.
TIAA-CREF cannot and does not provide legal advice and recommends that plan sponsors consult their own legal advisors for such advice.
TIAA-CREF Individual & Institutional Services, LLC and Teachers Personal Investors Services, Inc., members FINRA, distribute securities products.
Annuity contracts and certificates are issued by Teachers Insurance and Annuity Association (TIAA) and College Retirement Equities Fund (CREF), New York, NY.

31For Institutional Investor Use Only. Not for Use With or Distribution to the Public.
© 2012 Teachers Insurance and Annuity Association-College Retirement Equities Fund (TIAA-CREF), 730 Third Avenue, New York, NY 10017
For Institutional Investor Use Only. Not for Use With or Distribution to the Public.
C6130 | TW320833 178022_227301 (9/12)


![[Placeholder for COVER]](https://img.pdfslide.us/doc/110x75/619c2e8b5d272c6fb861b4b3/placeholder-for-cover.jpg)