Embed Size (px)
Citation preview
PICTURE OF THE MONTH
Photographic Documentation and Environmental Analysis of an Intense, AnticyclonicSupercell on the Colorado Plains
ROGER EDWARDS
Storm Prediction Center, Norman, Oklahoma
STEPHEN J. HODANISH
National Weather Service, Pueblo, Colorado
(Manuscript received 6 February 2006, in final form 12 May 2006)
ABSTRACT
Anticyclonic left-moving supercells are observed each year in the United States, emanating both dis-cretely and from storm splitting processes. Such thunderstorms often produce severe hail and wind gustsand, on rare occasion, tornadoes. The body of documentary literature on this subset of supercells isrelatively scant compared with right-moving storms, and this is especially true regarding visual character-istics and conceptual models. Here a characteristic example of the anticyclonic supercell is presented usingan intense and well-defined specimen that passed over Aroya, Colorado, on 15 June 2002. Photographic andradar documentation is provided in original and mirrored forms, for aid in conceptualizing the left-movingsupercell and associated structures and processes. A summary overview is presented of the environment,development, evolution, and effects of this remotely located but noteworthy event.
1. Introduction and backgroundSupercells moving leftward of the mean wind vector,
in the Northern Hemisphere, characteristically containa mesoanticyclone (after Davies-Jones 1986) that maybe treated as the conceptual mirror image of its right-moving counterpart. Cyclonic storms overwhelminglydominate the literature on supercell conceptualizationand processes (i.e., Moller et al. 1994); however, left-moving supercells often produce damaging wind andmay rarely spawn tornadoes (i.e., Monteverdi et al.2001; Dostalek et al. 2004; Edwards et al. 2004). Thedominant threat with anticyclonic supercells, however,is large hail. They often produce significant (�5 cm)hail, particularly in environments characterized bylarge vertical shear and buoyancy, which also supportextremely large, damaging hail from right-moving su-percells (i.e., Mathews and Turnage 2000; Edwards etal. 2004).
Many left movers are observationally documented(i.e., Nielsen-Gammon and Read 1995) to have devel-oped from the storm splitting process similar to thoseideally depicted in numerical models (i.e., Klemp andWilhelmson 1978; Weisman and Klemp 1982). By con-trast, our operational experience, as well as the Sunny-vale, California, example in Monteverdi et al. (2001),indicate that some anticyclonic supercells form dis-cretely, then deviate to the left of the mean shear and/or mean wind soon after genesis.
Here we examine an anomalously intense, anticy-clonic supercell affecting a relatively remote areaaround Aroya, in Lincoln and Cheyenne Counties, Col-orado, on the afternoon of 15 June 2002. The supercellproduced hail up to 5 cm in diameter, accumulating upto 10 cm deep. This storm is documented and analyzedusing multiple observational platforms, including satel-lite imagery, radar imagery, and field photography (i.e.,Fig. 1; discussed in more detail in section 4). Thestorm’s evolution and morphology are examined andcompared across both remotely sensed and directly ob-served perspectives. This is a common general themefor observational studies of cyclonic supercells (i.e.,
Corresponding author address: Roger Edwards, Storm Predic-tion Center, National Weather Center, 120 Boren Blvd. #2300,Norman, OK 73069.E-mail: [email protected]
DECEMBER 2006 P I C T U R E O F T H E M O N T H 3753
MWR3296
Dowell and Bluestein 2002; Wakimoto and Martner1992; Bluestein et al. 1989), but not for left movers.
Ground photography, temporally concurrent radarimagery of the storm at peak intensity, and a simpleconceptual diagram are presented, inverted into mirrorimages (Fig. 1) and compared with similar imagery of acyclonic supercell, for utility in both conceptual relationand in visual recognition by storm spotters. We obser-vationally illustrate a persistent and anomalously in-tense mesoanticyclone in this storm during the periodof its most deviant leftward motion. Observational dataand the Rapid Update Cycle (RUC) model soundings(Thompson et al. 2003) are used to evaluate the near-storm environment and assess the predictability of itsunusual, east-southeastward average motion for a left-moving supercell. The environment—both in storm-relative and Galilean-invariant frameworks—changedrapidly before storm initiation from one favoring right-moving supercells to one favoring left movers. We il-lustrate the associated effects on vertical shear andbuoyancy related to the combined passage of a coldfront and subsequent convective outflow, each prior tothe storm’s genesis. Finally, this event is used to rein-force the benefits of multiplatform observations of se-vere local storms and their environments, including thepresence of field observers in sparsely populated areas.
2. Documentation and morphology
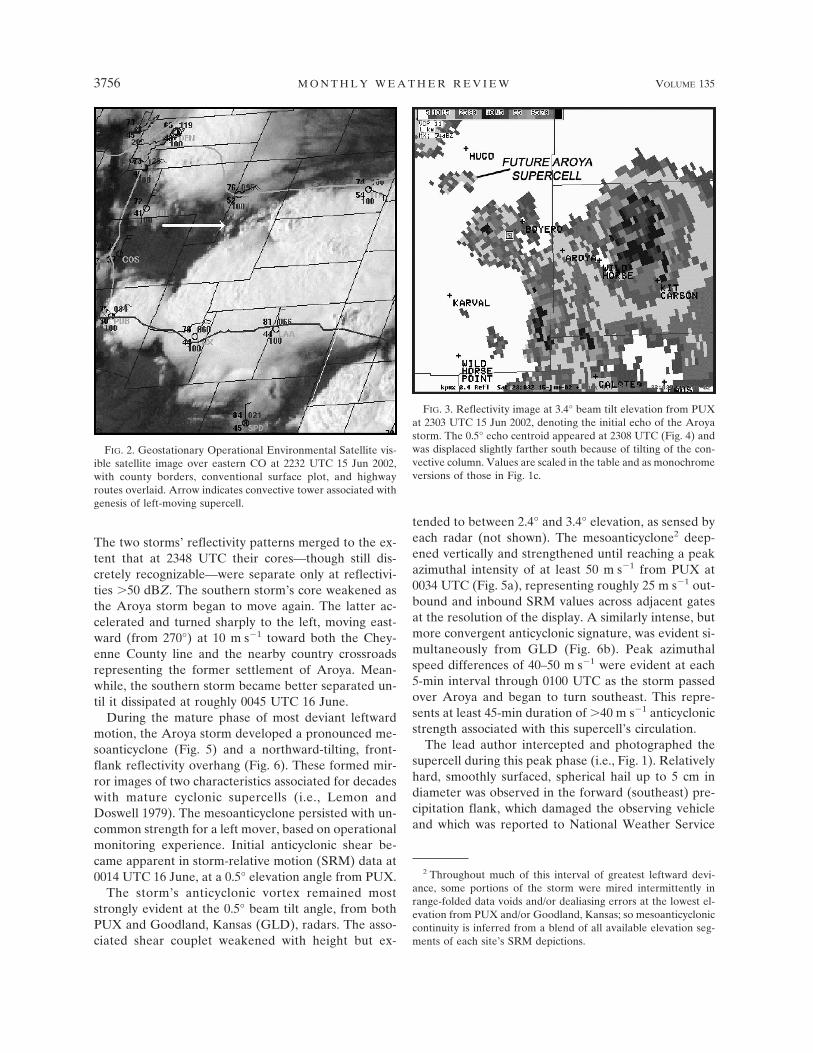
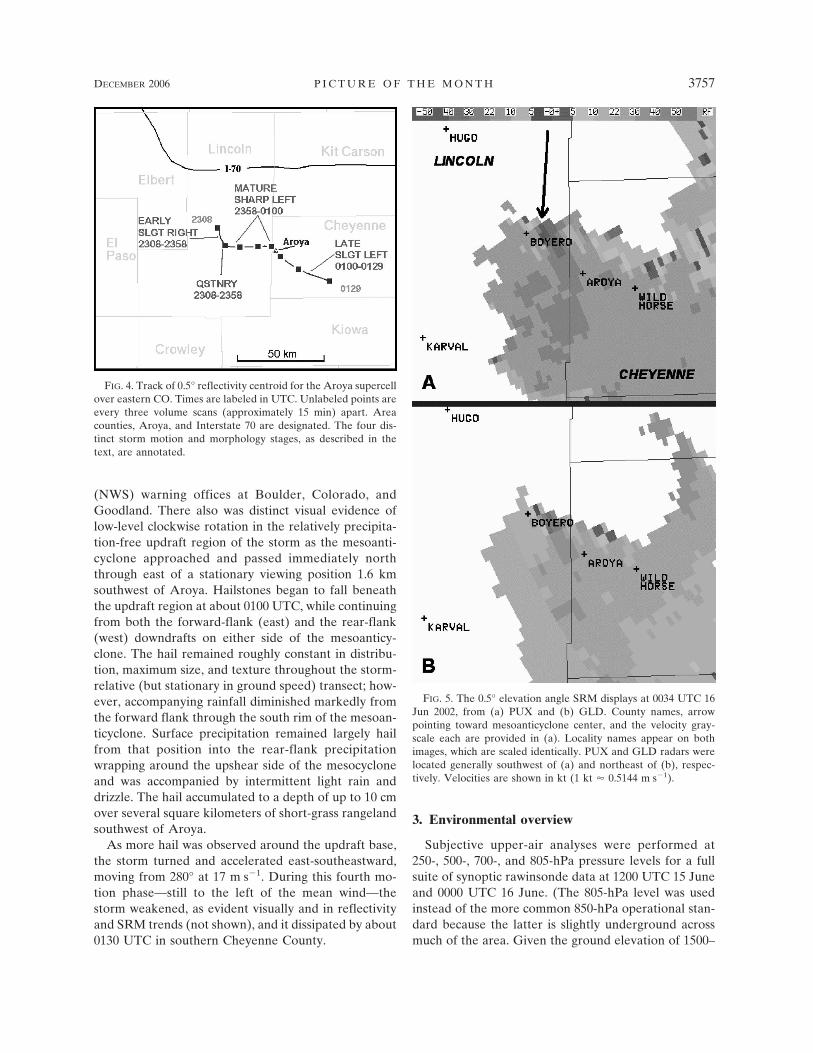
The Aroya storm developed discretely, not as a resultof any storm splitting processes. The first convectivetowers associated with this cell were evident on visiblesatellite imagery (Fig. 2) over west-central LincolnCounty, Colorado, at about 2230 UTC. Initial reflectiv-ity appeared aloft around 2303 UTC (Fig. 3) on the 3.4°tilt from the WSR-88D radar at Pueblo, Colorado(PUX). This storm then followed a winding, 80-km-long, roughly east-southeastward track. The path con-sisted of four sharply defined motion stages, for ap-proximately 2.5 h across Lincoln and Cheyenne Coun-ties before dissipating (Fig. 4).
The echo initially moved southeast (from 335°) at 9m s�1, slower than and slightly to the right of the south-eastward mean wind1 vector, which was from 310° at 12m s�1. The nascent supercell then became nearly sta-tionary for about 0.5 h, beginning at 2328 UTC. Duringthis phase it interacted with and nearly was absorbedinto a previously stronger thunderstorm to the south-east (west-southwest of Boyero, Colorado, in Fig. 3).
1 In this case, “mean wind” denotes a pressure-weighted aver-aging of the flow from the level of free convection to the equilib-rium level.
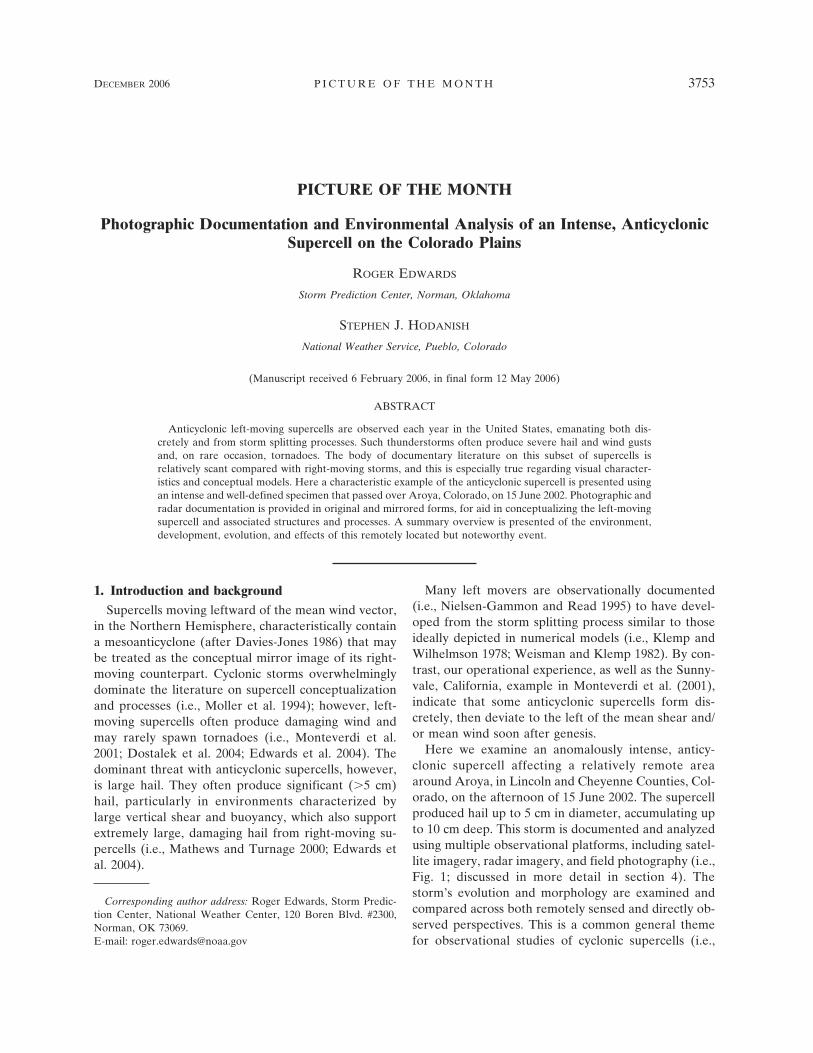
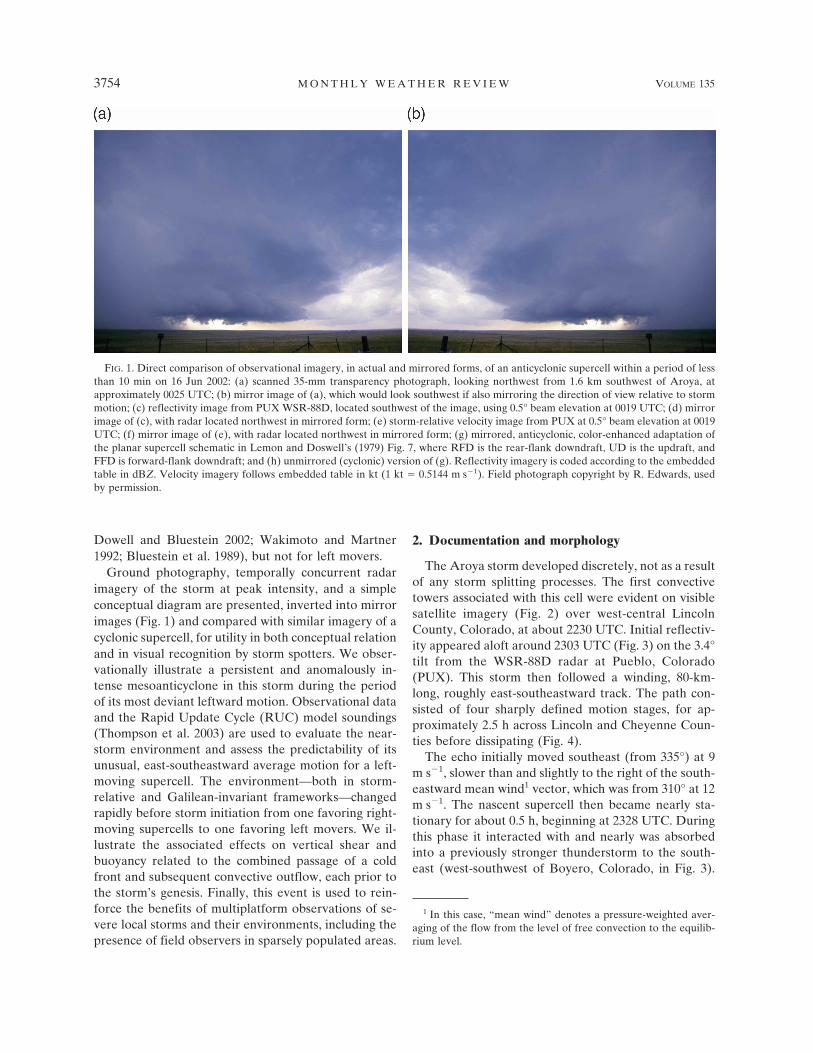
FIG. 1. Direct comparison of observational imagery, in actual and mirrored forms, of an anticyclonic supercell within a period of lessthan 10 min on 16 Jun 2002: (a) scanned 35-mm transparency photograph, looking northwest from 1.6 km southwest of Aroya, atapproximately 0025 UTC; (b) mirror image of (a), which would look southwest if also mirroring the direction of view relative to stormmotion; (c) reflectivity image from PUX WSR-88D, located southwest of the image, using 0.5° beam elevation at 0019 UTC; (d) mirrorimage of (c), with radar located northwest in mirrored form; (e) storm-relative velocity image from PUX at 0.5° beam elevation at 0019UTC; (f) mirror image of (e), with radar located northwest in mirrored form; (g) mirrored, anticyclonic, color-enhanced adaptation ofthe planar supercell schematic in Lemon and Doswell’s (1979) Fig. 7, where RFD is the rear-flank downdraft, UD is the updraft, andFFD is forward-flank downdraft; and (h) unmirrored (cyclonic) version of (g). Reflectivity imagery is coded according to the embeddedtable in dBZ. Velocity imagery follows embedded table in kt (1 kt � 0.5144 m s�1). Field photograph copyright by R. Edwards, usedby permission.
3754 M O N T H L Y W E A T H E R R E V I E W VOLUME 135
Fig 1a b live 4/C
FIG. 1. (Continued)
DECEMBER 2006 P I C T U R E O F T H E M O N T H 3755
Fig 1c–h live 4/C
The two storms’ reflectivity patterns merged to the ex-tent that at 2348 UTC their cores—though still dis-cretely recognizable—were separate only at reflectivi-ties �50 dBZ. The southern storm’s core weakened asthe Aroya storm began to move again. The latter ac-celerated and turned sharply to the left, moving east-ward (from 270°) at 10 m s�1 toward both the Chey-enne County line and the nearby country crossroadsrepresenting the former settlement of Aroya. Mean-while, the southern storm became better separated un-til it dissipated at roughly 0045 UTC 16 June.
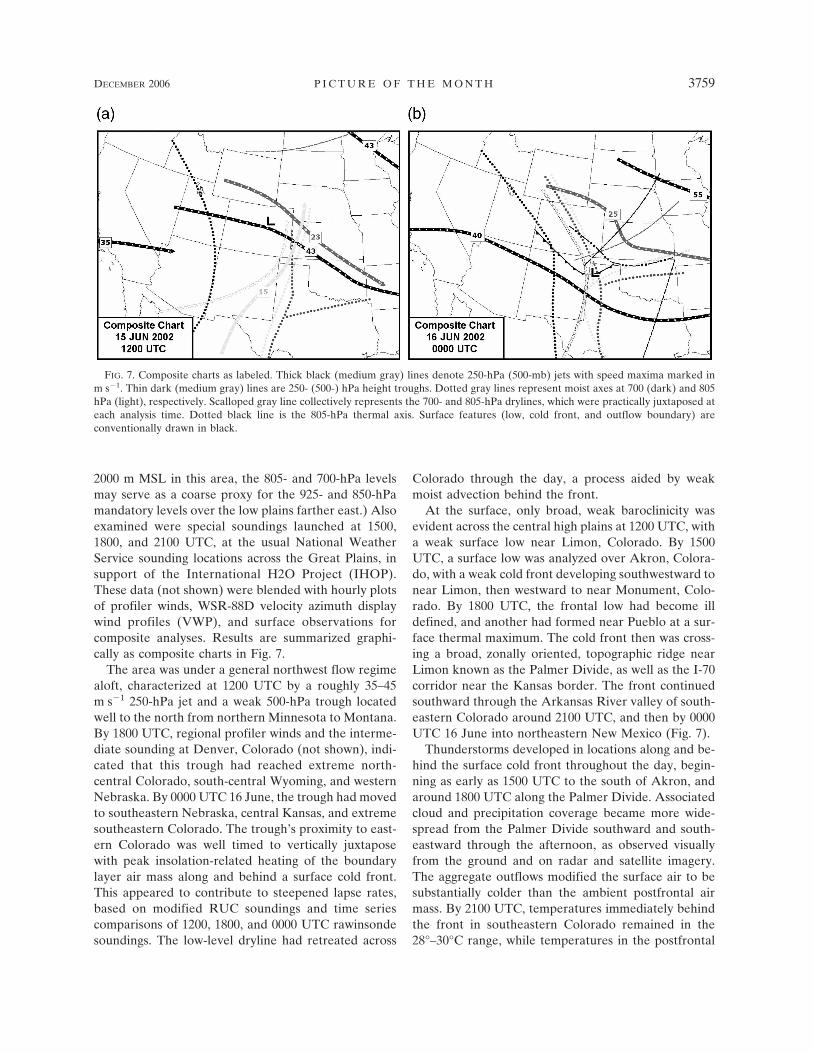
During the mature phase of most deviant leftwardmotion, the Aroya storm developed a pronounced me-soanticyclone (Fig. 5) and a northward-tilting, front-flank reflectivity overhang (Fig. 6). These formed mir-ror images of two characteristics associated for decadeswith mature cyclonic supercells (i.e., Lemon andDoswell 1979). The mesoanticyclone persisted with un-common strength for a left mover, based on operationalmonitoring experience. Initial anticyclonic shear be-came apparent in storm-relative motion (SRM) data at0014 UTC 16 June, at a 0.5° elevation angle from PUX.
The storm’s anticyclonic vortex remained moststrongly evident at the 0.5° beam tilt angle, from bothPUX and Goodland, Kansas (GLD), radars. The asso-ciated shear couplet weakened with height but ex-
tended to between 2.4° and 3.4° elevation, as sensed byeach radar (not shown). The mesoanticyclone2 deep-ened vertically and strengthened until reaching a peakazimuthal intensity of at least 50 m s�1 from PUX at0034 UTC (Fig. 5a), representing roughly 25 m s�1 out-bound and inbound SRM values across adjacent gatesat the resolution of the display. A similarly intense, butmore convergent anticyclonic signature, was evident si-multaneously from GLD (Fig. 6b). Peak azimuthalspeed differences of 40–50 m s�1 were evident at each5-min interval through 0100 UTC as the storm passedover Aroya and began to turn southeast. This repre-sents at least 45-min duration of �40 m s�1 anticyclonicstrength associated with this supercell’s circulation.
The lead author intercepted and photographed thesupercell during this peak phase (i.e., Fig. 1). Relativelyhard, smoothly surfaced, spherical hail up to 5 cm indiameter was observed in the forward (southeast) pre-cipitation flank, which damaged the observing vehicleand which was reported to National Weather Service
2 Throughout much of this interval of greatest leftward devi-ance, some portions of the storm were mired intermittently inrange-folded data voids and/or dealiasing errors at the lowest el-evation from PUX and/or Goodland, Kansas; so mesoanticycloniccontinuity is inferred from a blend of all available elevation seg-ments of each site’s SRM depictions.
FIG. 2. Geostationary Operational Environmental Satellite vis-ible satellite image over eastern CO at 2232 UTC 15 Jun 2002,with county borders, conventional surface plot, and highwayroutes overlaid. Arrow indicates convective tower associated withgenesis of left-moving supercell.
FIG. 3. Reflectivity image at 3.4° beam tilt elevation from PUXat 2303 UTC 15 Jun 2002, denoting the initial echo of the Aroyastorm. The 0.5° echo centroid appeared at 2308 UTC (Fig. 4) andwas displaced slightly farther south because of tilting of the con-vective column. Values are scaled in the table and as monochromeversions of those in Fig. 1c.
3756 M O N T H L Y W E A T H E R R E V I E W VOLUME 135
(NWS) warning offices at Boulder, Colorado, andGoodland. There also was distinct visual evidence oflow-level clockwise rotation in the relatively precipita-tion-free updraft region of the storm as the mesoanti-cyclone approached and passed immediately norththrough east of a stationary viewing position 1.6 kmsouthwest of Aroya. Hailstones began to fall beneaththe updraft region at about 0100 UTC, while continuingfrom both the forward-flank (east) and the rear-flank(west) downdrafts on either side of the mesoanticy-clone. The hail remained roughly constant in distribu-tion, maximum size, and texture throughout the storm-relative (but stationary in ground speed) transect; how-ever, accompanying rainfall diminished markedly fromthe forward flank through the south rim of the mesoan-ticyclone. Surface precipitation remained largely hailfrom that position into the rear-flank precipitationwrapping around the upshear side of the mesocycloneand was accompanied by intermittent light rain anddrizzle. The hail accumulated to a depth of up to 10 cmover several square kilometers of short-grass rangelandsouthwest of Aroya.
As more hail was observed around the updraft base,the storm turned and accelerated east-southeastward,moving from 280° at 17 m s�1. During this fourth mo-tion phase—still to the left of the mean wind—thestorm weakened, as evident visually and in reflectivityand SRM trends (not shown), and it dissipated by about0130 UTC in southern Cheyenne County.
3. Environmental overview
Subjective upper-air analyses were performed at250-, 500-, 700-, and 805-hPa pressure levels for a fullsuite of synoptic rawinsonde data at 1200 UTC 15 Juneand 0000 UTC 16 June. (The 805-hPa level was usedinstead of the more common 850-hPa operational stan-dard because the latter is slightly underground acrossmuch of the area. Given the ground elevation of 1500–
FIG. 4. Track of 0.5° reflectivity centroid for the Aroya supercellover eastern CO. Times are labeled in UTC. Unlabeled points areevery three volume scans (approximately 15 min) apart. Areacounties, Aroya, and Interstate 70 are designated. The four dis-tinct storm motion and morphology stages, as described in thetext, are annotated.
FIG. 5. The 0.5° elevation angle SRM displays at 0034 UTC 16Jun 2002, from (a) PUX and (b) GLD. County names, arrowpointing toward mesoanticyclone center, and the velocity gray-scale each are provided in (a). Locality names appear on bothimages, which are scaled identically. PUX and GLD radars werelocated generally southwest of (a) and northeast of (b), respec-tively. Velocities are shown in kt (1 kt � 0.5144 m s�1).
DECEMBER 2006 P I C T U R E O F T H E M O N T H 3757
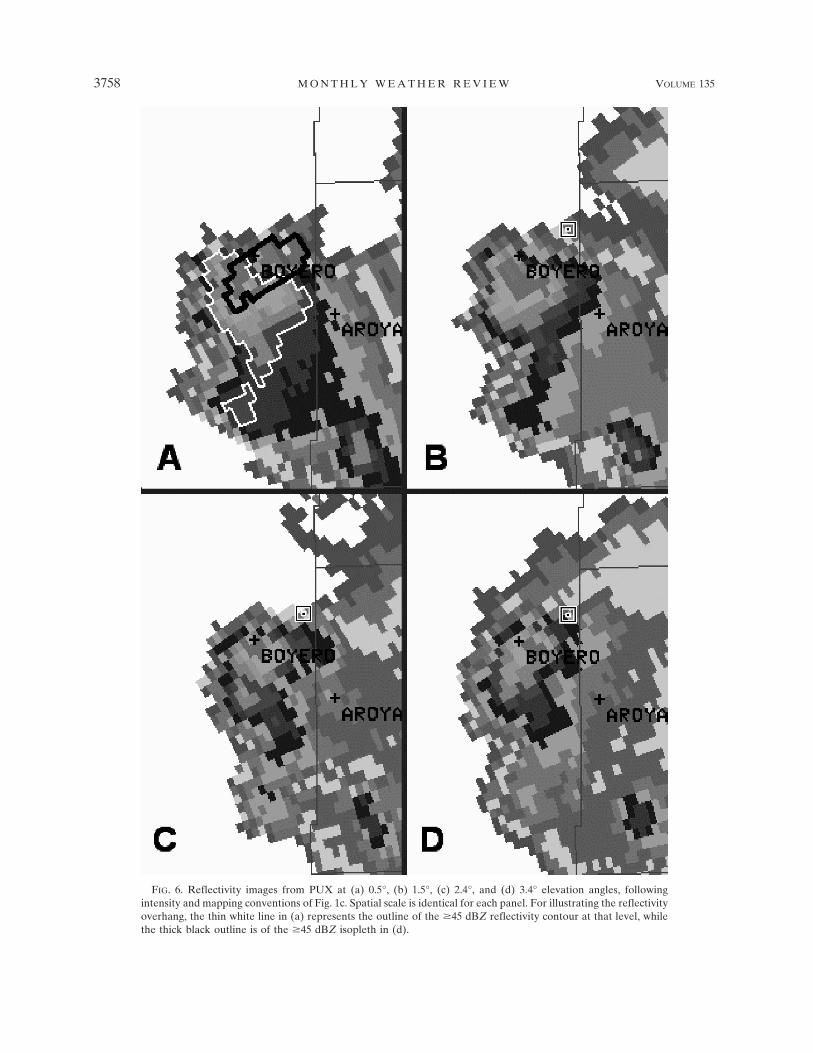
FIG. 6. Reflectivity images from PUX at (a) 0.5°, (b) 1.5°, (c) 2.4°, and (d) 3.4° elevation angles, followingintensity and mapping conventions of Fig. 1c. Spatial scale is identical for each panel. For illustrating the reflectivityoverhang, the thin white line in (a) represents the outline of the �45 dBZ reflectivity contour at that level, whilethe thick black outline is of the �45 dBZ isopleth in (d).
3758 M O N T H L Y W E A T H E R R E V I E W VOLUME 135
2000 m MSL in this area, the 805- and 700-hPa levelsmay serve as a coarse proxy for the 925- and 850-hPamandatory levels over the low plains farther east.) Alsoexamined were special soundings launched at 1500,1800, and 2100 UTC, at the usual National WeatherService sounding locations across the Great Plains, insupport of the International H2O Project (IHOP).These data (not shown) were blended with hourly plotsof profiler winds, WSR-88D velocity azimuth displaywind profiles (VWP), and surface observations forcomposite analyses. Results are summarized graphi-cally as composite charts in Fig. 7.
The area was under a general northwest flow regimealoft, characterized at 1200 UTC by a roughly 35–45m s�1 250-hPa jet and a weak 500-hPa trough locatedwell to the north from northern Minnesota to Montana.By 1800 UTC, regional profiler winds and the interme-diate sounding at Denver, Colorado (not shown), indi-cated that this trough had reached extreme north-central Colorado, south-central Wyoming, and westernNebraska. By 0000 UTC 16 June, the trough had movedto southeastern Nebraska, central Kansas, and extremesoutheastern Colorado. The trough’s proximity to east-ern Colorado was well timed to vertically juxtaposewith peak insolation-related heating of the boundarylayer air mass along and behind a surface cold front.This appeared to contribute to steepened lapse rates,based on modified RUC soundings and time seriescomparisons of 1200, 1800, and 0000 UTC rawinsondesoundings. The low-level dryline had retreated across
Colorado through the day, a process aided by weakmoist advection behind the front.
At the surface, only broad, weak baroclinicity wasevident across the central high plains at 1200 UTC, witha weak surface low near Limon, Colorado. By 1500UTC, a surface low was analyzed over Akron, Colora-do, with a weak cold front developing southwestward tonear Limon, then westward to near Monument, Colo-rado. By 1800 UTC, the frontal low had become illdefined, and another had formed near Pueblo at a sur-face thermal maximum. The cold front then was cross-ing a broad, zonally oriented, topographic ridge nearLimon known as the Palmer Divide, as well as the I-70corridor near the Kansas border. The front continuedsouthward through the Arkansas River valley of south-eastern Colorado around 2100 UTC, and then by 0000UTC 16 June into northeastern New Mexico (Fig. 7).
Thunderstorms developed in locations along and be-hind the surface cold front throughout the day, begin-ning as early as 1500 UTC to the south of Akron, andaround 1800 UTC along the Palmer Divide. Associatedcloud and precipitation coverage became more wide-spread from the Palmer Divide southward and south-eastward through the afternoon, as observed visuallyfrom the ground and on radar and satellite imagery.The aggregate outflows modified the surface air to besubstantially colder than the ambient postfrontal airmass. By 2100 UTC, temperatures immediately behindthe front in southeastern Colorado remained in the28°–30°C range, while temperatures in the postfrontal
FIG. 7. Composite charts as labeled. Thick black (medium gray) lines denote 250-hPa (500-mb) jets with speed maxima marked inm s�1. Thin dark (medium gray) lines are 250- (500-) hPa height troughs. Dotted gray lines represent moist axes at 700 (dark) and 805hPa (light), respectively. Scalloped gray line collectively represents the 700- and 805-hPa drylines, which were practically juxtaposed ateach analysis time. Dotted black line is the 805-hPa thermal axis. Surface features (low, cold front, and outflow boundary) areconventionally drawn in black.
DECEMBER 2006 P I C T U R E O F T H E M O N T H 3759
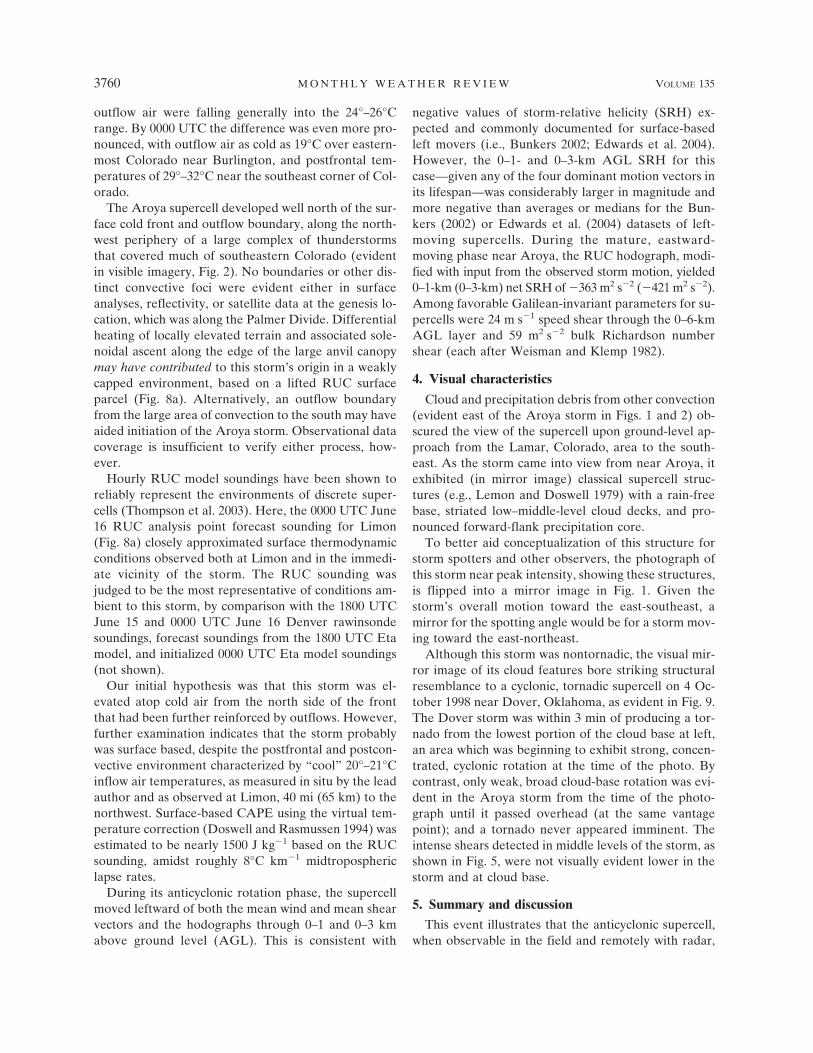
outflow air were falling generally into the 24°–26°Crange. By 0000 UTC the difference was even more pro-nounced, with outflow air as cold as 19°C over eastern-most Colorado near Burlington, and postfrontal tem-peratures of 29°–32°C near the southeast corner of Col-orado.
The Aroya supercell developed well north of the sur-face cold front and outflow boundary, along the north-west periphery of a large complex of thunderstormsthat covered much of southeastern Colorado (evidentin visible imagery, Fig. 2). No boundaries or other dis-tinct convective foci were evident either in surfaceanalyses, reflectivity, or satellite data at the genesis lo-cation, which was along the Palmer Divide. Differentialheating of locally elevated terrain and associated sole-noidal ascent along the edge of the large anvil canopymay have contributed to this storm’s origin in a weaklycapped environment, based on a lifted RUC surfaceparcel (Fig. 8a). Alternatively, an outflow boundaryfrom the large area of convection to the south may haveaided initiation of the Aroya storm. Observational datacoverage is insufficient to verify either process, how-ever.
Hourly RUC model soundings have been shown toreliably represent the environments of discrete super-cells (Thompson et al. 2003). Here, the 0000 UTC June16 RUC analysis point forecast sounding for Limon(Fig. 8a) closely approximated surface thermodynamicconditions observed both at Limon and in the immedi-ate vicinity of the storm. The RUC sounding wasjudged to be the most representative of conditions am-bient to this storm, by comparison with the 1800 UTCJune 15 and 0000 UTC June 16 Denver rawinsondesoundings, forecast soundings from the 1800 UTC Etamodel, and initialized 0000 UTC Eta model soundings(not shown).
Our initial hypothesis was that this storm was el-evated atop cold air from the north side of the frontthat had been further reinforced by outflows. However,further examination indicates that the storm probablywas surface based, despite the postfrontal and postcon-vective environment characterized by “cool” 20°–21°Cinflow air temperatures, as measured in situ by the leadauthor and as observed at Limon, 40 mi (65 km) to thenorthwest. Surface-based CAPE using the virtual tem-perature correction (Doswell and Rasmussen 1994) wasestimated to be nearly 1500 J kg�1 based on the RUCsounding, amidst roughly 8°C km�1 midtroposphericlapse rates.
During its anticyclonic rotation phase, the supercellmoved leftward of both the mean wind and mean shearvectors and the hodographs through 0–1 and 0–3 kmabove ground level (AGL). This is consistent with
negative values of storm-relative helicity (SRH) ex-pected and commonly documented for surface-basedleft movers (i.e., Bunkers 2002; Edwards et al. 2004).However, the 0–1- and 0–3-km AGL SRH for thiscase—given any of the four dominant motion vectors inits lifespan—was considerably larger in magnitude andmore negative than averages or medians for the Bun-kers (2002) or Edwards et al. (2004) datasets of left-moving supercells. During the mature, eastward-moving phase near Aroya, the RUC hodograph, modi-fied with input from the observed storm motion, yielded0–1-km (0–3-km) net SRH of �363 m2 s�2 (�421 m2 s�2).Among favorable Galilean-invariant parameters for su-percells were 24 m s�1 speed shear through the 0–6-kmAGL layer and 59 m2 s�2 bulk Richardson numbershear (each after Weisman and Klemp 1982).
4. Visual characteristics
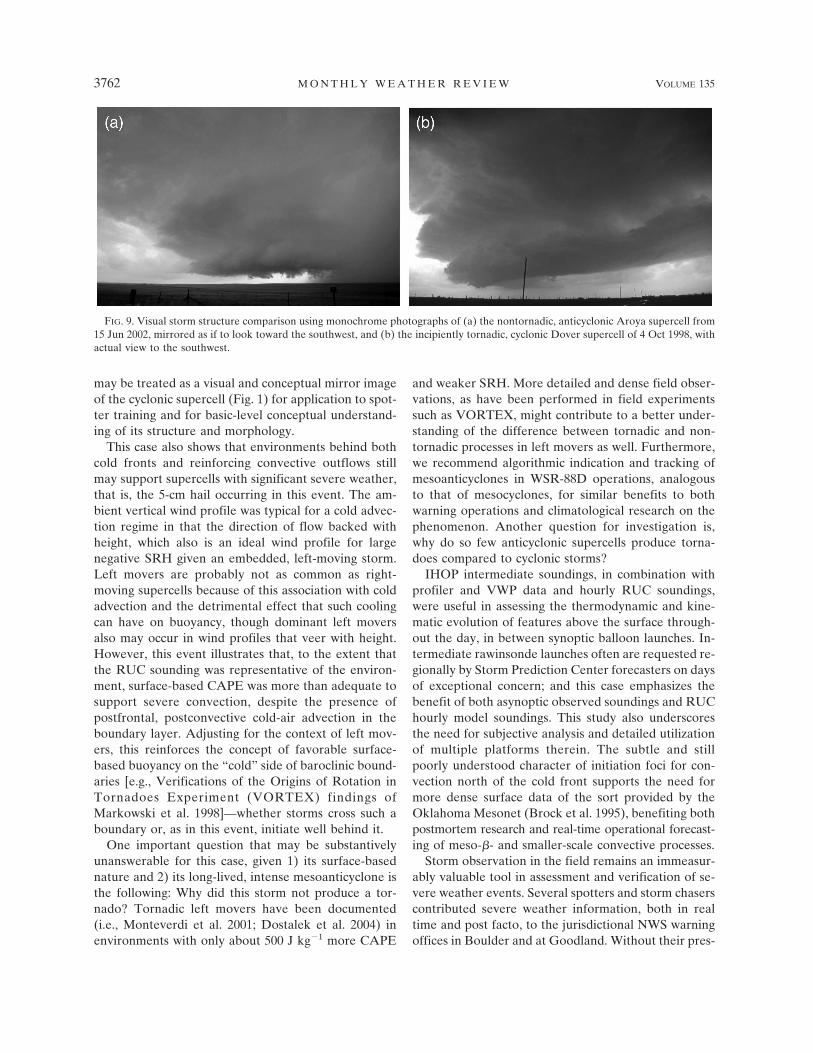
Cloud and precipitation debris from other convection(evident east of the Aroya storm in Figs. 1 and 2) ob-scured the view of the supercell upon ground-level ap-proach from the Lamar, Colorado, area to the south-east. As the storm came into view from near Aroya, itexhibited (in mirror image) classical supercell struc-tures (e.g., Lemon and Doswell 1979) with a rain-freebase, striated low–middle-level cloud decks, and pro-nounced forward-flank precipitation core.
To better aid conceptualization of this structure forstorm spotters and other observers, the photograph ofthis storm near peak intensity, showing these structures,is flipped into a mirror image in Fig. 1. Given thestorm’s overall motion toward the east-southeast, amirror for the spotting angle would be for a storm mov-ing toward the east-northeast.
Although this storm was nontornadic, the visual mir-ror image of its cloud features bore striking structuralresemblance to a cyclonic, tornadic supercell on 4 Oc-tober 1998 near Dover, Oklahoma, as evident in Fig. 9.The Dover storm was within 3 min of producing a tor-nado from the lowest portion of the cloud base at left,an area which was beginning to exhibit strong, concen-trated, cyclonic rotation at the time of the photo. Bycontrast, only weak, broad cloud-base rotation was evi-dent in the Aroya storm from the time of the photo-graph until it passed overhead (at the same vantagepoint); and a tornado never appeared imminent. Theintense shears detected in middle levels of the storm, asshown in Fig. 5, were not visually evident lower in thestorm and at cloud base.
5. Summary and discussion
This event illustrates that the anticyclonic supercell,when observable in the field and remotely with radar,
3760 M O N T H L Y W E A T H E R R E V I E W VOLUME 135
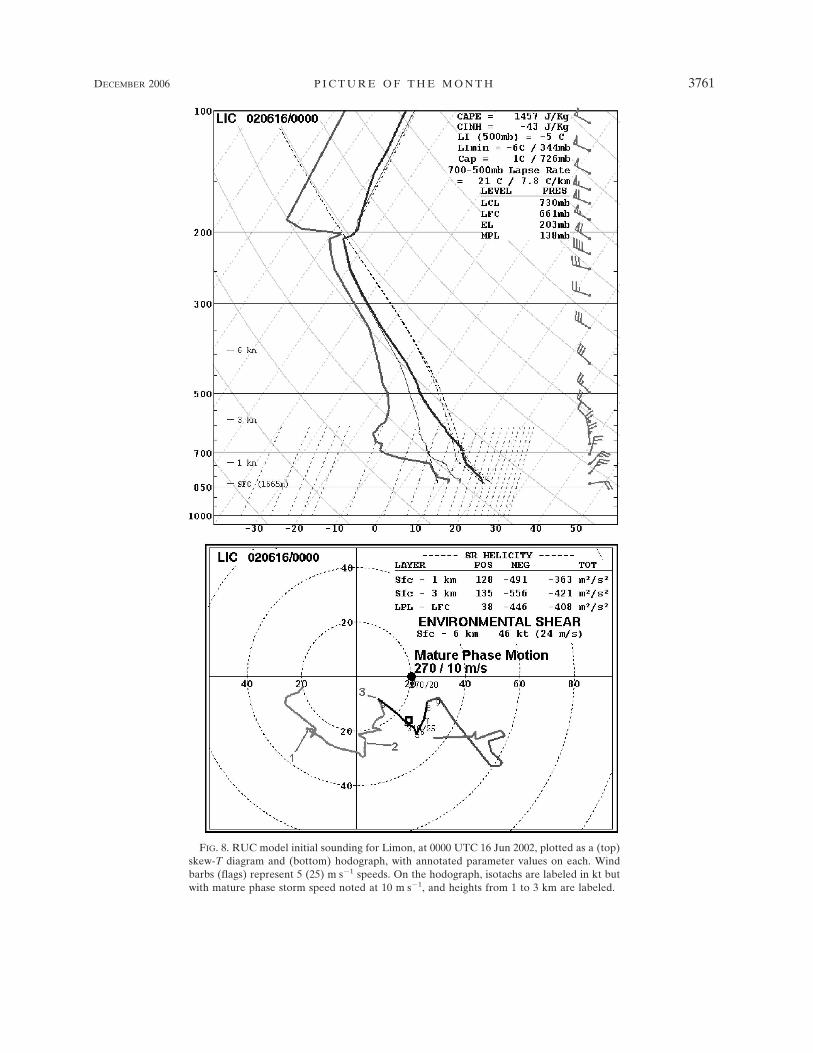
FIG. 8. RUC model initial sounding for Limon, at 0000 UTC 16 Jun 2002, plotted as a (top)skew-T diagram and (bottom) hodograph, with annotated parameter values on each. Windbarbs (flags) represent 5 (25) m s�1 speeds. On the hodograph, isotachs are labeled in kt butwith mature phase storm speed noted at 10 m s�1, and heights from 1 to 3 km are labeled.
DECEMBER 2006 P I C T U R E O F T H E M O N T H 3761
may be treated as a visual and conceptual mirror imageof the cyclonic supercell (Fig. 1) for application to spot-ter training and for basic-level conceptual understand-ing of its structure and morphology.
This case also shows that environments behind bothcold fronts and reinforcing convective outflows stillmay support supercells with significant severe weather,that is, the 5-cm hail occurring in this event. The am-bient vertical wind profile was typical for a cold advec-tion regime in that the direction of flow backed withheight, which also is an ideal wind profile for largenegative SRH given an embedded, left-moving storm.Left movers are probably not as common as right-moving supercells because of this association with coldadvection and the detrimental effect that such coolingcan have on buoyancy, though dominant left moversalso may occur in wind profiles that veer with height.However, this event illustrates that, to the extent thatthe RUC sounding was representative of the environ-ment, surface-based CAPE was more than adequate tosupport severe convection, despite the presence ofpostfrontal, postconvective cold-air advection in theboundary layer. Adjusting for the context of left mov-ers, this reinforces the concept of favorable surface-based buoyancy on the “cold” side of baroclinic bound-aries [e.g., Verifications of the Origins of Rotation inTornadoes Experiment (VORTEX) findings ofMarkowski et al. 1998]—whether storms cross such aboundary or, as in this event, initiate well behind it.
One important question that may be substantivelyunanswerable for this case, given 1) its surface-basednature and 2) its long-lived, intense mesoanticyclone isthe following: Why did this storm not produce a tor-nado? Tornadic left movers have been documented(i.e., Monteverdi et al. 2001; Dostalek et al. 2004) inenvironments with only about 500 J kg�1 more CAPE
and weaker SRH. More detailed and dense field obser-vations, as have been performed in field experimentssuch as VORTEX, might contribute to a better under-standing of the difference between tornadic and non-tornadic processes in left movers as well. Furthermore,we recommend algorithmic indication and tracking ofmesoanticyclones in WSR-88D operations, analogousto that of mesocyclones, for similar benefits to bothwarning operations and climatological research on thephenomenon. Another question for investigation is,why do so few anticyclonic supercells produce torna-does compared to cyclonic storms?
IHOP intermediate soundings, in combination withprofiler and VWP data and hourly RUC soundings,were useful in assessing the thermodynamic and kine-matic evolution of features above the surface through-out the day, in between synoptic balloon launches. In-termediate rawinsonde launches often are requested re-gionally by Storm Prediction Center forecasters on daysof exceptional concern; and this case emphasizes thebenefit of both asynoptic observed soundings and RUChourly model soundings. This study also underscoresthe need for subjective analysis and detailed utilizationof multiple platforms therein. The subtle and stillpoorly understood character of initiation foci for con-vection north of the cold front supports the need formore dense surface data of the sort provided by theOklahoma Mesonet (Brock et al. 1995), benefiting bothpostmortem research and real-time operational forecast-ing of meso-�- and smaller-scale convective processes.
Storm observation in the field remains an immeasur-ably valuable tool in assessment and verification of se-vere weather events. Several spotters and storm chaserscontributed severe weather information, both in realtime and post facto, to the jurisdictional NWS warningoffices in Boulder and at Goodland. Without their pres-
FIG. 9. Visual storm structure comparison using monochrome photographs of (a) the nontornadic, anticyclonic Aroya supercell from15 Jun 2002, mirrored as if to look toward the southwest, and (b) the incipiently tornadic, cyclonic Dover supercell of 4 Oct 1998, withactual view to the southwest.
3762 M O N T H L Y W E A T H E R R E V I E W VOLUME 135
ence in this event and in others in the sparsely popu-lated Great Plains, neither precise and accurate watchand warning verification nor field documentation suchas that herein would be as common. The phenomenonof low population density has handicapped efforts toimprove radar-based warning algorithms and opera-tions, with various statistical or geographical adjust-ment methods devised to compensate (i.e., Witt et al.1998; Lenning et al. 1998). Low population affects se-vere weather climatology as well. Observed severeweather report collections for other sparsely populatedparts of the Great Plains have sometimes been statisti-cally modulated by up to tenfold multiples, as in thenontornadic severe weather climatology of Paruk andBlackwell (1994). By at least transiently populating thelandscape around severe storms, some of these impactsmay be ameliorated.
Furthermore, documentation resulting from field ob-servations—including still photography and video—isused commonly for subsequent spotter training. A re-sponsible and well-trained fleet of spotters and mobilestorm chasers has been demonstrated, in many in-stances (i.e., Pietrycha and Fox 2004; Moller et al. 1994,Winston 1988), to benefit both real-time warning op-erations and subsequent research and verification ef-forts, and should be encouraged and supported wher-ever possible.
Acknowledgments. The authors thank Paul Wolyn ofNWS Pueblo, along with NWS Central Region and theSPC Scientific Support Branch, for generously supply-ing data and platforms for analysis both at Pueblo andNorman. Thanks to Elke Edwards for her skilled inter-cept navigation and to Al Pietrycha for his excellentnowcasting, both of which made close observation anddocumentation of this storm possible from afield. SteveWeiss (SPC) provided very helpful encouragement,guidance, and internal review. We deeply appreciatethe formal reviewers for their beneficial comments andsuggestions for revision.
REFERENCES
Bluestein, H. B., E. W. McCaul Jr., G. P. Byrd, G. R. Woodall, G.Martin, S. Keighton, and L. C. Showell, 1989: Mobile sound-ing observations of a thunderstorm near the dryline: TheGruver, Texas storm complex of 25 May 1987. Mon. Wea.Rev., 117, 244–250.
Brock, F. V., K. C. Crawford, R. L. Elliott, G. W. Cuperus, S. J.Stadler, H. L. Johnson, and M. D. Eilts, 1995: The OklahomaMesonet: A technical overview. J. Atmos. Oceanic Technol.,12, 5–19.
Bunkers, M. J., 2002: Vertical wind shear associated with left-moving supercells. Wea. Forecasting, 17, 845–855.
Davies-Jones, R. P., 1986: Tornado dynamics. Thunderstorm Mor-phology and Dynamics, 2d ed., E. Kessler, Ed., University ofOklahoma Press, 197–236.
Dostalek, J. F., J. F. Weaver, and G. L. Phillips, 2004: Aspects ofa tornadic left-moving thunderstorm on 25 May 1999. Wea.Forecasting, 19, 614–626.
Doswell, C. A., III, and E. N. Rasmussen, 1994: The effect ofneglecting the virtual temperature correction on CAPE cal-culations. Wea. Forecasting, 9, 625–629.
Dowell, D. C., and H. B. Bluestein, 2002: The 8 June 1995McLean, Texas, storm. Part II: Cyclic tornado formation,maintenance, and dissipation. Mon. Wea. Rev., 130, 2649–2670.
Edwards, R., R. L. Thompson, and C. M. Mead, 2004: Assessmentof anticyclonic supercell environments using close proximitysoundings from the RUC model. Preprints, 22d Conf. on Se-vere Local Storms, Hyannis, MA, Amer. Meteor. Soc., CD-ROM, P1.2.
Klemp, J. B., and R. B. Wilhelmson, 1978: Simulations of right-and left-moving storms produced through storm splitting. J.Atmos. Sci., 35, 1097–1110.
Lemon, L. R., and C. A. Doswell III, 1979: Severe thunderstormevolution and mesocyclone structure as related to tornado-genesis. Mon. Wea. Rev., 107, 1184–1197.
Lenning, E., H. E. Fuelberg, and A. I. Watson, 1998: An evalua-tion of WSR-88D severe hail algorithms along the northeast-ern Gulf Coast. Wea. Forecasting, 13, 1029–1044.
Markowski, P. M., E. N. Rasmussen, and J. M. Straka, 1998: Theoccurrence of tornadoes in supercells interacting with bound-aries during VORTEX-95. Wea. Forecasting, 13, 852–859.
Mathews, G. N., and T. J. Turnage, 2000: An example of a left-split supercell producing 5-inch hail: The Big Spring, Texas,storm of 10 May 1996. Preprints, 20th Conf. on Severe LocalStorms, Orlando, FL, Amer. Meteor. Soc., 526–529.
Moller, A. R., C. A. Doswell III, M. P. Foster, and G. R. Woodall,1994: The operational recognition of supercell thunderstormenvironments and storm structure. Wea. Forecasting, 9, 327–347.
Monteverdi, J. P., W. Blier, G. J. Stumpf, W. Pi, and K. Anderson,2001: First WSR-88D documentation of an anticyclonic su-percell with anticyclonic tornadoes: The Sunnyvale–Los Al-tos, California, tornadoes of 4 May 1998. Mon. Wea. Rev.,129, 2805–2814.
Nielsen-Gammon, J. W., and W. L. Read, 1995: Detection andinterpretation of left-moving severe thunderstorms using theWSR-88D: A case study. Wea. Forecasting, 10, 127–140.
Paruk, B. J., and S. R. Blackwell, 1994: A severe thunderstormclimatology for Alberta. Natl. Wea. Dig., 19, 27–33.
Pietrycha, A. E., and M. Fox, 2004: Effective use of various com-munication methods during a severe convective outbreak.Natl. Wea. Dig., 28, 59–64.
Thompson, R. L., R. Edwards, J. A. Hart, K. L. Elmore, and P. M.Markowski, 2003: Close proximity soundings within supercellenvironments obtained from the Rapid Update Cycle. Wea.Forecasting, 18, 1243–1261.
Wakimoto, R. M., and B. E. Martner, 1992: Observations of aColorado tornado. Part II: Combined photogrammetric andDoppler radar analysis. Mon. Wea. Rev., 120, 522–543.
Weisman, M. L., and J. B. Klemp, 1982: The dependence of nu-merically simulated convective storms on vertical wind shearand buoyancy. Mon. Wea. Rev., 110, 504–520.
Winston, H. A., 1988: A comparison of three radar-based severestorm detection algorithms on Colorado High Plains thun-derstorms. Wea. Forecasting, 3, 131–140.
Witt, A., M. D. Eilts, G. J. Stumpf, E. D. Mitchell, J. T. Johnson,and K. W. Thomas, 1998: Evaluating the performance ofWSR-88D severe storm detection algorithms. Wea. Forecast-ing, 13, 513–518.
DECEMBER 2006 P I C T U R E O F T H E M O N T H 3763