Embed Size (px)
Citation preview

AP Physics I – Uniform Linear Motion Mastery Packet
Name: ____________________________________________ Class IDN: _______ Score: _______ / 20
Scenario: A motion map which records the position of a jogger and a walker on the football field is collected at regular 1.00 second intervals.
a) Which motion map represents the jogger: Top Bottom
Justify your answer.
b) Determine the velocity of the jogger and the walker. Show all work, including the mathematical representation and algebra.
Velocity of Walker: ____________ _________
Velocity of Jogger: ____________ _________
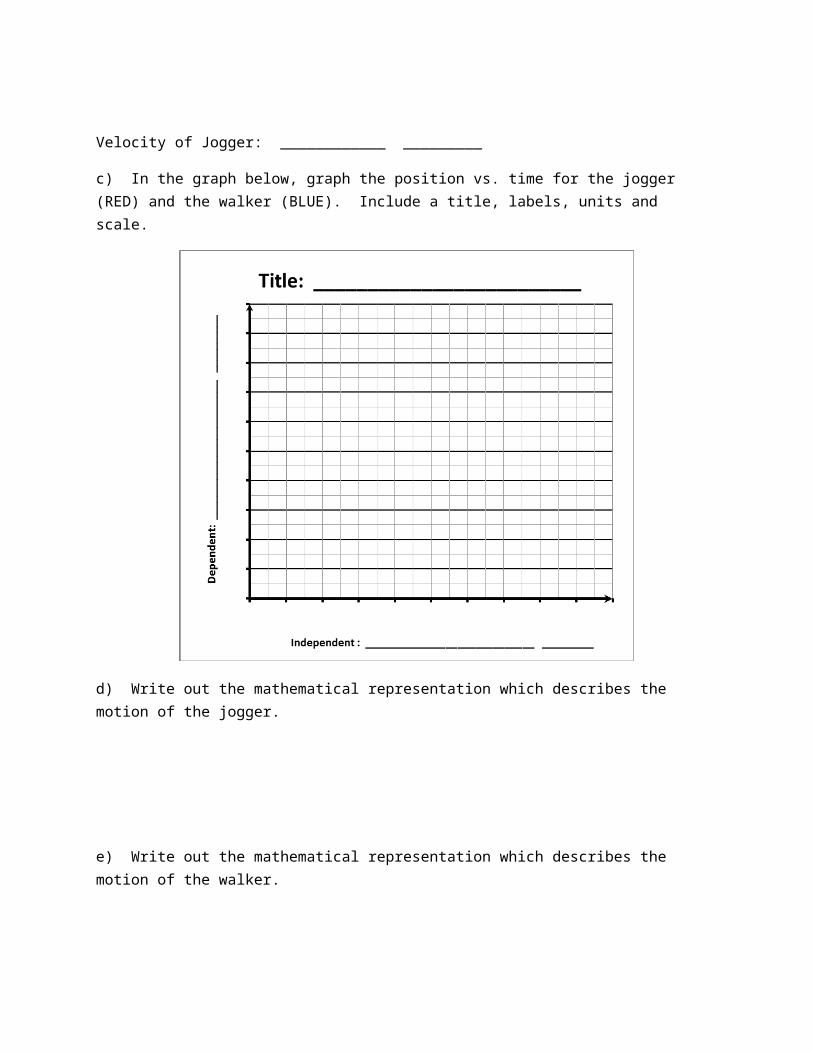
c) In the graph below, graph the position vs. time for the jogger (RED) and the walker (BLUE). Include a title, labels, units and scale.
d) Write out the mathematical representation which describes the motion of the jogger.
e) Write out the mathematical representation which describes the motion of the walker.
f) Estimate the position and clock reading the jogger and walker will intersect.
Position: ____________ _________ Clock Reading: ____________ _________

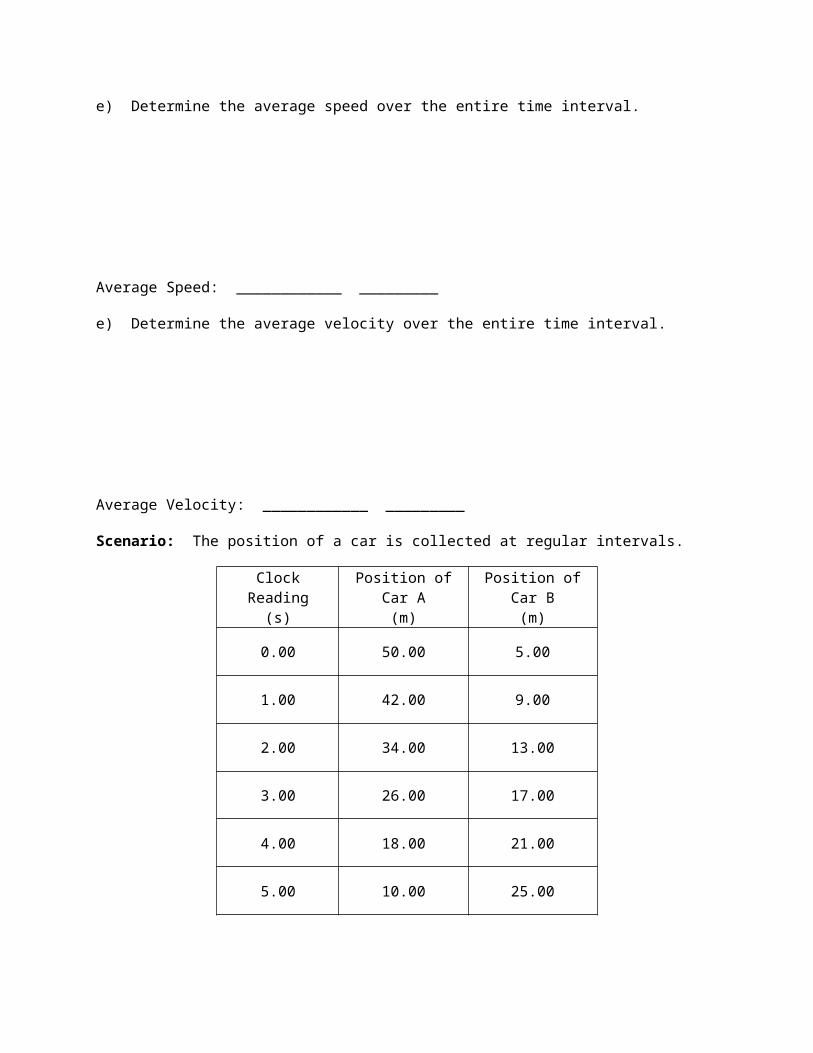
Scenario: The position of a car is collected at regular intervals.
Actual Time(s)
Position of Car(m)
0.00 50.00
1.00 42.00
2.00 34.00
3.00 26.00
4.00 18.00
5.00 10.00
6.00 2.00
Position at a Given Clock Reading
Pictorial Representation: In the space below, mark each car’s position at each clock reading. Include a line with an arrow indicating the direction of motion which connects each mark.
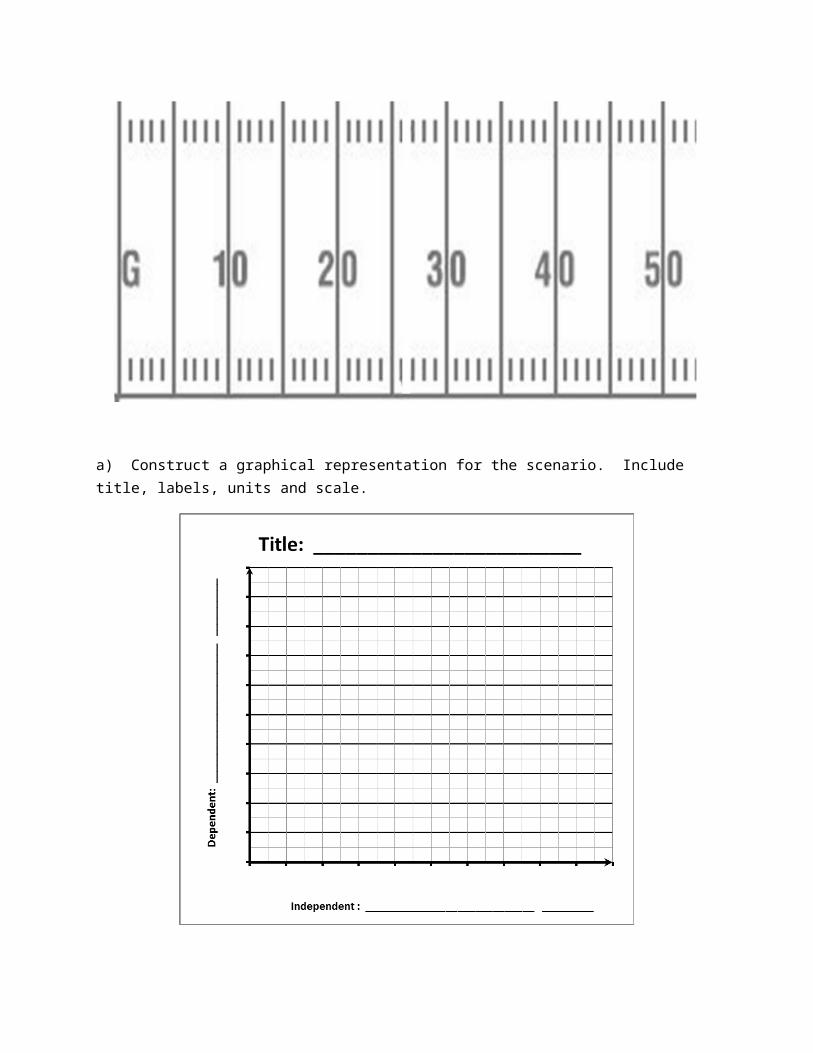
a) Construct a graphical representation for the scenario. Include title, labels, units and scale.
e) Determine the average speed over the entire time interval.
Average Speed: ____________ _________
e) Determine the average velocity over the entire time interval.
Average Velocity: ____________ _________
Scenario: The position of a car is collected at regular intervals.
Clock Reading(s)
Position of Car A(m)
Position of Car B(m)
0.00 50.00 5.00
1.00 42.00 9.00
2.00 34.00 13.00
3.00 26.00 17.00
4.00 18.00 21.00
5.00 10.00 25.00
6.00 2.00 29.00
Position at a Given Clock Reading
Pictorial Representation: In the space below, mark each car’s position at each clock reading. Include a line with an arrow indicating the direction of motion which connects each mark. Car A should be indicated with RED and Car B should be indicated with BLUE.
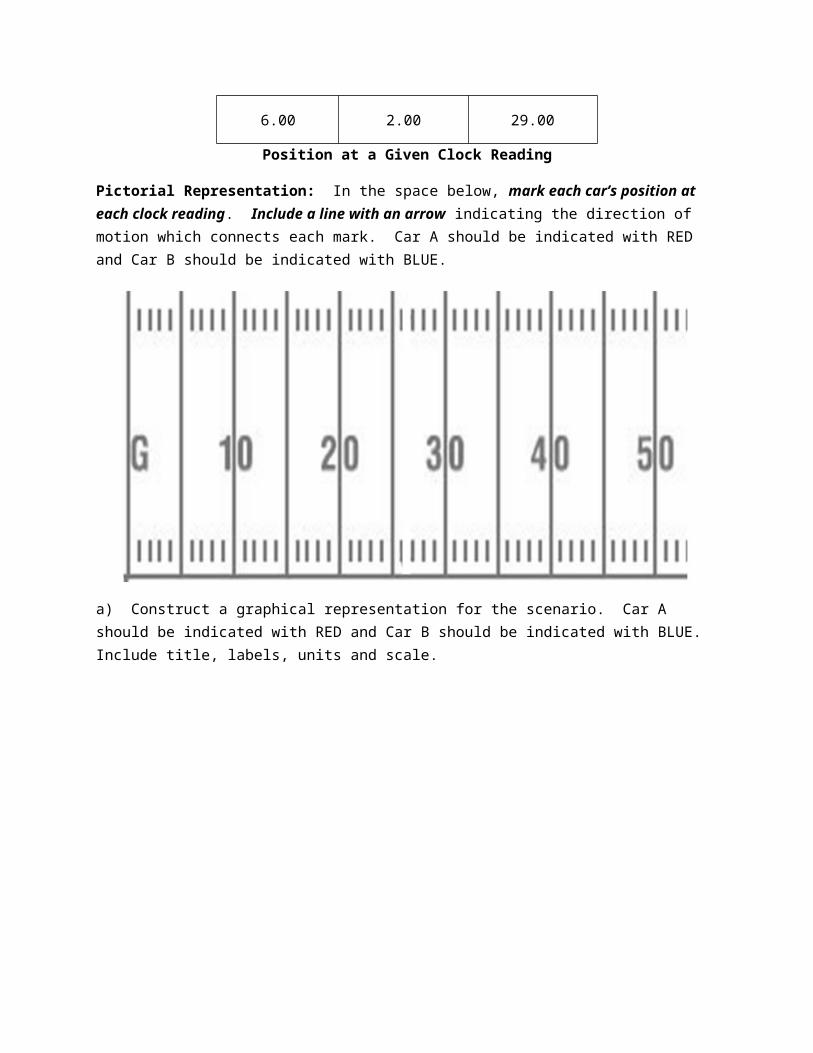
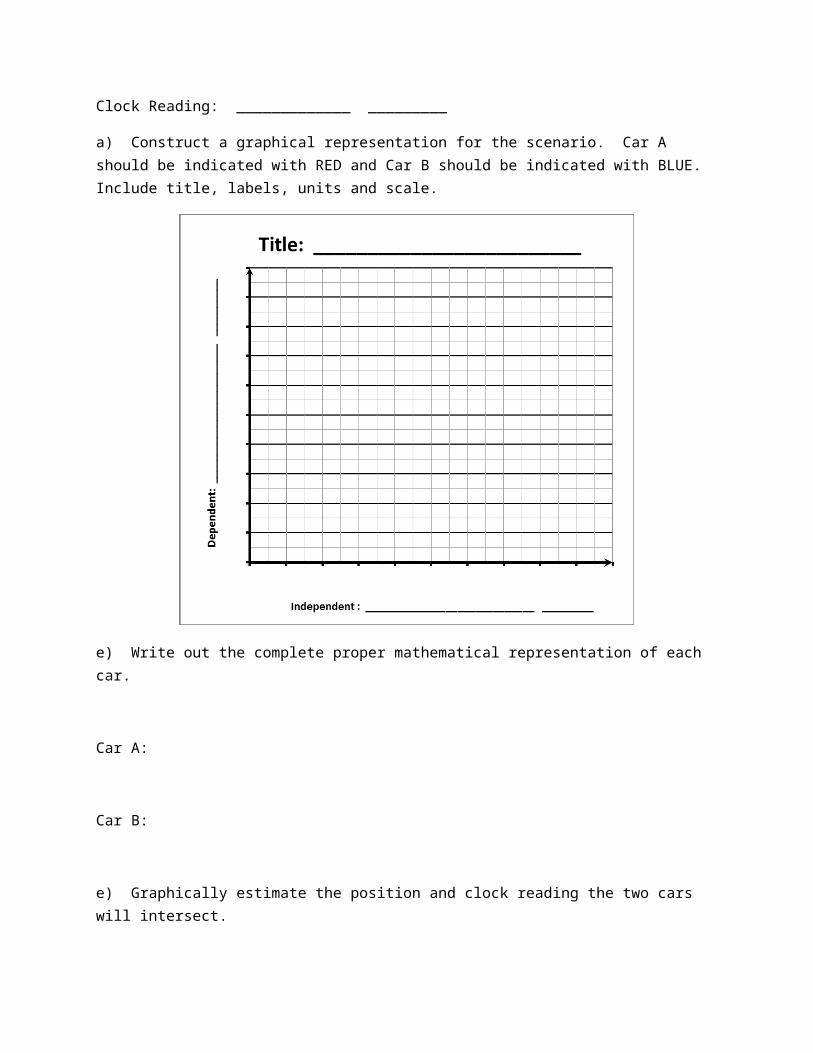
a) Construct a graphical representation for the scenario. Car A should be indicated with RED and Car B should be indicated with BLUE. Include title, labels, units and scale.
e) Write out the complete proper mathematical representation of each car.
Car A:
Car B:
e) Graphically estimate the position and clock reading the two cars will intersect.
Position: ____________ _________
Clock Reading: _____________ _________

f) Graphically estimate the position of Car A at a clock reading of 3.50 seconds.
Position of Car A: ____________ _________
g) Mathematically determine the position of Car A at a clock reading of 3.50 seconds.
Position of Car A: ____________ _________
Graphically estimate the clock reading when Car B will be at a position of 40.00 m.
Clock Reading: ____________ _________
i) Mathematically determine the clock reading when Car B will be at a position of 40.00 m.
Clock Reading: ____________ _________
Mathematically determine the position and clock reading the two cars will intersect. (Physics III Only)
Position: ____________ _________ Clock Reading: _____________ _________

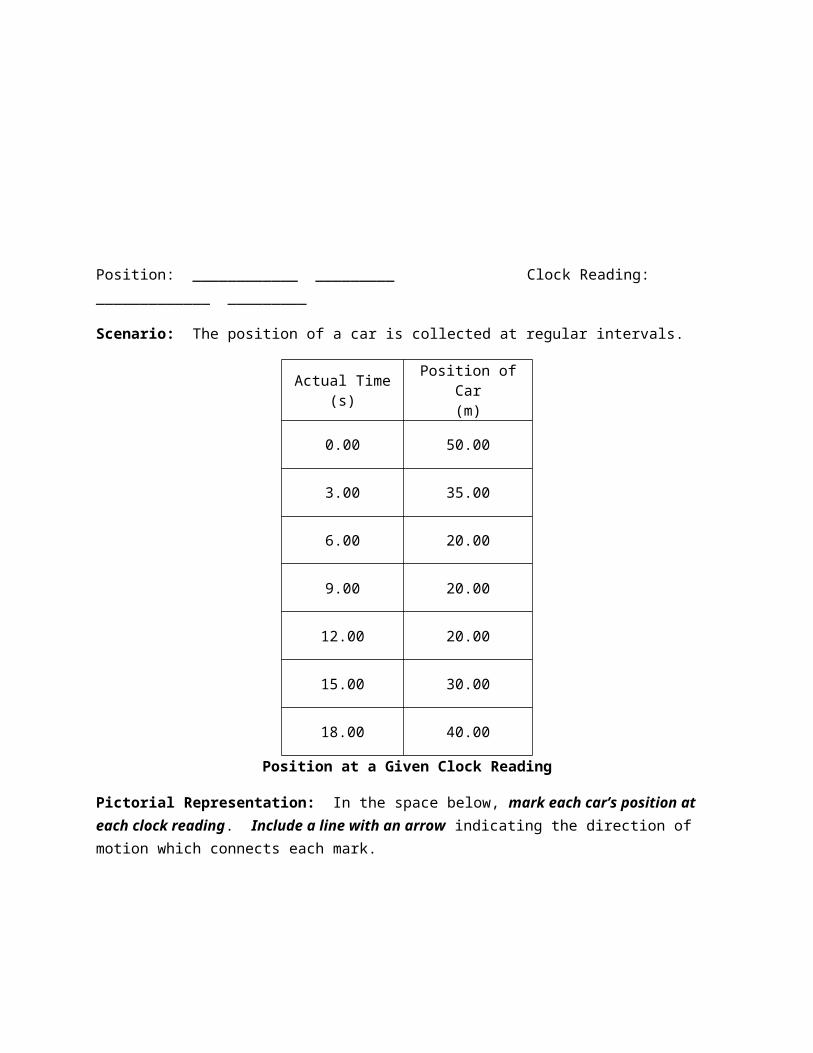
Scenario: The position of a car is collected at regular intervals.
Actual Time(s)
Position of Car(m)
0.00 50.00
3.00 35.00
6.00 20.00
9.00 20.00
12.00 20.00
15.00 30.00
18.00 40.00
Position at a Given Clock Reading
Pictorial Representation: In the space below, mark each car’s position at each clock reading. Include a line with an arrow indicating the direction of motion which connects each mark.
a) Construct a graphical representation for the scenario. Include title, labels, units and scale.
What does the slope of the graph of position vs. clock reading physically represent?
What does the y intercept of the graph of position vs. clock reading physically represent?

g) Determine the system’s speed during the following time intervals:
0 – 6 seconds
Speed 0 – 6 seconds: ____________ _________
6 – 12 seconds
Speed 6 – 12 seconds: ____________ _________
12 – 18 seconds
Speed 12 – 18 seconds: ____________ _________
c) Determine the distance covered during the entire time interval.
Distance: ____________ _________
e) Determine the average speed over the entire time interval.
Average Speed: ____________ _________
g) Determine the system’s velocity during the following time intervals:
0 – 6 seconds
Velocity 0 – 6 seconds: ____________ _________
6 – 12 seconds
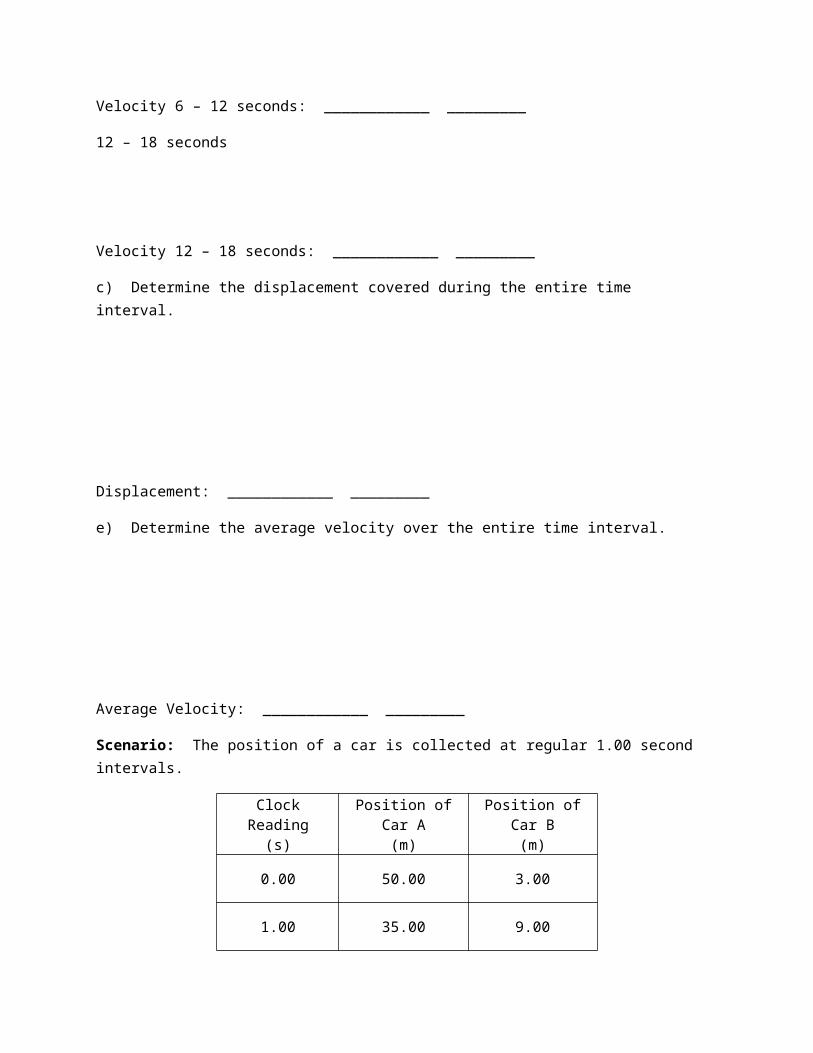
Velocity 6 – 12 seconds: ____________ _________
12 – 18 seconds
Velocity 12 – 18 seconds: ____________ _________
c) Determine the displacement covered during the entire time interval.
Displacement: ____________ _________
e) Determine the average velocity over the entire time interval.
Average Velocity: ____________ _________
Scenario: The position of a car is collected at regular 1.00 second intervals.
Clock Reading(s)
Position of Car A(m)
Position of Car B(m)
0.00 50.00 3.00
1.00 35.00 9.00
2.00 20.00 15.00
3.00 5.00 21.00
4.00 X 27.00
5.00 X 33.00
6.00 X 39.00
Position at a Given Clock Reading
Pictorial Representation: In the space below, mark each car’s position at each clock reading. Include a line with an arrow indicating the direction of motion which connects each mark. Car A should be indicated with RED and Car B should be indicated with BLUE.
Pictorially estimate the position and clock reading the two cars will intersect.
Position: ____________ _________
Clock Reading: _____________ _________
a) Construct a graphical representation for the scenario. Car A should be indicated with RED and Car B should be indicated with BLUE. Include title, labels, units and scale.
e) Write out the complete proper mathematical representation of each car.
Car A:
Car B:
e) Graphically estimate the position and clock reading the two cars will intersect.

Position: ____________ _________
Clock Reading: _____________ _________
Mathematically determine the position and clock reading the two cars will intersect. (Physics III Only)
Position: ____________ _________ Clock Reading: _____________ _________
Determine the velocity of Car A relative to Car B.
Velocity of A relative to B: ____________ _________
Determine the velocity of Car B relative to Car A. (Physics III Only)
Velocity of B relative to A: ____________ _________
Scenario 6: A system moves with a speed of 2.0 m/s for 5.0 seconds in the positive direction, 4.0 m/s for 7.0 seconds in the negative direction, and then 1.0 m/s for 8.0 seconds in the positive direction. The initial position of the system is the 25 m position.
a) Determine the distance covered during the entire 20.0 seconds.
Distance: ____________ _________
b) Determine the displacement of the system after the entire 20.0 seconds.
Displacement: ____________ _________
c) Determine the average speed and average velocity of the system over the entire 20.0 seconds.
Average Speed: ____________ _________
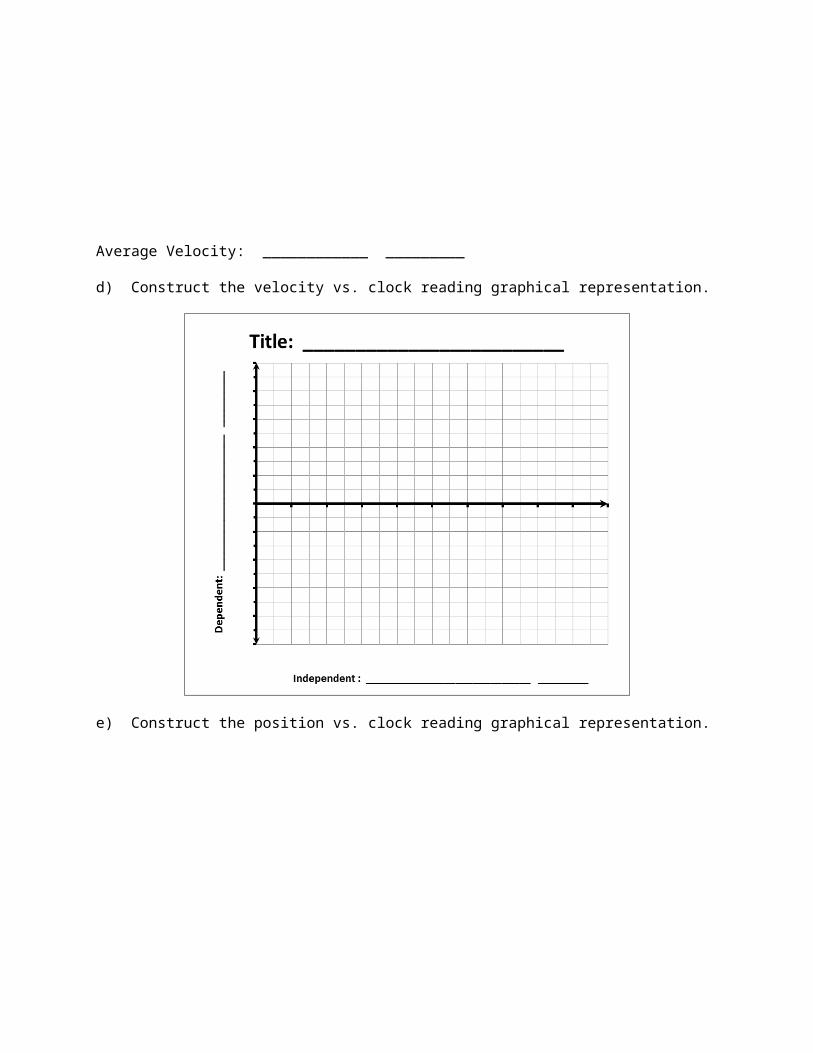
Average Velocity: ____________ _________
d) Construct the velocity vs. clock reading graphical representation.
e) Construct the position vs. clock reading graphical representation.
g) Determine the area under the velocity vs. clock reading graphical representation. Show the work necessary to determine each individual area.
Area under Velocity vs. Clock Reading Curve: ____________ _________
How does the area under a velocity vs. clock reading curve compare to the displacement of the system?
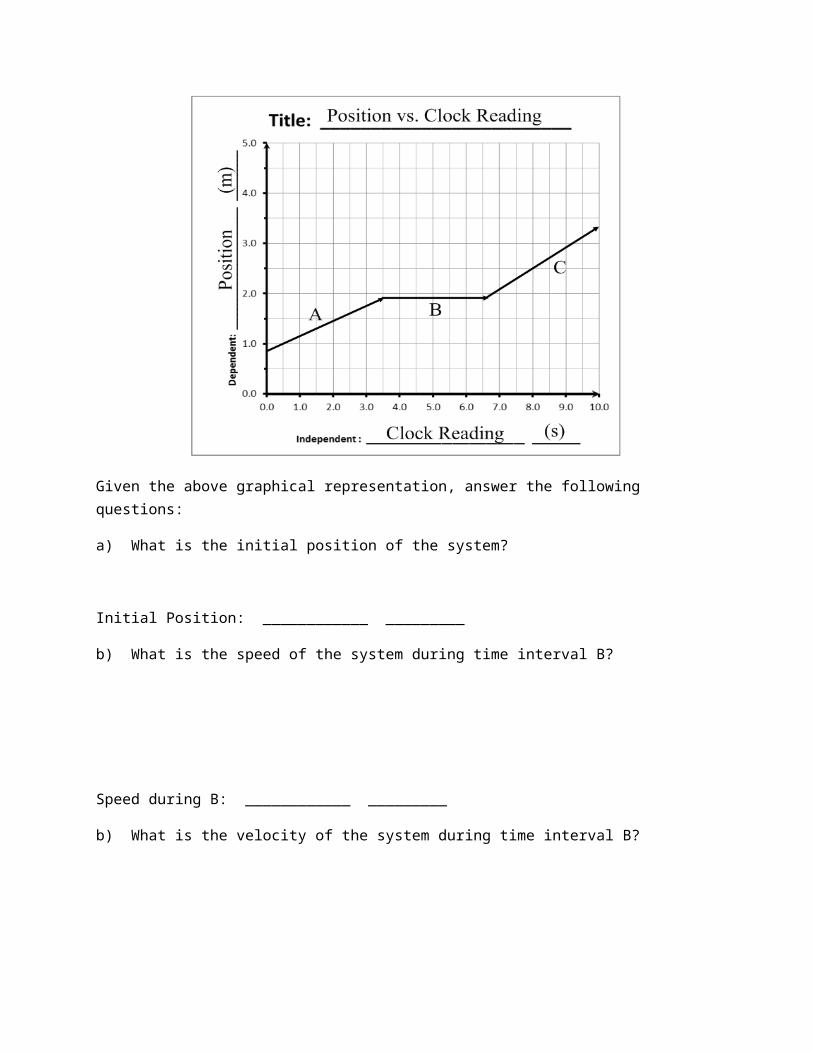
Given the above graphical representation, answer the following questions:
a) What is the initial position of the system?
Initial Position: ____________ _________
b) What is the speed of the system during time interval B?
Speed during B: ____________ _________
b) What is the velocity of the system during time interval B?
Velocity during B: ____________ _________

b) What is the speed of the system during time interval C?
Speed during C: ____________ _________
b) What is the velocity of the system during time interval C?
Velocity during C: ____________ _________
e) What is the average speed over the entire time interval?
Average Speed: ____________ _________
f) What is the average velocity over the entire time interval?
Average Velocity: ____________ _________

Scenario: A system starts at an initial position of 1.0 m and remains stationary for the first second. It then moves at a velocity of +1.50 meters each and every second for two seconds, and then remains stationary for three seconds. Finally, the system returns to the starting position in three seconds and remains there.
a) In the graph provided, construct the position vs. clock reading graphical representation for this scenario. Include a title, labels, units and scale.
b) In the space provided, construct a motion map for this scenario.
c) What is the speed of the system the time the system returns to the starting position?
Speed during Time Interval: ____________ _________
b) What is the velocity of the system during time interval B?
Velocity during B: ____________ _________
b) What is the speed of the system during time interval B?
Speed during D: ____________ _________
b) What is the velocity of the system during time interval B?
Velocity during D: ____________ _________
e) What is the average speed over the entire time interval?
Average Speed: ____________ _________
f) What is the average velocity over the entire time interval?
Average Velocity: ____________ _________
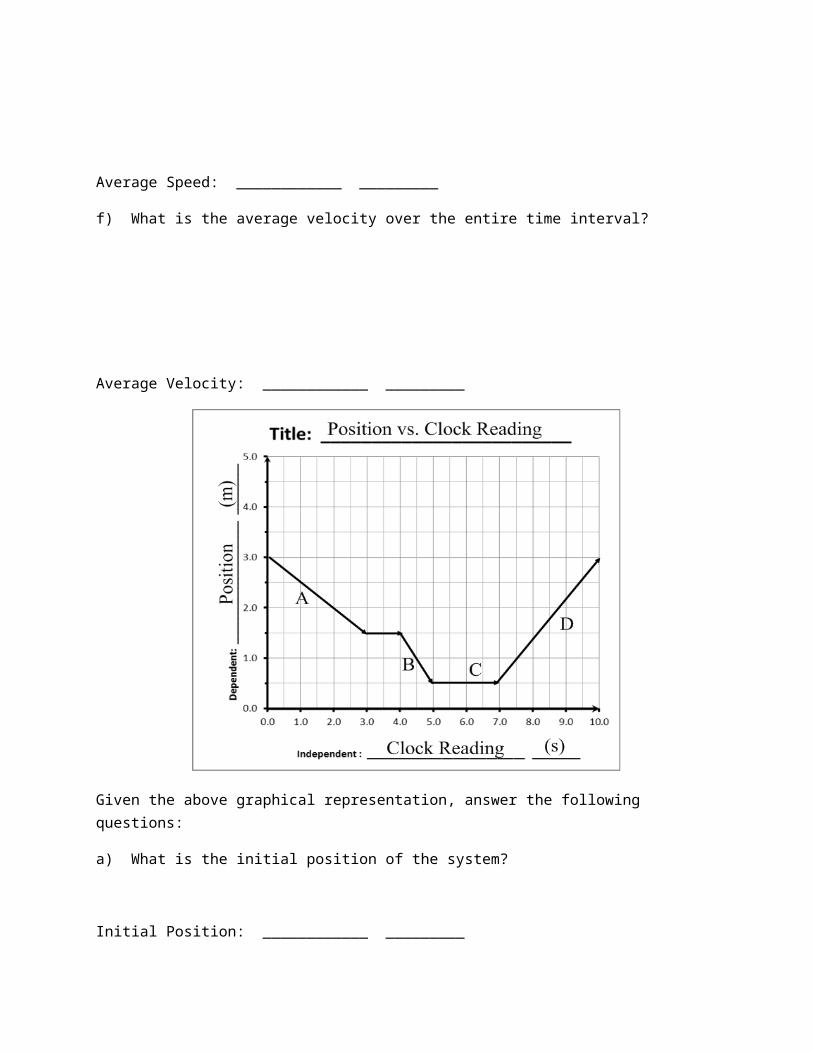
Given the above graphical representation, answer the following questions:
a) What is the initial position of the system?
Initial Position: ____________ _________
b) What is the speed of the system during time interval B?
Speed during B: ____________ _________
b) What is the velocity of the system during time interval B?
Velocity during B: ____________ _________

b) What is the speed of the system during time interval B?
Speed during D: ____________ _________
b) What is the velocity of the system during time interval B?
Velocity during D: ____________ _________
e) What is the average speed over the entire time interval?
Average Speed: ____________ _________
f) What is the average velocity over the entire time interval?
Average Velocity: ____________ _________
Given the above graphical representation, answer the following questions:
a) Construct a corresponding graphical representation of position vs. clock reading. Assume an initial position of the system of 2.00 meters.
c) What is the total distance covered during the entire time interval?
Total Distance: ____________ _________
d) What is the total displacement during the entire time interval?
Total Displacement: ____________ _________
What is the average speed of the system over the entire time interval?
Average Speed: ____________ _________
What is the average velocity of the system over the entire time interval?
Average Velocity: ____________ _________