Embed Size (px)
Citation preview
This question paper consists of 12 printed pages.
SP (NF/SLC) S23402/4© CIE 2002 [Turn over
CAMBRIDGE INTERNATIONAL EXAMINATIONS
Joint Examination for the School Certificateand General Certificate of Education Ordinary Level
PHYSICS 5054/2PAPER 2 Theory
OCTOBER/NOVEMBER SESSION 20021 hour 45 minutes
Candidates answer on the question paper.Additional materials:
Answer paperGraph paper
TIME 1 hour 45 minutes
INSTRUCTIONS TO CANDIDATES
Write your name, Centre number and candidate number in the spaces at the top of this page and onany separate answer paper used.
Section A
Answer all questions.
Write your answers in the spaces provided on the question paper.
Section B
Answer any two questions.
Write your answers on the separate answer paper provided.
At the end of the examination, fasten any separate answer paper used securely to the question paper.
INFORMATION FOR CANDIDATES
The number of marks is given in brackets [ ] at the end of each question or part question.
Candidates are reminded that all quantitative answers should include appropriate units.
Candidates are advised to show all their working in a clear and orderly manner, as more marks areawarded for sound use of physics than for correct answers.
CandidateCentre Number Number
Candidate Name
FOR EXAMINER’S USE
Section A
Q9
Q10
Q11
TOTAL
www.theallpapers.com
2
5054/2/O/N/02
Section A
Answer all the questions in this section.
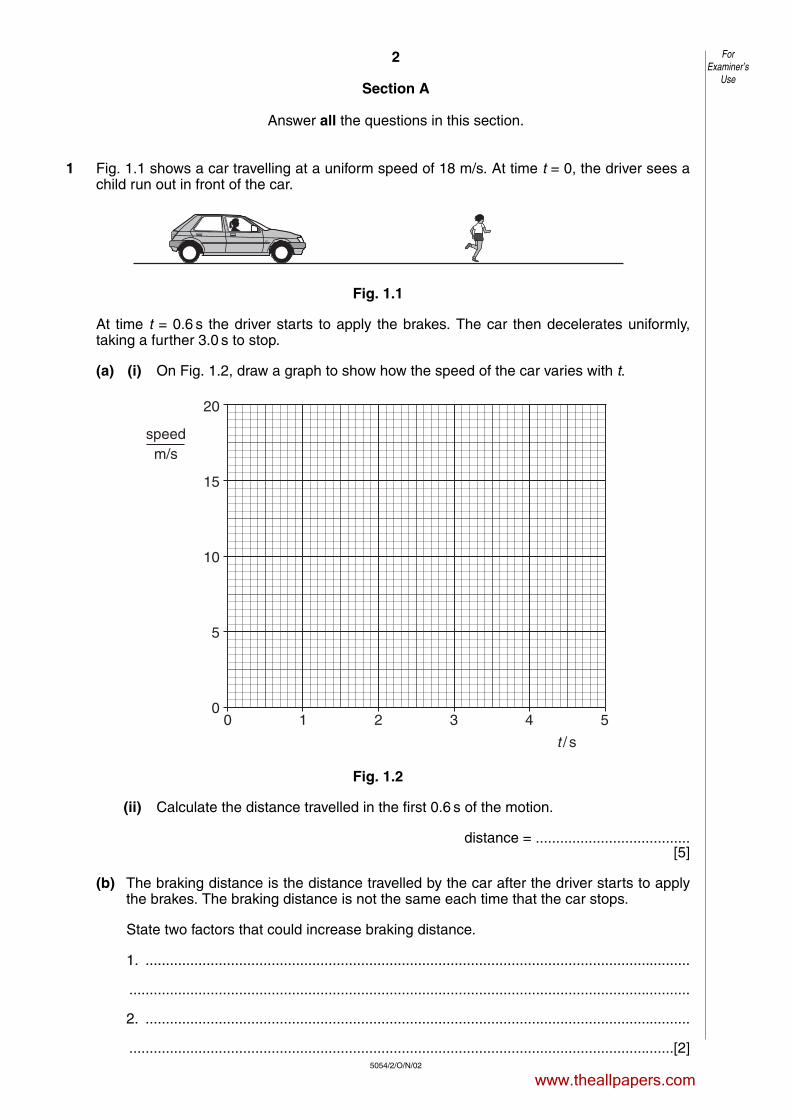
1 Fig. 1.1 shows a car travelling at a uniform speed of 18 m/s. At time t = 0, the driver sees achild run out in front of the car.
Fig. 1.1
At time t = 0.6 s the driver starts to apply the brakes. The car then decelerates uniformly,taking a further 3.0 s to stop.
(a) (i) On Fig. 1.2, draw a graph to show how the speed of the car varies with t.
Fig. 1.2
(ii) Calculate the distance travelled in the first 0.6 s of the motion.
distance = ......................................[5]
(b) The braking distance is the distance travelled by the car after the driver starts to applythe brakes. The braking distance is not the same each time that the car stops.
State two factors that could increase braking distance.
1. ......................................................................................................................................
..........................................................................................................................................
2. ......................................................................................................................................
......................................................................................................................................[2]
00
5
10
15
20
1 2 3 4 5
speedm/s
t / s
ForExaminer’s
Use
www.theallpapers.com
3
5054/2/O/N/02 [Turn over
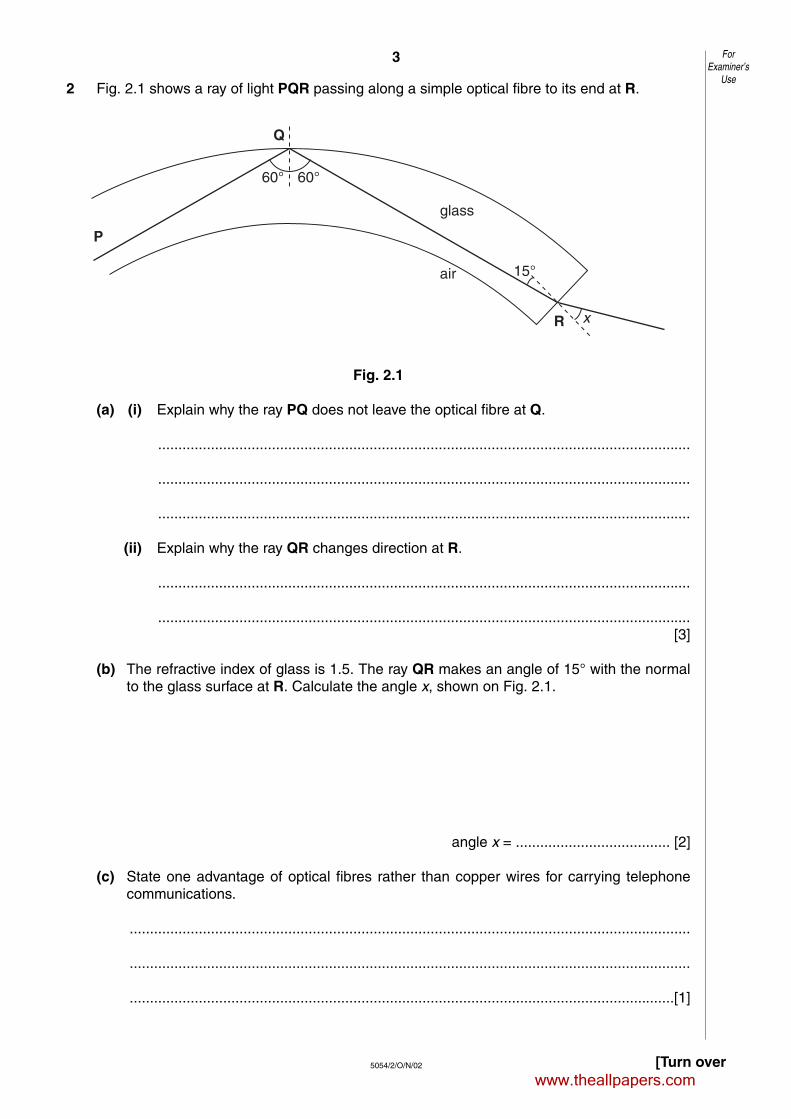
2 Fig. 2.1 shows a ray of light PQR passing along a simple optical fibre to its end at R.
Fig. 2.1
(a) (i) Explain why the ray PQ does not leave the optical fibre at Q.
...................................................................................................................................
...................................................................................................................................
...................................................................................................................................
(ii) Explain why the ray QR changes direction at R.
...................................................................................................................................
...................................................................................................................................[3]
(b) The refractive index of glass is 1.5. The ray QR makes an angle of 15° with the normalto the glass surface at R. Calculate the angle x, shown on Fig. 2.1.
angle x = ...................................... [2]
(c) State one advantage of optical fibres rather than copper wires for carrying telephonecommunications.
..........................................................................................................................................
..........................................................................................................................................
......................................................................................................................................[1]
P
Q
R
60° 60°
15°
x
glass
air
ForExaminer’s
Use
www.theallpapers.com
4
5054/2/O/N/02
3 Microwaves are waves in the electromagnetic spectrum.
(a) (i) State the name of waves in one other part of the electromagnetic spectrum thathave wavelengths longer than microwaves.
...............................................................................................................................[1]
(ii) A wave in the electromagnetic spectrum has a wavelength longer than microwaves.Explain why the frequency of this wave is lower than the frequency of microwaves.
...................................................................................................................................
...................................................................................................................................
...................................................................................................................................
...................................................................................................................................
...............................................................................................................................[2]
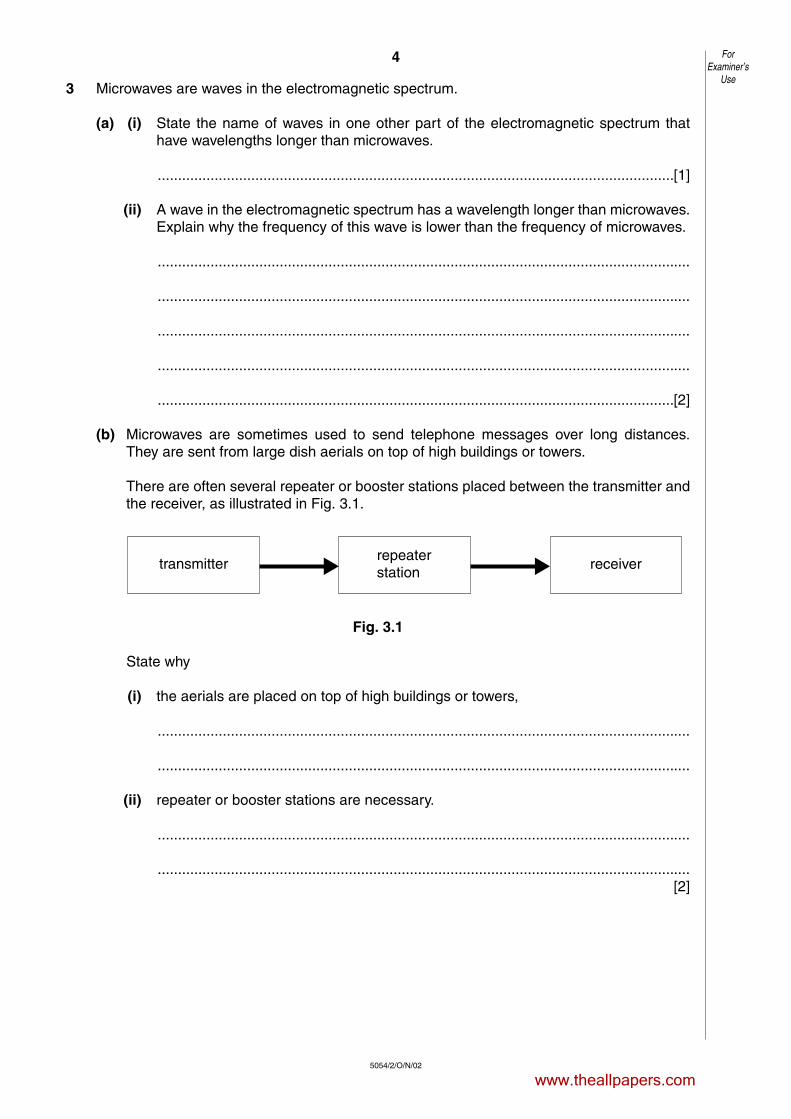
(b) Microwaves are sometimes used to send telephone messages over long distances.They are sent from large dish aerials on top of high buildings or towers.
There are often several repeater or booster stations placed between the transmitter andthe receiver, as illustrated in Fig. 3.1.
Fig. 3.1
State why
(i) the aerials are placed on top of high buildings or towers,
...................................................................................................................................
...................................................................................................................................
(ii) repeater or booster stations are necessary.
...................................................................................................................................
...................................................................................................................................[2]
receiverrepeaterstation
transmitter
ForExaminer’s
Use
▼ ▼
www.theallpapers.com
5
5054/2/O/N/02 [Turn over
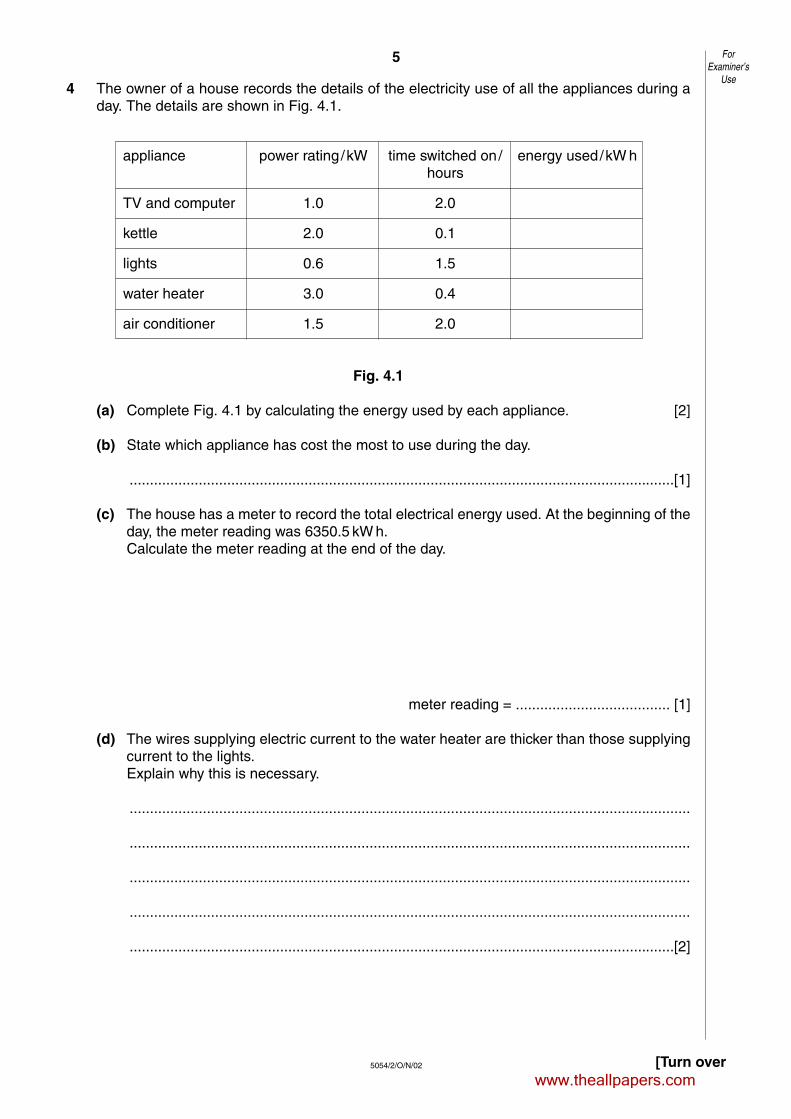
4 The owner of a house records the details of the electricity use of all the appliances during aday. The details are shown in Fig. 4.1.
Fig. 4.1
(a) Complete Fig. 4.1 by calculating the energy used by each appliance. [2]
(b) State which appliance has cost the most to use during the day.
......................................................................................................................................[1]
(c) The house has a meter to record the total electrical energy used. At the beginning of theday, the meter reading was 6350.5 kW h.Calculate the meter reading at the end of the day.
meter reading = ...................................... [1]
(d) The wires supplying electric current to the water heater are thicker than those supplyingcurrent to the lights.Explain why this is necessary.
..........................................................................................................................................
..........................................................................................................................................
..........................................................................................................................................
..........................................................................................................................................
......................................................................................................................................[2]
ForExaminer’s
Use
appliance power rating/kW time switched on/ energy used/kW hhours
TV and computer 1.0 2.0
kettle 2.0 0.1
lights 0.6 1.5
water heater 3.0 0.4
air conditioner 1.5 2.0
www.theallpapers.com
6
5054/2/O/N/02
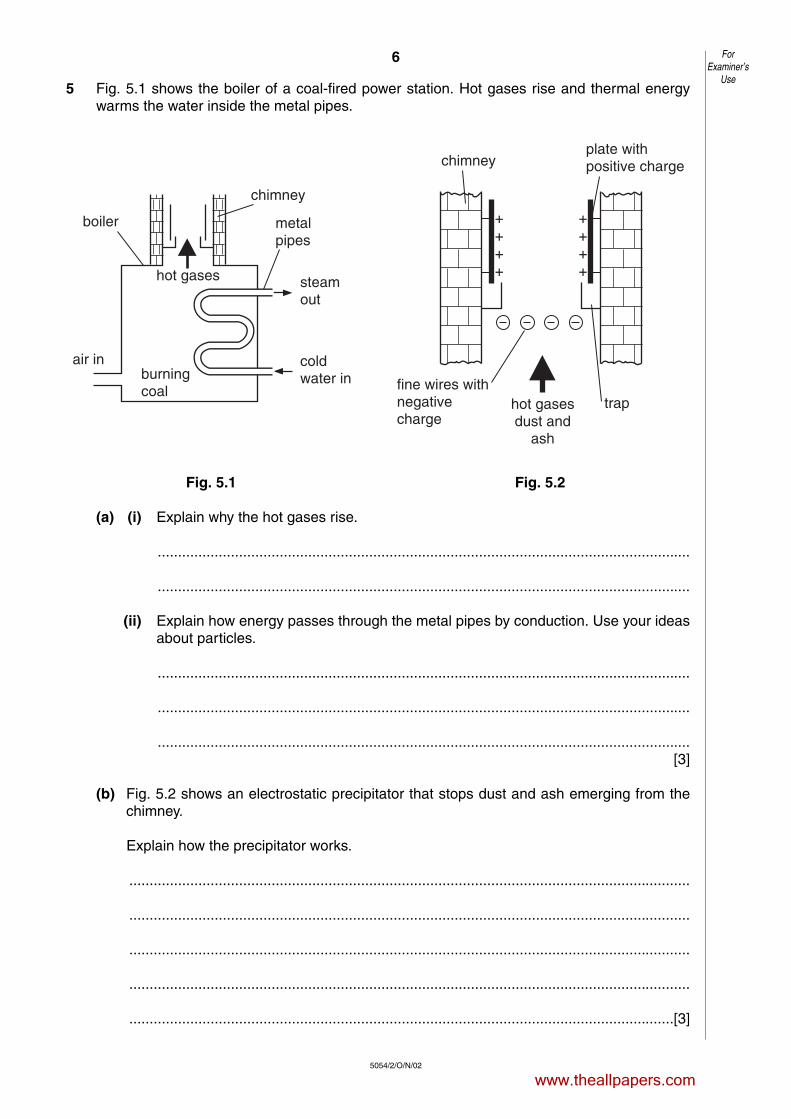
5 Fig. 5.1 shows the boiler of a coal-fired power station. Hot gases rise and thermal energywarms the water inside the metal pipes.
Fig. 5.1 Fig. 5.2
(a) (i) Explain why the hot gases rise.
...................................................................................................................................
...................................................................................................................................
(ii) Explain how energy passes through the metal pipes by conduction. Use your ideasabout particles.
...................................................................................................................................
...................................................................................................................................
...................................................................................................................................[3]
(b) Fig. 5.2 shows an electrostatic precipitator that stops dust and ash emerging from thechimney.
Explain how the precipitator works.
..........................................................................................................................................
..........................................................................................................................................
..........................................................................................................................................
..........................................................................................................................................
......................................................................................................................................[3]
chimney
fine wires withnegativecharge
traphot gasesdust and
ash
plate withpositive charge
boiler
air inburningcoal
chimney
metalpipes
steamout
coldwater in
hot gases
ForExaminer’s
Use
www.theallpapers.com
7
5054/2/O/N/02 [Turn over
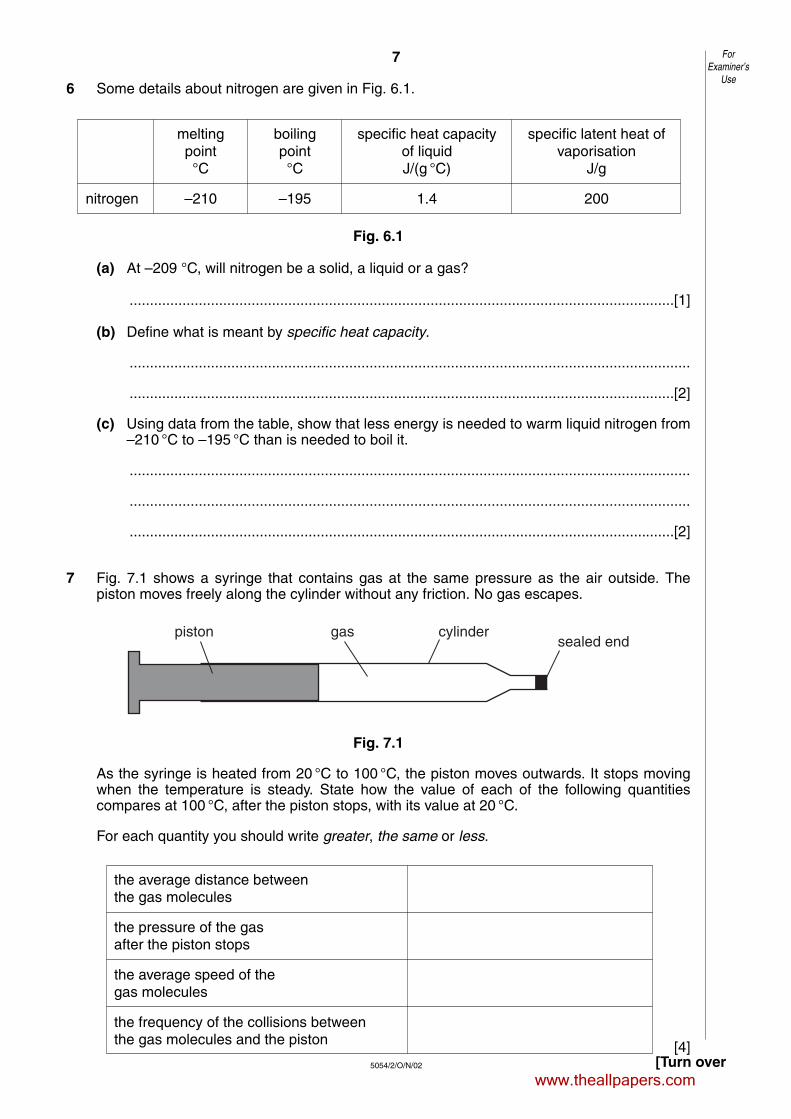
6 Some details about nitrogen are given in Fig. 6.1.
Fig. 6.1
(a) At –209 °C, will nitrogen be a solid, a liquid or a gas?
......................................................................................................................................[1]
(b) Define what is meant by specific heat capacity.
..........................................................................................................................................
......................................................................................................................................[2]
(c) Using data from the table, show that less energy is needed to warm liquid nitrogen from–210 °C to –195 °C than is needed to boil it.
..........................................................................................................................................
..........................................................................................................................................
......................................................................................................................................[2]
7 Fig. 7.1 shows a syringe that contains gas at the same pressure as the air outside. Thepiston moves freely along the cylinder without any friction. No gas escapes.
Fig. 7.1
As the syringe is heated from 20 °C to 100 °C, the piston moves outwards. It stops movingwhen the temperature is steady. State how the value of each of the following quantitiescompares at 100 °C, after the piston stops, with its value at 20 °C.
For each quantity you should write greater, the same or less.
[4]
piston gas cylindersealed end
ForExaminer’s
Use
melting boiling specific heat capacity specific latent heat ofpoint point of liquid vaporisation°C °C J/(g °C) J/g
nitrogen –210 –195 1.4 200
the average distance betweenthe gas molecules
the pressure of the gasafter the piston stops
the average speed of thegas molecules
the frequency of the collisions betweenthe gas molecules and the piston
www.theallpapers.com
8
5054/2/O/N/02
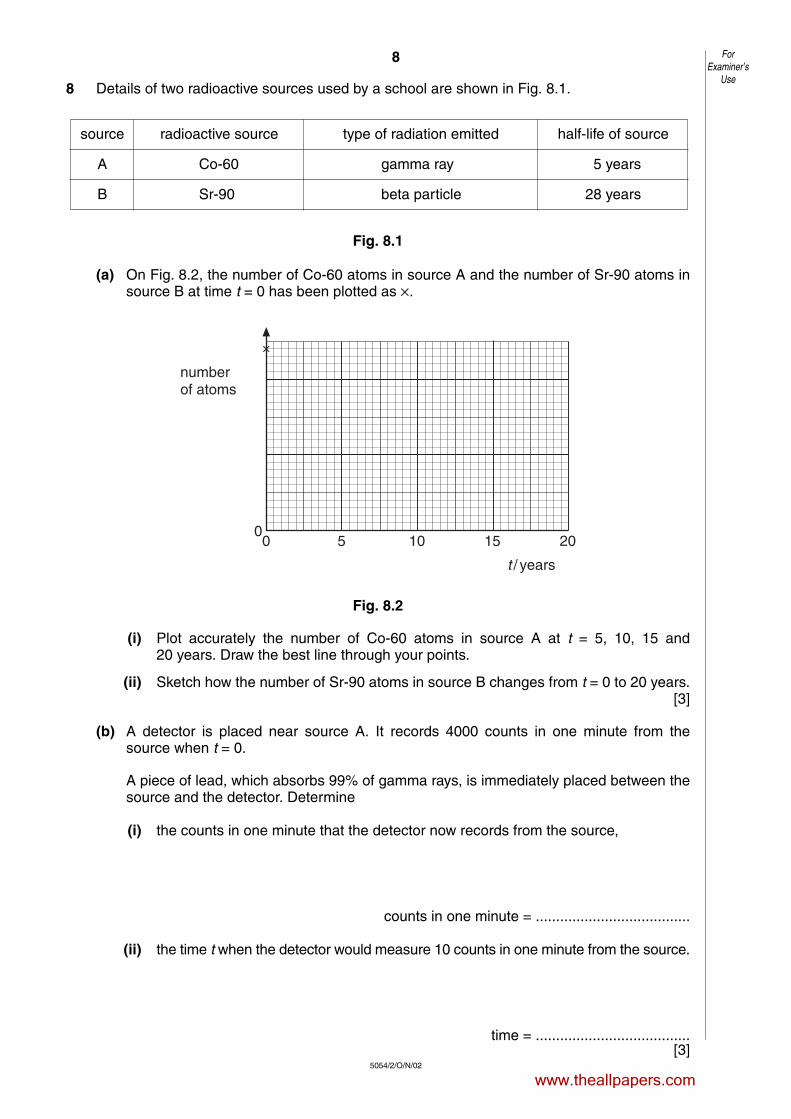
8 Details of two radioactive sources used by a school are shown in Fig. 8.1.
Fig. 8.1
(a) On Fig. 8.2, the number of Co-60 atoms in source A and the number of Sr-90 atoms insource B at time t = 0 has been plotted as ×.
Fig. 8.2
(i) Plot accurately the number of Co-60 atoms in source A at t = 5, 10, 15 and20 years. Draw the best line through your points.
(ii) Sketch how the number of Sr-90 atoms in source B changes from t = 0 to 20 years.[3]
(b) A detector is placed near source A. It records 4000 counts in one minute from thesource when t = 0.
A piece of lead, which absorbs 99% of gamma rays, is immediately placed between thesource and the detector. Determine
(i) the counts in one minute that the detector now records from the source,
counts in one minute = ......................................
(ii) the time t when the detector would measure 10 counts in one minute from the source.
time = ......................................[3]
00
5 10
t / years
15 20
numberof atoms
ForExaminer’s
Use
source radioactive source type of radiation emitted half-life of source
A Co-60 gamma ray 5 years
B Sr-90 beta particle 28 years
www.theallpapers.com
9
5054/2/O/N/02 [Turn over
Section B
Answer two questions from this section.
Use the separate answer sheets available from the Supervisor.
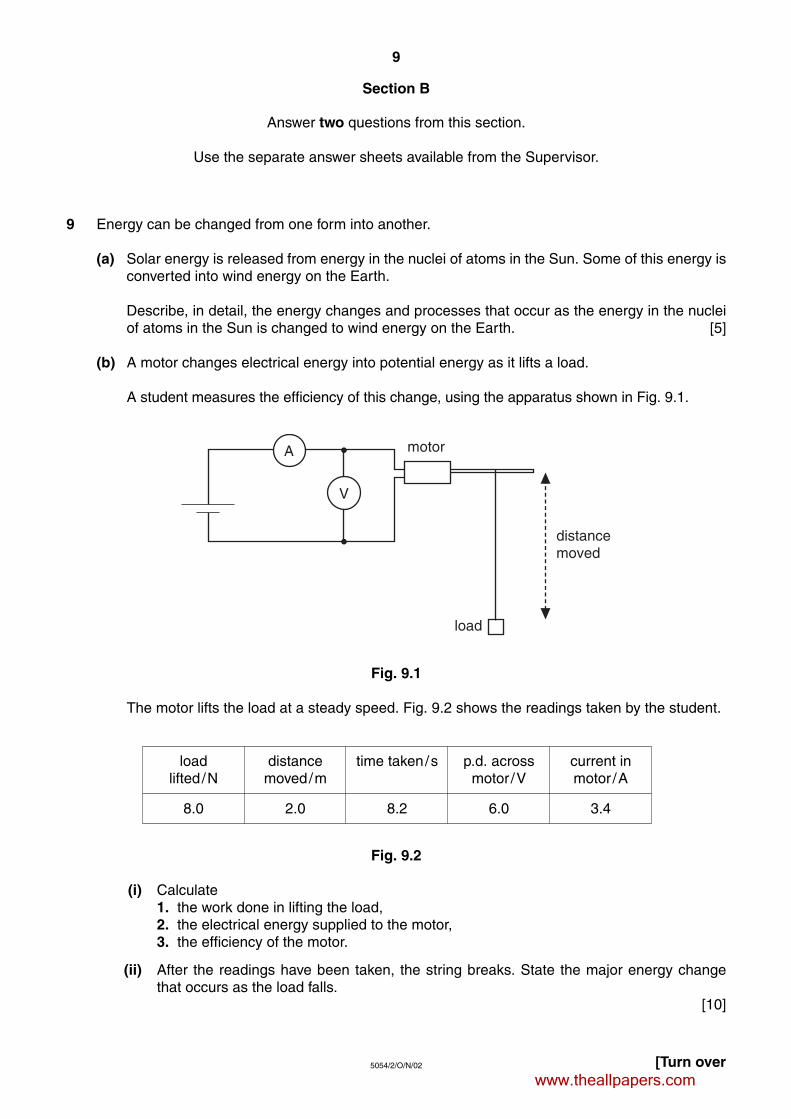
9 Energy can be changed from one form into another.
(a) Solar energy is released from energy in the nuclei of atoms in the Sun. Some of this energy isconverted into wind energy on the Earth.
Describe, in detail, the energy changes and processes that occur as the energy in the nucleiof atoms in the Sun is changed to wind energy on the Earth. [5]
(b) A motor changes electrical energy into potential energy as it lifts a load.
A student measures the efficiency of this change, using the apparatus shown in Fig. 9.1.
Fig. 9.1
The motor lifts the load at a steady speed. Fig. 9.2 shows the readings taken by the student.
Fig. 9.2
(i) Calculate1. the work done in lifting the load,2. the electrical energy supplied to the motor,3. the efficiency of the motor.
(ii) After the readings have been taken, the string breaks. State the major energy changethat occurs as the load falls.
[10]
A
V
motor
load
distancemoved
load distance time taken/s p.d. across current inlifted/N moved/m motor /V motor /A
8.0 2.0 8.2 6.0 3.4
www.theallpapers.com
10
5054/2/O/N/02
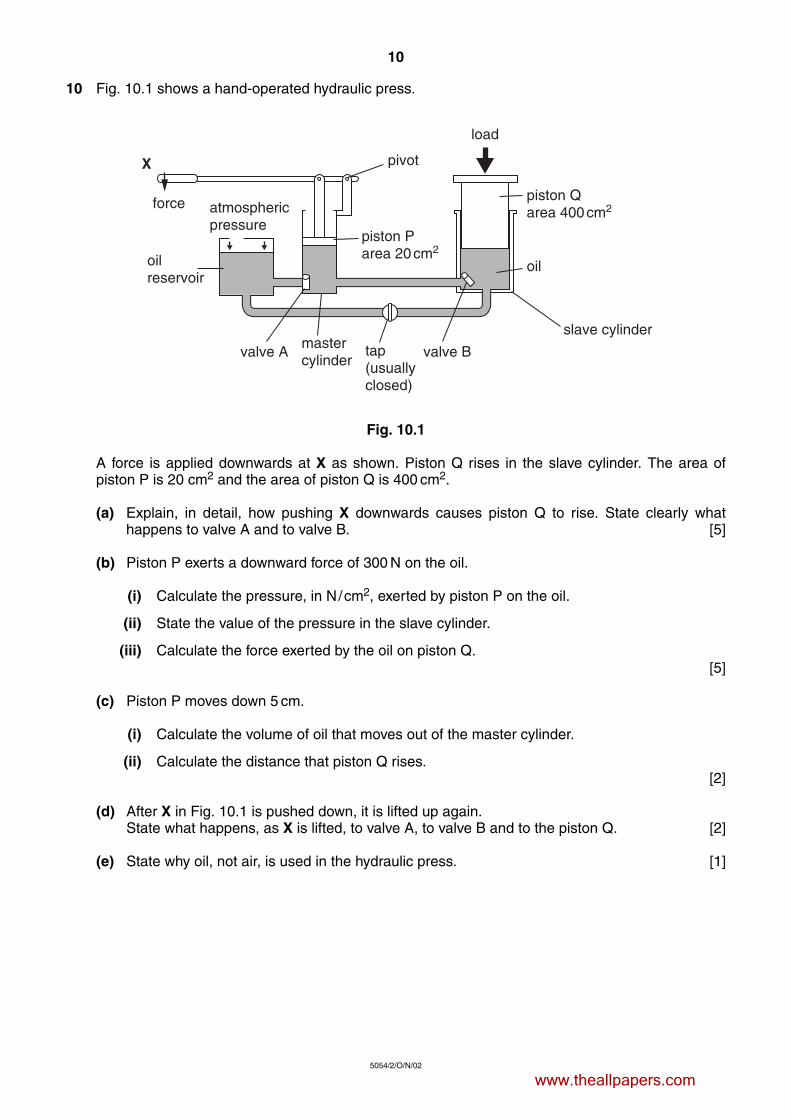
10 Fig. 10.1 shows a hand-operated hydraulic press.
Fig. 10.1
A force is applied downwards at X as shown. Piston Q rises in the slave cylinder. The area ofpiston P is 20 cm2 and the area of piston Q is 400 cm2.
(a) Explain, in detail, how pushing X downwards causes piston Q to rise. State clearly whathappens to valve A and to valve B. [5]
(b) Piston P exerts a downward force of 300 N on the oil.
(i) Calculate the pressure, in N/cm2, exerted by piston P on the oil.
(ii) State the value of the pressure in the slave cylinder.
(iii) Calculate the force exerted by the oil on piston Q.[5]
(c) Piston P moves down 5 cm.
(i) Calculate the volume of oil that moves out of the master cylinder.
(ii) Calculate the distance that piston Q rises.[2]
(d) After X in Fig. 10.1 is pushed down, it is lifted up again.State what happens, as X is lifted, to valve A, to valve B and to the piston Q. [2]
(e) State why oil, not air, is used in the hydraulic press. [1]
load
oil
piston Qarea 400cm2
slave cylinder
valve Bvalve Amastercylinder
atmosphericpressure
oilreservoir
force
X pivot
piston Parea 20cm2
tap(usuallyclosed)
www.theallpapers.com
11
5054/2/O/N/02 [Turn over
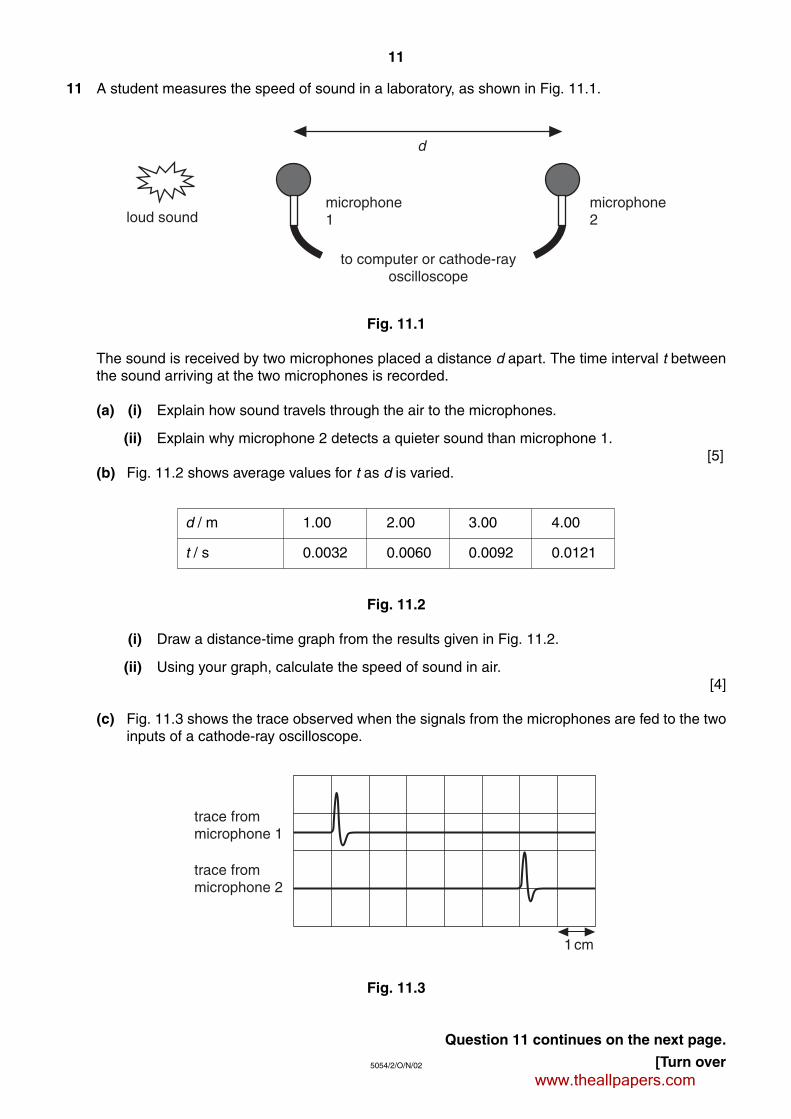
11 A student measures the speed of sound in a laboratory, as shown in Fig. 11.1.
Fig. 11.1
The sound is received by two microphones placed a distance d apart. The time interval t betweenthe sound arriving at the two microphones is recorded.
(a) (i) Explain how sound travels through the air to the microphones.
(ii) Explain why microphone 2 detects a quieter sound than microphone 1.[5]
(b) Fig. 11.2 shows average values for t as d is varied.
Fig. 11.2
(i) Draw a distance-time graph from the results given in Fig. 11.2.
(ii) Using your graph, calculate the speed of sound in air.[4]
(c) Fig. 11.3 shows the trace observed when the signals from the microphones are fed to the twoinputs of a cathode-ray oscilloscope.
Fig. 11.3
Question 11 continues on the next page.
trace frommicrophone 1
trace frommicrophone 2
1cm
microphone1
to computer or cathode-rayoscilloscope
loud sound
d
microphone2
d / m 1.00 2.00 3.00 4.00
t / s 0.0032 0.0060 0.0092 0.0121
www.theallpapers.com
12
5054/2/O/N/02
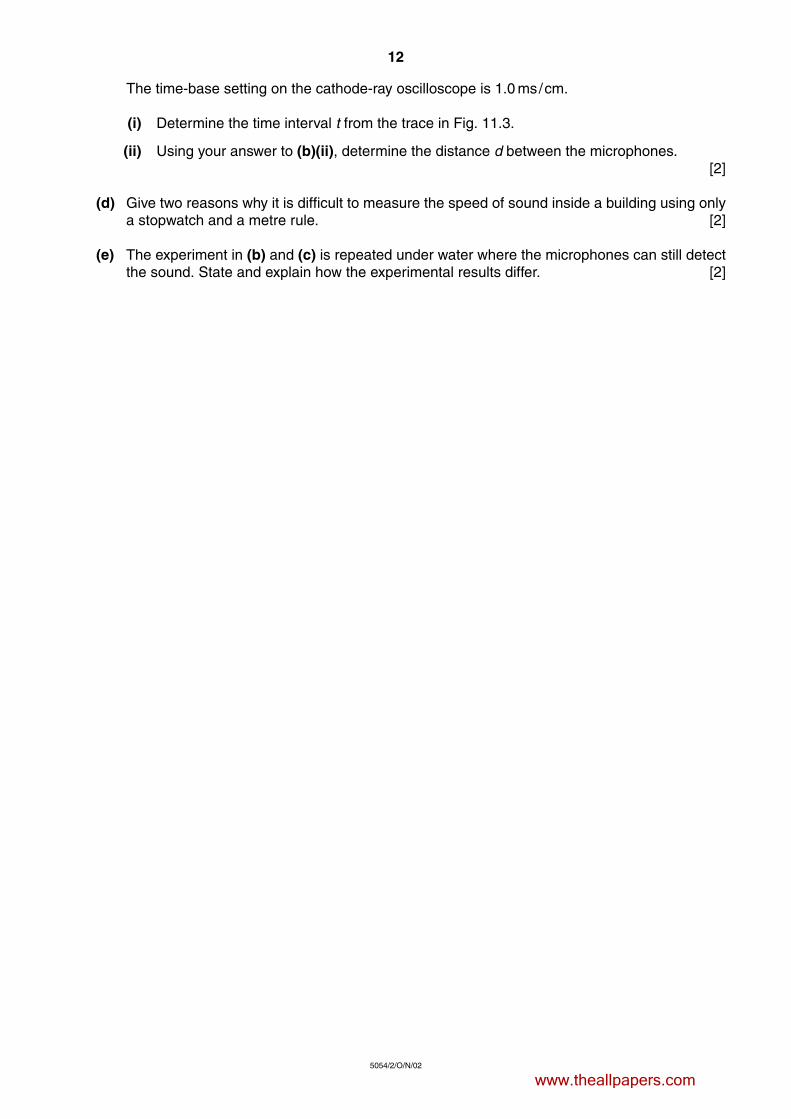
The time-base setting on the cathode-ray oscilloscope is 1.0 ms/cm.
(i) Determine the time interval t from the trace in Fig. 11.3.
(ii) Using your answer to (b)(ii), determine the distance d between the microphones.[2]
(d) Give two reasons why it is difficult to measure the speed of sound inside a building using onlya stopwatch and a metre rule. [2]
(e) The experiment in (b) and (c) is repeated under water where the microphones can still detectthe sound. State and explain how the experimental results differ. [2]
www.theallpapers.com