Embed Size (px)
Citation preview
1
TED ANKARA COLLAGE FOUNDATION PRIVATE HIGH SCHOOL
Physics Extended Essay
To Study the Variations of Photoelectric Current with Intensity of Light
Word Count: 3970
Candidate Name: GAMZE ONUKER
Candidate No: D1129061
Supervisor Name: OYA ADALIER
2
ABSTRACT
This study discusses the variations of photoelectric current with intensity of light. The
photoelectric effect is dependent upon various factors including frequency of light, intensity of
light, nature of material, energy of light and potential difference. However, even if the
photoelectric effect is caused, the photoelectric current which is produced as a result of it may
vary if intensity of light is changed, provided that frequency of illumination is greater than
threshold frequency. To determine the impact of changing light intensity on photoelectric effect
while keeping the other factors constant, an experiment was performed. The impact was seen by
changing the distance of light source from photocell and the recording the readings on
Microammeter. The correlation and graphical analysis was done to draw the results. The
correlation analysis showed a significant positive relationship between photoelectric current and
intensity of light. The graphical analysis also highlighted a positive linear relationship.
Therefore, it was concluded that intensity of light directly affects the variations in photoelectric
current.
(WORD COUNT:164)
Gamze ONUKER
D1129061
3
TABLE OF CONTENT
ABSTRACT .................................................................................................................................... 2
INTRODUCTION .......................................................................................................................... 4
THEORY ........................................................................................................................................ 6
Factors Affecting Photoelectric Effect ........................................................................................ 6
1. Intensity of Light: ............................................................................................................. 6
2. Frequency: ....................................................................................................................... 6
3. Number of Photoelectrons: .............................................................................................. 7
4. Kinetic Energy of Photoelectrons: ................................................................................... 7
Uses of Photoelectric current ...................................................................................................... 7
AIMS AND OBJECTIVES ............................................................................................................ 9
METHODOLOGY ....................................................................................................................... 10
EXPERIMENT ............................................................................................................................. 11
Apparatus .................................................................................................................................. 11
Precautions and Sources of Error .............................................................................................. 14
Dependent and Independent Variables ...................................................................................... 15
PRIMARY DATA COLLECTED ................................................................................................ 16
ANALYSIS AND EVALUATION .............................................................................................. 21
Correlation ................................................................................................................................. 21
Graphical Explanation ............................................................................................................... 21
CONCLUSIONS........................................................................................................................... 25
BIBLIOGRAPHY ......................................................................................................................... 30
Gamze ONUKER
D1129061
4
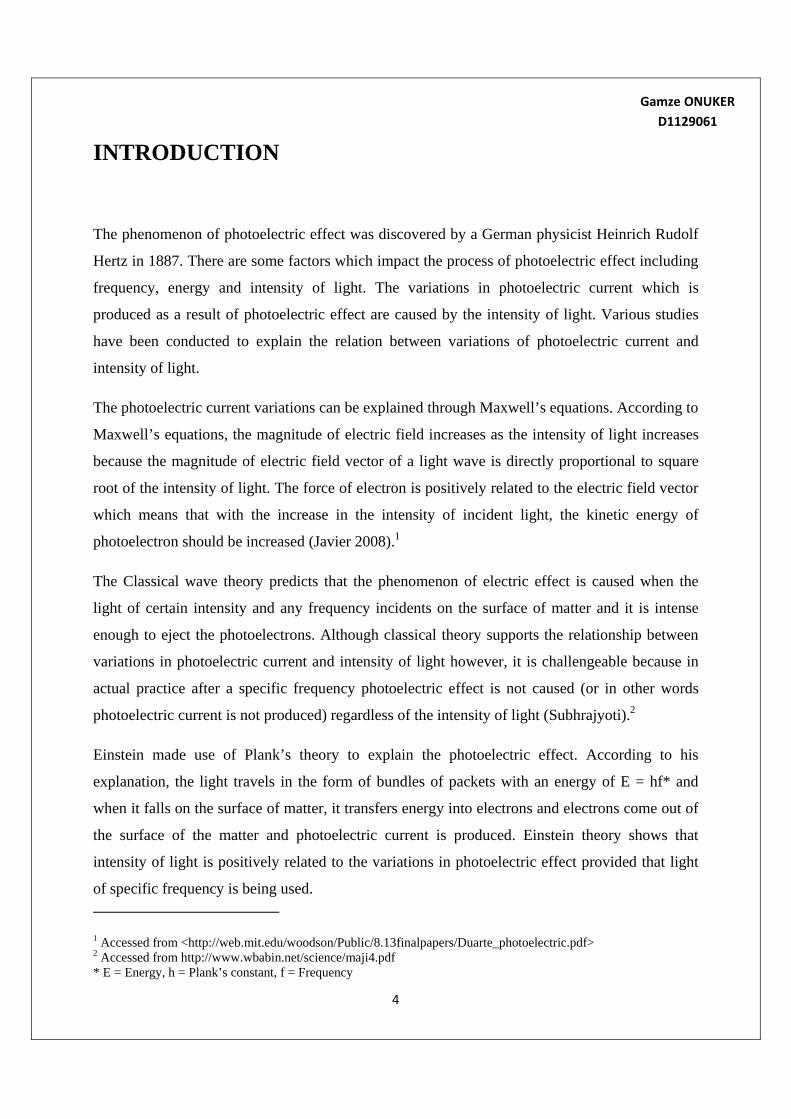
INTRODUCTION
The phenomenon of photoelectric effect was discovered by a German physicist Heinrich Rudolf
Hertz in 1887. There are some factors which impact the process of photoelectric effect including
frequency, energy and intensity of light. The variations in photoelectric current which is
produced as a result of photoelectric effect are caused by the intensity of light. Various studies
have been conducted to explain the relation between variations of photoelectric current and
intensity of light.
The photoelectric current variations can be explained through Maxwell’s equations. According to
Maxwell’s equations, the magnitude of electric field increases as the intensity of light increases
because the magnitude of electric field vector of a light wave is directly proportional to square
root of the intensity of light. The force of electron is positively related to the electric field vector
which means that with the increase in the intensity of incident light, the kinetic energy of
photoelectron should be increased (Javier 2008).1
The Classical wave theory predicts that the phenomenon of electric effect is caused when the
light of certain intensity and any frequency incidents on the surface of matter and it is intense
enough to eject the photoelectrons. Although classical theory supports the relationship between
variations in photoelectric current and intensity of light however, it is challengeable because in
actual practice after a specific frequency photoelectric effect is not caused (or in other words
photoelectric current is not produced) regardless of the intensity of light (Subhrajyoti).2
Einstein made use of Plank’s theory to explain the photoelectric effect. According to his
explanation, the light travels in the form of bundles of packets with an energy of E = hf* and
when it falls on the surface of matter, it transfers energy into electrons and electrons come out of
the surface of the matter and photoelectric current is produced. Einstein theory shows that
intensity of light is positively related to the variations in photoelectric effect provided that light
of specific frequency is being used.
1 Accessed from <http://web.mit.edu/woodson/Public/8.13finalpapers/Duarte_photoelectric.pdf> 2 Accessed from http://www.wbabin.net/science/maji4.pdf * E = Energy, h = Plank’s constant, f = Frequency
Gamze ONUKER
D1129061
5
In short, equations of Maxwell supports that intensity of light positively affects the variations in
photoelectric current. The Classical theory also supports that intensity of light of any frequency
positively affect the photoelectric current. However, quantum theory explains that only with a
specific frequency of light, the intensity of light is directly proportional to photoelectric current.
Therefore, in order to consolidate the results of these three different theories and to study the
variations of photoelectric effect with the change in the intensity of light, the need to conduct this
research study was felt.
This study starts with the theory section which briefly covers the process of photoelectric effect,
factors affecting this phenomenon and applications of photoelectric current in our daily life. In
the next section, I have explained the methodology that have been used to study the relationship
between variations of photoelectric current and intensity of light. After that the experiment has
been explained through which data has been collected. In the next section, the primary data
collected has been summarized. In the last section, an analysis and evaluation has been done to
interpret the data and findings. The study wraps up with a brief conclusion of the study and
results.
Gamze ONUKER
D1129061
6
THEORY
The photoelectric effect is defined as;
Emission of electrons from the surface of matter including metals, gases, liquids and non-
metallic solids when light of a certain frequency is incident on it is known as photoelectric effect.
In other words, it is the process of the removal of electrons from the surface of matter when rays
of special frequency fall on the surface of matter. As a result of the flow of these photoelectrons,
the photoelectric current is produced.
Factors Affecting Photoelectric Effect
Photoelectric current is produced as a result of photoelectric effect; therefore, understanding the
factors which influence the photoelectric effect is very important. The previous studies on
photoelectric effect have presented the following factors which may have a direct impact on
photoelectric effect.
1. Intensity of Light: If a high intense light of frequency equal or greater than threshold
frequency falls on the surface of matter, the photoelectric effect is caused. Since studying
the impact of this factor is the focus of this research study, therefore, it would be
discussed in detail however; one thing which is very clear is that the emission of
electrons does not depend upon the intensity of light unless the frequency of light is
greater than the threshold frequency.
2. Frequency: If a beam of light with frequency equal to or greater than threshold frequency
strike the surface of matter, photoelectric effect is produced. If frequency is less than the
threshold frequency then photoelectric effect cannot be seen. The threshold frequency
varies from matter to matter.
Gamze ONUKER
D1129061
7
3. Number of Photoelectrons: The increase in intensity of light increases the number of
photoelectrons, provided the frequency is greater than threshold frequency. In short, the
number of photoelectrons increases the photoelectric current.
4. Kinetic Energy of Photoelectrons: The kinetic energy of photoelectrons increases when
light of high energy falls on the surface of matter. When energy of light is equal to
threshold energy then electrons are emitted from the surface whereas when energy is
greater than threshold energy then photoelectric current is produced. The threshold
frequency is not same for all kinds of matter and it varies from matter to matter.
Uses of Photoelectric current
Photoelectric effect is a very useful phenomenon and its importance can be understood from
following uses of the photoelectric current.
Basically the photoelectric current produced as the result of photoelectric effect is used in
different types of photodiodes and phototransistors. The photoelectric current is very useful in
many solar light sensitive diodes and solar power such as solar cells. In semiconductors,
photoelectric current is produced by exciting the electrons or by kicking out electrons from the
valence shells by throwing light even of low energy. This current produced in semiconductors is
used for different purposes and has voltages related to the band gap energy.
One of the major uses of the photoelectric current is in photomultipliers. In Photomultipliers, the
current is used for the detection of low levels of light. In the early days of television, the
photoelectric current was also used in video camera tubes. The photoelectric current is produced
in Silicon image sensors by knocking out the electrons from outer most shell of the solid but not
out of the matter. This photoelectric current is then used in different charged couple devices. In
addition, Photoelectric current is also used in gold leaf electroscope which is designed for the
detection of electricity.
Photoelectron spectroscopy is also included in one of the main applications of the photoelectric
current. The energy of incident photons can be found with the help of photoelectric current
Gamze ONUKER
D1129061
8
because energy of incident photons is equal to the sum of binding energy of material’s work
function and the energy of photoelectrons. The binding energy is determined by bombarding the
matter with ultraviolet source or monochromatic X-ray source. On the other hand, energy of
emitted photoelectrons is determined by measuring the kinetic energy of photoelectric current.
Photoelectric current of positive or negative charges is also produced in space craft due to the
photoelectric effect. The parts of space craft exposed to the shadow develop a negative current of
several kilovolts. On the other hand, the parts of space craft exposed to light produce a positive
current.
Furthermore, the sunlight hits the lunar dust, they get charged due to photoelectric effect. The
surface of the moon is lifted off due the repulsion of this charged dust. So, the photoelectric
effect is also used to study the surface of the moon. Apart from all of the above mentioned uses,
photoelectric current produced during photoelectric effect also has a great use in night vision
devices. The photoelectrons are ejected out when light is fallen on gallium arsenide plate of the
night vision devices which are then amplified into cascade of electrons. These amplified
electrons are used to lighten up a phosphor screen.
In short, there are various applications of photoelectric effect and current in our daily life.
Gamze ONUKER
D1129061
9
AIMS AND OBJECTIVES
The primary purpose of this project is to evaluate the impact of distance of source of light on the
magnitude of current. Through this project, I expect to get an inverse relationship between the
two variables. Since, the energy consumption issues are increasing nowadays, and projecting the
right consumption has become difficult for policymakers, therefore, there is a need to carry out
such research projects that may provide help to energy producing companies. This research aims
to assist policymakers and energy producing companies to understand the impact of the factors
affecting power generation such as current. Therefore, it is expected that this research will be
really useful in understanding an important phenomenon of photoelectric effect, thereby,
contributing to environment.
Research Question
The research question of this study is as follows:
“What is the impact of changing intensity of light on current produced through photoelectric
cell?”
Gamze ONUKER
D1129061
10
METHODOLOGY
This study is an experimental research study. It focuses on the variation of photoelectric current
by changing the intensity of light. The quantitative experimental approach has been used to study
the relationship between the two factors. Apart from that, findings of similar previous research
studies and theories have been consulted to support the findings of this research study.
The experiment has been conducted in the laboratory environment to study the impact of
independent variable on the dependent variable. It is one-point in time study and it is not a
continuous study. Total nine readings have been taken by conducting the experiment. Since, it
only studies the relationship between the variations of photoelectric current and intensity of light
therefore, all other variables have been kept constant while carrying out the experiment.
After collecting the data by performing the experiment, it has been analyzed by two steps. In the
first step, the correlation analysis has been done to explain the significant relationship between
the two variables while in the second step; the graphical description has been used to interpret
the findings.
Two variables have been selected to conduct the research. The dependent variable is the current
whereas; the independent variable is the distance. Since, it has been investigated that by
changing the distance, the magnitude of current changes therefore, current is the dependent
variable.
Gamze ONUKER
D1129061
11
EXPERIMENT
To Study the Variation of Photoelectric Effect with Intensity of Light
Aim of Experiment: The aim of performing this experiment was to check the impact of
change in intensity of light on photoelectric current. Apart from that, it has also proved that the
photoelectric phenomenon, which has been commonly used in various applications of daily life
is a simple phenomenon.
Apparatus
The apparatus, which I have used to conduct this experiment, include Photocell, Rheostat,
Electric Lamps, Sensitive Galvanometer/Microammeter, Battery, Scale, Key and Connecting
wires.
1. I drew a circuit diagram (Figure 1) to get an idea about the scheme of connections. I
arranged the circuit in the exact manner as provided in Figure 1. Before conducting the
experiment, I ensured whether all apparatus was working properly or not.
Gamze ONUKER
D1129061
12
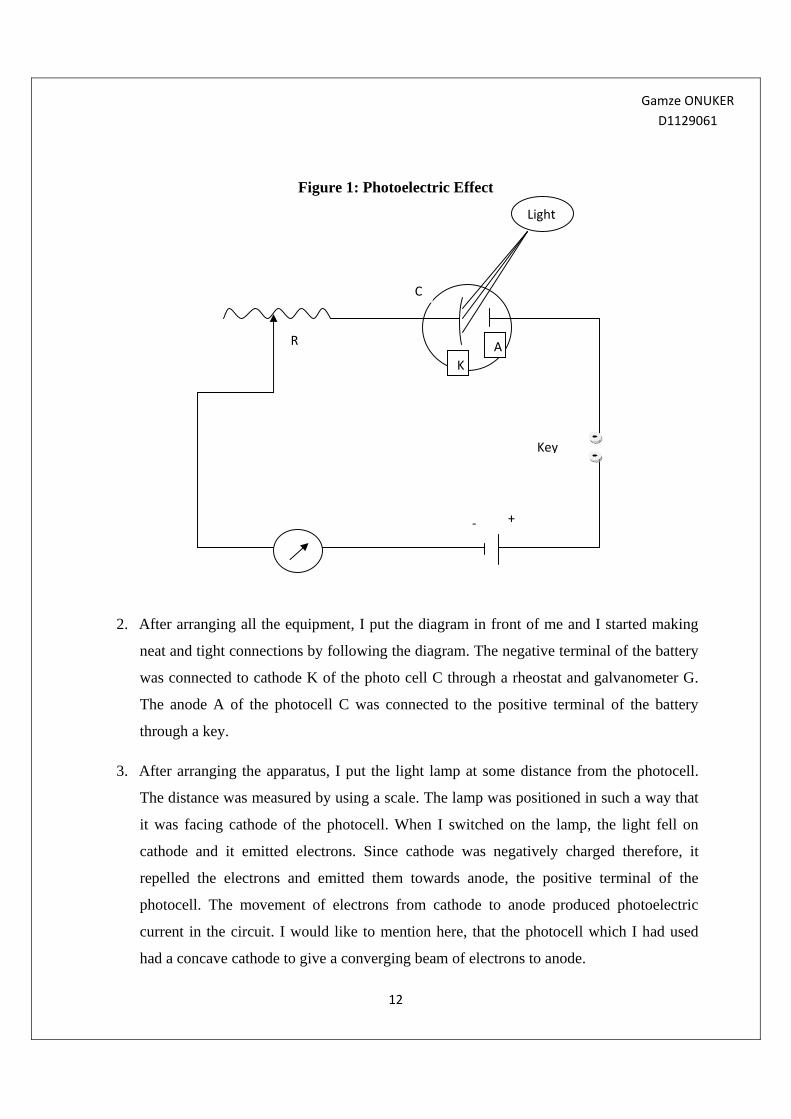
Figure 1: Photoelectric Effect
2. After arranging all the equipment, I put the diagram in front of me and I started making
neat and tight connections by following the diagram. The negative terminal of the battery
was connected to cathode K of the photo cell C through a rheostat and galvanometer G.
The anode A of the photocell C was connected to the positive terminal of the battery
through a key.
3. After arranging the apparatus, I put the light lamp at some distance from the photocell.
The distance was measured by using a scale. The lamp was positioned in such a way that
it was facing cathode of the photocell. When I switched on the lamp, the light fell on
cathode and it emitted electrons. Since cathode was negatively charged therefore, it
repelled the electrons and emitted them towards anode, the positive terminal of the
photocell. The movement of electrons from cathode to anode produced photoelectric
current in the circuit. I would like to mention here, that the photocell which I had used
had a concave cathode to give a converging beam of electrons to anode.
R
K
A
Key
‐ +
Light
C
Gamze ONUKER
D1129061
13
4. When I ensured that the apparatus was well arranged and photoelectric current was being
produced, I changed the distance of the lamp from cathode of photocell and noted down
the new distance. While changing the distance I checked the deflection in the
Microammeter. I noted down the reading of deflection of Microammeter.
The relation between intensity of illumination and distance is as follows:
I = constant/d2
It means that intensity of light is inversely proportional to the square of distance. Since I
was taking the readings of distance and galvanometer therefore, this formula could be
used to determine the intensity of light.
One thing which I considered while changing the distance was that whenever I changed
the distance of the lamp from the cathode, I moved the lamp linearly, to keep the angle of
incident rays same from the cathode.
5. I took few readings of distance of lamp from cathode of photocell and deflections in
Microammeter. Since I did not change the angle at which light was falling on the
cathode, therefore, I ensured that the relation between intensity of light and square of
distance was linear.
I = constant/d2
I = 1/d2
Since, constant = 1 (as there was no change in angle and relationship is linear)
Gamze ONUKER
D1129061

14
6. After taking all readings I plotted a graph between 1/ d2 and theta, which is the deflection
in galvanometer. The graph which I plotted was a straight line and it was showing the
direct relationship between photoelectric current and incident light.
Precautions and Sources of Error
It was a very simple experiment however, in order to avoid the impact of other factors on the
experiment, I took following precautions:
i. I took distance readings by placing the lamp at larger distance and then I changed the
lamp with regular steps. The reason was that the smaller values of distance might have
reduced the accuracy of readings.
ii. The same light source was used for all readings to keep the frequency constant. However,
before conducting the experiment, I ensured that no other electric source was attached to
the apparatus and the light of right frequency was selected. Furthermore, all other lights
of the laboratory were switched off before performing the experiment.
iii. There are two kinds of photocells available in the laboratory including those which have
external voltage source and those which do not have external voltage source. I performed
the experiment by using the one without external voltage source.
iv. To make my readings précised I used a Microammeter and my readings of current were
measured in Microampere. Although a sensitive galvanometer could be also used
however, a galvanometer is typically used to check the effect of photoelectric effect only
and it does not give precise measurements of current.
v. In order to avoid the inconsistency in data the distance of lamp from cathode was
changed linearly without changing the angle at which light falls on cathode.
vi. The photocell was not exposed to stray light because it could have distorted the aim of
keeping the same frequency of light.
Gamze ONUKER
D1129061
15
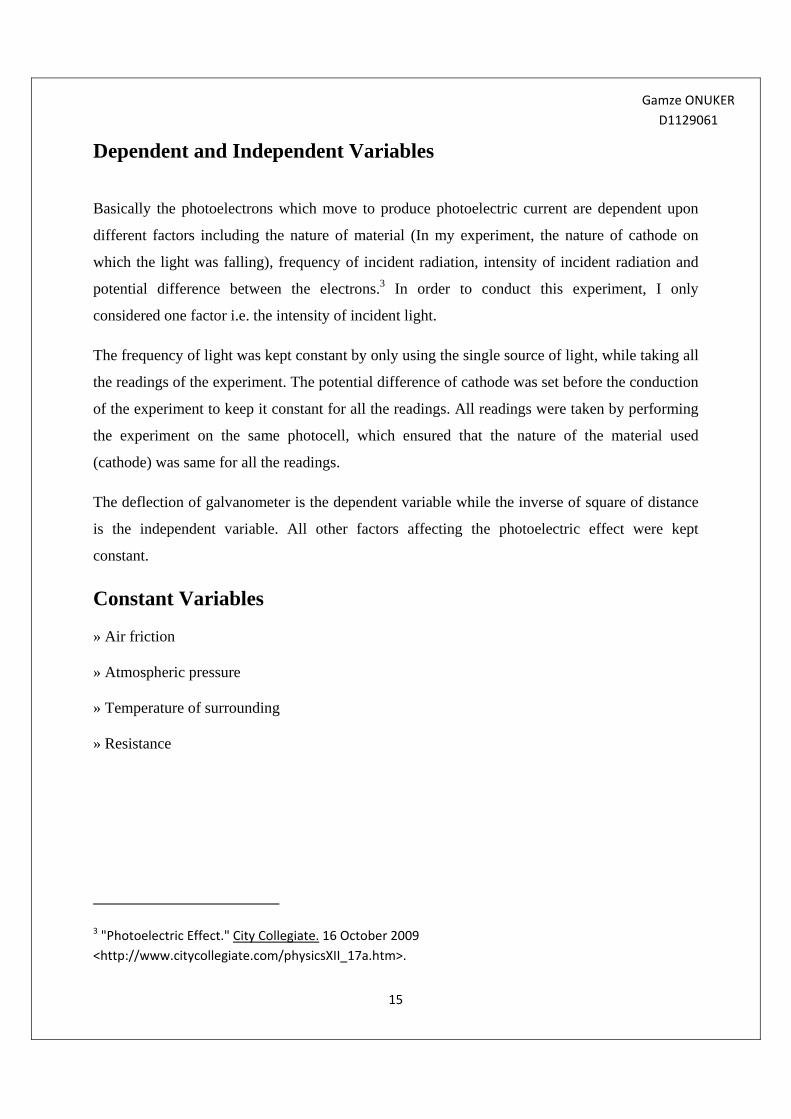
Dependent and Independent Variables
Basically the photoelectrons which move to produce photoelectric current are dependent upon
different factors including the nature of material (In my experiment, the nature of cathode on
which the light was falling), frequency of incident radiation, intensity of incident radiation and
potential difference between the electrons.3 In order to conduct this experiment, I only
considered one factor i.e. the intensity of incident light.
The frequency of light was kept constant by only using the single source of light, while taking all
the readings of the experiment. The potential difference of cathode was set before the conduction
of the experiment to keep it constant for all the readings. All readings were taken by performing
the experiment on the same photocell, which ensured that the nature of the material used
(cathode) was same for all the readings.
The deflection of galvanometer is the dependent variable while the inverse of square of distance
is the independent variable. All other factors affecting the photoelectric effect were kept
constant.
Constant Variables
» Air friction » Atmospheric pressure » Temperature of surrounding » Resistance
3 "Photoelectric Effect." City Collegiate. 16 October 2009
<http://www.citycollegiate.com/physicsXII_17a.htm>.
Gamze ONUKER
D1129061
16
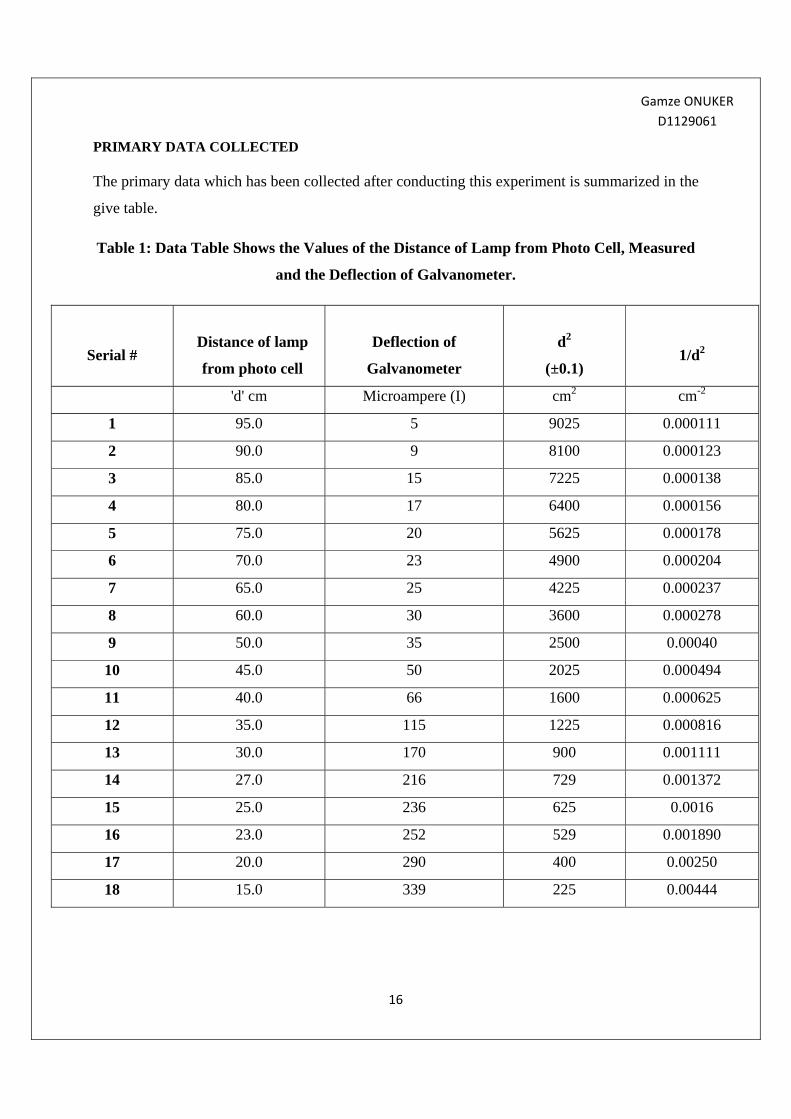
PRIMARY DATA COLLECTED
The primary data which has been collected after conducting this experiment is summarized in the
give table.
Table 1: Data Table Shows the Values of the Distance of Lamp from Photo Cell, Measured
and the Deflection of Galvanometer.
Serial #
Distance of lamp
from photo cell
Deflection of
Galvanometer
d2
(±0.1)
1/d2
'd' cm Microampere (I) cm2 cm-2
1 95.0 5 9025 0.000111
2 90.0 9 8100 0.000123
3 85.0 15 7225 0.000138
4 80.0 17 6400 0.000156
5 75.0 20 5625 0.000178
6 70.0 23 4900 0.000204
7 65.0 25 4225 0.000237
8 60.0 30 3600 0.000278
9 50.0 35 2500 0.00040
10 45.0 50 2025 0.000494
11 40.0 66 1600 0.000625
12 35.0 115 1225 0.000816
13 30.0 170 900 0.001111
14 27.0 216 729 0.001372
15 25.0 236 625 0.0016
16 23.0 252 529 0.001890
17 20.0 290 400 0.00250
18 15.0 339 225 0.00444
Gamze ONUKER
D1129061
17
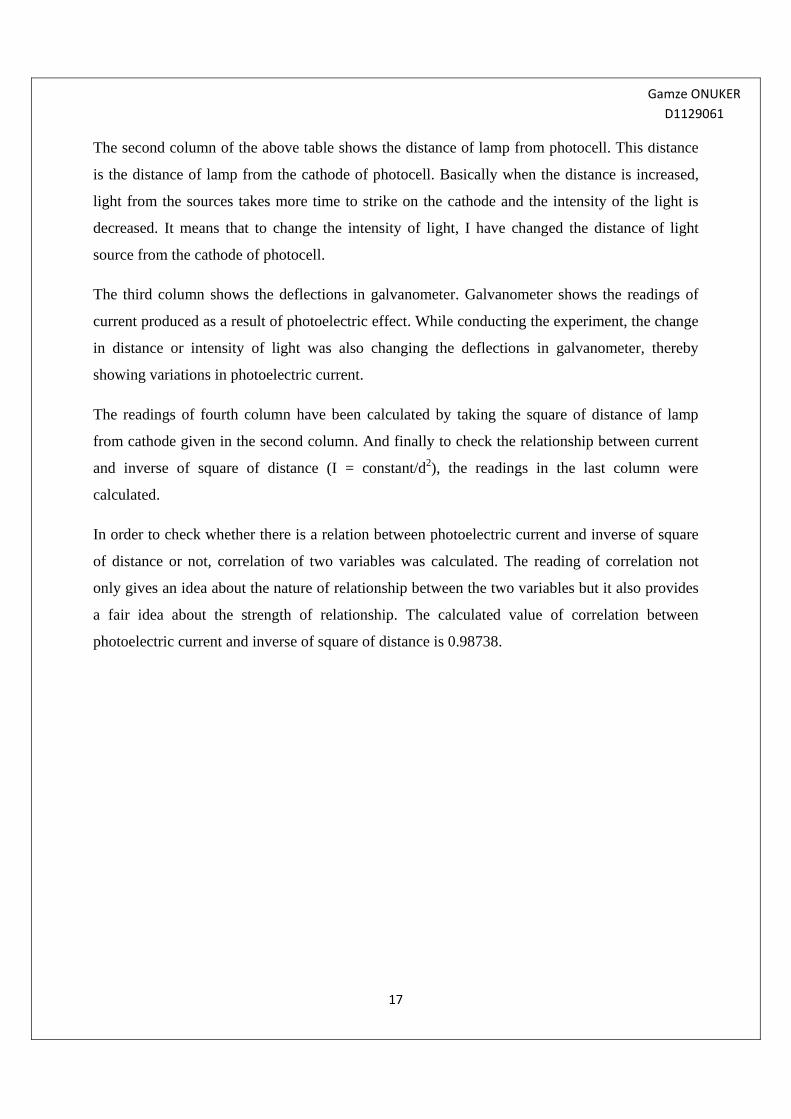
The second column of the above table shows the distance of lamp from photocell. This distance
is the distance of lamp from the cathode of photocell. Basically when the distance is increased,
light from the sources takes more time to strike on the cathode and the intensity of the light is
decreased. It means that to change the intensity of light, I have changed the distance of light
source from the cathode of photocell.
The third column shows the deflections in galvanometer. Galvanometer shows the readings of
current produced as a result of photoelectric effect. While conducting the experiment, the change
in distance or intensity of light was also changing the deflections in galvanometer, thereby
showing variations in photoelectric current.
The readings of fourth column have been calculated by taking the square of distance of lamp
from cathode given in the second column. And finally to check the relationship between current
and inverse of square of distance (I = constant/d2), the readings in the last column were
calculated.
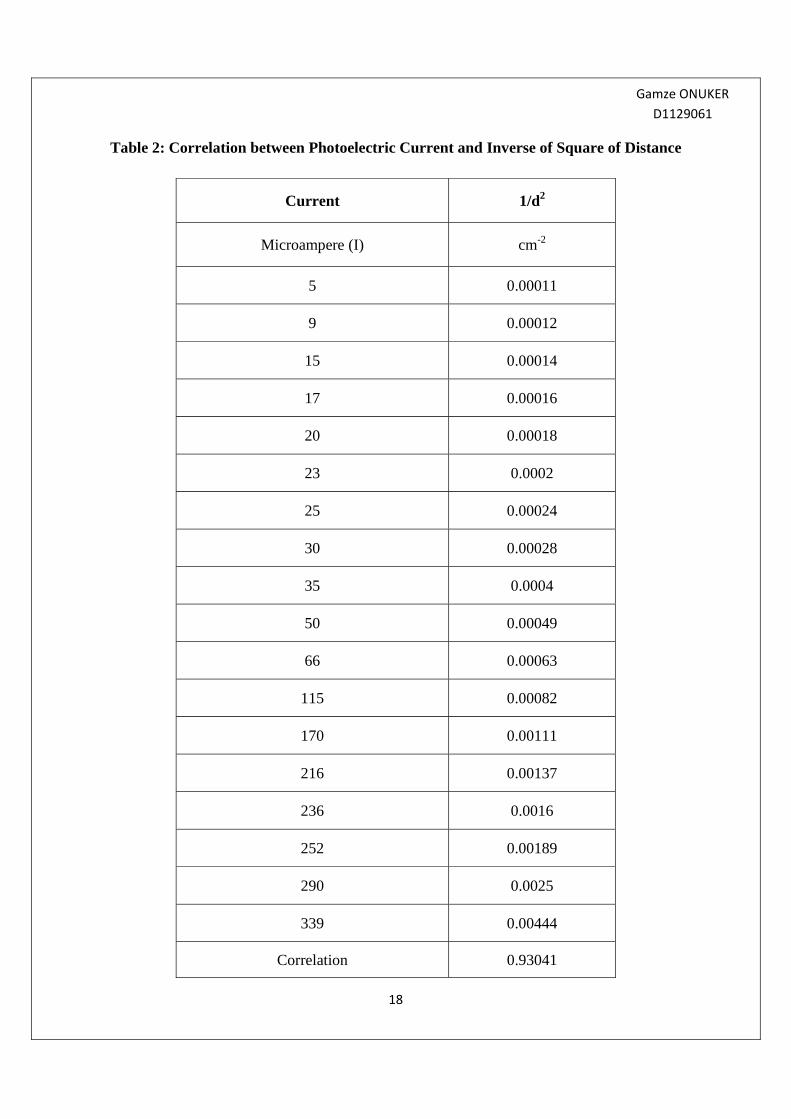
In order to check whether there is a relation between photoelectric current and inverse of square
of distance or not, correlation of two variables was calculated. The reading of correlation not
only gives an idea about the nature of relationship between the two variables but it also provides
a fair idea about the strength of relationship. The calculated value of correlation between
photoelectric current and inverse of square of distance is 0.98738.
Gamze ONUKER
D1129061
18
Table 2: Correlation between Photoelectric Current and Inverse of Square of Distance
Current 1/d2
Microampere (I) cm-2
5 0.00011
9 0.00012
15 0.00014
17 0.00016
20 0.00018
23 0.0002
25 0.00024
30 0.00028
35 0.0004
50 0.00049
66 0.00063
115 0.00082
170 0.00111
216 0.00137
236 0.0016
252 0.00189
290 0.0025
339 0.00444
Correlation 0.93041
Gamze ONUKER
D1129061
19
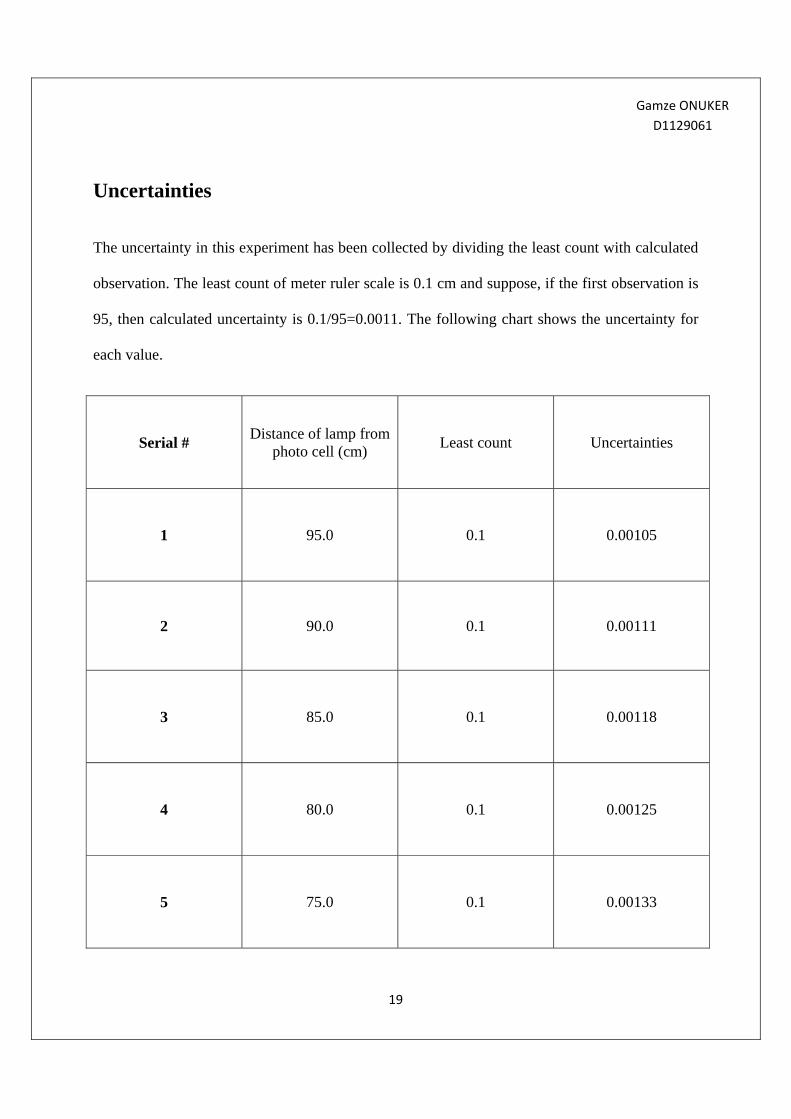
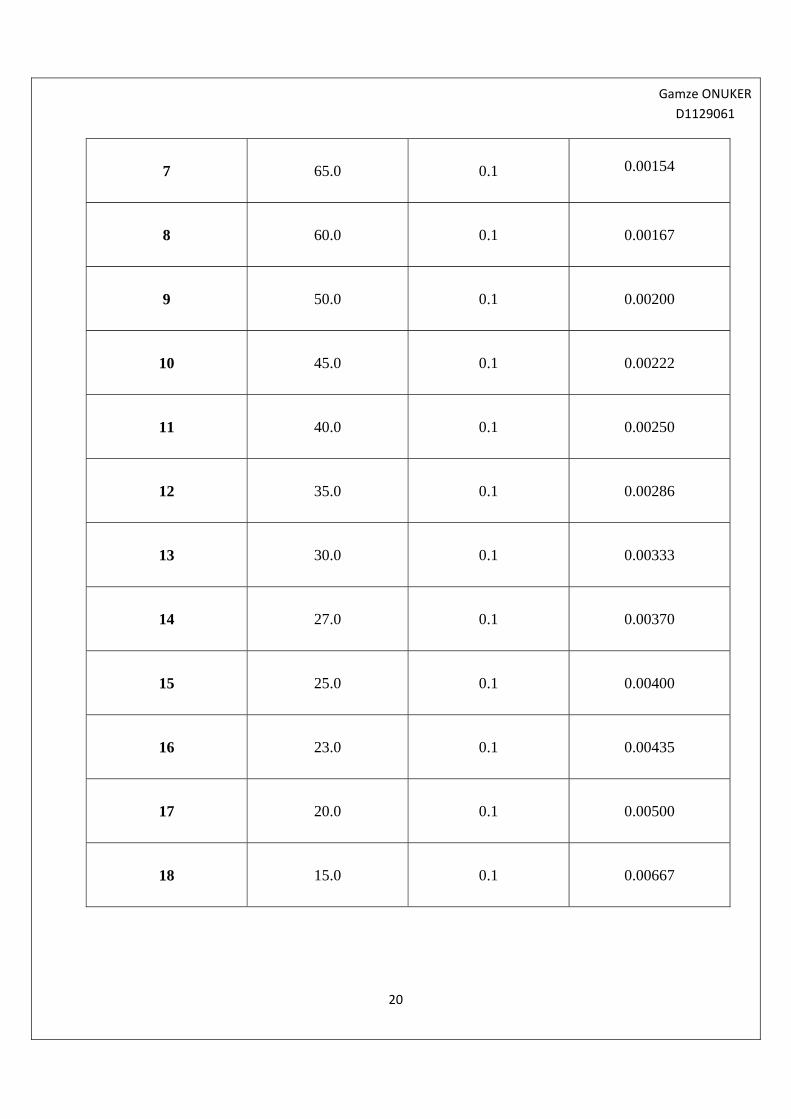
Uncertainties
The uncertainty in this experiment has been collected by dividing the least count with calculated
observation. The least count of meter ruler scale is 0.1 cm and suppose, if the first observation is
95, then calculated uncertainty is 0.1/95=0.0011. The following chart shows the uncertainty for
each value.
Serial # Distance of lamp from
photo cell (cm) Least count Uncertainties
1 95.0 0.1 0.00105
2 90.0 0.1 0.00111
3 85.0 0.1 0.00118
4 80.0 0.1 0.00125
5 75.0 0.1 0.00133
Gamze ONUKER
D1129061
20
7 65.0 0.1
0.00154
8 60.0 0.1 0.00167
9 50.0 0.1 0.00200
10 45.0 0.1 0.00222
11 40.0 0.1 0.00250
12 35.0 0.1 0.00286
13 30.0 0.1 0.00333
14 27.0 0.1 0.00370
15 25.0 0.1 0.00400
16 23.0 0.1 0.00435
17 20.0 0.1 0.00500
18 15.0 0.1 0.00667
Gamze ONUKER
D1129061
21
ANALYSIS
The analysis of the primary data collected from the experiment is based on the correlation of
variable and graphical description. Although both tools of analysis provide information about
nature of relationship and strength however, their consolidated findings would made my results
reliable.
Correlation
The correlation of variations in photoelectric effect and inverse of square of distance is about
0.93. Although this value is below that 1.0 however, it shows that there is a significant positive
relationship between the two variables. In other words, it shows that there is a positive
relationship between variations of photoelectric current and intensity of light. Though the
correlation is not perfectly 1.0 however, it is very significant.
Therefore, correlation analysis shows that increasing intensity of light has a positive effect on
variations of photoelectric current.
Graphical Explanation
The theoretical explanation of variations of photoelectric current by changing the intensity of
light gives the following graph (Graph 1). This graph shows that there is a linear positive
relationship between current and inverse of square of distance.
Gamze ONUKER
D1129061
22
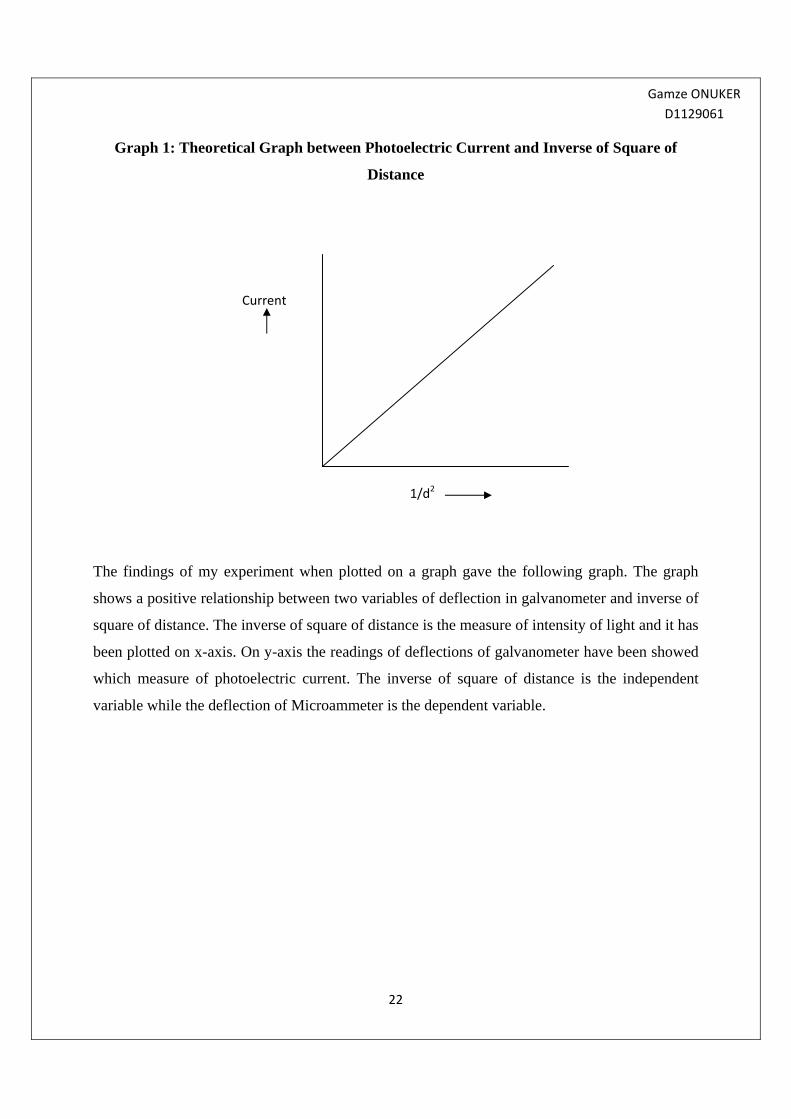
Graph 1: Theoretical Graph between Photoelectric Current and Inverse of Square of
Distance
The findings of my experiment when plotted on a graph gave the following graph. The graph
shows a positive relationship between two variables of deflection in galvanometer and inverse of
square of distance. The inverse of square of distance is the measure of intensity of light and it has
been plotted on x-axis. On y-axis the readings of deflections of galvanometer have been showed
which measure of photoelectric current. The inverse of square of distance is the independent
variable while the deflection of Microammeter is the dependent variable.
1/d2
Current
Gamze ONUKER
D1129061
23
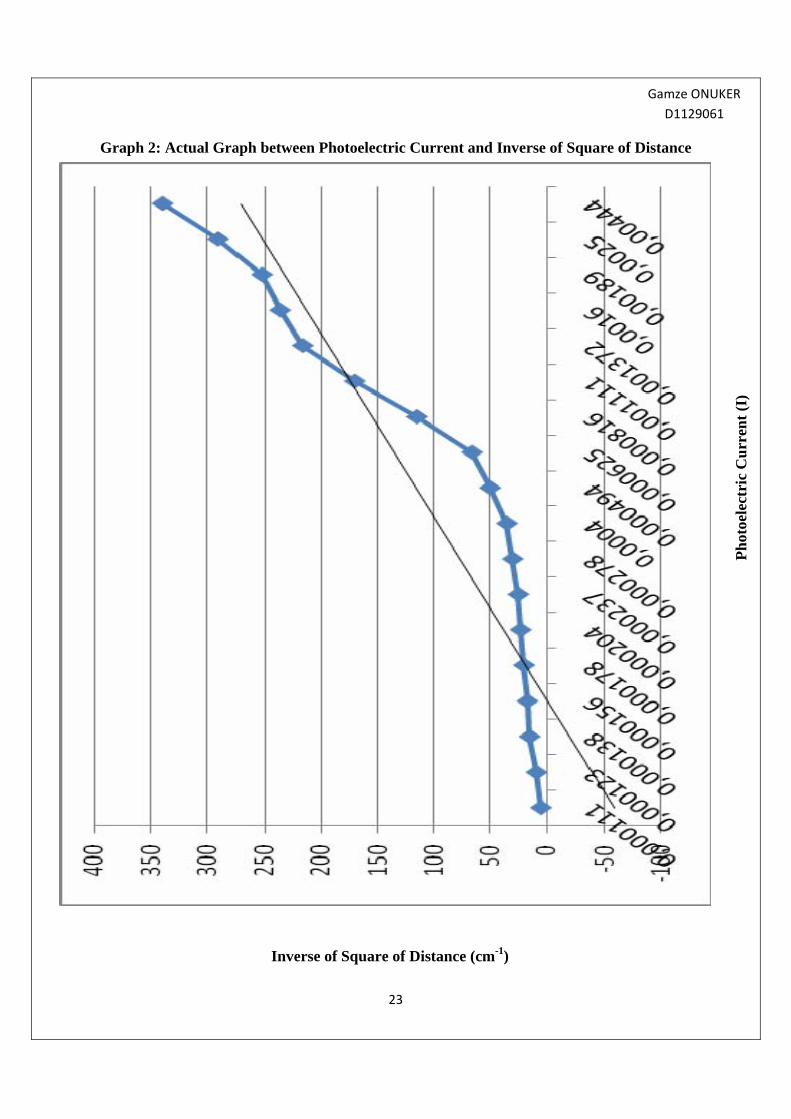
Graph 2: Actual Graph between Photoelectric Current and Inverse of Square of Distance
Ph
otoe
lect
ric
Cu
rren
t (I
)
Inverse of Square of Distance (cm-1)
Gamze ONUKER
D1129061
24
The Graph 2 shows that there is a positive relationship between the deflections in galvanometer
and inverse of square of distance. Apart from that, the graph also shows that it is a considerable
linear relationship. The line drawn between the two variables is not completely linear which
might have caused because of the errors in the experiment. It is agreed that the graph line is not
completely linear however; the trend line clearly shows a completely positive relationship
between photoelectric current and inverse of distance.
Therefore, graphical analysis shows that increasing intensity of light has a positive effect on
variations of photoelectric current.
On the basis of correlation analysis and graphical analysis, it is evident that variations of
photoelectric current are caused by changing the intensity of light. Now, I would explain the
reason because of which this phenomenon occurs.
Basically photoelectric current is produced as a result of photoelectric effect when light strikes
on the surface of matter. The beam of light knocks out electron from the surface of matter, which
flow and produce photoelectric current. When the intensity of light is increased, it gets more
photons or packets of energy. The light of high intensity when strikes the surface of matter
knocks out more electrons thereby, increasing the flow of electrons. As a result of increasing
flow of electrons more photoelectric current is produced.
However, if the frequency of the light that is striking the surface of matter is not equal or greater
than the threshold frequency or in other words, if a single photon is not energetic enough to
knock down an electron from the surface of matter, then photoelectric current is not produced no
matter how intense the light is.
Gamze ONUKER
D1129061

25
CONCLUSION AND EVALUATION
From the analysis of findings of experiment it is evident that all results are in agreement with
previous studies. The method which I have used to explain the effect of intensity of light on
photoelectric current has highlighted a positive linear relationship with only slight deviations. I
believe that these issues might have resolved by changing the distance more accurately and by
taking the readings of Microammeter more precisely. However, very small readings of
Microammeter prevented me from doing so. Based on the analysis and evaluation of my findings, it
can be concluded that photoelectric effect is a very important process because of its various applications
in our daily life. The photoelectric current which is produced as a result of this phenomenon shows
variations when intensity of light is changed. There is a linear positive relationship between intensity of
light and variations in photoelectric current because when intensity of light increases, more photons
knock out more electrons, thereby, increasing the photoelectric current. However, this relationship only
exists when the frequency of light being used is greater than the threshold frequency.
Sources of Error
One limitation of our experiment is that whilst conducting the experiment, we could not control the
external variables; therefore, our experimental results deviated from expected theoretical results. In order
to check out the extent to which error occurs in this experiment, the percentage error has been collected.
Gamze ONUKER
D1129061
26
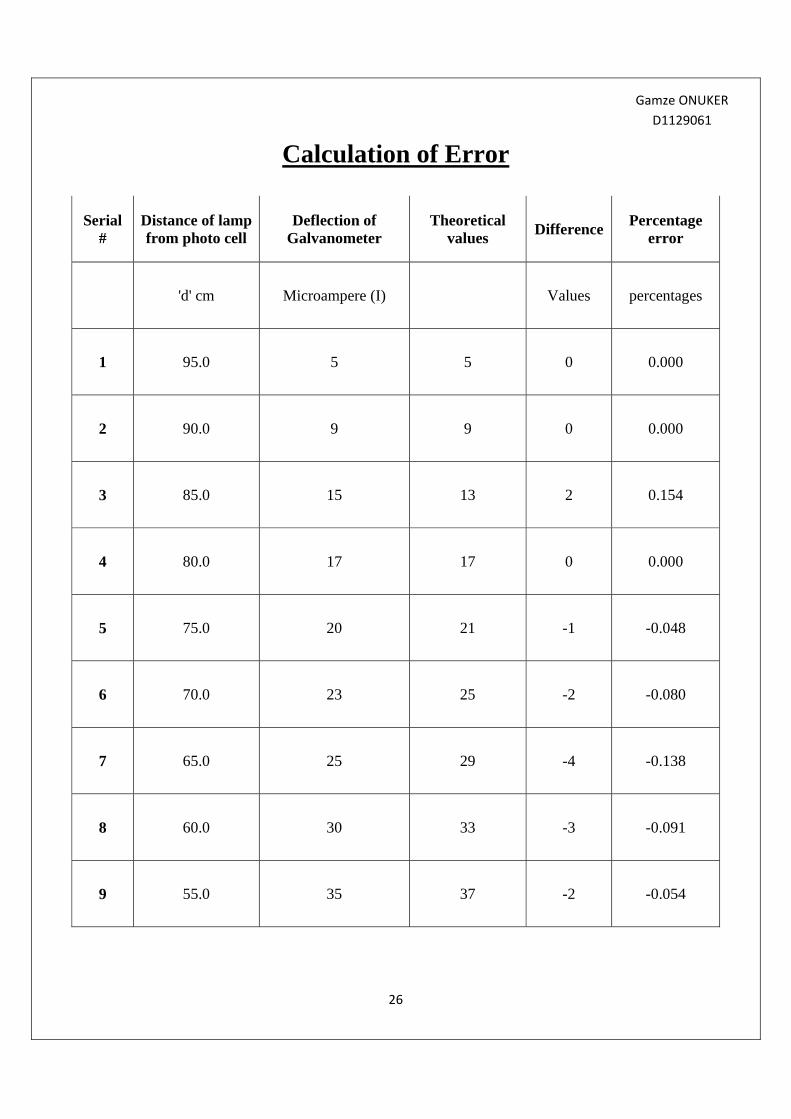
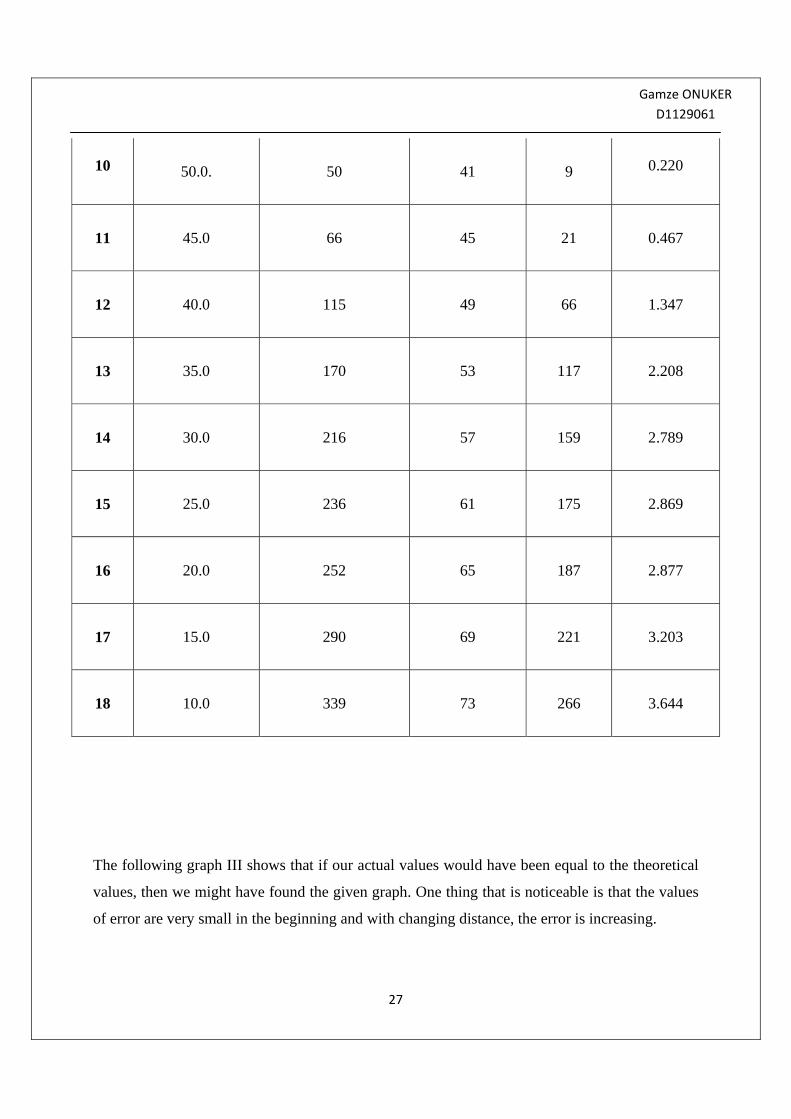
Calculation of Error
Serial #
Distance of lamp from photo cell
Deflection of Galvanometer
Theoretical values
Difference Percentage
error
'd' cm Microampere (I) Values percentages
1 95.0 5 5 0 0.000
2 90.0 9 9 0 0.000
3 85.0 15 13 2 0.154
4 80.0 17 17 0 0.000
5 75.0 20 21 -1 -0.048
6 70.0 23 25 -2 -0.080
7 65.0 25 29 -4 -0.138
8 60.0 30 33 -3 -0.091
9 55.0 35 37 -2 -0.054
Gamze ONUKER
D1129061
27
10 50.0. 50 41 9
0.220
11 45.0 66 45 21 0.467
12 40.0 115 49 66 1.347
13 35.0 170 53 117 2.208
14 30.0 216 57 159 2.789
15 25.0 236 61 175 2.869
16 20.0 252 65 187 2.877
17 15.0 290 69 221 3.203
18 10.0 339 73 266 3.644
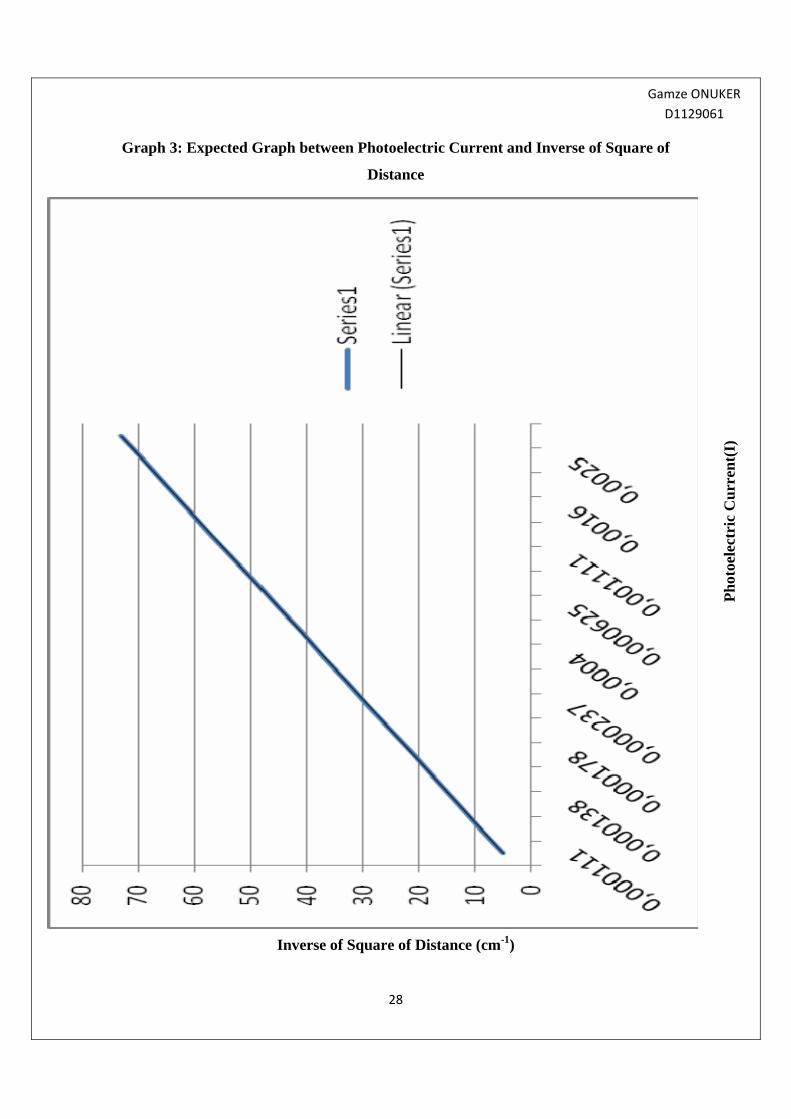
The following graph III shows that if our actual values would have been equal to the theoretical
values, then we might have found the given graph. One thing that is noticeable is that the values
of error are very small in the beginning and with changing distance, the error is increasing.
Gamze ONUKER
D1129061
28
Graph 3: Expected Graph between Photoelectric Current and Inverse of Square of
Distance
Inverse of Square of Distance (cm-1)
Ph
otoe
lect
ric
Cu
rren
t(I)
Gamze ONUKER
D1129061

29
¤ In order to get better results and to make this experiment better, the apparatus needs to be very
accurate. For measuring the distance accurately, a good length should be used with least error. Controlling
the external conditions such as air friction and atmospheric conditions was not really possible for us,
however, by performing this experiment, under completely controlled conditions, the percentage error can
be reduced.
Gamze ONUKER
D1129061
30
BIBLIOGRAPHY
Javier, Duarte. M. G. The Photoelectric Effect: Determination of Planck’s Constant. 25 September 2008.
"Photoelectric Effect." City Collegiate. 16 October 2009 <http://www.citycollegiate.com/physicsXII_17a.htm>.
Subhrajyoti, Maji. The General Science Journal. 15 October 2009 <http://www.wbabin.net/science/maji4.pdf>
Gamze ONUKER
D1129061