Embed Size (px)
Citation preview
chapter
Physico-chemical
Parameters
29
CHAPTER 3
PHYSICO-CHEMICAL PARAMETERS
3.1 Introduction
Water is ‘life’. It is one of the basic needs in the world. Water is probably the
only natural resource to touch all aspects of human civilization from agricultural and
industrial development to cultural and religious values rooted in society. The total
amount of water on the earth is about 1.35 billion cubic kilometers. About 97.1 % has
been locked into oceans as saltwater. Ice sheets and glaciers have arrested 2.1 %, and
only 0.2 % is the fresh water present on the earth, which can be used by human for
variety of purposes. Remaining 0.6 % is in underground form and India has 4% of
water resources of the world, while it has to support 16% of the world population and
15% of livestock, unfortunately it has been getting polluted day by day due to
different anthropogenic activities. So it is necessary to conserve the water and prevent
it from every type of pollution. There should be proper investigation of quality and
management of water. This could be possible by continuous water quality monitoring.
Freshwater is one of the basic needs of the mankind and is vital to all forms of life. It
exists in lentic and lotic habitats. All the lentic habitats, such as reservoirs, ponds and
lakes, are extremely important as they are endowed with abundance of other natural
resources too. Dams are also called artificial lakes. In order to fulfill the various needs
of man, dams have been constructed across the rivers so as to form a pool of water on
the upstream side of the barrier. These artificial lakes are called water reservoirs. The
quality of this reservoir water is not much different from that of a natural lake. The
water stored in the reservoir can be used easily not only for water supplies but also for
irrigation, hydroelectric power generation and aquaculture. It also enhances the
aesthetic as well as ecological value of the area.
Water has a unique place on planet as it supports life on earth. The entire
fabric of life is woven around it. Man uses this important resource collected in
depressions on earth or creates depressions by blocking the streams and constructing
reservoirs, because of industrial development and unplanned urbanization. This
important resource for life has been polluted to a point of crisis. A healthy
environment is necessary for any organism, since life depends upon the continuance
of a proper exchange of essential substances and energies between the organisms and
30
its surroundings (Welch, 1952)
The adverse impact is felt on the unique physical and chemical properties of
water. The fish and other organisms that inhabit these reservoirs are also affected
which in turn influence the functions of the reservoir. Water Quality is important for
drinking, irrigation, fish production, recreation and other purposes. The water quality
deterioration in reservoirs usually results from acidification, heavy metal
contamination, organic pollution, obnoxious fishing practices and excessive nutrient
input that leads to eutrophication. The effects of these imports into the reservoir not
only affect the socio-economic functions of the reservoir negatively, but also lead to
the loss of structural biodiversity of the reservoir. The physico-chemical properties of
water quality assessment give a proper indication of the status, productivity and
sustainability of a water body. The changes in the physico-chemical characteristics
like temperature and chemical elements of water such as dissolved oxygen, nitrates
and phosphates provide valuable information on the quality of the water, the source
(s) of the variations and their impacts on the functions and biodiversity of the
reservoir.
Hence, the consideration of the physico-chemical factors in the study of
limnology is basis for the understanding of trophic dynamics of the water body. The
physical and chemical properties of water immensely influence uses of a water body
for the distribution and richness of biota. Each factor plays its own role but at the
same time the final effect is the actual result of the interactions of all the factors.
These factors serve as a basis for the richness or otherwise biological productivity of
any aquatic environment. Looking at the importance of understanding physico-
chemical properties of water in a water body for supporting various biota, a study was
planned to find out physico-chemical status of water of Budki M.I. Tank, a perennial
water body present at Budki. Following parameters we considered for the study.
3.1.1 Temperature (Temp.)
Temperature is a measure of the intensity (not the amount) of heat stored in a
volume of water measured in calories and is the product of the weight of the
substance (in grams), temperature (°C) and the specific heat (Cal/gram °C).
Temperature of water may not be as important in pure water because of the wide
range of temperature tolerance in aquatic life, but in polluted water, temperature can
31
have profound effects on dissolved oxygen (DO) and biological oxygen demand
(BOD)
In general atmospheric ambient and water temperature depend on
geographical location and meteorological conditions such as rainfall, humidity, cloud
cover, wind velocity, etc. Atmospheric temperature is a measure of temperature at
different levels of earth surface. It is governed by many factors including incoming
solar radiation, humidity and altitude. Atmospheric temperature varies as one move
vertically upwards from the earth's surface. The atmospheric and water temperature
go more or less hand in hand (Macan, 1958). Water temperature is an important
factor which influences the chemical, biochemical and biological characteristics of
water body. Water temperature is of enormous significance as it regulates various
abiotic characteristics and activities of an aquatic ecosystem (Hutchinson, 1957 and
Kataria et. al., 1995).
3.1.2 Water cover (WC)
In Indian climatic conditions the water level of any fresh water body fluctuates
seasonally influencing water cover. The rate of inflow and outflow of water with
resultant water level have a direct bearing on productivity of water body as the sudden
fluctuations directly affect the biotic communities. Plankton, benthos and periphyton
pulses coincide with the months of least water fluctuations, that is, all the
communities are at their ebb during the months of maximum levels and water
discharge (Sugunan and Pathak, 1986). The spillway discharge, apart from dislodging
the standing crop of plankton, removes the oxygenated clear water of the top layer,
leaving the oxygen deficient bottom water. Conversely, the deep drawdown removes
the decomposing material including nutrients (Jhingran, 1975). Percentage of shallow
area (littoral formation), which varies at different seasons depending on the contour of
water body, is also an indicator of productive nature of the Lakes (Sugunan, 2000).
An irregular shoreline encompasses more littoral formation and areas of land and
water interface. Thus, a high value of shoreline development index is believed to be
indicative of productive nature of the water body. High shoreline indices of Hirakud
(13.5), Gobindsagar (12.26), Tilaiya (9.12), Konar (8.78), Nagarjunsagar (7.89) and
Rihand (7.04) have been correlated to a moderate to rich plankton community
(Sugunan, 2000).
32
3.1.3 Transparency (Trans.)
Transparency is a characteristic of water that varies with the combined effect
of colour and turbidity. It measures the depth to which light penetrates in the water
body. Transparency gives an idea about the degree of suspended particles in the
water, which in turn affects the light penetration (Verma et.al., 1980). Clear water
permits light to penetrate more deeply into the lake than does cloudy water. This light
allows photosynthesis and production of oxygen in deeper water while pollution tends
to reduce water clarity.
Evaluation of the vertical extinction and spectral characteristics of light in
natural waters is commonly accomplished in situ with modern underwater quantum
sensors. The Secchi disc transparency is essentially a function of the reflection of
light from its surface and is therefore influenced by the absorption characteristics of
both, the water and its dissolved and particulate matter. The Secchi disc
transparencies range from few centimeters in turbid reservoirs to over 40 m in a few
rare clear lakes. The Secchi disc transparency correlates closely with the percentage
transmission of light. Higher water transparency is recorded at the beginning of dry
season as a consequence of reduced rain (Cleber and Giani, 2001). Transparency of
water is generally influenced by factors like wind action, plankton concentration,
suspended silt particles and decomposition of organic matter at the bottom.
3.1.4 Total solids (TS), Total suspended solids (TSS) and Total dissolved solids
(TDS)
Total solids are dissolved solids plus suspended and settleable solids in water.
In stream water, dissolved solids consist of calcium, chlorides, nitrates, phosphorus,
iron, sulfur, and other ion particles that will pass through a filter with pores of around
2 microns (0.002 cm) in size. Suspended solids include silt and clay particles,
plankton, algae, fine organic debris, and other particulate matter. These are particles
that will not pass through a 2-micron filter. A high concentration of total solids will
make drinking water unpalatable and might have an adverse effect on people who are
not used to drinking such water.
Total suspended solids (TSS) include all particles suspended in water which
will not pass through a filter. Suspended solids are present in sanitary wastewater and
many types of industrial waste water. There are also nonpoint sources of suspended
33
solids, such as soil erosion from agricultural and construction sites. As levels of TSS
increase, a water body begins to lose its ability to support a diversity of aquatic life.
Suspended solids absorb heat from sunlight, which increases water temperature and
subsequently decreases levels of dissolved oxygen (warmer water holds less oxygen
than cooler water). Some cold water species, such as trout and stoneflies, are
especially sensitive to changes in dissolved oxygen. Photosynthesis also decreases,
since less light penetrates the water. As less oxygen is produced by plants and algae,
there is a further drop in dissolved oxygen levels. TSS can also destroy fish habitat
because it can harm fish directly by clogging gills, reducing growth rates, and
lowering resistance to disease. Most people consider water with a TSS concentration
less than 20 mg/L to be clear. Water with TSS levels between 40 and 80 mg/L tends
to appear cloudy, while water with concentrations over 150 mg/L usually appears
dirty. The nature of the particles that comprise the suspended solids may cause these
numbers to vary.
Total dissolved solids (TDS) comprise inorganic salts and small amounts of
organic matter that are dissolved in water. The principal constituents are usually the
cations Calcium, Magnesium, Sodium and Potassium and the anions carbonate,
bicarbonate, chloride, sulphate and, particularly in groundwater, nitrate (from
agricultural use). (TDS) are solids in water that can pass through a filter (usually with
a pore size of 0.45 micrometers). TDS is a measure of the amount of material
dissolved in water. This material can include carbonates, bicarbonates, chlorides,
sulfates, phosphates, nitrates, Calcium, Magnesium, Sodium, organic ions, and other
ions. A certain level of these ions in water is necessary for aquatic life. Some
dissolved solids come from organic sources such as leaves, silt, plankton, and
industrial waste and sewage, other sources come from runoff from urban areas, road
salts used on street during the winter, and fertilizers and pesticides used on lawns and
farms.
As per APHA (1998), solids refer to the matter that is suspended or dissolved
in the water or waste water. The total suspended solids (TSS), is a portion of total
solids (TS) retained by a filter while the total dissolved solids (TDS) are the in
filterable solids, mostly inorganic salts and small amount of organic matter dissolved
in the water. These have been proved to be very useful parameters in determining the
productivity of water, and of biological and physical waste water treatment processes.
34
A limit of 500 mg/L TDS is permissible in drinking water. The concentration of total
dissolved solid gives an idea about suitability of this water for various uses including
potability of water (Trivedy, 1995).Water in nature contains both organic and
inorganic solids varying both qualitatively and quantitatively with the season. TDS
may affect the water quality adversely in a number of ways. Waters with highly
dissolved solids are generally of inferior potability and may induce an unfavorable
physiological reaction in the transient consumer. Highly mineralized water is not
suitable for many industrial applications (APHA, 1985) as it increases hardness and
corrosive properties of the water and may create an imbalance for the aquatic life,
whereas the suspended sediments are probably key factors controlling the availability
of light.
The amount of hydrocarbonates and corresponding TDS in the water are
positively correlated with phytoplankton and zooplankton diversity (Karatayev et. al.,
2008). The wetlands act as sinks for the nutrient deposition and hence, the high TDS
value may also depends on the age of the lake (Anitha et. al., 2005) as a result of
gradual salt deposition.
3.1.5 pH (Potentia hydrogenii)
pH is the negative logarithm of hydrogen ion concentration, is one of the most
important and frequently used test in the water chemistry. It is a valuable indicator
for the acid alkali balance of water. Practically every phase of water supply and waste
water treatment of acid base neutralization and water softening, precipitation,
disinfection and corrosion control are pH dependent. In case of pollution by acidic
and alkaline wastes, the pH serves as an index to denote the extent of pollution. pH
changes in water are governed by the amount of free carbon-dioxide, carbonates and
bicarbonates. The alteration of hydrogen ion concentration of water is accompanied
by changes in other physico-chemical aspects. In addition to factors like temperature,
salinity, atmospheric pressure, disposal of industrial wastes, etc., biological factors
such as respiration and photosynthesis also influence pH.
The pH of water determines the solubility and biological availability of
certain chemical nutrients such as Phosphorus, Nitrogen, Carbon as well as heavy
metals like Lead, Copper, Cadmium, etc. It indicates how much and what form of
Phosphorus is most abundant in water and whether aquatic life can use the form
35
available. Metals tend to be more toxic at lower pH because they are more soluble in
acidic water. Measured on a scale of 0-14, pH of natural water usually lies in the
range of 4.4 to 8.5. The rise in pH parallels with the rise in carbonate alkalinity and
percentage of Oxygen saturation. It is probably not affected by photosynthetic
activity of a water body (Kobbia et. al., 1992; Kebede, 1996). A weak correlation
between pH and fresh water gastropod species richness has been established by
Sarkar and Hakuriat (1964) whereas, with temperature, pH has been considered to
cause summer minima of total phytoplankton density (Hujare, 2005). Further, Sharma
et.al, (2008) have described role of pH in formation of algal bloom too. Thus, pH
plays important role in controlling biotic community structure of a water body
3.1.6 Dissolved Oxygen ( DO)
Dissolved oxygen (DO) plays a vital role for the survival of organisms in a
water body, the presence of Oxygen is a positive sign and the absence of Oxygen is a
sign of severe pollution. Waters with consistently high dissolved oxygen are
considered to be stable aquatic systems capable of supporting many different kinds of
aquatic life. Dissolved oxygen (DO) refers to the volume of Oxygen that is contained
in water. Oxygen enters the water by photosynthesis of aquatic biota and by the
transfer of Oxygen across the air-water interface. The amount of Oxygen that can be
held by the water depends on the water temperature, salinity, and pressure. Gas
solubility increases with decreasing temperature (colder water holds more oxygen).
Gas solubility increases with decreasing salinity (freshwater holds more Oxygen than
does saltwater). Both the partial pressure and the degree of saturation of oxygen will
change with altitude. Finally, gas solubility decreases as pressure decreases. Thus, the
amount of Oxygen absorbed in water decreases as altitude increases because of the
decrease in relative pressure (Smith, 1990).
The concentration of DO diverse significantly over 24 hours, mostly due to
photosynthetic activity of plants. During the day time photosynthesis occurs and
release Oxygen into the water and during night, respiration occurs which remove
Oxygen from the water. In cold water the more oxygen can be dissolved therefore,
DO concentrations at one location are usually higher in the winter than in the summer.
During dry (summer) seasons, water levels decrease and the flow rate of a river slows
down. As the water moves slower, it mixes less with the air, and the DO concentration
36
decreases. During rainy seasons, Oxygen concentrations tend to be higher because the
rain interacts with Oxygen in the air as it falls. More sunlight and warmer
temperatures also bring increased activity levels in plant and animal life; depending
on what organisms are present, this may increase or decrease the DO concentration.
The aquatic plant density also affects the concentration of Oxygen, fewer plants grow
in winter because of cold temperature and shorter day length and more green plants
mean more photosynthesis, which produces more Oxygen during the day when the
sun is shining. The anthropogenic activities also change DO due to organic wastes,
urban runoff, removal of aquatic vegetation and construction of dams.
According to Ramchandra and Solanki (2007) dissolved Oxygen is essential
to the respiratory metabolism of most aquatic organisms. The dynamics of oxygen
distribution in inland waters are governed by a balance between inputs from the
atmosphere and photosynthesis and losses from the chemical and biotic oxidations.
DO is a very important parameter for the survival of fishes and other aquatic
organisms. It is also needed for many chemical reactions that are important for lake
functioning such as oxidation of metals, decomposition of dead and decaying matter
etc.
3.1.7 Carbon dioxide (CO2)
Free carbon dioxide is present in water in the form of a dissolved gas, surface
waters usually contain less than 10 ppm free carbon dioxide and some ground waters
may easily go beyond that concentration. Carbon dioxide is readily soluble in water;
over the ordinary temperature range (0-30 0C) the solubility is about 200 times that of
Oxygen. Calcium and Magnesium combine with carbon dioxide to form their
carbonates and bicarbonates. Aquatic plant life depends upon carbon dioxide and
bicarbonates in water for growth and microscopic life suspended in the water,
phytoplankton, as well as large rooted plants and utilize carbon dioxide in the
photosynthesis of plant materials such as starches, sugars, oils, proteins. The carbon
in all these materials comes from the carbon dioxide in water.
Free CO2 in water accumulates due to microbial activity and respiration of
organisms. It imparts the acidity to the water because of the formation of carbonic
acid. Photosynthesis and respiration are two major processes that influence the
amount of CO2 in water. Algae and submerged macrophytes require an abundant and
37
readily available source of Carbon for high sustainable growth. The dissolved carbon
dioxide influences water quality properties such as acidity, hardness and related
characteristics. Thus, it is essential that the rudiments of dissolved inorganic Carbon
reactivity be evolved. Hence, CO2 forms an important component in aquatic
ecosystem.
A high level of carbon dioxide usually indicates that there is a lot of dead
material undergoing decomposition. This may occur naturally, but could be the result
of different types of water pollution or water treatment. The carbon dioxide in a lake
is not constant but it changes. Dead organisms usually sink as a result the carbon
dioxide level caused by their decomposition is usually greater near the bottom of the
lake. The level of carbon dioxide will be higher at night because the plants will be
using Oxygen and producing carbon dioxide at the time. The carbon dioxide level
will be greater in the fall due to dead algae and animals that have died over the winter
and are now decaying and in terms of succession; an older lake will have more
carbon dioxide because of more decay due to more organisms.
3.1.8 Total hardness (TH)
Total hardness (Calcium and Magnesium) is an important parameter in the
detection of water pollution. It exists mainly as bicarbonates of Ca++ and Mg++ and to
a lesser degree in the form of Sulphates and Chlorides. Calcium is an essential
nutritional element for animal life and also aids in maintaining the structure of plant
cells and soil. Magnesium possesses no major concern with public health. Limits of
concentration of hardness set for water are based mainly on palatability, corrosion and
incrustation.
The water hardness is a traditional measure of the capacity of water to react
with soap. Hard water requires a considerable amount of soap to leather. Calcium and
Magnesium are the most abundant elements that render hardness to natural surface as
well as ground waters. They exist mainly as bicarbonates of (Ca++), (Mg++) and to a
lesser degree in the form of Sulphates (SO4-) and Chlorides (Cl-). Hardness caused
by, bicarbonates and carbonates of Calcium and Magnesium is called temporary
hardness whereas that caused by their sulphates and chlorides is called permanent
hardness. Natural hardness of water depends upon the geological nature of the
catchment area. It plays an important role in the distribution of aquatic biota and
38
many species are identified as indicators for hard and soft waters (Ramchandra et. al.,
2006). In the presence of carbon dioxide, calcium carbonate is dissolved in water. It
maintains the pH of the most natural waters between 6.0 to 8.0. However, dissolved
Magnesium concentrations are lower than Calcium for a majority of the natural
waters. Because of the high solubility of magnesium salts, this metal tends to remain
in solution and is less readily precipitated than Calcium. Calcium is an essential
nutrient element for animal life that aids in maintaining the structure of plant cells and
soils. The hardness may range from zero to hundreds of milligrams per liter
depending on the source and treatment to which the water has been subjected.
According to Larry (1996) total hardness observed for streams and rivers
throughout the world range between 1-1000 ppm as CaCO3. Hardness reflects the
composite measure of polyvalent cations whereas Calcium and Magnesium are the
primary constituent of hardness. Hardness value above 500mg/L is generally
unacceptable, although this level is tolerable in some communities (Zoeteman, 1980).
Total hardness is an important parameter in the detection of water pollution and
causes various diseases. Hardness of water is mainly caused by Calcium and
Magnesium in addition to water sulphates, nitrates, and silicates may also contribute
to hardness. Temporary hardness is caused by carbonate and bicarbonate ions and
they are removed by boiling of water on the other hand chlorides, sulphates and heavy
metals are difficult to remove. Hardness has been evaluated and correlated by
different workers for different purposes. Kudari et. al., (2006) classified water bodies
based on the hardness as slightly hard moderately hard and hard. While, Moshood,
(2008) stated that the utilization of Calcium and Magnesium ions by organisms
probably causes decrease in the concentration of total hardness in the dry season.
Higher hardness and conductivity of water in winter has been correlated to more
productive during this season. Hardness is very important parameter in decreasing the
toxic effects of poisonous elements.
3.1.9 Chlorides (Cl-)
The chloride concentration is one of the important indicators of water
pollution (Munawar, 1970 and Khare et. al., 2007). The maximum permissible limit
i.e. 500mg/L. for drinking water prescribed by WHO. According to Rajkumar et.
al.(2004) Chlorides occur naturally in all types of waters, high concentration of
39
chlorides is considered to be the indicators of pollution due to organic wastes of
animal or industrial origin and chlorides are troublesome in irrigation water and also
harmful to aquatic life. In high concentrations, chlorides in urban areas are indicators
of large amounts of non-point pollution; pesticides, grease and oil, metals and other
toxic materials with high levels of chlorides. Chlorides are commonly found in
sewage, streams and wastewater. Chlorides are leached from various rocks into soil
and water by weathering. The chloride ions highly mobile and is transported to closed
basins. Chloride increases the electrical conductivity of water and thus increases its
corrosivity. In metal pipes, chloride reacts with metal ions to form soluble salts, thus
increasing levels of metals in drinking water. In lead pipes, a protective oxide layer is
built up, but chloride enhances galvanic corrosion. It can also increase the rate of
pitting corrosion of metal pipes.
The concentrations of four major cations Ca++, Mg++, Na+ and K+ and four
major anions, HCO3-, CO3
-, SO4- and Cl-, usually constitute the total ionic salinity of
the water for all practical purposes. Of these chlorides influence, in general, osmotic
salinity balance and ion exchange. However, metabolic utilization does not cause
large variations in the spatial and seasonal distribution of chlorides within most lakes,
but high chloride content may indicate the pollution by sewage/ industrial waste or
intrusion of the saline water (APHA, 1998).
3.1.10 Nitrates (NO3-)
Nitrates are one of the most important nutrients in an aquatic ecosystem. They
are the highly oxidized form of nitrogen compounds commonly present in the natural
water. They are the products of the aerobic decomposition of nitrogenous matter
received from domestic sewage, agricultural runoff and industrial effluents. Nitrate is
an inorganic chemical that is highly soluble in water; major sources of nitrate in
drinking water contain fertilizers, sewage and animal manure. Nitrogen is a major
nutrient that affects the productivity of fresh water. Dominant forms of nitrogen in
fresh waters include dissolved molecular N2, ammonia (NH3), nitrite (NO2-), nitrate
(NO3-) and large number of organic compounds like amino acids, amines,
nucleotides, proteins and refractory humic compounds of low nitrogen content
(Wetzel, 2006). Most nitrogen containing materials in natural waters tend to be
converted to nitrate. Nitrates also occur naturally in the environment, in mineral
40
deposits, soil, seawater, freshwater systems, and the atmosphere.
Human activities and mainly those related to agriculture are a major cause of
the presence of nitrates and nitrites in surface water. These two substances are
responsible for many problems not only for environment but also for human health.
Indeed, although not directly toxic, they participate in eutrophication phenomena of
surface water. The nitrate concentration in the range (0-7.00 mg·/L), the nitrites
concentration in the range (0-0.28 mg·/L), and the ammonium ion concentration in the
range (0-0.03 mg·/L). This allows us to notice that the rates of nitrates obtained are
lower than the standards required which are in the order of 50 mg·/L. (WHO, 2004).
Their presence can be explained by an incomplete oxidation of the ammonia water or
a nitrate reduction reaction. This pollution can be caused by intense agricultural
activity (the studied region is known for its agricultural vocation) and misuse of
chemical fertilizers around the sewage waste water.
Nitrates generally occur in trace quantities in surface waters but may attain
low levels in ground water. However, the high amounts of nitrates are generally
indicative of water pollution. The runoff water coming from intensive agricultural
activities like use of fertilizers, also contributes to significant nitrate contents in
surface waters.
In 1974, Congress passed the Safe Drinking Water Act. This law requires EPA
to find out the level of contaminants in drinking water at which no complicated health
effects are likely to occur. These non-enforceable health goals, based solely on
possible health risks and exposure over a lifetime with an adequate margin of safety,
are called maximum contaminant level goals (MCLG). Contaminants are any
physical, chemical, biological or radiological substances or matter in water. The
MCLG for nitrate is 10 mg/L or 10 ppm. EPA has set this level of protection based on
the best available science to prevent potential health problems. EPA has set an
enforceable regulation for nitrate, called a maximum contaminant level (MCL), at 10
mg/L or 10 ppm. MCLs are set as close to the health goals as possible, considering
cost, benefits and the ability of public water systems to detect and remove
contaminants using suitable treatment technologies. In this case, the MCL equals the
MCLG, because analytical methods or treatment technology do not pose any
limitation.
41
Nitrates are found only in small amounts in fresh domestic water. It is an
essential nutrient for many photosynthetic autotrophs and in some cases has been
identified as growth limiting nutrient. Many workers have reported the presence of
nitrates at higher levels in effluent water compared to fresh water. Adeyeye and
Abulude, (2004) Nitrates in natural waters can be traced to percolating nitrates from
sources such as decaying plant and animal materials, agricultural fertilizers and
domestic sewage. The presence of nitrates in the water samples is suggestive of some
bacterial action and bacterial growth (Narayan et. al., 2007). Low levels of nitrates
and phosphates are not indicative of low productivity as these nutrients are quickly
recycled (Sugunan, 2000). The natural concentration of 0.3 mg/L of nitrates may be
enhanced by fertilizer in the runoff, industrial and municipal waste waters up to 5
mg/L. In Lakes, concentration of nitrates in excess of 0.2 mg/L is found Nitrogen
stimulates algal growth leading to eutrophication (Ramchandra and Solanki, 2007).
According to Trevisan and Forsberg (2007) phytoplankton of Amazonian system of
lakes is mainly controlled by the availability of nutrients, especially nitrogen, during
the dry period. The concentration of nutrients, mainly Nitrogen and Phosphorus, are
the factors which govern the phytoplankton growth and distribution. Forbes et. al.,
(2008) could not detect any significant relationship between bioavailable nitrogen (i.e.
nitrate) and N2 fixation potentials with the help of both multiple linear regressions and
the pruned regression tree analysis. However, the roles of bioavailable nitrogen, as
well as temperature are normally revealed in the seasonal N2 fixation (Scott et. al.,
2008). A relationship between total Nitrogen and total phosphate exists which
indicates that both zooplankton and phytoplankton biomass increase with the increase
of total Nitrogen and total phosphate concentrations (Chun et. al., 2007).
3.1.11 Phosphates (PO4-3)
Phosphorus is necessary for the growth of biological organisms, including
both their metabolic and photosynthetic processes, it occurs naturally in water bodies
mainly in the form of phosphates a compound of phosphorus and oxygen. Phosphorus
is a nutrient essential for all organisms for the basic processes of life and natural
element found in rocks, soils and organic material. Phosphorus clings tightly to soil
particles and is used by plants, so its concentrations in clean waters are generally very
low. However, Phosphorus is used extensively in fertilizer and other chemicals, so it
can be found in higher concentrations in areas of human activity. Many harmless
42
activities added together can cause Phosphorus overloads. Phosphates promote the
growth of plankton and aquatic plants which provide food for larger organisms,
including zooplankton, fish, humans, and other mammals. Plankton represents the
base of the food chain. Initially, this increased productivity will cause an increase in
the fish population and overall biological diversity of the system. The role of
Phosphate in promoting plant growth actually makes it a dangerous pollutant when
dumped in excessive quantities into aquatic ecosystems. In fact, plants have so much
difficulty that the chemical is a limiting nutrient. The rate at which plants can grow
and reproduce is limited by the amount of usable phosphates in the soil or water (for
aquatic plants). When humans add extra Phosphorous to water, they create a
condition called eutrophication that can wipe out aquatic ecosystems. Eutrophication
is characterized by a rapid growth in the plant population called algal bloom. With
more living plants come more dead plants needing decomposition. The bacteria that
decompose the dead plants use Oxygen, and eventually burn up so much that not
enough remains to support fish, insects, mussels, and other animals, leading to a
massive die-off. The deposition of Phosphorus into lake sediments occurs by
mechanisms such as a) sedimentation of Phosphorus minerals imported from the
drainage basin, b) adsorption or precipitation of Phosphorus with inorganic
compounds c) uptake of phosphorus from the water column by algal and other
attached microbial communities (Bostrom et. al., 1988). The quantities of Phosphorus
entering the surface drainage vary with the amount of Phosphorus in catchment soils,
topography, vegetative cover, quantity and duration of runoff flow, land use and
pollution.
The presence of phosphates in almost every detergent, including household
cleaners and laundry soap, used to contribute significantly to eutrophication. In the
United States, the problem was moderated somewhat in the 1970 when the Clean
Water Act and other laws mandated the removal of Phosphates from many detergents
(next time you do laundry, look on the side of the box and should find the phrase
“Contains No Phosphates”), although industrial cleaners and some specialty
detergents still use phosphates.
3.1.12 Sulphate (SO4 -2)
Sulfate is a substance that occurs naturally in drinking water, regarding to
43
health sulfate in drinking water have been raised because of reports that diarrhoea
may be associated with the ingestion of water containing high levels of sulfate. The
general population that may be at higher risk from the laxative effects of sulfates
when they experience a quick change from drinking water with low sulfate
concentrations to drinking water with high sulfate concentrations. According to
Delisle and Schmidt (1977), sulfates are discharged into water from mines and
smelters and from kraft pulp and paper mills, textile mills and tanneries. Sodium,
Potassium and Magnesium sulfates are all highly soluble in water, whereas calcium
and barium sulfates and many heavy metal sulfates are less soluble. Atmospheric
sulfur dioxide, formed by the combustion of fossil fuels and in metallurgical roasting
processes, may contribute to the sulfate content of surface waters. Sulfur trioxide,
produced by the photolytic or catalytic oxidation of sulfur dioxide, combines with
water vapour to form dilute sulfuric acid, which falls as “acid rain.” According to
Greenwood and Earnshaw (1984), sulfates and sulfuric acid products are used in the
production of fertilizers, chemicals, dyes, glass, paper, soaps, textiles, fungicides,
insecticides, astringents and emetics. They are also used in the mining, wood pulp,
metal and plating industries, in sewage treatment and in leather processing.
Aluminum sulfate (alum) is used as a sedimentation agent in the treatment of drinking
water. Copper sulfate has been used for the control of algae in raw and public water
supplies (McGuire , 1984).
Iron sulphides such as, FeS may be exposed to water and atmospheric Oxygen
by mining or rock excavation, producing sulphuric acid, which contributes sulphate to
ground and surface waters. Sulphates are also released during blasting and the
deposition of waste rock in dumps at metal mines. This is known as acid rock
drainage and is a significant source of sulphate generation in British Columbia. The
burning of fossil fuels is also a major source of Sulphur to the atmosphere. Most of
the man's emissions of Sulphur to the atmosphere, about 95%, are in the form of SO2.
Sulphate fertilizers are also a major source of sulphate to ambient waters. Sulphate
concentrations typically range between about 2 and 30 mg/L for most lakes and rivers
in British Columbia. Although, some lakes in the Cariboo Region and in Richter Pass
near Osoyoos have particularly high natural sulphate levels in the thousands of mg/L.
Seasonal fluctuations in dissolved sulphate concentrations are obvious in most rivers,
with low concentrations during freshet and elevated concentrations during winter low
44
flows.
Sulfates in drinking water currently have a secondary maximum contaminant
level (SMCL) of 250 milligrams per liter (mg/L), based on aesthetic effects (i.e., taste
and odor). This regulation is not a federally enforceable standard, but is provided as a
guideline for states and public water systems. EPA estimates that about 3% of the
public drinking water systems in the country may have sulfate levels of 250 mg/L or
greater. The Safe Drinking Water Act (SDWA), as amended in 1996, directs the U.S.
Environmental Protection Agency (EPA) and the Centers for Disease Control and
Prevention (CDC) to jointly conduct a study to establish a reliable dose-response
relationship for the adverse human health effects from exposure to sulfate in drinking
water, including the health effects that may be experienced by sensitive
subpopulations (infants and travelers).
According to Cocchetto and Levy, (1981) ingestion of 8 g of sodium sulfate
and 7 g of magnesium sulfate caused catharsis in adult males. Cathartic effects are
commonly reported to be experienced by people consuming drinking-water
containing sulfates in concentrations exceeding 600 mg/L (US DHEW, 1962).
Dehydration has also been reported as a common side-effect following the ingestion
of large amounts of magnesium or sodium sulfate (Fingl, 1980)
3.1.13 Magnesium (Mg)
Magnesium is present in seawater and amounts about 1300 ppm., after Sodium
it is the most commonly found cation in oceans. Rivers contain approximately 4 ppm
of Magnesium, marine algae 6000-20,000 ppm and oysters 1200 ppm. Magnesium
and other alkali earth metals are responsible for water hardness. Water containing
large amounts of alkali earth ions is called hard water, and water containing low
amounts of these ions is called soft water. According to Pitter (1999) Magnesium is
usually less abundant in waters than Calcium, which is easy to understand since
Magnesium is found in the earth’s crust in much lower amounts as compared with
Calcium. In common underground and surface waters the weight concentration of Ca
is usually several times higher compared to that of Mg, the Ca to Mg ratio reaching up
to 10. Drinking water contains magnesium salts, the level of which varies depending
on the geographical region. It can enter the environment from discharge and
emissions from industries that use or manufacture Magnesium.
45
According to Weast (1987), Magnesium is the eighth most common element
in the crust of the Earth and is mainly tied up within mineral deposits, for example as
magnesite (magnesium carbonate [MgCO3]) and dolomite. The most plentiful source
of biologically available Magnesium, however, is the hydrosphere (i.e. oceans and
rivers). In the sea, the concentration of Magnesium is ∼55 mmol/L and in the Dead
Sea as an extreme example the concentration is reported to be 198 mmol/L
Magnesium has steadily increased over time. Magnesium salts dissolve easily in water
and are much more soluble than the respective Calcium salts. As a result, Magnesium
is readily available to organisms. Magnesium plays an important role in plants and
animals alike. In plants, Magnesium is the central ion of chlorophyll . In vertebrates,
Magnesium is the fourth most abundant cation and is essential, especially within cells,
being the second most common intracellular cation after Potassium, with both these
elements being vital for numerous physiological functions. Magnesium is also used
widely for technical and medical applications ranging from alloy production,
pyrotechnics and fertilizers to health care. Traditionally, magnesium salts are used as
antacids or laxatives in the form of magnesium hydroxide [Mg(OH)2], magnesium
chloride (MgCl2), magnesium citrate (C6H6O7Mg) or magnesium sulphate (MgSO4).
3.1.14 Calcium (Ca)
Calcium (Ca++) and Magnesium (Mg++) ions are both common in natural
waters and both are essential elements for all organisms. Calcium and Magnesium,
when combined with bicarbonate, carbonate and sulphate, contribute to the hardness
of natural waters. The effect of this hardness can be seen as deposited scale when such
waters are heated. Normally hardness due to Calcium predominates although in
certain regions, Magnesium hardness can be high. In some river catchments, hardness
can vary seasonally reaching peak values during low flow conditions.
According to Annalakshmi and Amsath, (2012) Calcium is an important
micronutrient in an aquatic environment and this environment is affected by
adsorption of calcium ion on the metallic oxides. In addition to this it has effect on
microorganisms, which play an important role in Calcium exchange between
sediments and overlying water. Calcium is the fifth most abundant natural element.
As per NAQUADAT (1977), the greatest concentration, 365 mg/L, was recorded in
Prince Edward Island, and the lowest, 0.3 mg/L, in Newfoundland. Data collected
46
from 24 stations in Saskatchewan in 1980 and 1981 showed that the concentration of
Calcium in surface waters ranged from 2 to 141 mg/L, whereas the average
concentrations from sampling stations in all provinces ranged from 1 to 336 mg/L.
Calcium enters the freshwater system through the weathering of rocks,
especially limestone, and from the soil through seepage, leaching and runoff.
(Day,1963). The leaching of calcium from soil has been found to increase
significantly with the acidity of rainwater. (Overrein,1972).
Calcium occurs in water naturally. Seawater contains approximately 400 ppm
calcium. One of the main reasons for the abundance of Calcium in water is its natural
occurrence in the earth's crust, Calcium is also a constituent of coral. Rivers generally
contain 1-2 ppm of Calcium, but in lime are as rivers may contain Calcium
concentrations as high as 100 ppm. Examples of calcium concentrations in water
organisms: seaweed luctuca 800-6500 ppm (moist mass), oysters approximately 1500
ppm (dry mass). In a watery solution calcium is mainly present as Ca2+ (aq), but it
may also occur as CaOH+ (aq) or Ca(OH)2(aq), or as CaSO4 in seawater. Calcium is
an important determinant of water hardness, and it also functions as a pH stabilizer,
because of its buffering qualities. Calcium also gives water a better taste. Water
hardness influences aquatic organisms concerning metal toxicity. In softer water
membrane permeability in the gills is increased. Calcium also competes with other
ions for binding spots in the gills. Consequently, hard water better protects fishes
from direct metal uptake. pH values of 4.5-4.9 may harm Salmon eggs and grown
Salmons, when the Calcium, Sodium and Chlorine content is low.
3.2 Material and Methods
The study site was visited at an interval of a month from January, 2009 to
December, 2010. Total 24 visits were made during the study period. To collect water
samples for analysis, plastic containers of two liters capacity were used. Surface
water samples were collected from three sites at Budki M.I. tank namely A, B and C
between 8 a.m. to 10 a.m. in three separate clean containers and labeled station wise
to indicate date, location and brought to the laboratory for analysis. The parameters
such as Water Temperature (WT), pH and Carbon-dioxide were analyzed at the field
station itself while Dissolved Oxygen (DO) was fixed in separate BOD sample
bottles. Analysis of other parameters such as Total Hardness (TH), Chlorides (Cl-),
47
pH, Nitrates (NO3) and Phosphates (PO4-3) were carried out in the laboratory. To
retain the chemical properties, all the samples were protected from heat and direct
sunlight during transportation and until estimated.
3.2.1 Physical parameters
3.2.1.1 Temperature (Temp.)
Both Atmospheric or Ambient (AT) and Water Temperature (WT) were
measured using Mercury thermometer and noted in 0C.
3.2.1.2 Water Cover (WC)
The water cover was estimated visually in terms of percentage as compared to
maximum filled level.
3.2.1.3 Transparency (Trans.)
Transparency was determined using Secchi disc, a metallic disc of 20 cm
diameter with four alternate black and white quarters on the upper surface. The disc
with centrally placed weight at the lower surface is suspended with a graduated cord
at the centre. Transparency was measured by gradually lowering the Secchi disc at
respective sampling stations. The depths at which it disappears (A) and reappears (B)
in the water were noted. The transparency of the water body was computed as
follows, Secchi disc light penetration = A + B / 2
Where, A = depth at which Secchi disc disappears.
B = depth at which Secchi disc reappears.
3.2.1.4 Total Solids (TS)
Total solids were determined as the residues left after evaporation of the
unfiltered sample. An evaporating dish of 100 ml capacity was ignited at 550 ± 50 C
in muffle furnace for half an hour, cooled in desiccators and weighed. Then 100 ml of
unfiltered sample was evaporated in an evaporating dish on a hot plate at 98 C. After
heating the residues at 103-105 C in an oven for one hour the evaporating dish was
cooled in a desiccators and weighed. TS was calculated as,
Total Solids in mg/L = (A − B) × 1000VWhere, A = Final weight of the dish in gm.
48
B = Initial weight of the dish in gm.
V = Volume of sample taken in ml.
3.2.1.5 Total Dissolved Solids (TDS)
Total dissolved solids were determined as the residues left after evaporation of
the filtered sample. As reported for TS an evaporating dish of 100 ml capacity was
ignited at 550 ± 50 C in muffle furnace for half an hour, cooled in desiccators and
weighed. 100 ml of filtered sample was added to it and evaporated in a pre-weighed
evaporating dish on the hot plate at 98 C. The residues were heated at 103-105 C in
an oven for one hour and final weight was taken after cooling the evaporating dish in
a desiccators. TDS was calculated as,
Total Dissolved Solids in mg/L = (A − B) × 1000VWhere, A = Final weight of the dish in grams.
B = Initial weight of the dish in grams.
V = Volume of sample taken in ml.
3.2.1.6 Total Suspended Solids (TSS)
It is the difference between the total solids and total dissolved solids.
TSS = TS – TDS
3.2.2 Chemical parameters
3.2.2.1 pH (Electrometric method)
The pH of water sample was measured by electronic portable pH
meter. The pH meter was calibrated with phosphate buffer of known pH. It uses
electrodes (Eqip-Tronics, Model No.EQ-615) that are free from interference. At
constant temperature, a pH change produces a corresponding change in the electrical
property of the solution. This change was read by the electrode and the accuracy was
the greatest in the middle pH ranges.
3.2.2.2 Dissolved Oxygen (DO) (Winkler's method - APHA, 1998)
The Manganese sulphate reacts with alkali (KOH) to form a white precipitate
of manganous hydroxide. In presence of oxygen it gets oxidized to form a brown
coloured manganese oxyhydrate which is equivalent to the amount of dissolved
49
Oxygen present in water. In the presence of iodide ion acidification, oxides of
manganese revert to divalent state with the liberation of Iodine equivalent to
originally dissolved Oxygen content in the sample. The Iodine is then titrated with
standard solution of sodium thiosulphate using starch as an indicator.
For the estimation of Dissolved Oxygen the water samples were collected with
care in BOD bottles without bubble formation. The DO was then fixed at the station
itself by adding 1 ml each of Manganese Sulphate and Alkali-iodide azide reagents.
The precipitates formed were dissolved by adding 2 ml. of concentrated Sulphuric
acid. From this 50ml sample was taken and titrated against 0.1N Sodium thiosulphate.
To estimate Iodine generated starch was used as an indicator and the end point was
noted as the solution turns from blue to colorless. The DO was calculated using
following formula
DO mg/L = B. R. × N × 1000Amount of sample taken (ml)Where, C. B.R. = Constant Burette Reading (Amount of titrant used).
N = Normality of Sodium thiosulphate.
3.2.2.3 Free Carbon dioxide(CO2) (APHA, 1998)
The method is based on the principle that free carbon dioxide (CO2) in water
reacts with sodium hydroxide (NaOH) to form sodium bicarbonate (Na2CO3) and the
end point is indicated by development of pink colour using phenolphthalein as an
indicator at pH 8.3. To estimate CO2 in water in 100 ml. sample 2 to 3 drops of
phenolphthalein were added and the sample was titrated against 0.05N Sodium
hydroxide until a pink color was obtained. The free carbon dioxide was calculated
using following formula:
Free carbondioxide mg/L = B. R. × N × 44 × 1000Amount of sample taken (ml) Where,C.B.R. = Constant Burette Reading (Amount of titrant used).
N = Normality of Sodium Hydroxide (0.05N).
44 = Equivalent weight of CO2.
3.2.2.4 Total Hardness (TH) (EDTA Titrimetric Method, APHA, 1998)
Hardness is generally due to Calcium and Magnesium ions present in the
50
water. EDTA (Ethylene di-amine tetra acetic acid) and its sodium salts as well as
Eriochrome Black-T form a chelated soluble complex when added to a solution of
certain metal cations. When a small amount of Eriochrome Black-T Calamite
indicator is added to the aqueous solution containing Calcium and Magnesium ions at
pH 10.0 it forms Calcium and Magnesium ion complexes and the solution becomes
wine red. Since EDTA has strong affinity towards Calcium and Magnesium ions,
with the addition of EDTA as titrant, the complex binds to EDTA and Erichrome
Black T is released free. As a result the solution turned from wine red to blue,
indicating the end point.
For the estimation of total hardness, in 100 ml. of sample, 1 to 2 ml of buffer
solution and a pinch of Eriochrome Black-T (used as an indicator) were added. After
the appearance of wine red colour, the mixture was titrated against EDTA stirring
continuously till end point change of wine red to blue colour was achieved. The total
hardness was calculated using following formula,
Total hardness expressed as mg CaCO /L = A × N × 1000Amount of sample taken (ml) Where A = ml of titrant (EDTA) used.
N = Normality of EDTA.
3.2.2.5 Chlorides (Cl-) (Argentometric Titremetric method, APHA, 1998)
Silver nitrate reacts with chlorides to form very slightly soluble white
precipitates of AgCl2. In a neutral or slightly alkaline solution, chloride is estimated
with silver nitrate as titrant using potassium chromate as an indicator. Silver chloride
is precipitated quantitatively before red silver chromate is formed.
In 100 ml. sample, 1 ml. of K2CrO4 indicator was added and titrated against
0.02N AgNO3-till brick red precipitates were formed. The formula used to calculate
mg. of Cl-/l is as follows,
mg of Cl /L = C. B. R.× N × 35.45 × 1000Amount of sample taken (ml) Where, C.B.R. = Constant Burette reading (Amount of titrant used).
N = Normality of Silver Nitrate.
35.45 = Equivalent weight of Chloride.
51
3.2.2.6 Nitrates (NO3) (Cadmium Reduction Method, APHA, 1998)
Nitrite (NO2) is reduced to nitrate (NO3-) in the presence of Cadmium (Cd).
This method uses commercially available Cd granules coated with 2% copper
sulphate (CuSO4) packed in a glass column. The Nitrates (NO3-) produced was
determined by diazotizing it with color reagent containing sulfanilamide coupled with
N-(1- naphthyl)-ethylenediamine dihydrochloride (NEDD) to form highly coloured
azo dye. The color developed was measured colorimetrically at 410 nm. A correction
was made for any NO3- present in the sample by analyzing the sample without the
reduction step. A standard graph was plotted to obtain the factor. Nitrates were
calculated as
NO mg/L = O. D.× FactorAmount of sample taken (ml) Where, O.D. = Optical Density
3.2.2.7 Phosphates (PO4-3) (APHA, 1998)
The phosphates in water react with ammonium molybdate and form complex
molybdophosphoric acid which gets reduced to a complex of blue colour in the
presence of SnCl2. The absorption of light by this blue colour can be measured at 690
nm to calculate the concentration of phosphates.
In a conical flask containing 100ml. of sample, 4ml of strong acid and 4 ml of
ammonium molybdate were added followed by 10 drops of SnCl2. The blue colour
developed was measured after 10 minutes at 690 nm with colorimeter model
Photochem 5.0. It is necessary to make a standard graph before the analysis of
sample to obtain the factor. The instrument was set by running a reagent blank. The
Phosphates were calculated as
PO as mg/L = O. D.× FactorAmount of sample taken (ml) Where, O.D. = Optical Density
For the convenience of analysis the monthly data were pooled for three
seasons: namely 1.Summer (January, February, March and April) ; 2.Monsoon (May,
June, July and August) and 3.Winter (September, October, November and December).
The results given are in the form of Mean ± SEM. The data were subjected to
ANOVA across the season with the help of Prism 3 software (Graphpad software, San
52
Diego, California U.S.A.). The P value for ANOVA is non significant if P > 0.05
(ns), significant if P < 0.05(*), significantly significant (**) if P is < 0.001 and highly
significant (***) if P < 0.0001. The Pearson Correlation between various parameters
were also calculated with the help of SPSS 7.5/12 for windows. If (**) Correlation is
significant at the 0.01 level (two-tailed), whereas at (*) correlation is significant at
0.05 level (two-tailed).
3.2.2.8 Sulphates (SO4) Turbidimtric method
1. 100 ml of clear sample was taken (not containing more than 40 mg/L of SO4 ) or
a suitable aliquot diluted to 100 ml in 250 ml conical flask and 5.0 ml of
conditioning reagent was added.
2. The sample was stirred on a magnetic stirrer and during stirring, a spoonful of
BaCl2 crystals were added. Stiring for only one minute after addition of BaCl2
crystals was done.
3. The reading were taken on a spectrophotometer (Schimabzu, 2450) at 420 nm
exactly after 4 minutes. The concentration of sulphate from the standard curve
were calculated.
4. The standard curve was prepared by employing the same procedure as described
above, for 0.0-40.0 mg/L.
3.2.2.9 Magnesium (Mg ) EDTA Titration
1. The volume of EDTA used in Calcium determination was found out.
2. The volume of EDTA used in hardness (Ca++ Mg ++) determination with same
volume of the sample as taken in the Calcium determination was also noted.
Magnesium,, mg/l= Y-X ×400.8
ml of sample×1.645
Where, × = EDTA used for Ca determination for the same volume of the sample
Y= EDTA used for hardness (Ca+Mg)
3.2.2.10 Calcium (Ca ) EDTA Titration
1. 50 ml sample in a conical flask was taken. If the sample having higher alkalinity,
use smaller volume diluted to 50 ml.
2. 2.0ml of NaOH solution added in the sample.
3. 100 to 200 mg of murexide indicator was added a pink color changes.
53
4. Titrated against EDTA solution until the pink color changed to purple. For better
judgment of end point, compared the purple color with the distilled water blank
titration end point.
Calcium, mg/L = X ×400.8
ml of sample
Where, × =Volume of EDTA used.
3.3 Result and Discussion
For convenience, the results we accessible into two groups: Group I (Physical
Parameters) Ambient Temperature (AT), Water Temperature (WT), Water Cover
(WC), Transparency (Trans), Total Solids (TS), Total Dissolved Solids (TDS) and
Total Suspended Solids (TSS). Group II (Chemical Parameters) pH, Dissolved
Oxygen (DO), Carbon Dioxide(CO2),Total Hardness (TH) and Chlorides(Cl-),
Nitrates (NO3-),Phosphates(PO4
-3) and Sulphates (SO4-2).
3.3.1 Group I: Physical Parameters
3.3.1.1 Temperature (Temp.)
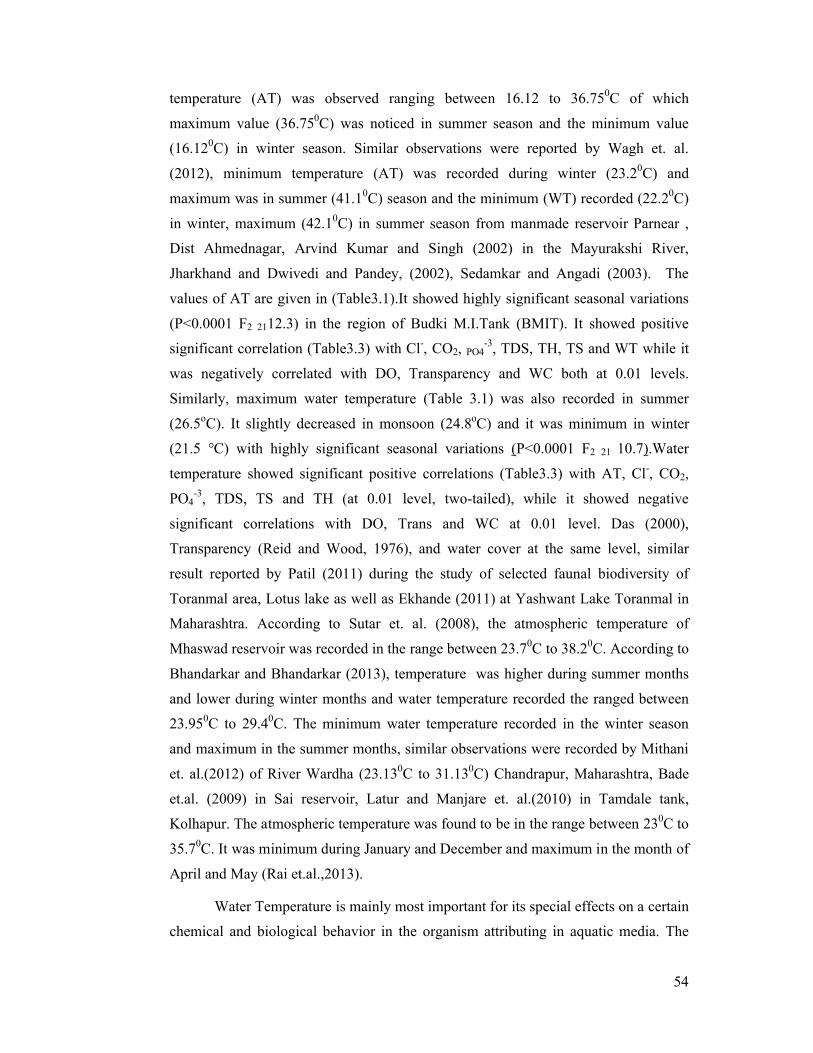
Atmospheric (AT) and water temperature (WT) are two important
environmental factors. The range of atmospheric temperature recorded during the
period of two years January 2009 to December 2010. The minimum temperature
recorded during winter season (24.40C ± 0.560C) and maximum temperature recorded
in summer (310C ± 1.320C ) during the study period (Table 3.1). Similar results are
observed by Gaike and Shejule (2012), the atmospheric temperature recorded between
ranging from 160C to 320C and the water temperature recorded from 160C to 290C. In
Kasura dam, maximum atmospheric temperature was recorded in the month of May
320C and minimum 160C was recorded in the month of December. The maximum
water temperature recorded in May was 290C and the minimum of 160C was recorded
in December. Temperature is a physical factor indicated the quality of water and it has
effect on growth and distribution of aquatic life, concentration of dissolved gases and
chemical solutes. Chavan et. al. (2012), observed minimum temperature 21.40C
during winter season and maximum temperature 26.530C summer in season. The low
water temperature in the winter might be due to high water levels and lower solar
radiation whereas maximum in the summer might be due to low water level, greater
solar radiation and clear atmosphere. According to Sahni and Yadav (2012),
54
temperature (AT) was observed ranging between 16.12 to 36.750C of which
maximum value (36.750C) was noticed in summer season and the minimum value
(16.120C) in winter season. Similar observations were reported by Wagh et. al.
(2012), minimum temperature (AT) was recorded during winter (23.20C) and
maximum was in summer (41.10C) season and the minimum (WT) recorded (22.20C)
in winter, maximum (42.10C) in summer season from manmade reservoir Parnear ,
Dist Ahmednagar, Arvind Kumar and Singh (2002) in the Mayurakshi River,
Jharkhand and Dwivedi and Pandey, (2002), Sedamkar and Angadi (2003). The
values of AT are given in (Table3.1).It showed highly significant seasonal variations
(P<0.0001 F2 2112.3) in the region of Budki M.I.Tank (BMIT). It showed positive
significant correlation (Table3.3) with Cl-, CO2, PO4-3, TDS, TH, TS and WT while it
was negatively correlated with DO, Transparency and WC both at 0.01 levels.
Similarly, maximum water temperature (Table 3.1) was also recorded in summer
(26.5oC). It slightly decreased in monsoon (24.8oC) and it was minimum in winter
(21.5 °C) with highly significant seasonal variations (P<0.0001 F2 21 10.7).Water
temperature showed significant positive correlations (Table3.3) with AT, Cl-, CO2,
PO4-3, TDS, TS and TH (at 0.01 level, two-tailed), while it showed negative
significant correlations with DO, Trans and WC at 0.01 level. Das (2000),
Transparency (Reid and Wood, 1976), and water cover at the same level, similar
result reported by Patil (2011) during the study of selected faunal biodiversity of
Toranmal area, Lotus lake as well as Ekhande (2011) at Yashwant Lake Toranmal in
Maharashtra. According to Sutar et. al. (2008), the atmospheric temperature of
Mhaswad reservoir was recorded in the range between 23.70C to 38.20C. According to
Bhandarkar and Bhandarkar (2013), temperature was higher during summer months
and lower during winter months and water temperature recorded the ranged between
23.950C to 29.40C. The minimum water temperature recorded in the winter season
and maximum in the summer months, similar observations were recorded by Mithani
et. al.(2012) of River Wardha (23.130C to 31.130C) Chandrapur, Maharashtra, Bade
et.al. (2009) in Sai reservoir, Latur and Manjare et. al.(2010) in Tamdale tank,
Kolhapur. The atmospheric temperature was found to be in the range between 230C to
35.70C. It was minimum during January and December and maximum in the month of
April and May (Rai et.al.,2013).
Water Temperature is mainly most important for its special effects on a certain
chemical and biological behavior in the organism attributing in aquatic media. The
55
water temperature and air temperature were found more or less similar. In Indian
subcontinent, the temperature in most of the water bodies varied between 7.80C to
38.50C was reported by Sirighal et. al.(1986). Water temperature also controls the
physiological activities and distribution of aquatic organisms and has effect on natural
environment. Variation of water temperature is generally governed by the
atmospheric condition. According to Desai (1995) water temperature may be
depending on the season, geographic location and sampling time from Dudhasagar
river. This is reflected by lower water temperature at Budki M.I.Tank in monsoon due
to cloudy weather and rainfall while in winter due to cold climatic conditions with
shorter sunshine period. During summer season solar radiation and clear sky condition
enhanced the climatic condition. The variation in the temperature of the present study
is similar with the findings of Rao et. al., (1982) for Nainital lake (80C to 230C),
Billore and Vyas (1982) for Pichhola lake (0.60Cto26.30C) and Singhai et. al.,
(1990).Temperature control the hydrochemistry of parameters like Dissolved Oxygen,
Solubility, pH, Conductivity, etc. Patil (2011),Ramachandra and Solanki (2007). In
general water holds lesser Oxygen as the temperature increases Kulkarni et. al.,
(2007) in Khushavati river; Awasthi and Tiwari (2004) of Govindgharh lake, hence an
inverse relationship between the two, but a positive significant correlation with
Alkalinity, Acidity, Atmospheric Temperature, Chloride, CO2, pH, Phosphate, TDS,
TS and water cover is noted at 0.01 level in the present study. With reference to
thermal cover between AT and WT and annual variations in temperature, Jaychandra
and Joseph (1988) recorded maximum difference of 2.70C between AT and WT at a
tropical Vellayani Lake in Kerala while Kanan and Job (1980) have reported a
difference of 5.5 0C in Diurnal depth wise and seasonal changes of physicochemical
factors in Sathiyar reservoir and Sreenivasan at.el.(1997) a difference of 6 0C in
Limnological study of a shallow water body (Kolovoi Lake) in Tamilnadu. Water
temperature of Indrapuri dam ranged between 21.30C to 28.80C. It was minimum
during November and December and maximum in the month of April and May (Rai
et.al., 2013). In the present study maximum mean value of AT was recorded in
summer (31.0 ± 1.320C) and minimum value was recorded in winter (24.4 ± 0.560C).
The difference between AT and WT were between 4.5 0C to 2.9 0C respectively in
summer and winter. It is a well established fact that land heats up and cools down
faster than water the same effect is produced at BMIT. Water temperature regulates
the biochemical behavior in the aquatic environment. The physiological and
metabolic activities of organism such as feeding, reproduction, movements and
distribution are seriously influenced by water temperature.
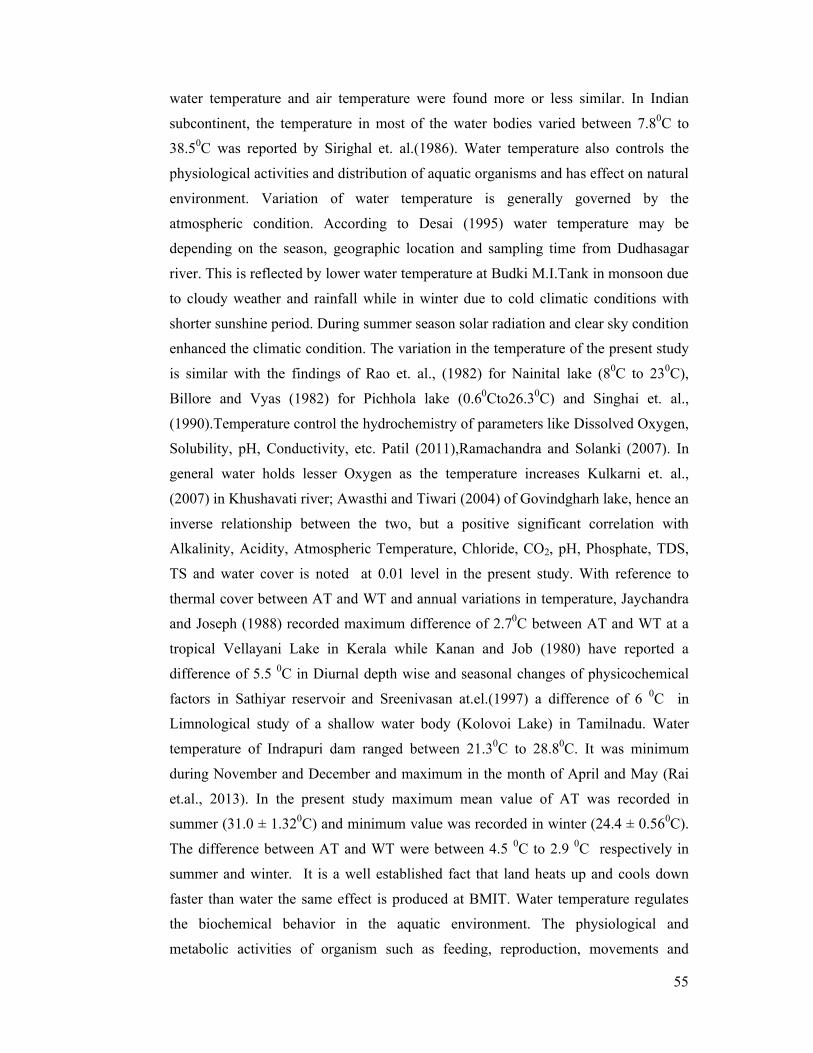
3.3.1.2 Water Cover (WC %)
At BMIT study area the maximum percentage of water cover (
Fig.3.2) was recorded in winter (84.4%) and minimum in summer (61.5%),
medium in monsoon (79.4%).
The maximum water
in the summer indicated
monsoon. At BMIT water cover start
water and collection continue
Water cover was minimum in summer due to
was used for domestic purposes by the people
reservoirs compared to the tanks
and therefore, more dissolution of atmospheric
Hence, water cover was positively correlated to DO at study area. The seasonal
variation in the percentage of water cover with the contour of water
the littoral formation; it is an indicator of productive nature of the
(Sugunan2000). An irregular shoreline encompasses more littoral formation produces
more area of land and water interface. At BMIT the shoreline is less i
hence less littoral formation in water cover. The space is essential for colonization and
clearly affects the composite production of periphytic communities (Wetzel, 2006).
Large lakes are typical repositories of the greatest numbers of specie
0
5
10
15
20
25
30
35
Summer
Fig. 3.1 : water TemperatureºC during January, 2009 to December, 2010
Atmospheric Temperature (AT) ˚C
Tem
p. ̊C0
C0 C
iously influenced by water temperature.
Water Cover (WC %)
At BMIT study area the maximum percentage of water cover (
) was recorded in winter (84.4%) and minimum in summer (61.5%),
(79.4%).
aximum water surface recorded at BMIT in the monsoon and minimum
d that the area received rainfall mainly during south
monsoon. At BMIT water cover started increasing in rainy season because of rain
continued from tributary present in the surrounding of BMIT.
minimum in summer due to percolation, evaporation of water and
s used for domestic purposes by the people around BMIT. The high DO in the
reservoirs compared to the tanks is slightly lesser than high water level (
and therefore, more dissolution of atmospheric Oxygen (Hegde and Hudder, 1995).
Hence, water cover was positively correlated to DO at study area. The seasonal
variation in the percentage of water cover with the contour of water body determines
the littoral formation; it is an indicator of productive nature of the lakes
. An irregular shoreline encompasses more littoral formation produces
more area of land and water interface. At BMIT the shoreline is less i
hence less littoral formation in water cover. The space is essential for colonization and
clearly affects the composite production of periphytic communities (Wetzel, 2006).
Large lakes are typical repositories of the greatest numbers of species because their
Summer Monsoon Winter
Fig. 3.1 : Seasonal variation in Atmospheric(Ambient) and water TemperatureºC during January, 2009 to December, 2010
Atmospheric Temperature (AT) ˚C Water Temperature (WT) ˚C
56
At BMIT study area the maximum percentage of water cover (Table 3.1,
) was recorded in winter (84.4%) and minimum in summer (61.5%), and
surface recorded at BMIT in the monsoon and minimum
rainfall mainly during south-west
increasing in rainy season because of rain
ry present in the surrounding of BMIT.
evaporation of water and
BMIT. The high DO in the
water level (Water Cover)
xygen (Hegde and Hudder, 1995).
Hence, water cover was positively correlated to DO at study area. The seasonal
body determines
lakes in India
. An irregular shoreline encompasses more littoral formation produces
more area of land and water interface. At BMIT the shoreline is less irregular and
hence less littoral formation in water cover. The space is essential for colonization and
clearly affects the composite production of periphytic communities (Wetzel, 2006).
s because their
Seasonal variation in Atmospheric(Ambient) and water TemperatureºC during January, 2009 to December, 2010
Water Temperature (WT) ˚C
greater surface area provides more opportunities for colonization. They contain a
greater variety of microhabitats and their internal environmental conditions are more
stable compared to smaller water bodies (Pip, 1987). These opportunities
development of various organisms are provided by water cover that in turn determines
the extent of littoral formation. As far as producers like algae are concerned spatial
heterogeneity in their rates of production is usually very high because of the
variability in littoral habitats within freshwater ecosystem. Most lakes of the world are
shallow and possess large littoral zone. Such shallow lakes with a well developed
littoral habitat can function as a refuge for zooplankton
predation that prevails in the open water. In the current investigation at BMIT water
cover ,the maximum mean percentage of water cover (
winter (84.0 ± 2.56 %) and minimum in summer (61.5 ± 3.50 %), and med
monsoon (79.4±5.13). Water cover showed positive significant correlations
(Table3.3) with DO while it showed negatively significant correlations with AT, Cl
CO2, TDS,TS, TH, and WT at 0.01 level.
3.3.1.3 Total Solids (TS)
During the period of researc
were found to be increased in
in winter season(156 ± 4.40 mg/
3.1, Fig 3.3.).
Total Solids are
0
20
40
60
80
100
Summer
Fig.3.2 :
%
greater surface area provides more opportunities for colonization. They contain a
greater variety of microhabitats and their internal environmental conditions are more
compared to smaller water bodies (Pip, 1987). These opportunities
development of various organisms are provided by water cover that in turn determines
the extent of littoral formation. As far as producers like algae are concerned spatial
heterogeneity in their rates of production is usually very high because of the
variability in littoral habitats within freshwater ecosystem. Most lakes of the world are
shallow and possess large littoral zone. Such shallow lakes with a well developed
littoral habitat can function as a refuge for zooplankton, fish and invertebrate
predation that prevails in the open water. In the current investigation at BMIT water
cover ,the maximum mean percentage of water cover (Table3.1) was recorded in
winter (84.0 ± 2.56 %) and minimum in summer (61.5 ± 3.50 %), and med
5.13). Water cover showed positive significant correlations
while it showed negatively significant correlations with AT, Cl
TH, and WT at 0.01 level.
Total Solids (TS)
During the period of research at BMIT water study, the total solids in water
increased in monsoon period (205±4.36 mg/L) and minimum during
in winter season(156 ± 4.40 mg/L), it was moderate in summer (198±4.5
useful parameter demonstrating the chemical status of the
Summer Monsoon Winter
Fig.3.2 : Seasonal variation in Water cover (%) at Budaki dam during January, 2009 to December, 2010
57
greater surface area provides more opportunities for colonization. They contain a
greater variety of microhabitats and their internal environmental conditions are more
compared to smaller water bodies (Pip, 1987). These opportunities for
development of various organisms are provided by water cover that in turn determines
the extent of littoral formation. As far as producers like algae are concerned spatial
heterogeneity in their rates of production is usually very high because of the great
variability in littoral habitats within freshwater ecosystem. Most lakes of the world are
shallow and possess large littoral zone. Such shallow lakes with a well developed
fish and invertebrate
predation that prevails in the open water. In the current investigation at BMIT water
) was recorded in
winter (84.0 ± 2.56 %) and minimum in summer (61.5 ± 3.50 %), and medium in
5.13). Water cover showed positive significant correlations
while it showed negatively significant correlations with AT, Cl-,
h at BMIT water study, the total solids in water
) and minimum during
±4.5Lmg/) (Table
useful parameter demonstrating the chemical status of the
Seasonal variation in Water cover (%) at Budaki
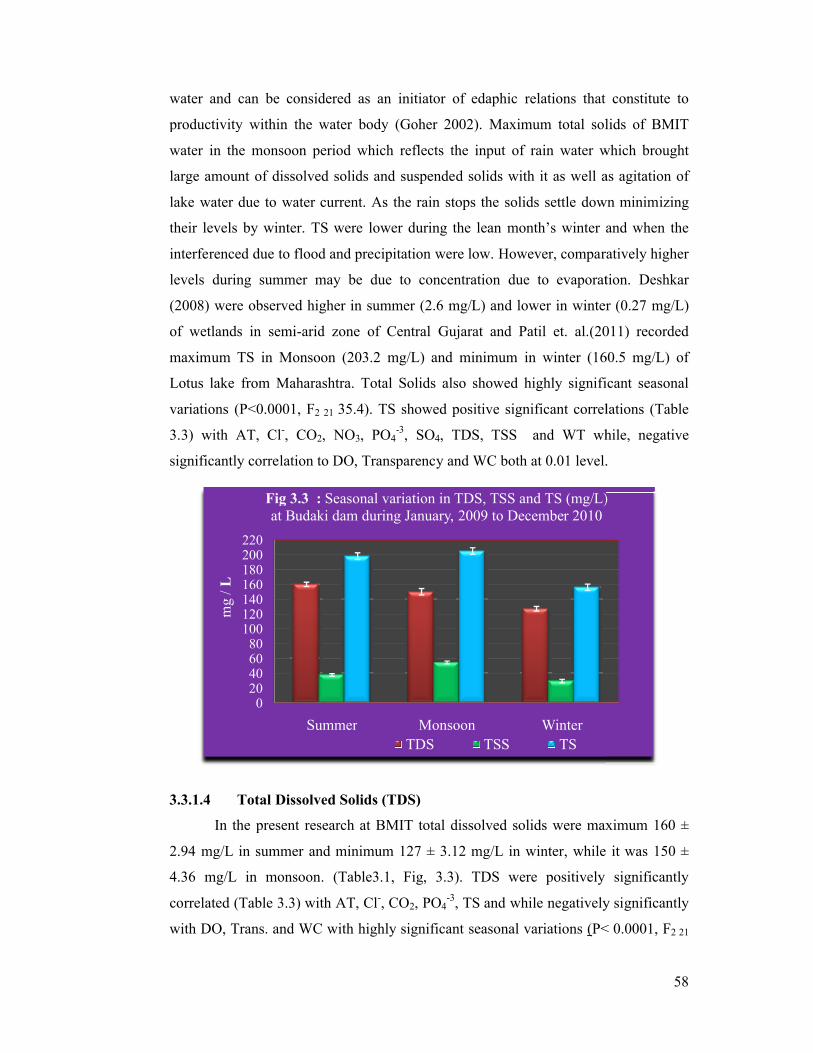
water and can be considered as
productivity within the water body
water in the monsoon period which r
large amount of dissolved solids and suspended solids with it as well as agitation of
lake water due to water current. As the rain stops the solids settle down minimizing
their levels by winter. TS were lower d
interferenced due to flood and precipitation
levels during summer may be due to concentration due to evaporation. Deshkar
(2008) were observed higher in summer (2.6 mg/L) an
of wetlands in semi-arid
maximum TS in Monsoon
Lotus lake from Maharashtra
variations (P<0.0001, F2 21
3.3) with AT, Cl-, CO2
significantly correlation to DO
3.3.1.4 Total Dissolved Solids (TDS)
In the present research at BMIT total
2.94 mg/L in summer and minimum 127 ± 3.12 mg/L in winter
4.36 mg/L in monsoon
correlated (Table 3.3) with AT, Cl
with DO, Trans. and WC
020406080
100120140160180200220
Summer
Fig 3.3 : at Budaki dam during January, 2009 to December 2010
mg
/ L
water and can be considered as an initiator of edaphic relations that constitute to
productivity within the water body (Goher 2002). Maximum total solids of BMIT
water in the monsoon period which reflects the input of rain water which b
large amount of dissolved solids and suspended solids with it as well as agitation of
lake water due to water current. As the rain stops the solids settle down minimizing
their levels by winter. TS were lower during the lean month’s winter and when the
due to flood and precipitation were low. However, comparatively higher
levels during summer may be due to concentration due to evaporation. Deshkar
were observed higher in summer (2.6 mg/L) and lower in winter (0.27 mg/L)
arid zone of Central Gujarat and Patil et. al.(2011)
maximum TS in Monsoon (203.2 mg/L) and minimum in winter (160.5 mg/L)
Lotus lake from Maharashtra. Total Solids also showed highly significan
2 21 35.4). TS showed positive significant correlations (
2, NO3, PO4-3, SO4, TDS, TSS and WT while,
to DO, Transparency and WC both at 0.01 level.
Dissolved Solids (TDS)
In the present research at BMIT total dissolved solids were maximum 160 ±
2.94 mg/L in summer and minimum 127 ± 3.12 mg/L in winter, while it was 150 ±
4.36 mg/L in monsoon. (Table3.1, Fig, 3.3). TDS were positively significantly
with AT, Cl-, CO2, PO4-3, TS and while negatively significantly
with DO, Trans. and WC with highly significant seasonal variations (P< 0.0001, F
Summer Monsoon Winter
Fig 3.3 : Seasonal variation in TDS, TSS and TS (mg/L) at Budaki dam during January, 2009 to December 2010
TDS TSS TS
58
initiator of edaphic relations that constitute to
Goher 2002). Maximum total solids of BMIT
eflects the input of rain water which brought
large amount of dissolved solids and suspended solids with it as well as agitation of
lake water due to water current. As the rain stops the solids settle down minimizing
winter and when the
re low. However, comparatively higher
levels during summer may be due to concentration due to evaporation. Deshkar
d lower in winter (0.27 mg/L)
(2011) recorded
(160.5 mg/L) of
. Total Solids also showed highly significant seasonal
35.4). TS showed positive significant correlations (Table
while, negative
.
maximum 160 ±
hile it was 150 ±
positively significantly
while negatively significantly
P< 0.0001, F2 21
Seasonal variation in TDS, TSS and TS (mg/L)
59
23.8). Gonzalves and Joshi (1946) at algae tank of Bandra and Sayed et.al (2011) of
Wadi El-Rayan Lakes, western desert, Egypt also observed highest (13772 mg/L)
concentration of total dissolved solids during summer, which decrease during rainy
seasons due to dilution of rainwater. Medudhula et.al.(2012)TDS value ranged from
261.25 to 269.05 mg/L in winter and Summer seasons, Shib Abir, (2014) also
recorded maximum TDS during Summer(216 mg/L) and minimum during winter (80
mg/L) at Rudrasagar wet land, Tripura. Salve and Hiware, (2006) reported seasonal
analysis and stated that low TDS recorded in winter season while maximum value in
monsoon due to addition of solids from surface run off in Wanparakalpa reservoir,
Nagapur near Parali Vaijanath Dist. Beed, Maharashtra.
According to Rahaman the maximum TDS values of the Ganges, Brahmaputra
and confluence were 376 mg/L, 245 mg/L & 231 mg/L and minimum values were
102 mg/L, 62 mg/L & 61mg/L and the average values were 260±96 mg/L, 155±61
mg/L & 155±55 mg/L. The total dissolved solids (TDS) mainly indicate the presence
of various kinds of minerals like ammonia, nitrite, nitrate, phosphate, alkalis, some
acids, sulphates and metallic ions etc which are comprised both colloidal and
dissolved solids in water. As per the investigation of Aggarwal and Arora (2012) of
Kaushalya River TDS and TSS are common indicators of polluted waters and
observed that TDS values ranged between 152mg/L to 252 mg/L and TSS values
ranged from 2 mg/L to 27 mg/L. The water with TDS and TSS can be considered to
be good. Shivayogimath et.al (2012), reported seasonal changes TDS from various
station of River Ghataprabha. The average TDS values at station 1 were 128.48 and
116.48 mg/l during pre-monsoon and post-monsoon seasons. From stations 2 to 7 the
values ranged between 182 to 254 mg/L and 163 to 227 mg/L during pre-monsoon
and post-monsoon seasons, concluded that the values of TDS in both the seasons were
well within the limits of drinking water. Mafruha Ahmed (2013) were found
maximum value (334 mg/L.) of TDS in dry season and minimum value (212 mg/L) in
wet season from Gulshan lake.
The higher values of TDS were recorded by many workers such as Sahni and
Yadav(2013)Total dissolved solids (TDS) value ranged from 2908.70 to 4373.00
mg/L of which higher value (4373.00 mg/L) was reported in summer season while the
lower value (2908.70mg/L) in winter season from Bharawas Pond, Rewari, Haryana.
Higher values of TDS in summer season may be due to evaporation of water,
60
contamination of domestic waste water, garbage and fertilizers etc. Olatunji et.al
(2011) the mean values of the total dissolved solids (TDS) range from 704.60 to
1,799.80 mg/L. in Asa River. The total dissolved solids ranged between 88 and 2560
mg/L. reported by Lawson (2011) from the Mangrove Swamps of Lagos Lagoon,
Lagos, Nigeria. Dhanalakshmi et.al.(2013) TDS of Pollachi town pond water recorded
during (2006-07 and 2007-08) the maximum value of 1320 mg/L and 1346 mg/L in
monsoon month and minimum of 842 mg/L and 925 mg/L in summer month
respectively.
The high amount of TDS increased turbidity which in turn decreased the light
penetration in water. This affects the photosynthesis thereby suppressing the primary
production in the form of algae and microphytes. Positive significant correlation with
AT, CL, CO2, PO4, TS and WT while; the significantly negative correlations between
with DO, Trans. and WC both at 0.01 levels were noted at BMIT. Positively
significant correlation with CO2 at study stations indicate decline in photosynthetic
activity due to lower light penetrance. The highest TDS recorded in summer at BMIT
may be due to decaying vegetation (Table3.1) The products of decaying vegetation at
the surface when started sinking might have increased the TSS as well as TDS (Khan
and Khan, 1985 in Seikha jheel at Aligarh.; Iqbal and Kataria (1995) of upper Lake of
Bhopal). It reduces solubility of gases (like Oxygen), utility of water for drinking
purpose and also enhances eutrophication of the aquatic ecosystem of Pushkar Lake,
Ajmer Rajasthan (Mathur et. al., 2008). The wetlands act as sinks for nutrient
deposition hence, the high TDS values may also depend on the age of the lake Anitha
et. al. (2005) as a result of gradual salt deposition, an observation not always
applicable for monsoonal wetlands in Mir Alam Lake, Hyderabad. However, at BMIT
the values of TDS were within the permissible limits of 500 mg/L (BIS, 1991), thus
water can be used for drinking as well as agriculture purpose.
3.3.1.5 Total Suspended Solids (TSS)
At BMIT maximum TSS mean value recorded 54.6 ± 1.89 mg/L in monsoon
and minimum 29.5±2.46mg/L in winter, while it was 37.9±1.66 mg/L in summer
(Table3.1) with variations at P < 0.0001 across the season. Total suspended solids
administered positive significant correlations (Table3.3) with AT, CL,CO2, TDS and
WT at the level of 0.05 and NO3, PO4, SO4,TS at 0.01 level while Trans. at the level
of 0.01 were significantly negatively correlated.
61
During tenure research work of BMIT the highest concentration of
TSS found in monsoon (54.6 mg/L.) and lowest in winter season (29.5 mg/L.) Similar
trend was observed by Garnaik et.al. (2013) of Nagavali River, Odisha (maximum in
Monsoon 82 mg/L and minimum in Post Monsoon (38 mg/L), where as Anhwange
et.al. (2012), reported the mean values for total suspended solid (TSS) observed
ranged between 12.55 to 49.57 mg/L during the wet season and range of 4.80 to
347.60 mg/L was recorded during dry season from Bengue river. Raut et. al.(2011) of
Ravivar Peth Lake at Ambajogai, the high values of total suspended solids during
monsoon (146.3±20.87 mg/L) may be due to siltation, deterioration and heavy
precipitation and low during winter (70.01±22.23 mg/L.) Solids concerned to
suspended and dissolved matter in water. They are useful parameters to describe the
chemical constituents of the water and can be considered as general relation that
contributes to productivity in the water body by Goher (2002) in Qarun lake. In
accordance to TSS, maximum was recorded in monsoon as a result of water runoff
from the catchment area which brings various suspended matter. TSS also increases
due to decaying vegetation. When the products of decaying vegetation at the surface
start sinking, it may increase the TSS as well as TDS (Khan and Khan, 1985; Iqbal
and Kataria, 1995). Such processes are minimum in winter hence the minimum TSS
in winter when the water of the lake is stabilized and most of the suspended matter
settles down. Increased level of suspended solids results in increased turbidity and
lower photosynthesis, rise in water temperature and decrease in dissolved Oxygen
Sharma et.al. (2008). According to Prabhakar et. al.(2012) of Palar River in Tamil
Nadu. TS and TSS varied from 800.63 to 903.15 mg/L, 453.19 to 510.10 mg/L and
346.00 to 390.20 mg/L respectively. The TSS value exceeded the desirable limit of
WHO and BIS standards, therefore, water was not recommended for drinking and
bathing purposes.
3.3.1.6 Transparency (Trans) (Secchi Depth).
The transparency of water fluctuated both spatially and temporally. In general,
the highest transparency values were recorded in winter (111±3.32 cm), and the
lowest in monsoon season (71.1±5.45 cm.) (Table. 3.1, Fig.3.4). Transparency
showed positive correlation with dissolved Oxygen DO with at 0.001 level while Ca,
Mg, TH, WC were non significantly correlated and significant negative correlation
with AT, Cl, NO3, PO4, SO4, TS, TSS and TDS at 0.01 level. Transparency also
62
showed highly significant seasonal variations (P< 0.0001, F2 21 28.2).
According to Nayak and Behara (2004), transparency recorded that the whole
lagoon remained turbid throughout the year, the highest Secchi disc depth was 0.91
M. The turbid nature of the lagoon due to influence of freshwater influx during
monsoon from Chilika lagoon near Sipakuda. Sahni and Yadav (2012),transparency
noted ranged between 12.12 to 15.12cms of which higher value (15.12 cm) was
reported in winter season while the lower value (12.12 cm) in summer season. Lower
value of transparency during summer season might be due to low level of water.
Similar conclusion was reported by Kamal et. al. (2007) reported highest in winter
(66 cm) and lowest in monsoon (15 cm) of Mouri River, Khulna, Bangladesh. Kadam
et.al.(2007) from Masoli reservoir of Parbhani district, Maharashta , Syeda and
Shaikh (2013) from Rupsha River, Bangladesh , reported that higher transparencey
occurred, during winter in December (42.4±8.72cm) due to absence of rain, runoff
and flood water as well as gradual settling of suspended particles. Ibrahim
et.al.(2009), reported from Kontagora Reservoir the higher dry season Secchi disc
transparency mean value compared to that of the rainy season could be due to absence
of floodwater, surface run-offs and settling effect of suspended materials that
followed the ending of rainfall. Similar observation was also recorded by Ikom
et.al.(2003) of river Adofi from Nigeria, the higher transparency observed during the
dry season could also be due to reduction in allochthonous substances that find their
ways into the reservoir with flood. According to Adebisi (1981) in Upper Ogun River.
Wade (1985), who observed that onset of rain decreased the Secchi-disc visibility in
two mine lakes around Jos, Nigeria. Lower transparency recorded during rainy season
when there was turbulence and high turbidity, has a corresponding low primary
productivity, because turbidity reduces the amount of light penetration, which in turn
reduces photosynthesis and hence primary productivity.
Idowu et.al. (2013), transparency of the water was lower during the period of
heavy rainfall probably due to flooding of the reservoir, which may have been caused
by higher amount of rainfall during this period due to high turbidity. It could also be
due to decrease in sunlight intensity due to presence of heavy cloud in the
atmosphere, which in turn reduced the quantity of light reaching the water thereby
decreasing light penetration, Egborge (1981) in Asejire Reservoir ; Ikom et. al. (2003)
in River Adofi; Ayoade et.al. (2006) in lakes.
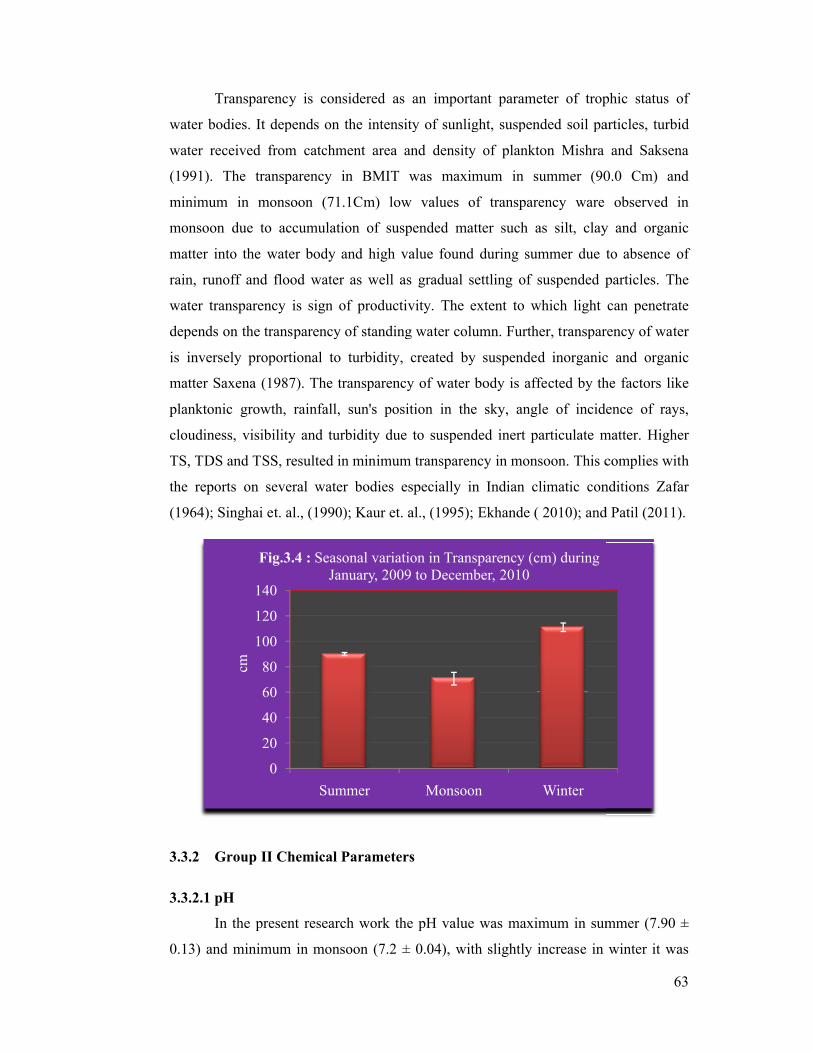
Transparency is considered as an important parameter of trophic status of
water bodies. It depends on the intensity of sunlight, suspended soil particles, tur
water received from catchment area and density of plankton Mishra and Saksena
(1991). The transparency in BMIT
minimum in monsoon (71.1Cm)
monsoon due to accumulation of su
matter into the water body and high value found
rain, runoff and flood water as well as gradual settling of suspended particles. The
water transparency is sign
depends on the transparency of standing water column. Further, transparency of water
is inversely proportional to turbidity, created by suspended inorganic and organic
matter Saxena (1987). The transparency of water b
planktonic growth, rainfall, sun's position in the sky, angle of incidence of rays,
cloudiness, visibility and turbidity due to suspended inert particulate matter. Higher
TS, TDS and TSS, resulted in minimum transparency
the reports on several water bodies especially in Indian climatic conditions Zafar
(1964); Singhai et. al., (1990); Kaur et
3.3.2 Group II Chemical Parameters
3.3.2.1 pH
In the present research work the pH value was maximum in summer (7.90 ±
0.13) and minimum in m
0
20
40
60
80
100
120
140
Summer
Fig.3.4 : Seasonal variation in Transparency (cm) during
cm
Transparency is considered as an important parameter of trophic status of
water bodies. It depends on the intensity of sunlight, suspended soil particles, tur
water received from catchment area and density of plankton Mishra and Saksena
(1991). The transparency in BMIT was maximum in summer (90.0 Cm) and
minimum in monsoon (71.1Cm) low values of transparency ware
monsoon due to accumulation of suspended matter such as silt, clay and organic
matter into the water body and high value found during summer due to absence of
rain, runoff and flood water as well as gradual settling of suspended particles. The
is sign of productivity. The extent to which light can penetrate
depends on the transparency of standing water column. Further, transparency of water
is inversely proportional to turbidity, created by suspended inorganic and organic
matter Saxena (1987). The transparency of water body is affected by the factors like
planktonic growth, rainfall, sun's position in the sky, angle of incidence of rays,
cloudiness, visibility and turbidity due to suspended inert particulate matter. Higher
TS, TDS and TSS, resulted in minimum transparency in monsoon. This complies with
the reports on several water bodies especially in Indian climatic conditions Zafar
(1964); Singhai et. al., (1990); Kaur et. al., (1995); Ekhande ( 2010); and Patil (
II Chemical Parameters
In the present research work the pH value was maximum in summer (7.90 ±
monsoon (7.2 ± 0.04), with slightly increase in winter it was
Summer Monsoon Winter
Seasonal variation in Transparency (cm) during January, 2009 to December, 2010
63
Transparency is considered as an important parameter of trophic status of
water bodies. It depends on the intensity of sunlight, suspended soil particles, turbid
water received from catchment area and density of plankton Mishra and Saksena
maximum in summer (90.0 Cm) and
observed in
spended matter such as silt, clay and organic
due to absence of
rain, runoff and flood water as well as gradual settling of suspended particles. The
he extent to which light can penetrate
depends on the transparency of standing water column. Further, transparency of water
is inversely proportional to turbidity, created by suspended inorganic and organic
ody is affected by the factors like
planktonic growth, rainfall, sun's position in the sky, angle of incidence of rays,
cloudiness, visibility and turbidity due to suspended inert particulate matter. Higher
in monsoon. This complies with
the reports on several water bodies especially in Indian climatic conditions Zafar
nd Patil (2011).
In the present research work the pH value was maximum in summer (7.90 ±
onsoon (7.2 ± 0.04), with slightly increase in winter it was
64
(7.80 ± 0.08). (Table 3.2 , Fig 3.5) pH showed significantly positive correlations with
CA, Mg, and TH at 0.01 level while it showed significant negative correlations with
TSS at 0.05 level. pH showed highly significant seasonal variations (P< 0.0001 F2 21
15.4).
Sharma et.al. (2011) noted that during monsoon season water was turbid; pH
fluctuated between 6.9 to 8.3.The minimum pH was recorded in monsoon, which was
mainly attributed to rain water after a long dry period, and maximum pH was
recorded during summer from Pichhola Lake, Udaipur. Patil et.al. (2011), observed
that pH recorded in summer (8.45 ± 0.097) and minimum in winter (7.48 ± 0.02) in
Lotus lake from Maharashtra.
According to Ujjania and Mistry (2011),the pH was determined by the digital
pH meter and significant variation was observed during the investigation, it was noted
high 7.5 to 7.9 (7.767 ± 0.115) during the immersion period while it was low 6.9 -7.4
(7.150 ± 0.123) and 7.6 – 7.7 (7.710 ± 0.040) during the pre-immersion and post-
immersion period respectively. Devi,et.al.(2013) from fish pond and around
Bhimavaram West Godavari District, (A.P.) the pH of pond water was slightly basic
in nature and the pH of the water samples were in the desired range of 6.5-9.5, the
growth of fish will be good in the range of 7-8 and it is a tolerable range for most
fish.
As per Lokhande (2013), the pH showed varied fluctuations during the study
period with maximum and minimum (7.0 to 8.6) value were noticed at the reservoir,
the maximum was found in April where at its minimum was in August. In the
investigation the pH of the reservoir water was alkaline ranging from 7.0 to 8.6
maximum in summer season and minimum in winter season at Dhanegaon Reservoir,
Osmanabad. The reservoir water was alkaline throughout the period of investigation.
During the study period in the summer season photosynthetic activity was reduced
due to higher temperature which resulted in the accumulation of carbon dioxide and
the subsequent decrease in the pH. According to Verma et. al,(2012), the maximum
pH was recorded during summer season (9.5 ± 0.27) and the minimum was recorded
during winter season (8.7 ±0.11). Alkaline state of pH might be in winter , the amount
of calcium increases during summer season due to rapid oxidation /decomposition of
organic matter (Billore, 1981). Relatively higher proportion of Calcium in the
surrounding rocks and soils might have also contributed to the rich Calcium level in
65
lake water. Calcium is present in water naturally, but the addition of sewage waste
might also be responsible for the increase in amount of calcium. Similar result was
observed in Papnash pond of Karnataka (Angadi et. al., 2005). The decrease may be
due to Calcium being absorbed by living organisms in winter. Kumar et.al (2012), the
pH of water ranged from 7.35 to 7.80. The maximum pH value of 7.80 was recorded
in the month of May, and minimum of 7.35 in February and July, the water body was
found to be slightly alkaline. The alkaline pH of water might be due to presence of
alkalinity minerals in water and slightly higher pH values during non-monsoon could
be recognized to increase photo synthetic assimilation of dissolved inorganic carbon
by planktons (Patil, 2012).
According to Fakayode (2005) the pH of a water body is very important in
determination of water quality since it affects other chemical reactions such as
solubility and metal toxicity. The pH of the water under study area is within the WHO
standards of 6.50-8.50. In the present study, the pH value was found to fluctuate from
7.20 to 7.90 at BMIT, indicating that the waters were neutral to alkaline at various
months. The highest value of pH was recorded during summer season (7.90) and the
lowest was recorded during monsoon season (7.20) (Table3.2). The low value during
monsoon might be due to dilution of rain water. A fall in pH value in monsoon season
was also recorded by Shardendu and Ambasht (1998). Whereas Venkateswarlu (1969)
and Jana (1973) observed high pH values during summer and slightly lower in winter
months. According to Zafar (1966) the pH of water is reliant to relative quantizes of
Calcium carbonate and bicarbonates the water tend to be more alkaline when it
possesses carbonates while it is much alkaline when it possesses larger quantizes of
bicarbonates,CO2 and Calcium. Higher pH value of summer can be due to utilization
of bicarbonate and carbonate buffer system Mehrotra (1988). According to Kaul and
Handoo (1980) and Satpathy et. al. (2007) were the pH of water is higher due to
increased metabolic autotrophic activities. Many reports were given different pH
ranges as ideal for supporting aquatic life. However all these ranges fall around
similar point between 6.7 to 8.5 De (1999) and the pH level of BMIT water was in
within the limit range.
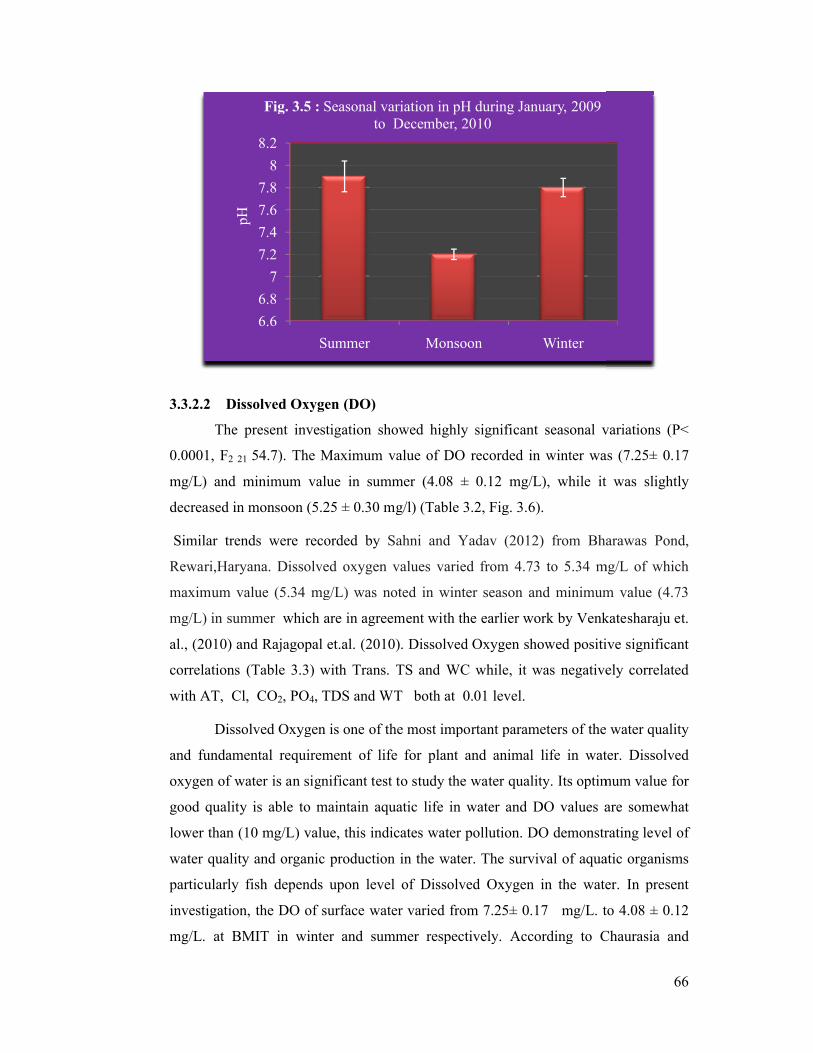
3.3.2.2 Dissolved Oxygen (DO)
The present investigation showed highly significant seasonal variations (P<
0.0001, F2 21 54.7). The Maximum value of DO recorded in winter
mg/L) and minimum value in
decreased in monsoon (5.25 ± 0.30 mg/l) (Table 3.2, Fig. 3.
Similar trends were recorded by
Rewari,Haryana. Dissolved oxygen
maximum value (5.34 mg/L) was noted in winter season and minimum value (4.73
mg/L) in summer which
al., (2010) and Rajagopal
correlations (Table 3.3) with
with AT, Cl, CO2, PO4, TDS
Dissolved Oxygen is one of the most important parameters of the water quality
and fundamental requirement of life for plant and animal life in water. Dissolved
oxygen of water is an significant test to study the water quality. Its optimum value for
good quality is able to maintain aquatic life in water and DO values are somewhat
lower than (10 mg/L) value, this indicates water pollution.
water quality and organic production in the water. The
particularly fish depends
investigation, the DO of surface water varied from 7.25± 0.17 mg/
mg/L. at BMIT in winter and summer respectively
6.6
6.8
7
7.2
7.4
7.6
7.8
8
8.2
Summer
Fig. 3.5 :
pH
Dissolved Oxygen (DO)
present investigation showed highly significant seasonal variations (P<
54.7). The Maximum value of DO recorded in winter was
minimum value in summer (4.08 ± 0.12 mg/L), while it was slightly
in monsoon (5.25 ± 0.30 mg/l) (Table 3.2, Fig. 3.6).
recorded by Sahni and Yadav (2012) from Bharawas Pond,
Dissolved oxygen values varied from 4.73 to 5.34 mg/L of which
maximum value (5.34 mg/L) was noted in winter season and minimum value (4.73
which are in agreement with the earlier work by Venkatesharaju et
and Rajagopal et.al. (2010). Dissolved Oxygen showed positive significant
) with Trans. TS and WC while, it was negatively correlated
, TDS and WT both at 0.01 level.
Dissolved Oxygen is one of the most important parameters of the water quality
and fundamental requirement of life for plant and animal life in water. Dissolved
oxygen of water is an significant test to study the water quality. Its optimum value for
ality is able to maintain aquatic life in water and DO values are somewhat
value, this indicates water pollution. DO demonstrating level of
water quality and organic production in the water. The survival of aquatic organisms
s upon level of Dissolved Oxygen in the water. In present
investigation, the DO of surface water varied from 7.25± 0.17 mg/L. to 4.08 ± 0.12
. at BMIT in winter and summer respectively. According to Chaurasia and
Summer Monsoon Winter
Fig. 3.5 : Seasonal variation in pH during January, 2009 to December, 2010
66
present investigation showed highly significant seasonal variations (P<
was (7.25± 0.17
), while it was slightly
from Bharawas Pond,
from 4.73 to 5.34 mg/L of which
maximum value (5.34 mg/L) was noted in winter season and minimum value (4.73
Venkatesharaju et.
ed positive significant
while, it was negatively correlated
Dissolved Oxygen is one of the most important parameters of the water quality
and fundamental requirement of life for plant and animal life in water. Dissolved
oxygen of water is an significant test to study the water quality. Its optimum value for
ality is able to maintain aquatic life in water and DO values are somewhat
demonstrating level of
urvival of aquatic organisms
upon level of Dissolved Oxygen in the water. In present
to 4.08 ± 0.12
According to Chaurasia and
Seasonal variation in pH during January, 2009
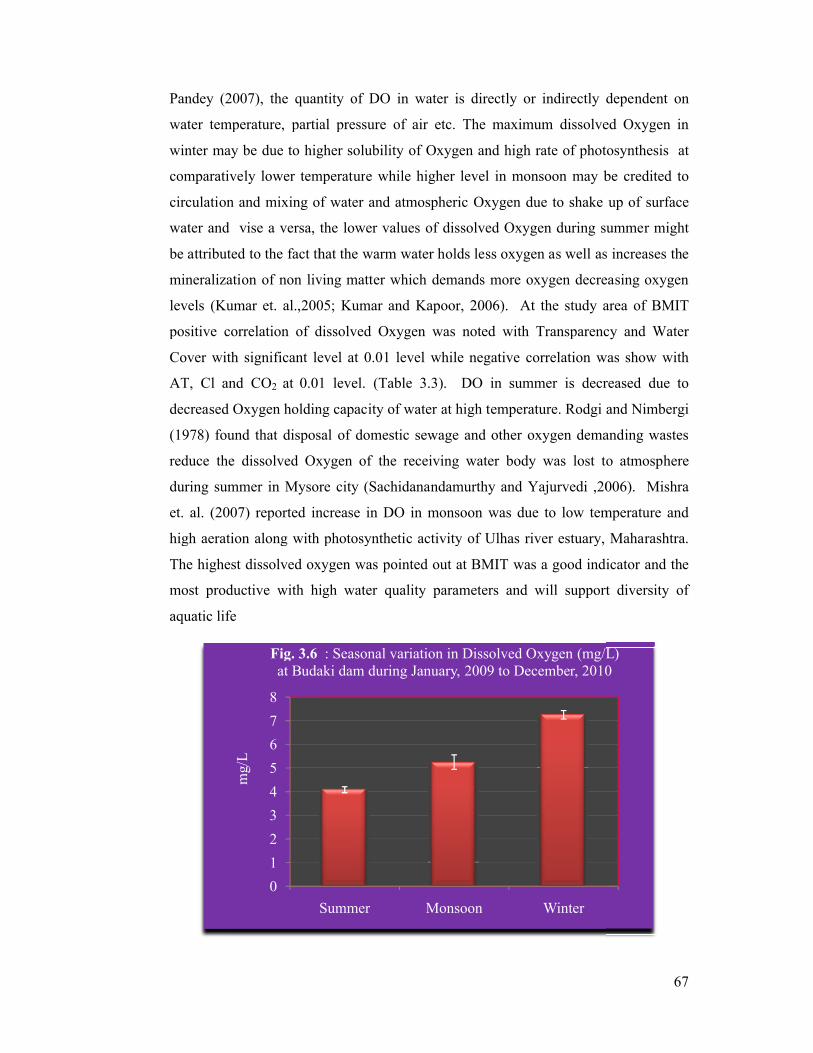
Pandey (2007), the quantity of DO in water is directly or indirectly dependent on
water temperature, partial pressure of air etc. The maximum dissolved
winter may be due to higher solubility of
comparatively lower temperatur
circulation and mixing of water and atmospheric
water and vise a versa, the lower values of dissolved
be attributed to the fact that the warm w
mineralization of non living matter which demands more oxygen decreasing oxygen
levels (Kumar et. al.,2005
positive correlation of dissolved
Cover with significant level at 0.0
AT, Cl and CO2 at 0.01
decreased Oxygen holding capacity of water at high temperature
(1978) found that disposal of domestic sewage and other oxygen demanding wastes
reduce the dissolved Oxygen of the receiving water body
during summer in Mysore
et. al. (2007) reported increase in DO in monsoon
high aeration along with photosynthetic activity
The highest dissolved oxygen
most productive with high
aquatic life
0
1
2
3
4
5
6
7
8
Summer
Fig. 3.6 at Budaki dam during January, 2009 to December, 2010
mg/
L
antity of DO in water is directly or indirectly dependent on
water temperature, partial pressure of air etc. The maximum dissolved
winter may be due to higher solubility of Oxygen and high rate of photosynthesis at
comparatively lower temperature while higher level in monsoon may be credited to
circulation and mixing of water and atmospheric Oxygen due to shake
ise a versa, the lower values of dissolved Oxygen during summer m
be attributed to the fact that the warm water holds less oxygen as well as increases the
mineralization of non living matter which demands more oxygen decreasing oxygen
2005; Kumar and Kapoor, 2006). At the study area
positive correlation of dissolved Oxygen was noted with Transparenc
Cover with significant level at 0.01 level while negative correlation was
1 level. (Table 3.3). DO in summer is decreased
xygen holding capacity of water at high temperature. Rodgi and
that disposal of domestic sewage and other oxygen demanding wastes
xygen of the receiving water body was lost to atmosphere
in Mysore city (Sachidanandamurthy and Yajurvedi ,2006)
ncrease in DO in monsoon was due to low temperature and
high aeration along with photosynthetic activity of Ulhas river estuary, Maharashtra
The highest dissolved oxygen was pointed out at BMIT was a good indicator and
with high water quality parameters and will support diversity of
Summer Monsoon Winter
Fig. 3.6 : Seasonal variation in Dissolved Oxygen (mg/L) at Budaki dam during January, 2009 to December, 2010
67
antity of DO in water is directly or indirectly dependent on
water temperature, partial pressure of air etc. The maximum dissolved Oxygen in
xygen and high rate of photosynthesis at
e while higher level in monsoon may be credited to
up of surface
xygen during summer might
ater holds less oxygen as well as increases the
mineralization of non living matter which demands more oxygen decreasing oxygen
At the study area of BMIT
Transparency and Water
was show with
decreased due to
and Nimbergi
that disposal of domestic sewage and other oxygen demanding wastes
lost to atmosphere
2006). Mishra
s due to low temperature and
of Ulhas river estuary, Maharashtra.
out at BMIT was a good indicator and the
water quality parameters and will support diversity of
: Seasonal variation in Dissolved Oxygen (mg/L) at Budaki dam during January, 2009 to December, 2010
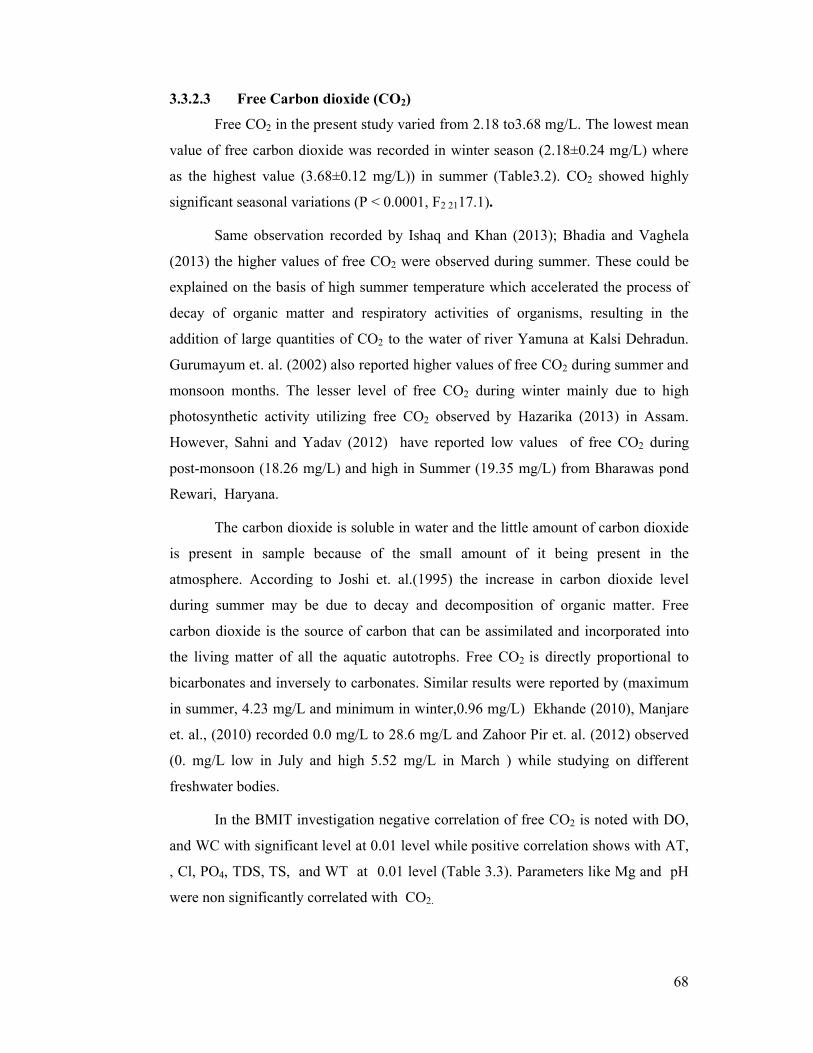
68
3.3.2.3 Free Carbon dioxide (CO2)
Free CO2 in the present study varied from 2.18 to3.68 mg/L. The lowest mean
value of free carbon dioxide was recorded in winter season (2.18±0.24 mg/L) where
as the highest value (3.68±0.12 mg/L)) in summer (Table3.2). CO2 showed highly
significant seasonal variations (P < 0.0001, F2 2117.1).
Same observation recorded by Ishaq and Khan (2013); Bhadia and Vaghela
(2013) the higher values of free CO2 were observed during summer. These could be
explained on the basis of high summer temperature which accelerated the process of
decay of organic matter and respiratory activities of organisms, resulting in the
addition of large quantities of CO2 to the water of river Yamuna at Kalsi Dehradun.
Gurumayum et. al. (2002) also reported higher values of free CO2 during summer and
monsoon months. The lesser level of free CO2 during winter mainly due to high
photosynthetic activity utilizing free CO2 observed by Hazarika (2013) in Assam.
However, Sahni and Yadav (2012) have reported low values of free CO2 during
post-monsoon (18.26 mg/L) and high in Summer (19.35 mg/L) from Bharawas pond
Rewari, Haryana.
The carbon dioxide is soluble in water and the little amount of carbon dioxide
is present in sample because of the small amount of it being present in the
atmosphere. According to Joshi et. al.(1995) the increase in carbon dioxide level
during summer may be due to decay and decomposition of organic matter. Free
carbon dioxide is the source of carbon that can be assimilated and incorporated into
the living matter of all the aquatic autotrophs. Free CO2 is directly proportional to
bicarbonates and inversely to carbonates. Similar results were reported by (maximum
in summer, 4.23 mg/L and minimum in winter,0.96 mg/L) Ekhande (2010), Manjare
et. al., (2010) recorded 0.0 mg/L to 28.6 mg/L and Zahoor Pir et. al. (2012) observed
(0. mg/L low in July and high 5.52 mg/L in March ) while studying on different
freshwater bodies.
In the BMIT investigation negative correlation of free CO2 is noted with DO,
and WC with significant level at 0.01 level while positive correlation shows with AT,
, Cl, PO4, TDS, TS, and WT at 0.01 level (Table 3.3). Parameters like Mg and pH
were non significantly correlated with CO2.
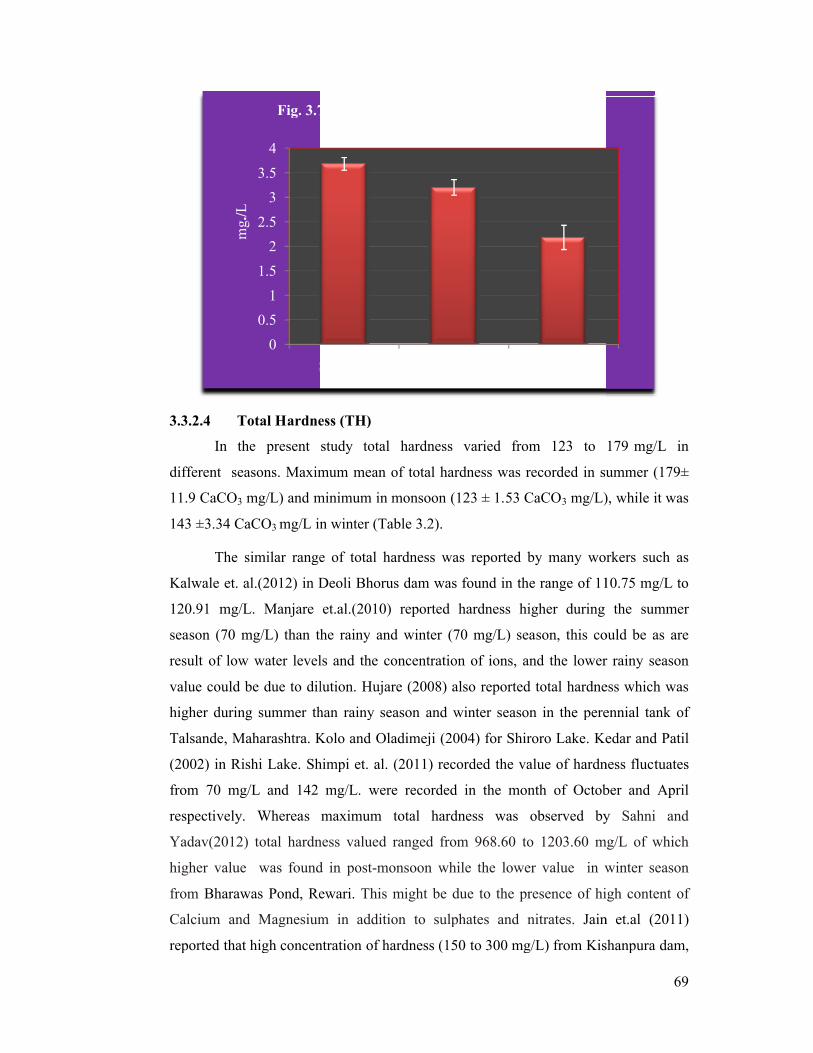
3.3.2.4 Total Hardness (TH)
In the present study total hardness varied from 123 to 179 mg/
different seasons. Maximum mean of
11.9 CaCO3 mg/L) and minimum in monsoon (123 ± 1.53 CaCO
143 ±3.34 CaCO3 mg/L in winter (Table 3.2).
The similar range of total hardness was
Kalwale et. al.(2012) in Deoli Bhorus dam was found in the range of 110.75 m
120.91 mg/L. Manjare
season (70 mg/L) than the rainy
result of low water levels and the concentration of ions, and the lower rainy season
value could be due to dilution.
higher during summer than rainy season and winter
Talsande, Maharashtra. Kolo and Oladimeji (2004) for Shiroro
(2002) in Rishi Lake. Shimpi et.
from 70 mg/L and 142 mg/
respectively. Whereas maximum total hardness was observed by
Yadav(2012) total hardness value
higher value was found in post
from Bharawas Pond, Rewari.
Calcium and Magnesium in addition to sulphate
reported that high concentration of hardness (150 to 300 mg/
0
0.5
1
1.5
2
2.5
3
3.5
4
Summer
Fig. 3.7 :
mg.
/L
Total Hardness (TH)
In the present study total hardness varied from 123 to 179 mg/
different seasons. Maximum mean of total hardness was recorded in summer (179±
and minimum in monsoon (123 ± 1.53 CaCO3 mg/L), while it was
in winter (Table 3.2).
The similar range of total hardness was reported by many workers such as
in Deoli Bhorus dam was found in the range of 110.75 m
et.al.(2010) reported hardness higher during the
than the rainy and winter (70 mg/L) season, this could be as are
result of low water levels and the concentration of ions, and the lower rainy season
could be due to dilution. Hujare (2008) also reported total hardness
summer than rainy season and winter season in the perennial tank
Kolo and Oladimeji (2004) for Shiroro Lake. Kedar and Patil
Shimpi et. al. (2011) recorded the value of hardness fluctuates
142 mg/L. were recorded in the month of October and
Whereas maximum total hardness was observed by
ardness valued ranged from 968.60 to 1203.60 mg/
higher value was found in post-monsoon while the lower value in winter season
Bharawas Pond, Rewari. This might be due to the presence of high content of
agnesium in addition to sulphates and nitrates. Jain et.al (
reported that high concentration of hardness (150 to 300 mg/L) from Kishanpura dam,
Summer Monsoon Winter
Fig. 3.7 : Seasonal variation in CO2 (mg/L) during January, 2009 to December, 2010
69
In the present study total hardness varied from 123 to 179 mg/L in
was recorded in summer (179±
), while it was
many workers such as
in Deoli Bhorus dam was found in the range of 110.75 mg/L to
hardness higher during the summer
his could be as are
result of low water levels and the concentration of ions, and the lower rainy season
reported total hardness which was
perennial tank of
Kedar and Patil
he value of hardness fluctuates
October and April
Whereas maximum total hardness was observed by Sahni and
from 968.60 to 1203.60 mg/L of which
monsoon while the lower value in winter season
be due to the presence of high content of
Jain et.al (2011)
Kishanpura dam,
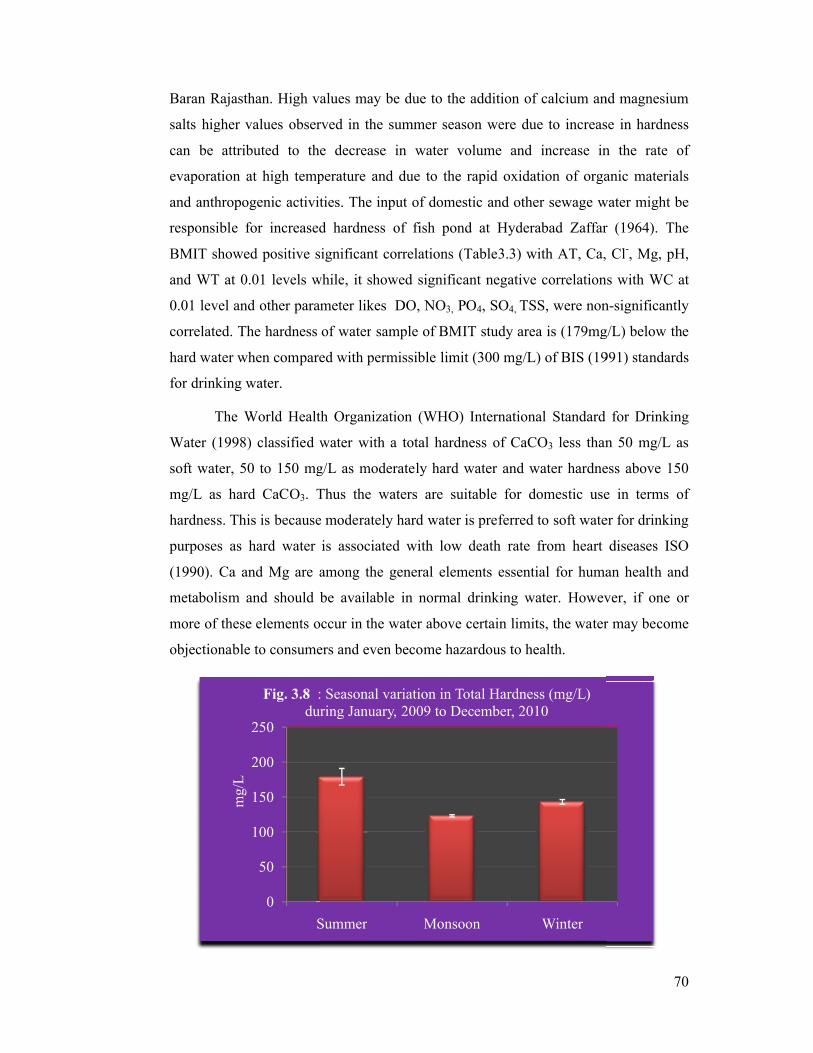
Baran Rajasthan. High values may
salts higher values observed in the summer season
can be attributed to the decrease in water volume and increase in the rate of
evaporation at high temperature and due to the rapid oxidation of organic materials
and anthropogenic activities.
responsible for increased hardness
BMIT showed positive significant correlations (
and WT at 0.01 levels while
0.01 level and other parameter likes
correlated. The hardness of water
hard water when compared with permissible
for drinking water.
The World Health Organization (WHO) International Standard for Drinking
Water (1998) classified water with a total hardness of CaCO
soft water, 50 to 150 mg/
mg/L as hard CaCO3. Thus the waters are suitable for domestic use in terms of
hardness. This is because moderately hard water is preferred to soft water for drinking
purposes as hard water is associate
(1990). Ca and Mg are among the general elements essential for human health and
metabolism and should be available in normal drinking water. However, if one or
more of these elements occur in the water above ce
objectionable to consumers and even become hazardous to health.
0
50
100
150
200
250
Summer
Fig. 3.8 : Seasonal variation in Total Hardness (mg/L) during January, 2009 to December, 2010
mg/
L
igh values may be due to the addition of calcium and magnesium
igher values observed in the summer season were due to increase
can be attributed to the decrease in water volume and increase in the rate of
temperature and due to the rapid oxidation of organic materials
and anthropogenic activities. The input of domestic and other sewage water might be
increased hardness of fish pond at Hyderabad Zaffar (1964).
BMIT showed positive significant correlations (Table3.3) with AT, Ca, Cl
while, it showed significant negative correlations with
0.01 level and other parameter likes DO, NO3, PO4, SO4, TSS, were non
hardness of water sample of BMIT study area is (179mg/L)
hard water when compared with permissible limit (300 mg/L) of BIS (1991) standards
The World Health Organization (WHO) International Standard for Drinking
Water (1998) classified water with a total hardness of CaCO3 less than 50 mg/
soft water, 50 to 150 mg/L as moderately hard water and water hardness above 150
. Thus the waters are suitable for domestic use in terms of
hardness. This is because moderately hard water is preferred to soft water for drinking
purposes as hard water is associated with low death rate from heart diseases ISO
1990). Ca and Mg are among the general elements essential for human health and
metabolism and should be available in normal drinking water. However, if one or
more of these elements occur in the water above certain limits, the water may become
objectionable to consumers and even become hazardous to health.
Summer Monsoon Winter
: Seasonal variation in Total Hardness (mg/L) during January, 2009 to December, 2010
70
be due to the addition of calcium and magnesium
increase in hardness
can be attributed to the decrease in water volume and increase in the rate of
temperature and due to the rapid oxidation of organic materials
The input of domestic and other sewage water might be
Zaffar (1964). The
Ca, Cl-, Mg, pH,
significant negative correlations with WC at
were non-significantly
(179mg/L) below the
of BIS (1991) standards
The World Health Organization (WHO) International Standard for Drinking
less than 50 mg/L as
as moderately hard water and water hardness above 150
. Thus the waters are suitable for domestic use in terms of
hardness. This is because moderately hard water is preferred to soft water for drinking
d with low death rate from heart diseases ISO
1990). Ca and Mg are among the general elements essential for human health and
metabolism and should be available in normal drinking water. However, if one or
rtain limits, the water may become
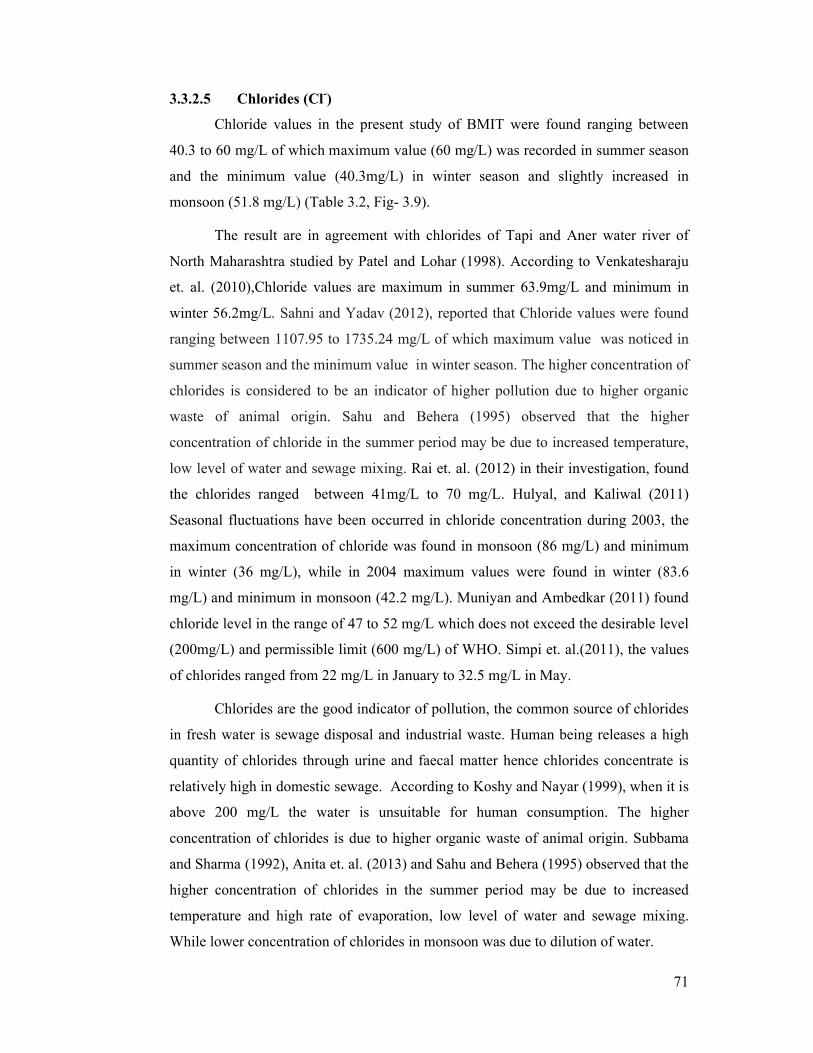
71
3.3.2.5 Chlorides (Cl-)
Chloride values in the present study of BMIT were found ranging between
40.3 to 60 mg/L of which maximum value (60 mg/L) was recorded in summer season
and the minimum value (40.3mg/L) in winter season and slightly increased in
monsoon (51.8 mg/L) (Table 3.2, Fig- 3.9).
The result are in agreement with chlorides of Tapi and Aner water river of
North Maharashtra studied by Patel and Lohar (1998). According to Venkatesharaju
et. al. (2010),Chloride values are maximum in summer 63.9mg/L and minimum in
winter 56.2mg/L. Sahni and Yadav (2012), reported that Chloride values were found
ranging between 1107.95 to 1735.24 mg/L of which maximum value was noticed in
summer season and the minimum value in winter season. The higher concentration of
chlorides is considered to be an indicator of higher pollution due to higher organic
waste of animal origin. Sahu and Behera (1995) observed that the higher
concentration of chloride in the summer period may be due to increased temperature,
low level of water and sewage mixing. Rai et. al. (2012) in their investigation, found
the chlorides ranged between 41mg/L to 70 mg/L. Hulyal, and Kaliwal (2011)
Seasonal fluctuations have been occurred in chloride concentration during 2003, the
maximum concentration of chloride was found in monsoon (86 mg/L) and minimum
in winter (36 mg/L), while in 2004 maximum values were found in winter (83.6
mg/L) and minimum in monsoon (42.2 mg/L). Muniyan and Ambedkar (2011) found
chloride level in the range of 47 to 52 mg/L which does not exceed the desirable level
(200mg/L) and permissible limit (600 mg/L) of WHO. Simpi et. al.(2011), the values
of chlorides ranged from 22 mg/L in January to 32.5 mg/L in May.
Chlorides are the good indicator of pollution, the common source of chlorides
in fresh water is sewage disposal and industrial waste. Human being releases a high
quantity of chlorides through urine and faecal matter hence chlorides concentrate is
relatively high in domestic sewage. According to Koshy and Nayar (1999), when it is
above 200 mg/L the water is unsuitable for human consumption. The higher
concentration of chlorides is due to higher organic waste of animal origin. Subbama
and Sharma (1992), Anita et. al. (2013) and Sahu and Behera (1995) observed that the
higher concentration of chlorides in the summer period may be due to increased
temperature and high rate of evaporation, low level of water and sewage mixing.
While lower concentration of chlorides in monsoon was due to dilution of water.
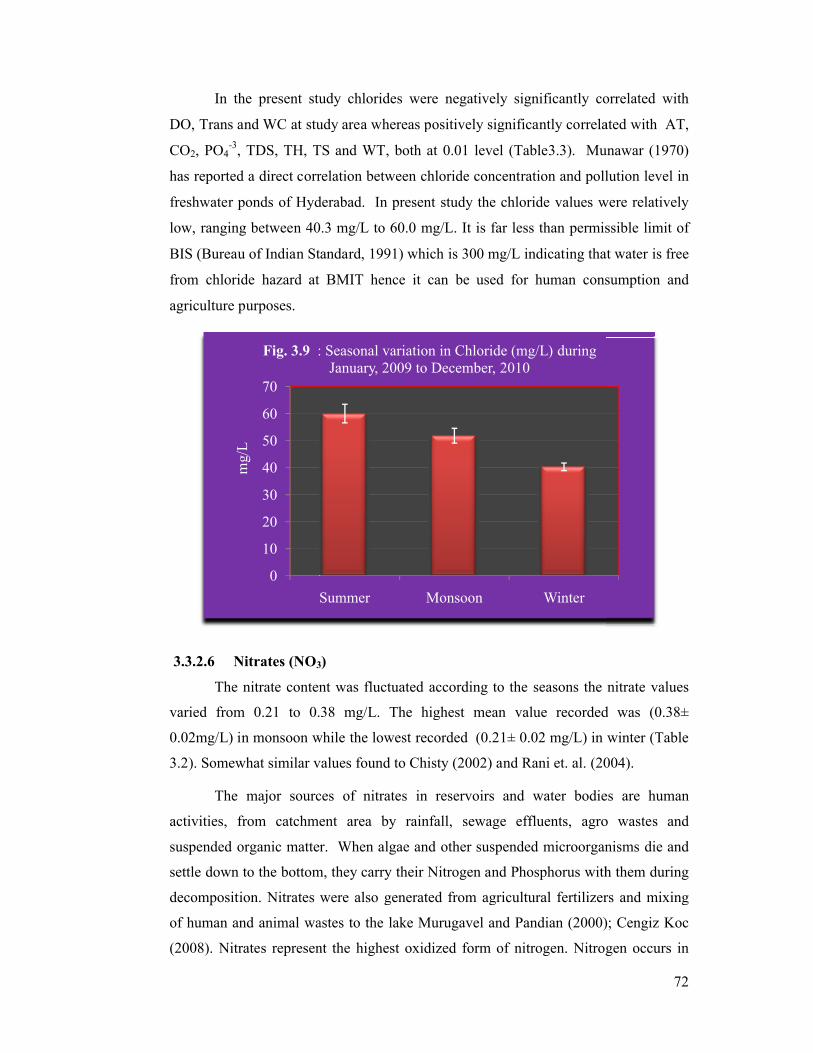
In the present study chloride
DO, Trans and WC at study area whereas positively significantly correlated with AT,
CO2, PO4-3, TDS, TH, TS and WT
has reported a direct correlation between chloride concentration and pollution level in
freshwater ponds of Hyderabad. In present study the chloride values
low, ranging between 40.3 mg/
BIS (Bureau of Indian Standard
from chloride hazard at BMIT hence it
agriculture purposes.
3.3.2.6 Nitrates (NO3
The nitrate content was fluctuated
varied from 0.21 to 0.38 mg/
0.02mg/L) in monsoon while
3.2). Somewhat similar values found to Chisty (2002) and Rani
The major sources of nitrate
activities, from catchment area by rainfall, sewage effluents, agro waste
suspended organic matter.
settle down to the bottom
decomposition. Nitrates were
of human and animal wastes to the lake
(2008). Nitrates represent the highest oxidized form of nitrogen. Nitrogen occurs in
0
10
20
30
40
50
60
70
Summer
Fig. 3.9 : Seasonal variation in Chloride (mg/L) during
mg/
L
In the present study chlorides were negatively significantly correlated with
DO, Trans and WC at study area whereas positively significantly correlated with AT,
TS and WT, both at 0.01 level (Table3.3). Munawar (1970)
has reported a direct correlation between chloride concentration and pollution level in
freshwater ponds of Hyderabad. In present study the chloride values we
low, ranging between 40.3 mg/L to 60.0 mg/L. It is far less than permissible limit of
BIS (Bureau of Indian Standard, 1991) which is 300 mg/L indicating that water is free
from chloride hazard at BMIT hence it can be used for human consumption and
3)
The nitrate content was fluctuated according to the seasons the
varied from 0.21 to 0.38 mg/L. The highest mean value recorded
monsoon while the lowest recorded (0.21± 0.02 mg/L) in
omewhat similar values found to Chisty (2002) and Rani et. al. (2004).
The major sources of nitrates in reservoirs and water bodies are
activities, from catchment area by rainfall, sewage effluents, agro waste
matter. When algae and other suspended microorganisms die and
settle down to the bottom, they carry their Nitrogen and Phosphorus with them during
were also generated from agricultural fertilizers and mixing
of human and animal wastes to the lake Murugavel and Pandian (2000); Cengiz Koc
represent the highest oxidized form of nitrogen. Nitrogen occurs in
Summer Monsoon Winter
: Seasonal variation in Chloride (mg/L) during January, 2009 to December, 2010
72
correlated with
DO, Trans and WC at study area whereas positively significantly correlated with AT,
Munawar (1970)
has reported a direct correlation between chloride concentration and pollution level in
were relatively
missible limit of
indicating that water is free
used for human consumption and
nitrate values
The highest mean value recorded was (0.38±
in winter (Table
(2004).
and water bodies are human
activities, from catchment area by rainfall, sewage effluents, agro wastes and
lgae and other suspended microorganisms die and
hosphorus with them during
also generated from agricultural fertilizers and mixing
Murugavel and Pandian (2000); Cengiz Koc
represent the highest oxidized form of nitrogen. Nitrogen occurs in
73
freshwaters in various forms such as, dissolved molecular nitrogen, inorganic nitrogen
in the form of ammonia, nitrites, nitrates, organic nitrogen as amino acids, proteins
and various complex organic compounds. Nnaji et. al.(2010) and Manjare et. al.
(2010) observed the similar values of freshwater bodies, while studying on river
Galma, Zaria, Nigeria and Tamdalge tank in Kolhapur district, Maharashtra
respectively. Jakher and Rawat (2003), also recorded the similar observation in a
tropical lake of Jodhpur, Rajasthan. The reverse observation was found by
Ramalingam et. al. (2011), the nitrate content was fluctuated between the stations as
well as the seasons as per him. The nitrate values varied from 0.11 to 0.90 mg/L. Patra
et.al. (2010), recorded in pre monsoon season maximum value of nitrate was
117.4±0.37 μmol/L in Chadheiguha area of Central sector and minimum amount was
found to be 1.55±0.15 μmol/L in Sanakuda area of Southern sector. As per Shib
Abir(2014), the maximum value of nitrates was recorded as 8.1mg/L in the month of
August (Monsoon) and minimum value observed in May (Summer) 2.4mg/L with a
mean value of 5.54. According to Manjare et.al. (2010) the maximum value
(37.5mg/l) was recorded in the month of July (monsoon) and minimum (4.40mg/l) in
the month of November (winter).
All organisms require Nitrogen for the basic process of life to synthesize
protein required for growth and reproduction. The presence of nitrates in the water
samples is suggestive of some bacterial action and bacterial growth. These findings
support the observations of Majumder et. al., (2006). Nitrates in natural waters can
be traced to percolating nitrates from sources such as decaying plant and animal
material, agricultural fertilizers, domestic sewage (Adeyeye and Abulude ,2004). The
nitrate content, more than 100 mg /L impart bitter taste to water and may cause
physiological problem. The high concentration of nitrates in drinking water is toxic
(Umavathi et. al., 2007). Drinking water contains more than 500 mg/L nitrates can
cause methamoglobinemia in infants. (Uba and Aghogo, 2001). Nitrates cause the
overgrowth of algae, other organisms and foul the water system.
Generally water bodies polluted by organic matter indicates higher values of
nitrates but the levels of nitrates in BMIT water were within the range of
permissible limit given by WHO i.e. 45 mg/L for human consumption and agriculture
purposes. Nitrates showed positive significant correlations (Table 3.3) with PO4,- SO4,
TSS, and TS while significant negative correlations with Trans. both at the 0.01 and
0.05 level.
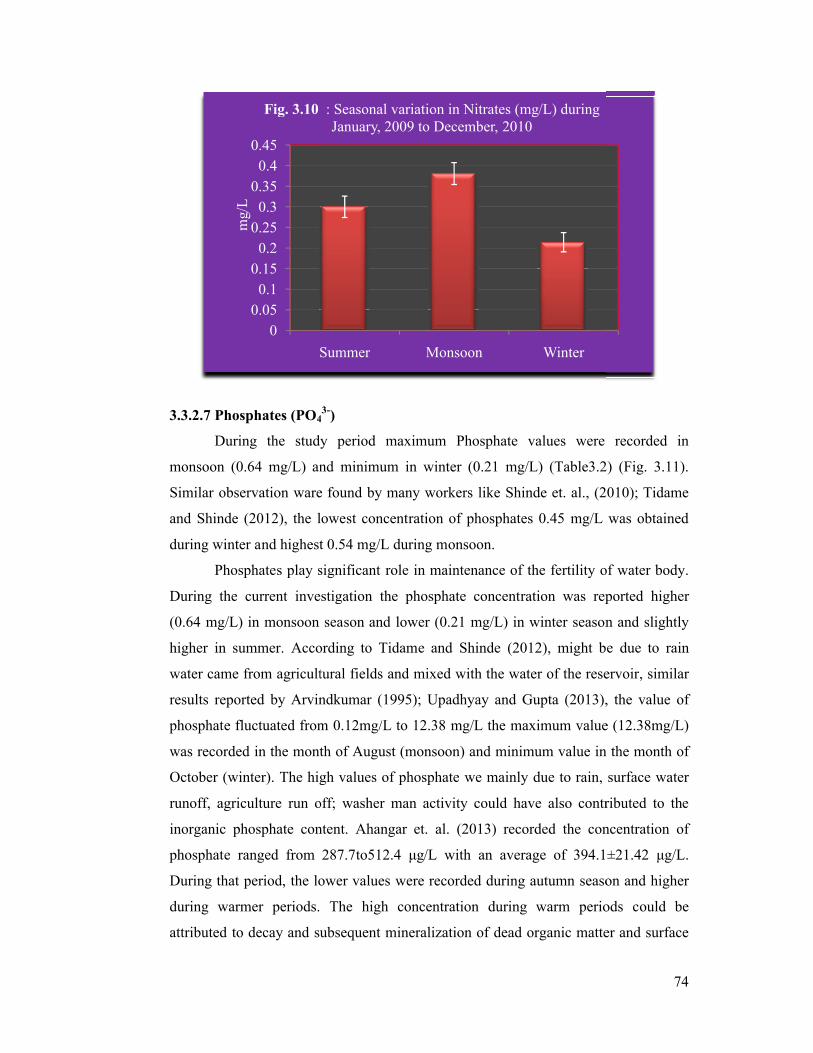
3.3.2.7 Phosphates (PO4
During the study period maximum Phosphate values were recorded in
monsoon (0.64 mg/L) and minimum in winter (0.21 mg/L) (Table3.2) (Fig. 3.11).
Similar observation ware found by many workers like Shinde
and Shinde (2012), the lowe
during winter and highest 0.54 mg/L during monsoon.
Phosphates play significant role in maintenance of the fertility of water body.
During the current investigation the phosphate concentration was repo
(0.64 mg/L) in monsoon season and lower (0.21 mg/
higher in summer. According to
water came from agricultural fields and mixed with the water of the reservoir
results reported by Arvindkumar (1995)
phosphate fluctuated from 0.12mg/
was recorded in the month of August (monsoon) and minimum value in the month of
October (winter). The high values of phosphate
runoff, agriculture run off; washer man activity could have also contributed to the
inorganic phosphate content
phosphate ranged from 287.7
During that period, the lower values were recorded during autumn season and higher
during warmer periods. The high concentration during warm periods c
attributed to decay and subsequent m
00.050.1
0.150.2
0.250.3
0.350.4
0.45
Summer
Fig. 3.10
mg/
L
43-)
During the study period maximum Phosphate values were recorded in
monsoon (0.64 mg/L) and minimum in winter (0.21 mg/L) (Table3.2) (Fig. 3.11).
Similar observation ware found by many workers like Shinde et. al., (2010); Tidame
the lowest concentration of phosphates 0.45 mg/L was obtained
during winter and highest 0.54 mg/L during monsoon.
play significant role in maintenance of the fertility of water body.
During the current investigation the phosphate concentration was repo
) in monsoon season and lower (0.21 mg/L) in winter season and slightly
According to Tidame and Shinde (2012), might be due to rain
water came from agricultural fields and mixed with the water of the reservoir
results reported by Arvindkumar (1995); Upadhyay and Gupta (2013), the value of
from 0.12mg/L to 12.38 mg/L the maximum value (12.38mg/
was recorded in the month of August (monsoon) and minimum value in the month of
winter). The high values of phosphate we mainly due to rain, surface water
runoff, agriculture run off; washer man activity could have also contributed to the
inorganic phosphate content. Ahangar et. al. (2013) recorded the concentration of
d from 287.7to512.4 μg/L with an average of 394.1±21.42 μg/L.
During that period, the lower values were recorded during autumn season and higher
during warmer periods. The high concentration during warm periods c
attributed to decay and subsequent mineralization of dead organic matter and surface
Summer Monsoon Winter
Fig. 3.10 : Seasonal variation in Nitrates (mg/L) during January, 2009 to December, 2010
74
During the study period maximum Phosphate values were recorded in
monsoon (0.64 mg/L) and minimum in winter (0.21 mg/L) (Table3.2) (Fig. 3.11).
, (2010); Tidame
st concentration of phosphates 0.45 mg/L was obtained
play significant role in maintenance of the fertility of water body.
During the current investigation the phosphate concentration was reported higher
) in winter season and slightly
be due to rain
water came from agricultural fields and mixed with the water of the reservoir, similar
Upadhyay and Gupta (2013), the value of
the maximum value (12.38mg/L)
was recorded in the month of August (monsoon) and minimum value in the month of
mainly due to rain, surface water
runoff, agriculture run off; washer man activity could have also contributed to the
) recorded the concentration of
to512.4 μg/L with an average of 394.1±21.42 μg/L.
During that period, the lower values were recorded during autumn season and higher
during warmer periods. The high concentration during warm periods could be
ineralization of dead organic matter and surface
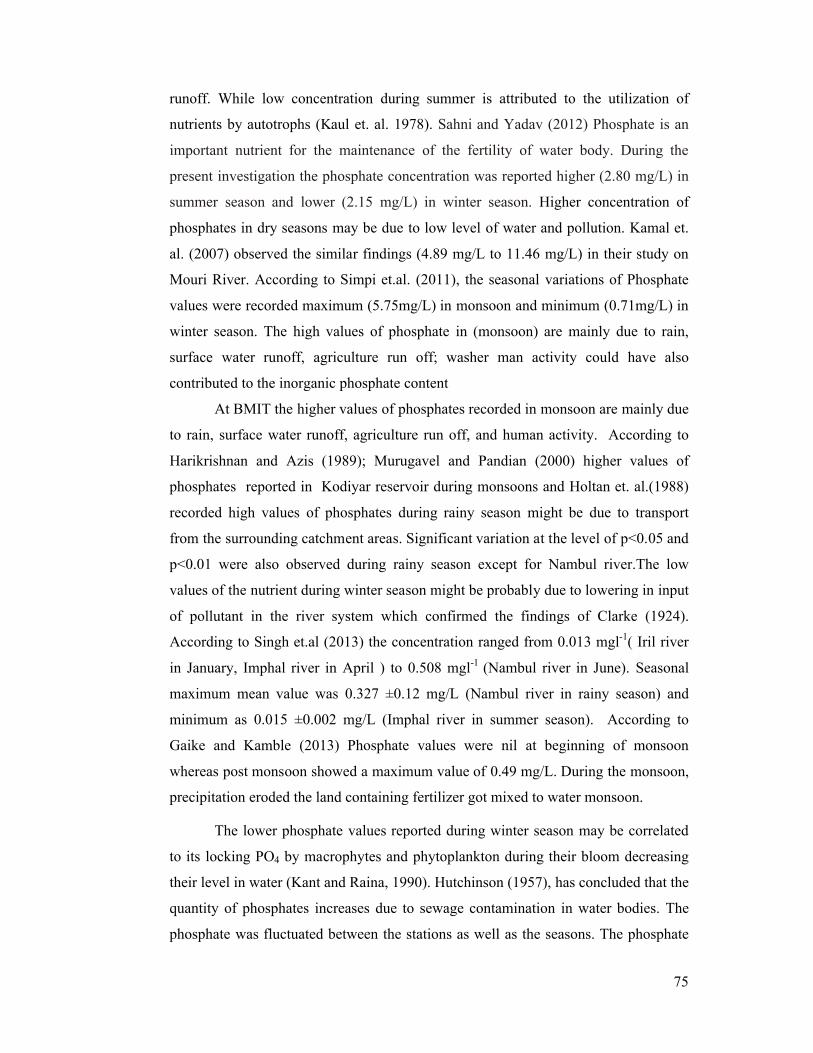
75
runoff. While low concentration during summer is attributed to the utilization of
nutrients by autotrophs (Kaul et. al. 1978). Sahni and Yadav (2012) Phosphate is an
important nutrient for the maintenance of the fertility of water body. During the
present investigation the phosphate concentration was reported higher (2.80 mg/L) in
summer season and lower (2.15 mg/L) in winter season. Higher concentration of
phosphates in dry seasons may be due to low level of water and pollution. Kamal et.
al. (2007) observed the similar findings (4.89 mg/L to 11.46 mg/L) in their study on
Mouri River. According to Simpi et.al. (2011), the seasonal variations of Phosphate
values were recorded maximum (5.75mg/L) in monsoon and minimum (0.71mg/L) in
winter season. The high values of phosphate in (monsoon) are mainly due to rain,
surface water runoff, agriculture run off; washer man activity could have also
contributed to the inorganic phosphate content
At BMIT the higher values of phosphates recorded in monsoon are mainly due
to rain, surface water runoff, agriculture run off, and human activity. According to
Harikrishnan and Azis (1989); Murugavel and Pandian (2000) higher values of
phosphates reported in Kodiyar reservoir during monsoons and Holtan et. al.(1988)
recorded high values of phosphates during rainy season might be due to transport
from the surrounding catchment areas. Significant variation at the level of p<0.05 and
p<0.01 were also observed during rainy season except for Nambul river.The low
values of the nutrient during winter season might be probably due to lowering in input
of pollutant in the river system which confirmed the findings of Clarke (1924).
According to Singh et.al (2013) the concentration ranged from 0.013 mgl-1( Iril river
in January, Imphal river in April ) to 0.508 mgl-1 (Nambul river in June). Seasonal
maximum mean value was 0.327 ±0.12 mg/L (Nambul river in rainy season) and
minimum as 0.015 ±0.002 mg/L (Imphal river in summer season). According to
Gaike and Kamble (2013) Phosphate values were nil at beginning of monsoon
whereas post monsoon showed a maximum value of 0.49 mg/L. During the monsoon,
precipitation eroded the land containing fertilizer got mixed to water monsoon.
The lower phosphate values reported during winter season may be correlated
to its locking PO4 by macrophytes and phytoplankton during their bloom decreasing
their level in water (Kant and Raina, 1990). Hutchinson (1957), has concluded that the
quantity of phosphates increases due to sewage contamination in water bodies. The
phosphate was fluctuated between the stations as well as the seasons. The phosphate
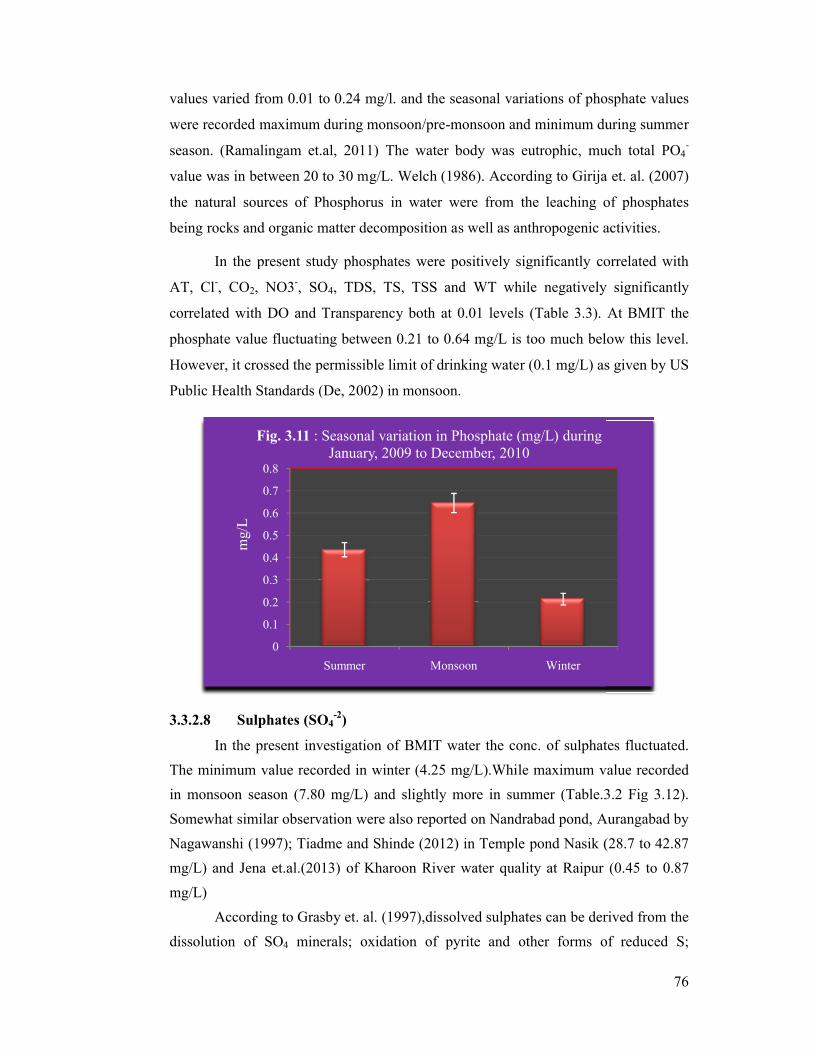
values varied from 0.01 to 0
were recorded maximum duri
season. (Ramalingam et.al, 2011)
value was in between 20 to 30 mg/
the natural sources of P
being rocks and organic matter decomposition as well as anthropogenic activities.
In the present study
AT, Cl-, CO2, NO3-, SO
correlated with DO and Transparency
phosphate value fluctuating between 0.21 to 0.64 mg/
However, it crossed the permissible limit of drinking water (0.1 mg/
Public Health Standards (De, 2002) in monsoon.
3.3.2.8 Sulphates (SO
In the present investigation of BMIT water the conc. of sulphates fluctuated.
The minimum value recorded in winter
in monsoon season (7.80
Somewhat similar observation
Nagawanshi (1997); Tiadme and Shinde (2012) in Temple pond Nasik (28.7 to 42.87
mg/L) and Jena et.al.(2013)
mg/L)
According to Grasby et
dissolution of SO4 minerals; oxidation of pyrite and other forms of reduced S;
0
0.1
0.2
0.3
0.4
0.5
0.6
0.7
0.8
Fig. 3.11 : Seasonal variation in Phosphate (mg/L) during
mg/
L
values varied from 0.01 to 0.24 mg/l. and the seasonal variations of phosphate values
recorded maximum during monsoon/pre-monsoon and minimum during summer
(Ramalingam et.al, 2011) The water body was eutrophic, much
in between 20 to 30 mg/L. Welch (1986). According to Girija
Phosphorus in water were from the leaching of phosphate
being rocks and organic matter decomposition as well as anthropogenic activities.
In the present study phosphates were positively significantly correlated
SO4, TDS, TS, TSS and WT while negatively significantly
correlated with DO and Transparency both at 0.01 levels (Table 3.3).
phosphate value fluctuating between 0.21 to 0.64 mg/L is too much below this level.
However, it crossed the permissible limit of drinking water (0.1 mg/L) as given by US
Public Health Standards (De, 2002) in monsoon.
(SO4-2)
In the present investigation of BMIT water the conc. of sulphates fluctuated.
The minimum value recorded in winter (4.25 mg/L).While maximum value
7.80 mg/L) and slightly more in summer (Table.3.2 Fig 3.12).
observation were also reported on Nandrabad pond, Aurangabad by
; Tiadme and Shinde (2012) in Temple pond Nasik (28.7 to 42.87
et.al.(2013) of Kharoon River water quality at Raipur
According to Grasby et. al. (1997),dissolved sulphates can be derived from the
minerals; oxidation of pyrite and other forms of reduced S;
Summer Monsoon Winter
: Seasonal variation in Phosphate (mg/L) during January, 2009 to December, 2010
76
the seasonal variations of phosphate values
monsoon and minimum during summer
much total PO4-
to Girija et. al. (2007)
re from the leaching of phosphates
being rocks and organic matter decomposition as well as anthropogenic activities.
positively significantly correlated with
vely significantly
At BMIT the
is too much below this level.
s given by US
In the present investigation of BMIT water the conc. of sulphates fluctuated.
value recorded
(Table.3.2 Fig 3.12).
were also reported on Nandrabad pond, Aurangabad by
; Tiadme and Shinde (2012) in Temple pond Nasik (28.7 to 42.87
(0.45 to 0.87
can be derived from the
minerals; oxidation of pyrite and other forms of reduced S;
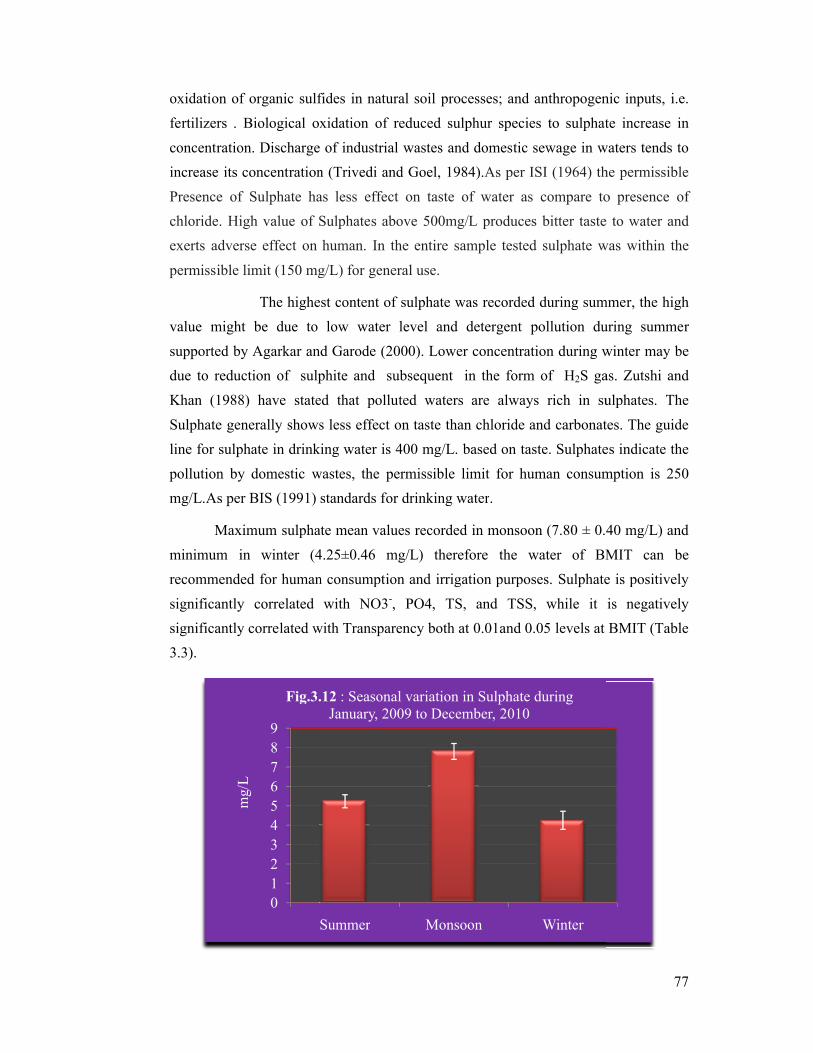
oxidation of organic sulfides in natural soil processes; and anthropogenic inputs, i.e.
fertilizers . Biological oxidation of reduced sulphur species to sulphate increase in
concentration. Discharge of industrial wastes and domestic sewage in waters tends to
increase its concentration (Trivedi and Goel, 1984).
Presence of Sulphate has less effect on taste of water
chloride. High value of Sulphate
exerts adverse effect on human. In the entire sample tested sulphate was within
permissible limit (150 mg/L)
The highest content of sulphate was recorded during summer, the high
value might be due to low water level and detergent pollution during summer
supported by Agarkar and Garode
due to reduction of sulphite and subsequent in the form of H
Khan (1988) have stated that pollu
Sulphate generally shows
line for sulphate in drinking water is 400 mg/
pollution by domestic wastes, the per
mg/L.As per BIS (1991) standards for drinking water
Maximum sulphate mean values recorded in monsoon (7.80 ± 0.40 mg/
minimum in winter (4.25±
recommended for human consumption and irrigation purposes. Sul
significantly correlated
significantly correlated with
3.3).
0123456789
Summer
Fig.3.12
mg/
L
organic sulfides in natural soil processes; and anthropogenic inputs, i.e.
fertilizers . Biological oxidation of reduced sulphur species to sulphate increase in
concentration. Discharge of industrial wastes and domestic sewage in waters tends to
its concentration (Trivedi and Goel, 1984).As per ISI (1964) the permissible
Presence of Sulphate has less effect on taste of water as compare to presence of
chloride. High value of Sulphates above 500mg/L produces bitter taste to water and
exerts adverse effect on human. In the entire sample tested sulphate was within
(150 mg/L) for general use.
The highest content of sulphate was recorded during summer, the high
to low water level and detergent pollution during summer
and Garode (2000). Lower concentration during winter may
due to reduction of sulphite and subsequent in the form of H2S gas. Zutshi and
Khan (1988) have stated that polluted waters are always rich in sulphate
shows less effect on taste than chloride and carbonates. The guide
ate in drinking water is 400 mg/L. based on taste. Sulphate
pollution by domestic wastes, the permissible limit for human consumption is 250
) standards for drinking water.
Maximum sulphate mean values recorded in monsoon (7.80 ± 0.40 mg/
winter (4.25±0.46 mg/L) therefore the water of BMIT
for human consumption and irrigation purposes. Sulphate is positively
significantly correlated with NO3-, PO4, TS, and TSS, while it is negatively
with Transparency both at 0.01and 0.05 levels at
Summer Monsoon Winter
Fig.3.12 : Seasonal variation in Sulphate during January, 2009 to December, 2010
77
organic sulfides in natural soil processes; and anthropogenic inputs, i.e.
fertilizers . Biological oxidation of reduced sulphur species to sulphate increase in
concentration. Discharge of industrial wastes and domestic sewage in waters tends to
the permissible
to presence of
produces bitter taste to water and
exerts adverse effect on human. In the entire sample tested sulphate was within the
The highest content of sulphate was recorded during summer, the high
to low water level and detergent pollution during summer
(2000). Lower concentration during winter may be
S gas. Zutshi and
ted waters are always rich in sulphates. The
less effect on taste than chloride and carbonates. The guide
. based on taste. Sulphates indicate the
missible limit for human consumption is 250
Maximum sulphate mean values recorded in monsoon (7.80 ± 0.40 mg/L) and
BMIT can be
ate is positively
, while it is negatively
BMIT (Table
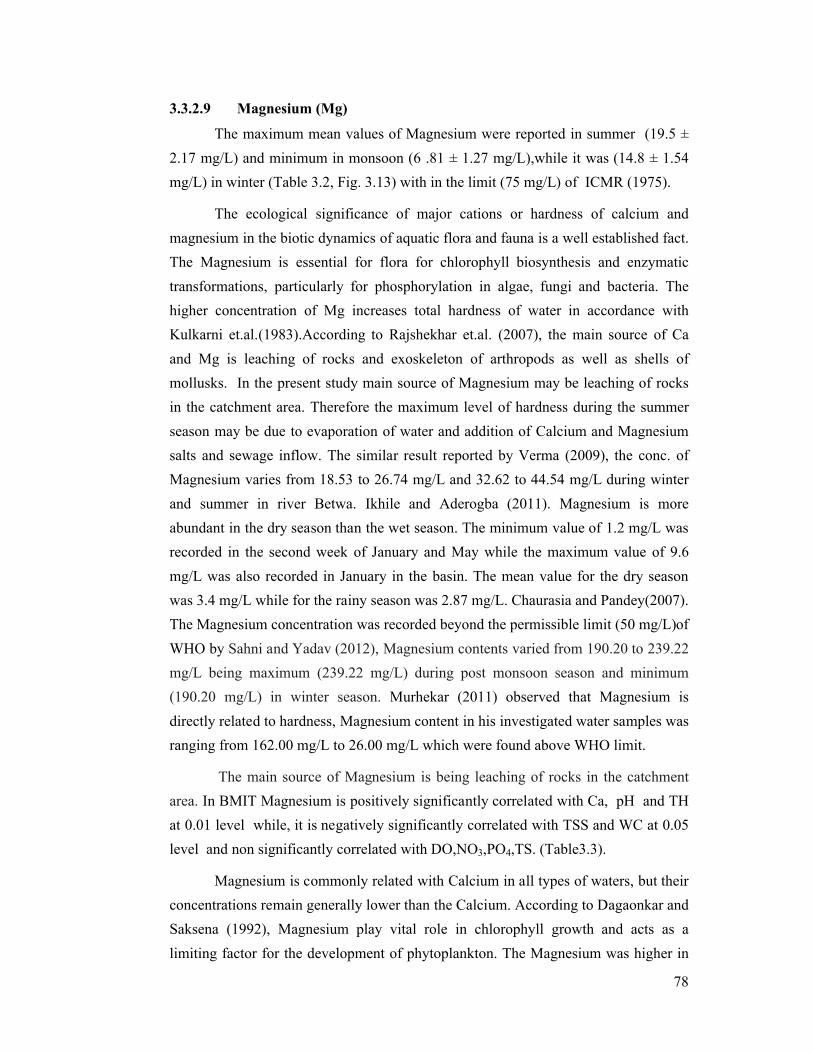
78
3.3.2.9 Magnesium (Mg)
The maximum mean values of Magnesium were reported in summer (19.5 ±
2.17 mg/L) and minimum in monsoon (6 .81 ± 1.27 mg/L),while it was (14.8 ± 1.54
mg/L) in winter (Table 3.2, Fig. 3.13) with in the limit (75 mg/L) of ICMR (1975).
The ecological significance of major cations or hardness of calcium and
magnesium in the biotic dynamics of aquatic flora and fauna is a well established fact.
The Magnesium is essential for flora for chlorophyll biosynthesis and enzymatic
transformations, particularly for phosphorylation in algae, fungi and bacteria. The
higher concentration of Mg increases total hardness of water in accordance with
Kulkarni et.al.(1983).According to Rajshekhar et.al. (2007), the main source of Ca
and Mg is leaching of rocks and exoskeleton of arthropods as well as shells of
mollusks. In the present study main source of Magnesium may be leaching of rocks
in the catchment area. Therefore the maximum level of hardness during the summer
season may be due to evaporation of water and addition of Calcium and Magnesium
salts and sewage inflow. The similar result reported by Verma (2009), the conc. of
Magnesium varies from 18.53 to 26.74 mg/L and 32.62 to 44.54 mg/L during winter
and summer in river Betwa. Ikhile and Aderogba (2011). Magnesium is more
abundant in the dry season than the wet season. The minimum value of 1.2 mg/L was
recorded in the second week of January and May while the maximum value of 9.6
mg/L was also recorded in January in the basin. The mean value for the dry season
was 3.4 mg/L while for the rainy season was 2.87 mg/L. Chaurasia and Pandey(2007).
The Magnesium concentration was recorded beyond the permissible limit (50 mg/L)of
WHO by Sahni and Yadav (2012), Magnesium contents varied from 190.20 to 239.22
mg/L being maximum (239.22 mg/L) during post monsoon season and minimum
(190.20 mg/L) in winter season. Murhekar (2011) observed that Magnesium is
directly related to hardness, Magnesium content in his investigated water samples was
ranging from 162.00 mg/L to 26.00 mg/L which were found above WHO limit.
The main source of Magnesium is being leaching of rocks in the catchment
area. In BMIT Magnesium is positively significantly correlated with Ca, pH and TH
at 0.01 level while, it is negatively significantly correlated with TSS and WC at 0.05
level and non significantly correlated with DO,NO3,PO4,TS. (Table3.3).
Magnesium is commonly related with Calcium in all types of waters, but their
concentrations remain generally lower than the Calcium. According to Dagaonkar and
Saksena (1992), Magnesium play vital role in chlorophyll growth and acts as a
limiting factor for the development of phytoplankton. The Magnesium was higher in
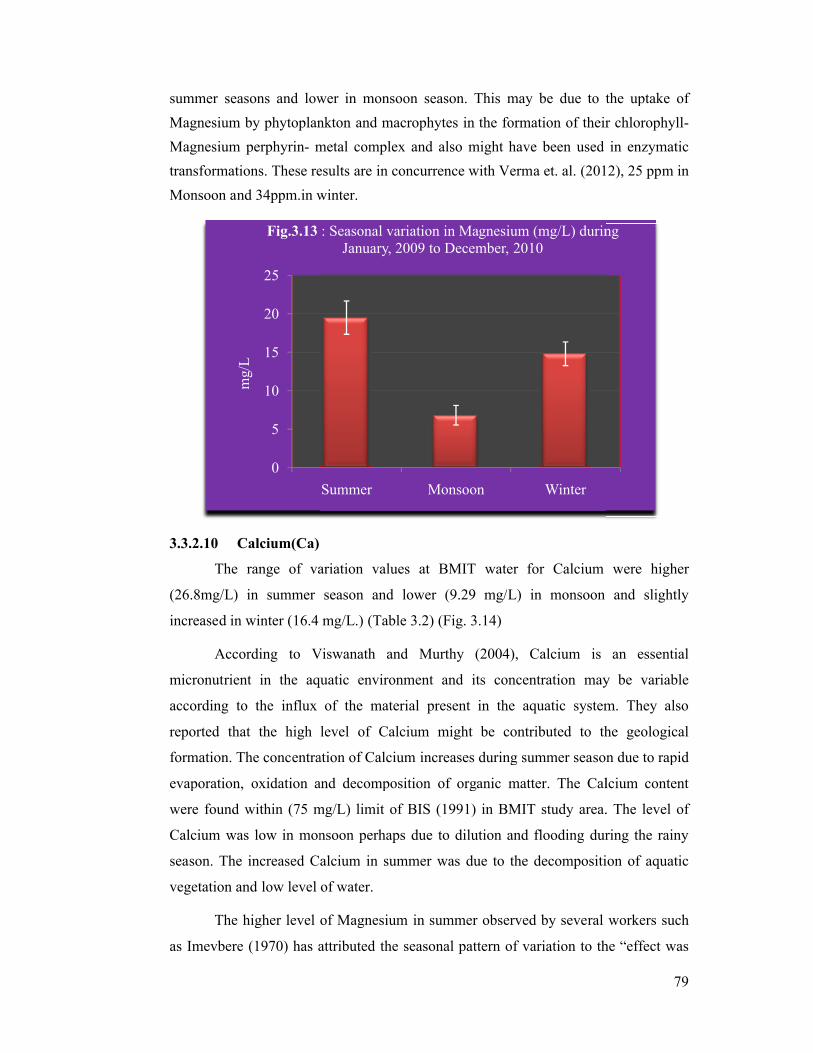
summer seasons and lower in monsoon season. This may be due to the uptake of
Magnesium by phytoplankton and macrophytes in the formation of their chlorophyll
Magnesium perphyrin- metal complex and
transformations. These results
Monsoon and 34ppm.in winter
3.3.2.10 Calcium(Ca)
The range of variation values at BMIT water
(26.8mg/L) in summer season and lower (9.29 mg/
increased in winter (16.4
According to Viswanath and Murthy (2004), Calcium is an essential
micronutrient in the aquatic environment and its concentration may be variable
according to the influx of the material present in the aquatic system. They also
reported that the high level of
formation. The concentration of Calcium increases during summer season due to rapid
evaporation, oxidation and decomposition of organic matter. The Calcium content
were found within (75 mg/L)
Calcium was low in monsoon perhaps due to dilution and flooding during the rainy
season. The increased Calcium
vegetation and low level of water.
The higher level of Magnesium in s
as Imevbere (1970) has attributed the seasonal pattern of variation to the “effect was
0
5
10
15
20
25
Fig.3.13m
g/L
summer seasons and lower in monsoon season. This may be due to the uptake of
agnesium by phytoplankton and macrophytes in the formation of their chlorophyll
metal complex and also might have been used in en
These results are in concurrence with Verma et. al. (2012)
winter.
The range of variation values at BMIT water for Calcium w
) in summer season and lower (9.29 mg/L) in monsoon and slightly
mg/L.) (Table 3.2) (Fig. 3.14)
Viswanath and Murthy (2004), Calcium is an essential
micronutrient in the aquatic environment and its concentration may be variable
according to the influx of the material present in the aquatic system. They also
reported that the high level of Calcium might be contributed to the geological
formation. The concentration of Calcium increases during summer season due to rapid
evaporation, oxidation and decomposition of organic matter. The Calcium content
(75 mg/L) limit of BIS (1991) in BMIT study area. The level of
Calcium was low in monsoon perhaps due to dilution and flooding during the rainy
Calcium in summer was due to the decomposition of aquatic
vegetation and low level of water.
level of Magnesium in summer observed by several workers such
attributed the seasonal pattern of variation to the “effect was
Summer Monsoon Winter
: Seasonal variation in Magnesium (mg/L) during January, 2009 to December, 2010
79
summer seasons and lower in monsoon season. This may be due to the uptake of
agnesium by phytoplankton and macrophytes in the formation of their chlorophyll-
used in enzymatic
(2012), 25 ppm in
Calcium were higher
in monsoon and slightly
Viswanath and Murthy (2004), Calcium is an essential
micronutrient in the aquatic environment and its concentration may be variable
according to the influx of the material present in the aquatic system. They also
ht be contributed to the geological
formation. The concentration of Calcium increases during summer season due to rapid
evaporation, oxidation and decomposition of organic matter. The Calcium content
study area. The level of
Calcium was low in monsoon perhaps due to dilution and flooding during the rainy
due to the decomposition of aquatic
ummer observed by several workers such
attributed the seasonal pattern of variation to the “effect was
: Seasonal variation in Magnesium (mg/L) during
80
seen from the concentration of ions due to evaporation during the dry season and
dilution due to flooding during the rainy season.” Sahni and Yadav(2012) found
higher (118.80mg/L) in summer season and lower (75.71 mg/L) in winter season from
Bharawas Pond, Rewari, Haryana., Ravikumar et. al., (2005) reported the maximum
Calcium hardness in the months of April in Ayyanakere tank in Harapanahalli town in
Davangere district of Karnataka. The variation in the dry season was more than the
rainy season. The maximum level of hardness during the summer season may be due
to evaporation of water, addition of Calcium and Magnesium salts and sewage inflow
(Chaurasia and Pandey, 2007). According to Ikhile and Aderogba (2011), Calcium is
more abundant in the dry season than the wet season. The lowest value of 4.0mg/L
was recorded in February and March while the highest value of 40.0 mg/L was
recorded in the last weekend of December. The mean value of Calcium for the dry
season was 9.78 mg/L while that of the rainy season was 9.39 mg/L. Calcium was
found in greater abundance in all natural water as its main source is weathering of
rocks from which its leaches out. Calcium was found in the same quantity and
comparatively higher both in summer and northeast monsoon seasons, while lower in
southwest monsoon (Jemi and Balasing 2012).
Sayed et.al. (2011) reported higher (66.12 ±1.15mg/L) during Summer and
lower value (58.97 ± 3.95mg/L) during Winter season from Wadi El-Rayan Lakes,
western desert, Egypt. Waghmare and Kulkarni (2013) observed range the minimum
value of Calcium in the river was 22.9 mg/L at S1 in the month of October and
Maximum 49.2 mg/L at S2 in the month of May in Lendi River. Garg et. al. (2006) ;
Jain et. al. (2011). The maximum mean range was recorded in summer (26.8 ± 1.91
mg/L).While minimum mean value was recorded in monsoon season (9.29 ± 0.877
mg/L).
The Calcium is positively significantly correlated with Mg ,pH and TH at 0.01
level while it is negatively non significantly correlated with DO, NO3, PO4, SO4, TSS
and WC at BMIT.(Table 3.3).
Calcium is an important element influencing flora of ecosystem, which plays
potential role in metabolism and growth. According to Kataria et. al. (1995) and
Gowd et al (1998), in the natural water extreme Cl- ions is usually found associated
with Na++, K++ and Ca++ which create salty taste when concentration is 100 mg/L.
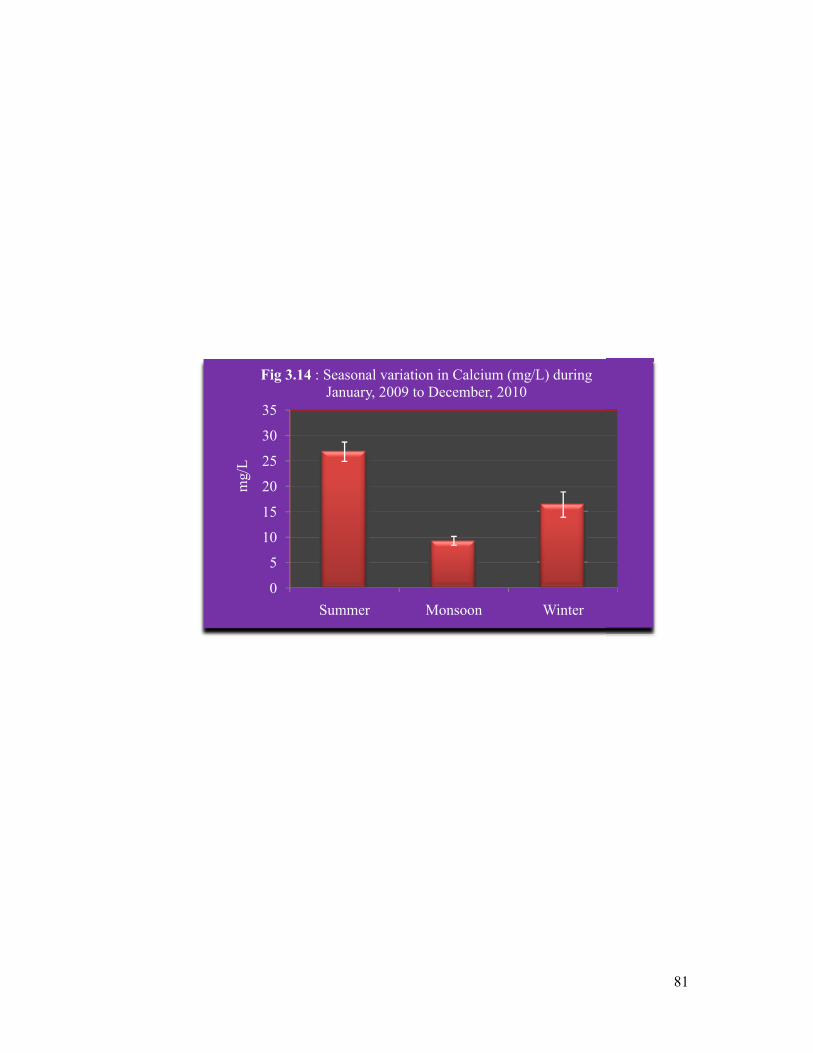
0
5
10
15
20
25
30
35
Summer
Fig 3.14 : Seasonal variation in Calcium (mg/L) during
mg/
L
Summer Monsoon Winter
: Seasonal variation in Calcium (mg/L) during January, 2009 to December, 2010
81
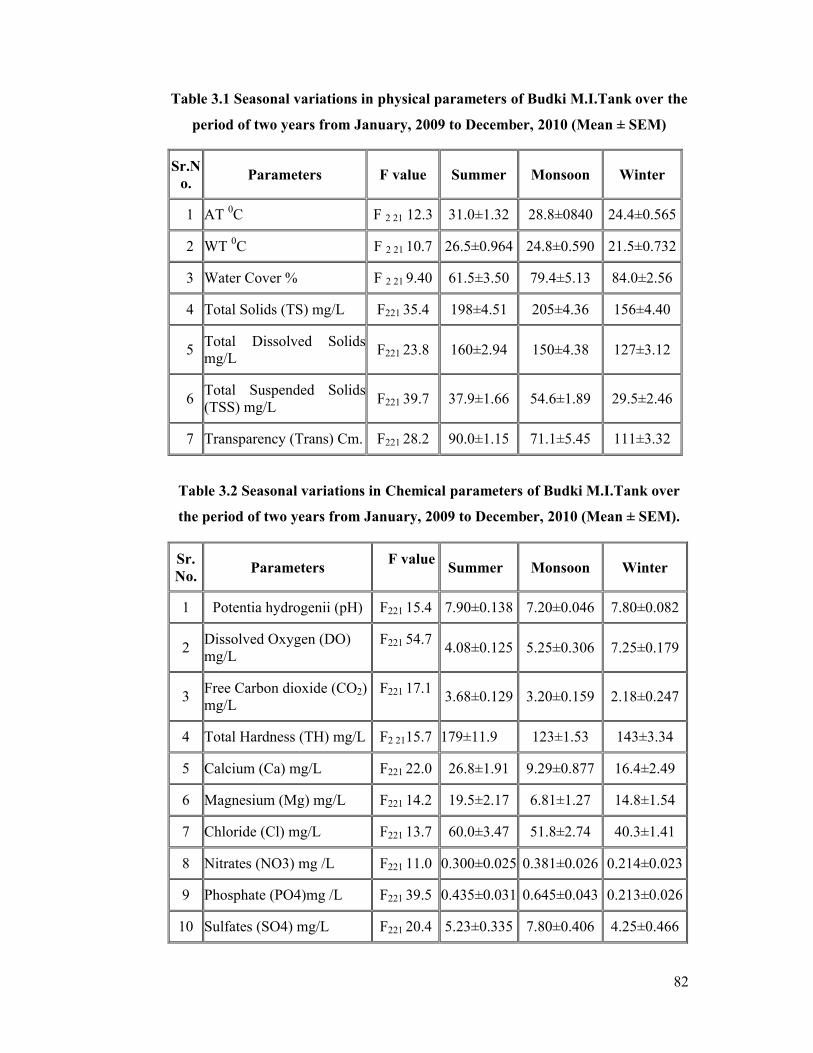
82
Table 3.1 Seasonal variations in physical parameters of Budki M.I.Tank over the
period of two years from January, 2009 to December, 2010 (Mean ± SEM)
Sr.No.
Parameters F value Summer Monsoon Winter
1 AT 0C F 2 21 12.3 31.0±1.32 28.8±0840 24.4±0.565
2 WT 0C F 2 21 10.7 26.5±0.964 24.8±0.590 21.5±0.732
3 Water Cover % F 2 21 9.40 61.5±3.50 79.4±5.13 84.0±2.56
4 Total Solids (TS) mg/L F221 35.4 198±4.51 205±4.36 156±4.40
5Total Dissolved Solids mg/L
F221 23.8 160±2.94 150±4.38 127±3.12
6Total Suspended Solids (TSS) mg/L
F221 39.7 37.9±1.66 54.6±1.89 29.5±2.46
7 Transparency (Trans) Cm. F221 28.2 90.0±1.15 71.1±5.45 111±3.32
Table 3.2 Seasonal variations in Chemical parameters of Budki M.I.Tank over
the period of two years from January, 2009 to December, 2010 (Mean ± SEM).
Sr. No.
Parameters F value
Summer Monsoon Winter
1 Potentia hydrogenii (pH) F221 15.4 7.90±0.138 7.20±0.046 7.80±0.082
2Dissolved Oxygen (DO)mg/L
F221 54.74.08±0.125 5.25±0.306 7.25±0.179
3Free Carbon dioxide (CO2) mg/L
F221 17.13.68±0.129 3.20±0.159 2.18±0.247
4 Total Hardness (TH) mg/L F2 2115.7 179±11.9 123±1.53 143±3.34
5 Calcium (Ca) mg/L F221 22.0 26.8±1.91 9.29±0.877 16.4±2.49
6 Magnesium (Mg) mg/L F221 14.2 19.5±2.17 6.81±1.27 14.8±1.54
7 Chloride (Cl) mg/L F221 13.7 60.0±3.47 51.8±2.74 40.3±1.41
8 Nitrates (NO3) mg /L F221 11.0 0.300±0.025 0.381±0.026 0.214±0.023
9 Phosphate (PO4)mg /L F221 39.5 0.435±0.031 0.645±0.043 0.213±0.026
10 Sulfates (SO4) mg/L F221 20.4 5.23±0.335 7.80±0.406 4.25±0.466
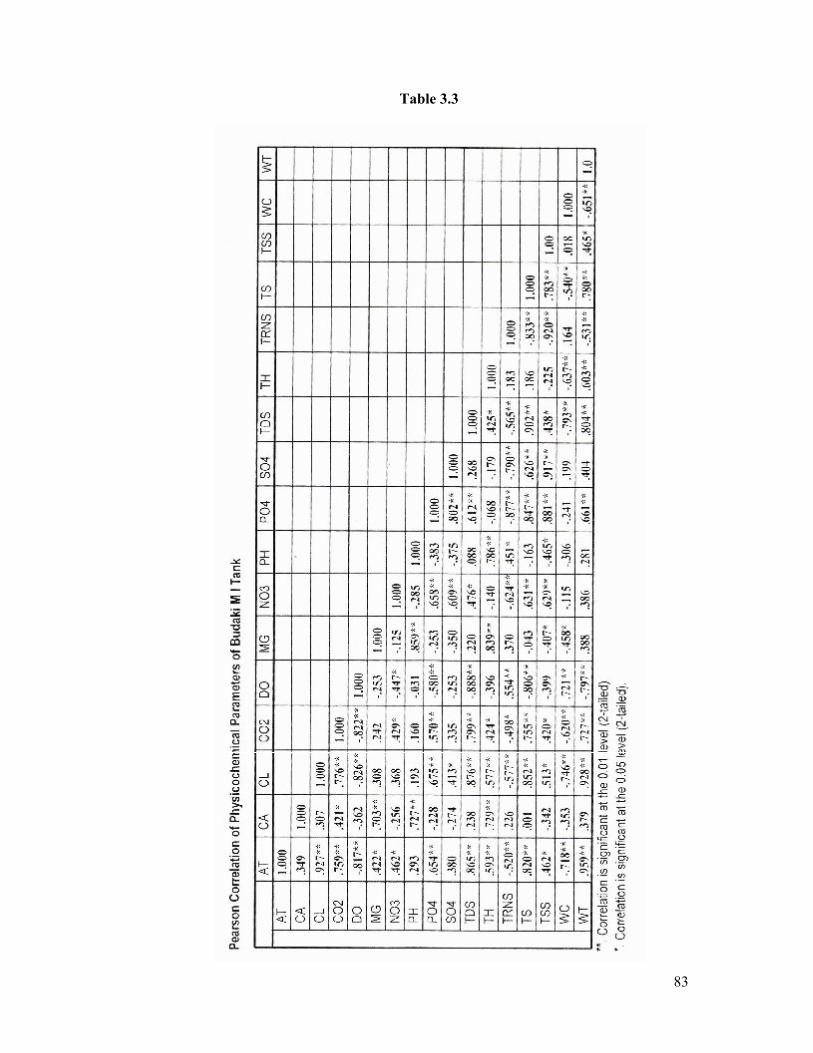
83
Table 3.3
84
3.4 REFERENCES
Adebisi A. A. (1981). The physico-chemical hydrology of tropical seasonal river –
Upper Ogun River.Hydrobiologia, 79: p157 - 165.
Adeyeye, E. I. and Abulude, F.O. (2004). Analytical assessments of some surface and
ground water resources in Ile – Ife, Nigeria. J. Chem. Soc. Nig., 29: p 98-103.
Agarkar, S. V. and. Garode, A. M. (2000). Evalution of physicochemical and
microbiological parameters of Vyazadi reservoir water. Indian Hydrobiol 3: p3-5 and
pollution technology, 3(4): p 563-565.
Aggarwal, Rhythm and Arora, Shakti.(2012). A Study of Water Quality of Kaushalya
River In The Submountaneous Shivalik Region International Journal of Scientific
and Technology Rerearch ,1( 8):p52-68.
Ahangar, Irshad Ahmad., Saksena, D. N., Mir, Mohammad Farooq and Ahanga,
Mohammad Afza. (2013).Seasonal Variations in Physico-chemical Characteristic of
Anchar Lake, Kashmir, International Journal of Advanced Biological Research,
3(2):p352-357.
Angadi S.B., Shiddamaliayya, N. and Patil, P.C.(2005). Limnological study of
Papnash pond, Bidar(Karnataka), J. Env. Biol., 26 : p 213-216.
Anhwange, B.A. , Agbaji, E. B. and Gimba E.C.(2012). Impact Assessment of Human
Activities and Seasonal Variation on River Benue, within Makurdi Metropolis;
International Journal of Science and Technology, 2 (5):p248-254.
Anita Bhatnagar and DevPooja(2013).Water quality guidelines for the management
of pond fish culture Internal Journal of Environmental Sciences 3:p 1-6.
Anitha, G., Chandrashekhar, S. V. A., and Kodarkar, M. S. (2005). Limnological
studies on Mir Alam Lake, Hyderabad. Pollution Research, 24(3): p681-687.
Annalakshmi G. and Amsath A., 2012.Nutrient status of Arasalar River, A Tributary
of Cauvery River at Tanjore District of Tamil Nadu, India. Int. Jour. Of Plant, Animal
Environmental Sciences, (2):p 214-222.
APHA, (1998).Standard methods for the examination of water and wastewater 20th
eds. American Public Health Association. American water works Association Water
Environment Federation. Washington, D.C.
APHA, American Public Health Association. (1985). Standard method for the
85
examination of water and waste water. 14th Ed. APHA-AWWAWPCF.Washington,
D.C : p 1193 assessment in Satna city (M.P): Seasonal parametric variations, Nature
environment
Arvind Kumar and Singh, A.K. (2002). Ecology, Conservation and Management of
the River Mayurakshi in Santhal Paragna (Jharkhand State) with special reference to
effect of sewage pollution on abiotic and biotic potentials. Ecology and Conservations
of Lakes, reservoirs and Rivers, ABDP, Rajasthan.: p 1-43.
Arvindkumar, (1995). Some limnological Aspects of the Fresh water Tropical
Wetland of Santhal. Pargana (Bihar) India, J. Envi. Poll.,2 (3):p 137-141.
Awasthi, U. and Tiwari, S. (2004). Seasonal trends in abiotic factors of a lentic habitat
(Govindgharh Lake) Rewa, M.P. Indian Eco. Env. And Cons., 10 (2): p165170.
Ayoade, A. A, Fagade S.O. and Adebisi A. A. (2006). Dynamics of Limnological
features of two man-made lakes in relation to fish production. African J. Biotechnol.,
5(10): p1013 – 1021.
Bade, B. B., Kulkarni, D. A. and Kumbhar, A. C.( 2009). Studies on physico-
chemical parameters in Sai Reservoir, Latur Dist, Maharashtra, 2(7): p 31-34.
Bhadja Poonam and Vaghela Ashokkumar (2013). Assessment Of Physico-
Chemicalparameters And Water Quality Index Of Reservoir Water, International
Journal of Plant, Animal and Environmental Sciences,(3)3:p 89-95.
Bhandarkar, S.V. and Bhandarkar, W.R.(2013). A study on seasonal variation of
physico-chemical properties in some freshwater lotic ecosystems in Gadchiroli
District Maharashtra, Int. J. of Life Sciences, Vol. 1(3):p 207-215
Billore D.K.(1981), Ecological studies of Pichhola lake, Ph.D. Thesis, Univ. of
Udaipur.
Billore, D.K. and Vyas, L.N. (1982). Distribution and production of macrophytes in
Pichhola lake, Udaipur (India) : p 45-54.
BIS (1991).IS:10400, Indian Standards for drinking waters, Bureau of Indian
Standard, New Delhi, India, 1(9):p 179-182.
Bostrom, M, Andersen, BJ.,Fleischer, S and Jansoon M.(1988). Exchange of
phosphorus across the sediment-water interface, Hydrobiologia 170: p229-244.
Cengiz Koc, C. P. (2008). The effect of the environment and ecology projects on lake
86
management and water quality. Environ. Monit. Asses., 146:p397-409.
Chaurasia Mahima and Pandey, G.C. (2007). Study of Physico-chemical
characteristics of some water ponds of Ayodhya.-Faizabad. IJEP, 27 (11):p 1019-
1023.
Chavan, A.W., Dhamani, A.A and Murkute ,V.B.(2012).Seasonal Variation in The
Physicochemical Parameters of River Wainganga nera Bramapuri, Dist. Chandrapur
(MS). Vidyabharati International Interdisciplinary Research Journal, 1(1):p28-35.
Chisty, N. (2002). Studies on Biodiversity of Freshwater Zooplankton in Relation to
Toxicity of selected Heavy Metals. Ph. D. Thesis submitted to M.L Sukhadia
Univeristy Udaipur.
Chun Ye, Qiujin Xu, Hainan Kong, Zhemin Shen, and Changzhou Yan, (2007).
Eutrophication conditions and ecological status in typical bays of Lake Taihu in
China. Environ. Monit.Asses., 135:p 217-225.
Clarke, F.W. (1924). The data of Geochemistry (5th Edn.) Bull. U.S. Geol.
Surv.770.U.S.Govt.printing offic, Washington D.C.: p 841.
Cleber, C. F. and Giani, A. (2001). Seasonal variation in the diversity and species
richness of phytoplankton in a tropical eutropic reservoir. Hydrobiologia, 445: p165-
174.
Cocchetto DM, Levy G (1981).Absorption of orally administered sodium sulfate in
humans. Journal of Pharmaceutical Sciences, 70:p331–333.
Dagaonkar, A. and Saksena, D.N. (1992).Physico-chemical and biological
characterization of a temple tank Kailasagar, Gwalior, Madhya Pradesh.Journal of
Hydrobiology, 8(1) : p11-19.
Das , A.K. (2000). Limno-Chemistry of some Andhra Pradesh Reservoirs. Journal
Inland Fisheries Society of India, 32(2):p37-44.
Day, E.H. (1963).The chemical elements in nature. George C. Harrap & Co., London,
U.K..
De, A. K. (2002). Environmental Chemistry, 4th Edition, New Age International
Publisher,New Delhi:p245-252
Delisle C.E, Schmidt J.W. (1977).The effects of sulphur on water and aquatic life in
Canada. In: Sulphur and its inorganic derivatives in the Canadian environment.
87
Ottawa, Ontario, National Research Council of Canada, (NRCC No. 15015).
Desai, P.V. (1995). Water quality of Dudhasagar river at Dudhasagar (Goa), India.
Poll Res., 14(4):p337-382.
Deshkar, S. L.( 2008). Avifaunal diversity and ecology of wetlands in semi arid zone
of Central Gujarat with reference to their conservation and categorization . Ph. D.
Thesis submitted to the Maharaja Sayajirao University of Baroda, Vadodara, India.
Devi Priyamvada, Sirisha D., and Gandhi N.(2013). Study on the Quality of Water
and Soil from Fish Pond in Around Bhimavaram West Godavari District, A.P., India.
International Research Journal of Environment Sciences,2 (1):p58-62.
Dhanalakshmi, V., Shanthi, K. and Remia1, K.M.(2013) Physicochemical study of
Eutrophic pond in Pollachi town, Tamilnadu, India Int.J.Curr.Microbiol.App.Sci ),
2(12): p219-227.
Dwivedi B.K. and Pandey G.C. (2002) . Physico-chemical factors and algal diversity
of two ponds, (Girija Kund and Maqubara pond), Faizabad. Poll. R.S., 21:p361-370.
Ekhande, A. P.( 2010). Hydrobiological studies of Yashwant Lake with special
reference to selected biodiversity. Ph. D. Thesis submitted to the Maharaja Sayajirao
University of Baroda, Vadodara, India.
Fakayode, S.O. (2005).Impact Assessment of Industrial Effluent on Water Quality of
the Receiving ALaro River in Ibadan, Nigeria. Ajeam-Ragee, 10: p1-13.
Fingl, E. (1980).Laxatives and cathartics. In: Gilman AG et. al., eds. Pharmacological
basis of therapeutics. New York, NY, MacMillan Publishing.
Forbes M G, Doyle R. D, Scott J. T, Stanley J. K, Huang H and Brooks B W (2008).
Physical factors control phytoplanktonproduction and nitrogen fixation in eight Texas
reservoirsEcosystems 11:p81–97.
Gaike, Pramod P. and Kamble, A.H. (2013). Seasonal Limnological Variation in Tale
Pimpalgaon dam near Patoda Dist.Beed (M.S)India. Iosr Journal Of Pharmacy, 3 (3) :
p24-25.
Gaike, Pramod P. and Shejule, K.B.(2012).Study of Physico-Chemical Properties of
Kasura Dam from Jalna District (M.S) India. Global Journal of Science Frontier
Research Biological Sciences, 12 ( 4) : p32-35.
Garnaik Bamakanta, Panda Sunakar, Tripathy Satyabhama and Tripathy Upendra
88
Prasad (2013). Seasonal Variation of Nagavali River Water Quality at the Vicinity of
PaperMill nearJaykaypur, Odisha, India, International Research Journal of
Environment Sciences, 2(5):p 46-52,
Girija, T. R., Mahanta, C. and Chandramouli, V. (2007). Water quality assessment
of an untreated effluent impacted urban stream: The Bharalu tributary of Brahmaputra
River. India. Envi.Moni. Assessement.doi, 10:p1007/S.
Goher, M.E.M., (2002). Chemical studies on the precipitation and dissolution of some
chemical element in Lake Qarun, Ph.D. Thesis fac of sci, Al-Azhar University, Egypt.
Gonzalves, E.A. and Joshi, D.B. (1946). Fresh water algae near Bombay.The seasonal
succession of algae in a tank of Bandra. J. Bomb. Nat. Hist. Soc., 46: p154-176.
Gowd, S. S., Sudheer, A. S. and Srinivasulu, S. (1998). Assessment of water quality
for domestic and irrigation purposes in Peddavanka watershed, Anantapur
District.Indian J. Envtl. Protcn, 19(9): p689-697.
Grasby, S.E., Hutcheon, I. and Krouse, H.R., (1997), Application of the stable isotope
composition of SO42- to tracing anomalous TDS in Nose Creek, southern Alberta,
Canada, Applied Geochemistry, 12(5): p 567-575.
Greenwood, N.N., Earnshaw, A. (1984).Chemistry of the elements. Oxford,
Pergamon Press:p676-681
Gurumayum ,S.D., Daimari, P., Goswami, BSJ., Sarkar, A. and Chaudhury ,M.
(2002). Journal of the Inland Fishries Society of India, 34(2): p36-42.
Harikrishnan, K. and Azis, P. K. A. (1989). Ecology of the Neyyar reservoir a
preliminary report. Proceedings of Kerala Science Congress.Cochin. : p140-145.
Hazarika Lakhi Prasad (2013). A study of certain physico-chemical characteristics of
Satajan wetland with special reference to fish diversity indices, Assam, India
European Journal of Experimental Biology, 3(4) : p173-180
Hegde, G. R. and Huddar, B. D. (1995). Limnological studies of two fresh water
lentic ecosystems of Hubli- Dharwad, Karnataka. In : Irfan A. Khan (eds), Frontiers
in Plant Science, The book syndicate publ. Hyderabad, p 35 - 43.
Holtan, H., Kamp-Nielsen, L. and Stuanes, A.O. (1988). Phosphorus in soil, water
and sediment: An Overview. Hydrobiologia,170 : p19-34.
Hujare, M. S. (2008). Seasonal variation of physico-chemical parameters in the
89
perennial tank of Talsande, Maharashtra. Ecotoxicol. Environ. Monit., 18(3) : p233-
242.
Hulyal,S.B. and Kaliwal,B.B.(2011).Seasonal Variations in Physico-Chemical
Characteristics of Almatti Reservoir of Bijapur district, Karnataka State International
Journal of Environmental Protection, 1 (1):p 58-67.
Hutchinson, G. E. (1957).A Treatise on limnology Vol. 1.Geography, physics,
Chemistry, John Wiley and Sons. Hydrobiologia, 33(1): p145-160.
ICMR(1975). Manuals of Standards Quality for Drinking Water Supplies, Special
report No., (44) : p27.
Ikhile,C.I. and Aderogba,K.A.(2011).Spatio-Temporal Variation in Water Quality of
Orle River Basin, S.W. Nigeria. An International Multi- Disciplinary Journal,
Ethiopia5(2):p322-336.
Idowu E.O.,Ugwumba A.A.A., Edward J.B. and Oso J.A.(2013).Study of the
Seasonal Variation in the Physico-Chemical Parameters of a Tropical Reservoir.
Greener Journal of Physical Sciences, 3 (4) : p142-148.
Ikom, R.B., Iloba, K.I. and Ekure, M.A. (2003).The Physical and Chemical
Hydrology of River Adofi at Utagba-Uno,Delta State, Nigeria. The Zoologist, 2(2):p
84 - 95.
Imevbore, A. M. A. (1970). Some preliminary observations on the ratios and
fecundity of the fish in river Niger. In: Visser (ed) Kainji Lake Studies. Ecology, 1:p
8788.
International Standard Organization (ISO) (1990).Water quality determination of sum
of Calcium and Magnesium. EDTA titrimetric method.(ISO, 5815); International
Organization for Standardization, Geneva.
Iqbal, S. A. and Kataria, H. C. (1995).Physico-chemical analysis and water quality
assessment of upper Lake of Bhopal.Indian J. Envi. Protection, 7: p1-15.
Ishaq Fouzia and Khan Amir (2013).Seasonal limnological variation and macro
benthic diversity of river Yamuna at Kalsi Dehradun of Uttarakhand. Asian Journal of
Plant Science and Research, 3(2):p133-144.
ISI (1983).Indian Standards specification For Drinking Water ISI : p105-500.
ISI (1964). Indian standard specification for drinking water ISI ,10500.
90
ISI (1991). Indian standard specification for drinking water ISO: 10500, ISI, New
Delhi.
Jain, M.K., Dadhich, L.K. and Kalpana, S. (2011). Water quality assessment of
Kishanpura dam, Baran, Rajasthan,India. Nature Environment and Pollution
Technology, 10(3) : p405-408.
Jakher, G.R. & Rawat, M. (2003).Studies on physico-chemical parameters of a
tropical lake, Jodhpur, Rajasthan, India. J. Aqua. Biol. ,18(2): p79-83.
Jana, B.B. (1973).Seasonal periodicity of plankton in freshwater ponds in West
Bengal, India. Hydrobiologia, 58: p127-143.
Jena Vinod, Gupta Sapana & Matic Natalija (2013). Assessment of Kharoon
RiverWater Quality at Raipur By Physico-Chemical Parameters Analysis Asian J.
Exp. Biol. Sci. 4 (1) :p79-83.
Jemi R. Jacklin and Balasingh G.S. Regini (2012). Studies on Physicochemical
Characteristics of Freshwater Temple Ponds in Kanyakumari District (South
Tamilnadu), International Journal of Geology, Earth and Environmental Sciences. 1
(1) : p.59-62.
Jhingran, V. C. (1975). Fish and fisheries of India.Hindustan Publishing Corporation,
Delhi, India. : p 954.
Joshi, M., Shishodia, S.K., Kumar, S.N. and Saikia, D.K.(1995). Ecosystem Studies in
upper region ofGanga River, Environmental monitoring and assessment, 35 : p181-
206.
Kadam, M. S. Pampatwar, D. V. and Mali, R.P., (2007).Seasonal variations in
variations in different physico-chemical characteristics in Mosoli reservoir of
Parbhani district, Maharashtra, Journal of aquatic biology, 22(1) : p 110-112.
Kalwale Ajit M., Padmakar, A. and Savale.(2012). Determination of Physico-
Chemical Parameters of Deoli Bhorus Dam water, Adv. Appl. Sci. Res., 3(1) : p273-
279.
Kamal, D., Khan, A.N., Rahman, M.A. and Ahamed, F. (2007). Study on the Physico-
chemical properties of water of Mouri River, Khulna, Bangladesh.Pakistan Journal of
Biological Sciences, 10(5) : p710-717.
Kanan,V. and Job, S.V.(1980).Diurnal depth wise and seasonal changes of
91
physicochemical factors in Sathiyar reservoir. Hydrobiologia, 70: p103-117.
Kant, S. and Raina, A. K. (1990). Limnological studies of two ponds in Jammu.II.
Physico-chemical parameters. J. Env. Biol., 11: p137-144.
Karatayev, A. Y., Burlakova, L. E. and Dodson, S. I. (2008). Community analysis
of Belarusian Lakes: correlations of species diversity with hydrochemistry.
Hydrobiologia, 10750-008-9323-2.
Kataria, H. C., Iqubal, S. A. and Sandilya, A. K. (1995). Limno-chemical studies of
Tawa Reservoir. Indian J. of Envtl Prtcn., 16 (11): p841-846.
Kaul, V. and Handoo, J. K.(1980). Physicochemical characteristics of Nilnag-a high
altitude forest lake in Kashmir and its comparison with valley lakes. Proc. Indian
National Sci. Acad. B, 46(4): p528-541.
Kaul, V., Trisal, C. L., and Handoo, J. K. (1978). Distribution and production of
macrophytes in some water bodies of Kashmir. In: Glimpses of Ecology (J.S. Singh
and B. Gopal, eds.). International Scientific Publications, Jaipur, India. : p 313-334.
Kaur, S., Dhillon, S. S., Kaur, N. and Bath, K. S. (1995). Physicochemical
characteristics of fresh water ecosystem prevailing in and around Patiala (Punjab) J.
Environ. Ecol., 13 (3) : p523-528.
Kebede, E. (1996). Phytoplankton in a salinity-alkalinity series of Lakes in the
Ethiopian Rift Valley. Uppsala University, Sweden. : p178.
Kedar, G.T. and Patil, G.P. (2002). Studies on the biodiversity and Physicochemical
status of Rishi lake Karanja (M.S.) PhD Thesis .Amravati university Amarawati..
Khan, A. J. and Khan, A. A. (1985). Physicochemical condition in Seikha jheel at
Aligarh.Env.Eco., 5 : p269 - 274.
Khan, M. A. G and Chaudhary S.H., (1994).Physical and chemical limnology of
lake Kaptai Bangladesh, Tropical Ecology, 35(1) : p 35-51.
Khare, S.L., S.R. Paul and Anita Dubey (2007). A Study of water quality of Khomph-
Niwari lake at Chhatarpur, M.P. Nat.Env.& Poll.Tech.,6(3) : p 539-540.
Kobbia, I. A., Zaki, M. Z. and Gad, Y. M. (1992). Ecology of phytoplankton in
esturine regions of Abuo Tarfaia drain in Lake Qarun (Egypt). Mansoura Sci., Bull.
Egypt, 19 : p141-165.
92
Kolo, R.J. and Oladimeji, A.A (2004).Water quality and some nutrient levels in
Shiroro Lake Niger State. Nigeria. Journals of aquatic sciences, 19(2) : p 99.
Koshy, M.and Nayar, T.V.(1999).water quality aspect of river Pampa, Poll.Res.,18(4)
: p501-510.
Kudari, V. A., Kadadevaru, G. G. and Kanamadi, (2006). Characterisation of
selected lentic habit of Dharwad, Haveri and Uttarkannada District of Karnataka
State, India.Env.Moni.Assess., 120 : p387- 405.
Kulkarni, A.Y., Khatavkar, S.D.and Goel, P.K. (1983). Studies on Physicochemical
characteristics of the water bodies at Aundh in south western Maharashtra with
reference to the stress of human activities, Indian J. Envi. Protection, 8(2): p109-114.
Kulkarni Rajendra Rao, Rita N. Sharma and Mehatab Bukari (2007). Diurnal
Variation of physicochemical aspects of pollution in Khushavati river at Quepem,
Goa. J. Aqua. Boil. 17(1): p27-28.
Kumar, R., Singh, R. D. and Sharma, K. D. (2005). Water resources of India.
Current Science, 89(5): p794-811.
Kumar, N.J.I. and Oommen, C. (2009). Variations in Hydrochemical characteristics
of two distinct wetlands of Central, India. Nature Environment and Pollution
Technology, 8(2) :p269-277
Larry, W.M. (1996). Water Resources Handbook, chapter: Water Quality, McGraw-
Hill, New York. : p 8-22.
Lawson, E.O. (2011) Physico-Chemical Parameters and Heavy Metal Contents of
Water from the Mangrove Swamps of Lagos Lagoon, Lagos, Nigeria Advances in
Biological Research 5 (1) : p 08-21.
Lokhande, M.V. (2013).Limnological Studies On Dhanegaon Rresrvoir, Dhanegaon,
Dist- Osmanabad, Maharashtra (India), Indian Streams Research Journal Volume 2,
Issue 12. : p1-6.
Macan, T. T. (1958).Ponds and Lakes, George, Allen and Unwin Ltd. London, p148.
Mafruha Ahmed (2013). Water Quality and Pollution Sources of Gulshan Lake.
International Journalof Information Technology and Business Management, 16 (1) :
p78-82.
Majumder, S., Gupta, S., Saha, R.N., Datta, J.K.and Mandal, N.(2006).
93
Eutrophication potential of Municipal sewage of Burdwan town, West Bengal, India,
Pollut. Res., 25(2) : p299-302.
Manjare, S. A., Vhanalakar, S. A., and Muley, D. V (2010). Anamlysis of water
quality using physico-chemical parameters at Tamdalge tank in Kolhapur district,
Maharashtra. Int. Journal of Adv. Biotech.and Research, 1(2) : p 115-119.
Mathur, P., Agarwal, S. and Nag, M. (2008). Assessment of physico-chemical
characteristics and suggested restoration measures for Pushkar Lake, Ajmer
Rajasthan, India. Proceedings of Taal 2007, The 12th World Lake Conference , :
p1518 - 1529.
McGuire, M.J., Jones, R.M., Means, E.G., Izaguirre, G., and Preston, A.E.,(1984)
Controlling Attached Blue-Green Algae with Copper Sulfate, Jour. AWWA,(76):p
60-65..
Medudhula.Thirupathaiah, Ch.Samatha, Chintha Sammaiah (2012), Analysis of water
quality using physico-chemical parameters in lower manair reservoir of Karimnagar
district, Andhra Pradesh, International Journal Of Environmental Sciences , ( 3)1 :p
172-180.
Mehrotra, S. (1988). Benthic studies on Lal Sagar reservoir with special reference to
macrobenthic fauna. Ph.D. thesis, submitted to University of Jodhpur, Rajasthan,
India.
Mishra, S.R. and Saksena, D.N. (1991).Pollutional ecology with reference to physico-
chemical characteristics of Morar (Kalpi) river, Gwalior (M.P.). InCurrent Trend in
Limnology-I (Sastry, N.K., ed.), Narendra Publishing House, New Delhi, p159-184.
Mishra, Vidya, Goldin Quadros and Athalye, R.P.(2007). Hydrological study of Ulhas
river estuary, Maharashtra, India.J.Aqua. Biol, 22(1) : p97-104
Mithani Imran, Dahegaonkar N.R., Shinde J.S. and Tummawar S.D.(2012).
Preliminary studies on physico-chemical parameters of river Wardha, District
Chandrapur, Maharashtra, Journal of Research in Ecology 1:p 014-018.
Moshood, K. M. (2008). Assessment of the water quality of Oyun Reservoir, Offa,
Nigeria, using selected physico-chemical parameters’. Turkish J. of Fisheries and
Aquatic Sci., 8 : p309-319.
Munawar, M. (1970.) A limnological study of fresh water ponds of Hyderabad,
94
India.1-The biotope. Hydrobiologia, 35 : p 127-162.
Muniyan, M. and Ambedkar, G. (2011). Seasonal Variations in Physicochemical
Parameters of Water Collected from Kedilam River, at Visoor Cuddalore District,
Tamil Nadu, India. International Journal of Environmental Biology, 1(2) : p 15-18.
Murhekar Gopalkrushna(2011).Determination of Physico-Chemical parameters of
Surface Water Samples in and around Akot City Int. J. Res. Chem. Environ.1: p183-
187.
Murugavel, P. and Pandian, T. J. (2000). Effect of altitude on hydrology,
productivity and species richness in Kodyar A tropical peninsular Indian aquatic
system. Hydrobiologia, 430 : p33-57.
Nagawanshi, M. (1997).Reproductive physiology of fresh water bivalve mollusks
from Nandrabad pond, Aurangabad Ph.D. thesis.Dr.B.A.Marathwada University,
Aurangbad, Maharashtra.
Narayan, R., Saxena, K. K. and Chauhan, S. (2007). Limnological investigation of
Texi Temple pond in district Etawah (U.P.). J. of Environ. Biol., 28(1) : p155-157
National Water Quality Data Bank (NAQUADAT) (1977). Water Quality Branch,
Inland Waters Directorate, Environment Canada.
Nayak and Behera (2004). Seasonal Variation of some Physicochemical Parameters
of the Chilika lagoon (east cost of India) after opening the New mouth, near
Sipakuda, Indian Journal of Marine Sciences, 33(2):p206-208.
Nnaji, J.C., Uzairu, A., Harrison, G.F.S. and Balarabe, M.L. (2010). Effect of
Pollution on the Physico-chemical Parameters of Water and Sediments of River
Galma, Zaria, Nigeria. Libyan Agriculture Research Center, 1 (2): p115-122
Olatunji, M., Kolawole, Kolawole T. Ajayi, Albert B. Olayemi, and Anthony I. Okoh.
(2011)Assessment of Water Quality in Asa River (Nigeria) and Its Indigenous Clarias
gariepinus FishInt J Environ Res Public Health, 8(11):p 4332–4352.
Overrein, L.N.(1972). Sulfur pollution patterns observed: leaching of calcium in
forest soil determined. Ambio, 1:p 145.
Patel, N.G. and Lohar, P.S. (1998). Comparative account of Physico-chemical aspect
of Tapi and river of North Maharashtra, J.aqua.biol., 13 (1& 2): p57-59.
Patil, A.M. (2012). Analysis of Water Quality Aspects of Wainganga River,
95
Maharashtra, India water week. Water, Energy and Food Security: Call for
Soluton,New Delhi.p 1-12
Patil, J. V., Ekhande, A. P and Padate, G. S.(2011).Study of Lotus Lake: Its abiotic
factors their correlation with reference to seasonal changes and altitude. Annals of
Biological Research, 2 (4):p 44-56.
Patra, A.P., Patra, J.K., Mahapatra, N.K.., Das ,S and Swain,G.C. (2010).Seasonal
Variation in Physicochemical Parameters of Chilika Lakeafter Opening of New
Mouth near Gabakunda, Orissa, IndiaWorld Journal of Fish and Marine Sciences 2
(2): p109-117.
Pitter, P. (1999).Hydrochemistry. (in Czech). 3rd ed. Vydavatelství VŠCHT, Praha
Rahaman Shiblu Seasonal variations in water quality of the Ganges and Brahmaputra
River, Bangladesh.by Academia.edu.,p1-16
Prabhahar,C., Saleshrani, K .and Tharmaraj K.(2012) Seasonal Variation in Physico-
Chemical Parameters of Palar River in and Around Vaniyambadi Segment, Vellore
District, Tamil Nadu, IndiaInternational Journal of Pharmaceutical & Biological
Archives ; 3(1):p99-104.
Rai, Arvind Kumar., Diba, Farah. and Paul, Biswajit.(2012).A Study on the Seasonal
Variations of Different Physico chemical Water Quality Parameters of Indrapuri Dam
Rohtas District Bihar. International Journal of Environmental Sciences, 2 (3):p 125-
129.
Rajasegar, M. (2003).Physicochemical characteristics of velar estuary in relation to
shrimp farming. J. Environ.Bio., 24(1): p95 -101.
Rajagopal, T., Thangamani,,A and Archunan, G. (2010) Comparison of physico-
chemical parameters and phytoplankton species diversity of two perennial ponds in
Sattur area, Tamil Nadu Journal of Environmental Biology, 31(5):p 787-794.
Rao,Rajendra.,Kulkarni, Rita N. and Burkari, Sharmaand Mehtab.(2002). Diurnal
variations of physic-chemical aspects of pollution in Khushavati River at Quepem,
Goa. J. Aqua. Biol.,Vol. 17 (1): p 27-28.
Rajkumar, S., Velmurugan, P., Shanthi, K., Ayyasamy, P. M., and
Lakshmanaperumalasamy, P. (2004). Water Quality of Kodaikanal lake, Tamilnadu in
Relation to Physico-Chemical and Bacteriological Characteristics, Capital Publishing
96
Company Lake.: p 339-346.
Rajshekhar, A.V., Lingaiah, A., Satyanarayana Rao, M.S. and Piska
RaviShankar.(2007). The studies on water quality parameter of a minor
reservoir,Nadergul, Rangareddy District, Andhra Pradesh, J.Aqua. Biol., 22 (I) :
p118-122.
Ramalingam Manikannan, Subramanian Asokan and Abdul Hameed Mohamed
Samsoor(2011).Seasonal variations of physico-chemical properties of the Great
Vedaranyam Swamp, Point Calimere Wildlife Sanctuary, South-east coast of India.
African Journal of Environmental Science and Technology, 5(9) : p 673-681.
Ramchandra, T. V. and Solanki, M. (2007). Ecological Assessement of Lentic Water
Bodies of Bangalore. Indian Institute of Science, Bangalore Envis Technical Report. :
p 25.
Ramchandra, T. V., Rishiram, R., and Karthick, B. (2006). Zooplankton as
bioindicators: Hydrobiological Investigations. In: Selected Bangalore Lakes.Indian
Institute of Science, Bangalore.Technical Report. : p 115.
Rani, R., Gupta, B.K. and Srivastava, K.B.L.(2004a). Studies on water quality
assessment in Satna city(M.P.): Seasonal parametric variations. Nat. Env. Poll. Tech.,
3(4) : p 563-565.
Raut, K.S., Shinde, S.E., Pathan, T.S. and Sonawane, D.L(2011). Seasonal variations
in physico-chemical characteristics of Ravivar Peth Lake at Ambajogai District.Beed
Marathwada Region, India. Journal of Research in biology,1(4) : p258-262.
Reid, G.K. and Wood, R.D.(1976). Ecology of Inland Waters and Estuaries.Second
edition. D. Van.Nostrand. Co., New York.
Rodgi, S.S. and Nimbergi, P.M.(1978). The Journal of the Karnataka University
Science,23:p 92-115.
Sachidanandamurthy, K.L. and Yajurvedi, H.N. (2006).Astudy on Physico-chemical
parameters of an aquaculture body in aquaculture body in Mysore City, Karnataka.
India J.Environ.Biol., 27(4) : p615-618.
Sahni Kavita and Yadav Sheela (2012).Seasonal Variations in Physico-Chemical
Parameters of Bharawas Pond, Rewari, Haryana. Asian J. Exp. Sci., 26( 1): p 61-64.
Sahu, B. K. and Behera, S. K. (1995). Studies on some physico-chemical
97
characteristics of Ganga river water (Rhishikesh-Kanpur within twenty four Hour
during winter). Eco.Env. Con., 1 : p35 - 38.
Salve, B.S. and Hiware, C.J.( 2006). Studies on water quality of Wanparakalpa
Reservoir, Nagapur, near Parli Vaijnath, dist. Beed, Marathwada region. J. Aqua.
Biol., 21(2) : p113-117.
Sarkar, H. L. and Hakuriat, R. (1964).The Limnology of Suraj Kund, India 1.Physico-
chemical conditions and plankton.Trans. American Microscop.Soci., 83(2) : p260-
266.
Satpathy, K. K., Prasad, M. V. R., Sheela Shanta, A., Bhaskar, S., Jebakumar, K. E.,
Rajan, M. and Arulsamy, K. S. (2007). A Comparison of water quality of two fresh
water sources at Kalpakkam.Proce. NSL. : p 140-144.
Sawane, A.P., Puranik, P.G. and Bobdey, A.P. (2007). Seasonal distribution of trace
element of water of Irai river, Chandrapur (MS). NSL, 66:p376-379.
Saxsena, M.M. (1987). Environmental analysis of water, soil and air.Agro-botanical
Publishers, India. : p 1-176.
Sayed, A., Shama, Mohamed, E., Goher, Mohamed, H., Abdo, Samy, M., Kaial and
Ayman, A. Ahmed (2011).Physico-chemical characteristics and heavy metal contents
in water of Wadi El-Rayan Lakes, western desert, Egypt Egypt. J. Aquat. Biol. &
Fish.l (15) 2 : p225-240.
Scott, J. T., Doyle, R. D., Prochnow, S., White, J. D. (2008). Are watershed and
lacustrine controls on planktonic Nitrogen fixation hierarchically structured? Ecol.
Appl., 18 : p805-19.
Sedamkar, E.and Angadi S.B.(2003).Physicochemical parameters of two fresh water
bodies of Gulbarga, India, with special reference to Phytoplankton, Poll.Res.,22 (3) :
p11-422.
Shardendu, and Ambasht, R.S. (1998). Limnological studies of a rural pond and a
urban tropical aquatic ecosystem: oxygen enforms and ionic strength. Tropical
Ecology. 29(2) : p 98-109.
Sharma Riddhi, Sharma Vipul, Sharma Madhu Sudan, Verma Bhoopendra
Kumar,Modi Rachana and Gaur Kuldeep Singh(2011).Studies on Limnological
Characteristic, Planktonic Diversity and Fishes (Species) in Lake Pichhola, Udaipur,
98
Rajasthan (India). Universal Journal of Environmental Research and Technology,1 (3)
: p 274-285.
Sharma, S., Dixit, S., Jain, P., Shah, K. W., Vishwakarma, R. (2008). Statistical
evaluation of hydrobiological parameters of Narmada River water at hoshangabad
city, India. Environ. Monit.Assess., 143 : p195-202.
Shib Abir (2014).Seasonal Variations in Physico-Chemical Characteristics of
Rudrasagar Wetland - A Ramsar Site, Tripura, North East, India. Research Journal of
Chemical Sciences, 4(1) : p 31-40.
Shinde, S. E., Pathan, T. S., Raut, P. R., More, P. R. and Sonawane, D. L. (2010).
Seasonal variation in physicochemical characteristics of Harsool- Savangi Dam,
District, Aurangabad ,India. The Ecoscan- the international quarterly journal of
Environmental sciences, 4(1) : p 37- 44.
Shivayogimath, C.B., Kalburgi, P.B., Deshannavar, U.B. and
Virupakshaiah,D.B.M(2012).Water Quality Evaluation of River Ghataprabha, India. I
Research Journal of Environment Scienceses, 1(1) : p 12-18.
Simpi, Basavaraja., Hiremath, S.M., Murthy, KNS.,.Chandrashekarappa, K.N., Patel ,
Anil N., Puttiah , E.T. (2011). Analysis of Water Quality Using Physico-Chemical
Parameters Hosahalli Tank in Shimoga District, Karnataka, India. Global Journal of
Science Frontier Research ,11 (3):p31-34.
Singh, Th. Alexander., Meetei, N.Sanamacha. and Meitei, L. Bijen(2013). Seasonal
Variation of Some Physico-chemical Characteristics of Three Major Riversin Imphal,
Manipur: A Comparative Evaluation, Curr. World Environ., 8(1) : p 93-102.
Singhai, S., Ramani, G. M. A. and Gupta, U. S. (1990).Seasonal variations and
relationship of different physico-chemical characteristics in the newly made Tawa.
Limnologia (Berlin), 21(1) : p 293 – 301.
Sirighal, R.N., Swamjeetand, R.W. and Davis. (1986). The physicochemical
Environment and the Plankton of Managed Ponds in Haryana, India, Proc.Indian
Acad. Sci., (Sec. B), 95(3) : p253- 263.
Smith, D. G., (1990). A Better Water Quality Indexing System for Rivers and
Streams, Water Research, 24(10): p 1237-1244.
Sreenivasan, A., Pillai, K. V. and Franklin, T. (1997).Limnological study of a shallow
99
water body (Kolovoi Lake) in Tamilnadu. Indian Hydrobiology, 2(2) : p61-69.
Sugunan, V. V. and Pathak, V. (1986). Temporal and spatial distribution of
periphyton in Nagarjunsagar reservoir. A. P. India. J. Inland. Fish. Soc. India, 18:
p20-33.
Sugunan,V.V.(2000). Ecology and fishery management of reservoirs in India.
Hydrobiologia, 430 : p121-147.
Sutar, A.U., Lubal, M. J. and Pawar, K.W.(2008 ).Studies on Physico-Chemical
Aspects of Mhaswad Water Rreservoir of Satara District (Maharashtra) India.
International Journal of Plant, Animal and Environmental Sciences, 2 (3) : p12-15.
Syeda Mushahida ANoor, Sk. Kamruzzaman (2013), Spatial and Temporal Variations
in Physical and Chemical Parameters in Water of Rupsha River and Relationship with
Edaphic Factors in Khulna South Western Bangladesh, International Journal of
Science and Research (IJSR), India,(2) 1:p 460-467
Tidame, S. K and Shinde, S. S.(2012). Studies on seasonal variations in physico-
chemical parameters of the Temple pond Nashik District (M.S.), India. International
Multidisciplinary Research Journal, 2(5) : p29-32.
Trevisan, G. V. and Forsberg, B. R. (2007). Relationships among nitrogen and total
phosphorus, algal biomass and zooplankton density in the central Amazonia lakes.
Hydrobiologia, 586 : p357-365.
Trivedi, R.K. and Goel, P.K. (1984). Chemical Biological Methods for water
pollution studies. Environmental publication, Karad, India. : p122.
Trivedy, R. K. (1995). Sources of water pollution and water quality parameters,
Encyclopedia of environmental pollution and control (Ed.By Trivedy, R.
K.).Environmedia, karad.
Uba , Aghogo and Aghogho (2001). Rain water quality from different root
catchments in port – Harcourt district. Institute public analyst of Nigeria News,2 :
p11-14.
Ujjania, N.C. and Mistry,C. A. (2011).Environmental Impact of idol immersion on
Tapi River (India), International Journal of Geology, Earth and Environmental
Sciences, 2 (3) : p 11-16.
Umavathi, S., Longakumar, K and Subhashini., (2007), Studies on the nutrient content
100
of Sulur pond in Coimbator, Tamil Nadu, Journal of ecology and environmental
conservation, 13(5) : p 501-504.
Upadhyay, Manish and Gupta, Vijay Laxmi (2013).Analysis of Water Quality Using
Physico-Chemical Parameters of Khudia Dam in Mungeli District, Chhattisgarh.
IOSR Journal of Engineering,3(1) : p 42-45.
US DHEW (1962). Drinking water standards . Washington, DC, US Department of
Health, Education and Welfare, Public Health Service; US Government Printing
Office Publication No. (956).
Venkatesharaju, K., Ravikumar, P., Somashekar, R. K., Prakash. K. L. (2010).
Physico-Chemical Aand Bactriological Invistigation on The River Cauvery of
Kollegal Streth in Karnkataka .Kathmandu University. Journal of Science,
Engineering and Technology, 6 (1) : p 50-59.
Venkateshwarlu, V. (1969).An ecological study of the algae of the river Mossi,
Hyderabad (India) with special reference to water pollution. II factors influencing the
distribution of algae.Hydrobiol, 33 : p 352-363.
Verma, P., Chandawat, D., Gupta, U. and Solanki, H. (2012).Water quality analysis of
an organically polluted lake by investigating different physical and chemical
parameters. International Journal of Research in Chemistry and Environment, 2(1) :
p105-111.
Verma Sarita (2009)Seasonal Variation of Water Quality in Betwa Riverat
Bundelkhand Region, India, Global Journal of Environmental Research, 3 (3) : p 164-
168.
Verma, S. R., Shukla, G. R. and Dalela, R. C. (1980). Studies on pollution of
Hiudan river in relation to fish and fisheries. Limnological (Bulletin), 12(1) : p33-75.
Wade, J.W. (1985). Limnology and Trace Element studies in relation to primary
production in two mine lakes. Unpublished M.Sc. Thesis, University of Jos. 205.
Water Research, 24(10) : p1237-1244.
Wagh,S.R., Pokale, S.N., Aher, R.K., Thopale, T.S. and Khopake S.L. (2012). Study
of Different Ecological Parameters of Manmade Reservoir from Parnear Tahasil, Dist.
Ahmednagar (MS) India, Bionano Frontier:p86-88.
Waghmare ,B. D. and Kulkarni A. N. (2013) Assessment of SeasonalVariation in
101
Calcium, Magnesium and Hardness of Lendi river, District Nanded, Maharashtra,
India. Indian J.L.Sci.3(1) : p83-85.
Weast, R.C.(1987).Handbook of Chemistry and Physics. Boca Raton, FL: CRC Press.
Welch, E. B. (1986). Ecological effects of waste water, published by the press
syndicate of the University of Cambridge, Cambridge.
Welch, P. S. (1952). Limnology, 2nd Eds., McGraw Hill Book Co. Inc., New York.
Wetzel, R. G. (2006). Limnology. Lake and River Ecosystems, Third edition original
ISBN: 0-12-744760-1.
WHO(2004).Guidelines for Drinking-Water Quality Vol. 1.Recommandations, World
Health Organization, Geneva, Switzerland, 3rd edition.
World Health Organization (WHO) (1998).Guideline for drinking water quality.
Health Criteria and other supporting information, 2nd ed, Geneva, 2 : p 231 -270.
Zafar, A. R. (1964). On the ecology of algae in certain fish pond of Hydrabad, India,
physicochemical complexes, Hydrobiologia, 23: p179-195.
Zafar, A. R. (1966). Limnology of Hussain Sagar Lake, Hyderabad.India., phykas, 5 :
p115-126.
Zaffar, A. R. (1964).Ecology of algae in certain fish ponds of Hyderabad, India.
Hydrobiologia, 30 (1) : p96-112.
Zahoor Pir, Imtiyaz Tali,.Mudgal, L. K, Sharma Shailendra and Siddique Anis.
(2012). Evaluation of water quality: Physico chemical characteristics of River
Narmada at Madhya Pradesh India,4(5) : p63-67.
Zoeteman, B.C.J. (1980). Sensory Assessment of Water Quality.Oxford, New York-
Toronto-Sydney-Paris-Frankfurt, Peryamon press.
Zutshi, D.P. and Khan, A.U. (1988). Eutrophic gradient in the Dal lake, Kashmir. Indian
Journal of Environmental Health. 30(4) : p 348-354.
Websites
http://www.water.ncsu.edu/watershedss/info/do.html.
http://water.me.vccs.edu/exam_prep/carbondioxide.html.
http://www.mostreamteam.org/Documents/VWQM/Intro_Notebook/Chapter%2007%

102
20Intro%20Water%20Chemistry.pdf.
http://www.ct.gov/dph/lib/dph/drinking_
http://www.lenntech.com/periodic/water/magnesium/magnesium-and-
water.htm#ixzz2uaLK6au0
http://www.lenntech.com/periodic/water/magnesium/magnesium-and-
water.htm#ixzz2uaMCWEf5
http://www.lenntech.com/periodic/water/calcium/calcium-and-
water.htm#ixzz2uWVB6TDX
http://www.lenntech.com/periodic/water/calcium/calcium-and-
water.htm#ixzz2uWUcqvws
http://www.who.int/water_sanitation_health/dwq/chemicals/tds.pdf
http://www.tdsmeter.com/what-is
http://www.who.int/water_sanitation_health/dwq/chemicals/tds.pdf