Embed Size (px)
Citation preview
8/14/2019 Physical Review Special Topics - Accelerators and Beams, Volume 7,
http://slidepdf.com/reader/full/physical-review-special-topics-accelerators-and-beams-volume-7 1/10
8/14/2019 Physical Review Special Topics - Accelerators and Beams, Volume 7,
http://slidepdf.com/reader/full/physical-review-special-topics-accelerators-and-beams-volume-7 2/10
scaled to high densities it may provide a very simple androbust method of high-brightness beam generation.
In this paper, we expand on the original proposedtransition trapping system, examining in greater detailthe issues of trapped beam quality and the techniques foroptimizing it.We also present a detailed plan for a plasmadensity transition trapping proof-of-principle experimentand report on substantial progress towards realizing this
experiment.
II. TRAPPING SCENARIOS
The current development of the idea of plasma densitytransition trapping centers around the detailed study of two particular scenarios. The rst case uses a high chargebeam to create a very strong blowout of plasma electronsin a plasma with a simple step function longitudinalplasma density prole. This is the original case proposedfor transition trapping [7]. The second case is optimizedfor a proof-of-principle trapping experiment. This caseuses a beam of much more modest charge to create a weak blowout in the high density region, and uses a slopedplasma density prole to enhance charge capture andreduce energy spread.
A. Strong blowout scenario
The strong blowout scenario uses the parameters pre-sented in Table I and illustrated in Fig. 1. The plasmadensity prole is a simple step function with a constant
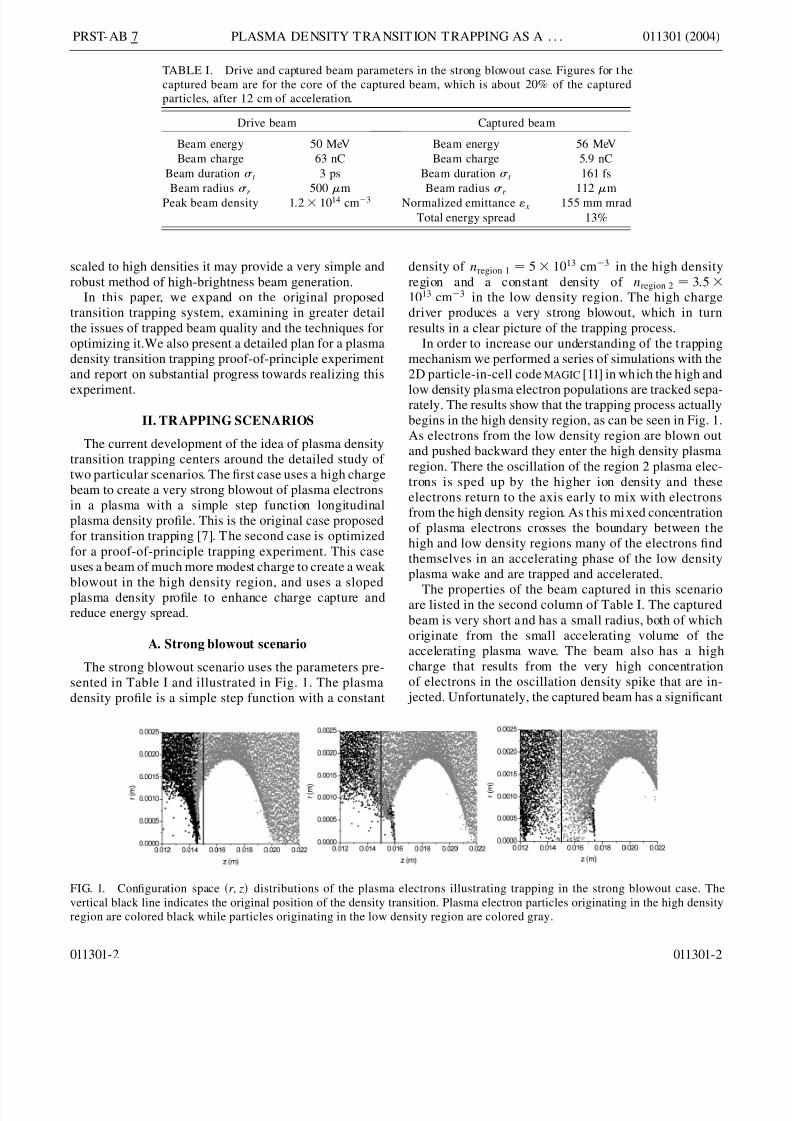
density of n region 1 5 1013 cmÿ3 in the high densityregion and a constant density of n region 2 3:51013 cmÿ3 in the low density region. The high chargedriver produces a very strong blowout, which in turnresults in a clear picture of the trapping process.
In order to increase our understanding of the t rappingmechanism we performed a series of simulations with the2D particle-in-cell code MAGIC [11] in which the high and
low density plasma electron populations are tracked sepa-rately. The results show that the trapping process actuallybegins in the high density region, as can be seen in Fig. 1.As electrons from the low density region are blown outand pushed backward they enter the high density plasmaregion. There the oscillation of the region 2 plasma elec-trons is sped up by the higher ion density and theseelectrons return to the axis early to mix with electronsfrom the high density region. As this mixed concentrationof plasma electrons crosses the boundary between thehigh and low density regions many of the electrons ndthemselves in an accelerating phase of the low densityplasma wake and are trapped and accelerated.
The properties of the beam captured in this scenarioare listed in the second column of Table I. The capturedbeam is very short and has a small radius, both of whichoriginate from the small accelerating volume of theaccelerating plasma wave. The beam also has a highcharge that results from the very high concentrationof electrons in the oscillation density spike that are in- jected. Unfortunately, the captured beam has a signicant
FIG. 1. Conguration space r; z distributions of the plasma electrons illustrating trapping in the strong blowout case. Thevertical black line indicates the original position of the density transition. Plasma electron particles originating in the high densityregion are colored black while particles originating in the low density region are colored gray.
TABLE I. Drive and captured beam parameters in the strong blowout case. Figures for t hecaptured beam are for the core of the captured beam, which is about 20% of the capturedparticles, after 12 cm of acceleration.
Drive beam Captured beam
Beam energy 50 MeV Beam energy 56 MeVBeam charge 63 nC Beam charge 5.9 nC
Beam duration t 3 ps Beam duration t 161 fsBeam radius r 500 m Beam radius r 112 m
Peak beam density 1:2 1014 cmÿ3 Normalized emittance " x 155 mm mradTotal energy spread 13%
PRST-AB 7 PLASMA DENSITY TRANSITION TRAPPING AS A . . . 011301 (2004)
011301-2 011301-2
8/14/2019 Physical Review Special Topics - Accelerators and Beams, Volume 7,
http://slidepdf.com/reader/full/physical-review-special-topics-accelerators-and-beams-volume-7 3/10
energy spread that results from the fast variation in theplasma wakeeld accelerating gradient where the par-ticles are captured. The beam also has a poor transverseemittance. This is an unavoidable consequence of trap-ping background plasma particles in the strong blowoutregime. The large amplitudes of transverse momentaimparted to the plasma electrons as the drive beam spacecharge blows them out to the side remains with the
particles as they are trapped and accelerated to highenergy.In addition to the undesirable emittance and energy
spread properties of the captured beam, this transitiontrapping scenario is a lso impractical from an experimen-tal standpoint. The drive beam parameters listed in therst column of Table I are not currently achievable. Forthis reason we began to look at what sort of trappingexperiments could be done with the more modest driverbeams that a re available. During this development wealso found ways to improve both the emittance and energyspread of the captured beams.
B. Weak blowout scenario
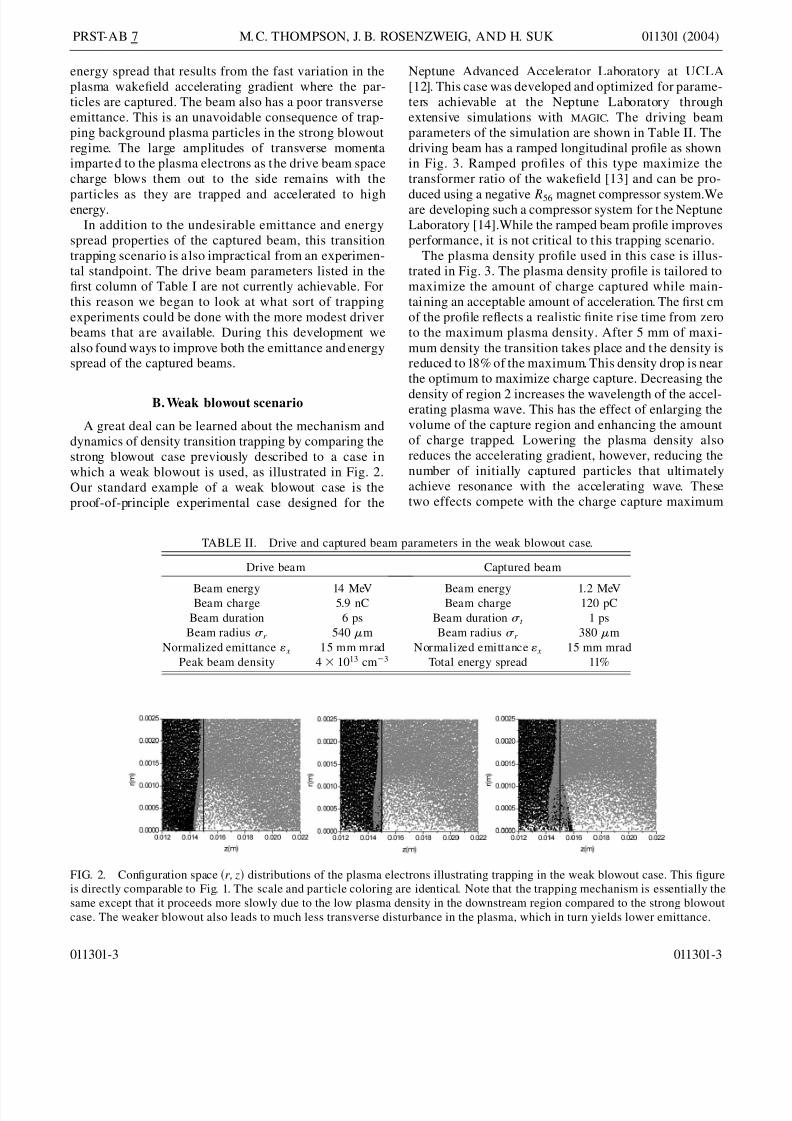
A great deal can be learned about the mechanism anddynamics of density transition trapping by comparing thestrong blowout case previously described to a case inwhich a weak blowout is used, as illustrated in Fig. 2.Our standard example of a weak blowout case is theproof-of-principle experimental case designed for the
Neptune Advanced Accelerator Laboratory at UCLA[12]. This case was developed and optimized for parame-ters achievable at the Neptune Laboratory throughextensive simulations with MAGIC. The driving beamparameters of the simulation are shown in Table II. Thedriving beam has a ramped longitudinal prole as shownin Fig. 3. Ramped proles of this type maximize thetransformer ratio of the wakeeld [13] and can be pro-
duced using a negative R56 magnet compressor system.Weare developing such a compressor system for the NeptuneLaboratory [14].While the ramped beam prole improvesperformance, it is not critical to this trapping scenario.
The plasma density prole used in this case is illus-trated in Fig. 3. The plasma density prole is tailored tomaximize the amount of charge captured while main-taining an acceptable amount of acceleration. The rst cmof the prole reects a realistic nite r ise time from zeroto the maximum plasma density. After 5 mm of maxi-mum density the transition takes place and the density isreduced to 18% of the maximum. This density drop is nearthe optimum to maximize charge capture. Decreasing thedensity of region 2 increases the wavelength of the accel-erating plasma wave. This has the effect of enlarging thevolume of the capture region and enhancing the amountof charge trapped. Lowering the plasma density alsoreduces the accelerating gradient, however, reducing thenumber of initially captured particles that ultimatelyachieve resonance with the accelerating wave. Thesetwo effects compete with the charge capture maximum
FIG. 2. Conguration space r; z distributions of the plasma electrons illustrating trapping in the weak blowout case. This gureis directly comparable to Fig. 1. The scale and par ticle coloring are identical. Note that the trapping mechanism is essentially thesame except that it proceeds more slowly due to the low plasma density in the downstream region compared to the strong blowoutcase. The weaker blowout also leads to much less transverse disturbance in the plasma, which in turn yields lower emittance.
TABLE II. Drive and captured beam parameters in the weak blowout case.
Drive beam Captured beam
Beam energy 14 MeV Beam energy 1.2 MeVBeam charge 5.9 nC Beam charge 120 pC
Beam duration 6 ps Beam duration t 1 psBeam radius r 540 m Beam radius r 380 m
Normalized emittance " x 15 mm mrad Normalized emittance " x 15 mm mradPeak beam density 4 1013 cmÿ3 Total energy spread 11%
PRST-AB 7 M. C. THOMPSON, J. B. ROSENZWEIG, AND H. SUK 011301 (2004)
011301-3 011301-3

8/14/2019 Physical Review Special Topics - Accelerators and Beams, Volume 7,
http://slidepdf.com/reader/full/physical-review-special-topics-accelerators-and-beams-volume-7 4/10
occurring at nregion 2 0:18n region 1 . To quantify the de-gree of blowout in this case, we note that the electronbeam density is 2 times larger than the peak plasmadensity of 2 1013 cmÿ3 , as can been seen from Table IIand Fig. 3.
In the simulation the transition is approximated as aperfect step function; t he validity of this assumption willbe elaborated on later in this paper. Finally, the gradualdecline in plasma density after the transition slowly in-creases the plasma wavelength, and thus the extent of theaccelerating phase of the wakeeld region. The growth inplasma wavelength reduces the peak gradient but re-phases the captured charge forward of the peak eld of the wake into a region of slightly weaker, but more uni-form, acceleration. This rephasing both increases theamount of charge trapped and reduces energy spread.The rate of density decline can be increased to reduceenergy spread even further. Gradually declining posttransition plasma densities have been shown to have simi-lar benets in the strong blowout regime [15].
The parameters of the bunch of captured plasma elec-trons are given in Table II. The captured plasma electronsform a well-dened beam of substantial charge that canbe propagated and detected without major difculty. The
captured beam is also well separated f rom the drive beamin energy and should be easy to isolate. If a bi-Gaussianbeam with t 1:5 ps is substituted for the rampedprole shown in Fig. 3, the captured beam parametersremain unchanged except for a 20% loss of capturedcharge.
III. EXPERIMENTAL PLANS
An experiment is planned with the parameters pre-sented in Table II and Fig. 3. Originally planned for theNeptune Laboratory at UCLA, this experiment will beperformed at the Fermilab NICADD PhotoinjectorLaboratory (FNPL) as part of our larger UCLA/FNALcollaboration on PWFAs. The F NPL accelerator is an18 MeV electron linac [16]. The system consists of anormal conducting L-band rf gun with a cesium telluridephotocathode and a 9-cell superconducting acceleratingcavity. Bunches with charge in excess of 8 nC can beproduced and compressed to durations of 1.6 ps rms usingmagnetic compression. By modifying an existing pulsedischarge plasma source [17] we have created a plasmacolumn with a peak density of 6 1013 cmÿ3 . As shownin Fig. 4, the raw plasma column has a Gaussian trans-verse density prole and over 6 cm of the plasma hasdensity greater than 2 1013 cmÿ3 , the required peak density for the trapping experiment.
Experimental realization of plasma density transitiontrapping depends on the creation of sharp density tran-sitions. The limit on the sharpness of the transition nec-essary to produce trapping is set by the trapping condition
kregion 1p Ltrans < 1: (1)
As can be seen from Fig. 5, this is a very strict condition.The turn on of the capture in this regime is nearly a stepfunction.
0 1 2 3 4 5 60.0
5.0x10 12
1.0x10 13
1.5x10 13
2.0x10 13
D e n s i t y
( c m -
3 )
Distance (cm)
-3 -2 -1 0 1 2 30
500
1000
1500
2000
2500
Direction of Propagation
C u r r e n
t ( A m p
)
Time (ps)
FIG. 3. Plasma density (top) and drive beam current (bottom)proles.
-5 -4 -3 -2 -1 0 1 2 3 4
1x10 13
2x10 13
3x10 13
4x10 13
5x10 13
6x10 13
P l a s m a
D e n s i t y
( c m - 3 )
z (cm)
FIG. 4. Measured transverse density prole of the plasmacolumn.
PRST-AB 7 PLASMA DENSITY TRANSITION TRAPPING AS A . . . 011301 (2004)
011301-4 011301-4
8/14/2019 Physical Review Special Topics - Accelerators and Beams, Volume 7,
http://slidepdf.com/reader/full/physical-review-special-topics-accelerators-and-beams-volume-7 5/10
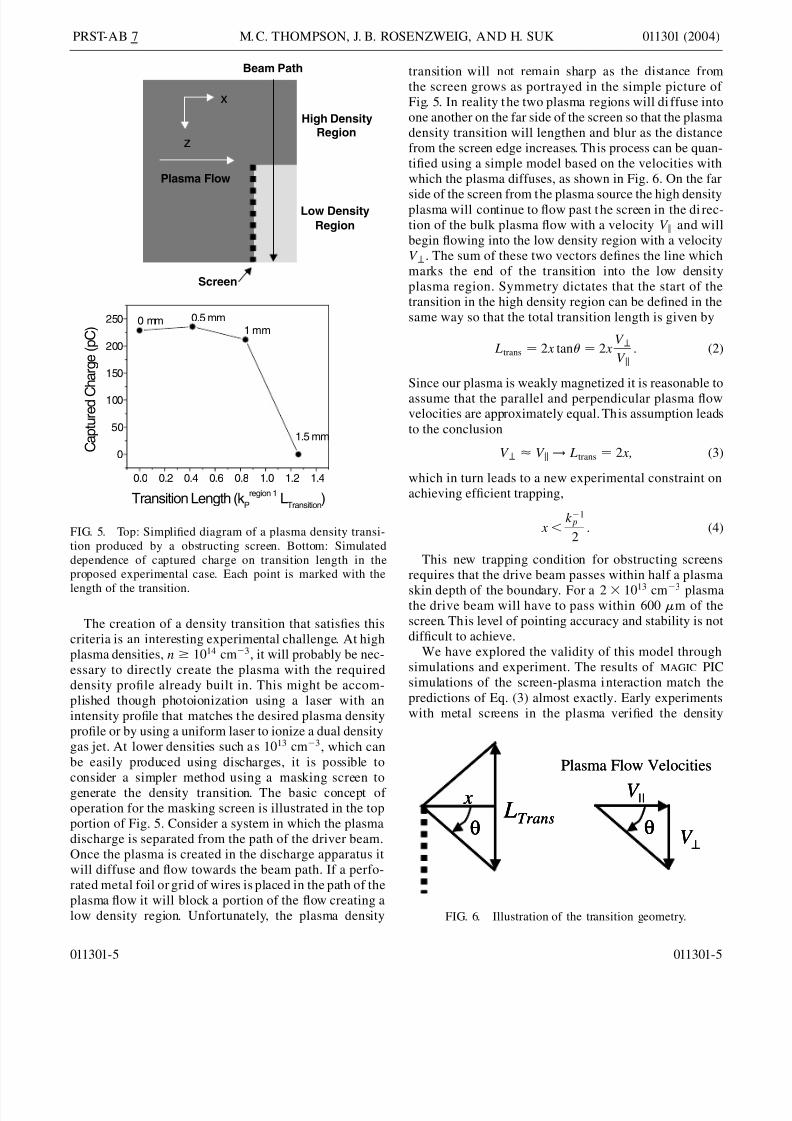
The creation of a density transition that satises thiscriteria is an interesting experimental challenge. At highplasma densities, n 1014 cmÿ3 , it will probably be nec-essary to directly create the plasma with the requireddensity prole already built in. This might be accom-plished though photoionization using a laser with anintensity prole that matches the desired plasma densityprole or by using a uniform laser to ionize a dual densitygas jet. At lower densities such as 10 13 cmÿ3 , which canbe easily produced using discharges, it is possible toconsider a simpler method using a masking screen togenerate the density transition. The basic concept of operation for the masking screen is illustrated in the topportion of Fig. 5. Consider a system in which the plasmadischarge is separated from the path of the driver beam.Once the plasma is created in the discharge apparatus itwill diffuse and ow towards the beam path. If a perfo-rated metal foil or grid of wires is placed in the path of theplasma ow it will block a portion of the ow creating alow density region. Unfortunately, the plasma density
transition will not remain sharp as the distance fromthe screen grows as portrayed in the simple picture of Fig. 5. In reality the two plasma regions will di ffuse intoone another on the far side of the screen so that the plasmadensity transition will lengthen and blur as the distancefrom the screen edge increases. This process can be quan-tied using a simple model based on the velocities withwhich the plasma diffuses, as shown in Fig. 6. On the far
side of the screen from the plasma source the high densityplasma will continue to ow past t he screen in the di rec-tion of the bulk plasma ow with a velocity V kand willbegin owing into the low density region with a velocityV ? . The sum of these two vectors denes the line whichmarks the end of the transition into the low densityplasma region. Symmetry dictates that the start of thetransition in the high density region can be dened in thesame way so that the total transition length is given by
Ltrans 2 x tan 2 xV ?V k
: (2)
Since our plasma is weakly magnetized it is reasonable toassume that the parallel and perpendicular plasma owvelocities are approximately equal. This assumption leadsto the conclusion
V ? V k! Ltrans 2 x; (3)
which in turn leads to a new experimental constraint onachieving efcient trapping,
x <kÿ1
p
2: (4)
This new trapping condition for obstructing screensrequires that the drive beam passes within half a plasmaskin depth of the boundary. For a 2 1013 cmÿ3 plasmathe drive beam will have to pass within 600 m of thescreen. This level of pointing accuracy and stability is notdifcult to achieve.
We have explored the validity of this model throughsimulations and experiment. The results of MAGIC PICsimulations of the screen-plasma interaction match thepredictions of Eq. (3) almost exactly. Early experimentswith metal screens in the plasma veried the density
x
θ L Trans
θ
V ||
V
Plasma Flow Velocities
x
θ L Trans
θ
V ||
V
x
θ L Trans
θ
V ||
V
Plasma Flow Velocities
FIG. 6. Illustration of the transition geometry.
High DensityRegion
Low DensityRegion
Plasma Flow
Beam Path
Screen
z
x
0.0 0.2 0.4 0.6 0.8 1.0 1.2 1.4
0
50
100
150
200
250
1.5 mm
1 mm0.5 mm0 mm
C a p
t u r e
d C h a r g e
( p C )
Transition Length (k Pregion 1 LTransition )
FIG. 5. Top: Simpli ed diagram of a plasma density transi-tion produced by a obstructing screen. Bottom: Simulateddependence of captured charge on transition length in theproposed experimental case. Each point is marked with the
length of the transition.
PRST-AB 7 M. C. THOMPSON, J. B. ROSENZWEIG, AND H. SUK 011301 (2004)
011301-5 011301-5
8/14/2019 Physical Review Special Topics - Accelerators and Beams, Volume 7,
http://slidepdf.com/reader/full/physical-review-special-topics-accelerators-and-beams-volume-7 6/10
masking effect, but measurements of the density transi-tion were inconclusive due to inadequate positioningequipment. A set of high precision density transitionmeasurements is planned.
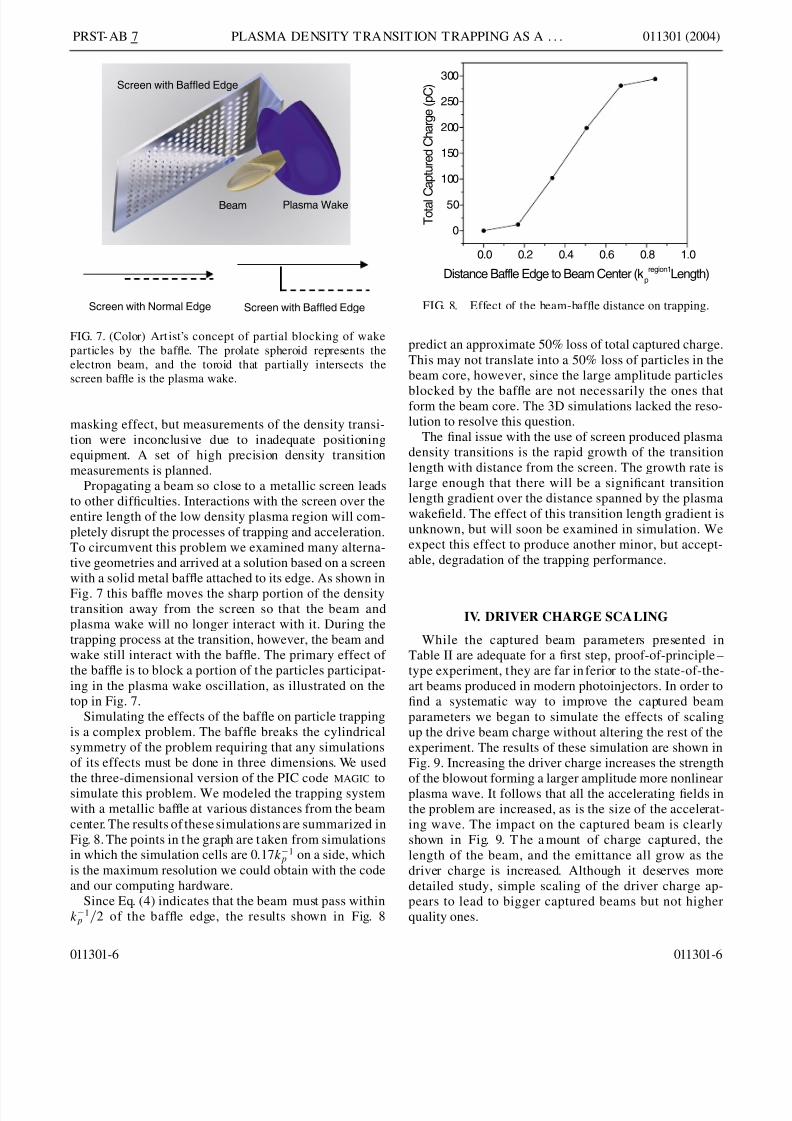
Propagating a beam so close to a metallic screen leadsto other dif culties. Interactions with the screen over theentire length of the low density plasma region will com-pletely disrupt the processes of trapping and acceleration.To circumvent this problem we examined many alterna-tive geometries and arrived at a solution based on a screenwith a solid metal baf e attached to its edge. As shown inFig. 7 this baf e moves the sharp portion of the densitytransition away from the screen so that the beam andplasma wake will no longer interact with it. During thetrapping process at the transition, however, the beam andwake still interact with the baf e. The primary effect of the baf e is to block a portion of the particles participat-ing in the plasma wake oscillation, as illustrated on thetop in Fig. 7.
Simulating the effects of the baf e on particle trappingis a complex problem. The baf e breaks the cylindricalsymmetry of the problem requiring that any simulationsof its effects must be done in three dimensions. We usedthe three-dimensional version of the PIC code MAGIC tosimulate this problem. We modeled the trapping systemwith a metallic baf e at various distances from the beamcenter. The results of these simulations are summarized inFig. 8. The points in t he graph are taken from simulationsin which the simulation cells are 0:17kÿ1
p on a side, whichis the maximum resolution we could obtain with the codeand our computing hardware.
Since Eq. (4) indicates that the beam must pass withinkÿ1
p =2 of the baf e edge, the results shown in Fig. 8
predict an approximate 50% loss of total captured charge.This may not translate into a 50% loss of particles in thebeam core, however, since the large amplitude particles
blocked by the baf e are not necessarily the ones thatform the beam core. The 3D simulations lacked the reso-lution to resolve this question.
The nal issue with the use of screen produced plasmadensity transitions is the rapid growth of the transitionlength with distance from the screen. The growth rate islarge enough that there will be a signi cant transitionlength gradient over the distance spanned by the plasmawake eld. The effect of this transition length gradient isunknown, but will soon be examined in simulation. Weexpect this effect to produce another minor, but accept-able, degradation of the trapping performance.
IV. DRIVER CHARGE SCALING
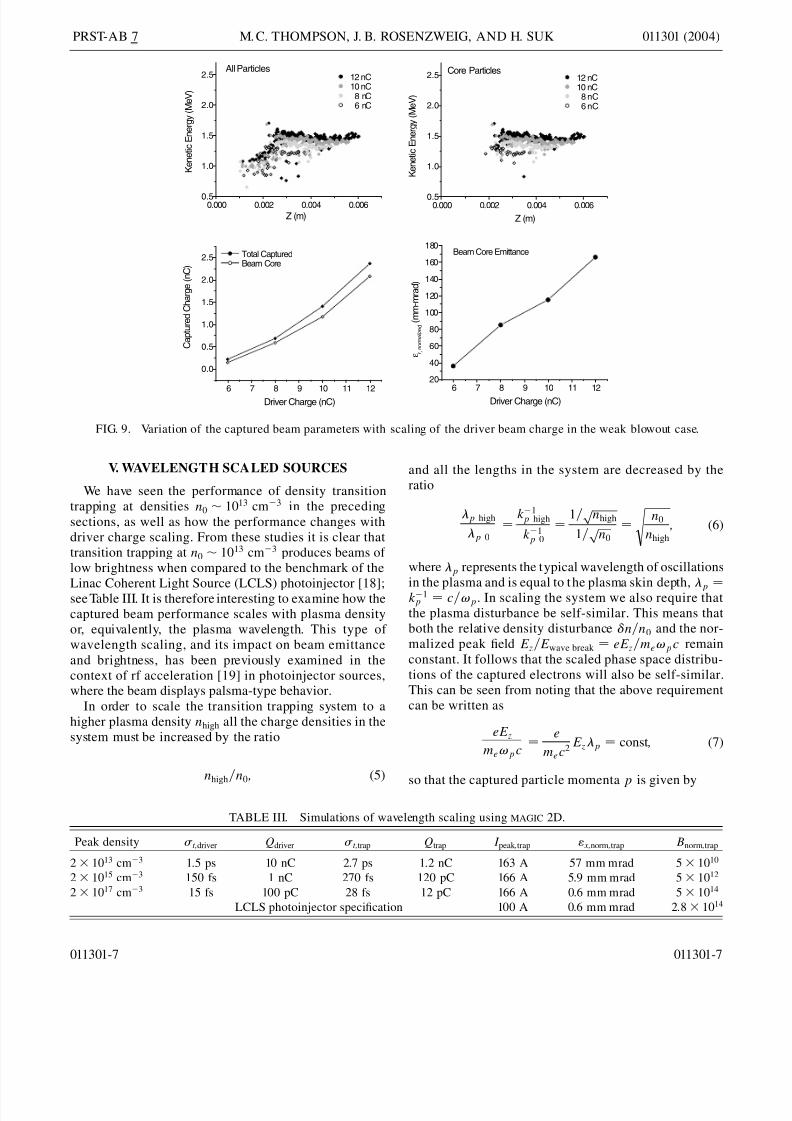
While the captured beam parameters presented inTable II are adequate for a rst step, proof-of-principle –type experiment, they are far in ferior to the state-of-the-art beams produced in modern photoinjectors. In order tond a systematic way to improve the captured beamparameters we began to simulate the effects of scalingup the drive beam charge without altering the rest of theexperiment. The results of these simulation are shown inFig. 9. Increasing the driver charge increases the strengthof the blowout forming a larger amplitude more nonlinearplasma wave. It follows that all the accelerating elds inthe problem are increased, as is the size of the accelerat-ing wave. The impact on the captured beam is clearlyshown in Fig. 9. T he a mount of charge captured, thelength of the beam, and the emittance all grow as thedriver charge is increased. Although it deserves moredetailed study, simple scaling of the driver charge ap-pears to lead to bigger captured beams but not higherquality ones.
0.0 0.2 0.4 0.6 0.8 1.0
0
50
100
150
200
250
300
T o
t a l C a p
t u r e
d C h a r g e
( p C )
Distance Baffle Edge to Beam Center (k pregion1 Length)
FIG. 8. Effect of the beam-baf e distance on trapping.Screen with Normal Edge Screen with Baffled Edge
Beam Plasma Wake
Screen with Baffled Edge
FIG. 7. (Color) Art ist ’s concept of partial blocking of wakeparticles by the baf e. The prolate spheroid represents theelectron beam, and the toroid that partially intersects thescreen baf e is the plasma wake.
PRST-AB 7 PLASMA DENSITY TRANSITION TRAPPING AS A . . . 011301 (2004)
011301-6 011301-6
8/14/2019 Physical Review Special Topics - Accelerators and Beams, Volume 7,
http://slidepdf.com/reader/full/physical-review-special-topics-accelerators-and-beams-volume-7 7/10
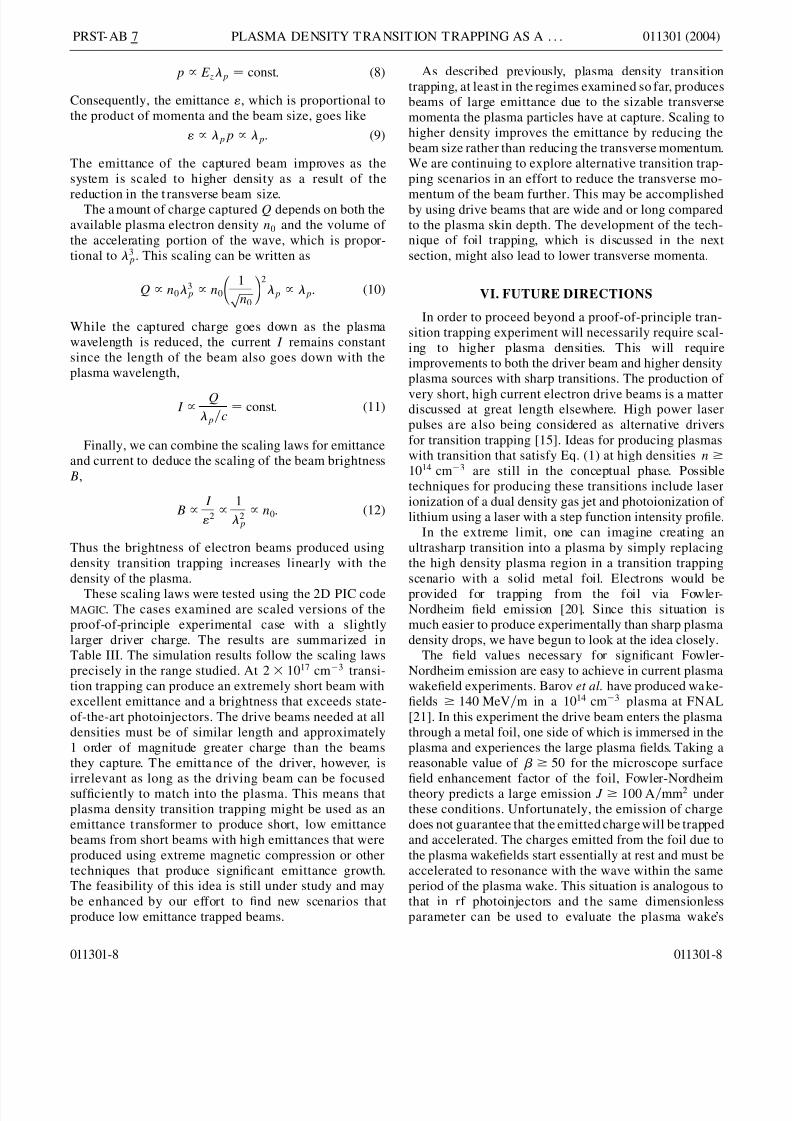
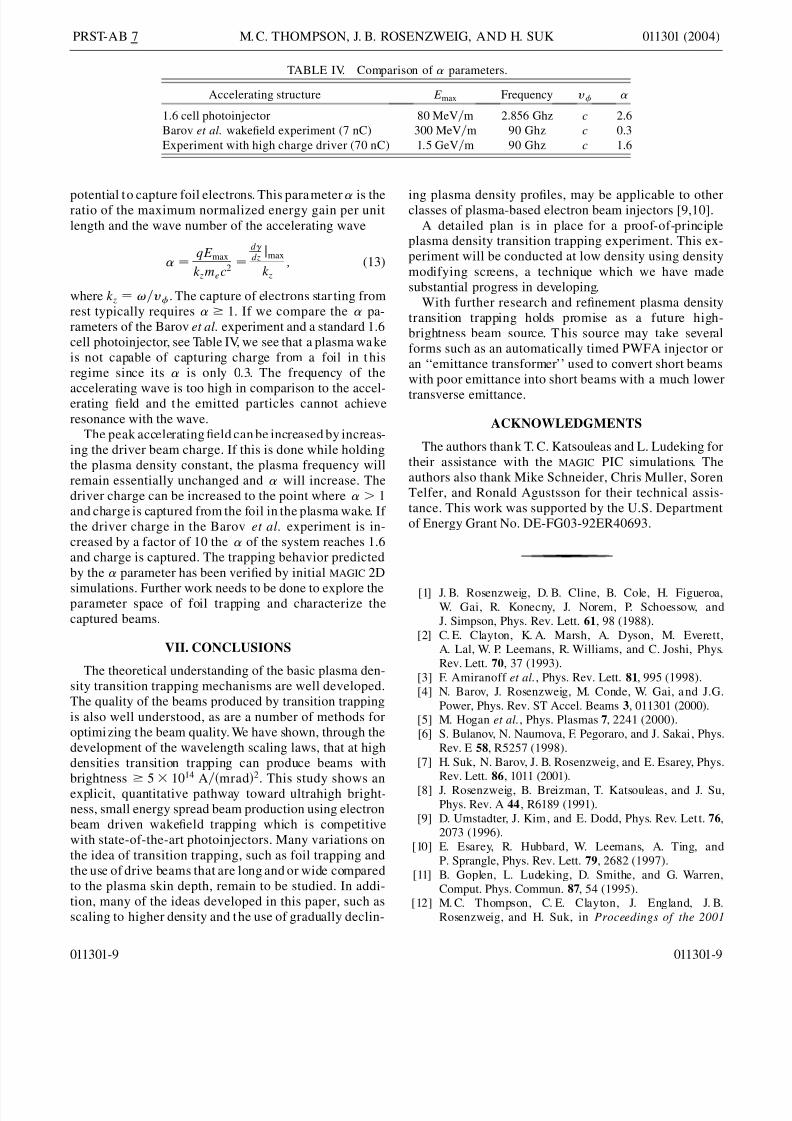
V. WAVELENGTH SCALED SOURCES
We have seen the performance of density transitiontrapping at densities n0 1013 cmÿ3 in the precedingsections, as well as how the performance changes withdriver charge scaling. From these studies it is clear thattransition trapping at n0 10 13 cmÿ3 produces beams of low brightness when compared to the benchmark of the
Linac Coherent Light Source (LCLS) photoinjector [18];see Table III. It is therefore interesting to examine how thecaptured beam performance scales with plasma densityor, equivalently, the plasma wavelength. This type of wavelength scaling, and its impact on beam emittanceand brightness, has been previously examined in thecontext of rf acceleration [19] in photoinjector sources,where the beam displays palsma-type behavior.
In order to scale the transition trapping system to ahigher plasma density nhigh all the charge densities in thesystem must be increased by the ratio
nhigh =n0 ; (5)
and all the lengths in the system are decreased by theratio
p high
p 0
kÿ1p high
kÿ1p 0
1= nhighp 1= n0p
n0
nhighs ; (6)
where p represents the typical wavelength of oscillations
in the plasma and is equal to t he plasma skin depth, pkÿ1p c=! p . In scaling the system we also require that
the plasma disturbance be self-similar. This means thatboth the relative density disturbance n=n 0 and the nor-malized peak eld Ez=Ewave break eE z=me! p c remainconstant. It follows that the scaled phase space distribu-tions of the captured electrons will also be self-similar.This can be seen from noting that the above requirementcan be written as
eE z
me! p ce
mec2 Ez p const ; (7)
so that the captured particle momenta p is given by
TABLE III. Simulations of wavelength scaling using MAGIC 2D.
Peak density t;driver Qdriver t;trap Q trap I peak ;trap " x;norm ;trap Bnorm ;trap
2 1013 cmÿ3 1.5 ps 10 nC 2.7 ps 1.2 nC 163 A 57 mm mrad 5 1010
2 1015 cmÿ3 150 fs 1 nC 270 fs 120 pC 166 A 5.9 mm mrad 5 1012
2 1017 cmÿ3 15 fs 100 pC 28 fs 12 pC 166 A 0.6 mm mrad 5 1014
LCLS photoinjector speci cation 100 A 0.6 mm mrad 2:8 1014
6 7 8 9 10 11 1220
40
60
80
100
120
140
160
180Beam Core Emittance
ε r , n o r m a l i z e
d ( m m - m r a
d )
Driver Charge (nC)
0.000 0.002 0.004 0.0060.5
1.0
1.5
2.0
2.5
Z (m)
All Particles12 nC10 nC
8 nC6 nC
K e n e
t i c E n e r g y
( M e V
)
0.000 0.002 0.004 0.0060.5
1.0
1.5
2.0
2.5 12 nC10 nC
8 nC6 nC
Core Particles
K e n e
t i c E n e r g y
( M e
V )
Z (m)
6 7 8 9 10 11 12
0.0
0.5
1.0
1.5
2.0
2.5 Total CapturedBeam Core
C a p
t u r e d
C h a r g e
( n C )
Driver Charge (nC)
FIG. 9. Variation of the captured beam parameters with scaling of the driver beam charge in the weak blowout case.
PRST-AB 7 M. C. THOMPSON, J. B. ROSENZWEIG, AND H. SUK 011301 (2004)
011301-7 011301-7
8/14/2019 Physical Review Special Topics - Accelerators and Beams, Volume 7,
http://slidepdf.com/reader/full/physical-review-special-topics-accelerators-and-beams-volume-7 8/10
p / Ez p const : (8)
Consequently, the emittance " , which is proportional tothe product of momenta and the beam size, goes like
" / p p / p : (9)
The emittance of the captured beam improves as thesystem is scaled to higher density as a result of the
reduction in the t ransverse beam size.The a mount of charge captured Q depends on both the
available plasma electron density n0 and the volume of the accelerating portion of the wave, which is propor-tional to 3
p . This scaling can be written as
Q / n03p / n0
1n0p
2
p / p : (10)
While the captured charge goes down as the plasmawavelength is reduced, the current I remains constantsince the length of the beam also goes down with theplasma wavelength,
I /Qp =c
const : (11)
Finally, we can combine the scaling laws for emittanceand current to deduce the scaling of the beam brightnessB,
B /I
" 2 /12p / n0: (12)
Thus the brightness of electron beams produced usingdensity transition trapping increases linearly with thedensity of the plasma.
These scaling laws were tested using the 2D PIC codeMAGIC . The cases examined are scaled versions of theproof-of-principle experimental case with a slightlylarger driver charge. The results are summarized inTable III. The simulation results follow the scaling lawsprecisely in the range studied. At 2 1017 cmÿ3 transi-tion trapping can produce an extremely short beam withexcellent emittance and a brightness that exceeds state-of-the-art photoinjectors. The drive beams needed at alldensities must be of similar length and approximately1 order of magnitude greater charge than the beamsthey capture. The emitta nce of the driver, however, isirrelevant as long as the driving beam can be focusedsuf ciently to match into the plasma. This means thatplasma density transition trapping might be used as anemittance t ransformer to produce short, low emittancebeams from short beams with high emittances that wereproduced using extreme magnetic compression or othertechniques that produce signi cant emittance growth.The feasibility of this idea is still under study and maybe enhanced by our effort to nd new scenarios thatproduce low emittance trapped beams.
As described previously, plasma density transitiontrapping, at least in the regimes examined so far, producesbeams of large emittance due to the sizable transversemomenta the plasma particles have at capture. Scaling tohigher density improves the emittance by reducing thebeam size rather than reducing the transverse momentum.We are continuing to explore alternative transition trap-ping scenarios in an effort to reduce the transverse mo-
mentum of the beam further. This may be accomplishedby using drive beams that are wide and or long comparedto the plasma skin depth. The development of the tech-nique of foil trapping, which is discussed in the nextsection, might also lead to lower transverse momenta.
VI. FUTURE DIRECTIONS
In order to proceed beyond a proof-of-principle tran-sition trapping experiment will necessarily require scal-ing to higher plasma densities. This will requireimprovements to both the driver beam and higher densityplasma sources with sharp transitions. The production of very short, high current electron drive beams is a matterdiscussed at great length elsewhere. High power laserpulses a re a lso being considered as alternative driversfor transition trapping [15]. Ideas for producing plasmaswith transition that satisfy Eq. (1) at high densities n1014 cmÿ3 are still in the conceptual phase. Possibletechniques for producing these transitions include laserionization of a dual density gas jet and photoionization of lithium using a laser with a step function intensity pro le.
In the extreme limit, one can imagine creating anultrasharp transition into a plasma by simply replacingthe high density plasma region in a transition trappingscenario with a solid metal foil. Electrons would beprovided for trapping from the foil via Fowler-Nordheim eld emission [20]. Since this situation ismuch easier to produce experimentally than sharp plasmadensity drops, we have begun to look at the idea closely.
The eld values necessary for signi cant Fowler-Nordheim emission are easy to achieve in current plasmawake eld experiments. Barov et al. have produced wake-elds 140 MeV =m in a 1014 cmÿ3 plasma at FNAL[21]. In this experiment the drive beam enters the plasmathrough a metal foil, one side of which is immersed in theplasma and experiences the large plasma elds. Taking areasonable value of 50 for the microscope surfaceeld enhancement factor of the foil, Fowler-Nordheimtheory predicts a large emission J 100 A =mm 2 underthese conditions. Unfortunately, the emission of chargedoes not guarantee that the emitted charge will be trappedand accelerated. The charges emitted from the foil due tothe plasma wake elds start essentially at rest and must beaccelerated to resonance with the wave within the sameperiod of the plasma wake. This situation is analogous tothat in rf photoinjectors and the same dimensionlessparameter can be used to evaluate the plasma wake ’s
PRST-AB 7 PLASMA DENSITY TRANSITION TRAPPING AS A . . . 011301 (2004)
011301-8 011301-8
8/14/2019 Physical Review Special Topics - Accelerators and Beams, Volume 7,
http://slidepdf.com/reader/full/physical-review-special-topics-accelerators-and-beams-volume-7 9/10
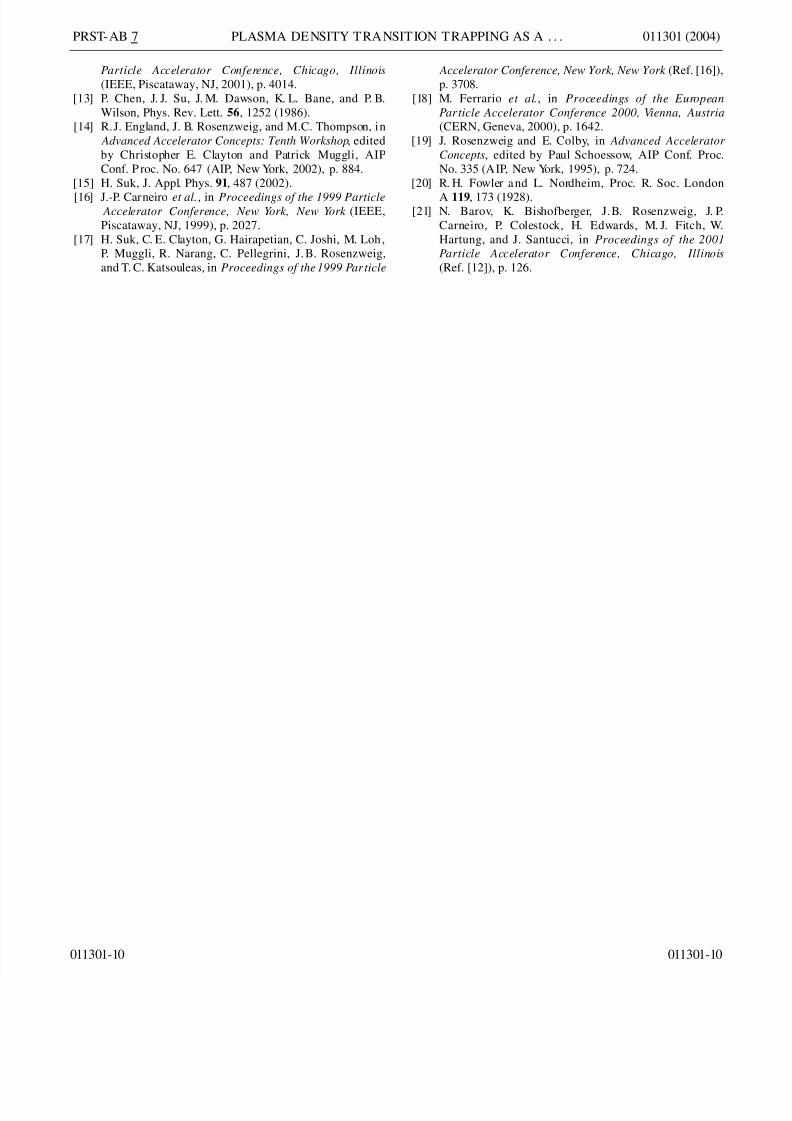
potential to capture foil electrons. This parameter is theratio of the maximum normalized energy gain per unitlength and the wave number of the accelerating wave
qE max
kzmec2
ddz jmax
kz ; (13)
where kz !=v . The capture of electrons star ting fromrest typically requires 1. If we compare the pa-rameters of the Barov et al. experiment and a standard 1.6cell photoinjector, see Table IV, we see that a plasma wa keis not capable of capturing charge from a foil in t hisregime since its is only 0.3. The frequency of the
accelerating wave is too high in comparison to the accel-erating eld and the emitted particles cannot achieveresonance with the wave.
The peak accelerating eld can be increased by increas-ing the driver beam charge. If this is done while holdingthe plasma density constant, the plasma frequency willremain essentially unchanged and will increase. Thedriver charge can be increased to the point where > 1and charge is captured from the foil in the plasma wake. If the driver charge in the Barov et al. experiment is in-creased by a factor of 10 the of the system reaches 1.6and charge is captured. The trapping behavior predictedby the parameter has been veri ed by initial MAGIC 2D
simulations. Further work needs to be done to explore theparameter space of foil trapping and characterize thecaptured beams.
VII. CONCLUSIONS
The theoretical understanding of the basic plasma den-sity transition trapping mechanisms are well developed.The quality of the beams produced by transition trappingis also well understood, as are a number of methods foroptimizing the beam quality. We have shown, through thedevelopment of the wavelength scaling laws, that at highdensities transition trapping can produce beams withbrightness 5 1014 A= mrad 2 . This study shows anexplicit, quantitative pathway toward ultrahigh bright-ness, small energy spread beam production using electronbeam driven wake eld trapping which is competitivewith state-of-the-art photoinjectors. Many variations onthe idea of transition trapping, such as foil trapping andthe use of drive beams that are long and or wide comparedto the plasma skin depth, remain to be studied. In addi-tion, many of the ideas developed in this paper, such asscaling to higher density and the use of gradually declin-
ing plasma density pro les, may be applicable to otherclasses of plasma-based electron beam injectors [9,10].
A detailed plan is in place for a proof-of-principleplasma density transition trapping experiment. This ex-periment will be conducted at low density using densitymodifying screens, a technique which we have madesubstantial progress in developing.
With further research and re nement plasma densitytransition trapping holds promise as a future high-brightness beam source. T his source may take severalforms such as an automatically timed PWFA injector oran ‘‘emittance transformer ’’ used to convert short beamswith poor emittance into short beams with a much lowertransverse emittance.
ACKNOWLEDGMENTS
The authors thank T. C. Katsouleas and L. Ludeking fortheir assistance with the MAGIC PIC simulations. Theauthors also thank Mike Schneider, Chris Muller, SorenTelfer, and Ronald Agustsson for their technical assis-tance. This work was supported by the U.S. Departmentof Energy Grant No. DE-FG03-92ER40693.
[1] J. B. Rosenzweig, D. B. Cline, B. Cole, H. Figueroa,W. Gai, R. Konecny, J. Norem, P. Schoessow, andJ. Simpson, Phys. Rev. Lett. 61 , 98 (1988).
[2] C. E. Clayton, K. A. Marsh, A. Dyson, M. Everett,A. Lal, W. P. Leemans, R. Williams, and C. Joshi, Phys.Rev. Lett. 70 , 37 (1993).
[3] F. Amiranoff et al. , Phys. Rev. Lett. 81, 995 (1998).[4] N. Barov, J. Rosenzweig, M. Conde, W. Gai, and J.G.
Power, Phys. Rev. ST Accel. Beams 3, 011301 (2000).[5] M. Hogan et al. , Phys. Plasmas 7, 2241 (2000).[6] S. Bulanov, N. Naumova, F. Pegoraro, and J. Sakai , Phys.
Rev. E 58 , R5257 (1998).[7] H. Suk, N. Barov, J. B. Rosenzweig, and E. Esarey, Phys.
Rev. Lett. 86 , 1011 (2001).[8] J. Rosenzweig, B. Breizman, T. Katsouleas, and J. Su,
Phys. Rev. A 44 , R6189 (1991).[9] D. Umstadter, J. Kim, and E. Dodd, Phys. Rev. Let t. 76 ,
2073 (1996).[10] E. Esarey, R. Hubbard, W. Leemans, A. Ting, and
P. Sprangle, Phys. Rev. Lett. 79 , 2682 (1997).[11] B. Goplen, L. Ludeking, D. Smithe, and G. Warren,
Comput. Phys. Commun. 87, 54 (1995).[12] M. C. Thompson, C. E. Clayton, J. England, J. B.
Rosenzweig, and H. Suk, in Proceedings of the 2001
TABLE IV. Comparison of parameters.
Accelerating structure Emax Frequency v
1.6 cell photoinjector 80 MeV =m 2.856 Ghz c 2.6Barov et al. wake eld experiment (7 nC) 300 MeV =m 90 Ghz c 0.3Experiment with high charge driver (70 nC) 1:5 GeV =m 90 Ghz c 1.6
PRST-AB 7 M. C. THOMPSON, J. B. ROSENZWEIG, AND H. SUK 011301 (2004)
011301-9 011301-9
8/14/2019 Physical Review Special Topics - Accelerators and Beams, Volume 7,
http://slidepdf.com/reader/full/physical-review-special-topics-accelerators-and-beams-volume-7 10/10
Particle Accelerator Conference, Chicago, Illinois(IEEE, Piscataway, NJ, 2001), p. 4014.
[13] P. Chen, J. J. Su, J. M. Dawson, K. L. Bane, and P. B.Wilson, Phys. Rev. Lett. 56 , 1252 (1986).
[14] R.J. England, J. B. Rosenzweig, and M.C. Thompson, in Advanced Accelerator Concepts: Tenth Workshop , editedby Christopher E. Clayton and Patrick Muggli, AIPConf. P roc. No. 647 (AIP, New York, 2002), p. 884.
[15] H. Suk, J. Appl. Phys. 91, 487 (2002).[16] J.-P. Carneiro et al. , in Proceedings of the 1999 Particle
Accelerator Conference, New York, New York (IEEE,Piscataway, NJ, 1999), p. 2027.
[17] H. Suk, C. E. Clayton, G. Hairapetian, C. Joshi, M. Loh,P. Muggli, R. Narang, C. Pellegrini, J. B. Rosenzweig,and T. C. Katsouleas, in Proceedings of the 1999 Par ticle
Accelerator Conference, New York, New York (Ref. [16]),p. 3708.
[18] M. Ferrario et al. , in Proceedings of the EuropeanPar ticle Accelerator Conference 2000, Vienna, Austria(CERN, Geneva, 2000), p. 1642.
[19] J. Rosenzweig and E. Colby, in Advanced Accelerator Concepts , edited by Paul Schoessow, AIP Conf. Proc.No. 335 (AIP, New York, 1995), p. 724.
[20] R. H. Fowler and L. Nordheim, Proc. R. Soc. LondonA 119 , 173 (1928).
[21] N. Barov, K. Bishofberger, J. B. Rosenzweig, J. P.Carneiro, P. Colestock, H. Edwards, M. J. Fitch, W.Hartung, and J. Santucci, in Proceedings of the 2001Particle Accelerator Conference, Chicago, Illinois(Ref. [12]), p. 126.
PRST-AB 7 PLASMA DENSITY TRANSITION TRAPPING AS A . . . 011301 (2004)
011301-10 011301-10