Embed Size (px)
Citation preview
Physical & Chemical Interactions on Paper Surface
– Impact on the Printability of Papers Produced
with E. globulus Kraft Pulps
Isabel Maria Teixeira Moutinho
Universidade de Coimbra Faculdade de Ciências e Tecnologia 2009


Physical & Chemical Interactions on Paper Surface –
Impact on the Printability of Papers Produced with E.
globulus Kraft Pulps
Isabel Maria Teixeira Moutinho
UNIVERSIDADE DE COIMBRA Faculdade de Ciências e Tecnologia 2009


Dissertation submitted to Coimbra University for the degree of Doctor of Philosophy in
Chemical Engineering (Chemical Processes)
…
Tese submetida à Universidade de Coimbra para a obtenção do grau de Doutor em
Engenharia Química – Especialidade de Processos Químicos.
Coimbra – Portugal
2009

vi
ACKNOWLEDGMENTS
I would like to express my warmest thanks to all those who contributed, in one way or
another, to the conclusion of this work, but especially to:
- Prof. Margarida Figueiredo and Prof. Paulo Ferreira. Without their guidance, academic
insight and patience, such a study would never have been accomplished.
- Prof. Graça Carvalho, Prof. Helena Gil and Prof. Jorge Coelho for their help and critical
thinking during the various phases of the work.
- Eng. José Luis Amaral, Eng. Paulo Mendes Sousa and Dra. Fernanda Paula from RAIZ for
their support and contribution for the execution of some stages of the experimental work.
- FCT (Fundação para a Ciência e a Tecnologia) and grupo Portucel Soporcel for the
financial support and valuable information shared, vital for this work.
- The staff of the Chemical Engineering Department of the Coimbra University for their help
throughout the several years that I have been developing my experimental work.
- Nuno Oliveira for his important help and support during all the work.
- My new co-workers, particularly to Vitor Crespo, João Breda, Maria José Heitor and
Marta Fortunato for their encouragement during the final stage of the work.
Finally, I would like to express my gratitude and infinite thanks to:
- My parents, my sister and my brother, for their continued support during this important
stage of my education and my life.
- André, for his help and support during most of the duration of this work.
- Sónia, for her help, companionship, friendship and endless patience and support during all
these years.
- Carla, for her important help, support, friendship and for the great years of co-work.
- Gus, Marco and PASO, for their friendship, help and infinite support.


ix
RESUMO
Actualmente assiste-se a uma crescente exigência dos consumidores relativamente à
qualidade dos papéis de impressão e escrita (P&W), especialmente no que respeita à sua
imprimabilidade. As interacções tinta-papel são afectadas quer pelas propriedades físico-
químicas da superfície do papel quer pelas propriedades da matriz fibrosa, pelo que não
apenas o tratamento final da superfície mas, em geral, todas as operações do processo de
produção condicionam o desempenho do papel em termos de impressão. Neste contexto, a
modificação química da superfície do papel é hoje em dia uma prática comum para
aumentar a qualidade de impressão, sendo a colagem superficial uma operação corrente
em qualquer fábrica de papel.
Tradicionalmente, é utilizada uma solução de amido para o tratamento superficial de
papéis de impressão e escrita, a fim de melhorar propriedades como a resistência
superficial ou imprimabilidade. No entanto, recentemente têm vindo a ser usadas
formulações de colagem superficial à base de misturas de amido catiónico com pequenas
percentagens de copolímeros sintéticos, de modo a realçar os efeitos da colagem
superficial, particularmente no que diz respeito à energia de superfície, carácter hidrofílico
e afinidade para com diferentes tipos de tinta. O objectivo principal é o de optimizar os
processos de absorção e espalhamento das tintas de impressão, e assim favorecer a
qualidade de impressão.
O principal objectivo do presente trabalho é precisamente analisar o impacto da aplicação
de diferentes formulações de colagem superficial, constituídas por misturas de amido e um
agente de colagem, tanto nas propriedades superficiais do papel como na qualidade de
impressão. Para tal foram utilizadas misturas de amido catiónico com 10 copolímeros
distintos, em três percentagens diferentes de copolímero (5%, 10% e 20% w/w), num total
de 30 formulações. Estas formulações foram devidamente caracterizadas e depois
aplicadas na superfície de folhas de papel não revestido produzido com base em pasta
kraft branqueada de E. globulus e procedeu-se à análise exaustiva das respectivas
superfícies, designadamente em termos de lisura, porosidade e algumas propriedades
químicas, como a energia de superfície e o carácter ácido-base da superfície. O papel
tratado com 100% de amido catiónico foi tomado como amostra de referência. Foram
utilizadas diversas técnicas de caracterização, como perfilometria óptica, porosimetria de
mercúrio, medição dos ângulos de contacto e cromatografia gasosa de fase inversa (IGC).

x
Complementarmente, usou-se ainda Microscopia de Força Atómica, Espectroscopia
Electrónica para Análise Química e Espectroscopia de Ião Secundário, a fim de esclarecer
aspectos mais específicos em algumas das amostras. Por fim, procedeu-se à avaliação da
qualidade de impressão inkjet nas diferentes amostras, através quer da determinação de
vários parâmetros de qualidade de impressão quer da análise das amostras impressas por
um painel de utilizadores finais deste tipo de papéis. Estes resultados foram correlacionados
com os provenientes da caracterização da superfície do papel, recorrendo a PLS (Partial
Least Squares). Todos os resultados experimentais foram sujeitos a uma análise de variância
(ANOVA) e análise de componentes principais (PCA - Principal Component Analysis) por
forma a avaliar a variabilidade intra e inter-amostras. Esta variabilidade foi analisada de
modo sistemático tendo em conta os tratamentos de superfície aplicados.
O estudo desenvolvido revelou que os tratamentos de colagem na superfície do papel têm
um impacto pouco significativo em parâmetros físicos, como os determinados por
perfilometria ou por porosimetria de mercúrio, mas influenciam decisivamente as
propriedades químicas da superfície das amostras. Com efeito, as diferentes formulações
testadas conduziram a níveis de energia de superfície e de carácter ácido-base, avaliados
pela medição dos ângulos de contacto e por IGC, significativamente diferentes. Estas
diferenças permitiram detectar e interpretar os efeitos quer da natureza quer da
quantidade de copolímero incorporado nas formulações, conduzindo ainda a uma melhor
compreensão das interacções de natureza físico-química que ocorrem à superfície do papel
quando este é sujeito a tratamentos de colagem superficial para optimização do processo
de impressão inkjet.
Por último, é de sublinhar que os resultados obtidos neste trabalho se revestem do maior
interesse para a indústria papeleira nacional, na medida em envolvem o seu mais
importante produto – os papéis não revestidos para impressão e escrita –, para o qual não
há estudos sistemáticos publicados com as formulações testadas. Além disso, a selecção das
formulações e dos copolímeros teve em conta a viabilidade da sua aplicação industrial.
xi
ABSTRACT
The consumer’s demand for quality in printing and writing paper grades (P&W) is increasing,
especially in what concerns printability.
Paper-ink interactions are strongly dependent on the structural and chemical properties of
the paper surface. These properties are the result not only of specific surface treatments but
also of the properties of the fibrous matrix, namely the quality of the pulp fibers. Therefore
final printing quality performance of the paper is influenced, in general, by all the
operations in the papermaking process. For this reason the chemical modification of the
paper surface in order to improve printing quality is nowadays a common practice in
papermaking, and surface sizing is a standard operation in many paper mills.
Typically – and especially for P&W papers - starch is used for surface sizing, with the main
goal of improving paper surface resistance and printability. However, there is an increasing
tendency to use blends of cationic starch and synthetic copolymers to enhance surface sizing
effects by controlling the paper surface energy, the corresponding hydrophilic character and
the affinity towards different types of ink. The main objective of this approach is to improve
print quality by optimizing the balance between the absorption and spreading phenomena.
This work targets the analysis of the impact of the application of different surface sizing
formulations, composed of blends of cationic starch and minor quantities of distinct
copolymers, in the chemical and physical surface characteristics of the modified paper
samples and in the final printing quality. Ten distinct copolymers were blended with cationic
starch in three different percentages of copolymer (5%, 10% and 20% w/w), resulting in a
total of 30 different formulations. These formulations were characterized and applied to the
surface of an E. globulus bleached kraft pulp based uncoated paper, and the corresponding
paper surfaces were fully characterized with respect to some structural properties, namely
roughness and porosity, as well as some chemical properties, namely surface energy and
acid-base character. A sample surface sized only with cationic starch was taken as
reference. Several characterization techniques were used, namely laser profilometry,
mercury porosimetry, contact angle measurements and inverse gas chromatography (IGC).
Selected samples were additionally analyzed by Atomic Force Microscopy, Electron
Spectroscopy for Chemical Analysis and Time-of-Flight Secondary Ion Mass Spectroscopy, in
order to clarify specific aspects. Finally, the influence of the different sizing agents on the
printing quality of the samples was investigated by quantifying several parameters in a
xii
specific inkjet printed mask and also by using the results of an evaluating panel composed of
several end users of this type of papers.
The results from the printing tests were correlated to those obtained from the
characterization of the paper surfaces by using Partial Least Squares. All the data were
submitted to an analysis of variance (ANOVA) and Principal Component Analysis (PCA) in
order to evaluate inter and intra-samples variability. This variability was thoroughly
analyzed and interpreted in terms of the corresponding surface treatments.
The results revealed that the surface sizing treatments used in this study have a minor impact
on the surface roughness and porosity, but a substantial influence on surface energetics. In
fact, relevant differences were detected in the surface energy and acid-base character of
the sized samples, as measured by contact angle and IGC. These differences enabled the
interpretation of the influence of the nature and quantity of the copolymers used in the sizing
formulations and simultaneously a better understanding of the physical and chemical
interactions that occur at paper surface when it is subjected to a sizing treatment in order to
optimize the inkjet printing process.
Finally, it should be pointed out that the results are of the utmost importance to the national
paper industry as they relate to its most relevant product – the eucalyptus based printing
and writing uncoated papers – for which there are no published results involving the tested
formulations. Furthermore, both the copolymers and the formulations used were selected
having in mind the feasibility of their application in the paper industry.

Physical & Chemical Interactions on Paper Surface – Impact on the Printability of Papers Produced with E. globulus Kraft Pulps ________________________________________________________________________________________________________________________
Isabel M. T. Moutinho xiii
INDEX
ACKNOWLEDGMENTS ............................................................................................................VII
RESUMO...............................................................................................................................IX
ABSTRACT ............................................................................................................................XI
INDEX ................................................................................................................................XIII
NOMENCLATURE AND UNITS .................................................................................................XIX
CHAPTER 1 ........................................................................................................................ 1
1 INTRODUCTION ................................................................................................................ 3
1.1 HISTORY..................................................................................................................................... 3
1.2 PAPER PRODUCTION .................................................................................................................. 6
1.3 PAPER SURFACE TREATMENTS ..................................................................................................... 7
1.3.1 Surface Sizing............................................................................................................................... 8
1.4 CHARACTERIZATION OF PAPER SURFACE ..................................................................................13
1.5 PRINTING .................................................................................................................................13
1.5.1 Printing Quality ..........................................................................................................................17
1.6 ABOUT THE WORK ..................................................................................................................17
CHAPTER 2 ...................................................................................................................... 21
MATERIALS AND METHODS............................................................................................ 21
2 MATERIALS AND METHODS.............................................................................................. 23
2.1 SURFACE SIZING ......................................................................................................................24
2.1.1 Equipment and Methodology ..................................................................................................24
2.1.2 Sizing Formulations ....................................................................................................................26
2.2 CHARACTERIZATION OF THE SURFACE SIZING AGENTS.............................................................27
Physical & Chemical Interactions on Paper Surface – Impact on the Printability of Papers Produced with E. globulus Kraft Pulps ________________________________________________________________________________________________________________________
Isabel M. T. Moutinho xiv
2.3 PHYSICOCHEMICAL CHARACTERIZATION OF THE PAPER SAMPLES .............................................27
2.4 PRINTING QUALITY EVALUATION..............................................................................................30
CHAPTER 3 ...................................................................................................................... 31
3 CHARACTERIZATION OF THE SIZING CHEMICALS ................................................................. 33
3.1 SIZING AGENTS COMPOSITION ...............................................................................................34
3.2 SIZING AGENTS PROPERTIES .....................................................................................................38
CHAPTER 4 ...................................................................................................................... 41
4 PROFILOMETRY .............................................................................................................. 43
4.1 THEORY....................................................................................................................................43
4.1.1 Roughness Parameters Definition............................................................................................44
4.1.1.1 Amplitude Parameters .........................................................................................................45
4.1.1.2 Spatial Parameters...............................................................................................................48
4.1.1.3 Hybrid Parameters ...............................................................................................................49
4.1.2 Roughness Measurement Techniques and Equipments.........................................................51
4.1.2.1 Equipment - Altisurf® 500 ..................................................................................................53
4.2 RESULTS....................................................................................................................................58
CHAPTER 5 ...................................................................................................................... 65
5 MERCURY POROSIMETRY................................................................................................. 67
5.1 THEORY....................................................................................................................................67
5.1.1 Measurement Techniques..........................................................................................................67
5.1.1.1 Mercury Porosimetry ............................................................................................................68
5.1.1.2 Equipment - AutoPore IV 9500 ..........................................................................................69
5.2 RESULTS....................................................................................................................................71

Physical & Chemical Interactions on Paper Surface – Impact on the Printability of Papers Produced with E. globulus Kraft Pulps ________________________________________________________________________________________________________________________
Isabel M. T. Moutinho xv
CHAPTER 6 ...................................................................................................................... 77
6 CONTACT ANGLE MEASUREMENTS.................................................................................... 79
6.1 THEORY....................................................................................................................................79
6.1.1 Fundamental Interactions..........................................................................................................79
6.1.2 Surface Energy Calculation Theories .....................................................................................81
6.1.2.1 Zisman .....................................................................................................................................81
6.1.2.2 Owens, Wendt, Rabel and Kaelble ..................................................................................82
6.1.2.3 Fowkes ....................................................................................................................................83
6.1.2.4 van Oss & Good ...................................................................................................................84
6.1.3 Contact Angle Measurements ..................................................................................................85
6.1.3.1 Equipment – OCA 20...........................................................................................................86
6.1.4 Topography Influence in Contact Angle Values...................................................................89
6.1.5 Dynamic Parameters .................................................................................................................91
6.2 RESULTS....................................................................................................................................92
6.2.1 Effect of Topography................................................................................................................93
6.2.2 Static Contact angles ................................................................................................................94
6.2.3 Surface Energies ........................................................................................................................97
6.2.4 Dynamic Contact Angles........................................................................................................ 102
CHAPTER 7 .................................................................................................................... 115
7 INVERSE GAS CHROMATOGRAPHY (IGC) ........................................................................ 117
7.1 THEORY................................................................................................................................. 119
7.1.1 Dispersive Component of the Surface Free Energy.......................................................... 120
7.1.2 Acid-Base Character .............................................................................................................. 121
7.1.3 Equipment - DANI GC 1000................................................................................................. 123
7.2 RESULTS................................................................................................................................. 126
7.2.1 Retention Times........................................................................................................................ 127
7.2.2 Dispersive Component of the Surface Energy................................................................... 130
Physical & Chemical Interactions on Paper Surface – Impact on the Printability of Papers Produced with E. globulus Kraft Pulps ________________________________________________________________________________________________________________________
Isabel M. T. Moutinho xvi
7.2.3 IGC versus Contact Angle in the Determination of σSD .................................................... 134
7.2.4 Acid-Base Character .............................................................................................................. 136
CHAPTER 8 .................................................................................................................... 141
8 PRINTING QUALITY....................................................................................................... 143
8.1 THEORY................................................................................................................................. 143
8.1.1 Inkjet Printing ........................................................................................................................... 143
8.1.2 Printing Quality Evaluation ................................................................................................... 147
8.1.2.1 Inkjet Printing Quality Parameters.................................................................................. 148
8.1.2.2 Methodology ...................................................................................................................... 151
8.2 RESULTS................................................................................................................................. 154
8.3 CORRELATIONS AND MODELS ............................................................................................... 161
CHAPTER 9 .................................................................................................................... 167
9 COMPLEMENTARY STUDIES ............................................................................................ 169
EFFECT OF SURFACE SIZING ON THE SURFACE CHEMISTRY OF PAPER CONTAINING EUCALYPTUS
PULP………………………………………………………………………………………..
CLXXI
ON THE EVALUATION OF THE TOPOGRAPHY OF SURFACE SIZED EUCALYPTUS BASED PAPERS .........CXCI
CHAPTER 10 .................................................................................................................. 205
10 CONCLUSIONS ............................................................................................................. 207
CHAPTER 11 .................................................................................................................. 213
11 REFERENCES ................................................................................................................ 215
FIGURES INDEX........................................................................................................................I
Physical & Chemical Interactions on Paper Surface – Impact on the Printability of Papers Produced with E. globulus Kraft Pulps ________________________________________________________________________________________________________________________
Isabel M. T. Moutinho xvii
TABLES INDEX .......................................................................................................................IX
APPENDIX ...........................................................................................................................I
APPENDIX A......................................................................................................................... III
DATASHEETS OF THE SYNTHETIC SURFACE SIZING AGENTS.................................................................... III
APPENDIX B ................................................................................................................... XXXV
SURFACE SIZING FORMULATIONS......................................................................................................XXXV
APPENDIX C ..................................................................................................................XXXVII
PROFILOMETRY RESULTS .................................................................................................................XXXVII
APPENDIX D....................................................................................................................... XLI
11.1 MERCURY POROSIMETRY RESULTS .............................................................................................XLI
APPENDIX E..................................................................................................................... XLVII
CONTACT ANGLE MEASUREMENTS....................................................................................................XLVII
APPENDIX F....................................................................................................................... LVII
INVERSE GAS CHROMATOGRAPHY......................................................................................................LVII
APPENDIX G.................................................................................................................... LXXV
PRINTING QUALITY PARAMETERS ...................................................................................................... LXXV


Physical & Chemical Interactions on Paper Surface – Impact on the Printability of Papers Produced with E. globulus Kraft Pulps ________________________________________________________________________________________________________________________
Isabel M. T. Moutinho xix
NOMENCLATURE AND UNITS
a – Cross-section area of the probe
AFM – Atomic Force Microscopy
AN – Gutmann’s acceptor number
AN* - Gutmann’s modified acceptor number
ANOVA – Analysis of Variance
BD – Drop base diameter
CA – Contact angle (º)
∆G – Free energy of adsorption
∆H – Enthalpy of Adsorption
DN – Gutmann’s donor number
∆S – Entropy of adsorption
ESCA - Electronic Spectroscopy for Chemical Analysis
IGC – Inverse Gas Chromatography
IR – Infra Red
J – Correction factor for gas compressibility
Ka – Acidic constant
Kb – Basic constant
N – Avogadro’s number
OBA – Optical Brightening Agent
OD – Optical density
OWRK – Owens Wendt Raelbe and Kaelbe
P – Pressure
PA – Printed Area
P&W – Printing and Writing
PCA – Principal Components Analysis
Physical & Chemical Interactions on Paper Surface – Impact on the Printability of Papers Produced with E. globulus Kraft Pulps ________________________________________________________________________________________________________________________
Isabel M. T. Moutinho xx
Pick-up – Amount of Surface Sizing applied (g/m2)
PLS – Partial Least Squares
θ − Contact angle (º)
R – Ideal gas constant
R* – Correction factor for the topography influence in the contact angle values
σ – Surface energy/tension (mN/m)
Sa – Roughness average (µm)
Sdq – Root-mean-square slope of the surface (µm/µm)
Sdr – Developed interfacial area ratio (%)
Sds – Density of summits of the surface (pks/mm2)
Sku – Kurtosis of the height Distribution
Sp – Maximum height of summits (µm)
Sq – Root-mean-square deviation of the surface (µm)
Ssc – Arithmetic mean summit curvature of the surface (1/µm)
Ssk – Skewness of the height distribution
St – Total height of the surface (µm)
Str – Surface texture isotropy
Subscript L − Liquid
Subscript S − Solid
Subscript SL − Solid-liquid interface
Superscript AB – Acid-base
Superscript D - Dispersive
Superscript P – Polar
Superscript S – Specific
Sv – Maximum depth of the surface (µm)

Physical & Chemical Interactions on Paper Surface – Impact on the Printability of Papers Produced with E. globulus Kraft Pulps ________________________________________________________________________________________________________________________
Isabel M. T. Moutinho xxi
Sz – Ten point height of the surface (µm)
T – Temperature
TA – Target Area
ToF-SIMS – Time of Flight Secondary Ion Mass Spectroscopy
Tr – Retention time (min)
Vn – Retention volume (ml)
Vol – Drop volume
Wa – Work of adhesion (mN/m)
WV – Wetting velocity


CHAPTER 1
INTRODUCTION

Physical & Chemical Interactions on Paper Surface – Impact on the Printability of Papers Produced with E. globulus Kraft Pulps ________________________________________________________________________________________________________________________
Isabel M. T. Moutinho 3
1 INTRODUCTION
Paper has played a vital role in the cultural development of mankind, being used mainly for
writing, printing, and packaging. It plays a key role in communication; printed communication
is almost synonymous with paper. Papermaking is a vast, multidisciplinary technology that has
expanded tremendously in recent years. Significant advances have been made in all areas
of papermaking, including raw materials, production technology, process control and end
products. The complexity of the processes, the scale of operation, and production speeds
leave little room for error or malfunction. Modern papermaking would not be possible
without a proper command of a great variety of technologies. Along the years not only has
the technology progressed and new technology emerged, but also the understanding of the
fundamentals of unit processes, raw materials and product properties have also deepened
considerably. Paper products are complex in structure and contain many different
components. The requirements placed on the way these products perform are wide, varied
and often conflicting. Product development and improvements is thus a constant need and
requires a profound understanding of the chemistry and physics of both raw materials and
product structures (Oittinen and Saarelma 1998; Lehtinen 2000; Levlin and Söderhjelm
2000)
1.1 HISTORY
Following the evolution of the human intelligence, the graphical representations became
increasingly complex, and together with an increase in the ability to create tools, took to the
development of more adequate supports. The history tells about the use of boards, cooked
clay, tissues of various fibers, papyrus, parchment and finally paper (Oittinen and Saarelma
1998; Lehtinen 2000; Paulapuro 2000).
Clay seems to have been the first material used explicitly for writing, by Sumerians, 6
millennia B.C.. The manuscripts on dry palm leaves appeared after the invention of the
alphabet, and they were used mainly in India and Southeast Asia until the 19th century. In
Greece appeared the waxed boards, which the Romans have also adopted. About 3
thousand years B.C. it was found out the possibility of the adaptation for writing of thick stem
plants, which grew in the margins of the Nile River and were called “Papyrus”. Many years
after, the Romans improved the papyrus quality, by pasting the fibers to each other with
Physical & Chemical Interactions on Paper Surface – Impact on the Printability of Papers Produced with E. globulus Kraft Pulps ________________________________________________________________________________________________________________________
Isabel M. T. Moutinho 4
starch glues. Papyrus was in fact the main mean for writing communication until the 8th
century. (Oittinen and Saarelma 1998; Lehtinen 2000; Paulapuro 2000).
The primacy of paper production is assigned to Ts'ai Lun of china in the year 105 After
Christ, who made paper of fishing nets and rags pulp, and later using vegetable fibers. In
Europe, paper was first manufactured in Spain and Sicily, and gradually its use spread
northward (Lehtinen 2000; Paulapuro 2000).
When the paper demand rapidly increased in the eighteenth century, papermakers in
Continental Europe came up with the idea of developing a machine for forming the paper.
Nicolas-Louis Robert (1761-1828) has gone down in history as the inventor of a continuously
moving belt of wire cloth on which the fiber suspension was spread and the water was
allowed to drain away, leaving an endless sheet of paper on the wire. The first trials were
made as early as 1793, but only in 1798 a construction on which a continuous web of paper
could be made. The wooden machine was 260 cm long, and the width of the paper was 64
centimeters (Lehtinen 2000; Paulapuro 2000).
In 1807, a patent for a machine with the essential features of the "fourdrinier" machine we
know today was procured in the names of the Fourdrinier brothers (Henry and Sealy) and
John Gamble (Lehtinen 2000; Paulapuro 2000).
In the 1820s in England, machine-produced paper surpassed in quantity the hand-paper
production. Around 1840, there were about 250 paper machines in operation in England,
125 in France, and 50 in Germany, the majority of which were of English origin (Lehtinen
2000; Paulapuro 2000).
Along the years many individuals and companies obtained patents on the basic components
in the process. Improvements at each stage of the papermaking process have contributed to
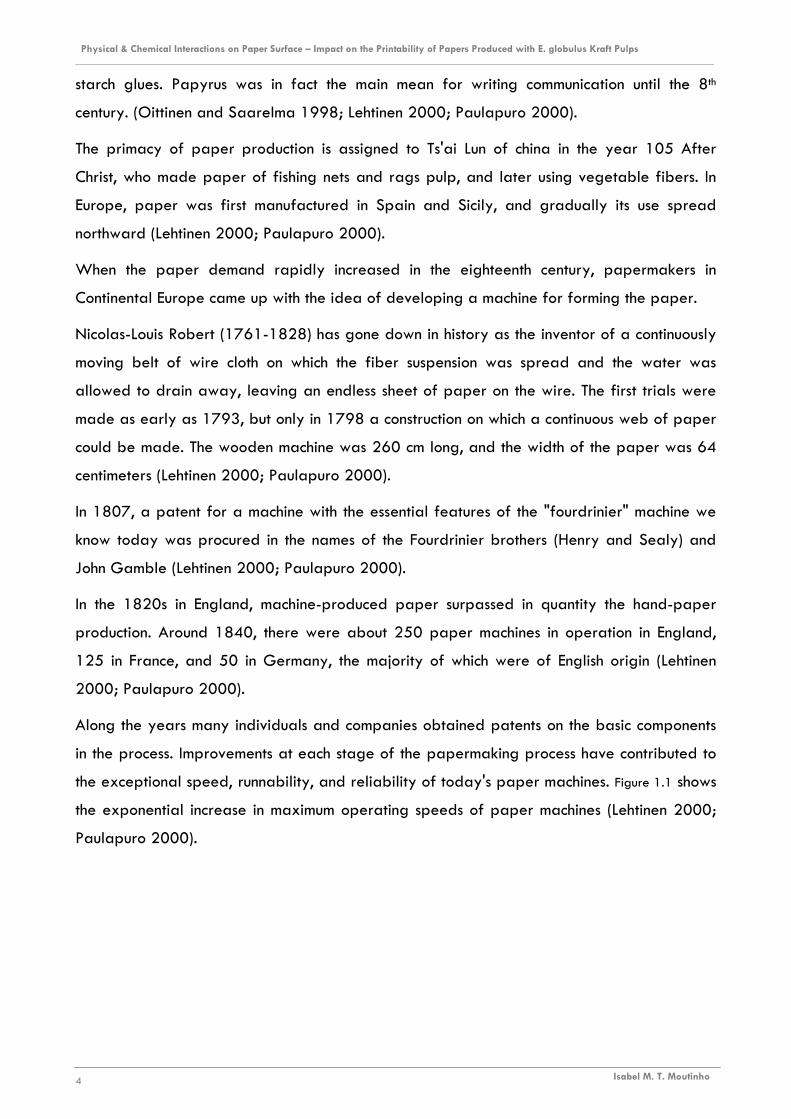
the exceptional speed, runnability, and reliability of today's paper machines. Figure 1.1 shows
the exponential increase in maximum operating speeds of paper machines (Lehtinen 2000;
Paulapuro 2000).
Physical & Chemical Interactions on Paper Surface – Impact on the Printability of Papers Produced with E. globulus Kraft Pulps ________________________________________________________________________________________________________________________
Isabel M. T. Moutinho 5
Figure 1.1 - Trends in maximum operating speeds of paper machines (Paulapuro 2000).
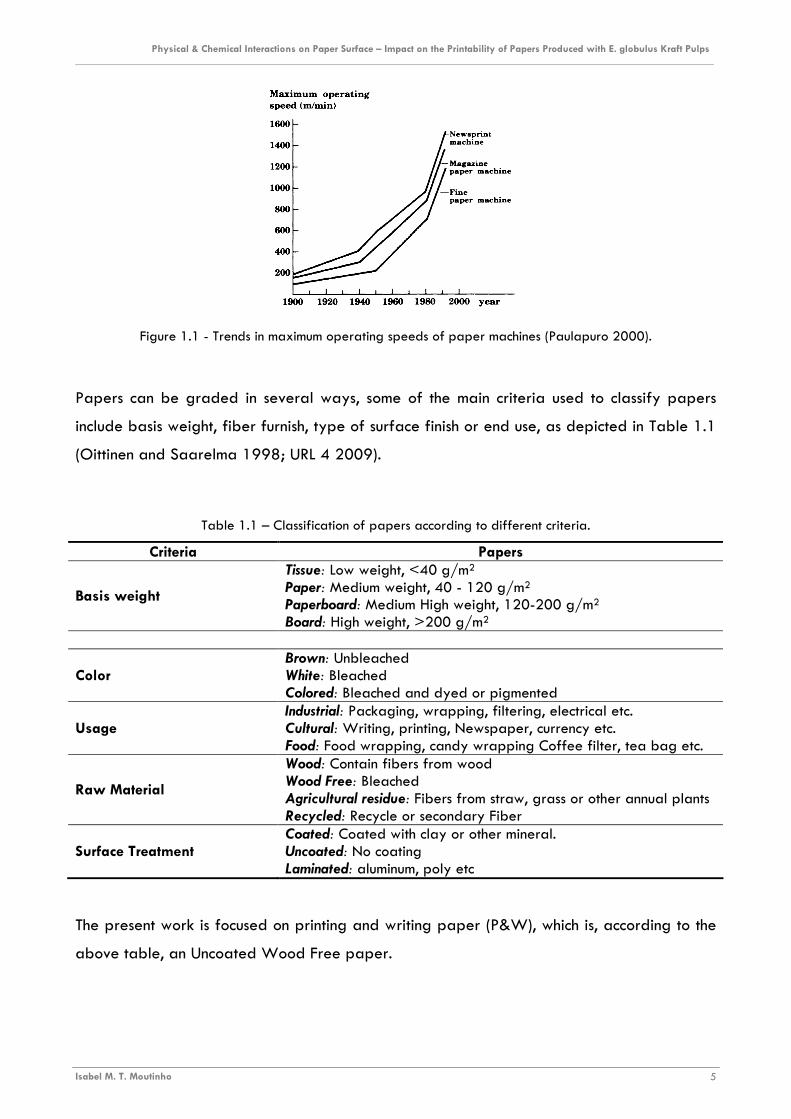
Papers can be graded in several ways, some of the main criteria used to classify papers
include basis weight, fiber furnish, type of surface finish or end use, as depicted in Table 1.1
(Oittinen and Saarelma 1998; URL 4 2009).
Table 1.1 – Classification of papers according to different criteria.
Criteria Papers
Basis weight
Tissue: Low weight, <40 g/m2 Paper: Medium weight, 40 - 120 g/m2 Paperboard: Medium High weight, 120-200 g/m2 Board: High weight, >200 g/m2
Color Brown: Unbleached White: Bleached Colored: Bleached and dyed or pigmented
Usage Industrial: Packaging, wrapping, filtering, electrical etc. Cultural: Writing, printing, Newspaper, currency etc. Food: Food wrapping, candy wrapping Coffee filter, tea bag etc.
Raw Material
Wood: Contain fibers from wood Wood Free: Bleached Agricultural residue: Fibers from straw, grass or other annual plants Recycled: Recycle or secondary Fiber
Surface Treatment Coated: Coated with clay or other mineral. Uncoated: No coating Laminated: aluminum, poly etc
The present work is focused on printing and writing paper (P&W), which is, according to the
above table, an Uncoated Wood Free paper.
Physical & Chemical Interactions on Paper Surface – Impact on the Printability of Papers Produced with E. globulus Kraft Pulps ________________________________________________________________________________________________________________________
Isabel M. T. Moutinho 6
1.2 PAPER PRODUCTION
Paper is obtained by a mixture of fibers, typically from vegetal origin composed by
cellulose, which are kept together by hydrogen bridges. The most common source of natural
fibers is the pulp obtained from the wood of threes. Vegetal fibers such as cotton, hemp, flax
and rice can also be used. Usually, and regarding printing and writing (P&W) papers in
particular, composition also includes filler and additives (Oittinen and Saarelma 1998;
Lehtinen 2000; Paulapuro 2000).
The papermaking process contains a great number of different unit processes, which work
through different mechanisms to produce the desired effects on the fiber suspension, and
subsequently, on the fibrous web. It starts with slushing of fibers and other raw materials in
water, continues through paper machine and finishing operations and ends with packaging of
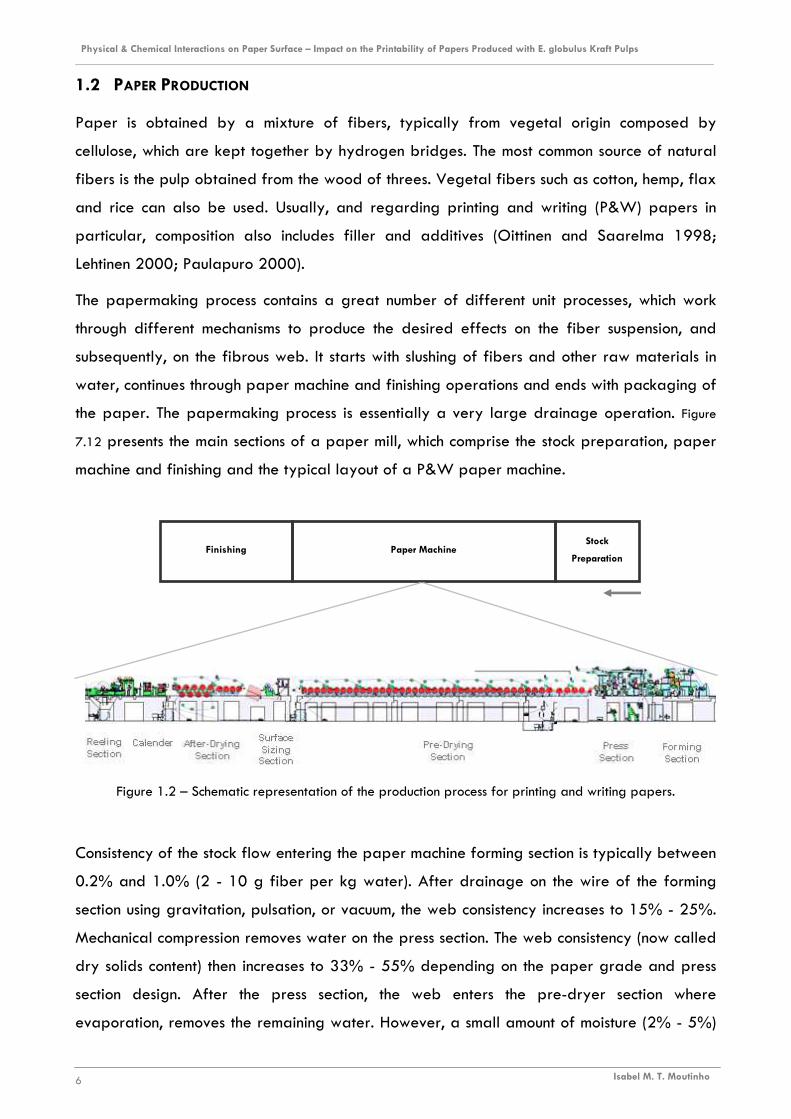
the paper. The papermaking process is essentially a very large drainage operation. Figure
7.12 presents the main sections of a paper mill, which comprise the stock preparation, paper
machine and finishing and the typical layout of a P&W paper machine.
Figure 1.2 – Schematic representation of the production process for printing and writing papers.
Consistency of the stock flow entering the paper machine forming section is typically between
0.2% and 1.0% (2 - 10 g fiber per kg water). After drainage on the wire of the forming
section using gravitation, pulsation, or vacuum, the web consistency increases to 15% - 25%.
Mechanical compression removes water on the press section. The web consistency (now called
dry solids content) then increases to 33% - 55% depending on the paper grade and press
section design. After the press section, the web enters the pre-dryer section where
evaporation, removes the remaining water. However, a small amount of moisture (2% - 5%)
Finishing Paper Machine Stock
Preparation
Physical & Chemical Interactions on Paper Surface – Impact on the Printability of Papers Produced with E. globulus Kraft Pulps ________________________________________________________________________________________________________________________
Isabel M. T. Moutinho 7
remains in the paper before the surface sizing operation, after which the paper web enters
in the after-drying section, to achieve the final moisture content typically between 5% and
7% (Oittinen and Saarelma 1998; Lehtinen 2000; Paulapuro 2000).
Although the principles of paper manufacturing are similar to the ones developed many
centuries ago, significant advances have been made in all areas of papermaking, including
raw materials, production technology, process control and end products. As mentioned in the
very beginning of this work, at the present time, the complexity of the processes, the scale of
operation, and the production speeds leave little room for error or malfunction. Paper must
maintain its competitiveness through continuous product development in order to meet the
ever-increasing demands on its performance. This framework is the main driving force for
many studies on paper, with a great focus on paper surface in the most recent years, mainly
due to the increasing importance given to paper ink interactions, which are mainly ruled by
the paper surface properties (Oittinen and Saarelma 1998; Lehtinen 2000; Paulapuro
2000).
1.3 PAPER SURFACE TREATMENTS
Currently, paper surface has been the subject of many attentions, since it is one of the crucial
factors affecting the final performance of the paper. Paper surface treatments are thus
increasingly used in every paper mill to control and improve the surface properties of its
product. These surface treatments may be physical (calendering) or chemical (surface sizing
or coating) (Keskitalo 2000; Levlin and Söderhjelm 2000).
In the production of P&W papers, the physical treatment of the surface by calendering and
the chemical treatment by surface sizing are generally always used. Coating is a chemical
surface treatment rarely applied for this type of papers; it is currently used for many other
paper grades such as magazine paper of photographic paper (Lehtinen 2000).
Calendering consists in submitting the paper to pressure, by passing it between rolling
cylinders. The main target of calendering is to modify the surface structure and/or the sheet
thickness. In the case of printing, the main calendering targets are to reduce surface
roughness and compress the pore structure to obtain a good printing result. Two different
options can be used for calendering: hard rolls, made from cast iron or soft rolls, with
polymer coverage. The latter distribute the calendering pressure more evenly creating a
Physical & Chemical Interactions on Paper Surface – Impact on the Printability of Papers Produced with E. globulus Kraft Pulps ________________________________________________________________________________________________________________________
Isabel M. T. Moutinho 8
more uniform surface finish and are currently the option preferably used in the industry
(Oittinen and Saarelma 1998).
Regarding the chemical treatment, it should be mentioned that the main difference between
coating and surface sizing is that the former involves pigments in the solution that is applied
to the paper surface, in concentrations that are in general larger than 3.5 g/m2. Pigments
such as clay, talc, and calcium carbonate are often used to produce the coating formulations
in order to further enhance the printability of fibrous sheets (Oittinen and Saarelma 1998)
(Donigian et al. 1997; Nissi et al. 1999; Lohmander and Rigdahl 2000; Ahlroos and grön
2001; Fardim 2002; Conceição et el. 2003; Forsström et al. 2003; Ridgway and Gane
2003; Garcia 2004; Putkisto et al. 2004; Engström 2005).
Surface sizing is the subject this work and will be detailed in the following section.
1.3.1 SURFACE SIZING
Surface sizing is a common operation in any paper mill of P&W papers. It consists in the
application of an aqueous suspension composed of several functional chemicals at the
surface of the paper, mainly to improve surface resistance, increase paper stiffness and
improve paper printability.
There are two types of formulations that can be used in surface sizing: starch alone or starch
combined with a synthetic surface sizing agent. The most common option in the industry is to
perform surface sizing by using starch alone (usually modified starch - cationic), however
there is an increasing tendency, already applied in several paper mills, to combine the
cationic starch with some synthetic surface sizing agents (Browning 1977; Bauer et al. 1999;
Sequera 1999; Keskitalo 2000; Lehtinen 2000; Lee et al. 2002; Carceller and Juppo2004;
Andersson et al. 2006; Prinz and Schultz 2007).
When both starch and synthetic surface sizing agents are used, the most important function of
the starch is to act as a binder, in order to produce an even blend. As for the synthetic
surface sizing agents, their use is often necessary because the primary raw material of
paper and paperboard is the hydrophilic component cellulose. As these synthetic surface
sizing agents are usually polymers with some degree of hydrophobicity, the paper surface
becomes water resistant, which is crucial for many printing processes (Oittinen and Saarelma
1998; Keskitalo 2000; Lehtinen 2000; Glittenberg and Leonhardt 2007).

Physical & Chemical Interactions on Paper Surface – Impact on the Printability of Papers Produced with E. globulus Kraft Pulps ________________________________________________________________________________________________________________________
Isabel M. T. Moutinho 9
It should be pointed out that besides starch (usually cationic) and, in some cases, the synthetic
surface sizing agents, the sizing formulations include additional compounds, such as salt,
optical brightener agents (OBA) and defoaming agents.
Starch is a natural polymer consisting of glucose monomers. It is the second most abundant
biologically produced organic material after cellulose. Chemically, the starch polymer is
much like cellulose. The difference lies in the structure which gives these two materials
different properties, as illustrated in Figure 1.3 (Bauer et al. 1999; Lehtinen 2000).
Figure 1.3 - Structure of starch and cellulose.
As indicated in Figure 1.3, the difference relies in the way glucose monomers are bonded. The
bonds between glucose units are called glycosidic bonds, and their orientation is different in
cellulose and starch. In starch, all glycosidic bonds are oriented in the same direction
whereas, in cellulose, the orientation of two consecutive bonds is opposite. This is the reason
for cellulose being a straight polymer while starch is coiled. Cellulose forms fibers, which are
partly crystalline, while starch is totally amorphous and forms granules with different shapes
and sizes depending on which plant they come from (corn, wheat, potato, and tapioca are
common sources) (Bauer et al. 1999; Lehtinen 2000).
In the paper industry, the starch is previously cooked by steam. During the cooking process,
the starch granules start to swell, at 40°C - 50°C, and after that, the starch polymers start to

Physical & Chemical Interactions on Paper Surface – Impact on the Printability of Papers Produced with E. globulus Kraft Pulps ________________________________________________________________________________________________________________________
Isabel M. T. Moutinho 10
dissolve. Starch has binding properties only in the dissolved form (seeFigure 1.4) (Bauer et
al. 1999; Lehtinen 2000).
Figure 1.4 - Starch during cooking.
Cooked native starch tends to be very viscous and forms gels at very low dry solids. This
behavior is called retrogradation because the starch polymers strive to rebind to each other
and to form irreversible gels. Thus, starch for surface sizing is usually modified to ensure its
good functionality, by improving and/or controlling its binding power, rheology, viscosity-
temperature stability, and tendency to degradation. In the particular case of the starch
modified for application in surface sizing, the most important modification that it is submitted
is cationization, making it positively charged, bi the addition of H+ functional groups, in order
to increase the affinity for the anionic surface of the cellulose fibers (Bauer et al. 1999;
Lehtinen 2000; Glittenberg and Leonhardt 2007).
The synthetic surface sizing agents are usually polymeric compounds, totally or partially
hydrophobic. Typically the chemical bases used to produce synthetic surface sizing agents
are styrene, maleic anhydride, acrylic acid, ester or polyurethanes (Brandão 1999; Exner
2001; Sreekumar et al. 2007; Prinz and Schultz 2007).
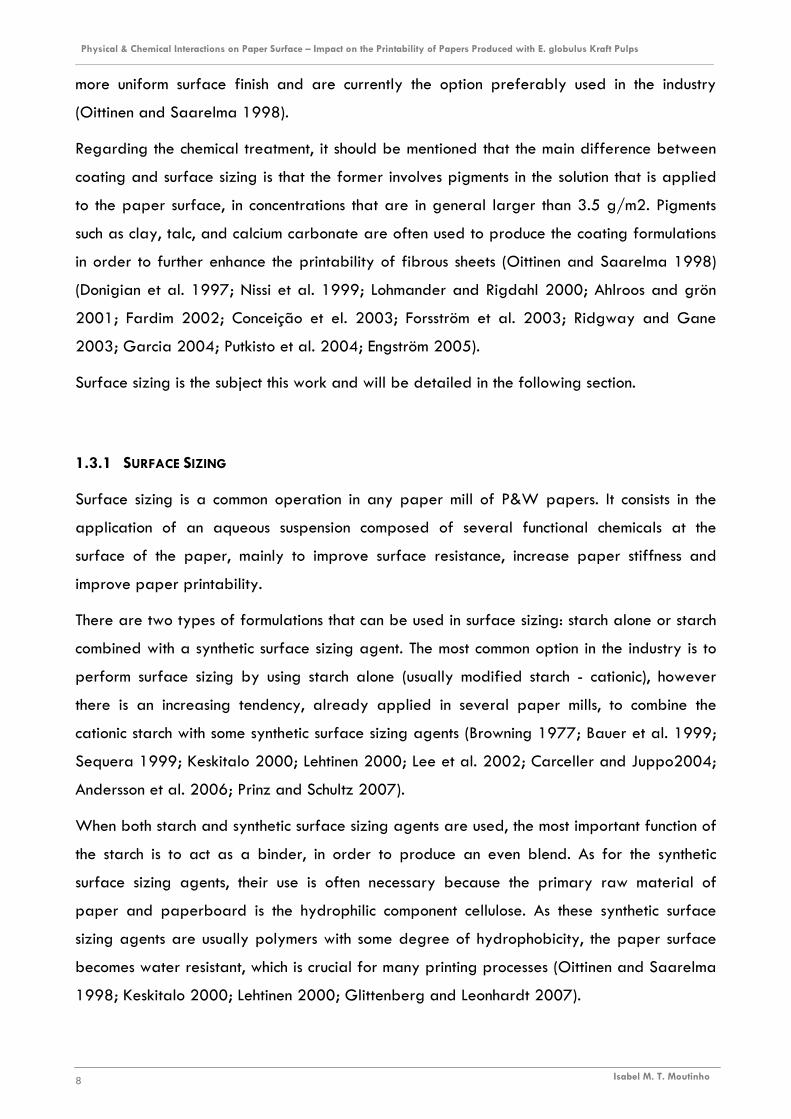
When combined with starch, a thin reticular film is formed at the paper surface, as depicted
in Figure 1.5. This film influences several paper properties such as smoothness, surface
resistance, surface free energy and hydrophobicity.
Physical & Chemical Interactions on Paper Surface – Impact on the Printability of Papers Produced with E. globulus Kraft Pulps ________________________________________________________________________________________________________________________
Isabel M. T. Moutinho 11
Starch
Particle Dispersion
Fiber Fiber
Starch
Colloid polymer protector
Polymer nucleus
Hydrophilic Hydrophobic
Figure 1.5 - Polymer-starch film formation on paper surface.
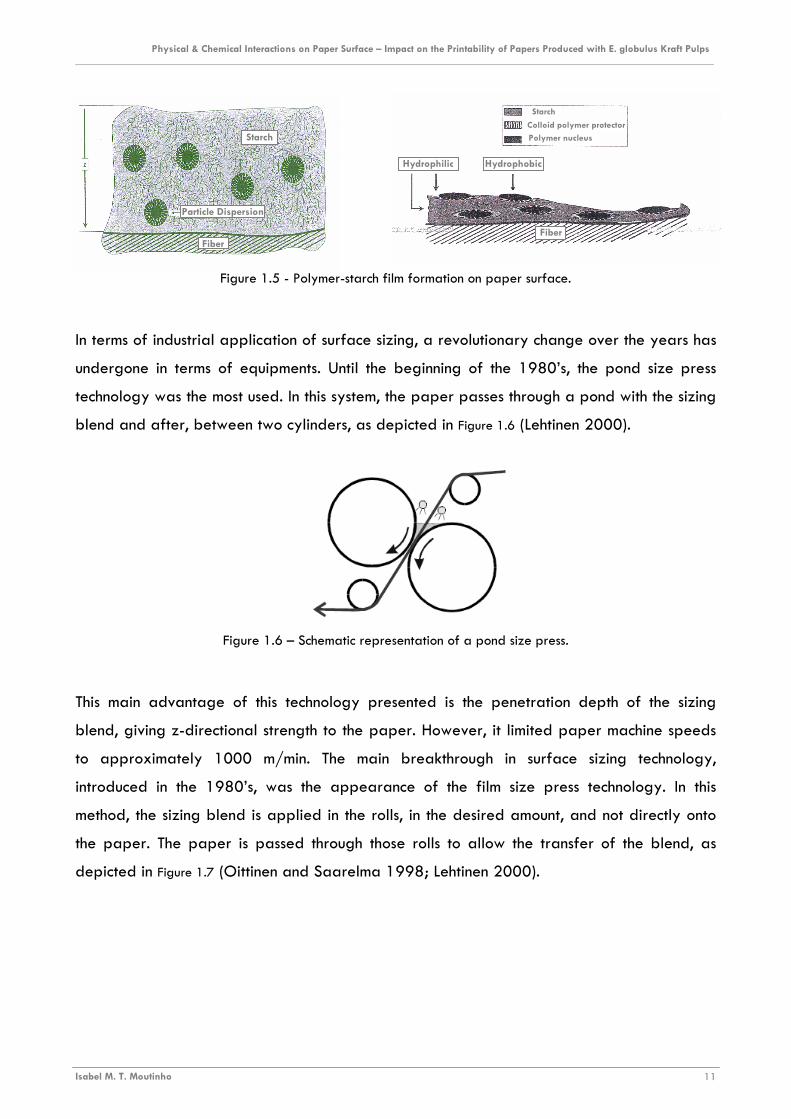
In terms of industrial application of surface sizing, a revolutionary change over the years has
undergone in terms of equipments. Until the beginning of the 1980’s, the pond size press
technology was the most used. In this system, the paper passes through a pond with the sizing
blend and after, between two cylinders, as depicted in Figure 1.6 (Lehtinen 2000).
Figure 1.6 – Schematic representation of a pond size press.
This main advantage of this technology presented is the penetration depth of the sizing
blend, giving z-directional strength to the paper. However, it limited paper machine speeds
to approximately 1000 m/min. The main breakthrough in surface sizing technology,
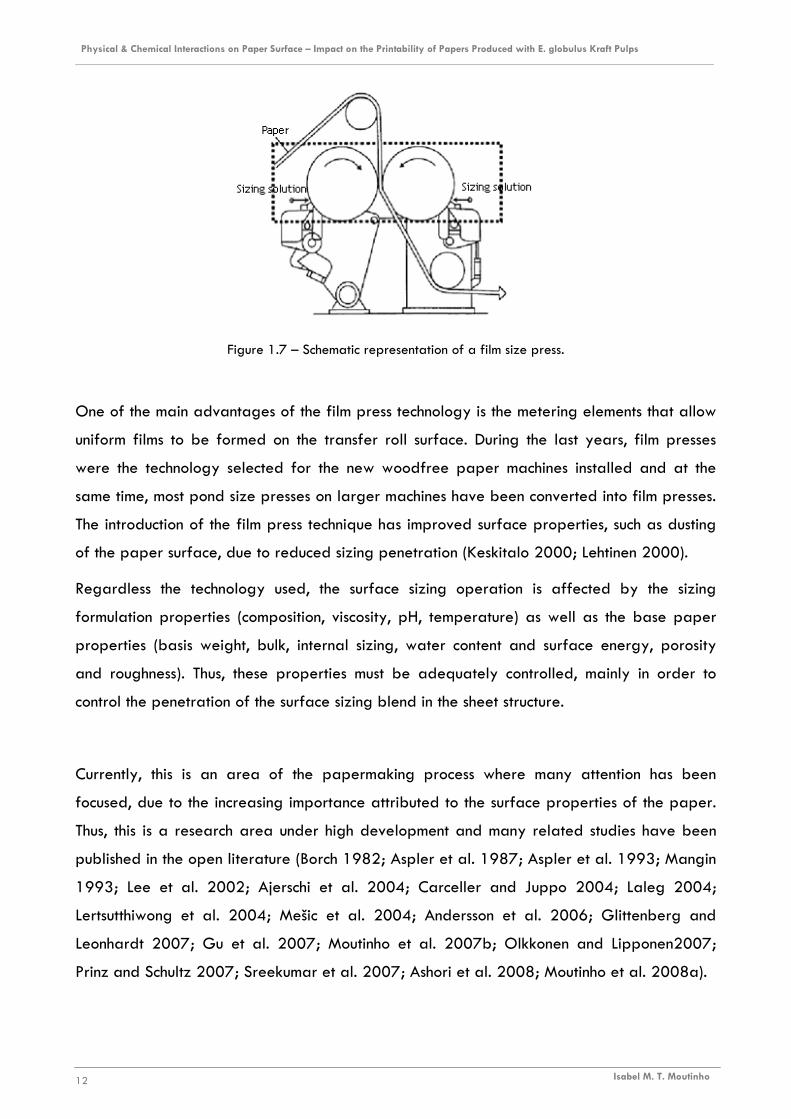
introduced in the 1980’s, was the appearance of the film size press technology. In this
method, the sizing blend is applied in the rolls, in the desired amount, and not directly onto
the paper. The paper is passed through those rolls to allow the transfer of the blend, as
depicted in Figure 1.7 (Oittinen and Saarelma 1998; Lehtinen 2000).
Physical & Chemical Interactions on Paper Surface – Impact on the Printability of Papers Produced with E. globulus Kraft Pulps ________________________________________________________________________________________________________________________
Isabel M. T. Moutinho 12
Figure 1.7 – Schematic representation of a film size press.
One of the main advantages of the film press technology is the metering elements that allow
uniform films to be formed on the transfer roll surface. During the last years, film presses
were the technology selected for the new woodfree paper machines installed and at the
same time, most pond size presses on larger machines have been converted into film presses.
The introduction of the film press technique has improved surface properties, such as dusting
of the paper surface, due to reduced sizing penetration (Keskitalo 2000; Lehtinen 2000).
Regardless the technology used, the surface sizing operation is affected by the sizing
formulation properties (composition, viscosity, pH, temperature) as well as the base paper
properties (basis weight, bulk, internal sizing, water content and surface energy, porosity
and roughness). Thus, these properties must be adequately controlled, mainly in order to
control the penetration of the surface sizing blend in the sheet structure.
Currently, this is an area of the papermaking process where many attention has been
focused, due to the increasing importance attributed to the surface properties of the paper.
Thus, this is a research area under high development and many related studies have been
published in the open literature (Borch 1982; Aspler et al. 1987; Aspler et al. 1993; Mangin
1993; Lee et al. 2002; Ajerschi et al. 2004; Carceller and Juppo 2004; Laleg 2004;
Lertsutthiwong et al. 2004; Mešic et al. 2004; Andersson et al. 2006; Glittenberg and
Leonhardt 2007; Gu et al. 2007; Moutinho et al. 2007b; Olkkonen and Lipponen2007;
Prinz and Schultz 2007; Sreekumar et al. 2007; Ashori et al. 2008; Moutinho et al. 2008a).
Physical & Chemical Interactions on Paper Surface – Impact on the Printability of Papers Produced with E. globulus Kraft Pulps ________________________________________________________________________________________________________________________
Isabel M. T. Moutinho 13
1.4 CHARACTERIZATION OF PAPER SURFACE
The evaluation of the effect of any surface modification requires a deep knowledge of the
paper surface characteristics. Surface characterization can be undertaken either from the
physical or the chemical point of view, and many techniques have been used for that
purpose.
Physical characterization of the paper surface is a more explored subject, since it is long
established that properties such as porosity or roughness decisively influence paper
performance. Thus profilometry (Gadelmawla et al. 2002; Wågberg and Johansson 2002;
Barros 2004; Ashori et al. 2008; TrueGage 2008), mercury porosimetry (Knauf and Doshi
1986; Johnson et al. 1999; Moura et al. 2005), Scanning Electron Microscopy (SEM) (Chinga
and Helle 2002b), Confocal microscopy (Conners and Banerjee 1995), and more recently,
Atomic Force Microscopy (AFM) (Chhabra et al. 2005; Das et al. 2006), are now currently
used to investigate the characterize paper.
Regarding the surface chemical properties, modern and sophisticated techniques have been
implemented (or adapted) for the chemical characterization of paper sheets, namely contact
angle measurements (Roe et al. 1967; Brigs et al. 1989; Marmur 2006), Fourier Transform
Infrared Spectroscopy (FTIR) (Liu et al1998; Ernstsson 2005; Fardim and Durán 2005),
Electronic Spectroscopy for Chemical analysis (ESCA/XPS) (Brinen 1993; Belgacem et al.
1995; Kangas and Kleen2004), Inverse Gas Chromatography (IGC) (Gutierrez et al. 1999;
Kunaver et al. 2004; Wang and Sain 2007), Time of Flight – Second Ion Mass Spectroscopy
(ToF-SIMS) (Kleen et al. 2003; Koljonen 2004; Lee et al. 2006) and Raman Spectroscopy
(Vyörykkä 2005). Most of these techniques were used in the present work, although some of
them were only applied in some specific studies an on a few samples, in order to complement
this study. In both cases the main objective is to provide information about paper surface that
enables a better knowledge of the surface performance, in particular the paper-ink
interactions, most relevant for P&W papers. The basic principle of the techniques used for
the majority of the samples will be described in later chapters together with the
corresponding results.
1.5 PRINTING
Paper is definitely the most important raw material in printing. The techniques and
procedures used to produce printed products have evolved tremendously specially over the
Physical & Chemical Interactions on Paper Surface – Impact on the Printability of Papers Produced with E. globulus Kraft Pulps ________________________________________________________________________________________________________________________
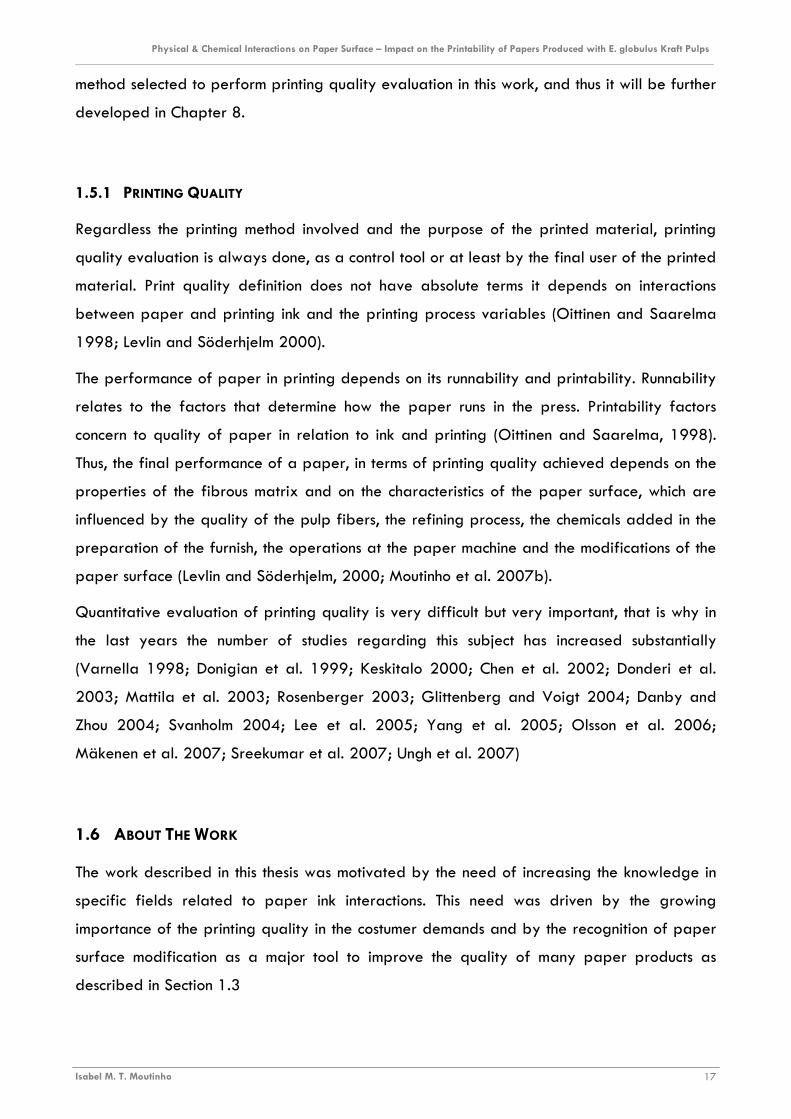
Isabel M. T. Moutinho 14
last century, as summarized in Table 1.2. The Chinese invented the oldest known printing
method, letterpress, in the year 700. Since then, many and revolutionary steps have been
given, especially in the 20th century, from flexography, gravure, and offset to the modern
digital printing and techniques (Oittinen and Saarelma 1998; Keskitalo 2000).
Table 1.2 - Development of printing and other visualization methods.
Visualization Method Year Letterpress 700 Letterpress, metal type 1450 Lithography 1800 Photography 1820 Motion picture 1895 Gravure 1900 Flexography 1900 Television 1926 Photo copying 1940 Computer display 1973 Electronic printing 1980 Networked printing 1990 Electronic publishing on display 1990 Distributed color printing 1995
The traditional methods are usually called mechanical printing, in order to expresses the fact
that the energy for image formation in the printing step is pressure. The term “mechanical”
distinguishes conventional printing methods from electronic or digital printing methods, which
are based on computer output.
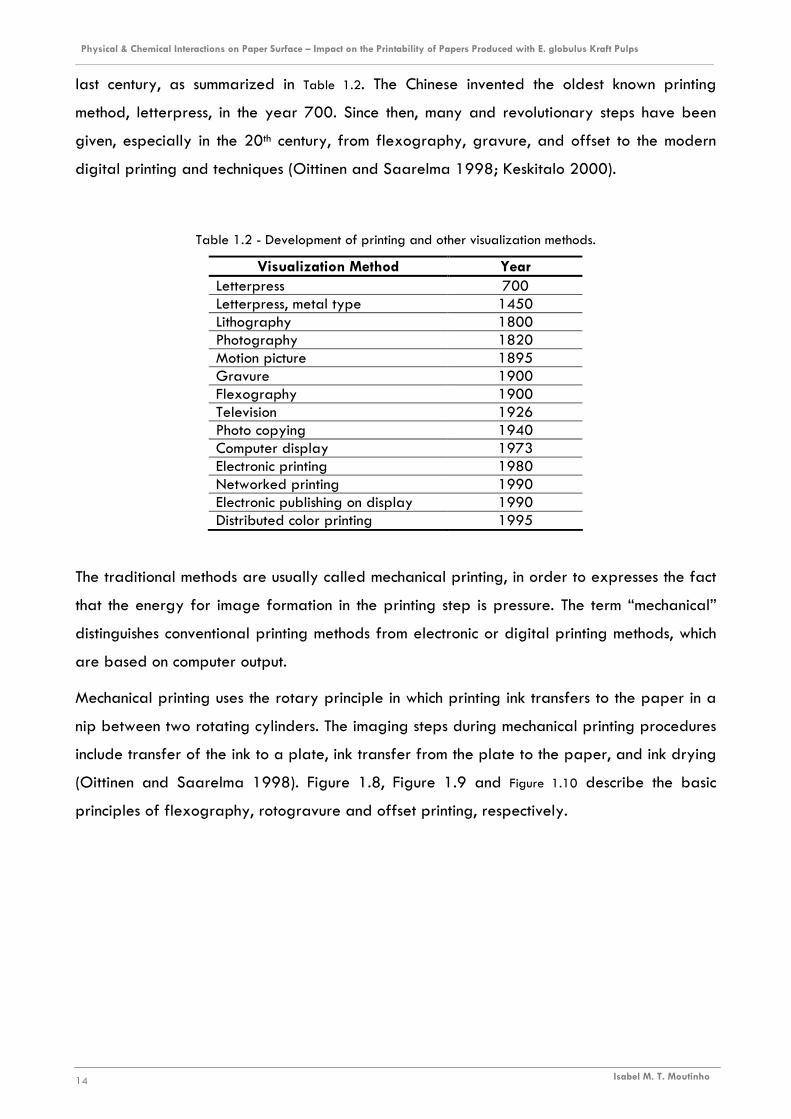
Mechanical printing uses the rotary principle in which printing ink transfers to the paper in a
nip between two rotating cylinders. The imaging steps during mechanical printing procedures
include transfer of the ink to a plate, ink transfer from the plate to the paper, and ink drying
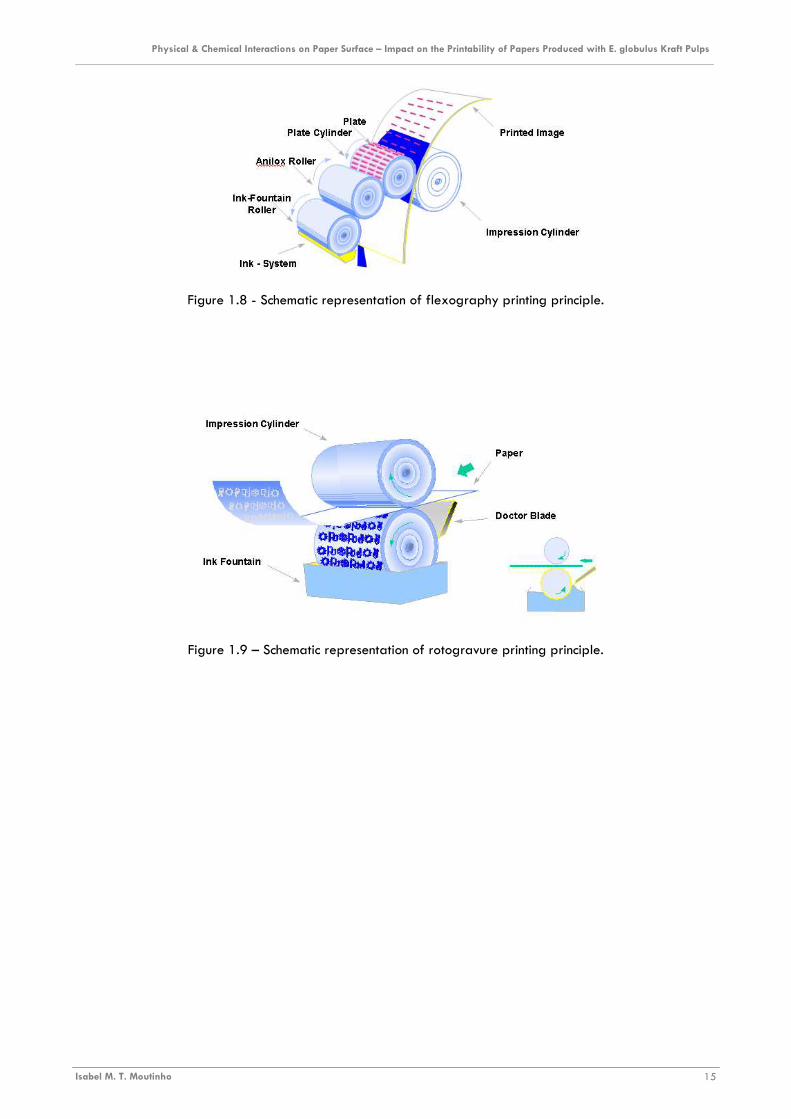
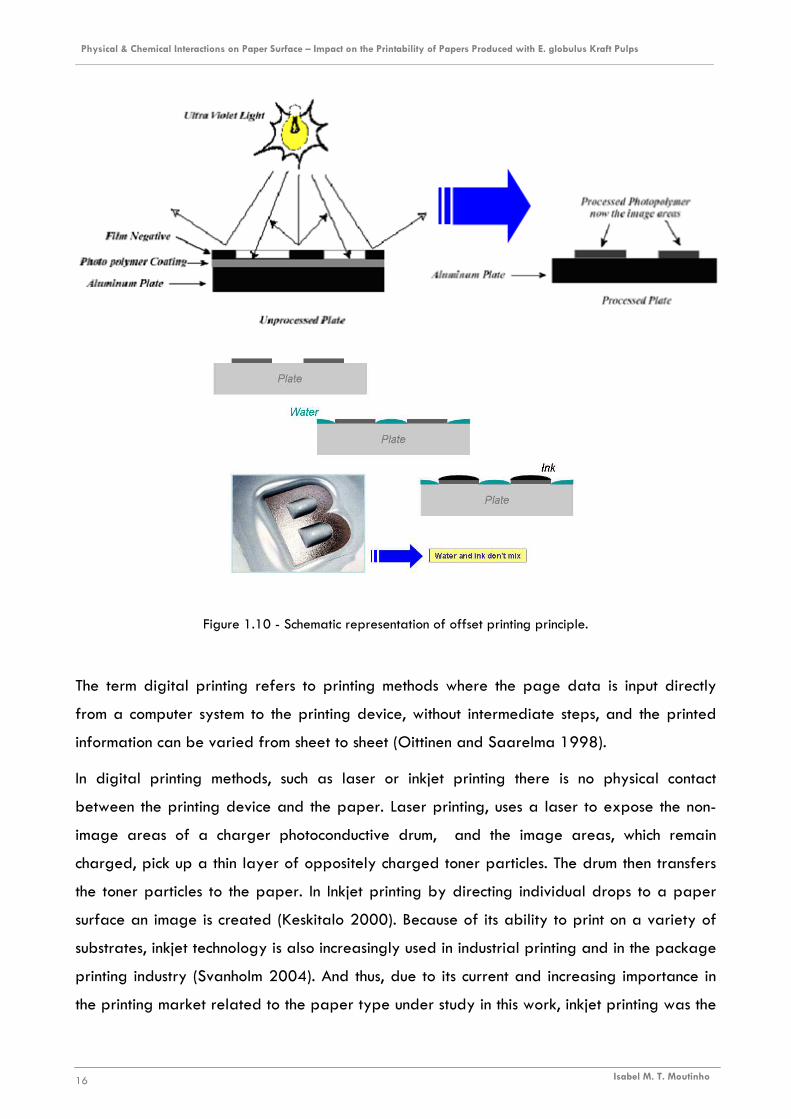
(Oittinen and Saarelma 1998). Figure 1.8, Figure 1.9 and Figure 1.10 describe the basic
principles of flexography, rotogravure and offset printing, respectively.
Physical & Chemical Interactions on Paper Surface – Impact on the Printability of Papers Produced with E. globulus Kraft Pulps ________________________________________________________________________________________________________________________
Isabel M. T. Moutinho 15
Figure 1.8 - Schematic representation of flexography printing principle.
Figure 1.9 – Schematic representation of rotogravure printing principle.
Physical & Chemical Interactions on Paper Surface – Impact on the Printability of Papers Produced with E. globulus Kraft Pulps ________________________________________________________________________________________________________________________
Isabel M. T. Moutinho 16
Figure 1.10 - Schematic representation of offset printing principle.
The term digital printing refers to printing methods where the page data is input directly
from a computer system to the printing device, without intermediate steps, and the printed
information can be varied from sheet to sheet (Oittinen and Saarelma 1998).
In digital printing methods, such as laser or inkjet printing there is no physical contact
between the printing device and the paper. Laser printing, uses a laser to expose the non-
image areas of a charger photoconductive drum, and the image areas, which remain
charged, pick up a thin layer of oppositely charged toner particles. The drum then transfers
the toner particles to the paper. In Inkjet printing by directing individual drops to a paper
surface an image is created (Keskitalo 2000). Because of its ability to print on a variety of
substrates, inkjet technology is also increasingly used in industrial printing and in the package
printing industry (Svanholm 2004). And thus, due to its current and increasing importance in
the printing market related to the paper type under study in this work, inkjet printing was the
Physical & Chemical Interactions on Paper Surface – Impact on the Printability of Papers Produced with E. globulus Kraft Pulps ________________________________________________________________________________________________________________________
Isabel M. T. Moutinho 17
method selected to perform printing quality evaluation in this work, and thus it will be further
developed in Chapter 8.
1.5.1 PRINTING QUALITY
Regardless the printing method involved and the purpose of the printed material, printing
quality evaluation is always done, as a control tool or at least by the final user of the printed
material. Print quality definition does not have absolute terms it depends on interactions
between paper and printing ink and the printing process variables (Oittinen and Saarelma
1998; Levlin and Söderhjelm 2000).
The performance of paper in printing depends on its runnability and printability. Runnability
relates to the factors that determine how the paper runs in the press. Printability factors
concern to quality of paper in relation to ink and printing (Oittinen and Saarelma, 1998).
Thus, the final performance of a paper, in terms of printing quality achieved depends on the
properties of the fibrous matrix and on the characteristics of the paper surface, which are
influenced by the quality of the pulp fibers, the refining process, the chemicals added in the
preparation of the furnish, the operations at the paper machine and the modifications of the
paper surface (Levlin and Söderhjelm, 2000; Moutinho et al. 2007b).
Quantitative evaluation of printing quality is very difficult but very important, that is why in
the last years the number of studies regarding this subject has increased substantially
(Varnella 1998; Donigian et al. 1999; Keskitalo 2000; Chen et al. 2002; Donderi et al.
2003; Mattila et al. 2003; Rosenberger 2003; Glittenberg and Voigt 2004; Danby and
Zhou 2004; Svanholm 2004; Lee et al. 2005; Yang et al. 2005; Olsson et al. 2006;
Mäkenen et al. 2007; Sreekumar et al. 2007; Ungh et al. 2007)
1.6 ABOUT THE WORK
The work described in this thesis was motivated by the need of increasing the knowledge in
specific fields related to paper ink interactions. This need was driven by the growing
importance of the printing quality in the costumer demands and by the recognition of paper
surface modification as a major tool to improve the quality of many paper products as
described in Section 1.3
Physical & Chemical Interactions on Paper Surface – Impact on the Printability of Papers Produced with E. globulus Kraft Pulps ________________________________________________________________________________________________________________________
Isabel M. T. Moutinho 18
Besides the scarce information on this topic in the open literature, the available information is
not focused in printing and writing papers produced with eucalyptus globulus fibers, which is
the core of the Portuguese papermaking industry. Thus this study is pioneer in the surface
studies of paper and also and in particular in the context the Portuguese paper industry and
research.
Before embracing this larger and longer work, a previous one was performed, as
undergraduate student, whose main purpose was to compare the impact of different surface
sizing agents on the surface properties and printing quality of paper sheets prepared in the
laboratory. Despite the limitation of using handsheets, this work pointed out many aspects
that required further investigation (Moutinho et al. 2004). Furthermore, it provided a first
contact with this field, namely with the phenomena related to the interactions between paper
and sizing formulation and/or printing inks as well as with techniques currently used to
characterize the surface of the paper samples. This constituted the main incentive for this
project that includes the present thesis, whose main objective is to analyze the effect of the
addition of different types of synthetic surface sizing agents to the more classical surface
sizing blend (composed of cationic starch) on the properties of commercial paper sheets, in
particular, on inkjet printing performance. In order to apply the obtained results and
conclusions to the industry, all the steps of the work followed as close as possible the
industrial practice. Furthermore the selection of the surface sizing was also performed having
this point in mind.
Finally, it is important to stress that this work is focused on surface sizing and not on coating.
The main difference between these two surface treatments lies on the fact that the coating
blends include pigments and the amount applied is usually above 6 g/m2. Moreover printing
and writing papers (P&W) are not usually coated.
The experimental work carried out in order to achieve these goals involves the following
main steps:
� Characterization/identification of the compounds used in the surface sizing
blends. These were composed of cationic starch and different proportions of
synthetic sizing agents. The sizing agents used ranged from styrene acrylate
copolymers that have been recently applied for surface sizing at industrial level, to
melamine copolymers that are not usually used for this purpose. The formulation
constituted only by cationic starch was taken as reference, as it is the most commonly
used. It should be highlighted that some of the sizing agents tested possessed distinct
Physical & Chemical Interactions on Paper Surface – Impact on the Printability of Papers Produced with E. globulus Kraft Pulps ________________________________________________________________________________________________________________________
Isabel M. T. Moutinho 19
chemical composition whereas others had identical composition but different
molecular configurations. Additionally, the influence of their incorporation
percentage was also investigated, using incorporation percentages of 5, 10 and
20%.
� Production of the surface sized samples. Preliminary studies were undertaken in
order to optimize the surface sizing procedure. These included the selection of the
formulations to be applied and the identification of the variables to be controlled, as
will be detailed in Section 2.1.2. Additionally, also a methodology to guarantee the
traceability of each paper sheet used was set.
� Physical and Chemical characterization of the samples. As the major concern is
about surface behavior, the characterization techniques focus mainly surface
energetics (contact angle e inverse gas chromatography), surface topography
(profilometry), and porosity (mercury porosimetry). It should be pointed out that
these techniques are not used as routine and thus, a previous work was needed
regarding each one of them, to establish the most adequate operating conditions
and to fully interpret their results. Additionally, some of the samples were analyzed
with more sophisticated techniques as AFM or ESCA in order to investigate specific
details.
� Evaluation of the inkjet printing performance of the samples. This is not a simple
issue as it is a subject not usually disclosed in the open literature, and thus all the
methodology was developed specifically for this work, using the available
technologies.
The surface sizing operation, which is the focus of this work, represents at the most 5% of the
paper structure, depending on the paper basis weight, and the differences between the
samples are necessarily limited by this fact. Thus it should be highlighted that previously to
any analysis of the characterization results, these were subjected to Analysis of Variance
(ANOVA), to guarantee that the differences between the samples were statistically valid.
This document is organized in 11 Chapters:
In this chapter (Introduction) some generic information regarding the papermaking process,
surface sizing, paper surface characterization and printing in presented. It is also given a
general overview of the work in order to frame the reader into its purpose and
methodology.
Physical & Chemical Interactions on Paper Surface – Impact on the Printability of Papers Produced with E. globulus Kraft Pulps ________________________________________________________________________________________________________________________
Isabel M. T. Moutinho 20
Chapter 2 (Materials and Methods) describes the experimental procedures used in the work,
in what concerns to the surface sizing operation, the paper surface characterization and the
printing quality evaluation. However the characterization techniques are fully detailed in
further chapters together with the corresponding results.
Chapter 3 (Characterization of the Sizing Chemicals) covers the methodology developed to
determine the composition and the properties of the compounds used in the sizing
formulations (starch and synthetic surface sizing agents).
The following chapters concern the physical and chemical characterization of the paper
surface of all 31 samples produced. Chapters 4, 5, 6, 7 regard, respectively, to
profilometry, mercury porosimetry, contact angle measurements, and inverse gas
chromatography (IGC).The structure of theses chapters is similar. They are all divided in two
sub-sections: firstly the principles of the technique, details and the methodology used are
described and, secondly, the corresponding results are presented and analyzed.
Chapter 8 (Printing Quality) covers the method used to evaluate the inkjet printing
performance of the samples and the corresponding results. Mathematical models were
implemented in order to correlate the values of the printing parameters with the surface
properties determined in the previous chapters.
Chapter 9 (Complementary Studies) is a compilation of scientific papers (published and
submitted) regarding specific aspects of the work. These papers involve either only a few
samples and/or a particular characterization technique which were found adequate to point
out a particular aspect of the work.
Chapter 10 (Conclusions) summarizes the main conclusions that can be withdrawn from this
study and points out some suggestions for future work.
Chapter 11 (References) is used to list the most relevant publications consulted to accomplish
this work, were detailed information on a given subject can be consulted.
The thesis is also complemented by a series of appendices (Appendix A to G.) where
additional information is presented, mainly in tables and plots. This was done to avoid
making the main text too extensive and too hard to follow.
CHAPTER 2
MATERIALS AND METHODS


Physical & Chemical Interactions on Paper Surface – Impact on the Printability of Papers Produced with E. globulus Kraft Pulps ________________________________________________________________________________________________________________________
Isabel M. T. Moutinho 23
2 MATERIALS AND METHODS
As detailed in Section 1.6, this work aims at modifying the surface properties of printing and
writing paper sheets through surface sizing. For that, different surface sizing formulations
(previously characterized) will be tested and the corresponding sized samples characterized
in terms of their physical and chemical properties. Finally the impact of the surface
modifications into the inkjet printing quality will also be evaluated.
Figure 2.1 represents schematically the methodology used to achieve these objectives.
Figure 2.1 – Schematic representation of the methodology used in this work
The compounds and techniques involved in this work will be described in this chapter, in four
different sections: Section 2.1 that not only describes the sizing equipment but also the sizing
formulations, which will be followed by an explanation of the techniques used to characterize
the sizing agents (Section 2.2) and to characterize the sized paper sheets (Section 2.3).
Finally, information on how printing quality is evaluated will be given in Section 2.4. More
extensive descriptions will be provided regarding the surface sizing process and the sizing
formulations, whereas only a brief explanation of the techniques used to characterize the
sized paper samples will be presented, since these will be supplied in subsequent chapters
along with the corresponding experimental results (Chapters 4 to 8).
Printing Quality
Evaluation
Printing
Selection of the
Characterization Techniques
Optimization of the
Operating Conditions
Base Paper Surface Sized Paper
Selection of the Synthetic
Surface Sizing Agents
Compounds
Characterization
Paper Physical and Chemical
Characterization of the Sized
Paper Samples

Physical & Chemical Interactions on Paper Surface – Impact on the Printability of Papers Produced with E. globulus Kraft Pulps ________________________________________________________________________________________________________________________
Isabel M. T. Moutinho 24
2.1 SURFACE SIZING
2.1.1 EQUIPMENT AND METHODOLOGY
The surface sizing formulations were applied to a base paper (79 ± 0.5 g/m2 basis weight),
produced in a paper mill with an Eucalyptus globulus Kraft pulp. This paper was calendered
(20 KN/m calendering pressure) and had no surface chemical treatment of any kind.
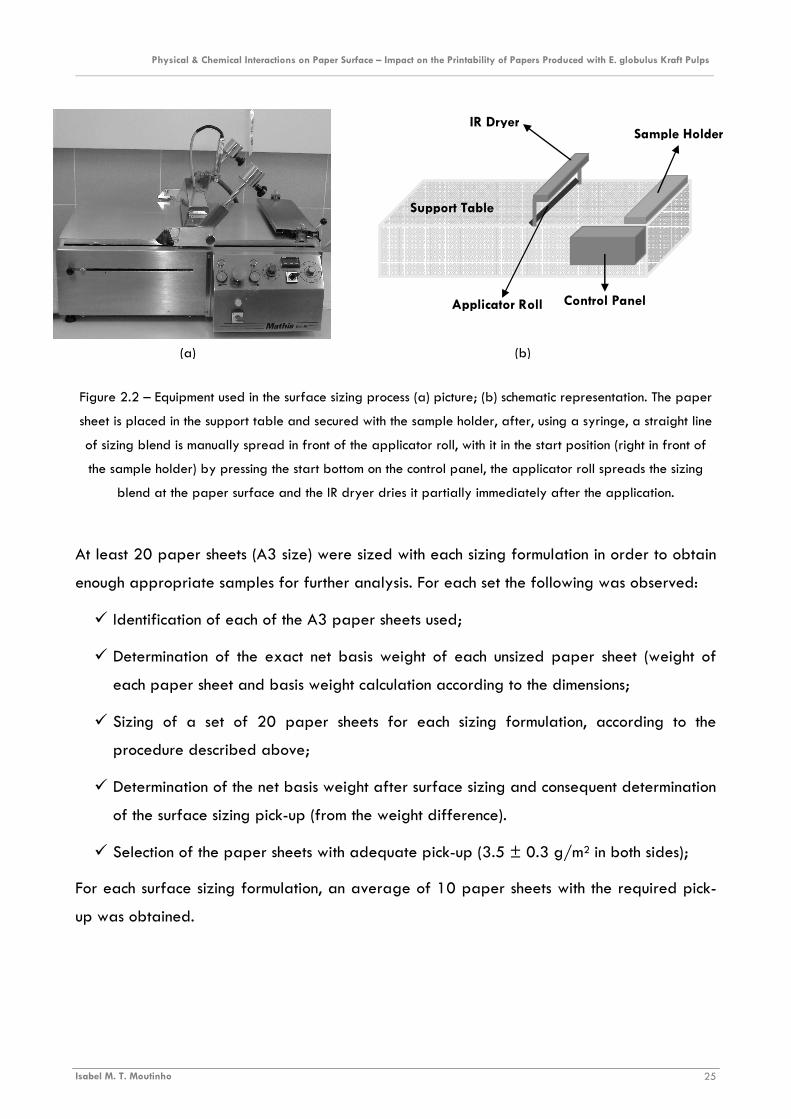
The Mathis laboratory device, model SVA-IR-B (illustrated in Figure 2.2), was used for paper
sheet surface sizing. It operates automatically with velocities ranging from 1 to 10 m/min
and can be used with three applicator rolls of different diameters. A preliminary study was
undertaken in order to optimize the sizing procedure. The main goal was to obtain a sizing
amount (pick-up) similar to that of industrial scale (usually approximately between 2 and 5
g/m2). This was achieved using the 0.15 mm roll in conjunction with a velocity of 6 m/min. A
pick-up of 3.5 ± 0.3 g/m2 (including both faces) was reached for these operating conditions.
Additionally, and to minimize the migration of the sizing formulations into the fibrous matrix
paper samples were subsequently dried (Figure 2.2) using the maximum intensity available
for the IR dryer (1.0 kW).
Due to equipment limitations, the sizing process was performed separately for each side of
the paper sheets. The uniformity of the application with the selected conditions was
confirmed using a colored blend (by sizing the paper sheet with a colored blend it is easily
observed the evenness for the color distribution at the surface, indicating that the equipment
allows good uniformity). The surface sized samples produced were no further calendered
since this mechanical operation could mask the effect of the different sizing formulations in
what concerns the physical properties of the paper surface.
Physical & Chemical Interactions on Paper Surface – Impact on the Printability of Papers Produced with E. globulus Kraft Pulps ________________________________________________________________________________________________________________________
Isabel M. T. Moutinho 25
(a) (b)
Support Table
Control Panel
Sample Holder
Applicator Roll
IR Dryer
Figure 2.2 – Equipment used in the surface sizing process (a) picture; (b) schematic representation. The paper
sheet is placed in the support table and secured with the sample holder, after, using a syringe, a straight line
of sizing blend is manually spread in front of the applicator roll, with it in the start position (right in front of
the sample holder) by pressing the start bottom on the control panel, the applicator roll spreads the sizing
blend at the paper surface and the IR dryer dries it partially immediately after the application.
At least 20 paper sheets (A3 size) were sized with each sizing formulation in order to obtain
enough appropriate samples for further analysis. For each set the following was observed:
� Identification of each of the A3 paper sheets used;
� Determination of the exact net basis weight of each unsized paper sheet (weight of
each paper sheet and basis weight calculation according to the dimensions;
� Sizing of a set of 20 paper sheets for each sizing formulation, according to the
procedure described above;
� Determination of the net basis weight after surface sizing and consequent determination
of the surface sizing pick-up (from the weight difference).
� Selection of the paper sheets with adequate pick-up (3.5 ± 0.3 g/m2 in both sides);
For each surface sizing formulation, an average of 10 paper sheets with the required pick-
up was obtained.
Physical & Chemical Interactions on Paper Surface – Impact on the Printability of Papers Produced with E. globulus Kraft Pulps ________________________________________________________________________________________________________________________
Isabel M. T. Moutinho 26
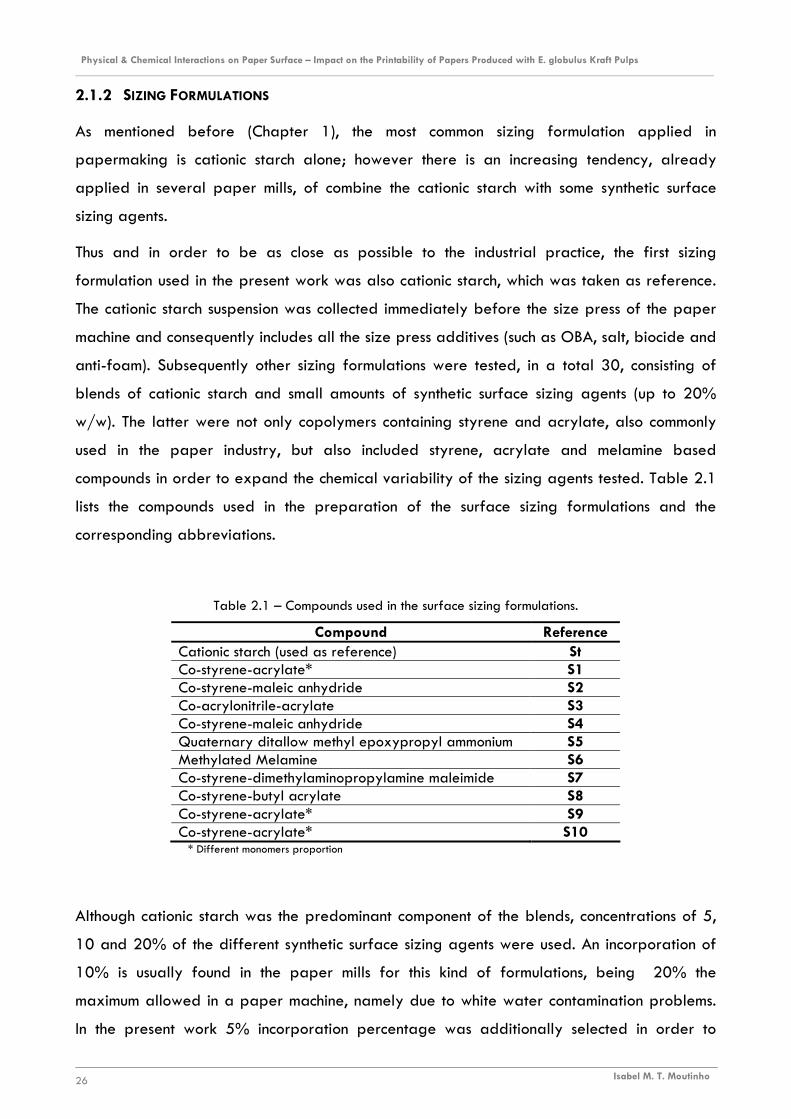
2.1.2 SIZING FORMULATIONS
As mentioned before (Chapter 1), the most common sizing formulation applied in
papermaking is cationic starch alone; however there is an increasing tendency, already
applied in several paper mills, of combine the cationic starch with some synthetic surface
sizing agents.
Thus and in order to be as close as possible to the industrial practice, the first sizing
formulation used in the present work was also cationic starch, which was taken as reference.
The cationic starch suspension was collected immediately before the size press of the paper
machine and consequently includes all the size press additives (such as OBA, salt, biocide and
anti-foam). Subsequently other sizing formulations were tested, in a total 30, consisting of
blends of cationic starch and small amounts of synthetic surface sizing agents (up to 20%
w/w). The latter were not only copolymers containing styrene and acrylate, also commonly
used in the paper industry, but also included styrene, acrylate and melamine based
compounds in order to expand the chemical variability of the sizing agents tested. Table 2.1
lists the compounds used in the preparation of the surface sizing formulations and the
corresponding abbreviations.
Table 2.1 – Compounds used in the surface sizing formulations.
Compound Reference Cationic starch (used as reference) St Co-styrene-acrylate* S1 Co-styrene-maleic anhydride S2 Co-acrylonitrile-acrylate S3 Co-styrene-maleic anhydride S4 Quaternary ditallow methyl epoxypropyl ammonium S5 Methylated Melamine S6 Co-styrene-dimethylaminopropylamine maleimide S7 Co-styrene-butyl acrylate S8 Co-styrene-acrylate* S9 Co-styrene-acrylate* S10
* Different monomers proportion
Although cationic starch was the predominant component of the blends, concentrations of 5,
10 and 20% of the different synthetic surface sizing agents were used. An incorporation of
10% is usually found in the paper mills for this kind of formulations, being 20% the
maximum allowed in a paper machine, namely due to white water contamination problems.
In the present work 5% incorporation percentage was additionally selected in order to
Physical & Chemical Interactions on Paper Surface – Impact on the Printability of Papers Produced with E. globulus Kraft Pulps ________________________________________________________________________________________________________________________
Isabel M. T. Moutinho 27
expand the concentration range of the surface sizing agent providing a better picture of its
influence.
The nomenclature used to identify the sizing formulations was:
StSi-j
Meaning St that the blend contains cationic starch, taken as standard (St), while Si-j indicates
that the blend includes surface sizing agent Si (i varies from 1 to 10, see Table 2.1), in the
percentage j (j equals 5, 10 or 20 w/w). For instance, formulation StS2-10 is composed of
cationic starch and surface sizing agent S2 (Co-styrene-maleic anhydride, Table 3.1) in a
percentage of 10 of S2 and (consequently) 90% of cationic starch. In Appendix B are
summarized the blends composition.
2.2 CHARACTERIZATION OF THE SURFACE SIZING AGENTS
The knowledge of the characteristics of the compounds used to prepare the surface sizing
formulations, in what concerns either their chemical composition or their physical and chemical
properties, as this information is crucial to relate the resultant surface modifications with the
performance of the sized paper sheets, namely in terms of printing quality.
Since most of the co-polymers used as surface sizing agents were commercial products, the
information about their chemical characteristics, provided by the corresponding datasheets
(Appendix A), was rather limited (or confidential). Thus, it was necessary to carry out some
additional measurements namely density, elemental analysis, particle size, pH, solids content
and total surface tension. As described later (Chapter 3) this information enabled the
schematic representation of the compounds molecules.
2.3 PHYSICOCHEMICAL CHARACTERIZATION OF THE PAPER SAMPLES
The characterization of the paper samples produced was performed by using several
techniques, listed in Table 2.2. Some of these techniques (profilometry, mercury porosimetry,
contact angle and IGC) were applied for all samples, while others (AFM, ESCA, ToF-SIMS
and SEM) could only be applied in some samples (mainly because they are not available in
our laboratories). Detailed considerations about all these techniques will be presented in the
Physical & Chemical Interactions on Paper Surface – Impact on the Printability of Papers Produced with E. globulus Kraft Pulps ________________________________________________________________________________________________________________________
Isabel M. T. Moutinho 28
next chapters (Chapter 4 to Chapter 7) together with the analysis of the corresponding
results.
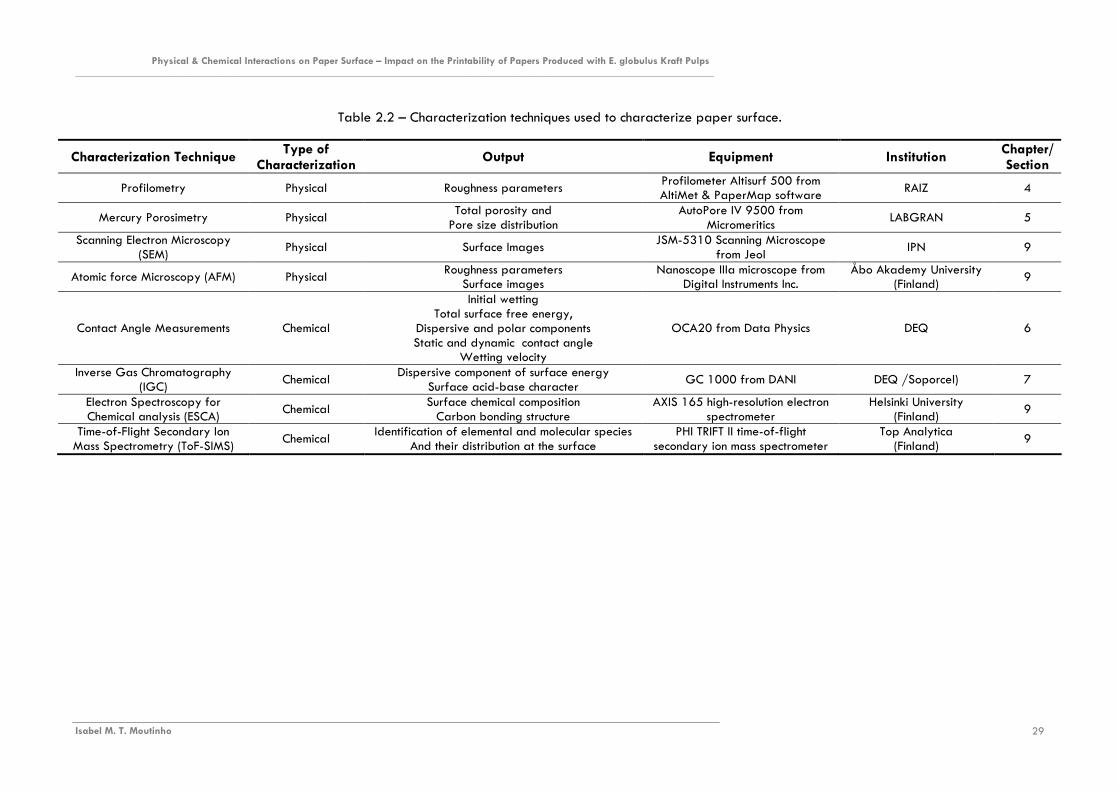
Physical & Chemical Interactions on Paper Surface – Impact on the Printability of Papers Produced with E. globulus Kraft Pulps ________________________________________________________________________________________________________________________
Isabel M. T. Moutinho 29
Table 2.2 – Characterization techniques used to characterize paper surface.
Characterization Technique Type of
Characterization Output Equipment Institution
Chapter/ Section
Profilometry Physical Roughness parameters Profilometer Altisurf 500 from AltiMet & PaperMap software
RAIZ 4
Mercury Porosimetry Physical Total porosity and
Pore size distribution AutoPore IV 9500 from
Micromeritics LABGRAN 5
Scanning Electron Microscopy (SEM)
Physical Surface Images JSM-5310 Scanning Microscope
from Jeol IPN 9
Atomic force Microscopy (AFM) Physical Roughness parameters
Surface images Nanoscope IIIa microscope from
Digital Instruments Inc. Åbo Akademy University
(Finland) 9
Contact Angle Measurements Chemical
Initial wetting Total surface free energy,
Dispersive and polar components Static and dynamic contact angle
Wetting velocity
OCA20 from Data Physics DEQ 6
Inverse Gas Chromatography (IGC)
Chemical Dispersive component of surface energy
Surface acid-base character GC 1000 from DANI DEQ /Soporcel) 7
Electron Spectroscopy for Chemical analysis (ESCA)
Chemical Surface chemical composition
Carbon bonding structure AXIS 165 high-resolution electron
spectrometer Helsinki University
(Finland) 9
Time-of-Flight Secondary Ion Mass Spectrometry (ToF-SIMS)
Chemical Identification of elemental and molecular species
And their distribution at the surface PHI TRIFT II time-of-flight
secondary ion mass spectrometer Top Analytica
(Finland) 9
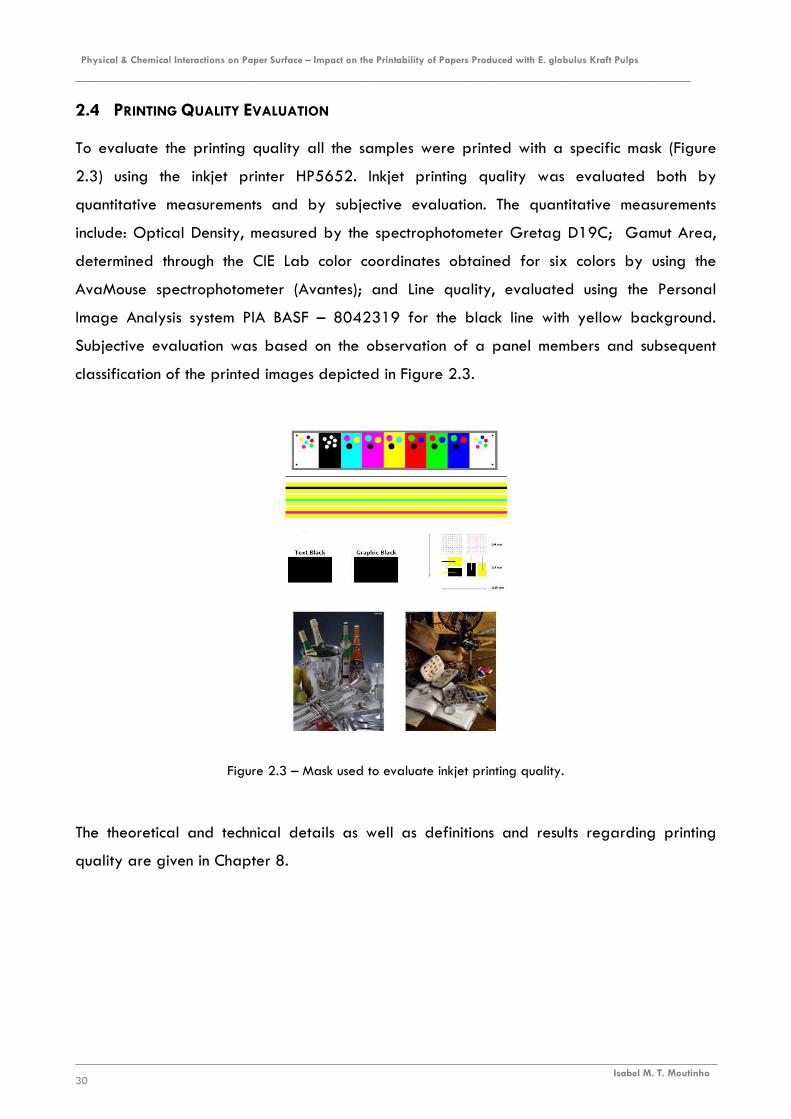
Physical & Chemical Interactions on Paper Surface – Impact on the Printability of Papers Produced with E. globulus Kraft Pulps
__________________________________________________________________________
Isabel M. T. Moutinho 30
2.4 PRINTING QUALITY EVALUATION
To evaluate the printing quality all the samples were printed with a specific mask (Figure
2.3) using the inkjet printer HP5652. Inkjet printing quality was evaluated both by
quantitative measurements and by subjective evaluation. The quantitative measurements
include: Optical Density, measured by the spectrophotometer Gretag D19C; Gamut Area,
determined through the CIE Lab color coordinates obtained for six colors by using the
AvaMouse spectrophotometer (Avantes); and Line quality, evaluated using the Personal
Image Analysis system PIA BASF – 8042319 for the black line with yellow background.
Subjective evaluation was based on the observation of a panel members and subsequent
classification of the printed images depicted in Figure 2.3.
Figure 2.3 – Mask used to evaluate inkjet printing quality.
The theoretical and technical details as well as definitions and results regarding printing
quality are given in Chapter 8.
CHAPTER 3
CHARACTERIZATION OF THE SIZING CHEMICALS

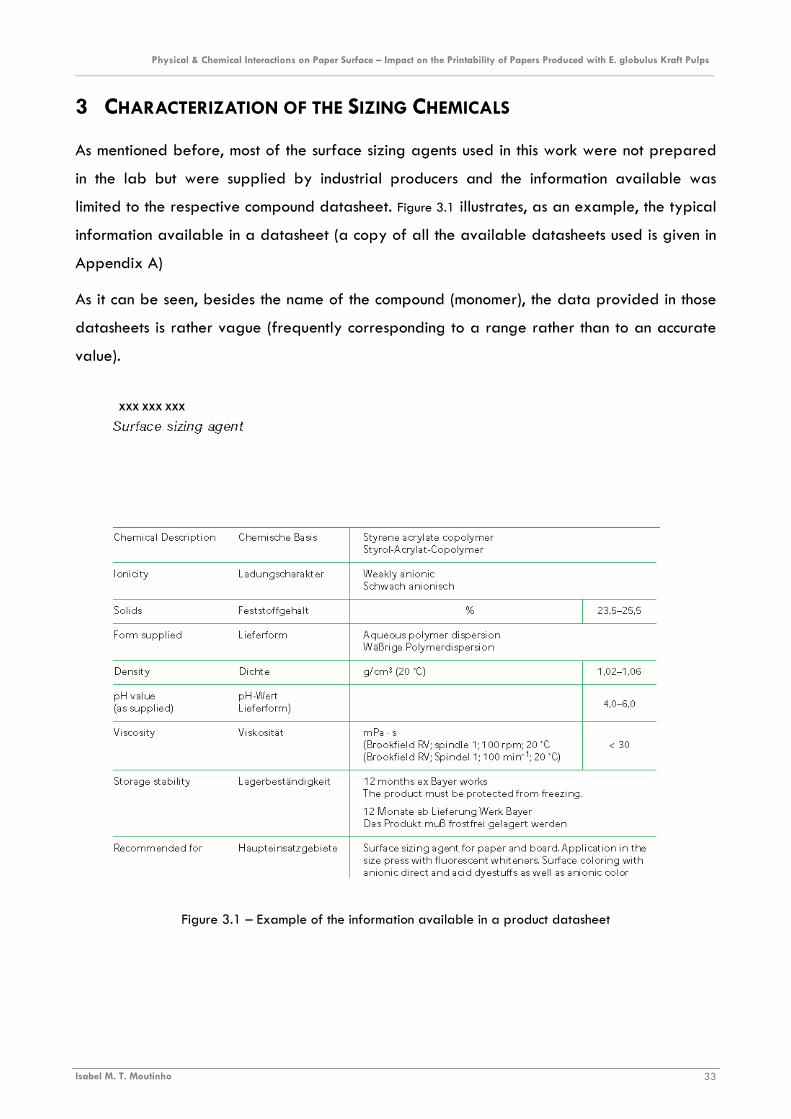
Physical & Chemical Interactions on Paper Surface – Impact on the Printability of Papers Produced with E. globulus Kraft Pulps ________________________________________________________________________________________________________________________
Isabel M. T. Moutinho 33
3 CHARACTERIZATION OF THE SIZING CHEMICALS
As mentioned before, most of the surface sizing agents used in this work were not prepared
in the lab but were supplied by industrial producers and the information available was
limited to the respective compound datasheet. Figure 3.1 illustrates, as an example, the typical
information available in a datasheet (a copy of all the available datasheets used is given in
Appendix A)
As it can be seen, besides the name of the compound (monomer), the data provided in those
datasheets is rather vague (frequently corresponding to a range rather than to an accurate
value).
Figure 3.1 – Example of the information available in a product datasheet
XXX XXX XXX
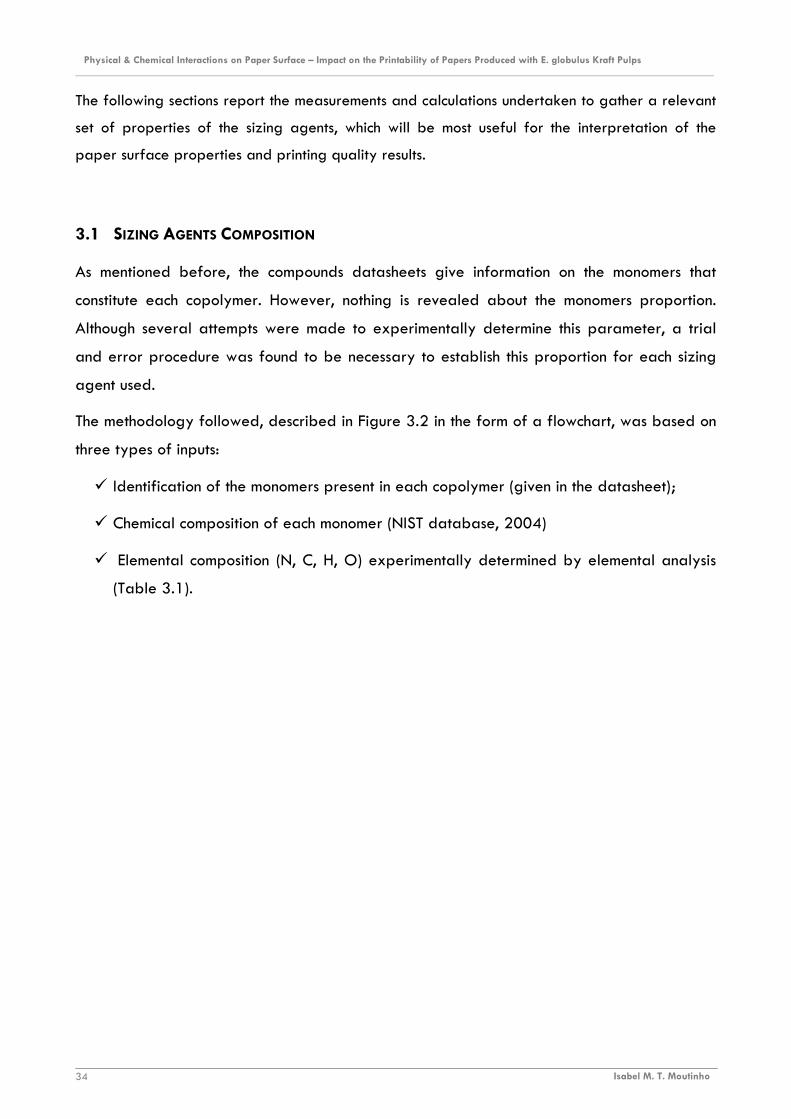
Physical & Chemical Interactions on Paper Surface – Impact on the Printability of Papers Produced with E. globulus Kraft Pulps ________________________________________________________________________________________________________________________
Isabel M. T. Moutinho 34
The following sections report the measurements and calculations undertaken to gather a relevant
set of properties of the sizing agents, which will be most useful for the interpretation of the
paper surface properties and printing quality results.
3.1 SIZING AGENTS COMPOSITION
As mentioned before, the compounds datasheets give information on the monomers that
constitute each copolymer. However, nothing is revealed about the monomers proportion.
Although several attempts were made to experimentally determine this parameter, a trial
and error procedure was found to be necessary to establish this proportion for each sizing
agent used.
The methodology followed, described in Figure 3.2 in the form of a flowchart, was based on
three types of inputs:
� Identification of the monomers present in each copolymer (given in the datasheet);
� Chemical composition of each monomer (NIST database, 2004)
� Elemental composition (N, C, H, O) experimentally determined by elemental analysis
(Table 3.1).
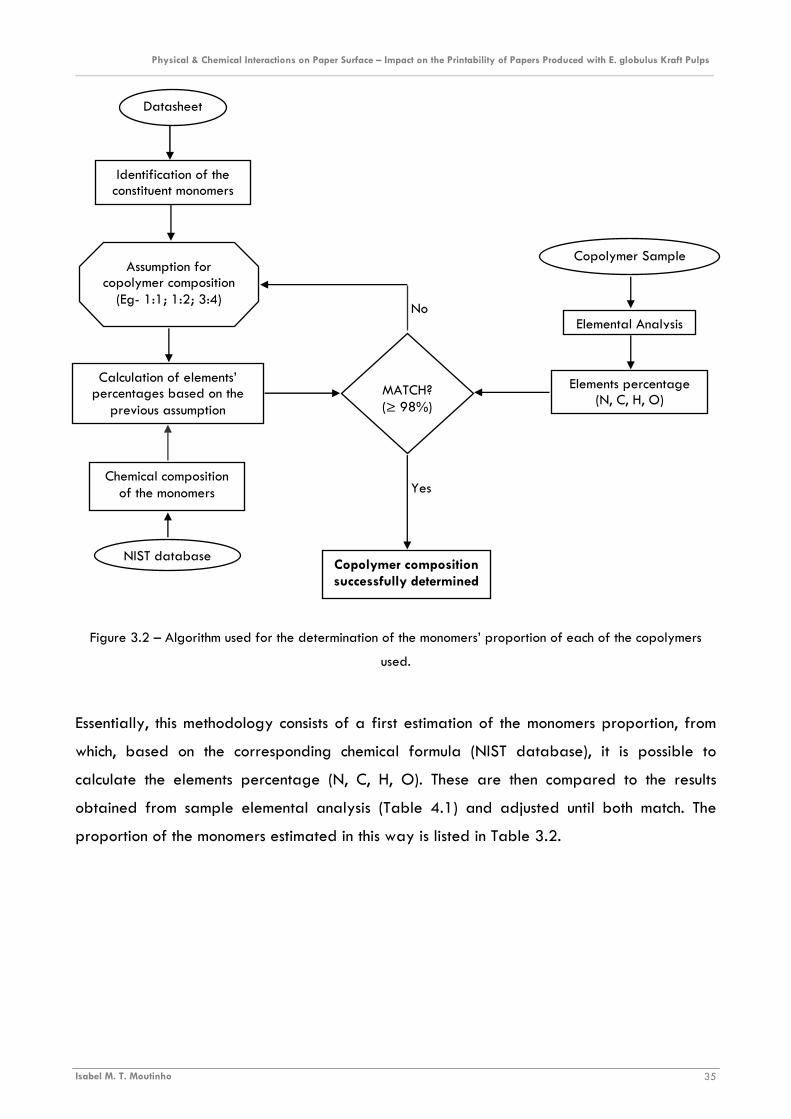
Physical & Chemical Interactions on Paper Surface – Impact on the Printability of Papers Produced with E. globulus Kraft Pulps ________________________________________________________________________________________________________________________
Isabel M. T. Moutinho 35
Yes
Copolymer composition successfully determined
Copolymer Sample
Elemental Analysis
Elements percentage (N, C, H, O)
MATCH? (≥ 98%)
Assumption for copolymer composition
(Eg- 1:1; 1:2; 3:4)
Datasheet
Identification of the constituent monomers
Calculation of elements’ percentages based on the
previous assumption
Chemical composition of the monomers
NIST database
No
Figure 3.2 – Algorithm used for the determination of the monomers’ proportion of each of the copolymers
used.
Essentially, this methodology consists of a first estimation of the monomers proportion, from
which, based on the corresponding chemical formula (NIST database), it is possible to
calculate the elements percentage (N, C, H, O). These are then compared to the results
obtained from sample elemental analysis (Table 4.1) and adjusted until both match. The
proportion of the monomers estimated in this way is listed in Table 3.2.
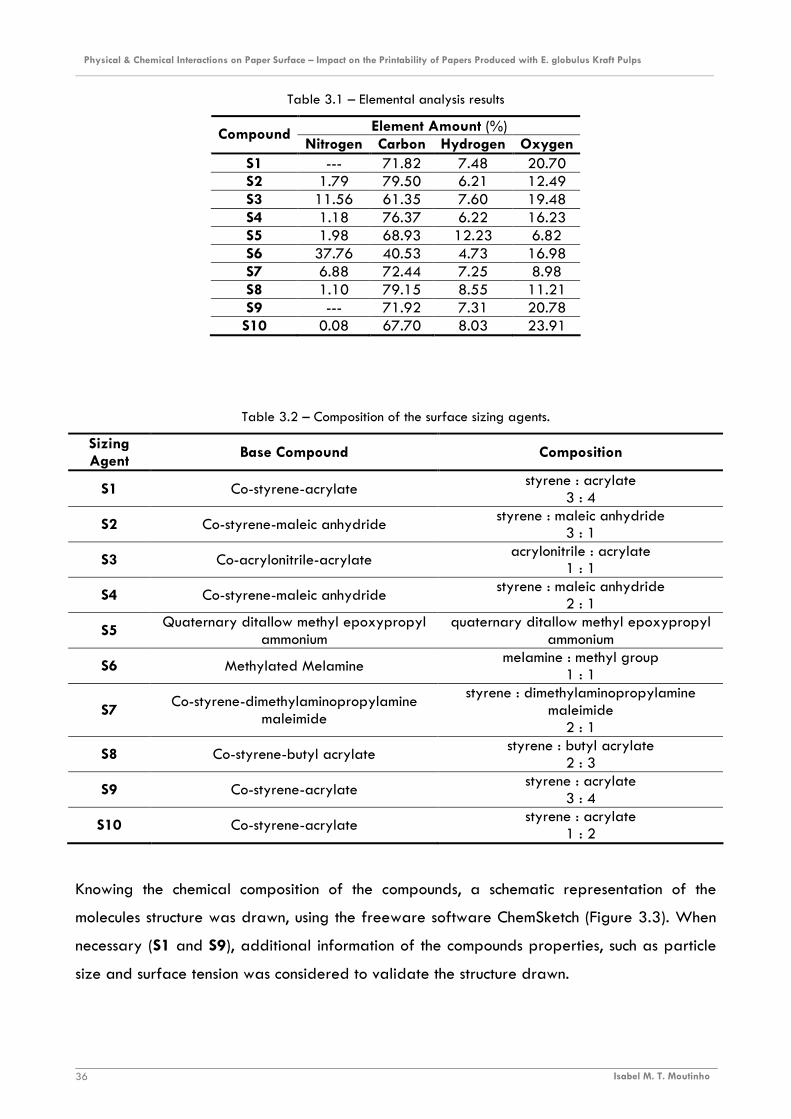
Physical & Chemical Interactions on Paper Surface – Impact on the Printability of Papers Produced with E. globulus Kraft Pulps ________________________________________________________________________________________________________________________
Isabel M. T. Moutinho 36
Table 3.1 – Elemental analysis results
Element Amount (%) Compound Nitrogen Carbon Hydrogen Oxygen
S1 --- 71.82 7.48 20.70 S2 1.79 79.50 6.21 12.49 S3 11.56 61.35 7.60 19.48 S4 1.18 76.37 6.22 16.23 S5 1.98 68.93 12.23 6.82 S6 37.76 40.53 4.73 16.98 S7 6.88 72.44 7.25 8.98 S8 1.10 79.15 8.55 11.21 S9 --- 71.92 7.31 20.78
S10 0.08 67.70 8.03 23.91
Table 3.2 – Composition of the surface sizing agents.
Sizing Agent
Base Compound Composition
S1 Co-styrene-acrylate styrene : acrylate
3 : 4
S2 Co-styrene-maleic anhydride styrene : maleic anhydride
3 : 1
S3 Co-acrylonitrile-acrylate acrylonitrile : acrylate
1 : 1
S4 Co-styrene-maleic anhydride styrene : maleic anhydride
2 : 1
S5 Quaternary ditallow methyl epoxypropyl
ammonium quaternary ditallow methyl epoxypropyl
ammonium
S6 Methylated Melamine melamine : methyl group
1 : 1
S7 Co-styrene-dimethylaminopropylamine
maleimide
styrene : dimethylaminopropylamine maleimide
2 : 1
S8 Co-styrene-butyl acrylate styrene : butyl acrylate
2 : 3
S9 Co-styrene-acrylate styrene : acrylate
3 : 4
S10 Co-styrene-acrylate styrene : acrylate
1 : 2
Knowing the chemical composition of the compounds, a schematic representation of the
molecules structure was drawn, using the freeware software ChemSketch (Figure 3.3). When
necessary (S1 and S9), additional information of the compounds properties, such as particle
size and surface tension was considered to validate the structure drawn.
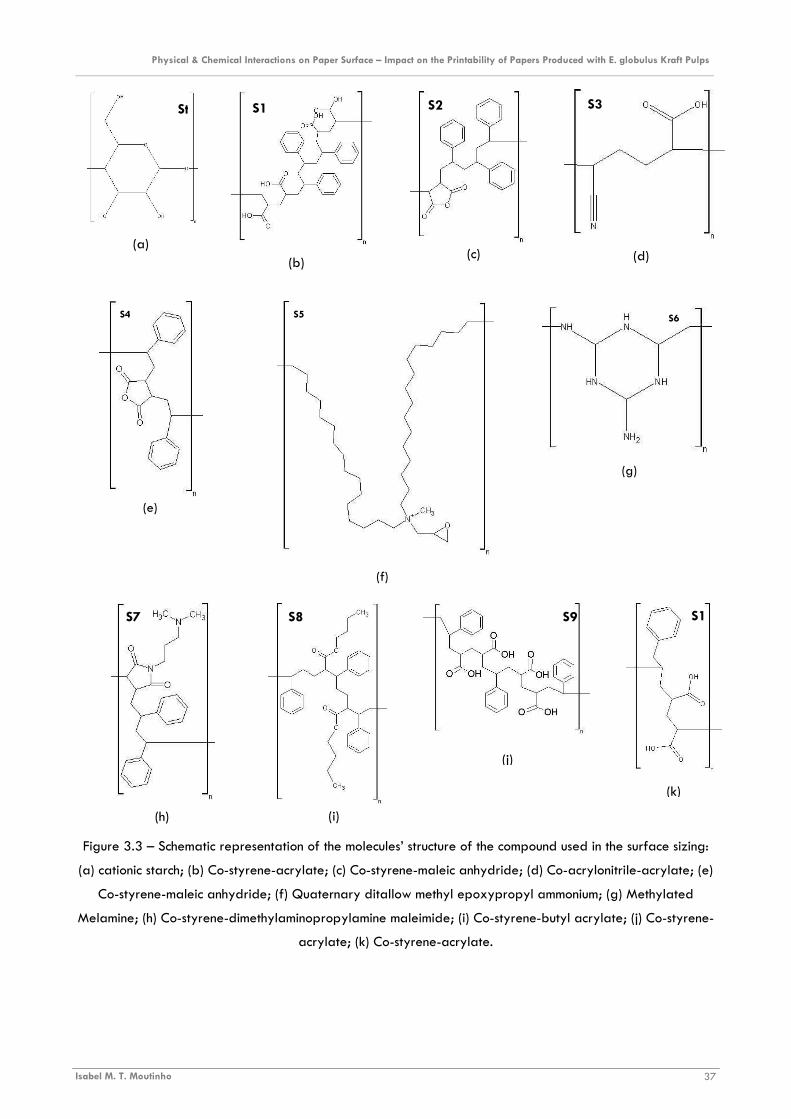
Physical & Chemical Interactions on Paper Surface – Impact on the Printability of Papers Produced with E. globulus Kraft Pulps ________________________________________________________________________________________________________________________
Isabel M. T. Moutinho 37
Figure 3.3 – Schematic representation of the molecules’ structure of the compound used in the surface sizing:
(a) cationic starch; (b) Co-styrene-acrylate; (c) Co-styrene-maleic anhydride; (d) Co-acrylonitrile-acrylate; (e)
Co-styrene-maleic anhydride; (f) Quaternary ditallow methyl epoxypropyl ammonium; (g) Methylated
Melamine; (h) Co-styrene-dimethylaminopropylamine maleimide; (i) Co-styrene-butyl acrylate; (j) Co-styrene-
acrylate; (k) Co-styrene-acrylate.
(a) (b)
(c) (d)
St S1 S2 S3
(e)
(f)
(g)
S4 S5 S6
(i) (h)
(k)
(j)
S7 S8 S9 S1
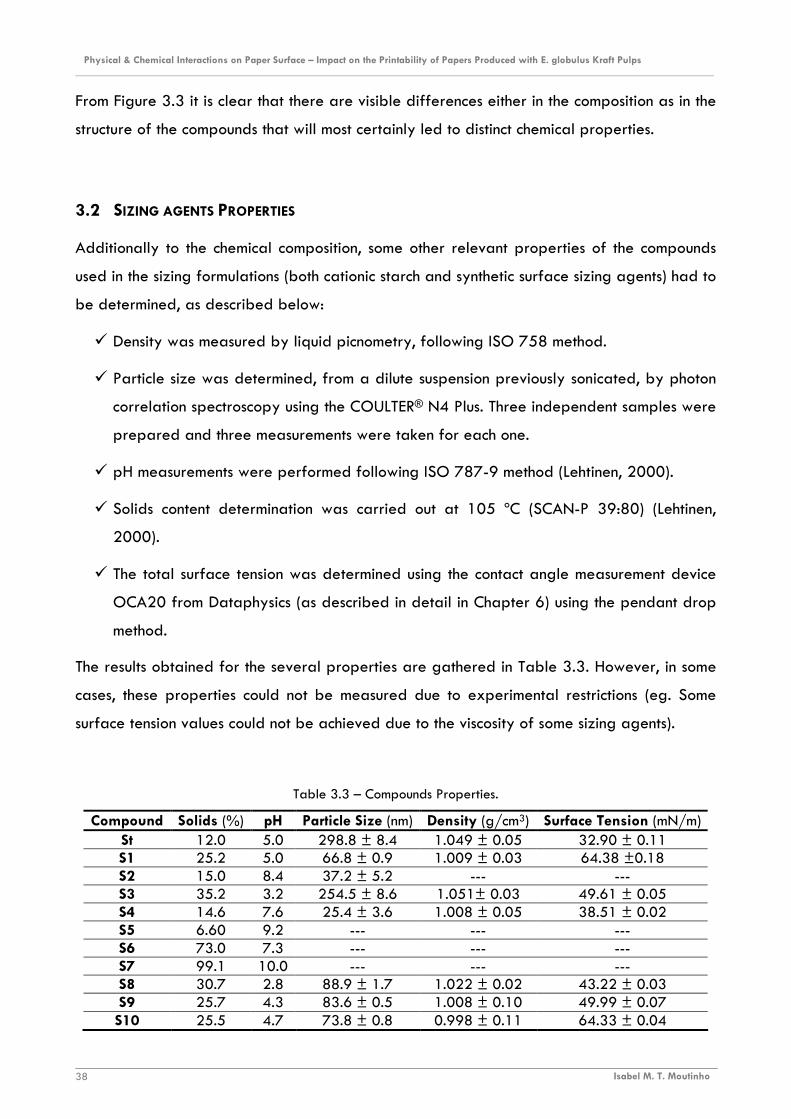
Physical & Chemical Interactions on Paper Surface – Impact on the Printability of Papers Produced with E. globulus Kraft Pulps ________________________________________________________________________________________________________________________
Isabel M. T. Moutinho 38
From Figure 3.3 it is clear that there are visible differences either in the composition as in the
structure of the compounds that will most certainly led to distinct chemical properties.
3.2 SIZING AGENTS PROPERTIES
Additionally to the chemical composition, some other relevant properties of the compounds
used in the sizing formulations (both cationic starch and synthetic surface sizing agents) had to
be determined, as described below:
� Density was measured by liquid picnometry, following ISO 758 method.
� Particle size was determined, from a dilute suspension previously sonicated, by photon
correlation spectroscopy using the COULTER® N4 Plus. Three independent samples were
prepared and three measurements were taken for each one.
� pH measurements were performed following ISO 787-9 method (Lehtinen, 2000).
� Solids content determination was carried out at 105 ºC (SCAN-P 39:80) (Lehtinen,
2000).
� The total surface tension was determined using the contact angle measurement device
OCA20 from Dataphysics (as described in detail in Chapter 6) using the pendant drop
method.
The results obtained for the several properties are gathered in Table 3.3. However, in some
cases, these properties could not be measured due to experimental restrictions (eg. Some
surface tension values could not be achieved due to the viscosity of some sizing agents).
Table 3.3 – Compounds Properties.
Compound Solids (%) pH Particle Size (nm) Density (g/cm3) Surface Tension (mN/m) St 12.0 5.0 298.8 ± 8.4 1.049 ± 0.05 32.90 ± 0.11 S1 25.2 5.0 66.8 ± 0.9 1.009 ± 0.03 64.38 ±0.18 S2 15.0 8.4 37.2 ± 5.2 --- --- S3 35.2 3.2 254.5 ± 8.6 1.051± 0.03 49.61 ± 0.05 S4 14.6 7.6 25.4 ± 3.6 1.008 ± 0.05 38.51 ± 0.02 S5 6.60 9.2 --- --- --- S6 73.0 7.3 --- --- --- S7 99.1 10.0 --- --- --- S8 30.7 2.8 88.9 ± 1.7 1.022 ± 0.02 43.22 ± 0.03 S9 25.7 4.3 83.6 ± 0.5 1.008 ± 0.10 49.99 ± 0.07
S10 25.5 4.7 73.8 ± 0.8 0.998 ± 0.11 64.33 ± 0.04
Physical & Chemical Interactions on Paper Surface – Impact on the Printability of Papers Produced with E. globulus Kraft Pulps ________________________________________________________________________________________________________________________
Isabel M. T. Moutinho 39
As can be seen from this table, the compounds exhibit relevant differences in terms of
particle size, surface tension and pH. This was not surprising considering the significant
diversity of the constituent molecules.
The values of these properties will be used in combination with the composition and structure
of the compounds to interpret some surface properties and behaviors of the sized papers.

CHAPTER 4
PROFILOMETRY

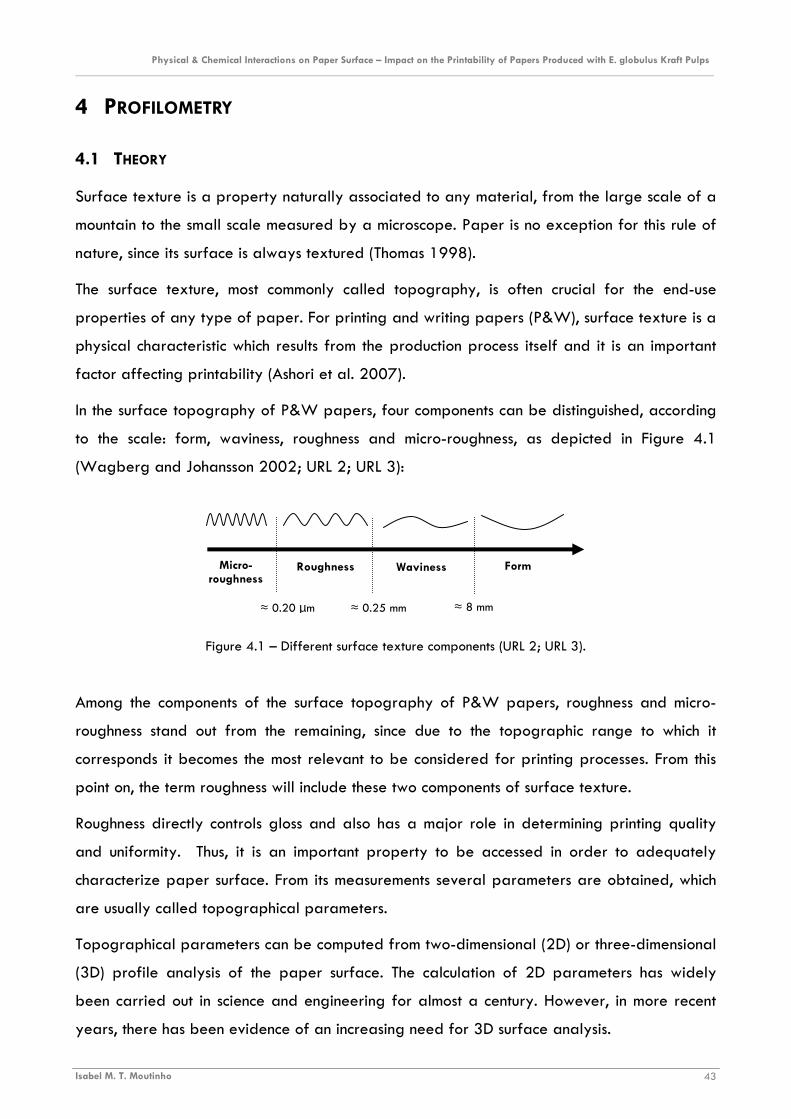
Physical & Chemical Interactions on Paper Surface – Impact on the Printability of Papers Produced with E. globulus Kraft Pulps ________________________________________________________________________________________________________________________
Isabel M. T. Moutinho 43
Micro-roughness
Roughness Waviness Form
≈ 0.20 µm ≈ 0.25 mm ≈ 8 mm
4 PROFILOMETRY
4.1 THEORY
Surface texture is a property naturally associated to any material, from the large scale of a
mountain to the small scale measured by a microscope. Paper is no exception for this rule of
nature, since its surface is always textured (Thomas 1998).
The surface texture, most commonly called topography, is often crucial for the end-use
properties of any type of paper. For printing and writing papers (P&W), surface texture is a
physical characteristic which results from the production process itself and it is an important
factor affecting printability (Ashori et al. 2007).
In the surface topography of P&W papers, four components can be distinguished, according
to the scale: form, waviness, roughness and micro-roughness, as depicted in Figure 4.1
(Wagberg and Johansson 2002; URL 2; URL 3):
Figure 4.1 – Different surface texture components (URL 2; URL 3).
Among the components of the surface topography of P&W papers, roughness and micro-
roughness stand out from the remaining, since due to the topographic range to which it
corresponds it becomes the most relevant to be considered for printing processes. From this
point on, the term roughness will include these two components of surface texture.
Roughness directly controls gloss and also has a major role in determining printing quality
and uniformity. Thus, it is an important property to be accessed in order to adequately
characterize paper surface. From its measurements several parameters are obtained, which
are usually called topographical parameters.
Topographical parameters can be computed from two-dimensional (2D) or three-dimensional
(3D) profile analysis of the paper surface. The calculation of 2D parameters has widely
been carried out in science and engineering for almost a century. However, in more recent
years, there has been evidence of an increasing need for 3D surface analysis.

Physical & Chemical Interactions on Paper Surface – Impact on the Printability of Papers Produced with E. globulus Kraft Pulps ________________________________________________________________________________________________________________________
Isabel M. T. Moutinho 44
This need arises partially as a result of the recognition that all surfaces interact in three
rather than two dimensions. In some cases 2D parameters introduced in many national and
international standards are inadequate to give a comprehensive description of 3D surfaces
and thus unable to meet the need of a wide variety of applications (Stout at al. 1993; Dong
et al. 1994a; Dong et al. 1994b; Wågberg 2002).
The functional applications of the materials in fields like wear, friction, lubrication, fatigue,
sealing, painting, etc., are deeply influenced by the amplitude and spatial characteristics of
the 3D surface topography of the materials (Dong et al. 1994a).
4.1.1 ROUGHNESS PARAMETERS DEFINITION
3D topography is complex and cannot be described completely by a single or a few
parameters.
Each one of the roughness parameters reduce all the information in a profile to a single
number which is calculated using a specific formula. As each parameter only describes one
aspect of the topography, a set of parameters is necessary to accurately characterize
surface topography (Dong et al 1994a; Wågberg 2002).
Some of these parameters are naturally extended from their 2D counterparts; others are
uniquely defined for 3D topography. Currently, in order to distinguish 2D and 3D
parameters, a capital letter “S” (meaning that it is calculated from an area (or surface)
rather than a line) is used to identify 3D parameters whereas a capital “R” is traditionally
used for 2D parameters (Stout et al. 1993; Dong et al 1994a; Dong et al 1994b; Cohen
2006).
3D measurement systems are all digital height measurement systems. They represent the
measured surface with a set of data usually in the form of a x-y matrix of the Cartesian
coordinate, where x and y spacing are not necessarily the same (Stout et al. 1993; Dong et
al. 1994a; Cohen 2006; TrueGage 2008).
An equally spaced digitalized 3D surface, can be denoted by z(xi, yj) (xi=i∆x, yj=j∆y;
i=1,2,…M; j=1,2,…,N), where ∆x and ∆y are the sampling intervals, and M and N
represent the number of sampling points in the x and y directions, respectively (Stout et al.
1993; Dong et al. 1994a; Cohen 2006; TrueGage 2008).
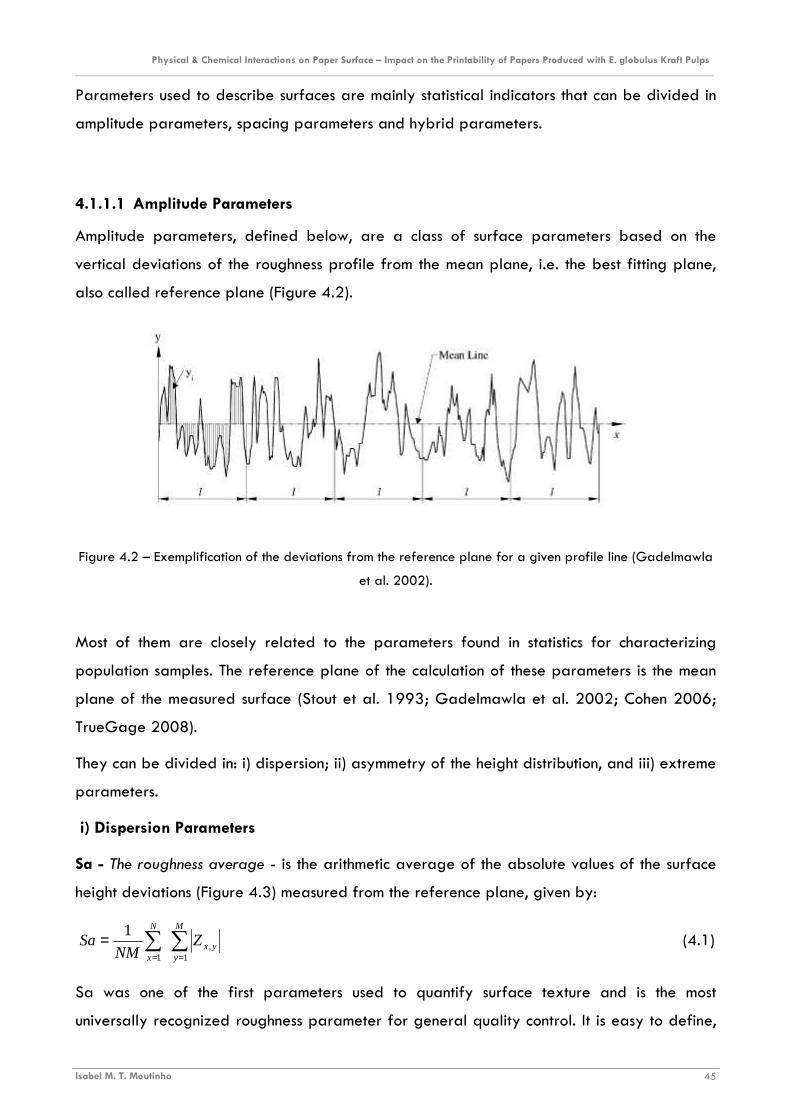
Physical & Chemical Interactions on Paper Surface – Impact on the Printability of Papers Produced with E. globulus Kraft Pulps ________________________________________________________________________________________________________________________
Isabel M. T. Moutinho 45
Parameters used to describe surfaces are mainly statistical indicators that can be divided in
amplitude parameters, spacing parameters and hybrid parameters.
4.1.1.1 Amplitude Parameters
Amplitude parameters, defined below, are a class of surface parameters based on the
vertical deviations of the roughness profile from the mean plane, i.e. the best fitting plane,
also called reference plane (Figure 4.2).
Figure 4.2 – Exemplification of the deviations from the reference plane for a given profile line (Gadelmawla
et al. 2002).
Most of them are closely related to the parameters found in statistics for characterizing
population samples. The reference plane of the calculation of these parameters is the mean
plane of the measured surface (Stout et al. 1993; Gadelmawla et al. 2002; Cohen 2006;
TrueGage 2008).
They can be divided in: i) dispersion; ii) asymmetry of the height distribution, and iii) extreme
parameters.
i) Dispersion Parameters
Sa - The roughness average - is the arithmetic average of the absolute values of the surface
height deviations (Figure 4.3) measured from the reference plane, given by:
∑∑==
=M
yyx
N
x
ZNM
Sa1
,1
1 (4.1)
Sa was one of the first parameters used to quantify surface texture and is the most
universally recognized roughness parameter for general quality control. It is easy to define,
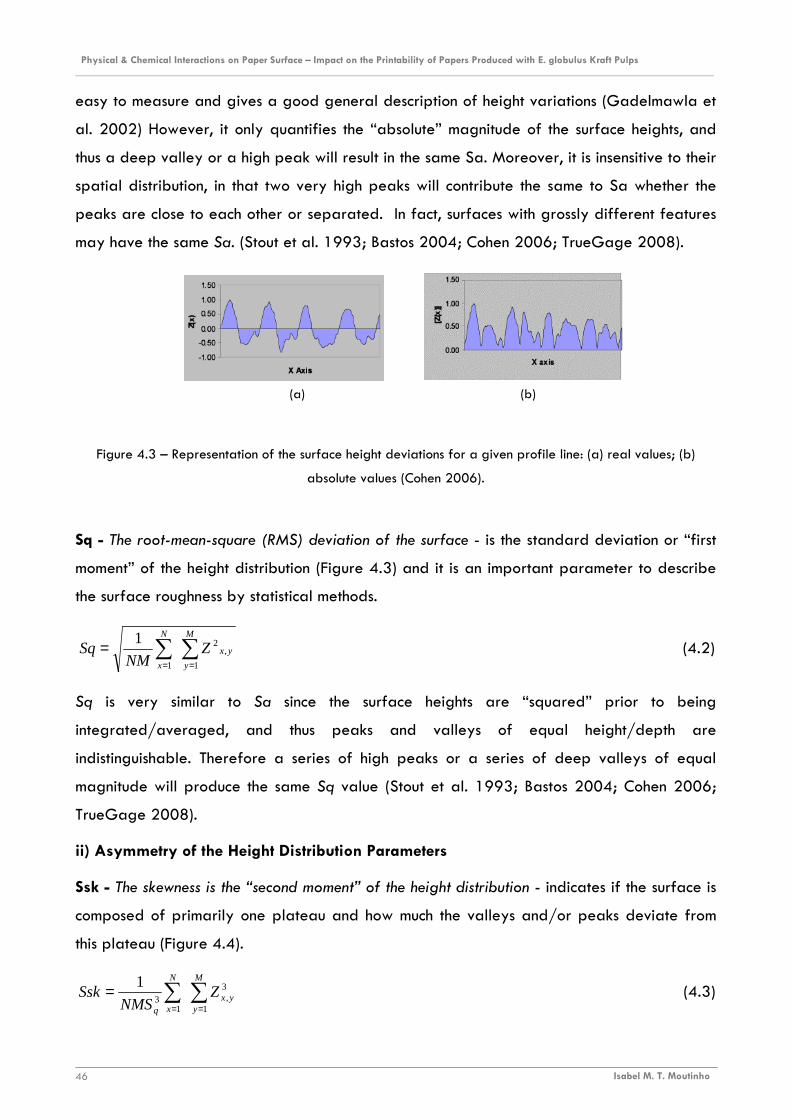
Physical & Chemical Interactions on Paper Surface – Impact on the Printability of Papers Produced with E. globulus Kraft Pulps ________________________________________________________________________________________________________________________
Isabel M. T. Moutinho 46
easy to measure and gives a good general description of height variations (Gadelmawla et
al. 2002) However, it only quantifies the “absolute” magnitude of the surface heights, and
thus a deep valley or a high peak will result in the same Sa. Moreover, it is insensitive to their
spatial distribution, in that two very high peaks will contribute the same to Sa whether the
peaks are close to each other or separated. In fact, surfaces with grossly different features
may have the same Sa. (Stout et al. 1993; Bastos 2004; Cohen 2006; TrueGage 2008).
Figure 4.3 – Representation of the surface height deviations for a given profile line: (a) real values; (b)
absolute values (Cohen 2006).
Sq - The root-mean-square (RMS) deviation of the surface - is the standard deviation or “first
moment” of the height distribution (Figure 4.3) and it is an important parameter to describe
the surface roughness by statistical methods.
∑∑==
=M
y
yx
N
x
ZNM
Sq1
,2
1
1 (4.2)
Sq is very similar to Sa since the surface heights are “squared” prior to being
integrated/averaged, and thus peaks and valleys of equal height/depth are
indistinguishable. Therefore a series of high peaks or a series of deep valleys of equal
magnitude will produce the same Sq value (Stout et al. 1993; Bastos 2004; Cohen 2006;
TrueGage 2008).
ii) Asymmetry of the Height Distribution Parameters
Ssk - The skewness is the “second moment” of the height distribution - indicates if the surface is
composed of primarily one plateau and how much the valleys and/or peaks deviate from
this plateau (Figure 4.4).
∑∑==
=M
yyx
N
xq
ZNMS
Ssk1
3,
13
1 (4.3)
(a) (b)
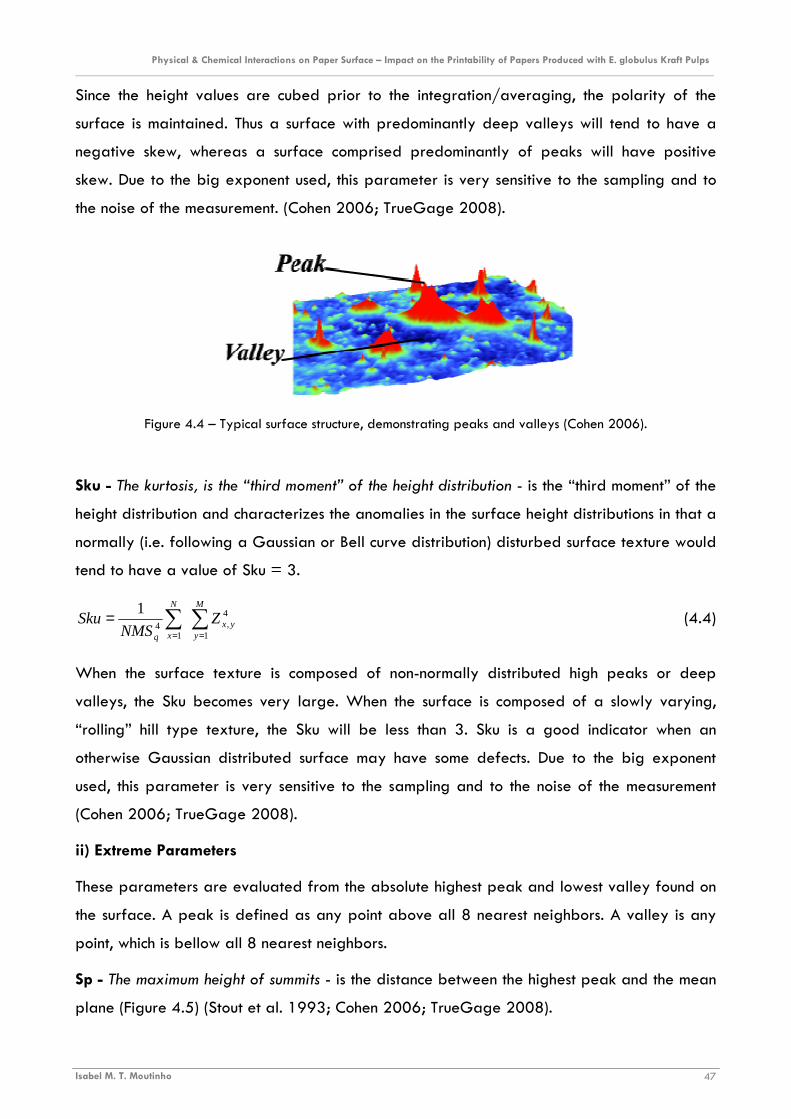
Physical & Chemical Interactions on Paper Surface – Impact on the Printability of Papers Produced with E. globulus Kraft Pulps ________________________________________________________________________________________________________________________
Isabel M. T. Moutinho 47
Since the height values are cubed prior to the integration/averaging, the polarity of the
surface is maintained. Thus a surface with predominantly deep valleys will tend to have a
negative skew, whereas a surface comprised predominantly of peaks will have positive
skew. Due to the big exponent used, this parameter is very sensitive to the sampling and to
the noise of the measurement. (Cohen 2006; TrueGage 2008).
Figure 4.4 – Typical surface structure, demonstrating peaks and valleys (Cohen 2006).
Sku - The kurtosis, is the “third moment” of the height distribution - is the “third moment” of the
height distribution and characterizes the anomalies in the surface height distributions in that a
normally (i.e. following a Gaussian or Bell curve distribution) disturbed surface texture would
tend to have a value of Sku = 3.
∑∑==
=M
yyx
N
xq
ZNMS
Sku1
4,
14
1 (4.4)
When the surface texture is composed of non-normally distributed high peaks or deep
valleys, the Sku becomes very large. When the surface is composed of a slowly varying,
“rolling” hill type texture, the Sku will be less than 3. Sku is a good indicator when an
otherwise Gaussian distributed surface may have some defects. Due to the big exponent
used, this parameter is very sensitive to the sampling and to the noise of the measurement
(Cohen 2006; TrueGage 2008).
ii) Extreme Parameters
These parameters are evaluated from the absolute highest peak and lowest valley found on
the surface. A peak is defined as any point above all 8 nearest neighbors. A valley is any
point, which is bellow all 8 nearest neighbors.
Sp - The maximum height of summits - is the distance between the highest peak and the mean
plane (Figure 4.5) (Stout et al. 1993; Cohen 2006; TrueGage 2008).
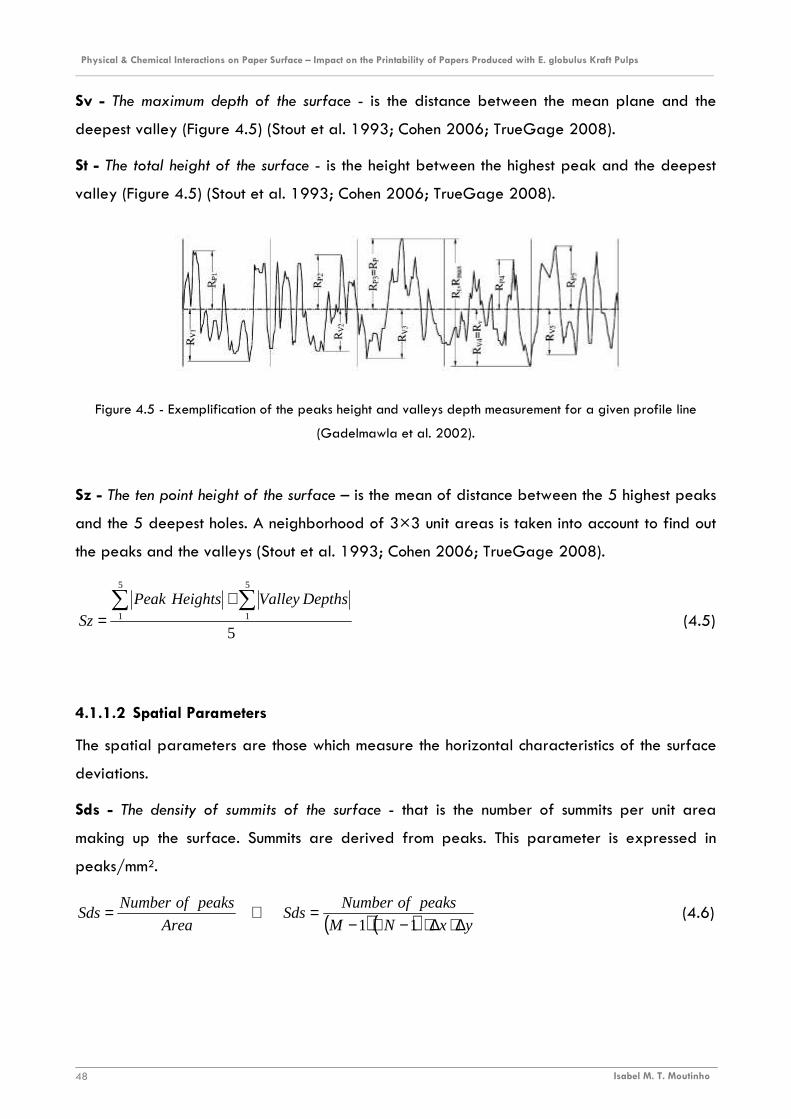
Physical & Chemical Interactions on Paper Surface – Impact on the Printability of Papers Produced with E. globulus Kraft Pulps ________________________________________________________________________________________________________________________
Isabel M. T. Moutinho 48
Sv - The maximum depth of the surface - is the distance between the mean plane and the
deepest valley (Figure 4.5) (Stout et al. 1993; Cohen 2006; TrueGage 2008).
St - The total height of the surface - is the height between the highest peak and the deepest
valley (Figure 4.5) (Stout et al. 1993; Cohen 2006; TrueGage 2008).
Figure 4.5 - Exemplification of the peaks height and valleys depth measurement for a given profile line
(Gadelmawla et al. 2002).
Sz - The ten point height of the surface – is the mean of distance between the 5 highest peaks
and the 5 deepest holes. A neighborhood of 3×3 unit areas is taken into account to find out
the peaks and the valleys (Stout et al. 1993; Cohen 2006; TrueGage 2008).
5
5
1
5
1∑∑ +
=DepthsValleyHeightsPeak
Sz (4.5)
4.1.1.2 Spatial Parameters
The spatial parameters are those which measure the horizontal characteristics of the surface
deviations.
Sds - The density of summits of the surface - that is the number of summits per unit area
making up the surface. Summits are derived from peaks. This parameter is expressed in
peaks/mm2.
( ) ( ) yxNM
peaksofNumberSds
Area
peaksofNumberSds
∆⋅∆⋅−⋅−=⇔=
11 (4.6)

Physical & Chemical Interactions on Paper Surface – Impact on the Printability of Papers Produced with E. globulus Kraft Pulps ________________________________________________________________________________________________________________________
Isabel M. T. Moutinho 49
Figure 4.6 – Example of a surface with an Sds value of 2600 peacks/mm2 (Cohen 2006).
Peaks are constrained to being separated by at least 1% of the minimum “x” or “y”
dimension comprising the 3D measurement areas. Additionally, summits are only found above
a threshold that is 5% of Sz above the mean plane (Figure 4.7) (Bastos 2004; Cohen 2006;
TrueGage 2008).
Figure 4.7 – Exemplification of the summits identification (Cohen 2006).
Str - The texture aspect ratio of the surface, is a measure of the spatial isotropy or directionality
of the surface texture. This parameter has a value between 0 and 1. If the value is near 1,
the surface is isotropic, i.e. has the same characteristics in all directions. If the value is near 0,
the surface is anisotropic, i.e. has an oriented and/or periodical structure (Stout et al. 1993;
Bastos 2004; Cohen 2006; TrueGage 2008).
( )( )( )( ) 10,
min
max
22
22
≤<+
+=⇔= StrStr
directionanyindecayslowestofLenght
directionanyindecayfastestofLenghtStr
yx
yx
ττ
ττ (4.7)
4.1.1.3 Hybrid Parameters
Hybrid parameters are a class of surface parameters characterized by depending both on
amplitude and spacing, such as slopes, curvatures, etc.
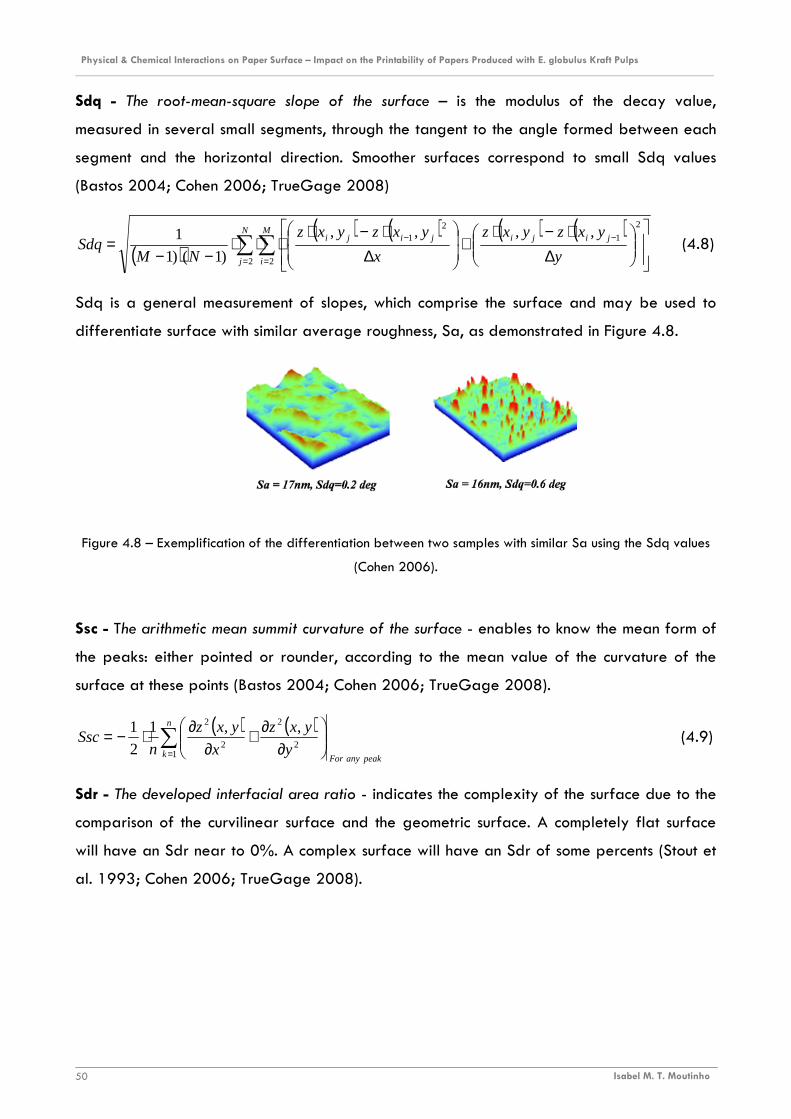
Physical & Chemical Interactions on Paper Surface – Impact on the Printability of Papers Produced with E. globulus Kraft Pulps ________________________________________________________________________________________________________________________
Isabel M. T. Moutinho 50
Sdq - The root-mean-square slope of the surface – is the modulus of the decay value,
measured in several small segments, through the tangent to the angle formed between each
segment and the horizontal direction. Smoother surfaces correspond to small Sdq values
(Bastos 2004; Cohen 2006; TrueGage 2008)
( )( ) ( ) ( ) ( )
∆⋅−⋅
+
∆⋅−⋅
⋅⋅⋅−−
= −−
==∑∑
2
12
1
22
,,,,
)1()1
1
y
yxzyxz
x
yxzyxz
NMSdq jijijiji
M
i
N
j
(4.8)
Sdq is a general measurement of slopes, which comprise the surface and may be used to
differentiate surface with similar average roughness, Sa, as demonstrated in Figure 4.8.
Figure 4.8 – Exemplification of the differentiation between two samples with similar Sa using the Sdq values
(Cohen 2006).
Ssc - The arithmetic mean summit curvature of the surface - enables to know the mean form of
the peaks: either pointed or rounder, according to the mean value of the curvature of the
surface at these points (Bastos 2004; Cohen 2006; TrueGage 2008).
( ) ( )peakanyFor
n
k y
yxz
x
yxz
nSsc ∑
=
∂∂+
∂∂⋅−=
12
2
2
2 ,,1
2
1 (4.9)
Sdr - The developed interfacial area ratio - indicates the complexity of the surface due to the
comparison of the curvilinear surface and the geometric surface. A completely flat surface
will have an Sdr near to 0%. A complex surface will have an Sdr of some percents (Stout et
al. 1993; Cohen 2006; TrueGage 2008).
Physical & Chemical Interactions on Paper Surface – Impact on the Printability of Papers Produced with E. globulus Kraft Pulps ________________________________________________________________________________________________________________________
Isabel M. T. Moutinho 51
( ) ( )
( ) ( ) 10011
11
100sec
)sec()(
1
1
1
1 ×∆⋅∆⋅−⋅−
∆⋅∆⋅−⋅−−=⇔
⇔×−=
∑∑−
=
−
=
yxNM
yxNMA
Sdr
areationalCross
areationalCrossareasurfaceTextureSdr
M
iij
N
j
(4.10)
Where, ( ) ( )( )[ ] ( ) ( )( )[ ]( ) ( )( )[ ] ( ) ( )( )[ ]
⋅−⋅+∆+⋅−⋅+∆⋅
⋅
⋅−⋅+∆+⋅−⋅+∆=
++++
++++
21
2111
221
21
2
21
2111
221
21
2
,,,,
,,,,
4
1
jijijiji
jijijiji
ij
yxzyxzxyxzyxzx
yxzyxzyyxzyxzy
A
Sdr may further differentiate surfaces of similar amplitudes and average roughness.
Typically Sdr will increase with the spatial intricacy of the texture whether or not Sa changes.
Sdr is useful in applications involving surface coatings and adhesion.
4.1.2 ROUGHNESS MEASUREMENT TECHNIQUES AND EQUIPMENTS
The techniques for paper roughness measurement can be classified in two categories. One
type of measurement simulates the printing process under pressure, and the other, called
profilometry, determines an effective three-dimensional (3D) surface profile (Barros 2004;
Ashori et al, 2008).
Air-leak methods, such as Bendtsen and Parker Print-Surf (PPS), were developed to simulate
printing pressure. Unfortunately air-leak meters have some drawbacks in paper surface
research. Because the total airflow volume is measured, no information is obtained about the
surface structure in detail. In other words, traditional surface roughness assessing instruments
give average numbers for the measured area but do not provide any detailed description of
the paper surface. This makes such instruments less suitable for revealing details of the
surface treatments effect (Barros 2004; Ashori et al, 2008).
As for the determination of the three-dimensional (3D) surface profile, its purpose is to
present a surface profile under room conditions as accurately as possible. There are two
types of methods to perform profilometry measurements: Contacting methods (Stylus
profilometry) and non-contacting methods (Optical profilometry). Laser and electron
microscopy can also be applied for profilometry measurements, embracing both contacting
and non-contacting methods (Barros 2004; Ashori et al 2008).

Physical & Chemical Interactions on Paper Surface – Impact on the Printability of Papers Produced with E. globulus Kraft Pulps ________________________________________________________________________________________________________________________
Isabel M. T. Moutinho 52
The Stylus instruments (Figure 4.9) are easily described as a mechanical instrument that
contacts with the surface under analysis and profiles it by following the surface details as
accurately as possible. These instruments can have several configurations, particularly in what
concerns to the tip that touches the surface. Its simplicity, however, is associated to several
limitations: on one hand, since the instrument touches the surface, there is the risk of damaging
it. On the other hand, since the stylus is an artifact of finite dimensions, it sometimes fails to
follow peaks and valleys faithfully and produces a distorted record of the surface. The
“traced profile” (ISO 3274, 1996) recorded by the Stylus instrument is the locus of the centre
of the stylus, thus, if the contacting portion of the stylus is assumed to be spherical in section,
the radius of curvature of a peak may be exaggerated, while the valley may be
represented as a cusp (Thomas, 1998; Barros 2004).
Figure 4.9 - Principle of a contacting stylus instrument profilometer: A cantilever (1) is holding a small tip (2)
that is sliding along the horizontal direction (3) over the object's surface (5). Following the profile the
cantilever is moving vertically (4). The vertical position is recorded as the measured profile (6) shown in light
green.
The optical instruments used to access surface roughness are based in the simple principle
that when electromagnetic radiation is incident on a rough surface a portion of its energy,
depending on the local physical properties of the surface, will be reflected and the reflected
beam will carry information about the roughness (Thomas, 1998). The radiation may be
reflected either specularly or diffusely or both (Figure 4.10). Reflection is totally specular
when the angle of reflection is equal to the angle of incidence (Snell’s law), and a surface
that reflects radiation in this manner is said to be smooth. Reflection is totally diffuse when
the energy in the incident beam is distributed in all directions (Barros 2004; Thomas, 1998).
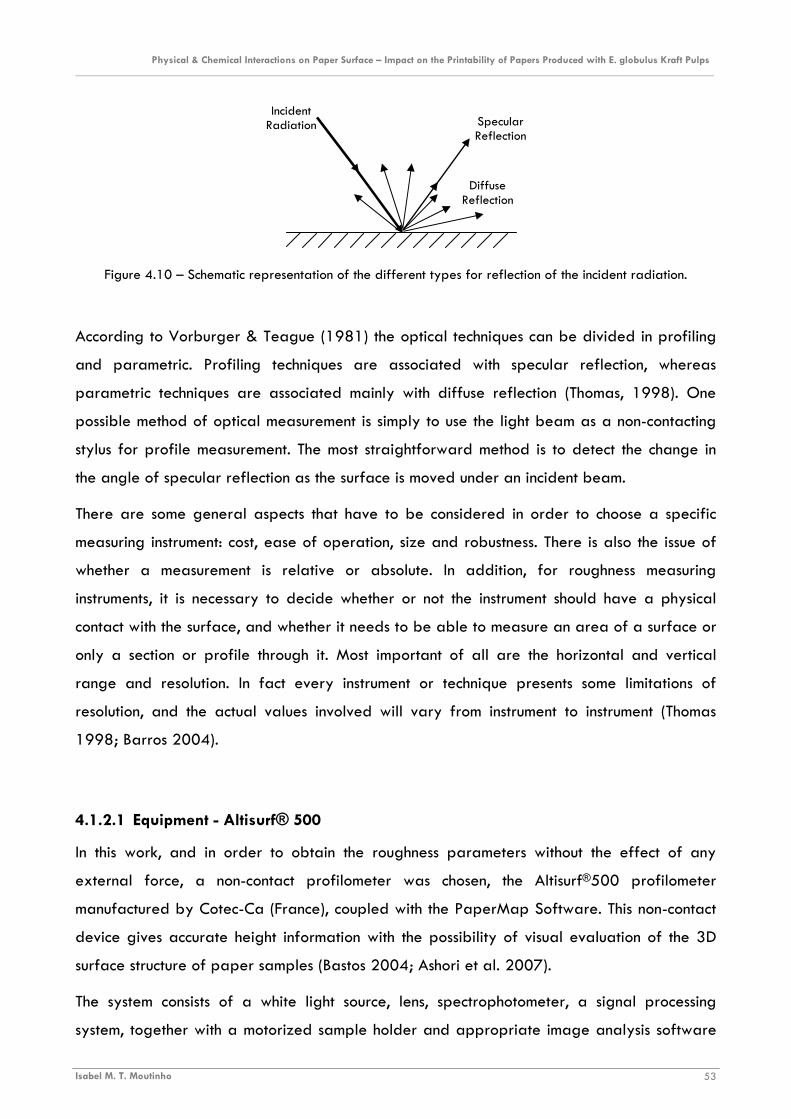
Physical & Chemical Interactions on Paper Surface – Impact on the Printability of Papers Produced with E. globulus Kraft Pulps ________________________________________________________________________________________________________________________
Isabel M. T. Moutinho 53
Incident Radiation Specular
Reflection
Diffuse Reflection
Figure 4.10 – Schematic representation of the different types for reflection of the incident radiation.
According to Vorburger & Teague (1981) the optical techniques can be divided in profiling
and parametric. Profiling techniques are associated with specular reflection, whereas
parametric techniques are associated mainly with diffuse reflection (Thomas, 1998). One
possible method of optical measurement is simply to use the light beam as a non-contacting
stylus for profile measurement. The most straightforward method is to detect the change in
the angle of specular reflection as the surface is moved under an incident beam.
There are some general aspects that have to be considered in order to choose a specific
measuring instrument: cost, ease of operation, size and robustness. There is also the issue of
whether a measurement is relative or absolute. In addition, for roughness measuring
instruments, it is necessary to decide whether or not the instrument should have a physical
contact with the surface, and whether it needs to be able to measure an area of a surface or
only a section or profile through it. Most important of all are the horizontal and vertical
range and resolution. In fact every instrument or technique presents some limitations of
resolution, and the actual values involved will vary from instrument to instrument (Thomas
1998; Barros 2004).
4.1.2.1 Equipment - Altisurf® 500
In this work, and in order to obtain the roughness parameters without the effect of any
external force, a non-contact profilometer was chosen, the Altisurf®500 profilometer
manufactured by Cotec-Ca (France), coupled with the PaperMap Software. This non-contact
device gives accurate height information with the possibility of visual evaluation of the 3D
surface structure of paper samples (Bastos 2004; Ashori et al. 2007).
The system consists of a white light source, lens, spectrophotometer, a signal processing
system, together with a motorized sample holder and appropriate image analysis software
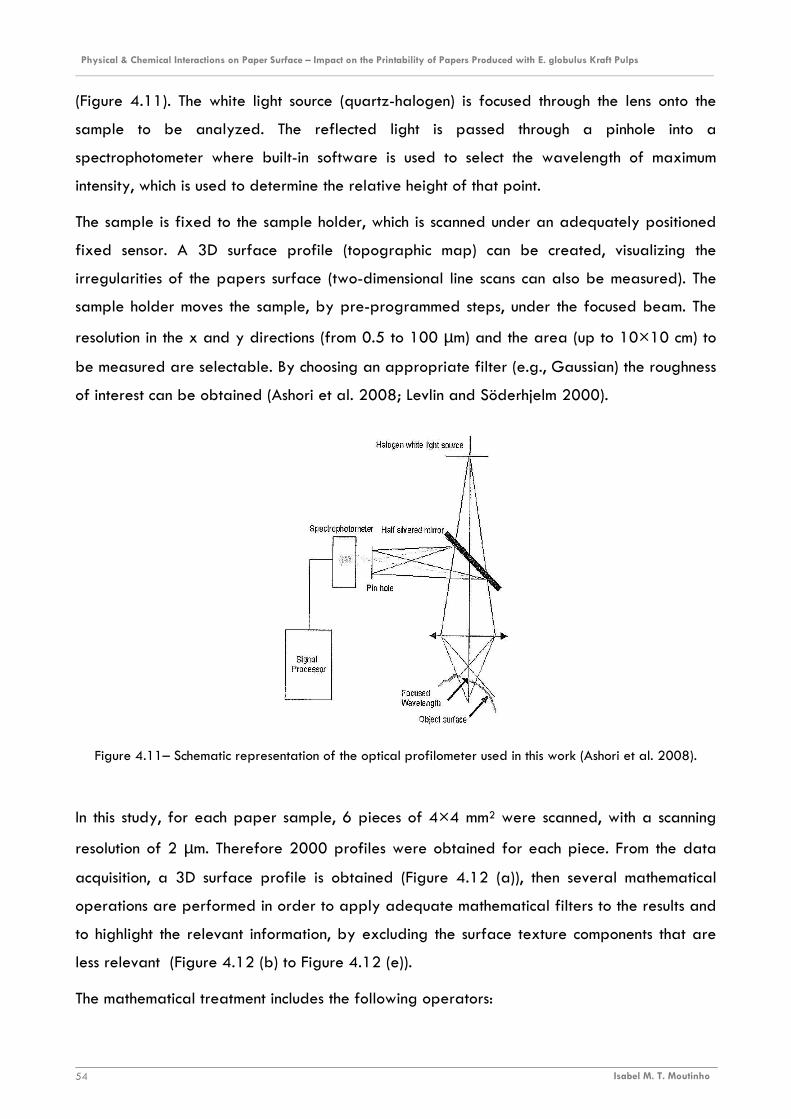
Physical & Chemical Interactions on Paper Surface – Impact on the Printability of Papers Produced with E. globulus Kraft Pulps ________________________________________________________________________________________________________________________
Isabel M. T. Moutinho 54
(Figure 4.11). The white light source (quartz-halogen) is focused through the lens onto the
sample to be analyzed. The reflected light is passed through a pinhole into a
spectrophotometer where built-in software is used to select the wavelength of maximum
intensity, which is used to determine the relative height of that point.
The sample is fixed to the sample holder, which is scanned under an adequately positioned
fixed sensor. A 3D surface profile (topographic map) can be created, visualizing the
irregularities of the papers surface (two-dimensional line scans can also be measured). The
sample holder moves the sample, by pre-programmed steps, under the focused beam. The
resolution in the x and y directions (from 0.5 to 100 µm) and the area (up to 10×10 cm) to
be measured are selectable. By choosing an appropriate filter (e.g., Gaussian) the roughness
of interest can be obtained (Ashori et al. 2008; Levlin and Söderhjelm 2000).
Figure 4.11– Schematic representation of the optical profilometer used in this work (Ashori et al. 2008).
In this study, for each paper sample, 6 pieces of 4×4 mm2 were scanned, with a scanning
resolution of 2 µm. Therefore 2000 profiles were obtained for each piece. From the data
acquisition, a 3D surface profile is obtained (Figure 4.12 (a)), then several mathematical
operations are performed in order to apply adequate mathematical filters to the results and
to highlight the relevant information, by excluding the surface texture components that are
less relevant (Figure 4.12 (b) to Figure 4.12 (e)).
The mathematical treatment includes the following operators:
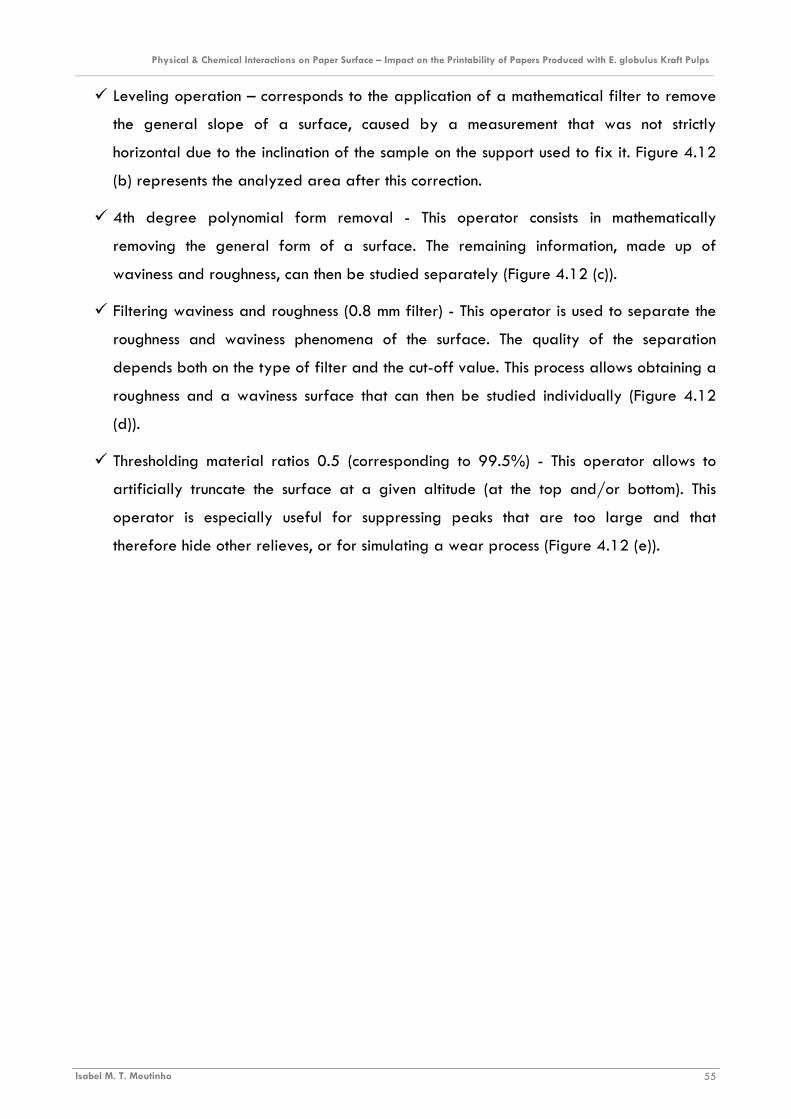
Physical & Chemical Interactions on Paper Surface – Impact on the Printability of Papers Produced with E. globulus Kraft Pulps ________________________________________________________________________________________________________________________
Isabel M. T. Moutinho 55
� Leveling operation – corresponds to the application of a mathematical filter to remove
the general slope of a surface, caused by a measurement that was not strictly
horizontal due to the inclination of the sample on the support used to fix it. Figure 4.12
(b) represents the analyzed area after this correction.
� 4th degree polynomial form removal - This operator consists in mathematically
removing the general form of a surface. The remaining information, made up of
waviness and roughness, can then be studied separately (Figure 4.12 (c)).
� Filtering waviness and roughness (0.8 mm filter) - This operator is used to separate the
roughness and waviness phenomena of the surface. The quality of the separation
depends both on the type of filter and the cut-off value. This process allows obtaining a
roughness and a waviness surface that can then be studied individually (Figure 4.12
(d)).
� Thresholding material ratios 0.5 (corresponding to 99.5%) - This operator allows to
artificially truncate the surface at a given altitude (at the top and/or bottom). This
operator is especially useful for suppressing peaks that are too large and that
therefore hide other relieves, or for simulating a wear process (Figure 4.12 (e)).
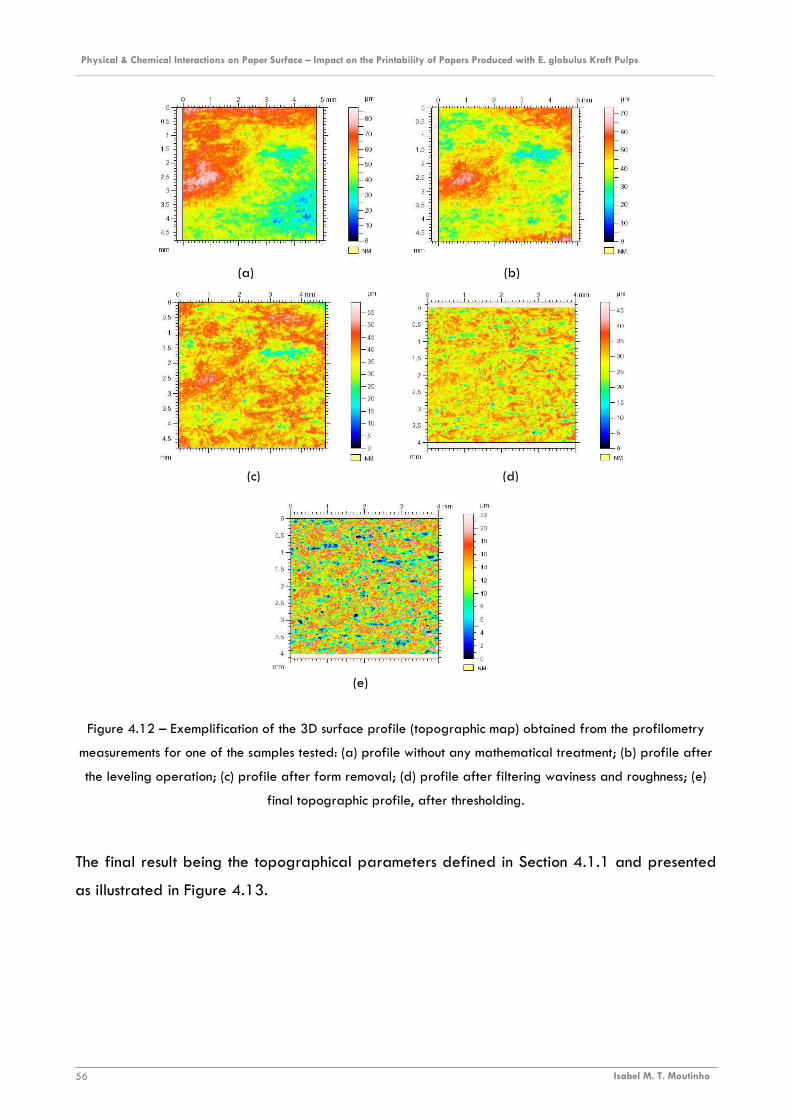
Physical & Chemical Interactions on Paper Surface – Impact on the Printability of Papers Produced with E. globulus Kraft Pulps ________________________________________________________________________________________________________________________
Isabel M. T. Moutinho 56
(e)
(a) (b)
(c) (d)
Figure 4.12 – Exemplification of the 3D surface profile (topographic map) obtained from the profilometry
measurements for one of the samples tested: (a) profile without any mathematical treatment; (b) profile after
the leveling operation; (c) profile after form removal; (d) profile after filtering waviness and roughness; (e)
final topographic profile, after thresholding.
The final result being the topographical parameters defined in Section 4.1.1 and presented
as illustrated in Figure 4.13.
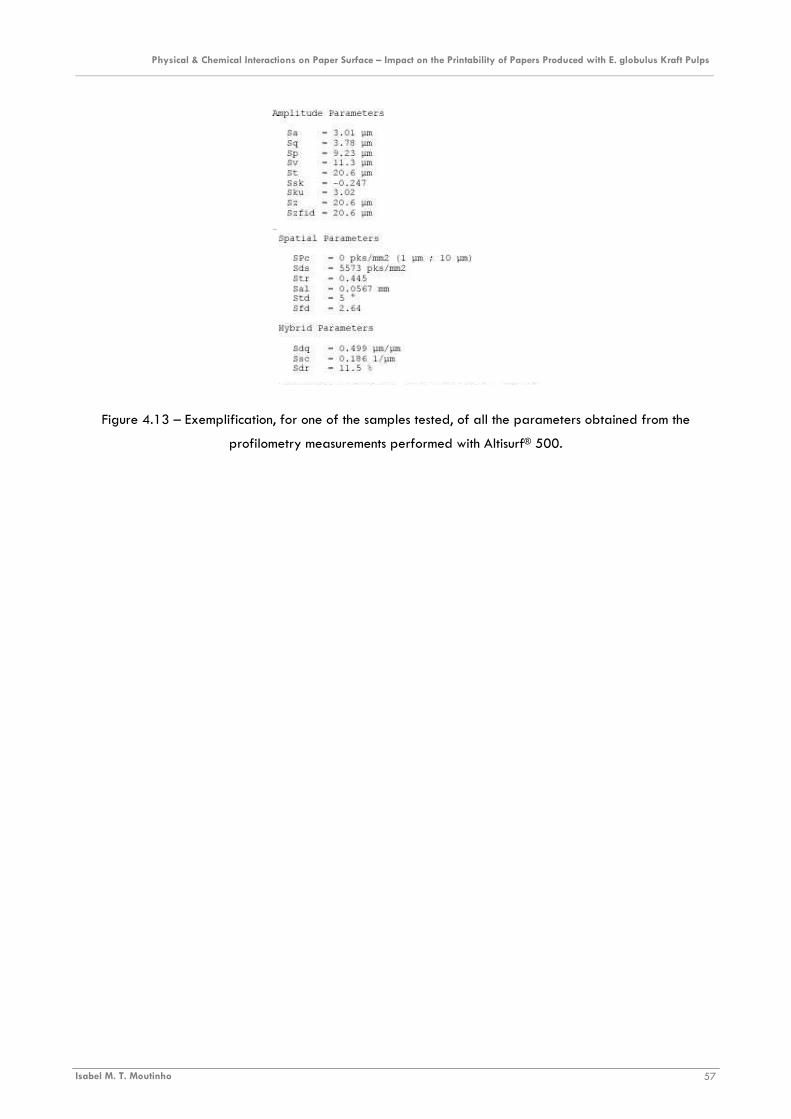
Physical & Chemical Interactions on Paper Surface – Impact on the Printability of Papers Produced with E. globulus Kraft Pulps ________________________________________________________________________________________________________________________
Isabel M. T. Moutinho 57
Figure 4.13 – Exemplification, for one of the samples tested, of all the parameters obtained from the
profilometry measurements performed with Altisurf® 500.
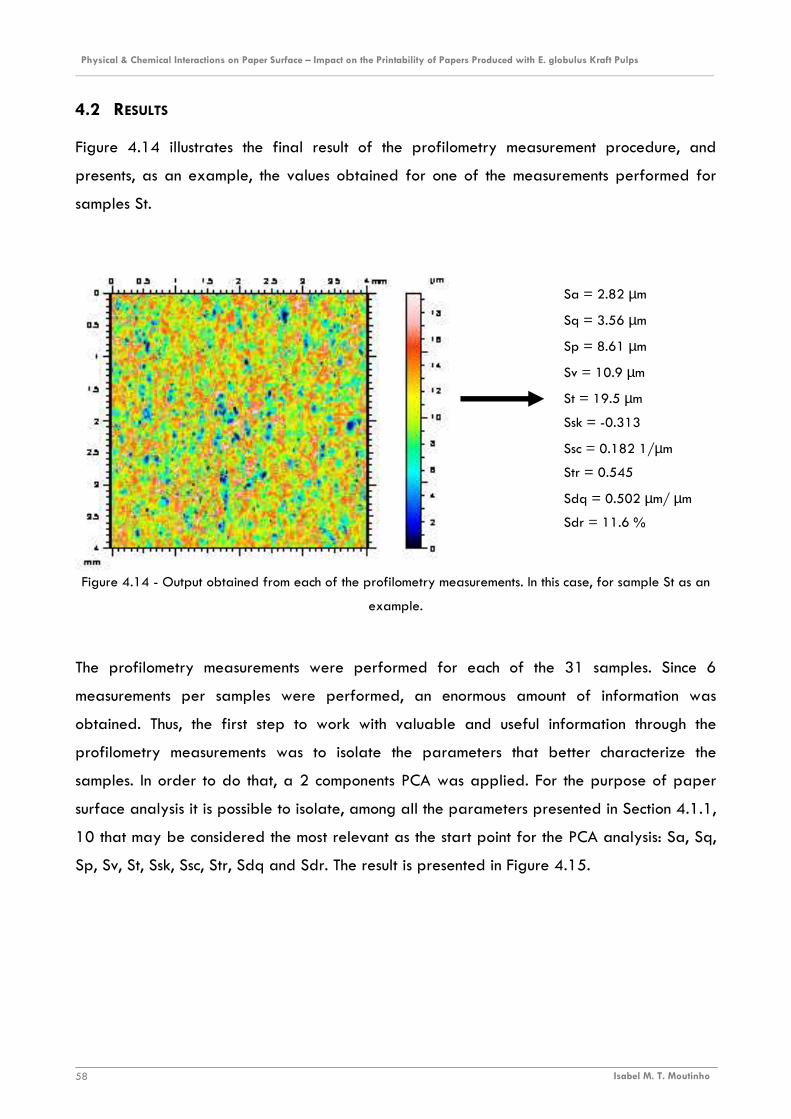
Physical & Chemical Interactions on Paper Surface – Impact on the Printability of Papers Produced with E. globulus Kraft Pulps ________________________________________________________________________________________________________________________
Isabel M. T. Moutinho 58
4.2 RESULTS
Figure 4.14 illustrates the final result of the profilometry measurement procedure, and
presents, as an example, the values obtained for one of the measurements performed for
samples St.
Figure 4.14 - Output obtained from each of the profilometry measurements. In this case, for sample St as an
example.
The profilometry measurements were performed for each of the 31 samples. Since 6
measurements per samples were performed, an enormous amount of information was
obtained. Thus, the first step to work with valuable and useful information through the
profilometry measurements was to isolate the parameters that better characterize the
samples. In order to do that, a 2 components PCA was applied. For the purpose of paper
surface analysis it is possible to isolate, among all the parameters presented in Section 4.1.1,
10 that may be considered the most relevant as the start point for the PCA analysis: Sa, Sq,
Sp, Sv, St, Ssk, Ssc, Str, Sdq and Sdr. The result is presented in Figure 4.15.
Sa = 2.82 µm
Sq = 3.56 µm
Sp = 8.61 µm
Sv = 10.9 µm
St = 19.5 µm
Ssk = -0.313
Ssc = 0.182 1/µm
Str = 0.545
Sdq = 0.502 µm/ µm
Sdr = 11.6 %
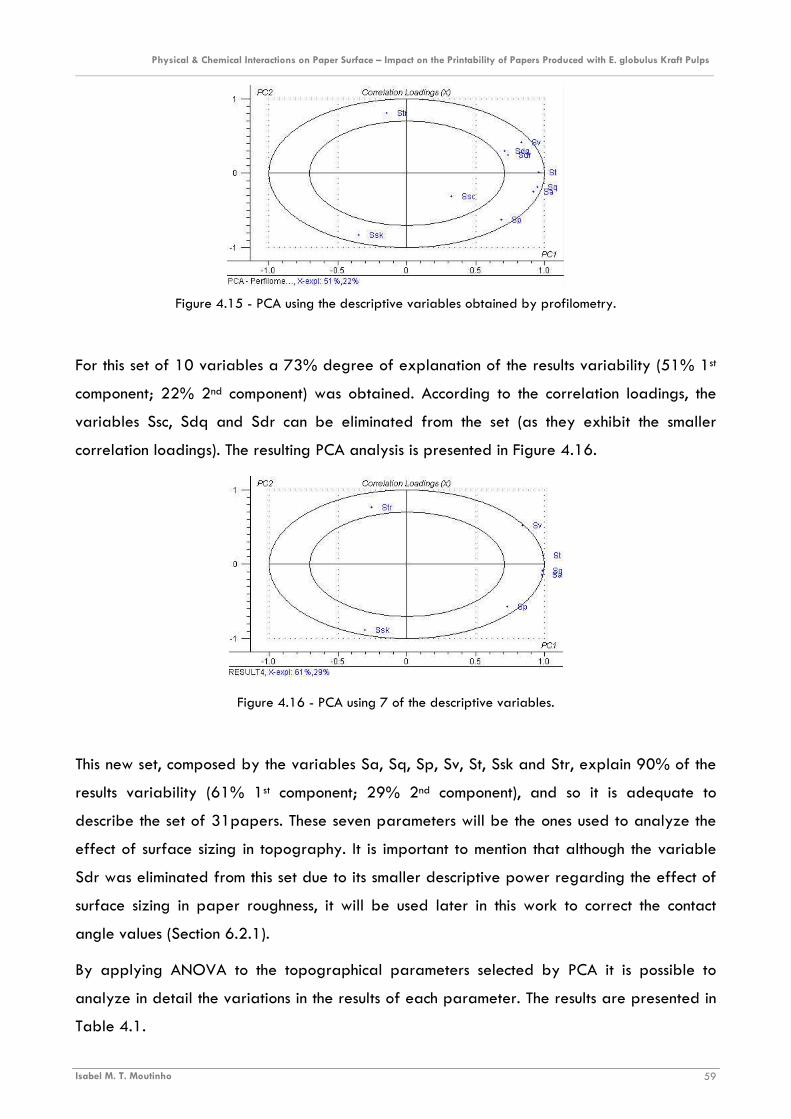
Physical & Chemical Interactions on Paper Surface – Impact on the Printability of Papers Produced with E. globulus Kraft Pulps ________________________________________________________________________________________________________________________
Isabel M. T. Moutinho 59
Figure 4.15 - PCA using the descriptive variables obtained by profilometry.
For this set of 10 variables a 73% degree of explanation of the results variability (51% 1st
component; 22% 2nd component) was obtained. According to the correlation loadings, the
variables Ssc, Sdq and Sdr can be eliminated from the set (as they exhibit the smaller
correlation loadings). The resulting PCA analysis is presented in Figure 4.16.
Figure 4.16 - PCA using 7 of the descriptive variables.
This new set, composed by the variables Sa, Sq, Sp, Sv, St, Ssk and Str, explain 90% of the
results variability (61% 1st component; 29% 2nd component), and so it is adequate to
describe the set of 31papers. These seven parameters will be the ones used to analyze the
effect of surface sizing in topography. It is important to mention that although the variable
Sdr was eliminated from this set due to its smaller descriptive power regarding the effect of
surface sizing in paper roughness, it will be used later in this work to correct the contact
angle values (Section 6.2.1).
By applying ANOVA to the topographical parameters selected by PCA it is possible to
analyze in detail the variations in the results of each parameter. The results are presented in
Table 4.1.
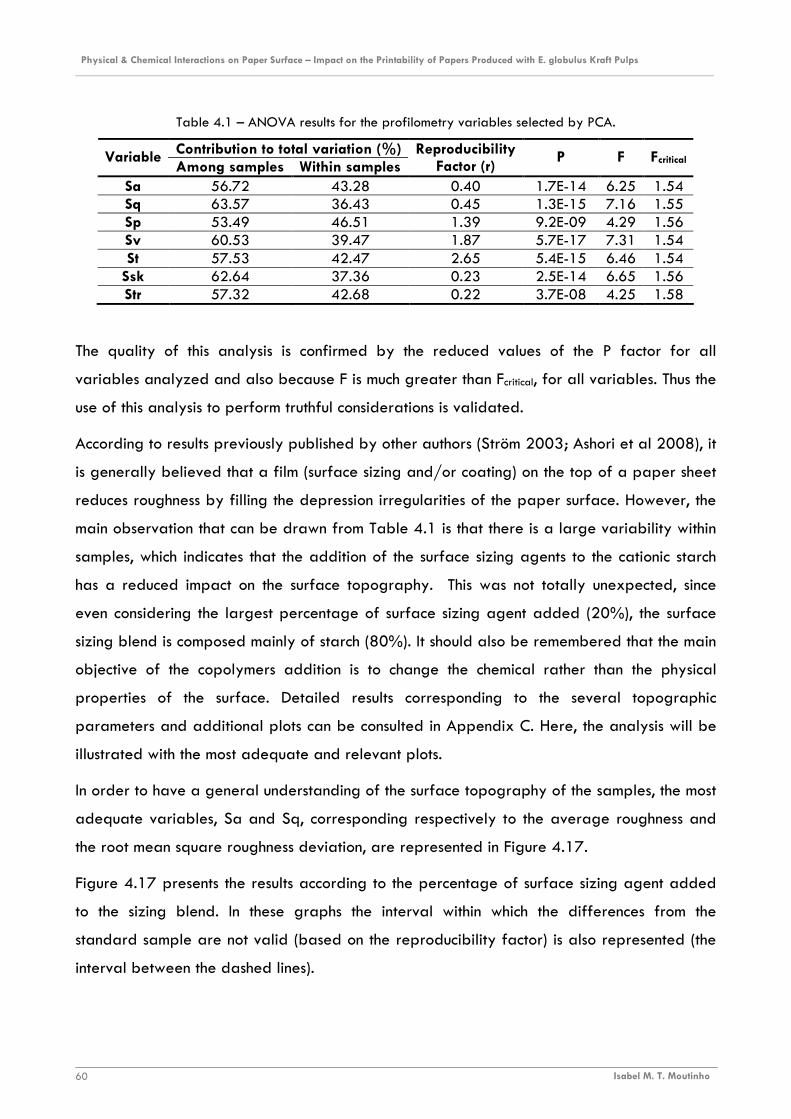
Physical & Chemical Interactions on Paper Surface – Impact on the Printability of Papers Produced with E. globulus Kraft Pulps ________________________________________________________________________________________________________________________
Isabel M. T. Moutinho 60
Table 4.1 – ANOVA results for the profilometry variables selected by PCA.
Contribution to total variation (%) Variable Among samples Within samples
Reproducibility Factor (r)
P F Fcritical
Sa 56.72 43.28 0.40 1.7E-14 6.25 1.54 Sq 63.57 36.43 0.45 1.3E-15 7.16 1.55 Sp 53.49 46.51 1.39 9.2E-09 4.29 1.56 Sv 60.53 39.47 1.87 5.7E-17 7.31 1.54 St 57.53 42.47 2.65 5.4E-15 6.46 1.54
Ssk 62.64 37.36 0.23 2.5E-14 6.65 1.56 Str 57.32 42.68 0.22 3.7E-08 4.25 1.58
The quality of this analysis is confirmed by the reduced values of the P factor for all
variables analyzed and also because F is much greater than Fcritical, for all variables. Thus the
use of this analysis to perform truthful considerations is validated.
According to results previously published by other authors (Ström 2003; Ashori et al 2008), it
is generally believed that a film (surface sizing and/or coating) on the top of a paper sheet
reduces roughness by filling the depression irregularities of the paper surface. However, the
main observation that can be drawn from Table 4.1 is that there is a large variability within
samples, which indicates that the addition of the surface sizing agents to the cationic starch
has a reduced impact on the surface topography. This was not totally unexpected, since
even considering the largest percentage of surface sizing agent added (20%), the surface
sizing blend is composed mainly of starch (80%). It should also be remembered that the main
objective of the copolymers addition is to change the chemical rather than the physical
properties of the surface. Detailed results corresponding to the several topographic
parameters and additional plots can be consulted in Appendix C. Here, the analysis will be
illustrated with the most adequate and relevant plots.
In order to have a general understanding of the surface topography of the samples, the most
adequate variables, Sa and Sq, corresponding respectively to the average roughness and
the root mean square roughness deviation, are represented in Figure 4.17.
Figure 4.17 presents the results according to the percentage of surface sizing agent added
to the sizing blend. In these graphs the interval within which the differences from the
standard sample are not valid (based on the reproducibility factor) is also represented (the
interval between the dashed lines).
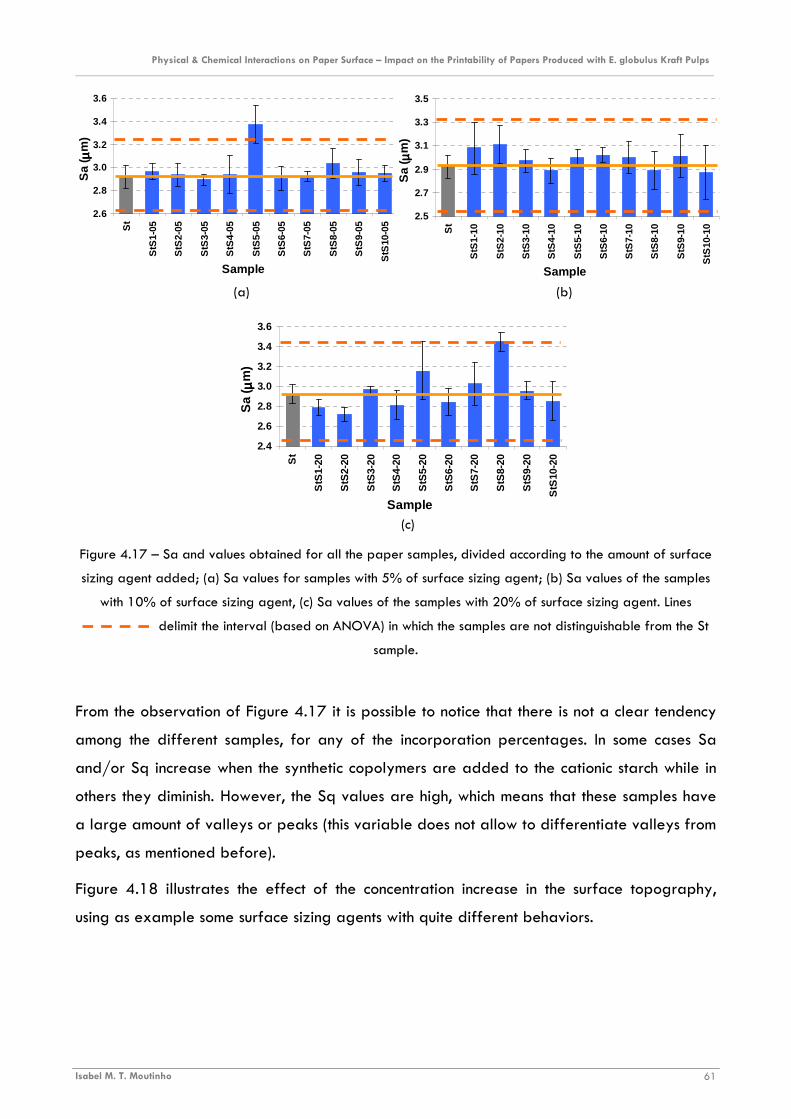
Physical & Chemical Interactions on Paper Surface – Impact on the Printability of Papers Produced with E. globulus Kraft Pulps ________________________________________________________________________________________________________________________
Isabel M. T. Moutinho 61
2.6
2.8
3.0
3.2
3.4
3.6
St
StS
1-05
StS
2-05
StS
3-05
StS
4-05
StS
5-05
StS
6-05
StS
7-05
StS
8-05
StS
9-05
StS
10-0
5
Sample
Sa
( µµ µµm
)
2.5
2.7
2.9
3.1
3.3
3.5
St
StS
1-10
StS
2-10
StS
3-10
StS
4-10
StS
5-10
StS
6-10
StS
7-10
StS
8-10
StS
9-10
StS
10-1
0
Sample
Sa
( µµ µµm
)
(a) (b)
2.4
2.6
2.8
3.0
3.2
3.4
3.6
St
StS
1-20
StS
2-20
StS
3-20
StS
4-20
StS
5-20
StS
6-20
StS
7-20
StS
8-20
StS
9-20
StS
10-2
0
Sample
Sa
( µµ µµm
)
(c)
Figure 4.17 – Sa and values obtained for all the paper samples, divided according to the amount of surface
sizing agent added; (a) Sa values for samples with 5% of surface sizing agent; (b) Sa values of the samples
with 10% of surface sizing agent, (c) Sa values of the samples with 20% of surface sizing agent. Lines
delimit the interval (based on ANOVA) in which the samples are not distinguishable from the St
sample.
From the observation of Figure 4.17 it is possible to notice that there is not a clear tendency
among the different samples, for any of the incorporation percentages. In some cases Sa
and/or Sq increase when the synthetic copolymers are added to the cationic starch while in
others they diminish. However, the Sq values are high, which means that these samples have
a large amount of valleys or peaks (this variable does not allow to differentiate valleys from
peaks, as mentioned before).
Figure 4.18 illustrates the effect of the concentration increase in the surface topography,
using as example some surface sizing agents with quite different behaviors.
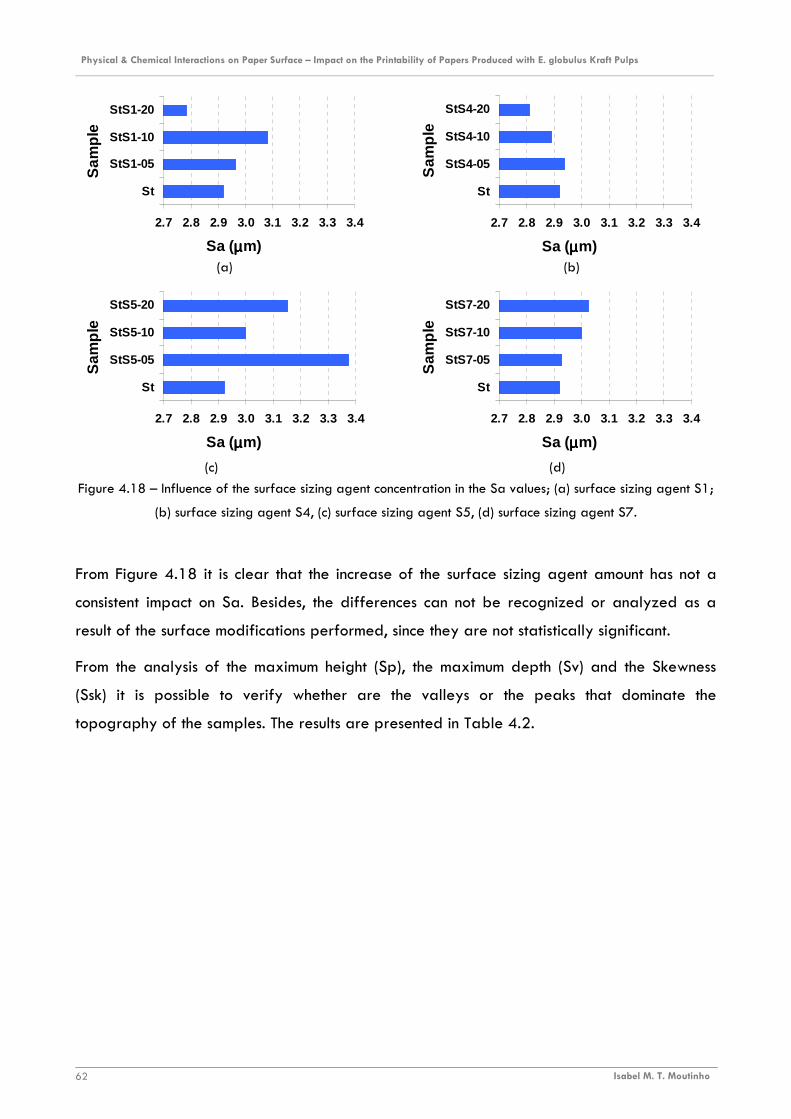
Physical & Chemical Interactions on Paper Surface – Impact on the Printability of Papers Produced with E. globulus Kraft Pulps ________________________________________________________________________________________________________________________
Isabel M. T. Moutinho 62
Figure 4.18 – Influence of the surface sizing agent concentration in the Sa values; (a) surface sizing agent S1;
(b) surface sizing agent S4, (c) surface sizing agent S5, (d) surface sizing agent S7.
From Figure 4.18 it is clear that the increase of the surface sizing agent amount has not a
consistent impact on Sa. Besides, the differences can not be recognized or analyzed as a
result of the surface modifications performed, since they are not statistically significant.
From the analysis of the maximum height (Sp), the maximum depth (Sv) and the Skewness
(Ssk) it is possible to verify whether are the valleys or the peaks that dominate the
topography of the samples. The results are presented in Table 4.2.
(a) (b)
2.7 2.8 2.9 3.0 3.1 3.2 3.3 3.4
St
StS1-05
StS1-10
StS1-20S
ampl
e
Sa (µµµµm)
2.7 2.8 2.9 3.0 3.1 3.2 3.3 3.4
St
StS4-05
StS4-10
StS4-20
Sam
ple
Sa (µµµµm)
(c) (d)
2.7 2.8 2.9 3.0 3.1 3.2 3.3 3.4
St
StS5-05
StS5-10
StS5-20
Sam
ple
Sa (µµµµm)
2.7 2.8 2.9 3.0 3.1 3.2 3.3 3.4
St
StS7-05
StS7-10
StS7-20
Sam
ple
Sa (µµµµm)
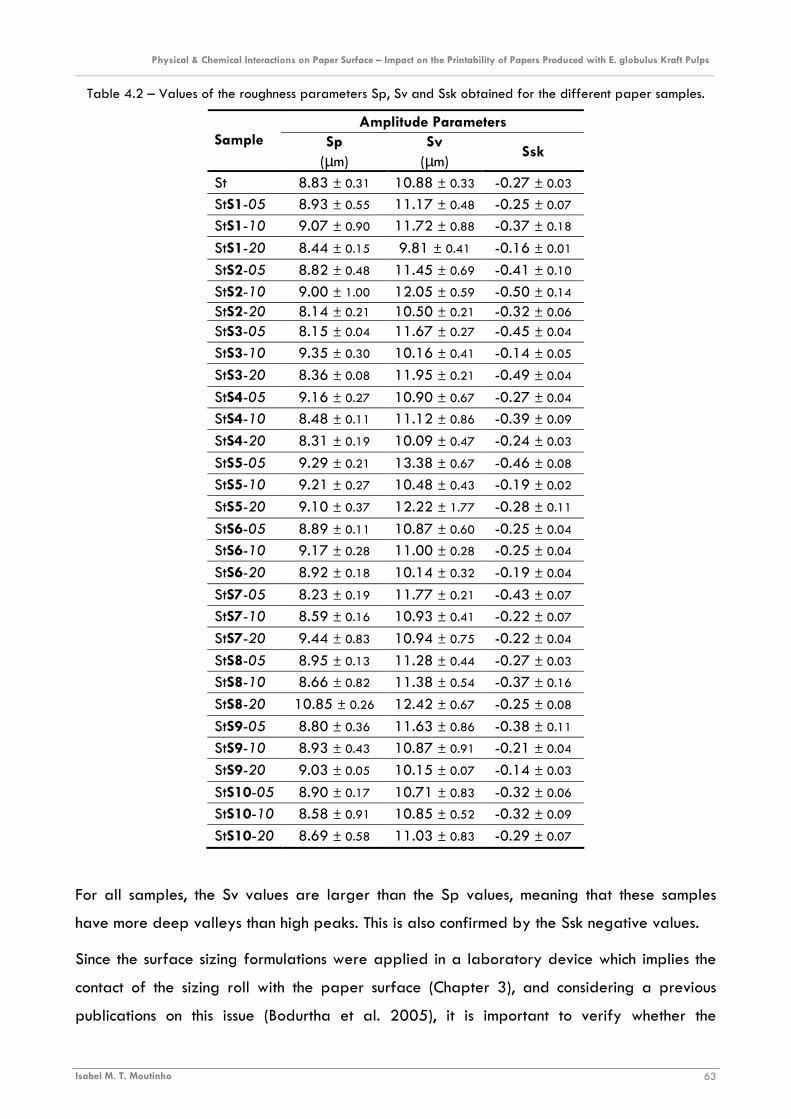
Physical & Chemical Interactions on Paper Surface – Impact on the Printability of Papers Produced with E. globulus Kraft Pulps ________________________________________________________________________________________________________________________
Isabel M. T. Moutinho 63
Table 4.2 – Values of the roughness parameters Sp, Sv and Ssk obtained for the different paper samples.
Amplitude Parameters Sample Sp
(µm) Sv
(µm) Ssk
St 8.83 ± 0.31 10.88 ± 0.33 -0.27 ± 0.03
StS1-05 8.93 ± 0.55 11.17 ± 0.48 -0.25 ± 0.07
StS1-10 9.07 ± 0.90 11.72 ± 0.88 -0.37 ± 0.18
StS1-20 8.44 ± 0.15 9.81 ± 0.41 -0.16 ± 0.01
StS2-05 8.82 ± 0.48 11.45 ± 0.69 -0.41 ± 0.10
StS2-10 9.00 ± 1.00 12.05 ± 0.59 -0.50 ± 0.14 StS2-20 8.14 ± 0.21 10.50 ± 0.21 -0.32 ± 0.06 StS3-05 8.15 ± 0.04 11.67 ± 0.27 -0.45 ± 0.04
StS3-10 9.35 ± 0.30 10.16 ± 0.41 -0.14 ± 0.05
StS3-20 8.36 ± 0.08 11.95 ± 0.21 -0.49 ± 0.04
StS4-05 9.16 ± 0.27 10.90 ± 0.67 -0.27 ± 0.04
StS4-10 8.48 ± 0.11 11.12 ± 0.86 -0.39 ± 0.09
StS4-20 8.31 ± 0.19 10.09 ± 0.47 -0.24 ± 0.03
StS5-05 9.29 ± 0.21 13.38 ± 0.67 -0.46 ± 0.08
StS5-10 9.21 ± 0.27 10.48 ± 0.43 -0.19 ± 0.02
StS5-20 9.10 ± 0.37 12.22 ± 1.77 -0.28 ± 0.11
StS6-05 8.89 ± 0.11 10.87 ± 0.60 -0.25 ± 0.04
StS6-10 9.17 ± 0.28 11.00 ± 0.28 -0.25 ± 0.04
StS6-20 8.92 ± 0.18 10.14 ± 0.32 -0.19 ± 0.04
StS7-05 8.23 ± 0.19 11.77 ± 0.21 -0.43 ± 0.07
StS7-10 8.59 ± 0.16 10.93 ± 0.41 -0.22 ± 0.07
StS7-20 9.44 ± 0.83 10.94 ± 0.75 -0.22 ± 0.04
StS8-05 8.95 ± 0.13 11.28 ± 0.44 -0.27 ± 0.03
StS8-10 8.66 ± 0.82 11.38 ± 0.54 -0.37 ± 0.16
StS8-20 10.85 ± 0.26 12.42 ± 0.67 -0.25 ± 0.08
StS9-05 8.80 ± 0.36 11.63 ± 0.86 -0.38 ± 0.11
StS9-10 8.93 ± 0.43 10.87 ± 0.91 -0.21 ± 0.04
StS9-20 9.03 ± 0.05 10.15 ± 0.07 -0.14 ± 0.03
StS10-05 8.90 ± 0.17 10.71 ± 0.83 -0.32 ± 0.06
StS10-10 8.58 ± 0.91 10.85 ± 0.52 -0.32 ± 0.09
StS10-20 8.69 ± 0.58 11.03 ± 0.83 -0.29 ± 0.07
For all samples, the Sv values are larger than the Sp values, meaning that these samples
have more deep valleys than high peaks. This is also confirmed by the Ssk negative values.
Since the surface sizing formulations were applied in a laboratory device which implies the
contact of the sizing roll with the paper surface (Chapter 3), and considering a previous
publications on this issue (Bodurtha et al. 2005), it is important to verify whether the

Physical & Chemical Interactions on Paper Surface – Impact on the Printability of Papers Produced with E. globulus Kraft Pulps ________________________________________________________________________________________________________________________
Isabel M. T. Moutinho 64
0.0
0.2
0.4
0.6
0.8
1.0
St
StS
1-05
StS
1-10
StS
1-20
StS
2-05
StS
2-10
StS
2-20
StS
3-05
StS
3-10
StS
3-20
StS
4-05
StS
4-10
StS
4-20
StS
5-05
StS
5-10
StS
5-20
StS
6-05
StS
6-10
StS
6-20
StS
7-05
StS
7-10
StS
7-20
StS
8-05
StS
8-10
StS
8-20
StS
9-05
StS
9-10
StS
9-20
StS
10-0
5
StS
10-1
0
StS
10-2
0
Sample
Str
Str
application process induces directionality in the surface of the paper samples. For that the
texture aspect ratio of the surface, evaluated by the topographic parameter Str, must be
analyzed. From the values of Str presented in Figure 4.19 it is possible to confirm that the
paper surfaces exhibit a certain degree of anisotropy, since the Str values are mostly
inferior to 0.5. However this anisotropy is not significant since the values are not too close to
0.
Figure 4.19 – Str values obtained for all the samples.
Despite the impossibility of detailed comparisons between all the samples using the
profilometry results, due to the little differences and the lack of statistical significance, some
general characteristics of the physical properties of these paper samples can be underlined.
The addition of the synthetic surface sizing agents changes the values of the topographical
parameters, but not significantly. The surfaces are moderately rougher with a large
predominance of valleys over peaks, and without any significant anisotropy.
The topographical characteristics of the samples will certainly participate in the ink reception
process, but since they are identical to all samples, they will not respond for the differences
in terms of printing performance.
Thus, any eventual distinct impact of the various sizing agents will only be noticed on the
porous structure of the samples and/or on the chemical characteristics of the paper surface,
which will be analyzed in the next chapters.
CHAPTER 5
MERCURY POROSIMETRY

Physical & Chemical Interactions on Paper Surface – Impact on the Printability of Papers Produced with E. globulus Kraft Pulps ________________________________________________________________________________________________________________________
Isabel M. T. Moutinho 67
5 MERCURY POROSIMETRY
5.1 THEORY
The porosity of any type of material is defined as the ratio of the voids volume to the total
volume of the sample:
volumeSolidsvolumePore
volumePore
sampletheofvolumeTotal
voidsofVolumePorosity
+== (5.1)
Paper is a porous material made of a network of fibers with voids in between. Porosity is a
critical factor in all sorts of paper, from printing papers, filter papers, cigarette papers to
bag papers. In particular for P&W papers, porosity significantly affects opacity, bulk and
the ink reception process (Knauf and Doshi 1986; Johnson et al. 1999; Keskitalo 2000). In
fact, porosity indicates how paper will react to fluid penetration in coating, sizing and
printing operations. Additionally, porosity can also be an important factor in a vacuum
feeding operation of a printing press (Johnson et al. 1999)
5.1.1 MEASUREMENT TECHNIQUES
Although easy to define, paper porosity is hard to measure accurately and several
techniques can be employed to quantify the volume of voids, whose values greatly depend
upon the method and the conditions used (Knauf and Doshi 1986; Murakami and Imamura
1980). However, two types of procedures are frequently used for paper porosity
determination: the air resistance and air permeability methods and the methods involving
volume or density measurements (Chinga and Helle 2002a; Bordurtha et al. 2005).
The air resistance and air permeability methods are both based on the resistance to the
passage of air offered by the paper structure when a pressure difference exists between
the two sides of the paper. The air resistance is measured as the time for a given volume of
air to flow through a specimen under specified conditions, while the air permeability is
measured as the volume of air which flows through the paper for a given time interval,
following the Sheffield Method (described in TAPPI T 547) or the Gurley Method (detailed in
TAPPI T 460 and TAPPI T 536). Many papermakers rely upon Gurley Densometer tests to
evaluate the porous nature of paper. However, it has been shown that the volume fraction
available to flow (permeability) is not equal to porosity: papers can have the same
Physical & Chemical Interactions on Paper Surface – Impact on the Printability of Papers Produced with E. globulus Kraft Pulps ________________________________________________________________________________________________________________________
Isabel M. T. Moutinho 68
permeability but different porosities (Lindsay 1998; Lindsay 2000; Branton and Baker
2002).
The methods involving volume or density measurements include water saturation and
evaporation methods, nitrogen gas adsorption or mercury intrusion porosimetry (Johnson et
al. 1999; Alince et al. 2002).
Among these methods, mercury porosimetry has an increasing use for paper porosity
measurements, since it is able to characterize a wide range of pore sizes, from a few
hundred micrometers to a few nanometers and a distribution of the pore sizes is also
achieved (Alince et al. 2002).
5.1.1.1 Mercury Porosimetry
Mercury Porosimetry is based on the capillary law governing liquid penetration into small
pores. This law, in the case of cylindrical pores and non wetting liquids like mercury is
expressed by the Washburn equation (Knauf and Doshi 1986; Bordurtha et al. 2005):
θσ cos41 ⋅
−=P
D (5.2)
where D is the pore diameter, P is the applied pressure, σ the surface tension, and θ the
contact angle, all in consistent units. As this equation shows, the larger the pore size, the lower
the pressure needed to overcome the capillary forces. Therefore the pore-size distribution
can be measured by gradually increasing the pressure on a vessel (called penetrometer,
Figure 5.1) containing a piece of paper submerged in mercury and measuring the intake of
this by the paper after each increase of pressure. In this way a cumulative pore volume can
be determined as a function of the applied pressure (or pore diameter, inversely
proportional to pressure as described Washburn eq.), starting with the volume of the largest
pores. The output is the so called intrusion curve.
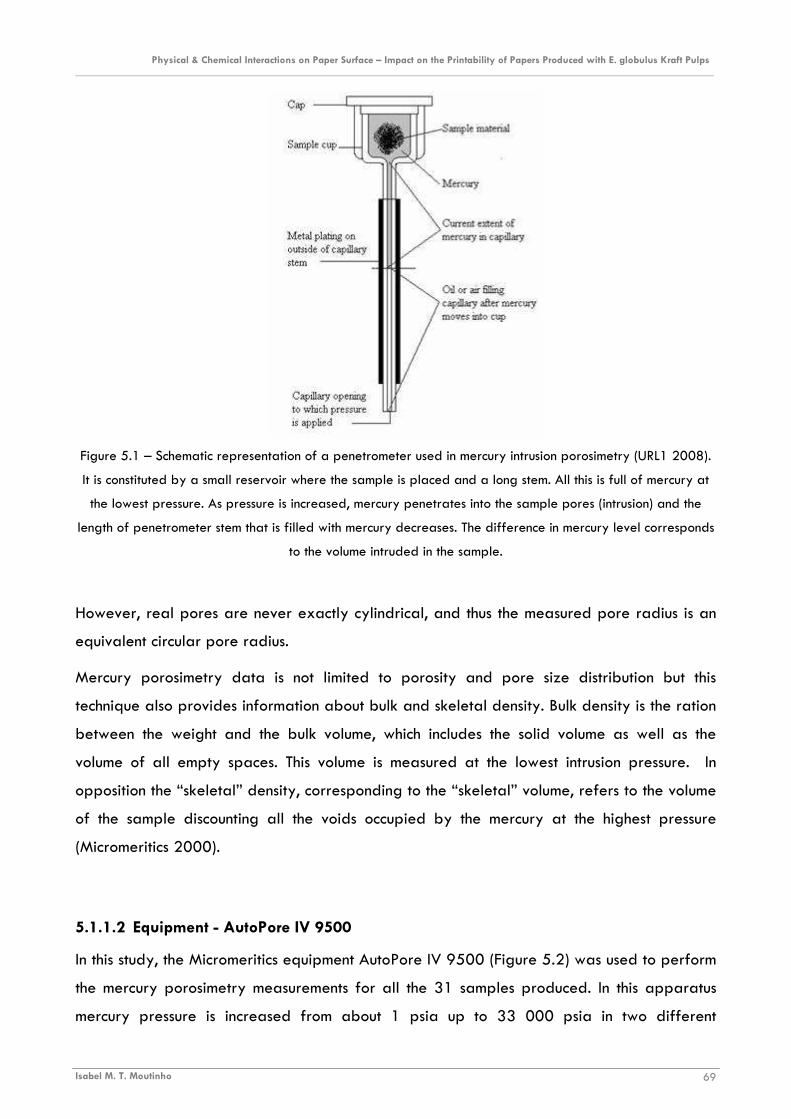
Physical & Chemical Interactions on Paper Surface – Impact on the Printability of Papers Produced with E. globulus Kraft Pulps ________________________________________________________________________________________________________________________
Isabel M. T. Moutinho 69
Figure 5.1 – Schematic representation of a penetrometer used in mercury intrusion porosimetry (URL1 2008).
It is constituted by a small reservoir where the sample is placed and a long stem. All this is full of mercury at
the lowest pressure. As pressure is increased, mercury penetrates into the sample pores (intrusion) and the
length of penetrometer stem that is filled with mercury decreases. The difference in mercury level corresponds
to the volume intruded in the sample.
However, real pores are never exactly cylindrical, and thus the measured pore radius is an
equivalent circular pore radius.
Mercury porosimetry data is not limited to porosity and pore size distribution but this
technique also provides information about bulk and skeletal density. Bulk density is the ration
between the weight and the bulk volume, which includes the solid volume as well as the
volume of all empty spaces. This volume is measured at the lowest intrusion pressure. In
opposition the “skeletal” density, corresponding to the “skeletal” volume, refers to the volume
of the sample discounting all the voids occupied by the mercury at the highest pressure
(Micromeritics 2000).
5.1.1.2 Equipment - AutoPore IV 9500
In this study, the Micromeritics equipment AutoPore IV 9500 (Figure 5.2) was used to perform
the mercury porosimetry measurements for all the 31 samples produced. In this apparatus
mercury pressure is increased from about 1 psia up to 33 000 psia in two different
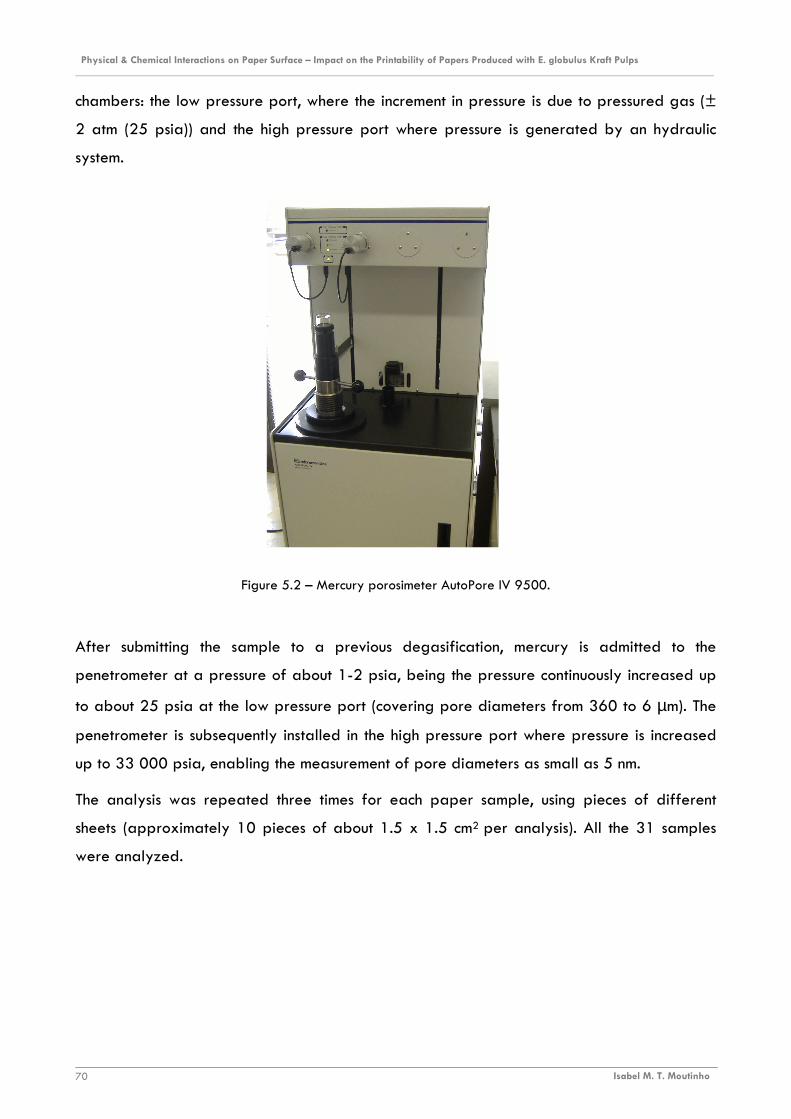
Physical & Chemical Interactions on Paper Surface – Impact on the Printability of Papers Produced with E. globulus Kraft Pulps ________________________________________________________________________________________________________________________
Isabel M. T. Moutinho 70
chambers: the low pressure port, where the increment in pressure is due to pressured gas (±
2 atm (25 psia)) and the high pressure port where pressure is generated by an hydraulic
system.
Figure 5.2 – Mercury porosimeter AutoPore IV 9500.
After submitting the sample to a previous degasification, mercury is admitted to the
penetrometer at a pressure of about 1-2 psia, being the pressure continuously increased up
to about 25 psia at the low pressure port (covering pore diameters from 360 to 6 µm). The
penetrometer is subsequently installed in the high pressure port where pressure is increased
up to 33 000 psia, enabling the measurement of pore diameters as small as 5 nm.
The analysis was repeated three times for each paper sample, using pieces of different
sheets (approximately 10 pieces of about 1.5 x 1.5 cm2 per analysis). All the 31 samples
were analyzed.
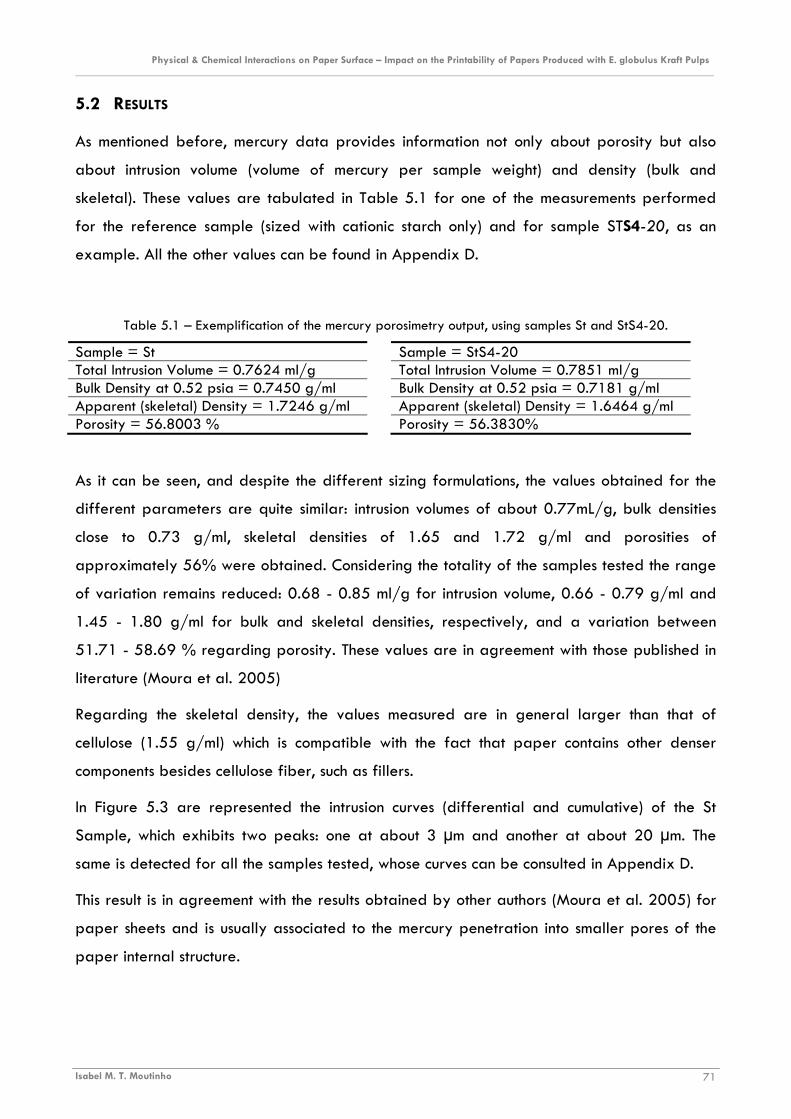
Physical & Chemical Interactions on Paper Surface – Impact on the Printability of Papers Produced with E. globulus Kraft Pulps ________________________________________________________________________________________________________________________
Isabel M. T. Moutinho 71
5.2 RESULTS
As mentioned before, mercury data provides information not only about porosity but also
about intrusion volume (volume of mercury per sample weight) and density (bulk and
skeletal). These values are tabulated in Table 5.1 for one of the measurements performed
for the reference sample (sized with cationic starch only) and for sample STS4-20, as an
example. All the other values can be found in Appendix D.
Table 5.1 – Exemplification of the mercury porosimetry output, using samples St and StS4-20.
Sample = St Sample = StS4-20 Total Intrusion Volume = 0.7624 ml/g Total Intrusion Volume = 0.7851 ml/g Bulk Density at 0.52 psia = 0.7450 g/ml Bulk Density at 0.52 psia = 0.7181 g/ml Apparent (skeletal) Density = 1.7246 g/ml Apparent (skeletal) Density = 1.6464 g/ml Porosity = 56.8003 % Porosity = 56.3830%
As it can be seen, and despite the different sizing formulations, the values obtained for the
different parameters are quite similar: intrusion volumes of about 0.77mL/g, bulk densities
close to 0.73 g/ml, skeletal densities of 1.65 and 1.72 g/ml and porosities of
approximately 56% were obtained. Considering the totality of the samples tested the range
of variation remains reduced: 0.68 - 0.85 ml/g for intrusion volume, 0.66 - 0.79 g/ml and
1.45 - 1.80 g/ml for bulk and skeletal densities, respectively, and a variation between
51.71 - 58.69 % regarding porosity. These values are in agreement with those published in
literature (Moura et al. 2005)
Regarding the skeletal density, the values measured are in general larger than that of
cellulose (1.55 g/ml) which is compatible with the fact that paper contains other denser
components besides cellulose fiber, such as fillers.
In Figure 5.3 are represented the intrusion curves (differential and cumulative) of the St
Sample, which exhibits two peaks: one at about 3 µm and another at about 20 µm. The
same is detected for all the samples tested, whose curves can be consulted in Appendix D.
This result is in agreement with the results obtained by other authors (Moura et al. 2005) for
paper sheets and is usually associated to the mercury penetration into smaller pores of the
paper internal structure.
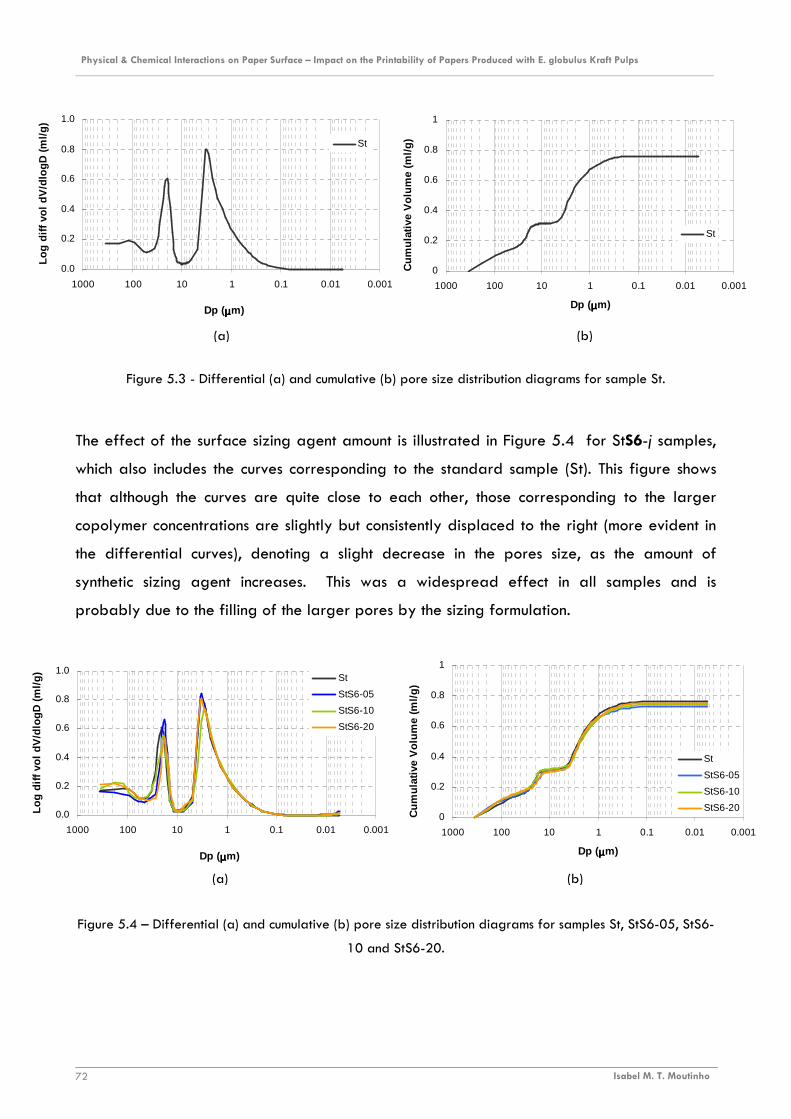
Physical & Chemical Interactions on Paper Surface – Impact on the Printability of Papers Produced with E. globulus Kraft Pulps ________________________________________________________________________________________________________________________
Isabel M. T. Moutinho 72
(a) (b)
0.0
0.2
0.4
0.6
0.8
1.0
0.0010.010.11101001000
Dp (µµµµm)
Log
diff
vol d
V/d
logD
(m
l/g)
St
0
0.2
0.4
0.6
0.8
1
0.0010.010.11101001000
Dp (µµµµm)
Cum
ulat
ive
Vol
ume
(ml/g
)
St
(a) (b)
0.0
0.2
0.4
0.6
0.8
1.0
0.0010.010.11101001000
Dp (µµµµm)
Log
diff
vol d
V/d
logD
(m
l/g) St
StS6-05
StS6-10
StS6-20
0
0.2
0.4
0.6
0.8
1
0.0010.010.11101001000
Dp (µµµµm)
Cum
ulat
ive
Vol
ume
(ml/g
)
St
StS6-05
StS6-10
StS6-20
Figure 5.3 - Differential (a) and cumulative (b) pore size distribution diagrams for sample St.
The effect of the surface sizing agent amount is illustrated in Figure 5.4 for StS6-j samples,
which also includes the curves corresponding to the standard sample (St). This figure shows
that although the curves are quite close to each other, those corresponding to the larger
copolymer concentrations are slightly but consistently displaced to the right (more evident in
the differential curves), denoting a slight decrease in the pores size, as the amount of
synthetic sizing agent increases. This was a widespread effect in all samples and is
probably due to the filling of the larger pores by the sizing formulation.
Figure 5.4 – Differential (a) and cumulative (b) pore size distribution diagrams for samples St, StS6-05, StS6-
10 and StS6-20.
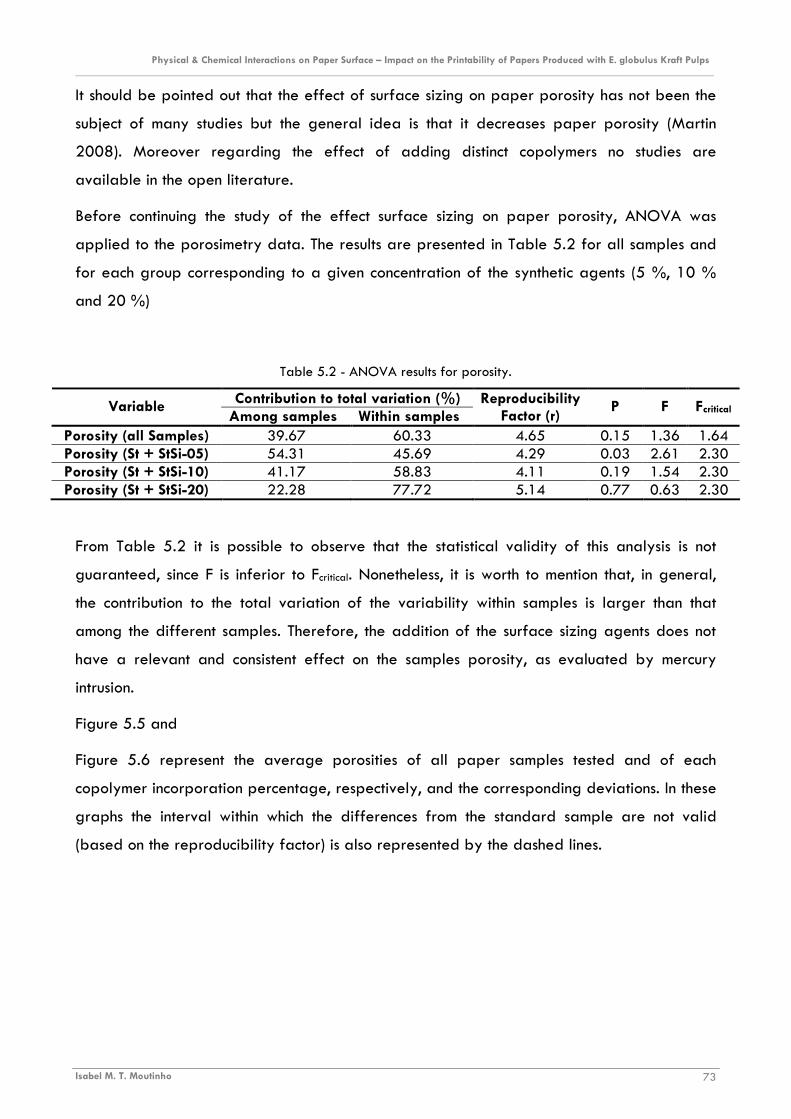
Physical & Chemical Interactions on Paper Surface – Impact on the Printability of Papers Produced with E. globulus Kraft Pulps ________________________________________________________________________________________________________________________
Isabel M. T. Moutinho 73
It should be pointed out that the effect of surface sizing on paper porosity has not been the
subject of many studies but the general idea is that it decreases paper porosity (Martin
2008). Moreover regarding the effect of adding distinct copolymers no studies are
available in the open literature.
Before continuing the study of the effect surface sizing on paper porosity, ANOVA was
applied to the porosimetry data. The results are presented in Table 5.2 for all samples and
for each group corresponding to a given concentration of the synthetic agents (5 %, 10 %
and 20 %)
Table 5.2 - ANOVA results for porosity.
Contribution to total variation (%) Variable Among samples Within samples
Reproducibility Factor (r)
P F Fcritical
Porosity (all Samples) 39.67 60.33 4.65 0.15 1.36 1.64 Porosity (St + StSi-05) 54.31 45.69 4.29 0.03 2.61 2.30 Porosity (St + StSi-10) 41.17 58.83 4.11 0.19 1.54 2.30 Porosity (St + StSi-20) 22.28 77.72 5.14 0.77 0.63 2.30
From Table 5.2 it is possible to observe that the statistical validity of this analysis is not
guaranteed, since F is inferior to Fcritical. Nonetheless, it is worth to mention that, in general,
the contribution to the total variation of the variability within samples is larger than that
among the different samples. Therefore, the addition of the surface sizing agents does not
have a relevant and consistent effect on the samples porosity, as evaluated by mercury
intrusion.
Figure 5.5 and
Figure 5.6 represent the average porosities of all paper samples tested and of each
copolymer incorporation percentage, respectively, and the corresponding deviations. In these
graphs the interval within which the differences from the standard sample are not valid
(based on the reproducibility factor) is also represented by the dashed lines.

Physical & Chemical Interactions on Paper Surface – Impact on the Printability of Papers Produced with E. globulus Kraft Pulps ________________________________________________________________________________________________________________________
Isabel M. T. Moutinho 74
46
48
50
52
54
56
58
60
62
St
StS
1-0
5
StS
1-1
0
StS
1-2
0
StS
2-0
5
StS
2-1
0
StS
2-2
0
StS
3-0
5
StS
3-1
0
StS
3-2
0
StS
4-0
5
StS
4-1
0
StS
4-2
0
StS
5-0
5
StS
5-1
0
StS
5-2
0
StS
6-0
5
StS
6-1
0
StS
6-2
0
StS
7-0
5
StS
7-1
0
StS
7-2
0
StS
8-0
5
StS
8-1
0
StS
8-2
0
StS
9-0
5
StS
9-1
0
StS
9-2
0
StS
10
-05
StS
10
-10
StS
10
-20
Sample
Tot
al P
oros
ity (
%)
(c)
46
48
50
52
54
56
58
60
62
St
StS
1-2
0
StS
2-2
0
StS
3-2
0
StS
4-2
0
StS
5-2
0
StS
6-2
0
StS
7-2
0
StS
8-2
0
StS
9-2
0
StS
10-
20
Sample
Tot
al P
oros
ity (
%)
46
48
50
52
54
56
58
60
62
St
StS
1-0
5
StS
2-0
5
StS
3-0
5
StS
4-0
5
StS
5-0
5
StS
6-0
5
StS
7-0
5
StS
8-0
5
StS
9-0
5
StS
10
-05
Sample
Tot
al P
oros
ity (
%)
46
48
50
52
54
56
58
60
62
St
StS
1-1
0
StS
2-1
0
StS
3-1
0
StS
4-1
0
StS
5-1
0
StS
6-1
0
StS
7-1
0
StS
8-1
0
StS
9-1
0
StS
10
-10
Sample
Tot
al P
oros
ity (
%)
(a) (b)
Figure 5.5 – Total porosity values obtained for all paper samples.
Figure 5.6 – Total porosity values, compared with sample St, of the samples (a) with 5% of surface sizing
agent; (b) with 10% of Surface sizing agent; (c) with 20% of surface sizing agent. The dashed
lines delimit the interval (based on ANOVA) in which the samples are not distinguishable from the
St sample.
Physical & Chemical Interactions on Paper Surface – Impact on the Printability of Papers Produced with E. globulus Kraft Pulps ________________________________________________________________________________________________________________________
Isabel M. T. Moutinho 75
In spite of the aforementioned lack of statistical significance, a slight decrease in sample
porosity is noticed, in general, as the copolymer amount increases (relatively to the standard
sample), in addition to the pore size diminution tendency detected in Figure 5.4.
Furthermore, the small impact of the various surface sizing formulations on sample porosity is
in agreement with profilometry data presented in Chapter 4, confirming the reduced
influence of the addition of the synthetic surface sizing agents to the surface sizing
formulation in the physical properties of the paper. Thus, any eventual distinct impact of the
various sizing agents will only be noticed on the chemical characteristics of the paper surface.


CHAPTER 6
CONTACT ANGLE MEASUREMENTS

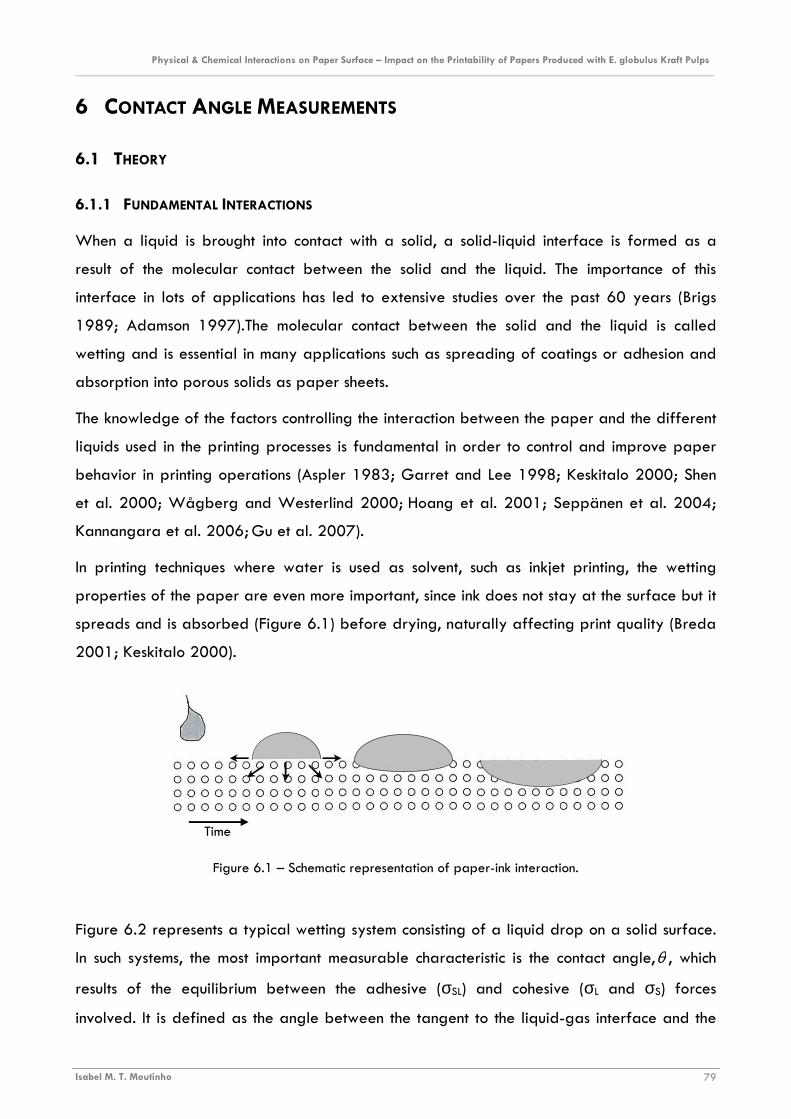
Physical & Chemical Interactions on Paper Surface – Impact on the Printability of Papers Produced with E. globulus Kraft Pulps ________________________________________________________________________________________________________________________
Isabel M. T. Moutinho 79
6 CONTACT ANGLE MEASUREMENTS
6.1 THEORY
6.1.1 FUNDAMENTAL INTERACTIONS
When a liquid is brought into contact with a solid, a solid-liquid interface is formed as a
result of the molecular contact between the solid and the liquid. The importance of this
interface in lots of applications has led to extensive studies over the past 60 years (Brigs
1989; Adamson 1997).The molecular contact between the solid and the liquid is called
wetting and is essential in many applications such as spreading of coatings or adhesion and
absorption into porous solids as paper sheets.
The knowledge of the factors controlling the interaction between the paper and the different
liquids used in the printing processes is fundamental in order to control and improve paper
behavior in printing operations (Aspler 1983; Garret and Lee 1998; Keskitalo 2000; Shen
et al. 2000; Wågberg and Westerlind 2000; Hoang et al. 2001; Seppänen et al. 2004;
Kannangara et al. 2006; Gu et al. 2007).
In printing techniques where water is used as solvent, such as inkjet printing, the wetting
properties of the paper are even more important, since ink does not stay at the surface but it
spreads and is absorbed (Figure 6.1) before drying, naturally affecting print quality (Breda
2001; Keskitalo 2000).
Figure 6.1 – Schematic representation of paper-ink interaction.
Figure 6.2 represents a typical wetting system consisting of a liquid drop on a solid surface.
In such systems, the most important measurable characteristic is the contact angle,θ , which
results of the equilibrium between the adhesive (σSL) and cohesive (σL and σS) forces
involved. It is defined as the angle between the tangent to the liquid-gas interface and the
Time

Physical & Chemical Interactions on Paper Surface – Impact on the Printability of Papers Produced with E. globulus Kraft Pulps ________________________________________________________________________________________________________________________
Isabel M. T. Moutinho 80
Gas Liquid
Solid
θ σS
σL
σSL
tangent to the solid interface at the contact point between the three phases (Gennes 1985;
Brigs et al. 1989; Keskitalo 2000; Levlin and Söderhjelm 2000; Marmur 2006).
Figure 6.2 – Contact angle formation on a solid surface according to the Young equation
When a wetting system is created, three distinct situations may be found: no wetting (contact
angle > 90º), partial wetting (0º < contact angle < 90º) or complete wetting (contact angle
= 0), as illustrated in Figure 6.3 (Gennes 1985; Brigs et al. 1989; Keskitalo 2000; Levlin
and Söderhjelm 2000; Marmur 2006).
Figure 6.3 – Representation of the possible wetting situations: (a) non wetting, (b) partial wetting and (c) complete
wetting.
The main factor ruling wetting is the surface energy (usually called surface tension when
referring to liquids) of the components involved, which determines how the liquid phase and
the solid phase interact with each other. (Gennes 1985; Brigs et al. 1989; Keskitalo 2000;
Levlin and Söderhjelm 2000; Marmur 2006).
To understand the origin of the surface tension/energy of a material it is necessary to
examine its surface at a molecular scale. Between the individual molecules there are
different attraction forces, such as London-Van der Waals, dipole, hydrogen bonds, ionic
forces or even acid-base interactions. In the interior of the material, each molecule is
surrounded by others, and a force balance is established. This balance does not exit at the
surface of the material, and all forces are directed towards the interior, creating the surface
tension of the material, ruled by the type of attraction between the molecules of the surface
(Gennes 1985; Brigs et al. 1989; Keskitalo 2000; Levlin and Söderhjelm 2000; Marmur
2006).
(a) (b) (c)

Physical & Chemical Interactions on Paper Surface – Impact on the Printability of Papers Produced with E. globulus Kraft Pulps ________________________________________________________________________________________________________________________
Isabel M. T. Moutinho 81
When the equilibrium between the liquid and the solid is establishes, the balance of forces of
the system at the contact point between the three phases (Figure 6.2) can be described by
the well known Young equation:
θσσσ cos⋅+= LSLS (6.1)
where Sσ is the surface free energy of the solid, SLσ is the interfacial free energy between
the liquid and the solid, Lσ is the surface tension of the liquid, and θ is the contact angle.
The new interface formed by the contact between the liquid and the solid surface is
characterized by a given energy that would be the one needed to remove the liquid drop
from the surface; this energy is called the work of adhesion (Wa ), and is computed by (Brigs
et al. 1989):
SLLSWa σσσ −+= (6.2)
By combining Equations 6.1 and 6.2 the so called Young-Dupre equation is obtained, which
relates the work of adhesion with the contact angle value:
)cos1( θσ +⋅= LWa (6.3)
These relations, based on force balances and thermodynamic definitions, are applicable to
the interactions occurring in any solid-liquid system and several theories have been
developed to use them in order to calculate the surface properties of solids, namely the
surface free energy, σS.
6.1.2 SURFACE ENERGY CALCULATION THEORIES
The most used theories to determine the surface energy of solids from contact angle data
using liquids whose surface tensions are known, are those of Zisman (1960’s); Owens, Wendt,
Rabel and Kaelbe (OWRK) (1960’s); Fowkes (1950´s) and of van Oss & Good (1980´s)
(Gennes 1985; Brigs et al. 1989; Keskitalo 2000; Levlin and Söderhjelm 2000; Marmur
2006)
6.1.2.1 Zisman
In this theory, at least two liquids with known surface tensions are used and the cosines of the
measured contact angles are plotted versus the surface tension of the corresponding liquid.
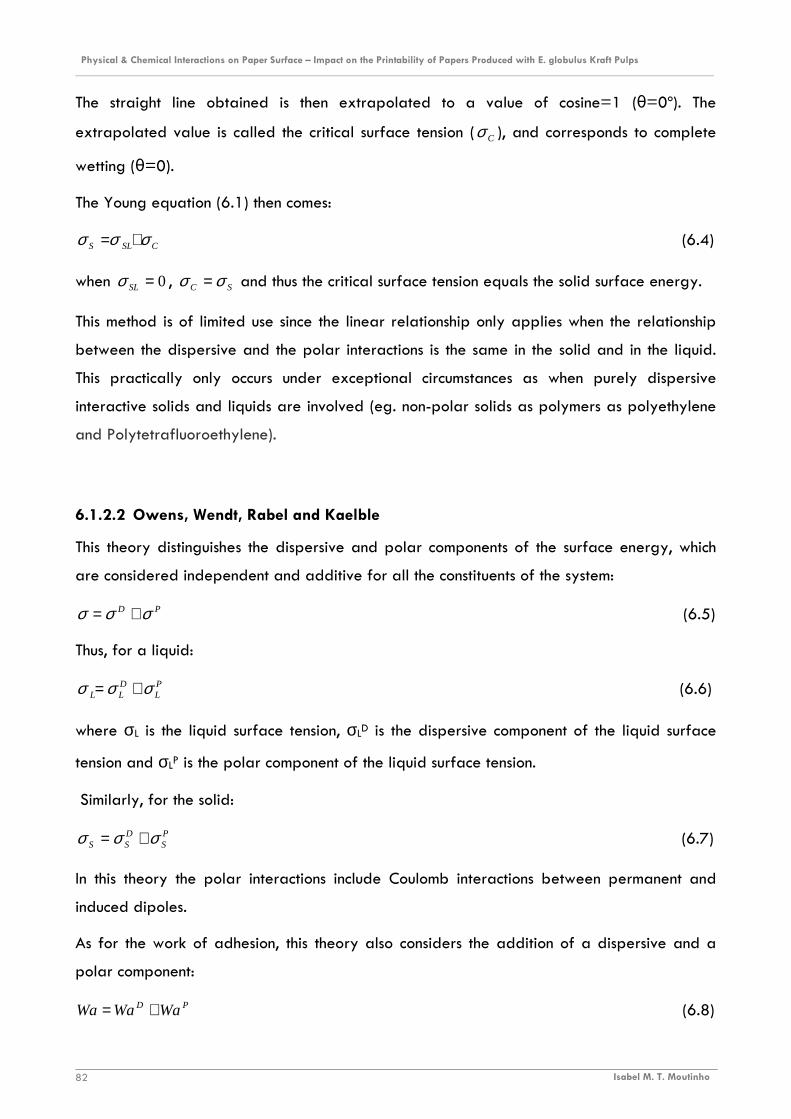
Physical & Chemical Interactions on Paper Surface – Impact on the Printability of Papers Produced with E. globulus Kraft Pulps ________________________________________________________________________________________________________________________
Isabel M. T. Moutinho 82
The straight line obtained is then extrapolated to a value of cosine=1 (θ=0º). The
extrapolated value is called the critical surface tension ( Cσ ), and corresponds to complete
wetting (θ=0).
The Young equation (6.1) then comes:
CSLS σσσ += (6.4)
when 0=SLσ , SC σσ = and thus the critical surface tension equals the solid surface energy.
This method is of limited use since the linear relationship only applies when the relationship
between the dispersive and the polar interactions is the same in the solid and in the liquid.
This practically only occurs under exceptional circumstances as when purely dispersive
interactive solids and liquids are involved (eg. non-polar solids as polymers as polyethylene
and Polytetrafluoroethylene).
6.1.2.2 Owens, Wendt, Rabel and Kaelble
This theory distinguishes the dispersive and polar components of the surface energy, which
are considered independent and additive for all the constituents of the system:
PD σσσ += (6.5)
Thus, for a liquid:
PL
DLL σσσ += (6.6)
where σL is the liquid surface tension, σLD is the dispersive component of the liquid surface
tension and σLP is the polar component of the liquid surface tension.
Similarly, for the solid:
PS
DSS σσσ += (6.7)
In this theory the polar interactions include Coulomb interactions between permanent and
induced dipoles.
As for the work of adhesion, this theory also considers the addition of a dispersive and a
polar component:
PD WaWaWa += (6.8)
Physical & Chemical Interactions on Paper Surface – Impact on the Printability of Papers Produced with E. globulus Kraft Pulps ________________________________________________________________________________________________________________________
Isabel M. T. Moutinho 83
Each component of the adhesion work is approximated by the geometric mean as:
DS
DL
DWa σσ ⋅⋅= 2 (6.9)
PS
PL
PWa σσ ⋅⋅= 2 (6.10)
Thus
PS
PL
SS
DLWa σσσσ ⋅⋅+⋅⋅= 22 (6.11)
Combining Equation 6.11 with Equation 6.3 leads to:
PS
PL
DS
DLL σσσσθσ ⋅⋅+⋅⋅=+⋅ 22)cos1( (6.12)
Re-arranging this equation it is possible to obtain:
( ) DSD
L
PLP
SD
L
L σσσ
σθσσ +⋅=+⋅
2
cos1 (6.13)
By plotting DL
PL
DL
L vsσ
σθσσ
2
cos1+⋅ for several liquids with known values of σLD and σLP a
straight line is obtained from which it is possible to calculate σSP (from the slope) and σSD
(from the intersection with the vertical axis).
Despite being a universal method, since it can be used for any solid surface, it also presents
some drawbacks, namely the poor approximation considered for the polar component
( PS
PL
PWa σσ⋅= 2 ) and the fact that the acid-base interactions are neglected.
6.1.2.3 Fowkes
Like in the previous theory, the Fowkes theory also distinguishes the dispersive and non-
dispersive parts of the surface energy. The geometric mean is again used to approximate
the work of adhesion, but only in the case of the dispersive part. The non dispersive
interactions, simply denoted as ndI , are not quantified in this theory. Since no information is
available for ndI , this analysis is only used for liquids having merely dispersive interactions
with the solid surface under study.
Considering Equation 6.3 and using the approximation for Wa as:
Physical & Chemical Interactions on Paper Surface – Impact on the Printability of Papers Produced with E. globulus Kraft Pulps ________________________________________________________________________________________________________________________
Isabel M. T. Moutinho 84
ndDS
DL IWa +⋅= σσ2 (6.14)
From Eq. 6.3 and considering 0=ndI , Eq. 6.14 leads to
( ) DS
DLL σσθσ ⋅⋅=+ 2cos1 (6.15)
By plotting ( ) DLL vs σθσ cos1+⋅ for several liquids, a straight line is obtained from
whose slope the value of σSD is computed.
Similarly to the Zisman theory, only the dispersive interactions are taken into account and thus
it is a quite restricted theory, since it is only applicable to non-polar systems.
6.1.2.4 van Oss & Good
In this theory, the interaction between liquid and solid is interpreted as the interaction
between an acid and a base. It considers that the surface energy can be decomposed into
LWσ and abσ :
abLW σσσ += (6.16)
here the superscript LW stands for Lifshitz - van der Waals interactions, which include London
dispersion, Keeson dipole-dipole and Debie induction whereas ab stands for Lewis acid-base
interactions.
Once again the geometric mean is used to approximate the several components of the forces
considered for the work of adhesion:
+−−+ ⋅⋅+⋅⋅+⋅⋅= SLSLLWS
LWLWa σσσσσσ 222 (6.17)
+σ denoting Lewis acid (electron-acceptor) and −σ Lewis base (electron-donor) character.
Combining Equation 6.17 with Equation 6.3 leads to:
( ) ( )+−−+ ⋅+⋅+⋅⋅=+⋅ SLSLLWS
LWLL σσσσσσθσ 2cos1 (6.18)
Equation 6.18 has three unknowns ( LWSσ , +
Sσ and −Sσ ). Thus and unlike the previous methods
(based on graphical solving strategies), it is necessary to establish this equation for at least
three liquids and solve the corresponding system numerically.

Physical & Chemical Interactions on Paper Surface – Impact on the Printability of Papers Produced with E. globulus Kraft Pulps ________________________________________________________________________________________________________________________
Isabel M. T. Moutinho 85
These theories are summarized in Table 6.1 showing that they not only differ in the outputs
provided but also on the solving strategy and applicability.
Table 6.1 – Summary of the theories presented for surface energy calculations based on contact angle
measurements.
Method Outputs Solving Strategy Applicability Drawbacks
Zisman Cσ Plot
Lvs σθcos Non-Polar
Solids Little
information
OWRK DSσ P
Sσ
Plot
DL
PL
DL
L vsσσθ
σσ
2
cos1+⋅ Universal
Poor approximation
for polar contribution
Fowkes DSσ
Plot
( ) DLL vs σθσ cos1+⋅
Non-polar systems
Little information
van Oss & Good
LWσ
+σ −σ
System of equations ( )( )+−−+ ⋅+⋅+⋅⋅=
=+⋅
SLSLLWS
LWL
L
σσσσσσ
θσ
2
cos1 Universal
Acid and base contributions of liquids are
relative to water
Having in mind the materials under test in this study and the universal character of the
OWRK theory, it was the one selected for the surface energy calculations in the present
work.
6.1.3 CONTACT ANGLE MEASUREMENTS
For the measurements of the contact angle, several methods are available such as the
Wilhelmy, the Washburn or the Sessile drop method. The former two methods are not
commonly used, mainly because they are indirect methods (Koljonen and Stenius 2005;
Gurau et al. 2006).
The sessile drop method is an optical contact angle method, which involves directly measuring
the contact angle for a drop of liquid resting on a horizontal solid surface (Figure 6.2).
Traditionally, the measurement of the contact angles was carried out using a goniometer
eyepiece, being the results quite operator dependent. Nowadays, the measurement is
performed through video based systems. Sophisticated CCD cameras are used to capture the
drop image which is stored and subsequently analyzed by the equipment software.
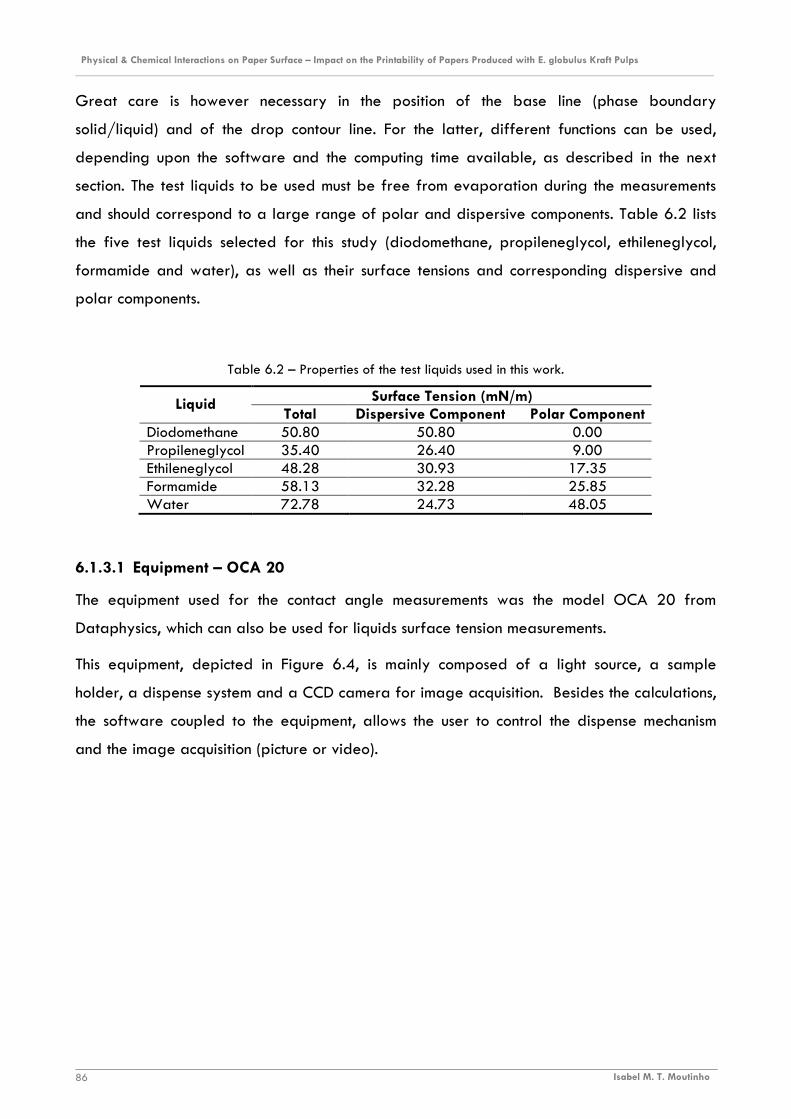
Physical & Chemical Interactions on Paper Surface – Impact on the Printability of Papers Produced with E. globulus Kraft Pulps ________________________________________________________________________________________________________________________
Isabel M. T. Moutinho 86
Great care is however necessary in the position of the base line (phase boundary
solid/liquid) and of the drop contour line. For the latter, different functions can be used,
depending upon the software and the computing time available, as described in the next
section. The test liquids to be used must be free from evaporation during the measurements
and should correspond to a large range of polar and dispersive components. Table 6.2 lists
the five test liquids selected for this study (diodomethane, propileneglycol, ethileneglycol,
formamide and water), as well as their surface tensions and corresponding dispersive and
polar components.
Table 6.2 – Properties of the test liquids used in this work.
Surface Tension (mN/m) Liquid Total Dispersive Component Polar Component
Diodomethane 50.80 50.80 0.00 Propileneglycol 35.40 26.40 9.00 Ethileneglycol 48.28 30.93 17.35 Formamide 58.13 32.28 25.85 Water 72.78 24.73 48.05
6.1.3.1 Equipment – OCA 20
The equipment used for the contact angle measurements was the model OCA 20 from
Dataphysics, which can also be used for liquids surface tension measurements.
This equipment, depicted in Figure 6.4, is mainly composed of a light source, a sample
holder, a dispense system and a CCD camera for image acquisition. Besides the calculations,
the software coupled to the equipment, allows the user to control the dispense mechanism
and the image acquisition (picture or video).
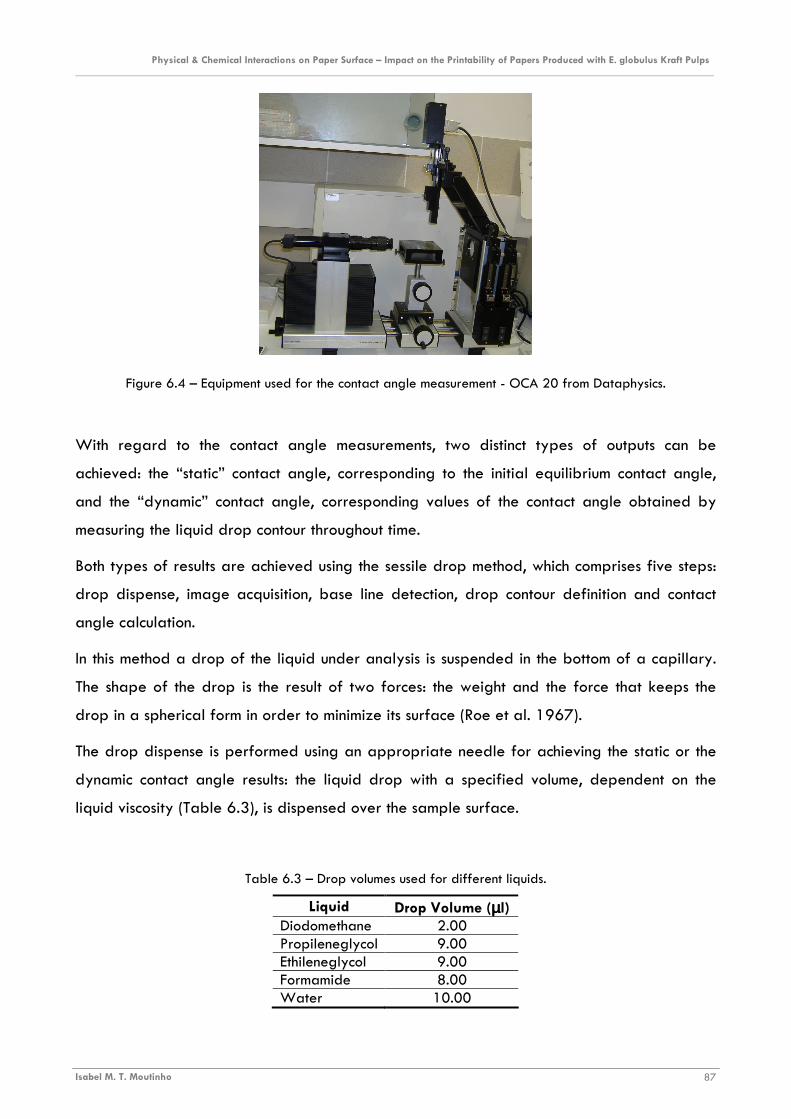
Physical & Chemical Interactions on Paper Surface – Impact on the Printability of Papers Produced with E. globulus Kraft Pulps ________________________________________________________________________________________________________________________
Isabel M. T. Moutinho 87
Figure 6.4 – Equipment used for the contact angle measurement - OCA 20 from Dataphysics.
With regard to the contact angle measurements, two distinct types of outputs can be
achieved: the “static” contact angle, corresponding to the initial equilibrium contact angle,
and the “dynamic” contact angle, corresponding values of the contact angle obtained by
measuring the liquid drop contour throughout time.
Both types of results are achieved using the sessile drop method, which comprises five steps:
drop dispense, image acquisition, base line detection, drop contour definition and contact
angle calculation.
In this method a drop of the liquid under analysis is suspended in the bottom of a capillary.
The shape of the drop is the result of two forces: the weight and the force that keeps the
drop in a spherical form in order to minimize its surface (Roe et al. 1967).
The drop dispense is performed using an appropriate needle for achieving the static or the
dynamic contact angle results: the liquid drop with a specified volume, dependent on the
liquid viscosity (Table 6.3), is dispensed over the sample surface.
Table 6.3 – Drop volumes used for different liquids.
Liquid Drop Volume (µµµµl) Diodomethane 2.00 Propileneglycol 9.00 Ethileneglycol 9.00 Formamide 8.00 Water 10.00
Physical & Chemical Interactions on Paper Surface – Impact on the Printability of Papers Produced with E. globulus Kraft Pulps ________________________________________________________________________________________________________________________
Isabel M. T. Moutinho 88
Regarding image acquisition, the static contact angle measurement is based on a digital
image, captured by the CCD camera, of the resting drop immediately after contact with the
solid surface (normally corresponding to a time interval inferior to 3 sec), whereas, for the
dynamic contact angle, successive images of the liquid drop are acquired during 180 sec
with a velocity of 2 frames/sec.
For the static contact angle measurements, at least 10 drops of each of the five test liquids
(Table 7.2) were used, using at least two stripes of paper from two different sheets, cut in
the diagonal direction in order to avoid any possible effect of fiber orientation. This
procedure was repeated for each of the 30 samples. The surface free energy of each
samples was computed from the average contact angle values (standard deviation of the
measurements < 2º). While for the dynamic contact angle measurements, at least three drops
were analyzed (water was the test liquid for these measurements), also using at least two
stripes of paper from two different sheets, cut in the diagonal direction in order to avoid any
possible effect of fiber orientation and it was ensured the reproducibility of the results
between tests, by verifying that the same behavior was observed.
The contact angle calculations depend on the accuracy of the baseline of the drop,
corresponding to the solid/liquid interface, as well on the drop profile (liquid/air interface).
Distinct mathematical methods are available for fitting the drop contour, resulting in different
accuracies and computational times: the height/width method, the Ellipse method and the
Laplace-Young method. In the height/width method a segment of circle is fitted to the drop
shape, but for large drops leads to considerable errors and thus it is of limited use. In the
ellipse method, the drop contour is approximated by an ellipse whereas in the Laplace-
Young method a line is fitted exactly to the drop contour which requires a longer
computational time. The ellipse method is thus slightly less accurate but faster, being selected
when a rapid calculation is necessary (fast absorption by the solid or dynamic contact angle
measurements).
Besides the calculation of the contact angle values and corresponding errors associated to
the measurement, the equipment software also enables the computation of other drop
properties such as the drop volume, drop base diameter and drop age (associating a time to
each contact angle value in the dynamic measurements).
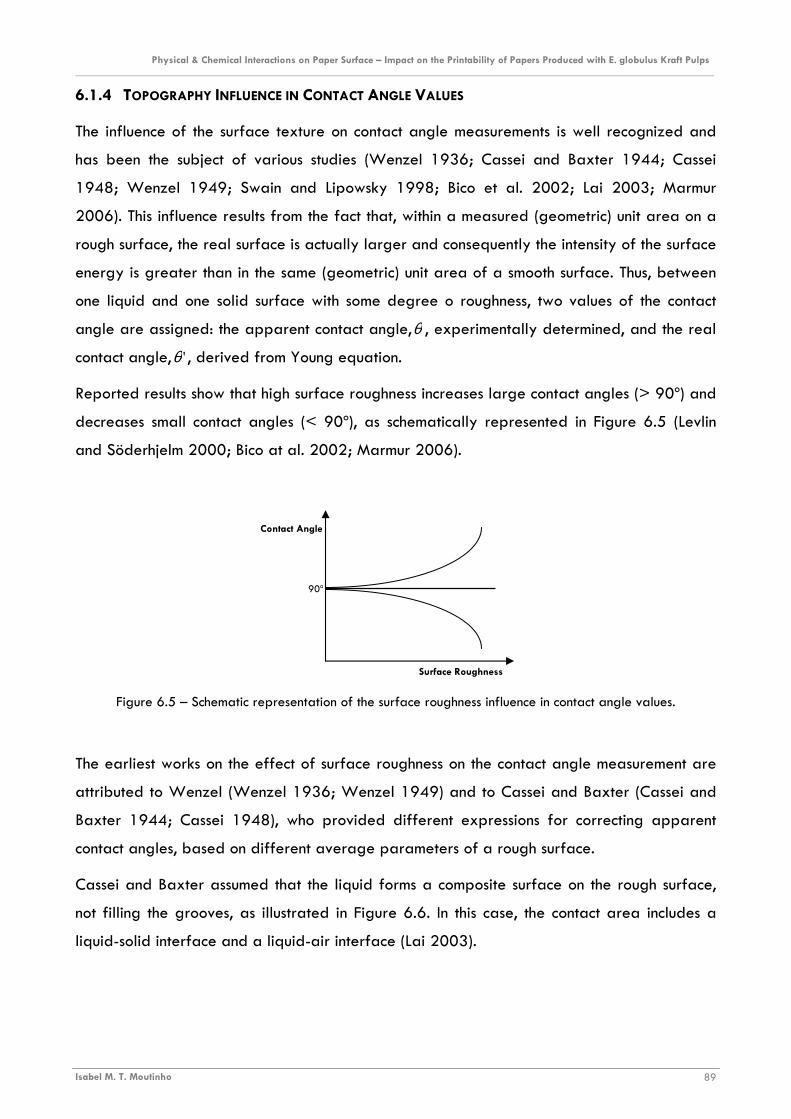
Physical & Chemical Interactions on Paper Surface – Impact on the Printability of Papers Produced with E. globulus Kraft Pulps ________________________________________________________________________________________________________________________
Isabel M. T. Moutinho 89
6.1.4 TOPOGRAPHY INFLUENCE IN CONTACT ANGLE VALUES
The influence of the surface texture on contact angle measurements is well recognized and
has been the subject of various studies (Wenzel 1936; Cassei and Baxter 1944; Cassei
1948; Wenzel 1949; Swain and Lipowsky 1998; Bico et al. 2002; Lai 2003; Marmur
2006). This influence results from the fact that, within a measured (geometric) unit area on a
rough surface, the real surface is actually larger and consequently the intensity of the surface
energy is greater than in the same (geometric) unit area of a smooth surface. Thus, between
one liquid and one solid surface with some degree o roughness, two values of the contact
angle are assigned: the apparent contact angle,θ , experimentally determined, and the real
contact angle, 'θ , derived from Young equation.
Reported results show that high surface roughness increases large contact angles (> 90º) and
decreases small contact angles (< 90º), as schematically represented in Figure 6.5 (Levlin
and Söderhjelm 2000; Bico at al. 2002; Marmur 2006).
Figure 6.5 – Schematic representation of the surface roughness influence in contact angle values.
The earliest works on the effect of surface roughness on the contact angle measurement are
attributed to Wenzel (Wenzel 1936; Wenzel 1949) and to Cassei and Baxter (Cassei and
Baxter 1944; Cassei 1948), who provided different expressions for correcting apparent
contact angles, based on different average parameters of a rough surface.
Cassei and Baxter assumed that the liquid forms a composite surface on the rough surface,
not filling the grooves, as illustrated in Figure 6.6. In this case, the contact area includes a
liquid-solid interface and a liquid-air interface (Lai 2003).
90º
Contact Angle
Surface Roughness
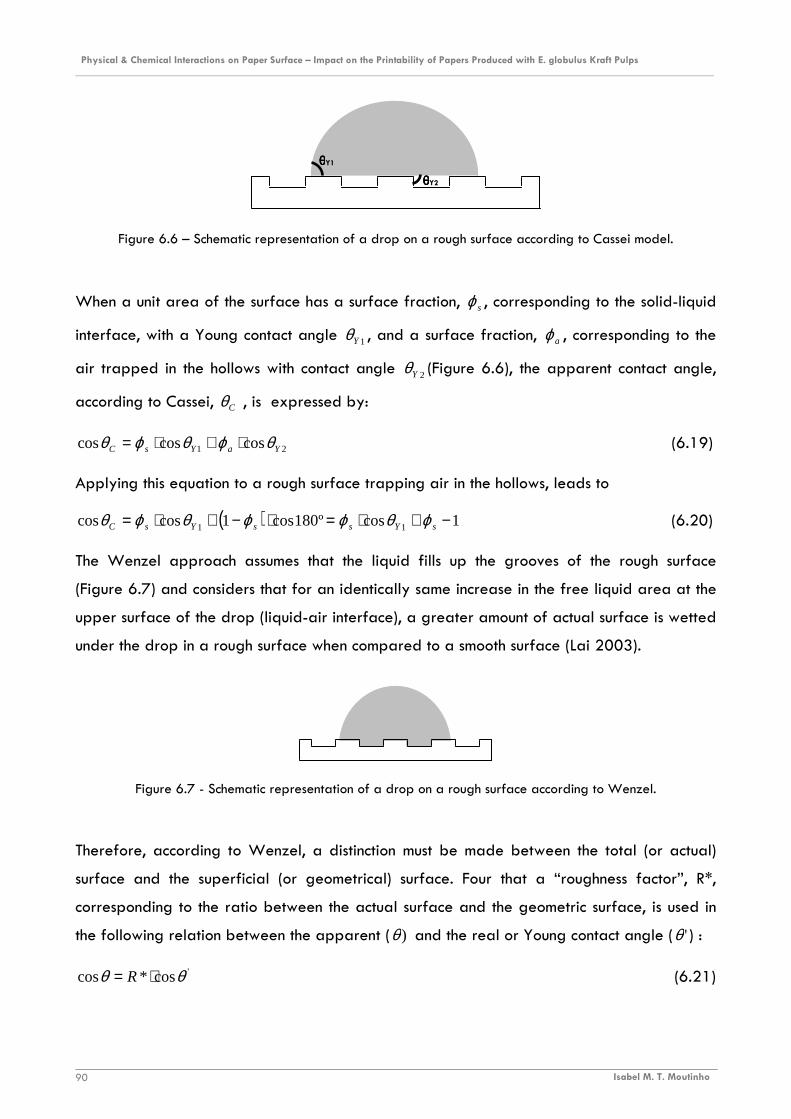
Physical & Chemical Interactions on Paper Surface – Impact on the Printability of Papers Produced with E. globulus Kraft Pulps ________________________________________________________________________________________________________________________
Isabel M. T. Moutinho 90
Figure 6.6 – Schematic representation of a drop on a rough surface according to Cassei model.
When a unit area of the surface has a surface fraction, sϕ , corresponding to the solid-liquid
interface, with a Young contact angle 1Yθ , and a surface fraction, aϕ , corresponding to the
air trapped in the hollows with contact angle 2Yθ (Figure 6.6), the apparent contact angle,
according to Cassei, Cθ , is expressed by:
21 coscoscos YaYsC θϕθϕθ ⋅+⋅= (6.19)
Applying this equation to a rough surface trapping air in the hollows, leads to
( ) 1cosº180cos1coscos 11 −+⋅=⋅−+⋅= sYssYsC ϕθϕϕθϕθ (6.20)
The Wenzel approach assumes that the liquid fills up the grooves of the rough surface
(Figure 6.7) and considers that for an identically same increase in the free liquid area at the
upper surface of the drop (liquid-air interface), a greater amount of actual surface is wetted
under the drop in a rough surface when compared to a smooth surface (Lai 2003).
Figure 6.7 - Schematic representation of a drop on a rough surface according to Wenzel.
Therefore, according to Wenzel, a distinction must be made between the total (or actual)
surface and the superficial (or geometrical) surface. Four that a “roughness factor”, R*,
corresponding to the ratio between the actual surface and the geometric surface, is used in
the following relation between the apparent ( )θ and the real or Young contact angle ( 'θ ) :
'cos*cos θθ ⋅= R (6.21)
θθθθY1
θθθθY2
Physical & Chemical Interactions on Paper Surface – Impact on the Printability of Papers Produced with E. globulus Kraft Pulps ________________________________________________________________________________________________________________________
Isabel M. T. Moutinho 91
In the present work, the Wenzel correction was selected to account for the influence of
topography on the contact angle measurements for the following reasons: i) the material
under study is paper, typically hydrophilic in nature, and thus the approach of Wenzel
(Figure 6.7) seems a more realistic assumption; ii) the correction factor R* is easier and more
accurately determined than the surface fraction sϕ defined in the Cassie correction (Swain
1998; Wågberg and Westerlind 2000; Bico et al. 2002; Lai 2003; Marmur 2006).
Thus, the contact angle experimentally measured will be corrected using Equation 6.22 with
the topographical correction factor R given by:
1001*
SdrR += (6.22)
here Sdr is the interfacial area ratio obtained by profilometry, as previously defined in
Section 4.1.1.3
6.1.5 DYNAMIC PARAMETERS
Besides the measurement of the contact angle as a function of time, the software used also
provides the values of the drop base diameter and of the drop volume. With this
information, it is possible to simultaneously evaluate the spreading and absorption
phenomena by computing the following parameters:
� Wetting velocity
� Spreading coefficient
� Absorption coefficient
The wetting velocity is calculated, according to the Tappi standard T458 om-89, using the
contact angle values after 5 and 60 seconds ( 5θ and 60θ respectively):
( )55
sec/º 605 θθ −=velocityWetting (6.23)
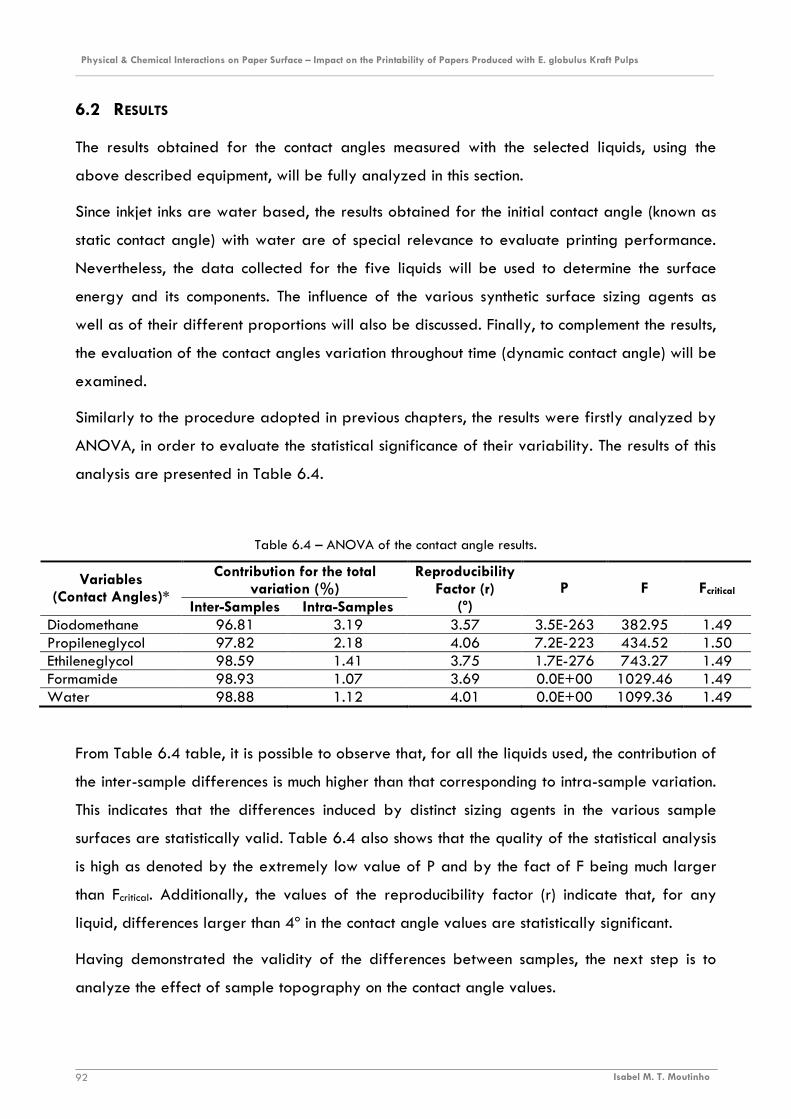
Physical & Chemical Interactions on Paper Surface – Impact on the Printability of Papers Produced with E. globulus Kraft Pulps ________________________________________________________________________________________________________________________
Isabel M. T. Moutinho 92
6.2 RESULTS
The results obtained for the contact angles measured with the selected liquids, using the
above described equipment, will be fully analyzed in this section.
Since inkjet inks are water based, the results obtained for the initial contact angle (known as
static contact angle) with water are of special relevance to evaluate printing performance.
Nevertheless, the data collected for the five liquids will be used to determine the surface
energy and its components. The influence of the various synthetic surface sizing agents as
well as of their different proportions will also be discussed. Finally, to complement the results,
the evaluation of the contact angles variation throughout time (dynamic contact angle) will be
examined.
Similarly to the procedure adopted in previous chapters, the results were firstly analyzed by
ANOVA, in order to evaluate the statistical significance of their variability. The results of this
analysis are presented in Table 6.4.
Table 6.4 – ANOVA of the contact angle results.
Contribution for the total variation (%)
Variables (Contact Angles)*
Inter-Samples Intra-Samples
Reproducibility Factor (r)
(º) P F Fcritical
Diodomethane 96.81 3.19 3.57 3.5E-263 382.95 1.49 Propileneglycol 97.82 2.18 4.06 7.2E-223 434.52 1.50 Ethileneglycol 98.59 1.41 3.75 1.7E-276 743.27 1.49 Formamide 98.93 1.07 3.69 0.0E+00 1029.46 1.49 Water 98.88 1.12 4.01 0.0E+00 1099.36 1.49
From Table 6.4 table, it is possible to observe that, for all the liquids used, the contribution of
the inter-sample differences is much higher than that corresponding to intra-sample variation.
This indicates that the differences induced by distinct sizing agents in the various sample
surfaces are statistically valid. Table 6.4 also shows that the quality of the statistical analysis
is high as denoted by the extremely low value of P and by the fact of F being much larger
than Fcritical. Additionally, the values of the reproducibility factor (r) indicate that, for any
liquid, differences larger than 4º in the contact angle values are statistically significant.
Having demonstrated the validity of the differences between samples, the next step is to
analyze the effect of sample topography on the contact angle values.

Physical & Chemical Interactions on Paper Surface – Impact on the Printability of Papers Produced with E. globulus Kraft Pulps ________________________________________________________________________________________________________________________
Isabel M. T. Moutinho 93
6.2.1 EFFECT OF TOPOGRAPHY
As previously mentioned in this chapter, the contact angle values are claimed to be affected
by the sample surface topography. In order to study this effect the Wenzel correction was
applied to the measured values, using Equation 6.21, with the corrective factor (R*)
computed from Equation 6.22, by using the Sdr values measured by Profilometry (Appendix
C). The values of R* determined for each sample are compiled in Table 6.5. As it can be
seen, all values are close to unity, indicating that the corrections applied are not much
relevant.
Table 6.5 – Values of the Sdr parameter (Appendix C) and of the corresponding correction factors, R,
calculated for each sample using Equation 6.22.
Sample SDR (%)
Correction Factor – R*
Sample SDR (%)
Correction Factor – R*
St 11.33 1.113 StS6-05 10.85 1.109 StS1-05 10.75 1.108 StS6-10 10.80 1.108 StS1-10 9.95 1.100 StS6-20 10.92 1.109 StS1-20 9.43 1.094 StS7-05 10.63 1.106 StS2-05 10.83 1.108 StS7-10 10.28 1.103 StS2-10 11.24 1.112 StS7-20 11.40 1.114 StS2-20 9.23 1.092 StS8-05 11.37 1.114 StS3-05 10.46 1.105 StS8-10 11.30 1.113 StS3-10 10.30 1.103 StS8-20 10.93 1.109 StS3-20 10.35 1.104 StS9-05 11.27 1.113 StS4-05 10.96 1.110 StS9-10 10.29 1.103 StS4-10 11.25 1.113 StS9-20 8.67 1.087 StS4-20 9.73 1.097 StS10-05 10.80 1.108 StS5-05 12.20 1.122 StS10-10 10.10 1.101 StS5-10 11.62 1.116 StS10-20 10.43 1.104 StS5-20 10.28 1.103 ------- ------- ---------
The differences between the uncorrected values of the contact angle and the corrected
values are evident in Figure 6.8, in which the results obtained for water (a) and
diodomethane (b) (respectively the more and the less polar of the liquids tested), are
plotted.
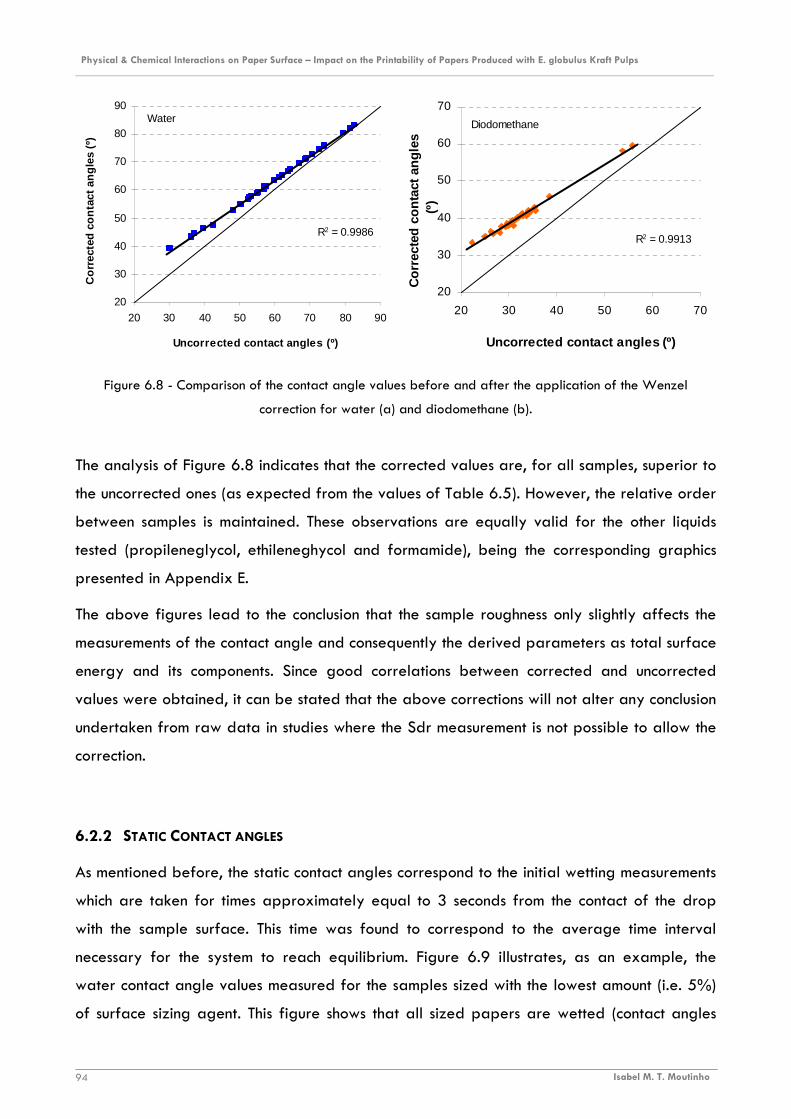
Physical & Chemical Interactions on Paper Surface – Impact on the Printability of Papers Produced with E. globulus Kraft Pulps ________________________________________________________________________________________________________________________
Isabel M. T. Moutinho 94
Water
R2 = 0.9986
20
30
40
50
60
70
80
90
20 30 40 50 60 70 80 90
Uncorrected contact angles (º)
Cor
rect
ed c
onta
ct a
ngle
s (º
)
Diodomethane
R2 = 0.9913
20
30
40
50
60
70
20 30 40 50 60 70
Uncorrected contact angles (º)
Cor
rect
ed c
onta
ct a
ngle
s (º
)
Figure 6.8 - Comparison of the contact angle values before and after the application of the Wenzel
correction for water (a) and diodomethane (b).
The analysis of Figure 6.8 indicates that the corrected values are, for all samples, superior to
the uncorrected ones (as expected from the values of Table 6.5). However, the relative order
between samples is maintained. These observations are equally valid for the other liquids
tested (propileneglycol, ethileneghycol and formamide), being the corresponding graphics
presented in Appendix E.
The above figures lead to the conclusion that the sample roughness only slightly affects the
measurements of the contact angle and consequently the derived parameters as total surface
energy and its components. Since good correlations between corrected and uncorrected
values were obtained, it can be stated that the above corrections will not alter any conclusion
undertaken from raw data in studies where the Sdr measurement is not possible to allow the
correction.
6.2.2 STATIC CONTACT ANGLES
As mentioned before, the static contact angles correspond to the initial wetting measurements
which are taken for times approximately equal to 3 seconds from the contact of the drop
with the sample surface. This time was found to correspond to the average time interval
necessary for the system to reach equilibrium. Figure 6.9 illustrates, as an example, the
water contact angle values measured for the samples sized with the lowest amount (i.e. 5%)
of surface sizing agent. This figure shows that all sized papers are wetted (contact angles

Physical & Chemical Interactions on Paper Surface – Impact on the Printability of Papers Produced with E. globulus Kraft Pulps ________________________________________________________________________________________________________________________
Isabel M. T. Moutinho 95
inferior to 90 º) and that the addition of the synthetic sizing agents always increases the
water contact angle, when compared to the value obtained for the standard sample (where
only starch is applied). In fact, cationic starch has a hydrophilic nature and thus the reduced
values of the contact angle with water (< 40 º) are perfectly natural. The increase in paper
surface hydrophobicity as a result of adding the sizing agents was also expected regarding
the copolymers composition (Section 3.1).
3035404550556065707580
St
StS
1-05
StS
2-05
StS
3-05
StS
4-05
StS
5-05
StS
6-05
StS
7-05
StS
8-05
StS
9-05
StS
10-0
5
Sample
Wat
er c
onta
ct a
ngle
(º)
Figure 6.9 - Contact angle values with water, measured for the reference samples and the samples sized with
the addition of 5% of synthetic surface sizing agent.
Nonetheless, it is evident that some samples exhibit values close to that of the reference
sample (e. g. StS3 and StS9) whereas others present values close to the hydrophobicity
barrier (e.g. StS4-05). The latter are, in principle, not favorable for printing performance
with based water inks. However, it is important to stress that the final printing quality is the
result of the balance of a set of properties and can not be predicted only by the analysis of
the contact angle measured for water.
A detailed explanation of these differences will be given when discussing the results
obtained for the surface energies and its components since these are the parameters that
indeed condition the values of the contact angle. Figure 6.10 presents the average values of
the contact angle measured with the five liquids tested and for all the concentrations of the
sizing agents (5 %, 10 % and 20 % w/w).
Comparing all the plots, it can be concluded that the contact angle values exhibit in general
the following trend:
Θ water > Θ formamide > Θ ethileneglycol > Θ propileneglycol > Θ diodomethane
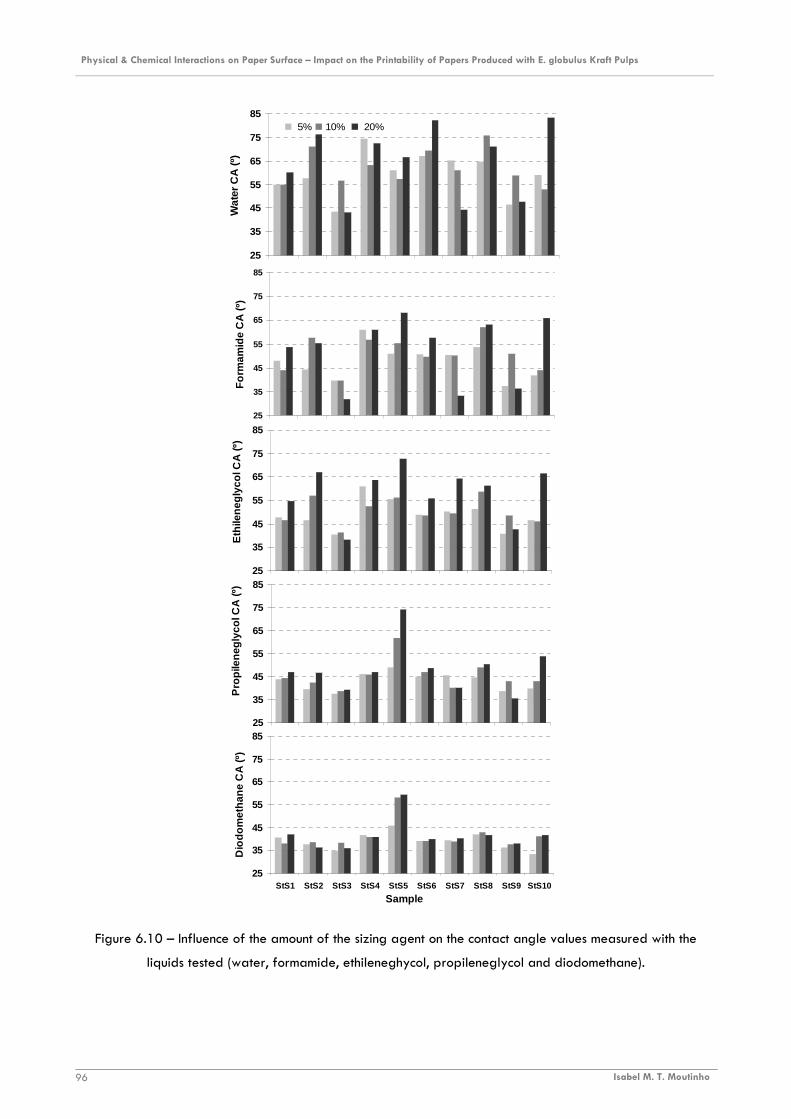
Physical & Chemical Interactions on Paper Surface – Impact on the Printability of Papers Produced with E. globulus Kraft Pulps ________________________________________________________________________________________________________________________
Isabel M. T. Moutinho 96
25
35
45
55
65
75
85
For
mam
ide
CA
(º)
25
35
45
55
65
75
85
Wat
er C
A (º
)
5% 10% 20%
25
35
45
55
65
75
85
Eth
ilene
glyc
ol C
A (º
)
25
35
45
55
65
75
85
Pro
pile
negl
ycol
CA
(º)
25
35
45
55
65
75
85
StS1 StS2 StS3 StS4 StS5 StS6 StS7 StS8 StS9 StS10
Sample
Dio
dom
etha
ne C
A (º
)
Figure 6.10 – Influence of the amount of the sizing agent on the contact angle values measured with the
liquids tested (water, formamide, ethileneghycol, propileneglycol and diodomethane).
Physical & Chemical Interactions on Paper Surface – Impact on the Printability of Papers Produced with E. globulus Kraft Pulps ________________________________________________________________________________________________________________________
Isabel M. T. Moutinho 97
This sequence was somehow expected since the polarity of the liquids tested decreases in the
same way (water is the most polar whereas diodomethane is non-polar), and the size agents
are mainly non-polar compounds.
However, there is one sizing agent, agent S5 (quaternary ditallow methyl epoxypropyl
ammonium), that presents a unique behavior: as the polarity of the liquid decreases, the
contact angle consistently increases (reaching a remarkably high contact angle value,
relatively to the others, for the diodomethane). This indicates that this surface sizing agent
has a much larger influence on the surface properties ruling the dispersive interactions than
on those ruling the polar interactions.
With regard to the effect of increasing the amount of copolymer (5, 10 and 20 %), all types
of tendencies can be observed, as illustrated in Figure 6.10: the contact angle increases with
the amount of the sizing agent, the contact angle decreases as the amount of the sizing agent
increases or, an inflexion point is detected.
The reason why the increase of the surface sizing concentration originates these distinct types
of variation is probably related with the arrangement of the copolymers molecules at the
sample surface, i.e., molecule orientation and the availability of their functional groups for
interacting with the various liquids. This point will be discussed in the next section, together
with the results of the surface energies.
6.2.3 SURFACE ENERGIES
Surface free energy and the corresponding dispersive and polar components were
determined, according to OWRK method, as describe in Section 6.1.3. The knowledge of
these parameters is essential to assess the impact of the various sizing agents on the sample
surface properties. The results obtained are plotted in Figure 6.11, while the numerical
values are listed in Appendix E.
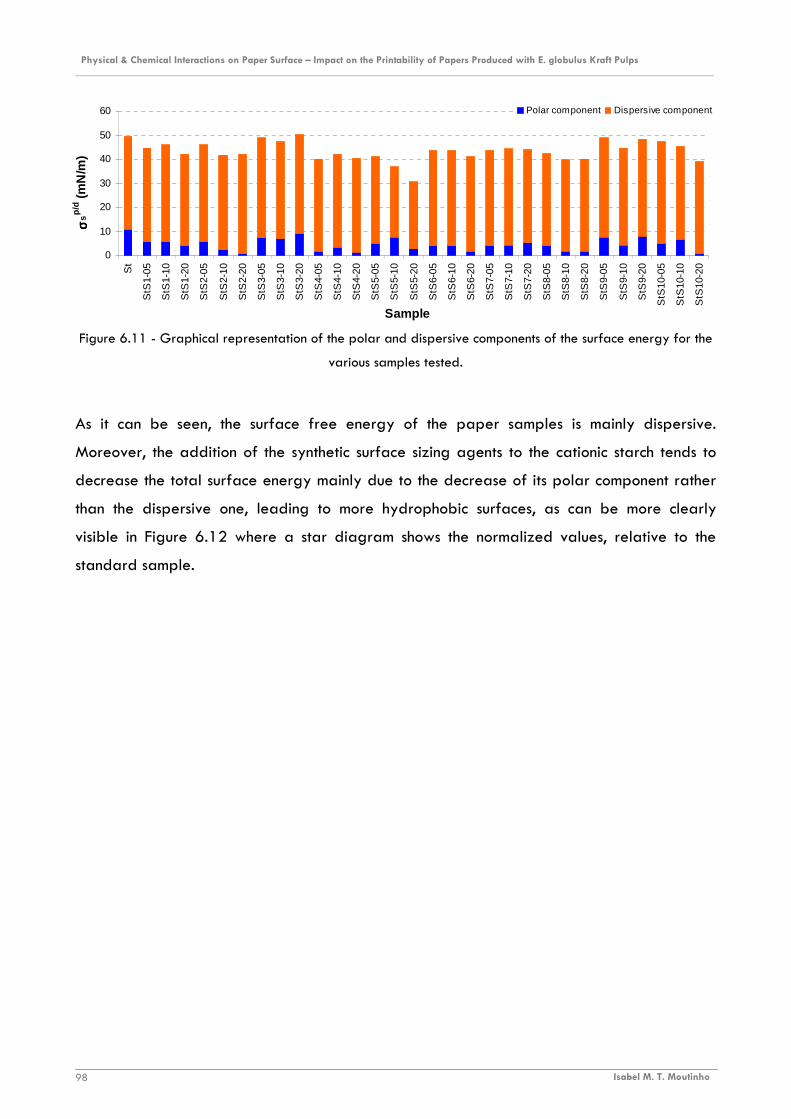
Physical & Chemical Interactions on Paper Surface – Impact on the Printability of Papers Produced with E. globulus Kraft Pulps ________________________________________________________________________________________________________________________
Isabel M. T. Moutinho 98
0
10
20
30
40
50
60
St
StS
1-05
StS
1-10
StS
1-20
StS
2-05
StS
2-10
StS
2-20
StS
3-05
StS
3-10
StS
3-20
StS
4-05
StS
4-10
StS
4-20
StS
5-05
StS
5-10
StS
5-20
StS
6-05
StS
6-10
StS
6-20
StS
7-05
StS
7-10
StS
7-20
StS
8-05
StS
8-10
StS
8-20
StS
9-05
StS
9-10
StS
9-20
StS
10-0
5
StS
10-1
0
StS
10-2
0
Sample
σσ σσs
p/d (m
N/m
)
Polar component Dispersive component
Figure 6.11 - Graphical representation of the polar and dispersive components of the surface energy for the
various samples tested.
As it can be seen, the surface free energy of the paper samples is mainly dispersive.
Moreover, the addition of the synthetic surface sizing agents to the cationic starch tends to
decrease the total surface energy mainly due to the decrease of its polar component rather
than the dispersive one, leading to more hydrophobic surfaces, as can be more clearly
visible in Figure 6.12 where a star diagram shows the normalized values, relative to the
standard sample.
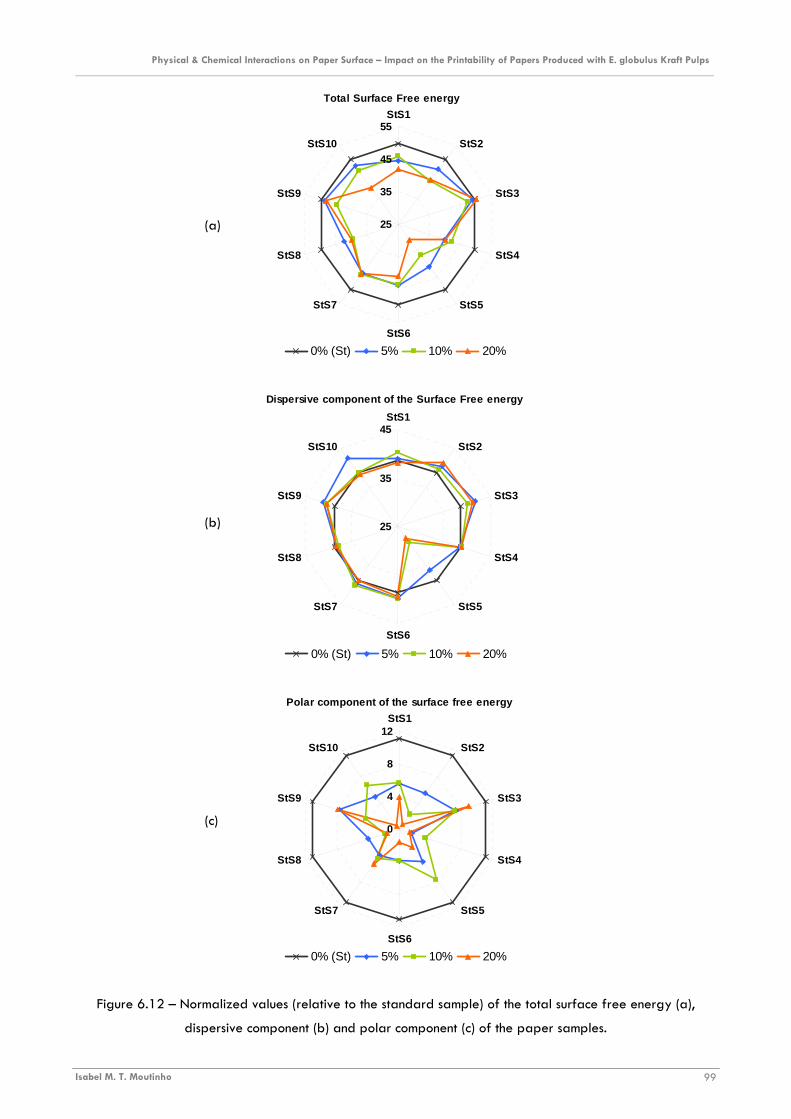
Physical & Chemical Interactions on Paper Surface – Impact on the Printability of Papers Produced with E. globulus Kraft Pulps ________________________________________________________________________________________________________________________
Isabel M. T. Moutinho 99
Total Surface Free energy
25
35
45
55StS1
StS2
StS3
StS4
StS5
StS6
StS7
StS8
StS9
StS10
0% (St) 5% 10% 20%
Dispersive component of the Surface Free energy
25
35
45StS1
StS2
StS3
StS4
StS5
StS6
StS7
StS8
StS9
StS10
0% (St) 5% 10% 20%
Polar component of the surface free energy
0
4
8
12StS1
StS2
StS3
StS4
StS5
StS6
StS7
StS8
StS9
StS10
0% (St) 5% 10% 20%
Figure 6.12 – Normalized values (relative to the standard sample) of the total surface free energy (a),
dispersive component (b) and polar component (c) of the paper samples.
(a)
(b)
(c)
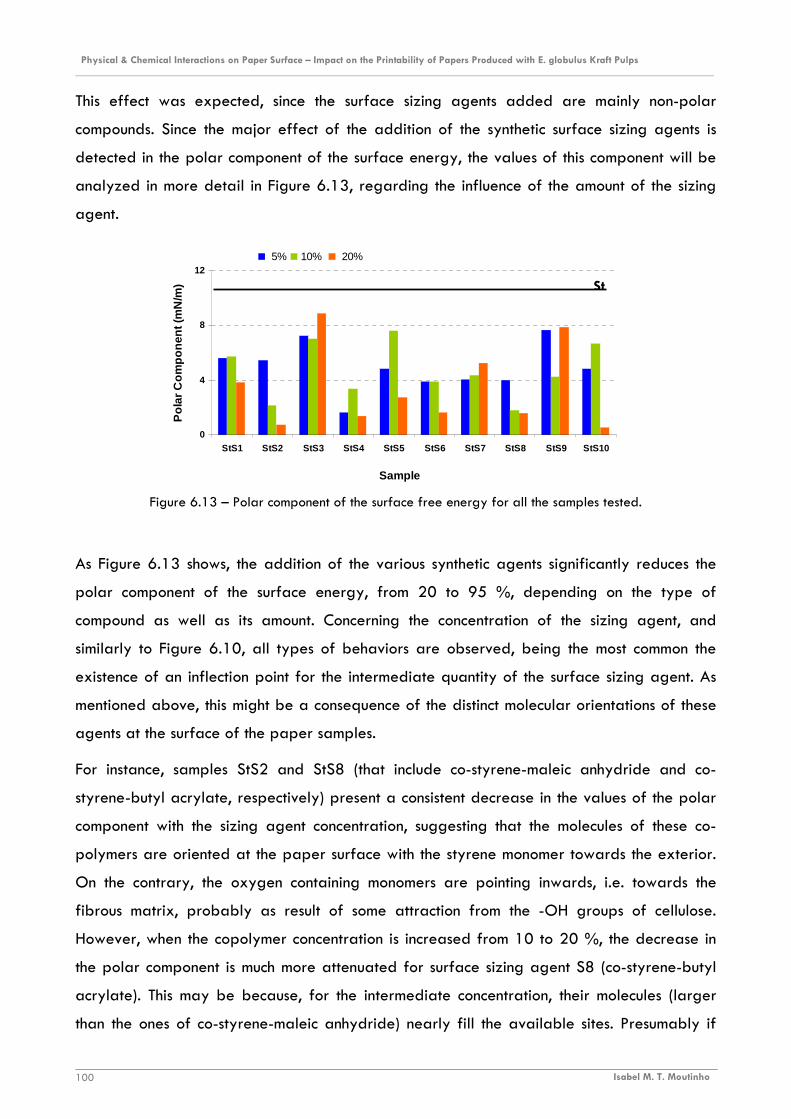
Physical & Chemical Interactions on Paper Surface – Impact on the Printability of Papers Produced with E. globulus Kraft Pulps ________________________________________________________________________________________________________________________
Isabel M. T. Moutinho 100
0
4
8
12
StS1 StS2 StS3 StS4 StS5 StS6 StS7 StS8 StS9 StS10
Sample
Pol
ar C
ompo
nent
(mN
/m)
5% 10% 20%
St
This effect was expected, since the surface sizing agents added are mainly non-polar
compounds. Since the major effect of the addition of the synthetic surface sizing agents is
detected in the polar component of the surface energy, the values of this component will be
analyzed in more detail in Figure 6.13, regarding the influence of the amount of the sizing
agent.
Figure 6.13 – Polar component of the surface free energy for all the samples tested.
As Figure 6.13 shows, the addition of the various synthetic agents significantly reduces the
polar component of the surface energy, from 20 to 95 %, depending on the type of
compound as well as its amount. Concerning the concentration of the sizing agent, and
similarly to Figure 6.10, all types of behaviors are observed, being the most common the
existence of an inflection point for the intermediate quantity of the surface sizing agent. As
mentioned above, this might be a consequence of the distinct molecular orientations of these
agents at the surface of the paper samples.
For instance, samples StS2 and StS8 (that include co-styrene-maleic anhydride and co-
styrene-butyl acrylate, respectively) present a consistent decrease in the values of the polar
component with the sizing agent concentration, suggesting that the molecules of these co-
polymers are oriented at the paper surface with the styrene monomer towards the exterior.
On the contrary, the oxygen containing monomers are pointing inwards, i.e. towards the
fibrous matrix, probably as result of some attraction from the -OH groups of cellulose.
However, when the copolymer concentration is increased from 10 to 20 %, the decrease in
the polar component is much more attenuated for surface sizing agent S8 (co-styrene-butyl
acrylate). This may be because, for the intermediate concentration, their molecules (larger
than the ones of co-styrene-maleic anhydride) nearly fill the available sites. Presumably if
Physical & Chemical Interactions on Paper Surface – Impact on the Printability of Papers Produced with E. globulus Kraft Pulps ________________________________________________________________________________________________________________________
Isabel M. T. Moutinho 101
the amount of this sizing agent would be further increased, the molecules would re-orient and
the polar component would again increase.
This is probably what happened with samples St S3 and StS9 whose polar components
exhibit a minimum for 10 % incorporation. Regarding the surface sizing agent S3 (co-
acrylonitrile-acrylate), for the lowest concentration (5 %), the less polar nitrile group is most
likely oriented outwards. As concentration increases (to 10 %), all the available sites are
nearly filled. A further increase in concentration leads not only to the accumulation of the
molecules but also to their reorientation. The affinity of their functional groups makes that the
acrylate group (more polar) reorient outwards leading to an increase in the polar character
of the surface. A similar explanation can be advanced for the sizing agent S9 (co-styrene-
acrylate): initially the styrene monomer is the one oriented outwards but the increase of the
co-polymer amount after saturation of the available sites originates a re-orientation of the
molecule and ultimately a new increase of the polar component. However, in this case, the
polar component variations are more pronounced than those found for sample StS3, most
certainly because the molecule of compound S9 is larger.
Similar justifications can be produced for the behaviors detected for the remaining surface
sizing agents, being the only difference the critical amount needed to change the molecules
orientation. This amount is probably related to the particle size of the copolymer, as
mentioned above, but might also be related to other factors such as, the penetration of the
surface sizing agent or the surface tension of the liquids.
Since, as Figure 6.12 indicates, the major impact of the surface sizing agents on surface
energetics seems to be derived from contribution of the polar component, the contact angle
was plotted as a function of the surface free energy the ( PSσ ). Figure 6.14 shows the
relationship obtained with water while Table 6.6 gathers the results achieved for the
remaining liquids tested.
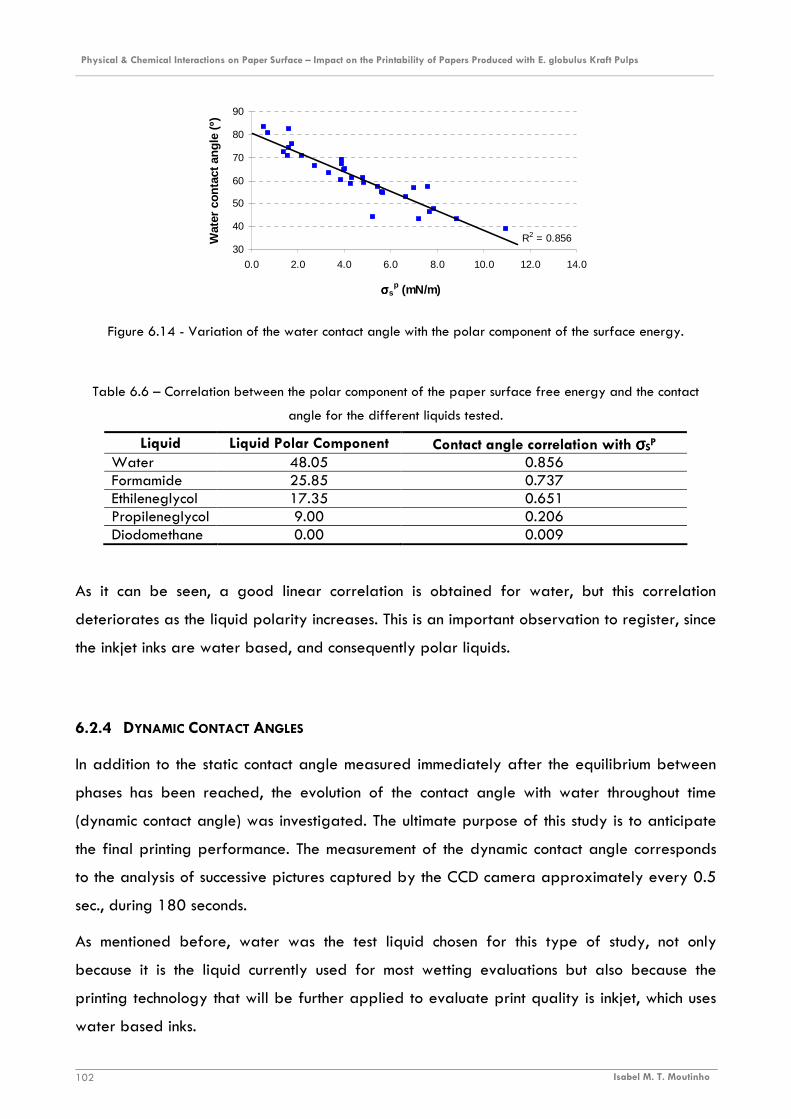
Physical & Chemical Interactions on Paper Surface – Impact on the Printability of Papers Produced with E. globulus Kraft Pulps ________________________________________________________________________________________________________________________
Isabel M. T. Moutinho 102
R2 = 0.85630
40
50
60
70
80
90
0.0 2.0 4.0 6.0 8.0 10.0 12.0 14.0
σσσσsp (mN/m)
Wat
er c
onta
ct a
ngle
(º)
Figure 6.14 - Variation of the water contact angle with the polar component of the surface energy.
Table 6.6 – Correlation between the polar component of the paper surface free energy and the contact
angle for the different liquids tested.
Liquid Liquid Polar Component Contact angle correlation with σσσσSP
Water 48.05 0.856 Formamide 25.85 0.737 Ethileneglycol 17.35 0.651 Propileneglycol 9.00 0.206 Diodomethane 0.00 0.009
As it can be seen, a good linear correlation is obtained for water, but this correlation
deteriorates as the liquid polarity increases. This is an important observation to register, since
the inkjet inks are water based, and consequently polar liquids.
6.2.4 DYNAMIC CONTACT ANGLES
In addition to the static contact angle measured immediately after the equilibrium between
phases has been reached, the evolution of the contact angle with water throughout time
(dynamic contact angle) was investigated. The ultimate purpose of this study is to anticipate
the final printing performance. The measurement of the dynamic contact angle corresponds
to the analysis of successive pictures captured by the CCD camera approximately every 0.5
sec., during 180 seconds.
As mentioned before, water was the test liquid chosen for this type of study, not only
because it is the liquid currently used for most wetting evaluations but also because the
printing technology that will be further applied to evaluate print quality is inkjet, which uses
water based inks.
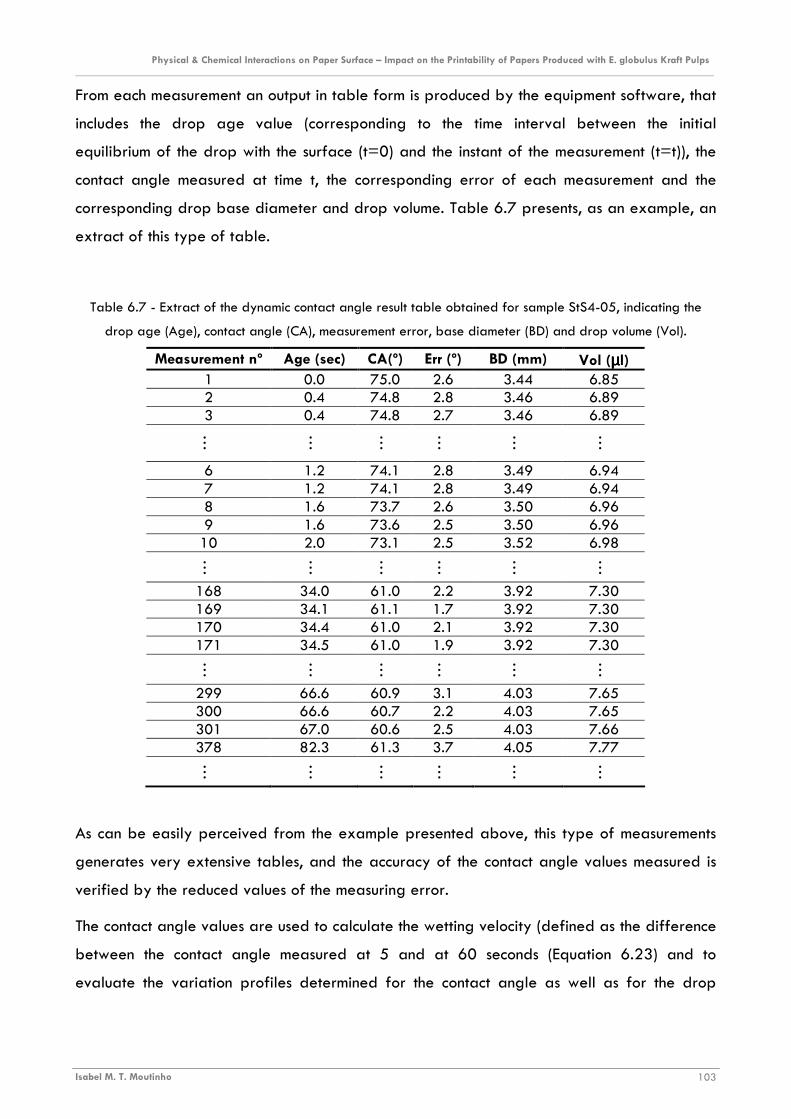
Physical & Chemical Interactions on Paper Surface – Impact on the Printability of Papers Produced with E. globulus Kraft Pulps ________________________________________________________________________________________________________________________
Isabel M. T. Moutinho 103
From each measurement an output in table form is produced by the equipment software, that
includes the drop age value (corresponding to the time interval between the initial
equilibrium of the drop with the surface (t=0) and the instant of the measurement (t=t)), the
contact angle measured at time t, the corresponding error of each measurement and the
corresponding drop base diameter and drop volume. Table 6.7 presents, as an example, an
extract of this type of table.
Table 6.7 - Extract of the dynamic contact angle result table obtained for sample StS4-05, indicating the
drop age (Age), contact angle (CA), measurement error, base diameter (BD) and drop volume (Vol).
Measurement nº Age (sec) CA(º) Err (º) BD (mm) Vol (µµµµl) 1 0.0 75.0 2.6 3.44 6.85 2 0.4 74.8 2.8 3.46 6.89 3 0.4 74.8 2.7 3.46 6.89
…
…
…
…
…
…
6 1.2 74.1 2.8 3.49 6.94 7 1.2 74.1 2.8 3.49 6.94 8 1.6 73.7 2.6 3.50 6.96 9 1.6 73.6 2.5 3.50 6.96
10 2.0 73.1 2.5 3.52 6.98
…
…
…
…
…
…
168 34.0 61.0 2.2 3.92 7.30 169 34.1 61.1 1.7 3.92 7.30 170 34.4 61.0 2.1 3.92 7.30 171 34.5 61.0 1.9 3.92 7.30
…
…
…
…
…
…
299 66.6 60.9 3.1 4.03 7.65 300 66.6 60.7 2.2 4.03 7.65 301 67.0 60.6 2.5 4.03 7.66 378 82.3 61.3 3.7 4.05 7.77
…
…
…
…
…
…
As can be easily perceived from the example presented above, this type of measurements
generates very extensive tables, and the accuracy of the contact angle values measured is
verified by the reduced values of the measuring error.
The contact angle values are used to calculate the wetting velocity (defined as the difference
between the contact angle measured at 5 and at 60 seconds (Equation 6.23) and to
evaluate the variation profiles determined for the contact angle as well as for the drop

Physical & Chemical Interactions on Paper Surface – Impact on the Printability of Papers Produced with E. globulus Kraft Pulps ________________________________________________________________________________________________________________________
Isabel M. T. Moutinho 104
spreading (evaluated from the drop base diameter profile) and for the drop absorption
(evaluated from the drop volume profile).
It should be stressed that in this text the results presented correspond to the average values
obtained for (at least) three independent measurements whereas the results presented in
graphical form correspond to an individual measurements representative of the behavior
detected for the sample under analysis.
The statistical validity of the wetting velocity results is confirmed by ANOVA, as depicted in
Table 6.8.
Table 6.8 – ANOVA results obtained for the wetting velocity values.
Contribution to total variation (%) Variable Among samples Within samples
Reproducibility Factor (r)
P F Fcritical
Wetting Velocity 60.53 39.47 0.05 5.85E-44 126.15 1.65
The average wetting velocity (WV) values obtained for each sample are presented in Table
6.9. To facilitate the analysis the results are divided into four groups depending upon the
value of the wetting velocity: wetting velocities smaller than 0.1º/sec, wetting velocities
between 0.1 and 0.2º/sec, wetting velocities between 0.2 and 0.3º/sec and wetting
velocities larger than 0.3º/sec.

Physical & Chemical Interactions on Paper Surface – Impact on the Printability of Papers Produced with E. globulus Kraft Pulps ________________________________________________________________________________________________________________________
Isabel M. T. Moutinho 105
Table 6.9 – Values of wetting velocity (WV) (Equation 7.23) obtained for each paper sample using water.
Wetting Velocity (º/sec) Sample WV≤ 0.1 0.1 <WV ≤ 0.2 0.2< WV ≤ 0.3 WV> 0.3
St 0.23 ± 0.02 StS1-05 0.21 ±0.00 StS1-10 0.09 ± 0.01 StS1-20 0.06 ± 0.02 StS2-05 0.20 ± 0.00 StS2-10 0.10 ± 0.02 StS2-20 0.04 ± 0.02 StS3-05 0.08 ± 0.02 StS3-10 0.09 ± 0.01 StS3-20 0.09 ± 0.02 StS4-05 0.27 ± 0.02 StS4-10 0.22 ± 0.01 StS4-20 0.16 ± 0.03 StS5-05 0.18 ± 0.01 StS5-10 0.34 ± 0.03 StS5-20 0.44 ± 0.00 StS6-05 0.29 ± 0.01 StS6-10 0.30 ± 0.01 StS6-20 0.36 ± 0.02 StS7-05 0.16 ± 0.01 StS7-10 0.17 ± 0.00 StS7-20 0.09 ± 0.00 StS8-05 0.17 ± 0.00 StS8-10 0.33 ± 0.01 StS8-20 0.22 ± 0.00 StS9-05 0.09 ± 0.01 StS9-10 0.08 ± 0.01 StS9-20 0.21 ± 0.01 StS10-05 0.16 ± 0.01 StS10-10 0.18 ± 0.02 StS10-20 0.23 ± 0.01
As this table shows, most of the sizing formulations lead to water wetting velocities smaller
than that of the standard sample (St), which is 0.23º/sec. However, it should be stressed that,
regarding the wetting velocity, it is not easily obvious which values should be considered
“large” or “small”, since the optimum wetting velocity value for a given paper also depends
upon absorption and spreading phenomena. Concerning P&W papers it is usually accepted
that relatively small wetting velocities are beneficial for inkjet printing performance, if
accompanied with a predominance of absorption over spreading. However, small wetting
values do not necessarily mean better printing performances. In fact, very small wetting
velocities may indicate that the paper has no capacity to absorb the ink solvent, leading to
bad printing performance.
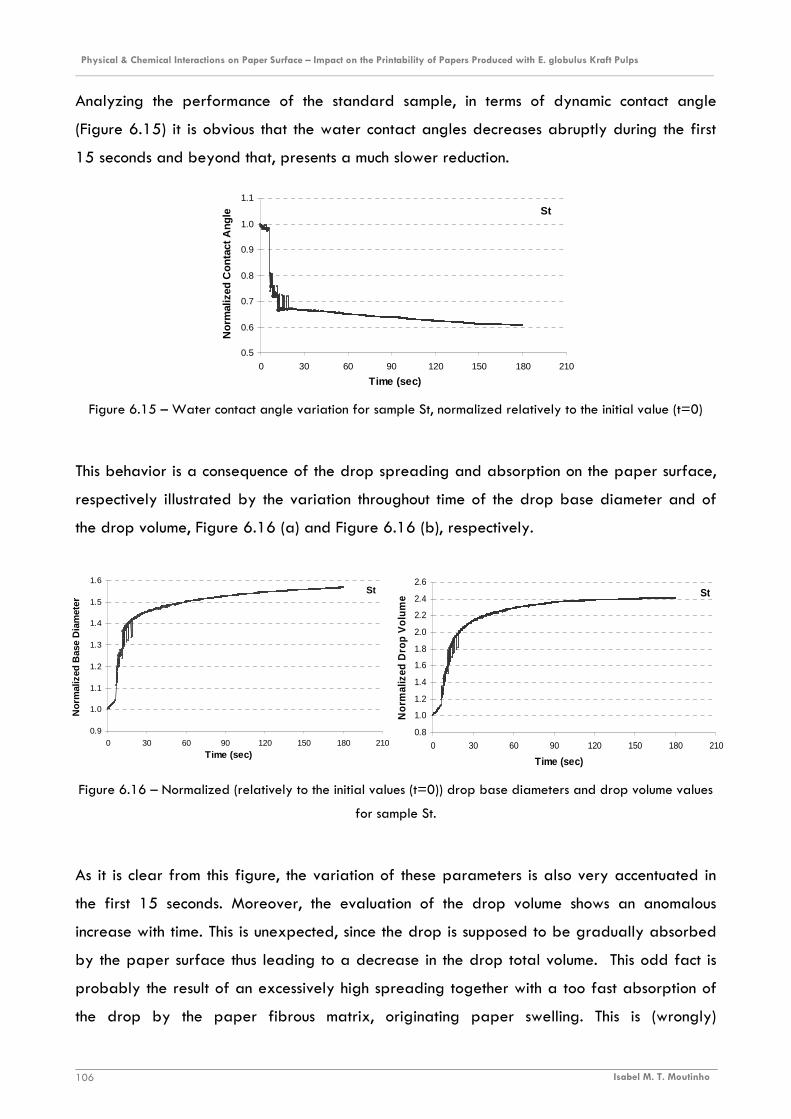
Physical & Chemical Interactions on Paper Surface – Impact on the Printability of Papers Produced with E. globulus Kraft Pulps ________________________________________________________________________________________________________________________
Isabel M. T. Moutinho 106
St
0.5
0.6
0.7
0.8
0.9
1.0
1.1
0 30 60 90 120 150 180 210
Time (sec)
Nor
mal
ized
Con
tact
Ang
le
St
0.8
1.0
1.2
1.4
1.6
1.8
2.0
2.2
2.4
2.6
0 30 60 90 120 150 180 210
Time (sec)
Nor
mal
ized
Dro
p V
olum
e
St
0.9
1.0
1.1
1.2
1.3
1.4
1.5
1.6
0 30 60 90 120 150 180 210
Time (sec)
Nor
mal
ized
Bas
e D
iam
eter
Analyzing the performance of the standard sample, in terms of dynamic contact angle
(Figure 6.15) it is obvious that the water contact angles decreases abruptly during the first
15 seconds and beyond that, presents a much slower reduction.
Figure 6.15 – Water contact angle variation for sample St, normalized relatively to the initial value (t=0)
This behavior is a consequence of the drop spreading and absorption on the paper surface,
respectively illustrated by the variation throughout time of the drop base diameter and of
the drop volume, Figure 6.16 (a) and Figure 6.16 (b), respectively.
Figure 6.16 – Normalized (relatively to the initial values (t=0)) drop base diameters and drop volume values
for sample St.
As it is clear from this figure, the variation of these parameters is also very accentuated in
the first 15 seconds. Moreover, the evaluation of the drop volume shows an anomalous
increase with time. This is unexpected, since the drop is supposed to be gradually absorbed
by the paper surface thus leading to a decrease in the drop total volume. This odd fact is
probably the result of an excessively high spreading together with a too fast absorption of
the drop by the paper fibrous matrix, originating paper swelling. This is (wrongly)

Physical & Chemical Interactions on Paper Surface – Impact on the Printability of Papers Produced with E. globulus Kraft Pulps ________________________________________________________________________________________________________________________
Isabel M. T. Moutinho 107
0.4
0.6
0.8
1.0
1.2
0 30 60 90 120 150 180 210
Time (sec)
Nor
mal
ized
con
tact
Ang
le
StS4-05
0.4
0.6
0.8
1.0
1.2
1.4
0 30 60 90 120 150 180 210
Time (sec)
Nor
mal
ized
Bas
e D
iam
eter StS4-05
0.4
0.6
0.8
1.0
1.2
0 30 60 90 120 150 180 210
Time (sec)
Nor
mal
ized
Dro
p V
olum
e StS4-05
interpreted by the image detecting system as an increase in drop volume. Obviously this
behavior is not adequate for printing purposes, indicating, as expected, that the standard
sample needs further treatment.
In fact, as Table 6.9 shows, the addition of the synthetic surface sizing agents to the starch
suspension usually leads to a decrease in the wetting velocities. However, this decrease can
not be analyzed independently of the evaluation of the drop base diameter and volume, as
explained before.
The profiles determined for each sample, regarding the normalized contact angle, drop
base diameter and drop volume, presented in Appendix E, show that in general the addition
of a synthetic surface sizing agent does not originate that unusual increase in drop diameter.
Moreover, no significant swelling was observed for any of these samples. This is valid either
for wetting velocities larger and smaller than that of the standard sample (0.23º/sec). It can
then be concluded that the sizing agents positively influence the wetting process. Figure 6.17
shows a typical result, obtained for sample StS4-05, that exhibits a wetting velocity similar
to that of the reference sample (0.27º/sec).
Figure 6.17 – Normalized contact angle and normalized drop volume for sample StS4-05.
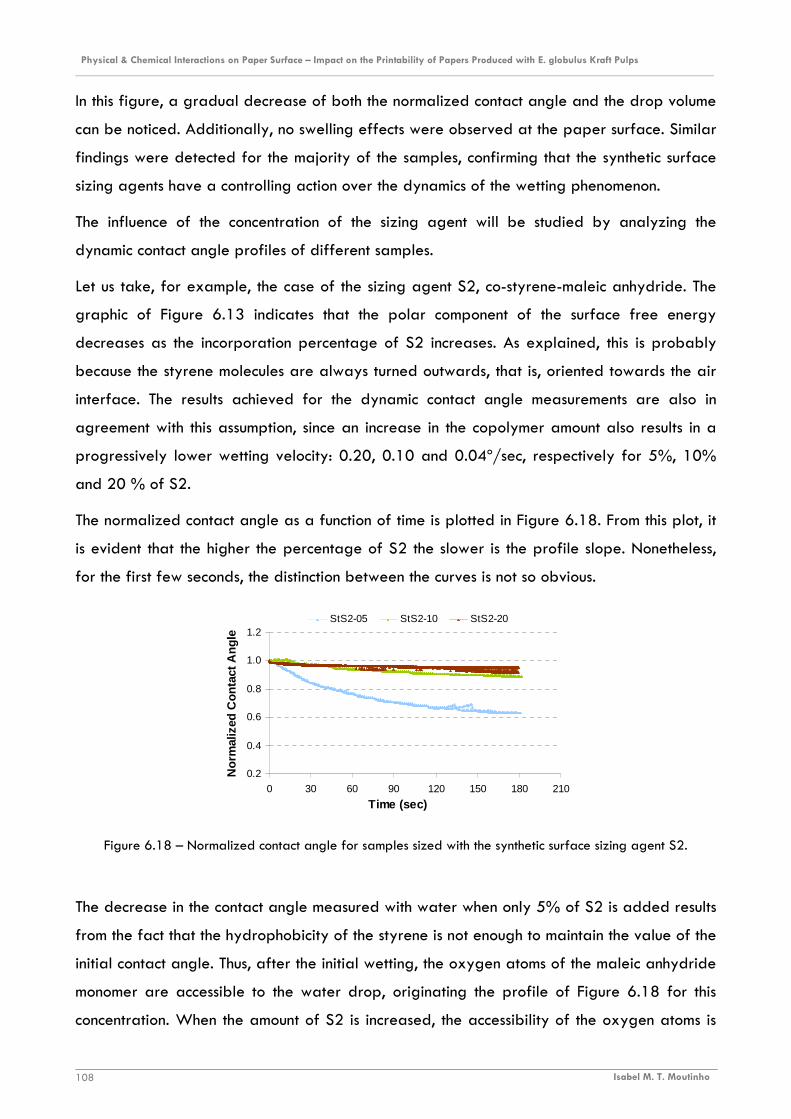
Physical & Chemical Interactions on Paper Surface – Impact on the Printability of Papers Produced with E. globulus Kraft Pulps ________________________________________________________________________________________________________________________
Isabel M. T. Moutinho 108
In this figure, a gradual decrease of both the normalized contact angle and the drop volume
can be noticed. Additionally, no swelling effects were observed at the paper surface. Similar
findings were detected for the majority of the samples, confirming that the synthetic surface
sizing agents have a controlling action over the dynamics of the wetting phenomenon.
The influence of the concentration of the sizing agent will be studied by analyzing the
dynamic contact angle profiles of different samples.
Let us take, for example, the case of the sizing agent S2, co-styrene-maleic anhydride. The
graphic of Figure 6.13 indicates that the polar component of the surface free energy
decreases as the incorporation percentage of S2 increases. As explained, this is probably
because the styrene molecules are always turned outwards, that is, oriented towards the air
interface. The results achieved for the dynamic contact angle measurements are also in
agreement with this assumption, since an increase in the copolymer amount also results in a
progressively lower wetting velocity: 0.20, 0.10 and 0.04º/sec, respectively for 5%, 10%
and 20 % of S2.
The normalized contact angle as a function of time is plotted in Figure 6.18. From this plot, it
is evident that the higher the percentage of S2 the slower is the profile slope. Nonetheless,
for the first few seconds, the distinction between the curves is not so obvious.
0.2
0.4
0.6
0.8
1.0
1.2
0 30 60 90 120 150 180 210
Time (sec)
Nor
mal
ized
Con
tact
Ang
le
StS2-05 StS2-10 StS2-20
Figure 6.18 – Normalized contact angle for samples sized with the synthetic surface sizing agent S2.
The decrease in the contact angle measured with water when only 5% of S2 is added results
from the fact that the hydrophobicity of the styrene is not enough to maintain the value of the
initial contact angle. Thus, after the initial wetting, the oxygen atoms of the maleic anhydride
monomer are accessible to the water drop, originating the profile of Figure 6.18 for this
concentration. When the amount of S2 is increased, the accessibility of the oxygen atoms is

Physical & Chemical Interactions on Paper Surface – Impact on the Printability of Papers Produced with E. globulus Kraft Pulps ________________________________________________________________________________________________________________________
Isabel M. T. Moutinho 109
0.2
0.4
0.6
0.8
1.0
1.2
0 30 60 90 120 150 180 210
Time (sec)
Nor
mal
ized
Bas
e D
iam
eter
StS2-05 StS2-10 StS2-20
0.2
0.4
0.6
0.8
1.0
1.2
0 30 60 90 120 150 180 210
Time (sec)
Nor
mal
ized
Dro
p V
olum
e
StS2-05 StS2-10 StS2-20
delayed, and the styrene mainly rules the wetting process, and thus no significant decrease in
the contact angle occurs. However, and as mentioned before, the analysis of the dynamic
contact angle should not be made independently of the drop behavior in terms of drop base
diameter (spreading) and drop volume (absorption). These results are presented in Figure
6.19
Figure 6.19 – Normalized drop base diameter and drop volume for the samples sized with the synthetic
surface sizing agent S2.
As this figure shows, the decrease in the wetting velocity of sample StS2-05 is found to be
due to high absorption, indicating that the addition of 5% of sizing agent is not sufficient to
decrease that absorption. On the contrary, the addition of 20% of S2 seems excessive, since
the absorption is negligible and thus almost no contact angle variation is detected. The
optimum sizing amount for this surface sizing agent seems to be above 5% and below 20%.
Since the sizing agent S2 is similar in composition to sizing agent S4 (the main difference
being the monomers ratio styrene/maleic anhydride that is 3/1 in the case of S2 and 2/1 in
the case of S4, (Table 3.2), it was found interesting to compare the dynamic performance of
these two copolymers. Figure 6.20 illustrates the variation of contact angle for the three
concentrations tested (5, 10 and 20%) of both styrene-maleic anhydride copolymers.
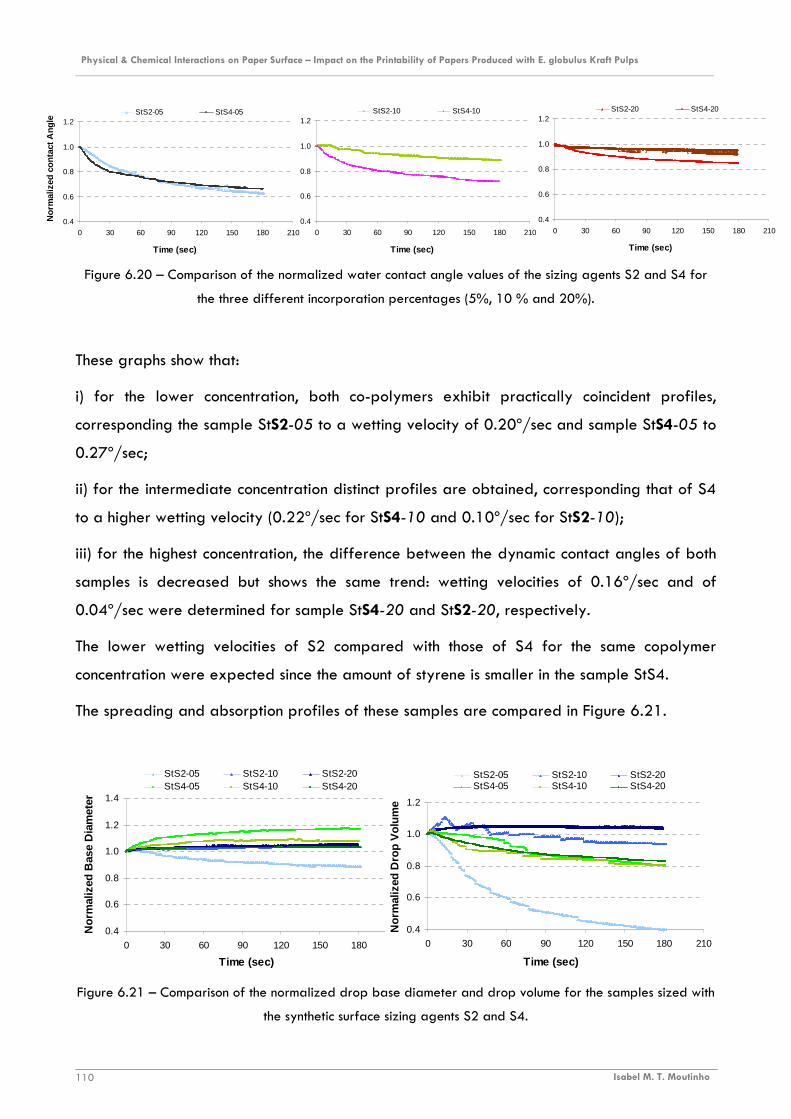
Physical & Chemical Interactions on Paper Surface – Impact on the Printability of Papers Produced with E. globulus Kraft Pulps ________________________________________________________________________________________________________________________
Isabel M. T. Moutinho 110
0.4
0.6
0.8
1.0
1.2
0 30 60 90 120 150 180 210
Time (sec)
Nor
mal
ized
con
tact
Ang
le
StS2-20 StS4-20
0.4
0.6
0.8
1.0
1.2
0 30 60 90 120 150 180 210
Time (sec)
Nor
mal
ized
con
tact
Ang
le
StS2-10 StS4-10
0.4
0.6
0.8
1.0
1.2
0 30 60 90 120 150 180 210
Time (sec)
Nor
mal
ized
con
tact
Ang
le
StS2-05 StS4-05
0.4
0.6
0.8
1.0
1.2
1.4
0 30 60 90 120 150 180 210
Time (sec)
Nor
mal
ized
Bas
e D
iam
eter
StS2-05 StS2-10 StS2-20StS4-05 StS4-10 StS4-20
0.4
0.6
0.8
1.0
1.2
0 30 60 90 120 150 180 210
Time (sec)
Nor
mal
ized
Dro
p V
olum
e
StS2-05 StS2-10 StS2-20 StS4-05 StS4-10 StS4-20
Figure 6.20 – Comparison of the normalized water contact angle values of the sizing agents S2 and S4 for
the three different incorporation percentages (5%, 10 % and 20%).
These graphs show that:
i) for the lower concentration, both co-polymers exhibit practically coincident profiles,
corresponding the sample StS2-05 to a wetting velocity of 0.20º/sec and sample StS4-05 to
0.27º/sec;
ii) for the intermediate concentration distinct profiles are obtained, corresponding that of S4
to a higher wetting velocity (0.22º/sec for StS4-10 and 0.10º/sec for StS2-10);
iii) for the highest concentration, the difference between the dynamic contact angles of both
samples is decreased but shows the same trend: wetting velocities of 0.16º/sec and of
0.04º/sec were determined for sample StS4-20 and StS2-20, respectively.
The lower wetting velocities of S2 compared with those of S4 for the same copolymer
concentration were expected since the amount of styrene is smaller in the sample StS4.
The spreading and absorption profiles of these samples are compared in Figure 6.21.
Figure 6.21 – Comparison of the normalized drop base diameter and drop volume for the samples sized with
the synthetic surface sizing agents S2 and S4.

Physical & Chemical Interactions on Paper Surface – Impact on the Printability of Papers Produced with E. globulus Kraft Pulps ________________________________________________________________________________________________________________________
Isabel M. T. Moutinho 111
0.0
0.2
0.4
0.6
0.8
1.0
1.2
0 30 60 90 120 150 180 210
Time (sec)
Nor
mal
ized
Con
tact
Ang
le
StS9-05 StS9-10 StS9-20
0.0
0.2
0.4
0.6
0.8
1.0
1.2
0 30 60 90 120 150 180 210
Time (sec)
Nor
mal
ized
Bas
e D
iam
eter
StS9-05 StS9-10 StS9-20
0.0
0.2
0.4
0.6
0.8
1.0
1.2
0 30 60 90 120 150 180 210
Time (sec)
Nor
mal
ized
Dro
p V
olum
e
StS9-05 StS9-10 StS9-20
Regarding these profiles, the samples sized with the sizing agent S4 are more consistent with
the corresponding contact angle profiles, exhibiting a continuous increase in the drop base
diameter and a decrease in the drop volume. For 20% of incorporation, the contact angle
variation is caused almost only by absorption. This suggests that, most probably, the sample
StS4-20 will be the one with better inkjet printing performance among these.
Figure 6.22 and Figure 6.23 illustrate the dynamic behavior of the samples sized with the
sizing agent S9 that also contains styrene (co-styrene-acrylate, Table 3.2).
Figure 6.22 - Normalized contact angle for samples sized with the synthetic surface sizing agent S9.
Figure 6.23 - Normalized drop base diameter and drop volume for the samples sized with the synthetic
surface sizing agent S9.
The analysis of the surface energy results (Section 6.2.3) suggested that, for 5 and 10% of
incorporation of this sizing agent, the styrene groups are the ones oriented outwards.
However, at 20% of incorporation, a re-orientation of the molecule takes place and the
acrylate groups are the ones facing the air interface. The dynamic behaviors depicted in
Figure 6.22 and Figure 6.23 also show similar profiles for the lower concentrations (5 % and
10 %) and a distinctive performance for 20 % of incorporation. The latter corresponds to a
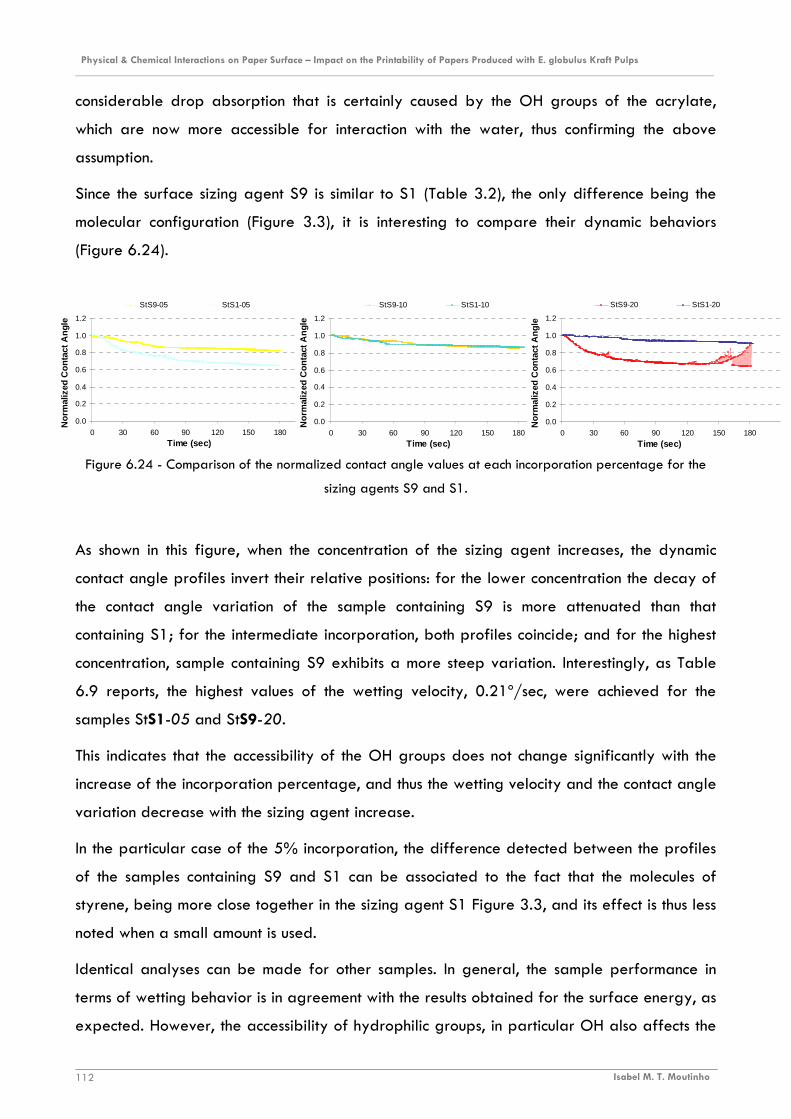
Physical & Chemical Interactions on Paper Surface – Impact on the Printability of Papers Produced with E. globulus Kraft Pulps ________________________________________________________________________________________________________________________
Isabel M. T. Moutinho 112
0.0
0.2
0.4
0.6
0.8
1.0
1.2
0 30 60 90 120 150 180 210Time (sec)
Nor
mal
ized
Con
tact
Ang
le
StS9-05 StS1-05
0.0
0.2
0.4
0.6
0.8
1.0
1.2
0 30 60 90 120 150 180 210Time (sec)
Nor
mal
ized
Con
tact
Ang
leStS9-10 StS1-10
0.0
0.2
0.4
0.6
0.8
1.0
1.2
0 30 60 90 120 150 180
Time (sec)
Nor
mal
ized
Con
tact
Ang
le
StS9-20 StS1-20
considerable drop absorption that is certainly caused by the OH groups of the acrylate,
which are now more accessible for interaction with the water, thus confirming the above
assumption.
Since the surface sizing agent S9 is similar to S1 (Table 3.2), the only difference being the
molecular configuration (Figure 3.3), it is interesting to compare their dynamic behaviors
(Figure 6.24).
Figure 6.24 - Comparison of the normalized contact angle values at each incorporation percentage for the
sizing agents S9 and S1.
As shown in this figure, when the concentration of the sizing agent increases, the dynamic
contact angle profiles invert their relative positions: for the lower concentration the decay of
the contact angle variation of the sample containing S9 is more attenuated than that
containing S1; for the intermediate incorporation, both profiles coincide; and for the highest
concentration, sample containing S9 exhibits a more steep variation. Interestingly, as Table
6.9 reports, the highest values of the wetting velocity, 0.21º/sec, were achieved for the
samples StS1-05 and StS9-20.
This indicates that the accessibility of the OH groups does not change significantly with the
increase of the incorporation percentage, and thus the wetting velocity and the contact angle
variation decrease with the sizing agent increase.
In the particular case of the 5% incorporation, the difference detected between the profiles
of the samples containing S9 and S1 can be associated to the fact that the molecules of
styrene, being more close together in the sizing agent S1 Figure 3.3, and its effect is thus less
noted when a small amount is used.
Identical analyses can be made for other samples. In general, the sample performance in
terms of wetting behavior is in agreement with the results obtained for the surface energy, as
expected. However, the accessibility of hydrophilic groups, in particular OH also affects the

Physical & Chemical Interactions on Paper Surface – Impact on the Printability of Papers Produced with E. globulus Kraft Pulps ________________________________________________________________________________________________________________________
Isabel M. T. Moutinho 113
dynamic contact angle profile. Additionally, the orientation of the functional groups of the
sizing agents at the paper surface is of great importance since it affects the accessibility of
the hydrophilic groups.

CHAPTER 7
INVERSE GAS CHROMATOGRAPHY
(IGC)

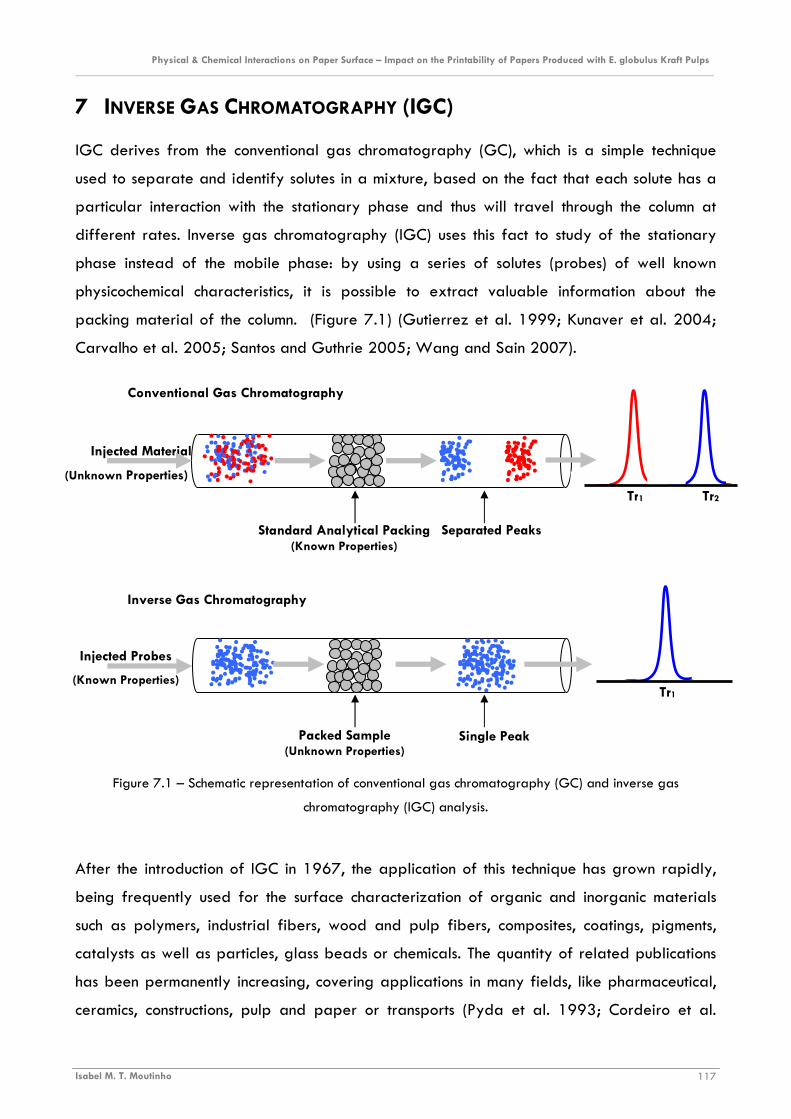
Physical & Chemical Interactions on Paper Surface – Impact on the Printability of Papers Produced with E. globulus Kraft Pulps ________________________________________________________________________________________________________________________
Isabel M. T. Moutinho 117
7 INVERSE GAS CHROMATOGRAPHY (IGC)
IGC derives from the conventional gas chromatography (GC), which is a simple technique
used to separate and identify solutes in a mixture, based on the fact that each solute has a
particular interaction with the stationary phase and thus will travel through the column at
different rates. Inverse gas chromatography (IGC) uses this fact to study of the stationary
phase instead of the mobile phase: by using a series of solutes (probes) of well known
physicochemical characteristics, it is possible to extract valuable information about the
packing material of the column. (Figure 7.1) (Gutierrez et al. 1999; Kunaver et al. 2004;
Carvalho et al. 2005; Santos and Guthrie 2005; Wang and Sain 2007).
Figure 7.1 – Schematic representation of conventional gas chromatography (GC) and inverse gas
chromatography (IGC) analysis.
After the introduction of IGC in 1967, the application of this technique has grown rapidly,
being frequently used for the surface characterization of organic and inorganic materials
such as polymers, industrial fibers, wood and pulp fibers, composites, coatings, pigments,
catalysts as well as particles, glass beads or chemicals. The quantity of related publications
has been permanently increasing, covering applications in many fields, like pharmaceutical,
ceramics, constructions, pulp and paper or transports (Pyda et al. 1993; Cordeiro et al.
Injected Material
Standard Analytical Packing (Known Properties)
Separated Peaks
Tr1 Tr2
Conventional Gas Chromatography
Injected Probes
(Known Properties)
Packed Sample (Unknown Properties)
Single Peak
Tr1
Inverse Gas Chromatography
(Unknown Properties)

Physical & Chemical Interactions on Paper Surface – Impact on the Printability of Papers Produced with E. globulus Kraft Pulps ________________________________________________________________________________________________________________________
Isabel M. T. Moutinho 118
1995; van Asten et al. 2000; Belgacem 2000; Keller and Luner 2000; Wålinder and
Gardner 2000; Tze and Gardner 2001; Uhlmann and Schneider 2002; Aquino et al. 2003;
Planinšek and Buckton 2003; Kunaver et al. 2004; Baoli et al. 2007; Bardavic et al. 2007;
Lindsay et al. 2007; Rjiba et al. 2007; Saxena et al. 2007; Voelkel and Strzemiecka 2007;
Wang and Sain 2007).
In the particular case of pulp and paper, the use of IGC to evaluate the properties of fibers
and pulps is common, and several studies covering themes such as the surface energetics of
cellulose fibers properties, or the effects the cooking and bleaching processes on surface and
strength properties can be found in the literature (Felix and Gatenholm 1993; Belgacem et
al. 1995; Böras et al. 1997; Liu et al. 1998; Shen et al. 1998; Shen and Parker 1999; van
Asten et al. 2000; Belgacem 2000; Aquino et al. 2003; Shakeri and Tabar-Haidar 2004;
Carvalho et al. 2005). However, the use of IGC to study paper surface and, in particular, its
interaction with ink is more recent and is still matter of development (Shen et al. 2000;
Santos et al. 2001; Moutinho et al. 2007a; Moutinho et al. 2008a).
The application of IGC to the surface characterization of paper samples enables the
evaluation of the dispersive component of the surface energy arising from London and Van-
der-Waals forces as well as its variation with temperature. Moreover, it also enables the
analysis of the surface acid-base character according to the Lewis concept (i.e., ability to
accept and donate electrons) (Gutierrez et al. 1999; Carvalho et al. 2005; Santos and
Guthrie 2005; Wang and Sain 2007; Aquino et al. 2003). It is in this context that IGC will
be used in the present work.
The theoretical principles of IGC are a widely discussed matter and many studies can be
found in the literature regarding the subject (Belgacem et al. 1995; Cordeiro et al. 1995; Liu
et al. 1998; Shen and Parker 1999; van Asten et al. 2000; Belgacem 2000; Wålinder and
Gardner 2000; Aquino et al. 2003; Planinšek and Buckton 2003; Kunaver et al. 2004;
Shakeri and Tabar-Haidar 2004; Carvalho et al. 2005; Santos and Guthrie 2005; Wang
and Sain 2007) thus, only brief considerations, useful to better understand the work, will be
presented here.
Physical & Chemical Interactions on Paper Surface – Impact on the Printability of Papers Produced with E. globulus Kraft Pulps ________________________________________________________________________________________________________________________
Isabel M. T. Moutinho 119
7.1 THEORY
In an IGC analysis, an inert carrier gas elutes a minute quantity of a probe molecule through
a column packed with the material under study. Due to the interactions between the
stationary and the mobile phase, the probe molecules are retained for a certain time (tr),
known as the retention time, which is used to calculate the net retention volume (Vn),
according to:
JFttVn r ⋅⋅−= )( 0 (7.1)
where t0 is the dead retention time of a marker probe, F is the carrier gas flow rate and J is
the correction factor for gas compressibility, calculated according to Equation 7.2:
1
1
5.13
0
2
0
−
−
=
P
P
P
P
Ji
i
(7.2)
Pi and P0 are the inlet and outlet pressures of the carrier gas, respectively.
Taking into account the fact of the experiments being undertaken at infinite dilution
conditions, the free energy of adsorption of the probes on the stationary phase surface per
mole (∆G) can be determined from the retention volume (Vn) according to Equation 7.3:
1)ln( CVnTRG +⋅⋅=∆− (7.3)
where R is the ideal gas constant, T is the absolute column temperature and C1 is a constant
which depends upon the chromatographic column.
Considering that the dispersive and specific components, ∆GD and ∆GS, respectively, are
additive (Equation 7.4), as suggested by Fowkes in 1987, Equation 7.3 can be rewritten as:
SD GGG ∆+∆=∆ (7.4)
Considering Equation 7.3, the above equation leads to
1)ln()( CVnTRGG SD +⋅⋅=∆+∆− (7.5)
On the other hand, the free energy of adsorption can also be related to the work of
adhesion (Wa) according to Equation 7.6:
WaaNG ⋅⋅=∆− (7.6)
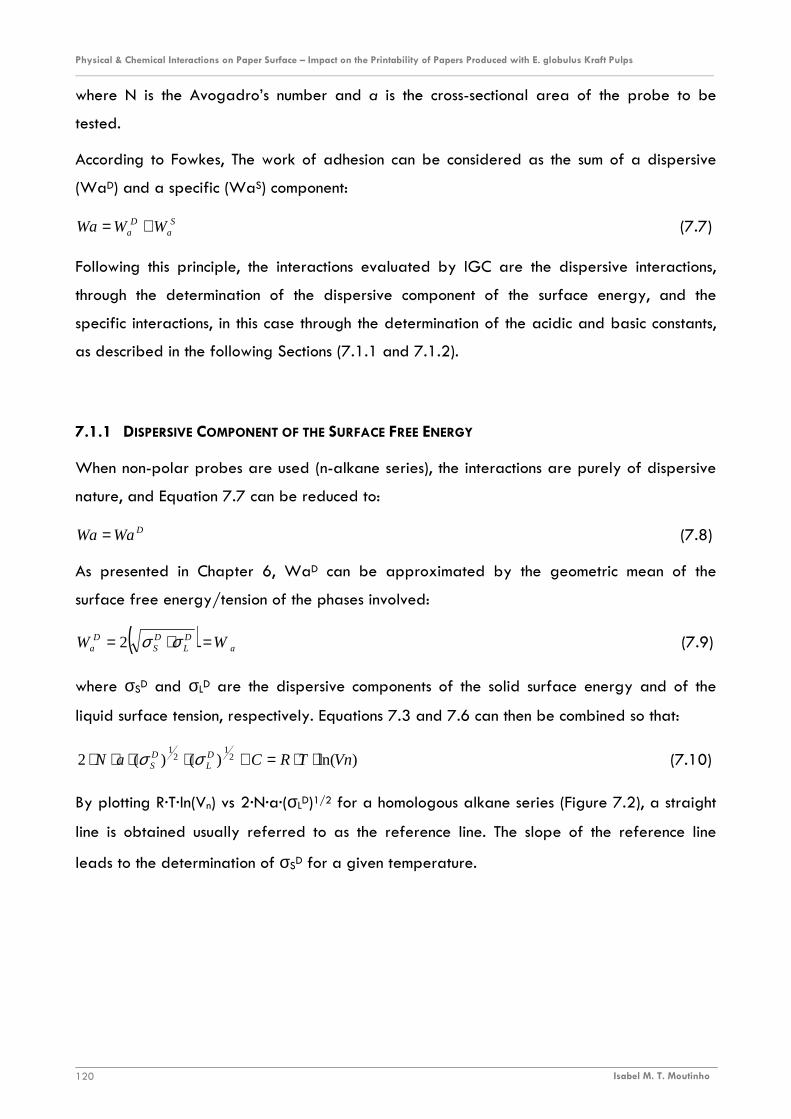
Physical & Chemical Interactions on Paper Surface – Impact on the Printability of Papers Produced with E. globulus Kraft Pulps ________________________________________________________________________________________________________________________
Isabel M. T. Moutinho 120
where N is the Avogadro’s number and a is the cross-sectional area of the probe to be
tested.
According to Fowkes, The work of adhesion can be considered as the sum of a dispersive
(WaD) and a specific (WaS) component:
Sa
Da WWWa += (7.7)
Following this principle, the interactions evaluated by IGC are the dispersive interactions,
through the determination of the dispersive component of the surface energy, and the
specific interactions, in this case through the determination of the acidic and basic constants,
as described in the following Sections (7.1.1 and 7.1.2).
7.1.1 DISPERSIVE COMPONENT OF THE SURFACE FREE ENERGY
When non-polar probes are used (n-alkane series), the interactions are purely of dispersive
nature, and Equation 7.7 can be reduced to:
DWaWa = (7.8)
As presented in Chapter 6, WaD can be approximated by the geometric mean of the
surface free energy/tension of the phases involved:
( ) aDL
DS
Da WW =⋅= σσ2 (7.9)
where σSD and σLD are the dispersive components of the solid surface energy and of the
liquid surface tension, respectively. Equations 7.3 and 7.6 can then be combined so that:
)ln()()(2 21
21
VnTRCaN DL
DS ⋅⋅=+⋅⋅⋅⋅ σσ (7.10)
By plotting R·T·ln(Vn) vs 2·N·a·(σLD)1/2 for a homologous alkane series (Figure 7.2), a straight
line is obtained usually referred to as the reference line. The slope of the reference line
leads to the determination of σSD for a given temperature.

Physical & Chemical Interactions on Paper Surface – Impact on the Printability of Papers Produced with E. globulus Kraft Pulps ________________________________________________________________________________________________________________________
Isabel M. T. Moutinho 121
Figure 7.2 – Schematic representation of the method used to calculate σSD at a given temperature using IGC.
7.1.2 ACID-BASE CHARACTER
In the late 70´s, it was proposed by Fowkes that the totality of specific interactions may be
interpreted as Lewis acid-base forces, and thus that the dispersive forces and acid-base
interactions are the primary forces operating across the interface. This approach has been
later supported by experimental results.
The acid-base interactions are analyzed through the net retention volume measured using
polar probes. In order to obtain the acidic (Ka) and the basic (Kb) parameters of the solid
surface, the vertical deviations from the reference line for each polar probe, are quantified,
allowing the estimation of the specific component of free energy (∆GS) as:
)ln()ln( Re fS VnTRVnpTRG ⋅⋅−⋅⋅=∆− (7.11)
where Vn,Ref is the retention volume established by the n-alkanes reference line, and Vnp is the
retention volume of the polar probes. The adhesion work between the polar probes tested
and the paper samples (Was) can be obtained from the specific free energy (Eq.7.6) as:
⋅⋅=
f
sa Vn
Vnp
aN
TRW
Re
ln (7.12)
In order to relate these concepts with the acid-base interactions, which according to Fowkes
can be considered as the origin of all specific interactions, it is necessary to make use of the
following thermodynamic definitions:
ABABAB STHG ∆⋅−∆=∆ (7.13)
ANKbDNKaH AB ⋅+⋅=∆ (7.14)
R·T·ln(Vn)
2·N·a·(σLD)1/2
α: tg(α)= (σSD)1/2
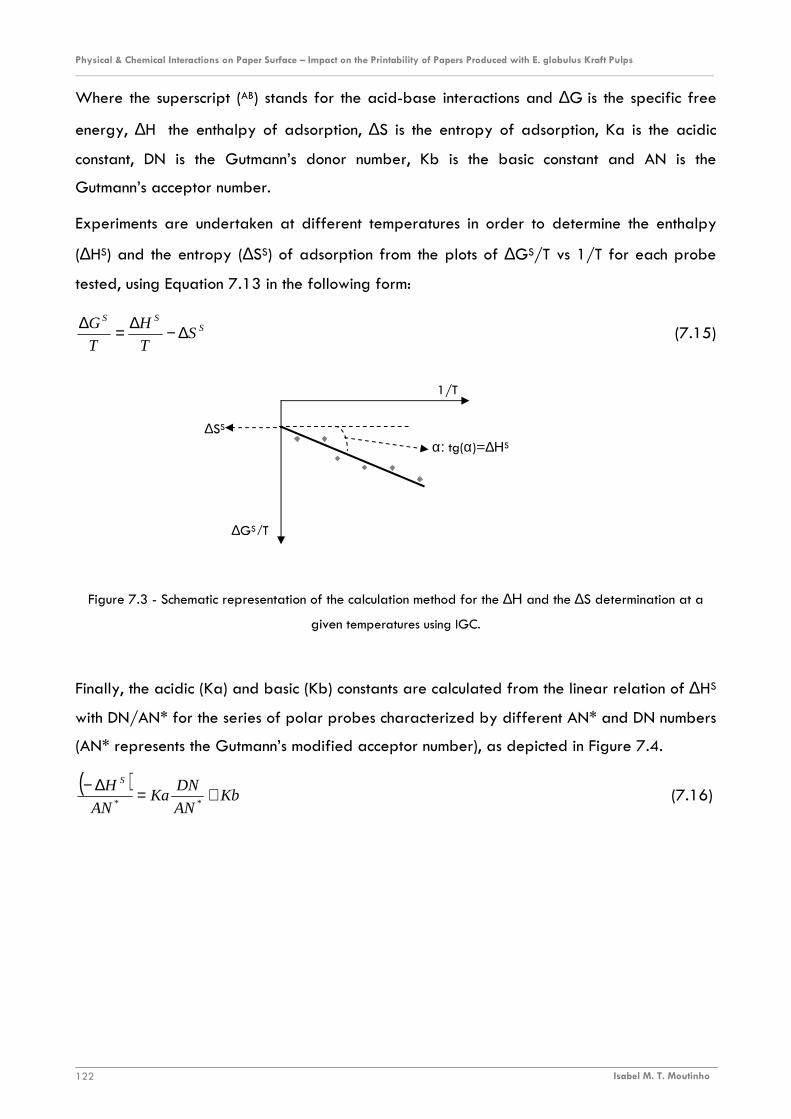
Physical & Chemical Interactions on Paper Surface – Impact on the Printability of Papers Produced with E. globulus Kraft Pulps ________________________________________________________________________________________________________________________
Isabel M. T. Moutinho 122
Where the superscript (AB) stands for the acid-base interactions and ∆G is the specific free
energy, ∆H the enthalpy of adsorption, ∆S is the entropy of adsorption, Ka is the acidic
constant, DN is the Gutmann’s donor number, Kb is the basic constant and AN is the
Gutmann’s acceptor number.
Experiments are undertaken at different temperatures in order to determine the enthalpy
(∆HS) and the entropy (∆SS) of adsorption from the plots of ∆GS/T vs 1/T for each probe
tested, using Equation 7.13 in the following form:
SSS
ST
H
T
G ∆−∆=∆ (7.15)
Figure 7.3 - Schematic representation of the calculation method for the ∆Η and the ∆S determination at a
given temperatures using IGC.
Finally, the acidic (Ka) and basic (Kb) constants are calculated from the linear relation of ∆HS
with DN/AN* for the series of polar probes characterized by different AN* and DN numbers
(AN* represents the Gutmann’s modified acceptor number), as depicted in Figure 7.4.
( )Kb
AN
DNKa
AN
H S
+=∆−**
(7.16)
α: tg(α)=∆ΗS
∆GS/T
1/T
∆SS
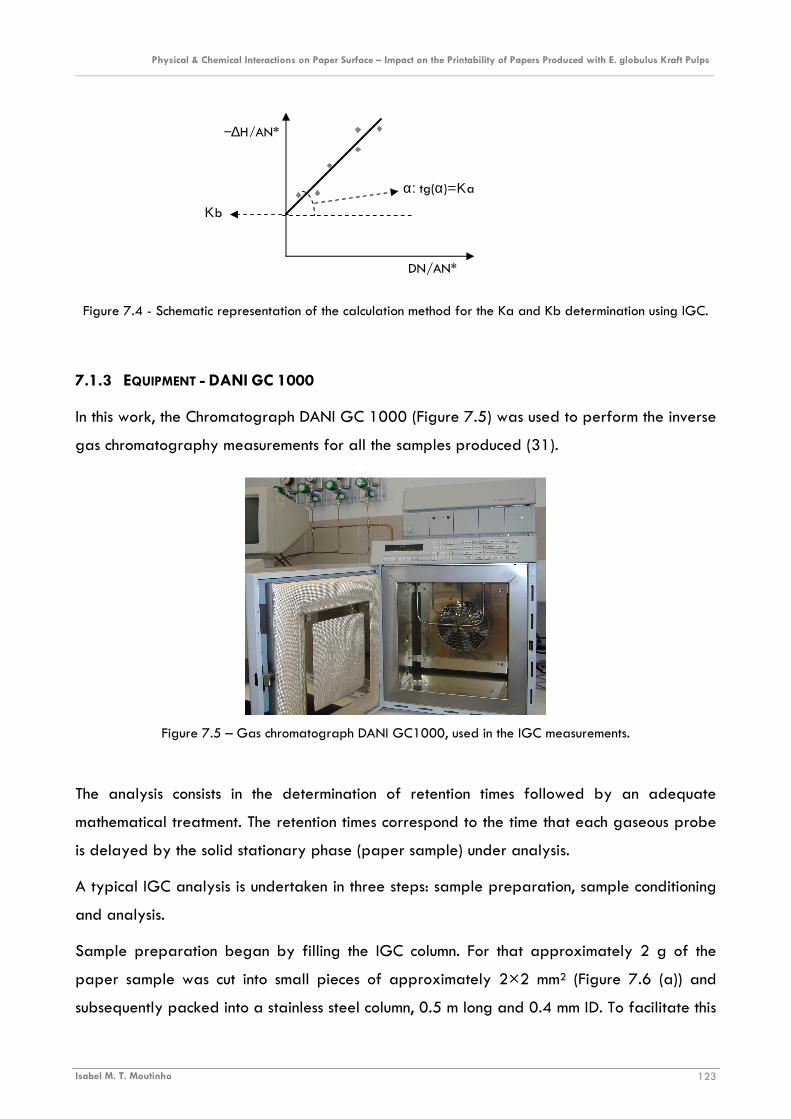
Physical & Chemical Interactions on Paper Surface – Impact on the Printability of Papers Produced with E. globulus Kraft Pulps ________________________________________________________________________________________________________________________
Isabel M. T. Moutinho 123
Figure 7.4 - Schematic representation of the calculation method for the Ka and Kb determination using IGC.
7.1.3 EQUIPMENT - DANI GC 1000
In this work, the Chromatograph DANI GC 1000 (Figure 7.5) was used to perform the inverse
gas chromatography measurements for all the samples produced (31).
Figure 7.5 – Gas chromatograph DANI GC1000, used in the IGC measurements.
The analysis consists in the determination of retention times followed by an adequate
mathematical treatment. The retention times correspond to the time that each gaseous probe
is delayed by the solid stationary phase (paper sample) under analysis.
A typical IGC analysis is undertaken in three steps: sample preparation, sample conditioning
and analysis.
Sample preparation began by filling the IGC column. For that approximately 2 g of the
paper sample was cut into small pieces of approximately 2×2 mm2 (Figure 7.6 (a)) and
subsequently packed into a stainless steel column, 0.5 m long and 0.4 mm ID. To facilitate this
−∆H/AN*
DN/AN*
Κb
α: tg(α)=Κa
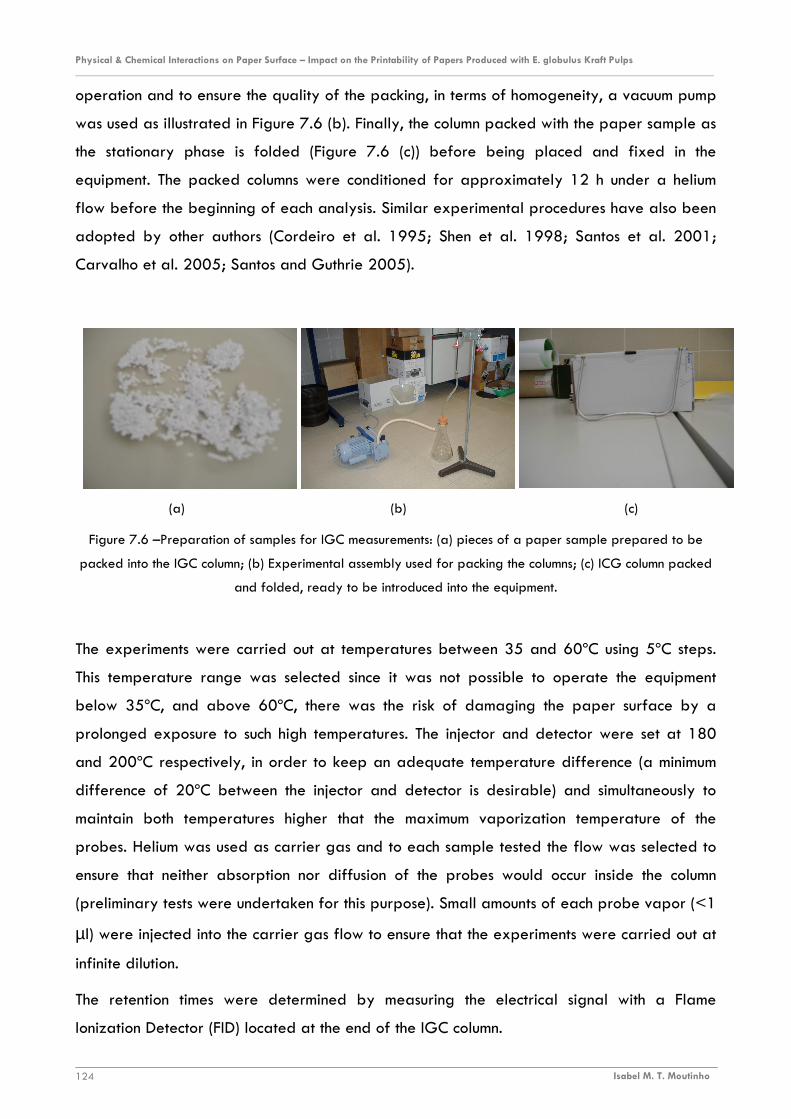
Physical & Chemical Interactions on Paper Surface – Impact on the Printability of Papers Produced with E. globulus Kraft Pulps ________________________________________________________________________________________________________________________
Isabel M. T. Moutinho 124
operation and to ensure the quality of the packing, in terms of homogeneity, a vacuum pump
was used as illustrated in Figure 7.6 (b). Finally, the column packed with the paper sample as
the stationary phase is folded (Figure 7.6 (c)) before being placed and fixed in the
equipment. The packed columns were conditioned for approximately 12 h under a helium
flow before the beginning of each analysis. Similar experimental procedures have also been
adopted by other authors (Cordeiro et al. 1995; Shen et al. 1998; Santos et al. 2001;
Carvalho et al. 2005; Santos and Guthrie 2005).
Figure 7.6 –Preparation of samples for IGC measurements: (a) pieces of a paper sample prepared to be
packed into the IGC column; (b) Experimental assembly used for packing the columns; (c) ICG column packed
and folded, ready to be introduced into the equipment.
The experiments were carried out at temperatures between 35 and 60ºC using 5ºC steps.
This temperature range was selected since it was not possible to operate the equipment
below 35ºC, and above 60ºC, there was the risk of damaging the paper surface by a
prolonged exposure to such high temperatures. The injector and detector were set at 180
and 200ºC respectively, in order to keep an adequate temperature difference (a minimum
difference of 20ºC between the injector and detector is desirable) and simultaneously to
maintain both temperatures higher that the maximum vaporization temperature of the
probes. Helium was used as carrier gas and to each sample tested the flow was selected to
ensure that neither absorption nor diffusion of the probes would occur inside the column
(preliminary tests were undertaken for this purpose). Small amounts of each probe vapor (<1
µl) were injected into the carrier gas flow to ensure that the experiments were carried out at
infinite dilution.
The retention times were determined by measuring the electrical signal with a Flame
Ionization Detector (FID) located at the end of the IGC column.
(a) (b) (c)

Physical & Chemical Interactions on Paper Surface – Impact on the Printability of Papers Produced with E. globulus Kraft Pulps ________________________________________________________________________________________________________________________
Isabel M. T. Moutinho 125
The n-alkane probes used to determine the dispersive component of the surface energy
were: n-hexane, n-heptane, n-octane, n-nonane and n-decane. To evaluate the acid/base
properties, the polar probes used were: dichloromethane (DCM, CH2Cl2, acidic),
trichloromethane (TCM, CHCl3, acidic), acetone (Acet, C8H6O, amphoteric), ethyl acetate
(ETA, CH3COOCH2CH3, amphoteric) and tetrahydrofuran (THF, C4H8O, basic). Natural gas
(83.7 % methane) was used to determine the dead retention volume.
The relevant characteristics of the probes used, such as the dispersive component (σLD) of the
surface tension, molecular surface area (a), Gutmann’s modified acceptor number (AN*), (DN)
and Lewis character are gathered in Table 7.1.
Table 7.1 – Properties of the probe molecules used*.
Probe Nomenclature Molecular
Weight (g)
γγγγld (mJ/m2)
a (Å2)
AN* (kJ/mol)
DN (kJ/mol)
Lewis Characteristics
C6H14 C6 86.2 18.4 51.4 - - neutral C7 H16 C7 100.2 20.3 57.0 - - neutral C8 H18 C8 114.2 21.3 62.8 - - neutral C9 H20 C9 128.3 22.7 68.9 - - neutral C10 H22 C10 142.3 23.9 75.0 - - neutral CH2Cl2 DCM 84.9 27.4 31.5 16.4 0 acidic CHCl3 TCM 119.4 25.0 44.0 22.7 0 acidic C8H6O Acet 58.1 16.5 42.5 10.5 71.4 amphoteric
CH3COOCH2CH3 (ETA)
ETA 88.1 19.6 48.0 6.3 71.8 amphoteric C4H8O THF 72.1 22.5 45.0 2.1 84.4 basic
* Cordeiro et al. 1995; Liu et al. 1998; Shen and Parker 1999; van Asten et al. 2000; Wålinder and Gardner 2000; Shakeri and
Tabar-Haidar 2004; Carvalho et al. 2005; Santos 2005
At least three determinations of the retention time were carried out for each of the eleven
probes (methane, n-hexane, n-heptane, n-octane, n-nonane and n-decane, trichloromethane,
dichloromethane, acetone, ethyl acetate, and tetrahydrofuran), for six different
temperatures: 35ºC, 40ºC, 45ºC, 50ºC, 55ºC and 60ºC.
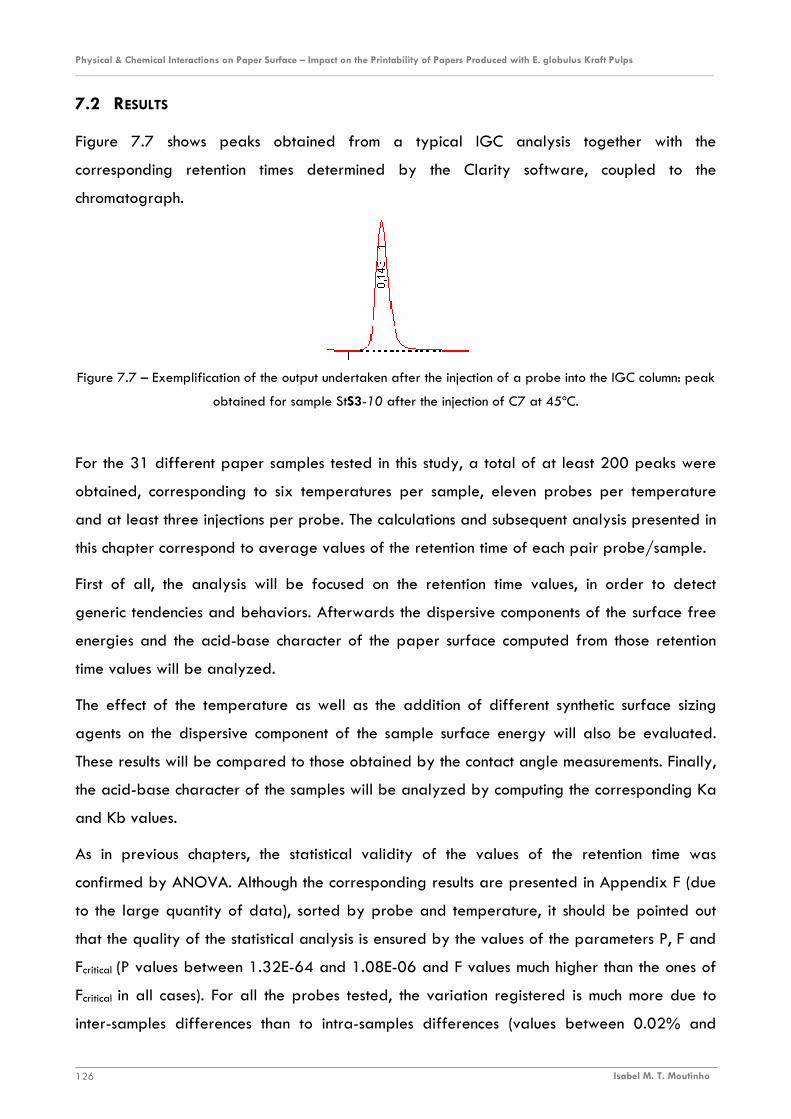
Physical & Chemical Interactions on Paper Surface – Impact on the Printability of Papers Produced with E. globulus Kraft Pulps ________________________________________________________________________________________________________________________
Isabel M. T. Moutinho 126
7.2 RESULTS
Figure 7.7 shows peaks obtained from a typical IGC analysis together with the
corresponding retention times determined by the Clarity software, coupled to the
chromatograph.
Figure 7.7 – Exemplification of the output undertaken after the injection of a probe into the IGC column: peak
obtained for sample StS3-10 after the injection of C7 at 45ºC.
For the 31 different paper samples tested in this study, a total of at least 200 peaks were
obtained, corresponding to six temperatures per sample, eleven probes per temperature
and at least three injections per probe. The calculations and subsequent analysis presented in
this chapter correspond to average values of the retention time of each pair probe/sample.
First of all, the analysis will be focused on the retention time values, in order to detect
generic tendencies and behaviors. Afterwards the dispersive components of the surface free
energies and the acid-base character of the paper surface computed from those retention
time values will be analyzed.
The effect of the temperature as well as the addition of different synthetic surface sizing
agents on the dispersive component of the sample surface energy will also be evaluated.
These results will be compared to those obtained by the contact angle measurements. Finally,
the acid-base character of the samples will be analyzed by computing the corresponding Ka
and Kb values.
As in previous chapters, the statistical validity of the values of the retention time was
confirmed by ANOVA. Although the corresponding results are presented in Appendix F (due
to the large quantity of data), sorted by probe and temperature, it should be pointed out
that the quality of the statistical analysis is ensured by the values of the parameters P, F and
Fcritical (P values between 1.32E-64 and 1.08E-06 and F values much higher than the ones of
Fcritical in all cases). For all the probes tested, the variation registered is much more due to
inter-samples differences than to intra-samples differences (values between 0.02% and
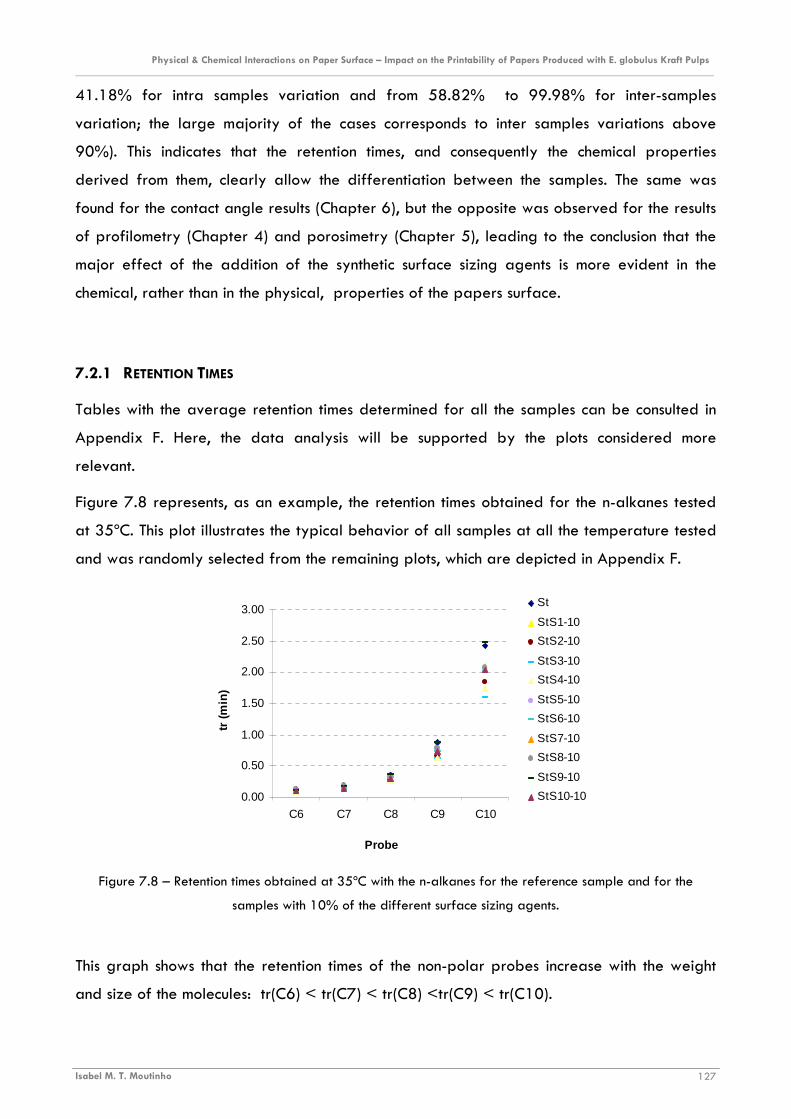
Physical & Chemical Interactions on Paper Surface – Impact on the Printability of Papers Produced with E. globulus Kraft Pulps ________________________________________________________________________________________________________________________
Isabel M. T. Moutinho 127
0.00
0.50
1.00
1.50
2.00
2.50
3.00
C6 C7 C8 C9 C10
Probe
tr (m
in)
St
StS1-10
StS2-10
StS3-10
StS4-10
StS5-10
StS6-10
StS7-10
StS8-10
StS9-10
StS10-10
41.18% for intra samples variation and from 58.82% to 99.98% for inter-samples
variation; the large majority of the cases corresponds to inter samples variations above
90%). This indicates that the retention times, and consequently the chemical properties
derived from them, clearly allow the differentiation between the samples. The same was
found for the contact angle results (Chapter 6), but the opposite was observed for the results
of profilometry (Chapter 4) and porosimetry (Chapter 5), leading to the conclusion that the
major effect of the addition of the synthetic surface sizing agents is more evident in the
chemical, rather than in the physical, properties of the papers surface.
7.2.1 RETENTION TIMES
Tables with the average retention times determined for all the samples can be consulted in
Appendix F. Here, the data analysis will be supported by the plots considered more
relevant.
Figure 7.8 represents, as an example, the retention times obtained for the n-alkanes tested
at 35ºC. This plot illustrates the typical behavior of all samples at all the temperature tested
and was randomly selected from the remaining plots, which are depicted in Appendix F.
Figure 7.8 – Retention times obtained at 35ºC with the n-alkanes for the reference sample and for the
samples with 10% of the different surface sizing agents.
This graph shows that the retention times of the non-polar probes increase with the weight
and size of the molecules: tr(C6) < tr(C7) < tr(C8) <tr(C9) < tr(C10).
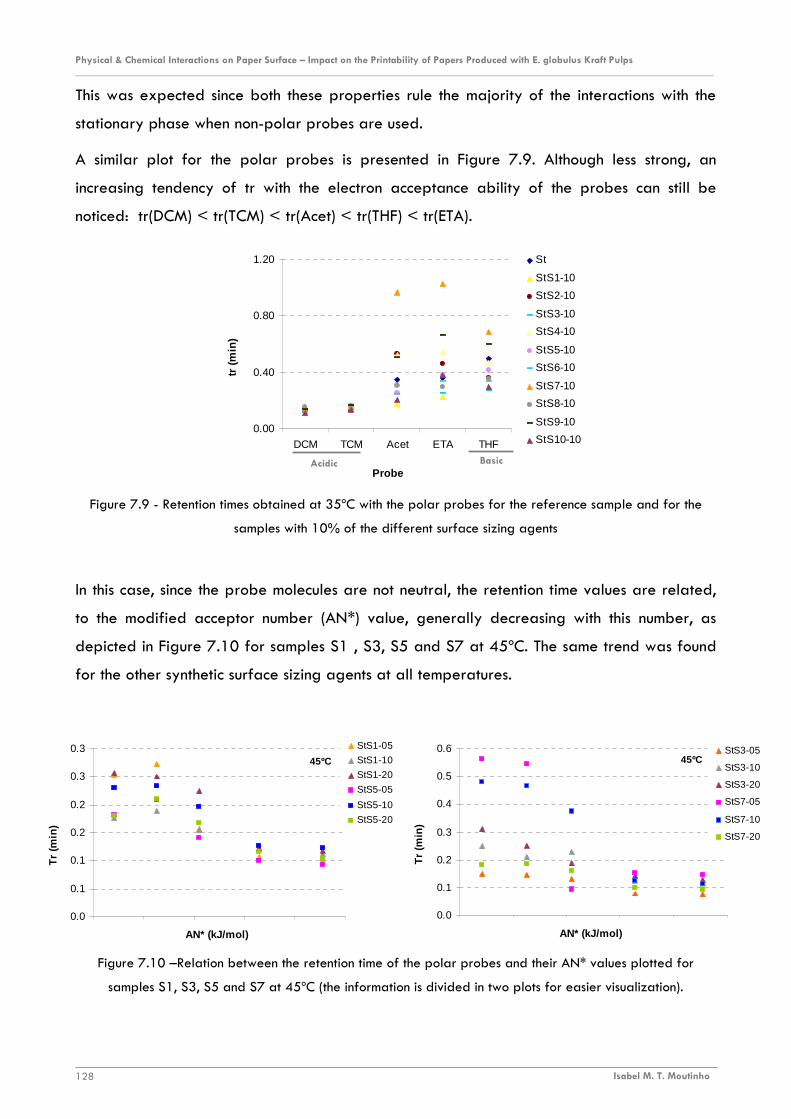
Physical & Chemical Interactions on Paper Surface – Impact on the Printability of Papers Produced with E. globulus Kraft Pulps ________________________________________________________________________________________________________________________
Isabel M. T. Moutinho 128
45ºC
0.0
0.1
0.1
0.2
0.2
0.3
0.3
AN* (kJ/mol)
Tr
(min
)
StS1-05
StS1-10
StS1-20
StS5-05
StS5-10
StS5-20
45ºC
0.0
0.1
0.2
0.3
0.4
0.5
0.6
AN* (kJ/mol)
Tr
(min
)
StS3-05
StS3-10
StS3-20
StS7-05
StS7-10
StS7-20
This was expected since both these properties rule the majority of the interactions with the
stationary phase when non-polar probes are used.
A similar plot for the polar probes is presented in Figure 7.9. Although less strong, an
increasing tendency of tr with the electron acceptance ability of the probes can still be
noticed: tr(DCM) < tr(TCM) < tr(Acet) < tr(THF) < tr(ETA).
Figure 7.9 - Retention times obtained at 35ºC with the polar probes for the reference sample and for the
samples with 10% of the different surface sizing agents
In this case, since the probe molecules are not neutral, the retention time values are related,
to the modified acceptor number (AN*) value, generally decreasing with this number, as
depicted in Figure 7.10 for samples S1 , S3, S5 and S7 at 45ºC. The same trend was found
for the other synthetic surface sizing agents at all temperatures.
Figure 7.10 –Relation between the retention time of the polar probes and their AN* values plotted for
samples S1, S3, S5 and S7 at 45ºC (the information is divided in two plots for easier visualization).
0.00
0.40
0.80
1.20
DCM TCM Acet ETA THF
Probe
tr (m
in)
St
StS1-10
StS2-10
StS3-10
StS4-10
StS5-10
StS6-10
StS7-10
StS8-10
StS9-10
StS10-10
Basic Acidic
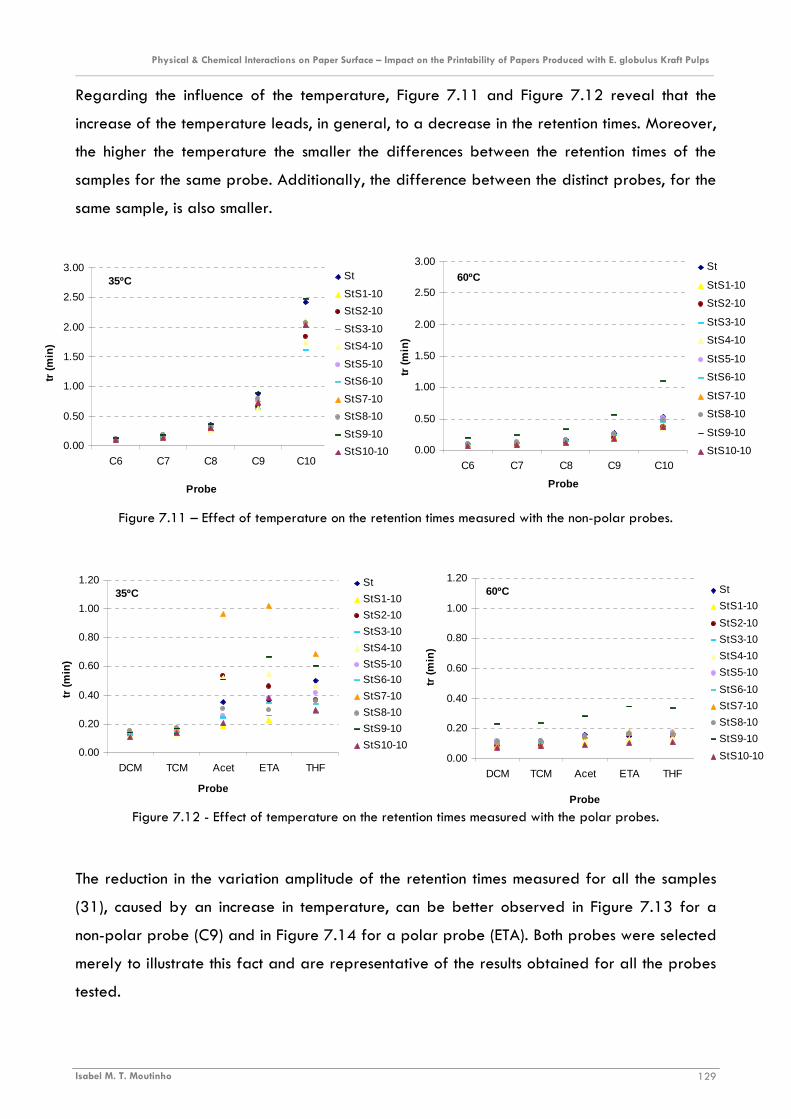
Physical & Chemical Interactions on Paper Surface – Impact on the Printability of Papers Produced with E. globulus Kraft Pulps ________________________________________________________________________________________________________________________
Isabel M. T. Moutinho 129
35ºC
0.00
0.50
1.00
1.50
2.00
2.50
3.00
C6 C7 C8 C9 C10
Probe
tr (m
in)
St
StS1-10
StS2-10
StS3-10
StS4-10
StS5-10
StS6-10
StS7-10
StS8-10
StS9-10
StS10-10
60ºC
0.00
0.50
1.00
1.50
2.00
2.50
3.00
C6 C7 C8 C9 C10
Probe
tr (m
in)
St
StS1-10
StS2-10
StS3-10
StS4-10
StS5-10
StS6-10
StS7-10
StS8-10
StS9-10
StS10-10
35ºC
0.00
0.20
0.40
0.60
0.80
1.00
1.20
DCM TCM Acet ETA THF
Probe
tr (m
in)
St
StS1-10
StS2-10
StS3-10
StS4-10
StS5-10
StS6-10
StS7-10
StS8-10
StS9-10
StS10-10
60ºC
0.00
0.20
0.40
0.60
0.80
1.00
1.20
DCM TCM Acet ETA THF
Probe
tr (m
in)
St
StS1-10
StS2-10
StS3-10
StS4-10
StS5-10
StS6-10
StS7-10
StS8-10
StS9-10
StS10-10
Regarding the influence of the temperature, Figure 7.11 and Figure 7.12 reveal that the
increase of the temperature leads, in general, to a decrease in the retention times. Moreover,
the higher the temperature the smaller the differences between the retention times of the
samples for the same probe. Additionally, the difference between the distinct probes, for the
same sample, is also smaller.
Figure 7.11 – Effect of temperature on the retention times measured with the non-polar probes.
Figure 7.12 - Effect of temperature on the retention times measured with the polar probes.
The reduction in the variation amplitude of the retention times measured for all the samples
(31), caused by an increase in temperature, can be better observed in Figure 7.13 for a
non-polar probe (C9) and in Figure 7.14 for a polar probe (ETA). Both probes were selected
merely to illustrate this fact and are representative of the results obtained for all the probes
tested.

Physical & Chemical Interactions on Paper Surface – Impact on the Printability of Papers Produced with E. globulus Kraft Pulps ________________________________________________________________________________________________________________________
Isabel M. T. Moutinho 130
Figure 7.13 - Effect of temperature on the retention times obtained with C9 for all the samples.
Figure 7.14 - Effect of temperature in the retention times obtained with ETA for all the samples.
7.2.2 DISPERSIVE COMPONENT OF THE SURFACE ENERGY
As mentioned before, from the retention times determined for the n-alkane series at different
temperatures, the corresponding value of the dispersive component of the surface free
energy (σSD) can be computed.
Figure 7.15 shows the values of σSD obtained for the reference sample and for the samples
sized with 5% incorporation of the different synthetic sizing agents as a function of
temperature.
35ºC
0.00
0.20
0.40
0.60
0.80
1.00
1.20
0 5 10 15 20 25 30 35Sample
tr (m
in)
ETA60ºC
0.00
0.20
0.40
0.60
0.80
1.00
1.20
0 5 10 15 20 25 30 35Sample
tr (m
in)
ETA
35ºC
0.00
0.20
0.40
0.60
0.80
1.00
1.20
0 5 10 15 20 25 30 35Sample
tr (m
in)
C960ºC
0.00
0.20
0.40
0.60
0.80
1.00
1.20
0 5 10 15 20 25 30 35Sample
tr (m
in)
C9
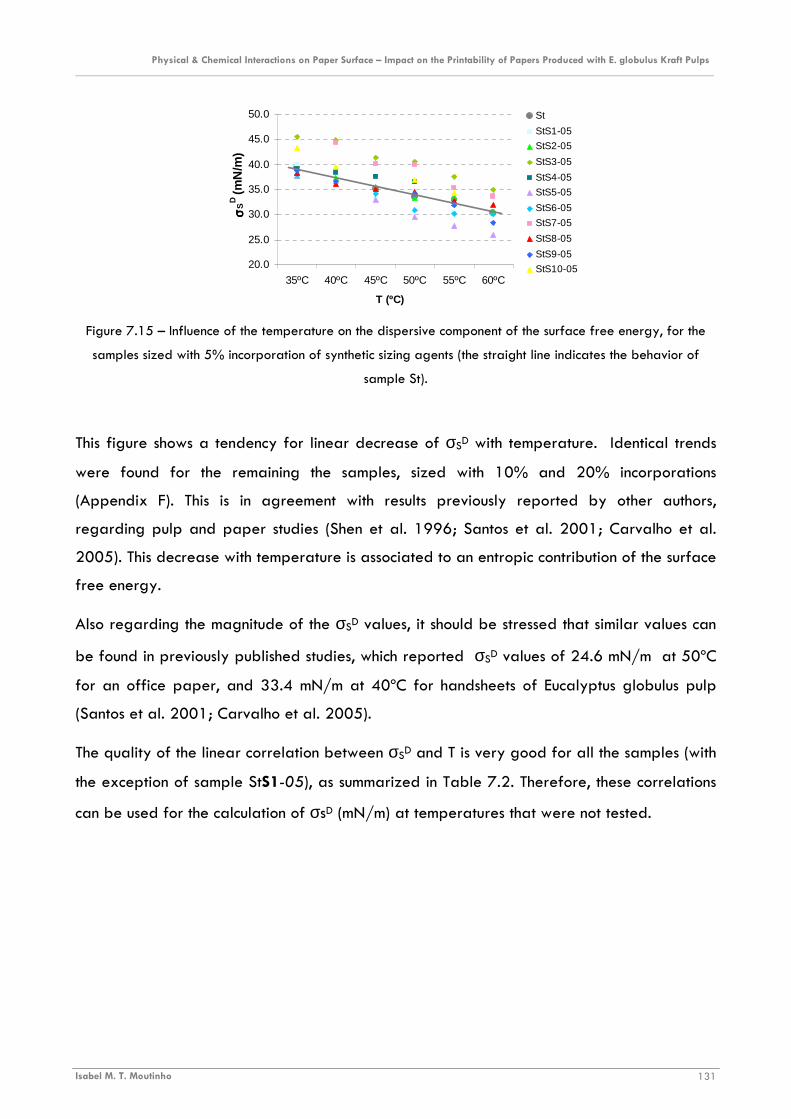
Physical & Chemical Interactions on Paper Surface – Impact on the Printability of Papers Produced with E. globulus Kraft Pulps ________________________________________________________________________________________________________________________
Isabel M. T. Moutinho 131
20.0
25.0
30.0
35.0
40.0
45.0
50.0
35ºC 40ºC 45ºC 50ºC 55ºC 60ºC
T (ºC)
σσ σσS
D (m
N/m
)
St
StS1-05
StS2-05
StS3-05
StS4-05
StS5-05
StS6-05
StS7-05
StS8-05
StS9-05
StS10-05
Figure 7.15 – Influence of the temperature on the dispersive component of the surface free energy, for the
samples sized with 5% incorporation of synthetic sizing agents (the straight line indicates the behavior of
sample St).
This figure shows a tendency for linear decrease of σSD with temperature. Identical trends
were found for the remaining the samples, sized with 10% and 20% incorporations
(Appendix F). This is in agreement with results previously reported by other authors,
regarding pulp and paper studies (Shen et al. 1996; Santos et al. 2001; Carvalho et al.
2005). This decrease with temperature is associated to an entropic contribution of the surface
free energy.
Also regarding the magnitude of the σSD values, it should be stressed that similar values can
be found in previously published studies, which reported σSD values of 24.6 mN/m at 50ºC
for an office paper, and 33.4 mN/m at 40ºC for handsheets of Eucalyptus globulus pulp
(Santos et al. 2001; Carvalho et al. 2005).
The quality of the linear correlation between σSD and T is very good for all the samples (with
the exception of sample StS1-05), as summarized in Table 7.2. Therefore, these correlations
can be used for the calculation of σsD (mN/m) at temperatures that were not tested.

Physical & Chemical Interactions on Paper Surface – Impact on the Printability of Papers Produced with E. globulus Kraft Pulps ________________________________________________________________________________________________________________________
Isabel M. T. Moutinho 132
Table 7.2 – Experimental correlations obtained for the variation of σSD with temperature for each of the
paper samples tested and corresponding determination coefficient (r2).
Sample Equation r2
St σSD = - 0.34 · T(ºC) + 50.90 0.97 StS1-05 σSD = - 0.40 · T(ºC) + 52.96 0.82 StS1-10 σSD = - 0.58 · T(ºC) + 62.52 0.87 StS1-20 σSD = - 0.36 · T(ºC)) + 51.93 0.91 StS2-05 σSD = - 0.28 · T(ºC) + 48.17 0.94 StS2-10 σSD = - 0.65 · T(ºC) + 65.39 0.97 StS2-20 σSD = - 0.53 · T(ºC) + 58.14 0.96 StS3-05 σSD = - 0.43 · T(ºC) + 61.37 0.97 StS3-10 σSD = - 0.63 · T(ºC) + 67.69 0.99 StS3-20 σSD = - 0.40 · T(ºC) + 57.23 0.98 StS4-05 σSD = - 0.18· T(ºC) + 45.48 0.98 StS4-10 σSD = - 0.37 · T(ºC) + 52.14 0.99 StS4-20 σSD = - 0.36 · T(ºC) + 51.82 0.95 StS5-05 σSD = - 0.51 · T(ºC) + 56.08 0.98 StS5-10 σSD = - 0.32 · T(ºC) + 52.17 0.93 StS5-20 σSD = - 0.41 · T(ºC) + 54.87 0.99 StS6-05 σSD = - 0.33 · T(ºC) + 49.06 0.91 StS6-10 σSD = - 0.48 · T(ºC) + 57.91 0.99 StS6-20 σSD = - 0.33 · T(ºC) + 49.78 0.98 StS7-05 σSD = - 0.52 · T(ºC) + 64.93 0.95 StS7-10 σSD = - 0.36 · T(ºC) + 53.83 0.99 StS7-20 σSD = - 0.61 · T(ºC) + 61.95 0.90 StS8-05 σSD = - 0.24 · T(ºC) + 46.29 0.97 StS8-10 σSD = - 0.46 · T(ºC) + 57.41 0.99 StS8-20 σSD = - 0.30 · T(ºC) + 49.14 1.00 StS9-05 σSD = - 0.38 · T(ºC) + 52.17 0.96 StS9-10 σSD = - 0.38 · T(ºC) + 52.51 0.98 StS9-20 σSD = - 0.54 · T(ºC) + 60.42 0.96 StS10-05 σSD = - 0.42 · T(ºC) + 57.36 0.96 StS10-10 σSD = - 0.18 · T(ºC) + 47.37 0.99 StS10-20 σSD = - 0.25 · T(ºC) + 50.40 0.99
It should be mentioned that the values of the temperature coefficients (dσSD/dT), are also in
agreement with those reported in literature for an office paper, of - 0.35 mN/(m·K) in the
range 50-90ºC and for amorphous cellulose, of - 0.36 mN/(m·K) in the range 50-100ºC
(Santos et al. 2001).
Concerning the effect of the addition the synthetic surface sizing agents to the cationic starch,
it was found that, in general, higher σSD values are obtained for the sizing blends than for

Physical & Chemical Interactions on Paper Surface – Impact on the Printability of Papers Produced with E. globulus Kraft Pulps ________________________________________________________________________________________________________________________
Isabel M. T. Moutinho 133
the reference sample (St). The same was detected in the contact angle measurements, as
reported in Chapter 6.
This indicates that the sizing agent generally increases the surface ability to establish
dispersive interactions, probably due to the higher surface tension of the sizing agents
compared to that of the cationic starch (Table 3.3).
However, in addition to the surface tension effect, the size and the spatial orientation of the
molecules of sizing agents at the paper surface can also influence its ability to establish
dispersive interactions.
Concerning the influence of the type and of the concentration of the sizing agent, different
behaviors were detected. Let us examine for instance the results of Figure 7.16 that shows
the variation of σSD with the concentration of the sizing agent S2 (co-styrene-maleic
anhydride), together with value of the reference sample, for different temperatures. Besides
a consistent decrease of σSD with temperature, it is visible that the relative position
corresponding to the three incorporation percentages is maintained between 35 ºC and
45ºC, but above this temperature, quite distinct behaviors can be observed. A dissimilar
behavior was detected for the synthetic surface sizing agent S4 (co-styrene-maleic
anhydride) which shows a different behavior for each of the temperatures tested. In fact
these are just examples of the myriad of patterns found for the various sizing agents.
This is most certainly a consequence of the dispersive interactions being weak by nature, and
thus significantly affected by the vibrational movement of the molecules caused by the
temperature. In fact the increase in temperature was found to alter the impact of the
molecules size and spatial orientation of the molecules on the intensity of the dispersive
forces (in particular when the molecules are non linear).
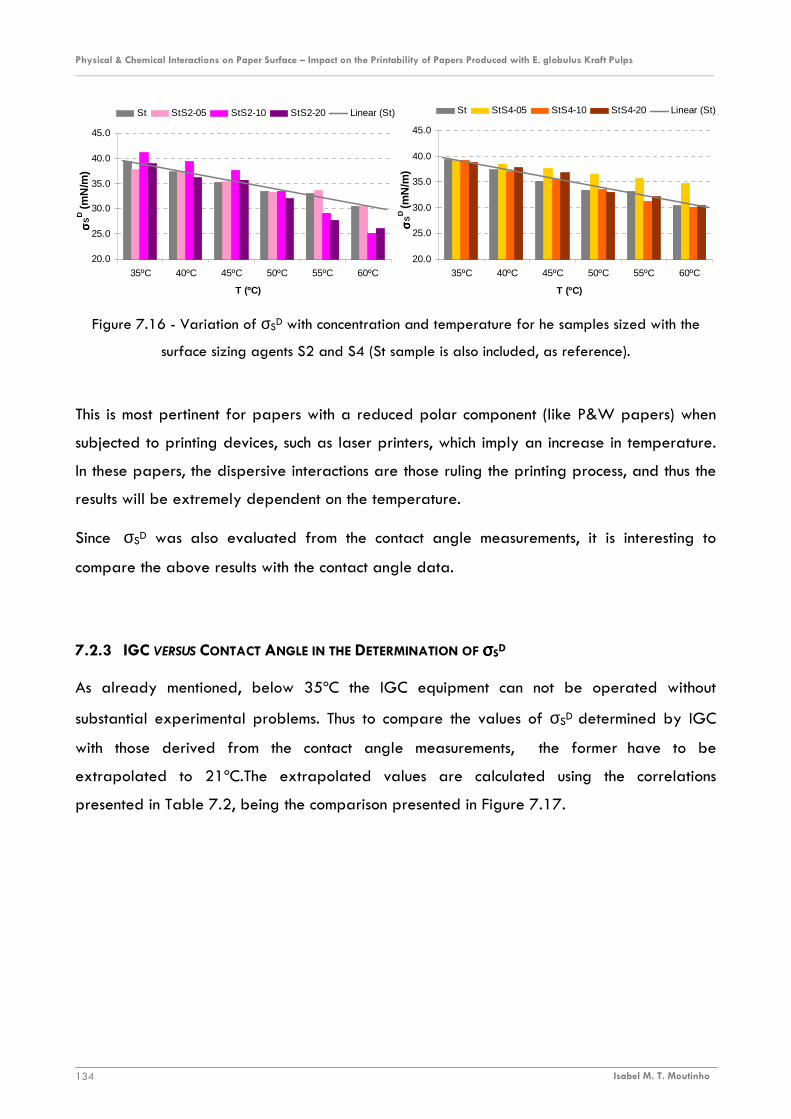
Physical & Chemical Interactions on Paper Surface – Impact on the Printability of Papers Produced with E. globulus Kraft Pulps ________________________________________________________________________________________________________________________
Isabel M. T. Moutinho 134
20.0
25.0
30.0
35.0
40.0
45.0
35ºC 40ºC 45ºC 50ºC 55ºC 60ºC
T (ºC)
σσ σσS
D (m
N/m
)
St StS4-05 StS4-10 StS4-20 Linear (St)
20.0
25.0
30.0
35.0
40.0
45.0
35ºC 40ºC 45ºC 50ºC 55ºC 60ºC
T (ºC)
σσ σσS
D (
mN
/m)
St StS2-05 StS2-10 StS2-20 Linear (St)
Figure 7.16 - Variation of σSD with concentration and temperature for he samples sized with the
surface sizing agents S2 and S4 (St sample is also included, as reference).
This is most pertinent for papers with a reduced polar component (like P&W papers) when
subjected to printing devices, such as laser printers, which imply an increase in temperature.
In these papers, the dispersive interactions are those ruling the printing process, and thus the
results will be extremely dependent on the temperature.
Since σSD was also evaluated from the contact angle measurements, it is interesting to
compare the above results with the contact angle data.
7.2.3 IGC VERSUS CONTACT ANGLE IN THE DETERMINATION OF σσσσSD
As already mentioned, below 35ºC the IGC equipment can not be operated without
substantial experimental problems. Thus to compare the values of σSD determined by IGC
with those derived from the contact angle measurements, the former have to be
extrapolated to 21ºC.The extrapolated values are calculated using the correlations
presented in Table 7.2, being the comparison presented in Figure 7.17.
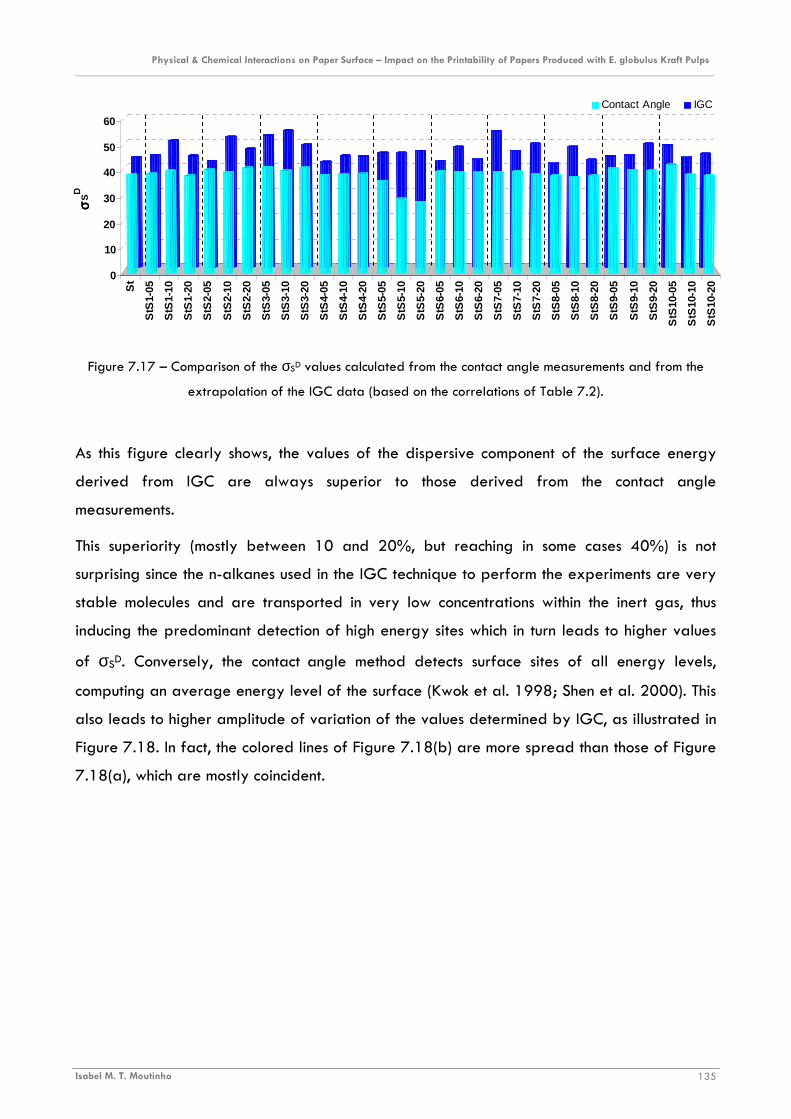
Physical & Chemical Interactions on Paper Surface – Impact on the Printability of Papers Produced with E. globulus Kraft Pulps ________________________________________________________________________________________________________________________
Isabel M. T. Moutinho 135
Figure 7.17 – Comparison of the σSD values calculated from the contact angle measurements and from the
extrapolation of the IGC data (based on the correlations of Table 7.2).
As this figure clearly shows, the values of the dispersive component of the surface energy
derived from IGC are always superior to those derived from the contact angle
measurements.
This superiority (mostly between 10 and 20%, but reaching in some cases 40%) is not
surprising since the n-alkanes used in the IGC technique to perform the experiments are very
stable molecules and are transported in very low concentrations within the inert gas, thus
inducing the predominant detection of high energy sites which in turn leads to higher values
of σSD. Conversely, the contact angle method detects surface sites of all energy levels,
computing an average energy level of the surface (Kwok et al. 1998; Shen et al. 2000). This
also leads to higher amplitude of variation of the values determined by IGC, as illustrated in
Figure 7.18. In fact, the colored lines of Figure 7.18(b) are more spread than those of Figure
7.18(a), which are mostly coincident.
St
StS
1-05
StS
1-10
StS
1-20
StS
2-05
StS
2-10
StS
2-20
StS
3-05
StS
3-10
StS
3-20
StS
4-05
StS
4-10
StS
4-20
StS
5-05
StS
5-10
StS
5-20
StS
6-05
StS
6-10
StS
6-20
StS
7-05
StS
7-10
StS
7-20
StS
8-05
StS
8-10
StS
8-20
StS
9-05
StS
9-10
StS
9-20
StS
10-0
5
StS
10-1
0
StS
10-2
0
0
10
20
30
40
50
60
σσ σσS
D
Contact Angle IGC
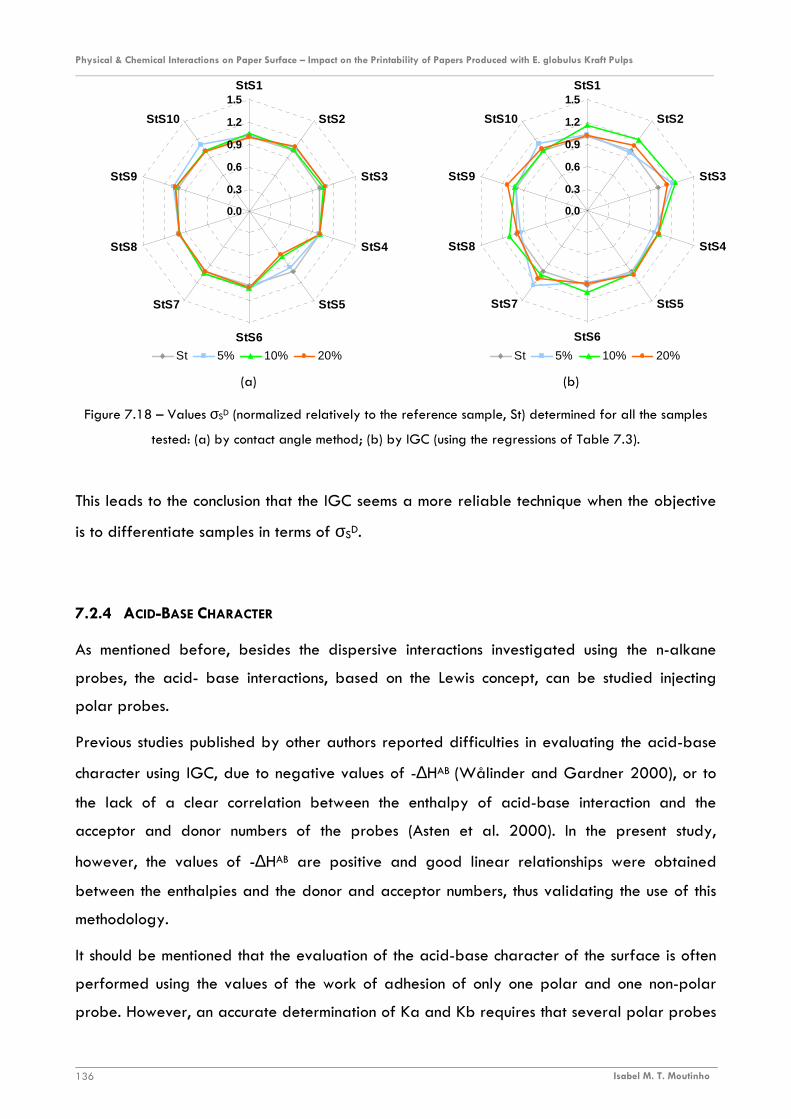
Physical & Chemical Interactions on Paper Surface – Impact on the Printability of Papers Produced with E. globulus Kraft Pulps ________________________________________________________________________________________________________________________
Isabel M. T. Moutinho 136
Figure 7.18 – Values σSD (normalized relatively to the reference sample, St) determined for all the samples
tested: (a) by contact angle method; (b) by IGC (using the regressions of Table 7.3).
This leads to the conclusion that the IGC seems a more reliable technique when the objective
is to differentiate samples in terms of σSD.
7.2.4 ACID-BASE CHARACTER
As mentioned before, besides the dispersive interactions investigated using the n-alkane
probes, the acid- base interactions, based on the Lewis concept, can be studied injecting
polar probes.
Previous studies published by other authors reported difficulties in evaluating the acid-base
character using IGC, due to negative values of -∆HAB (Wålinder and Gardner 2000), or to
the lack of a clear correlation between the enthalpy of acid-base interaction and the
acceptor and donor numbers of the probes (Asten et al. 2000). In the present study,
however, the values of -∆HAB are positive and good linear relationships were obtained
between the enthalpies and the donor and acceptor numbers, thus validating the use of this
methodology.
It should be mentioned that the evaluation of the acid-base character of the surface is often
performed using the values of the work of adhesion of only one polar and one non-polar
probe. However, an accurate determination of Ka and Kb requires that several polar probes
0.0
0.3
0.6
0.9
1.2
1.5StS1
StS2
StS3
StS4
StS5
StS6
StS7
StS8
StS9
StS10
St 5% 10% 20%
0.0
0.3
0.6
0.9
1.2
1.5StS1
StS2
StS3
StS4
StS5
StS6
StS7
StS8
StS9
StS10
St 5% 10% 20%
(a) (b)
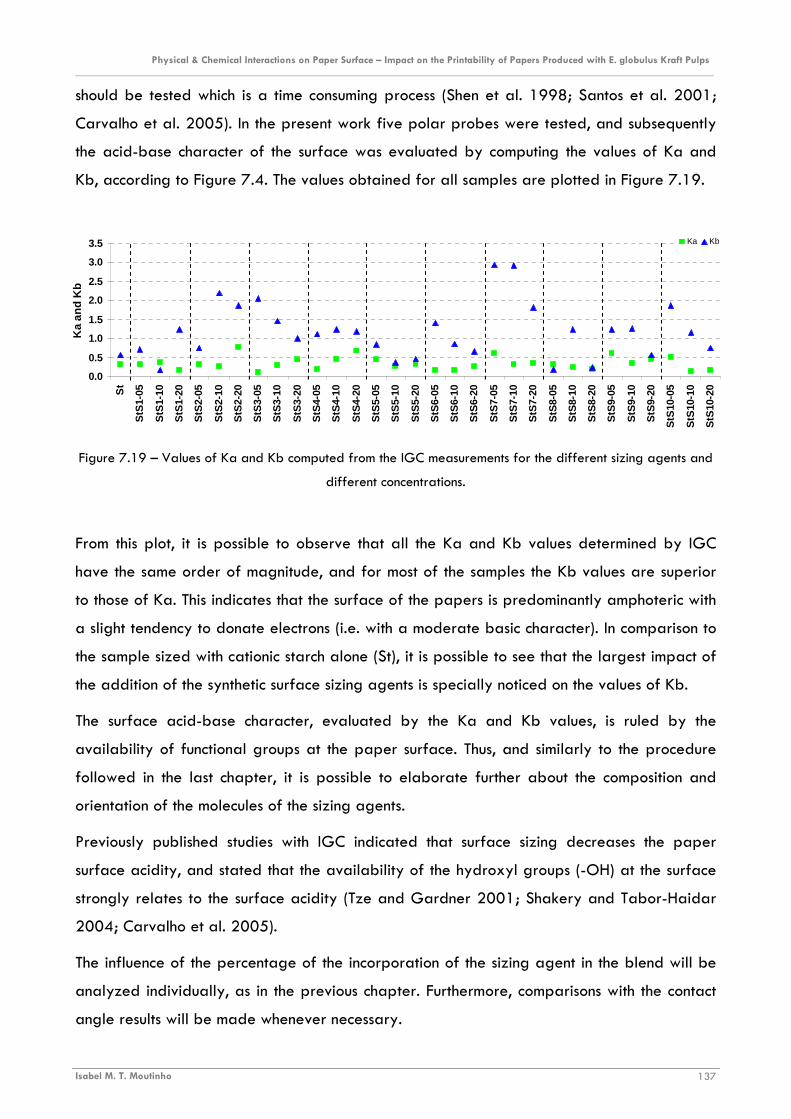
Physical & Chemical Interactions on Paper Surface – Impact on the Printability of Papers Produced with E. globulus Kraft Pulps ________________________________________________________________________________________________________________________
Isabel M. T. Moutinho 137
should be tested which is a time consuming process (Shen et al. 1998; Santos et al. 2001;
Carvalho et al. 2005). In the present work five polar probes were tested, and subsequently
the acid-base character of the surface was evaluated by computing the values of Ka and
Kb, according to Figure 7.4. The values obtained for all samples are plotted in Figure 7.19.
Figure 7.19 – Values of Ka and Kb computed from the IGC measurements for the different sizing agents and
different concentrations.
From this plot, it is possible to observe that all the Ka and Kb values determined by IGC
have the same order of magnitude, and for most of the samples the Kb values are superior
to those of Ka. This indicates that the surface of the papers is predominantly amphoteric with
a slight tendency to donate electrons (i.e. with a moderate basic character). In comparison to
the sample sized with cationic starch alone (St), it is possible to see that the largest impact of
the addition of the synthetic surface sizing agents is specially noticed on the values of Kb.
The surface acid-base character, evaluated by the Ka and Kb values, is ruled by the
availability of functional groups at the paper surface. Thus, and similarly to the procedure
followed in the last chapter, it is possible to elaborate further about the composition and
orientation of the molecules of the sizing agents.
Previously published studies with IGC indicated that surface sizing decreases the paper
surface acidity, and stated that the availability of the hydroxyl groups (-OH) at the surface
strongly relates to the surface acidity (Tze and Gardner 2001; Shakery and Tabor-Haidar
2004; Carvalho et al. 2005).
The influence of the percentage of the incorporation of the sizing agent in the blend will be
analyzed individually, as in the previous chapter. Furthermore, comparisons with the contact
angle results will be made whenever necessary.
0.0
0.5
1.0
1.5
2.0
2.5
3.0
3.5
St
StS
1-05
StS
1-10
StS
1-20
StS
2-05
StS
2-10
StS
2-20
StS
3-05
StS
3-10
StS
3-20
StS
4-05
StS
4-10
StS
4-20
StS
5-05
StS
5-10
StS
5-20
StS
6-05
StS
6-10
StS
6-20
StS
7-05
StS
7-10
StS
7-20
StS
8-05
StS
8-10
StS
8-20
StS
9-05
StS
9-10
StS
9-20
StS
10-0
5
StS
10-1
0
StS
10-2
0
Ka
and
Kb
Ka Kb
Physical & Chemical Interactions on Paper Surface – Impact on the Printability of Papers Produced with E. globulus Kraft Pulps ________________________________________________________________________________________________________________________
Isabel M. T. Moutinho 138
Starting with the sample sized with the synthetic sizing agent S1, (co-styrene-acrylate), no
relevant differences are found in the Ka values for 5 and 10 % incorporation (StS1-05 and
StS1-10). Having in mind that the surface acidic character is related to carboxyl groups
(COOH) and the proximity of Ka and Kb values at 5 and 10%, the most likely explanation is
that the amounts of the styrene and acrylate functional groups oriented outwards are
equivalent. Nonetheless, for the 5% incorporation, a slight predominance of styrene is
detected whereas for 10% the opposite occurs (acrylate dominates). For 20% incorporation
(StS1-20), a reduction in Ka and an increase in Kb were found, probably due to the
electronic cloud of the styrene. This interpretation, based on the molecular orientation,
enables to justify the results obtained by the contact angle method for the polar component
of the surface free energy (Figure 6.13), which were not explained there.
As for behavior of the sizing agent S9, which has the same composition of S1 (the difference
between these two sizing agents lies on arrangement of the monomers), some assumptions
regarding the orientation of its molecules at the paper surface were anticipated, in Chapter
6, when analyzing the contact angle results for 5 and 10% of incorporation (Fig. 6.13). As
explained then, the styrene monomer was the one oriented outwards, and only for 20%
incorporation, the acrylate monomer was the one predominantly turned out. The IGC results
confirm this analysis but reveals that at 5% incorporation the amount of styrene and acrylate
groups oriented outwards is similar, while at 10% the orientation of the styrene outwards
predominates. These results also indicate that the arrangement of the monomers (styrene and
acrylate) has a greater influence on the acid-base character of the sample StS9 than in the
case of sample StS1 (Figure 3.3).
Although having the same monomers than S1 and S9, the results obtained by IGC for sample
StS10 are inconclusive with regard to the orientation of the copolymer molecules at the
paper surface.
As for the surface sizing agent S2, composed of styrene and maleic anhydride, the results of
the contact angle measurements presented in Section 6.2.3 suggested that its molecules are
probably oriented so that the styrene monomer is turned to the exterior and the oxygen of
the maleic anhydride monomer point inwards for all concentrations. This hypothesis is in
agreement with the IGC results presented in Figure 7.19. In fact, the increase of the Kb
values in comparison to the reference sample (St) is certainly due to the presence of the
electronic cloud of the styrene monomer. In addition, when the amount of sizing agent is
Physical & Chemical Interactions on Paper Surface – Impact on the Printability of Papers Produced with E. globulus Kraft Pulps ________________________________________________________________________________________________________________________
Isabel M. T. Moutinho 139
increased to 20% the electron accepting effect of the oxygen atoms of the maleic anhydride
monomer is strongly enhanced, as detected by the increase in Ka.
Analyzing now the concentration of the sizing agent S4, which differs from the sizing agent
S2 in the styrene/maleic anhydride ratio (Table 3.2), and considering that styrene causes an
increase in Kb(as found for sample StS2), the enhancement of the basic character of samples
StS4 in comparison with the St sample was to be expected. However, the increment in Kb is
smaller than that found for sample StS2 in agreement with the also smaller styrene amount.
As for the surface sizing agent S3, which is quite distinct from the ones referred to in the
previous paragraphs, the analysis relative to the orientation of the acrylonitrile and acrylate
monomers at the paper surface derived from the contact angle data (Section 6.2.3) can not
be confirmed by the IGC. Nevertheless, the variation of the Ka and Kb values are in perfect
agreement with the copolymer composition: for 5% incorporation, a decrease of Ka
relatively to the reference sample St is observed, which is a consequence of the smaller
acidic character of the copolymer in relation to the cationic starch; increasing the amount of
copolymer, the Ka gradually increases due to the augment of the number of electron
accepting functional groups.
Regarding the sizing agents S5, S6, S7 and S8, the IGC results are not conclusive in what
concerns the influence of the polymer concentration on Ka and Kb values neither on the
orientation at their molecules at the surface.


CHAPTER 8
PRINTING QUALITY


Physical & Chemical Interactions on Paper Surface – Impact on the Printability of Papers Produced with E. globulus Kraft Pulps ________________________________________________________________________________________________________________________
Isabel M. T. Moutinho 143
8 PRINTING QUALITY
8.1 THEORY
As described in Section 1.5, there are innumerous types of printing processes, however
considering its importance in the P&W papers applications, the printing process selected for
this work was inkjet printing.
8.1.1 INKJET PRINTING
Inkjet is a non-impact printing process, where the ink is emitted from a jet device, driven by
an electronic signal, directly onto the substrate. The principles of inkjet were laid over a
century ago, but the practical inkjet devices did not appear until the mid 1960’s and in the
1970’s significant developmental efforts were made, the ink stream could be controlled and
individual droplets could be charged (Svanholm 2004).
However the real breakthrough for inkjet technology came in the early 1980’s, associated to
the introduction of IBM’s personal computer (PC). In the beginning of the 1980’s,
technological advances such as the thermal printers invented by Canon (UK Patent - GB
2007162A, 1987) and Hewlett Packard (US Patent – US 4490728, 1982) had made inkjet
a technology that was more reliable and more affordable, making it a strong potential
candidate for desktop printer applications (Svanholm 2004).
In 1984, Hewlett Packard launched their first line of low-cost printers with disposable inkjet
print heads, which reduced the cost even further. By the mid-1990’s and onwards, the image
quality, reliability and cost effectiveness had improved to a point where it was realistic for
inkjet to compete with conventional small-scale printing. The resolution was improved from
around 100 dots per inch (dpi) in the early 1980’s to 2400 dpi in 2004 (Svanholm 2004). In
1982-1984, an inkjet printer cost $1000-$6000. Nowadays a desktop inkjet printer can be
purchased for as little as $50.
The principle of inkjet printing consists in directing individual drops to a paper surface in
order to create an image. There are two main categories of inkjet printers (Oittinen and
Saarelma 1998; Keskitalo 2000; Svanholm 2004):
� Continuous (Figure 8.1a)
� Drop-on-Demand – DoD (Figure 8.1b)
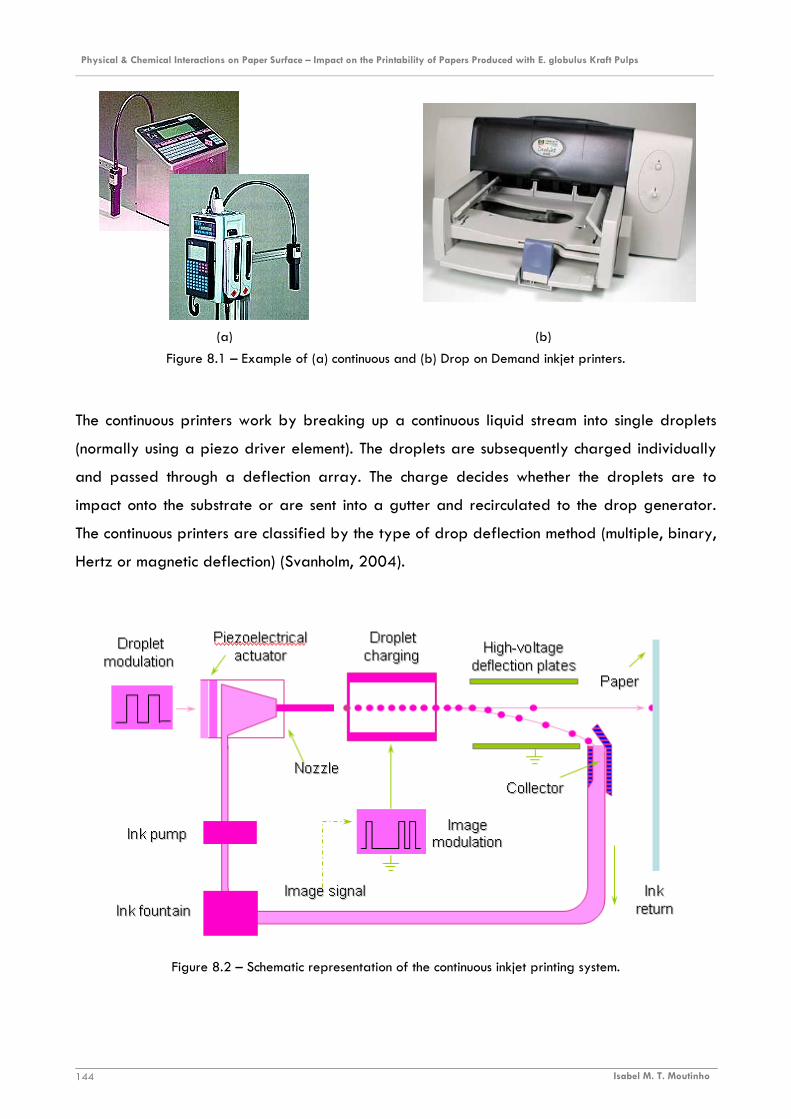
Physical & Chemical Interactions on Paper Surface – Impact on the Printability of Papers Produced with E. globulus Kraft Pulps ________________________________________________________________________________________________________________________
Isabel M. T. Moutinho 144
Figure 8.1 – Example of (a) continuous and (b) Drop on Demand inkjet printers.
The continuous printers work by breaking up a continuous liquid stream into single droplets
(normally using a piezo driver element). The droplets are subsequently charged individually
and passed through a deflection array. The charge decides whether the droplets are to
impact onto the substrate or are sent into a gutter and recirculated to the drop generator.
The continuous printers are classified by the type of drop deflection method (multiple, binary,
Hertz or magnetic deflection) (Svanholm, 2004).
Figure 8.2 – Schematic representation of the continuous inkjet printing system.
(a) (b)
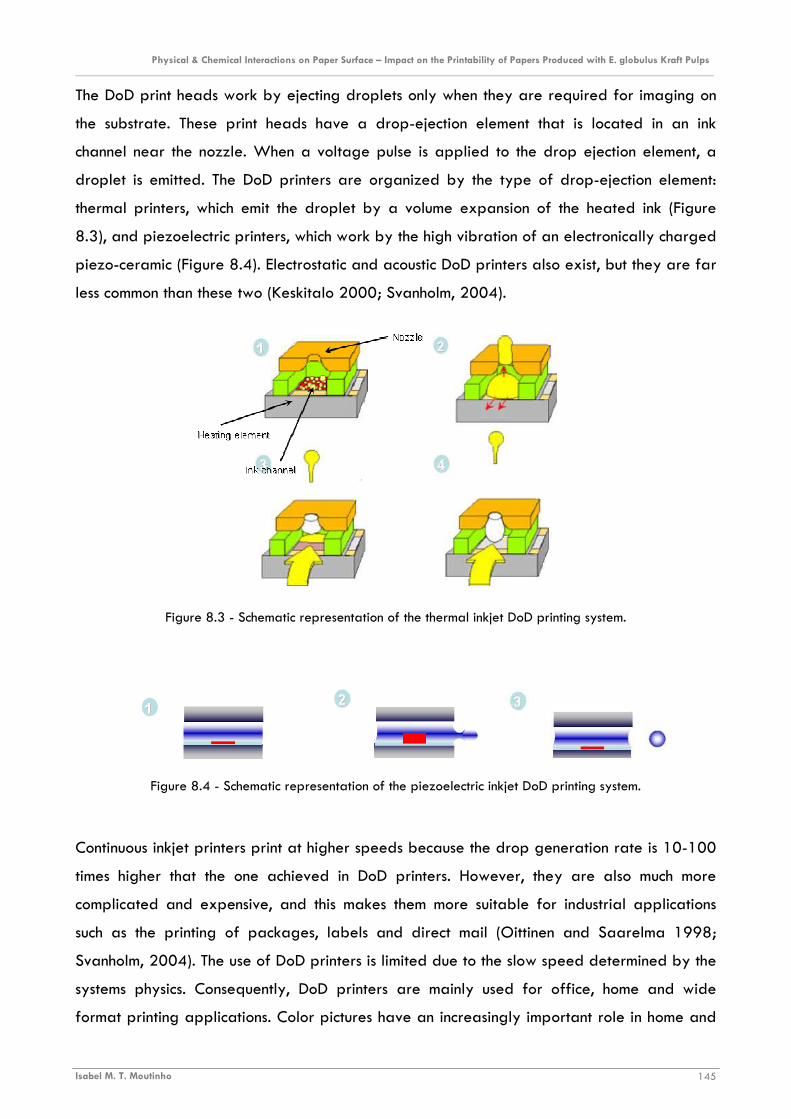
Physical & Chemical Interactions on Paper Surface – Impact on the Printability of Papers Produced with E. globulus Kraft Pulps ________________________________________________________________________________________________________________________
Isabel M. T. Moutinho 145
The DoD print heads work by ejecting droplets only when they are required for imaging on
the substrate. These print heads have a drop-ejection element that is located in an ink
channel near the nozzle. When a voltage pulse is applied to the drop ejection element, a
droplet is emitted. The DoD printers are organized by the type of drop-ejection element:
thermal printers, which emit the droplet by a volume expansion of the heated ink (Figure
8.3), and piezoelectric printers, which work by the high vibration of an electronically charged
piezo-ceramic (Figure 8.4). Electrostatic and acoustic DoD printers also exist, but they are far
less common than these two (Keskitalo 2000; Svanholm, 2004).
Figure 8.3 - Schematic representation of the thermal inkjet DoD printing system.
Figure 8.4 - Schematic representation of the piezoelectric inkjet DoD printing system.
Continuous inkjet printers print at higher speeds because the drop generation rate is 10-100
times higher that the one achieved in DoD printers. However, they are also much more
complicated and expensive, and this makes them more suitable for industrial applications
such as the printing of packages, labels and direct mail (Oittinen and Saarelma 1998;
Svanholm, 2004). The use of DoD printers is limited due to the slow speed determined by the
systems physics. Consequently, DoD printers are mainly used for office, home and wide
format printing applications. Color pictures have an increasingly important role in home and
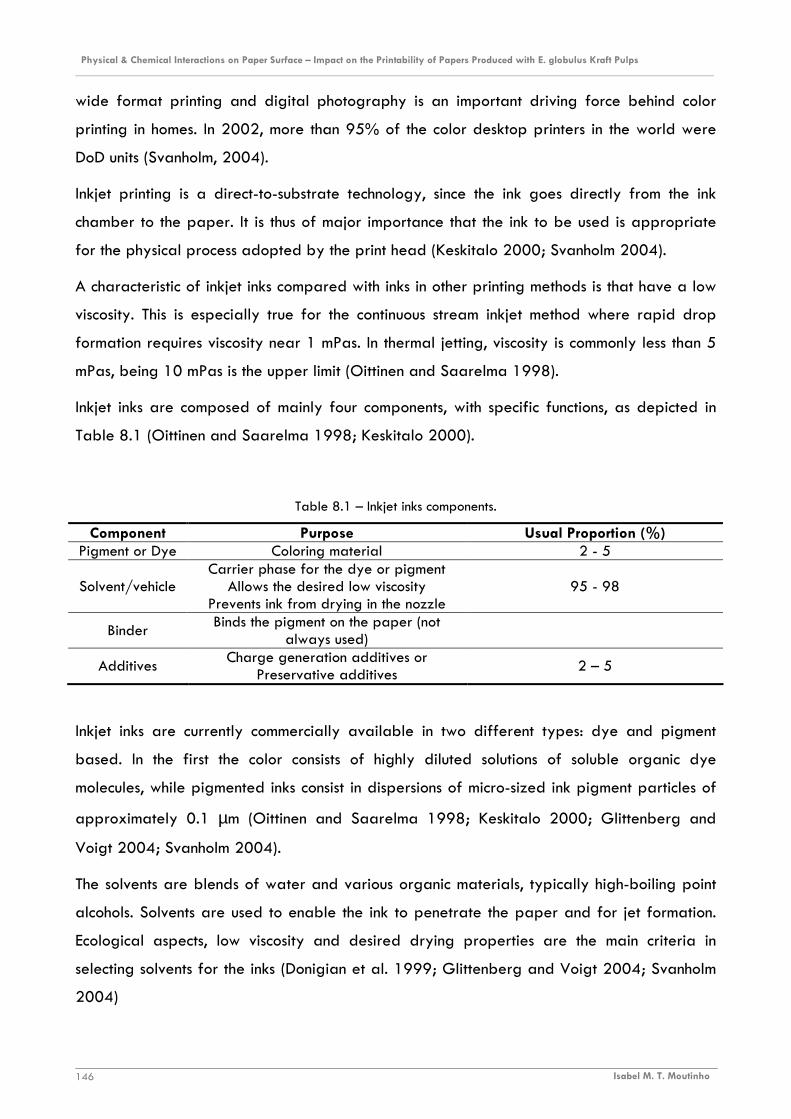
Physical & Chemical Interactions on Paper Surface – Impact on the Printability of Papers Produced with E. globulus Kraft Pulps ________________________________________________________________________________________________________________________
Isabel M. T. Moutinho 146
wide format printing and digital photography is an important driving force behind color
printing in homes. In 2002, more than 95% of the color desktop printers in the world were
DoD units (Svanholm, 2004).
Inkjet printing is a direct-to-substrate technology, since the ink goes directly from the ink
chamber to the paper. It is thus of major importance that the ink to be used is appropriate
for the physical process adopted by the print head (Keskitalo 2000; Svanholm 2004).
A characteristic of inkjet inks compared with inks in other printing methods is that have a low
viscosity. This is especially true for the continuous stream inkjet method where rapid drop
formation requires viscosity near 1 mPas. In thermal jetting, viscosity is commonly less than 5
mPas, being 10 mPas is the upper limit (Oittinen and Saarelma 1998).
Inkjet inks are composed of mainly four components, with specific functions, as depicted in
Table 8.1 (Oittinen and Saarelma 1998; Keskitalo 2000).
Table 8.1 – Inkjet inks components.
Component Purpose Usual Proportion (%) Pigment or Dye Coloring material 2 - 5
Solvent/vehicle Carrier phase for the dye or pigment
Allows the desired low viscosity Prevents ink from drying in the nozzle
95 - 98
Binder Binds the pigment on the paper (not
always used)
Additives Charge generation additives or
Preservative additives 2 – 5
Inkjet inks are currently commercially available in two different types: dye and pigment
based. In the first the color consists of highly diluted solutions of soluble organic dye
molecules, while pigmented inks consist in dispersions of micro-sized ink pigment particles of
approximately 0.1 µm (Oittinen and Saarelma 1998; Keskitalo 2000; Glittenberg and
Voigt 2004; Svanholm 2004).
The solvents are blends of water and various organic materials, typically high-boiling point
alcohols. Solvents are used to enable the ink to penetrate the paper and for jet formation.
Ecological aspects, low viscosity and desired drying properties are the main criteria in
selecting solvents for the inks (Donigian et al. 1999; Glittenberg and Voigt 2004; Svanholm
2004)
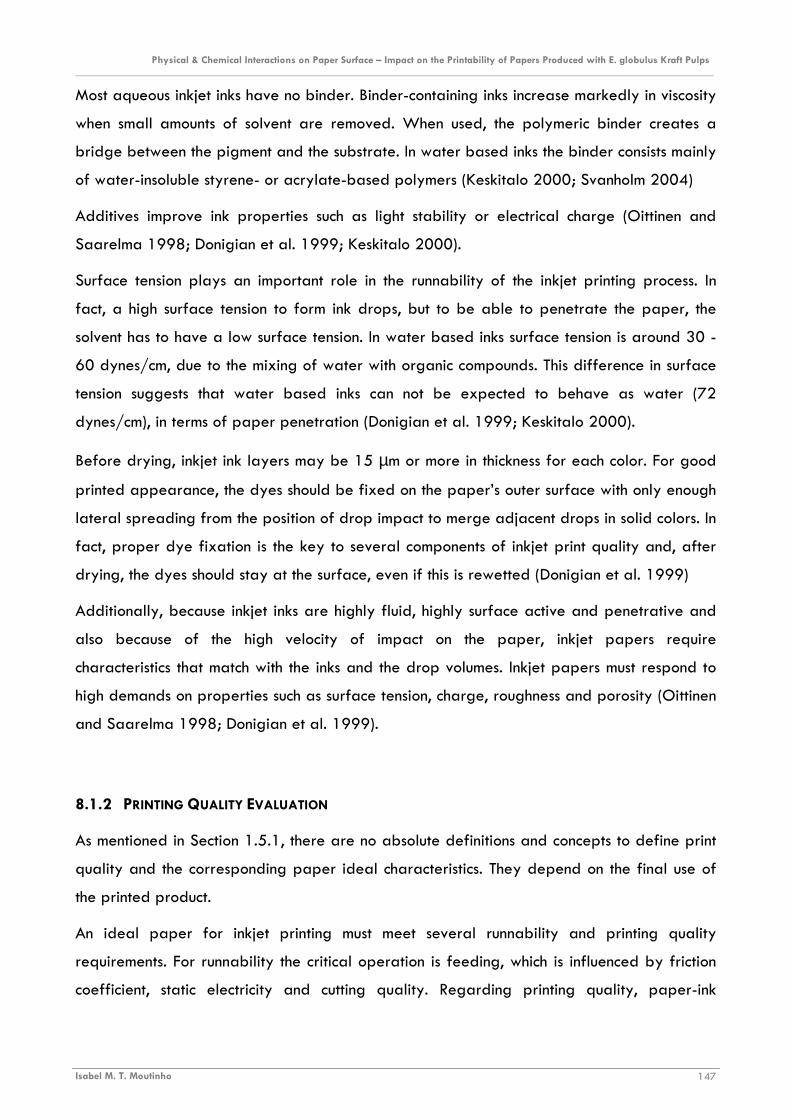
Physical & Chemical Interactions on Paper Surface – Impact on the Printability of Papers Produced with E. globulus Kraft Pulps ________________________________________________________________________________________________________________________
Isabel M. T. Moutinho 147
Most aqueous inkjet inks have no binder. Binder-containing inks increase markedly in viscosity
when small amounts of solvent are removed. When used, the polymeric binder creates a
bridge between the pigment and the substrate. In water based inks the binder consists mainly
of water-insoluble styrene- or acrylate-based polymers (Keskitalo 2000; Svanholm 2004)
Additives improve ink properties such as light stability or electrical charge (Oittinen and
Saarelma 1998; Donigian et al. 1999; Keskitalo 2000).
Surface tension plays an important role in the runnability of the inkjet printing process. In
fact, a high surface tension to form ink drops, but to be able to penetrate the paper, the
solvent has to have a low surface tension. In water based inks surface tension is around 30 -
60 dynes/cm, due to the mixing of water with organic compounds. This difference in surface
tension suggests that water based inks can not be expected to behave as water (72
dynes/cm), in terms of paper penetration (Donigian et al. 1999; Keskitalo 2000).
Before drying, inkjet ink layers may be 15 µm or more in thickness for each color. For good
printed appearance, the dyes should be fixed on the paper’s outer surface with only enough
lateral spreading from the position of drop impact to merge adjacent drops in solid colors. In
fact, proper dye fixation is the key to several components of inkjet print quality and, after
drying, the dyes should stay at the surface, even if this is rewetted (Donigian et al. 1999)
Additionally, because inkjet inks are highly fluid, highly surface active and penetrative and
also because of the high velocity of impact on the paper, inkjet papers require
characteristics that match with the inks and the drop volumes. Inkjet papers must respond to
high demands on properties such as surface tension, charge, roughness and porosity (Oittinen
and Saarelma 1998; Donigian et al. 1999).
8.1.2 PRINTING QUALITY EVALUATION
As mentioned in Section 1.5.1, there are no absolute definitions and concepts to define print
quality and the corresponding paper ideal characteristics. They depend on the final use of
the printed product.
An ideal paper for inkjet printing must meet several runnability and printing quality
requirements. For runnability the critical operation is feeding, which is influenced by friction
coefficient, static electricity and cutting quality. Regarding printing quality, paper-ink
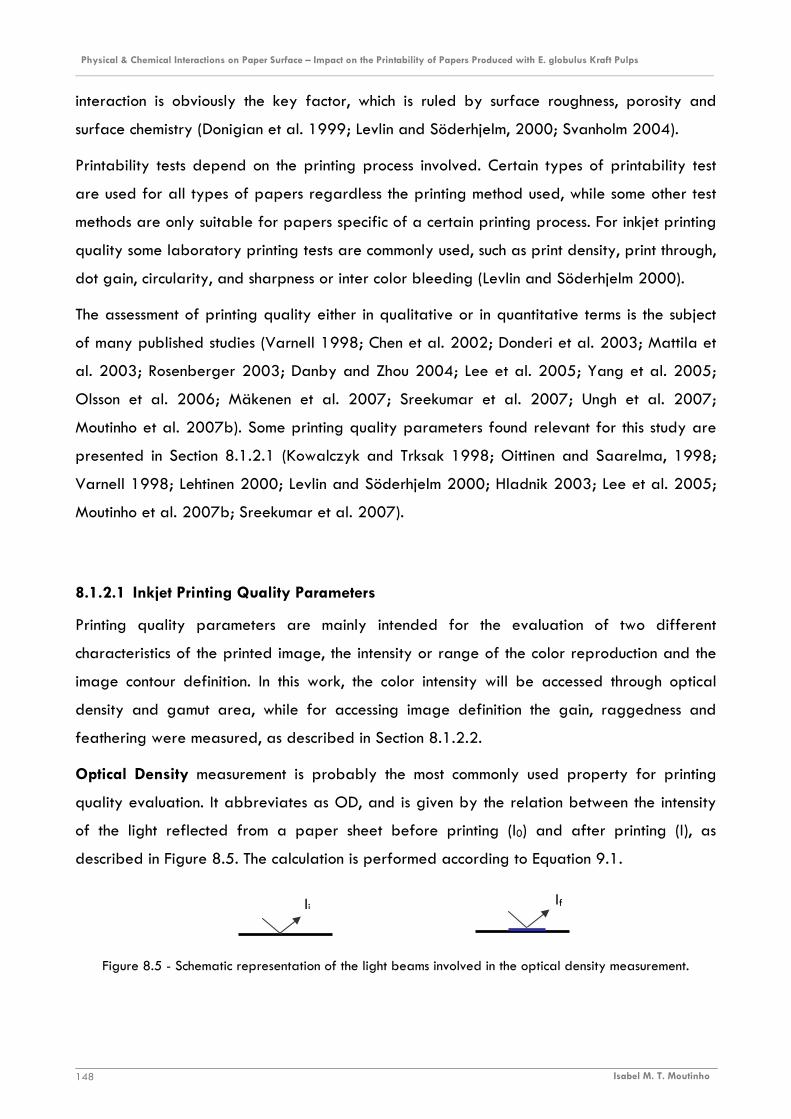
Physical & Chemical Interactions on Paper Surface – Impact on the Printability of Papers Produced with E. globulus Kraft Pulps ________________________________________________________________________________________________________________________
Isabel M. T. Moutinho 148
interaction is obviously the key factor, which is ruled by surface roughness, porosity and
surface chemistry (Donigian et al. 1999; Levlin and Söderhjelm, 2000; Svanholm 2004).
Printability tests depend on the printing process involved. Certain types of printability test
are used for all types of papers regardless the printing method used, while some other test
methods are only suitable for papers specific of a certain printing process. For inkjet printing
quality some laboratory printing tests are commonly used, such as print density, print through,
dot gain, circularity, and sharpness or inter color bleeding (Levlin and Söderhjelm 2000).
The assessment of printing quality either in qualitative or in quantitative terms is the subject
of many published studies (Varnell 1998; Chen et al. 2002; Donderi et al. 2003; Mattila et
al. 2003; Rosenberger 2003; Danby and Zhou 2004; Lee et al. 2005; Yang et al. 2005;
Olsson et al. 2006; Mäkenen et al. 2007; Sreekumar et al. 2007; Ungh et al. 2007;
Moutinho et al. 2007b). Some printing quality parameters found relevant for this study are
presented in Section 8.1.2.1 (Kowalczyk and Trksak 1998; Oittinen and Saarelma, 1998;
Varnell 1998; Lehtinen 2000; Levlin and Söderhjelm 2000; Hladnik 2003; Lee et al. 2005;
Moutinho et al. 2007b; Sreekumar et al. 2007).
8.1.2.1 Inkjet Printing Quality Parameters
Printing quality parameters are mainly intended for the evaluation of two different
characteristics of the printed image, the intensity or range of the color reproduction and the
image contour definition. In this work, the color intensity will be accessed through optical
density and gamut area, while for accessing image definition the gain, raggedness and
feathering were measured, as described in Section 8.1.2.2.
Optical Density measurement is probably the most commonly used property for printing
quality evaluation. It abbreviates as OD, and is given by the relation between the intensity
of the light reflected from a paper sheet before printing (I0) and after printing (I), as
described in Figure 8.5. The calculation is performed according to Equation 9.1.
Figure 8.5 - Schematic representation of the light beams involved in the optical density measurement.
Ii If
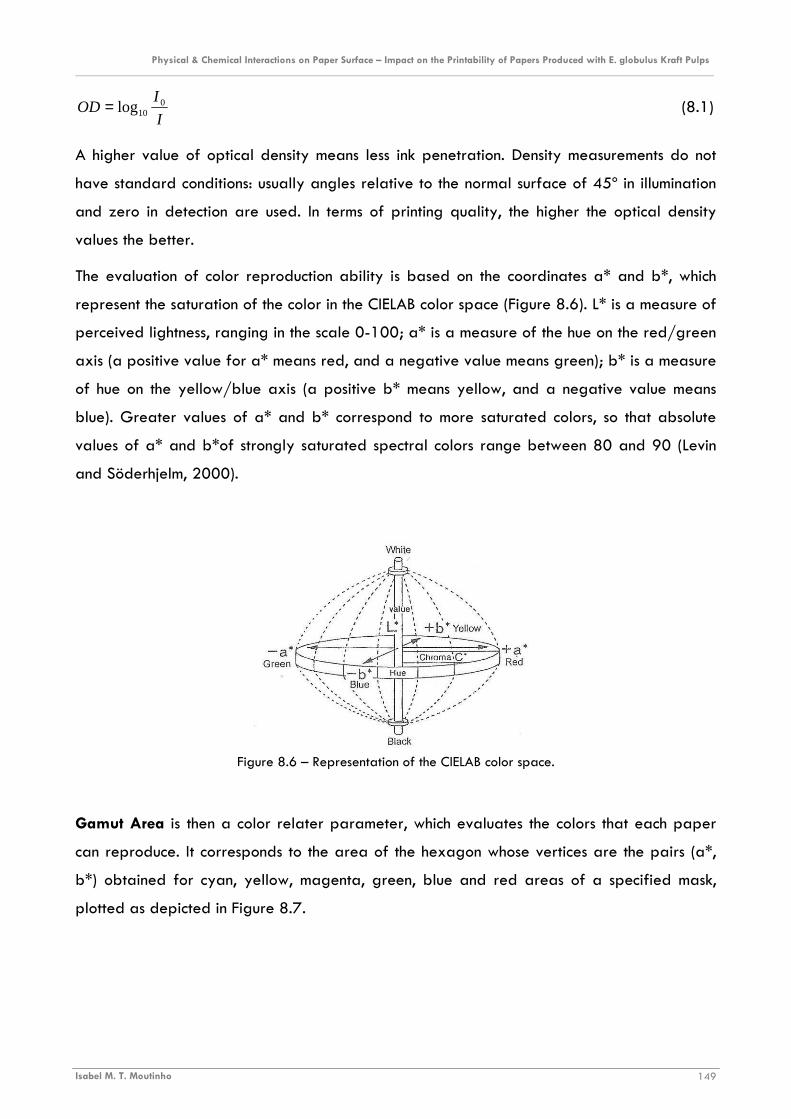
Physical & Chemical Interactions on Paper Surface – Impact on the Printability of Papers Produced with E. globulus Kraft Pulps ________________________________________________________________________________________________________________________
Isabel M. T. Moutinho 149
I
IOD 0
10log= (8.1)
A higher value of optical density means less ink penetration. Density measurements do not
have standard conditions: usually angles relative to the normal surface of 45º in illumination
and zero in detection are used. In terms of printing quality, the higher the optical density
values the better.
The evaluation of color reproduction ability is based on the coordinates a* and b*, which
represent the saturation of the color in the CIELAB color space (Figure 8.6). L* is a measure of
perceived lightness, ranging in the scale 0-100; a* is a measure of the hue on the red/green
axis (a positive value for a* means red, and a negative value means green); b* is a measure
of hue on the yellow/blue axis (a positive b* means yellow, and a negative value means
blue). Greater values of a* and b* correspond to more saturated colors, so that absolute
values of a* and b*of strongly saturated spectral colors range between 80 and 90 (Levin
and Söderhjelm, 2000).
Figure 8.6 – Representation of the CIELAB color space.
Gamut Area is then a color relater parameter, which evaluates the colors that each paper
can reproduce. It corresponds to the area of the hexagon whose vertices are the pairs (a*,
b*) obtained for cyan, yellow, magenta, green, blue and red areas of a specified mask,
plotted as depicted in Figure 8.7.
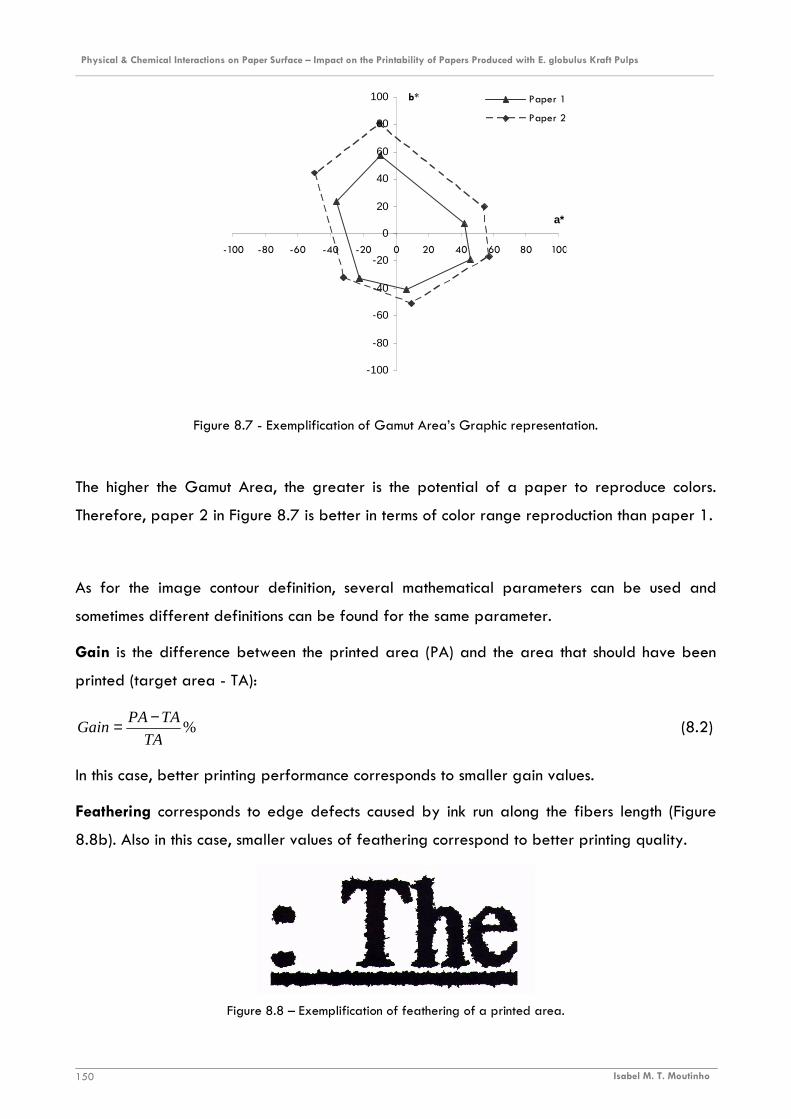
Physical & Chemical Interactions on Paper Surface – Impact on the Printability of Papers Produced with E. globulus Kraft Pulps ________________________________________________________________________________________________________________________
Isabel M. T. Moutinho 150
Figure 8.7 - Exemplification of Gamut Area’s Graphic representation.
The higher the Gamut Area, the greater is the potential of a paper to reproduce colors.
Therefore, paper 2 in Figure 8.7 is better in terms of color range reproduction than paper 1.
As for the image contour definition, several mathematical parameters can be used and
sometimes different definitions can be found for the same parameter.
Gain is the difference between the printed area (PA) and the area that should have been
printed (target area - TA):
%TA
TAPAGain
−= (8.2)
In this case, better printing performance corresponds to smaller gain values.
Feathering corresponds to edge defects caused by ink run along the fibers length (Figure
8.8b). Also in this case, smaller values of feathering correspond to better printing quality.
Figure 8.8 – Exemplification of feathering of a printed area.
-100
-80
-60
-40
-20
0
20
40
60
80
100
-100 -80 -60 -40 -20 0 20 40 60 80 100
a*
b* Paper 1
Paper 2

Physical & Chemical Interactions on Paper Surface – Impact on the Printability of Papers Produced with E. globulus Kraft Pulps ________________________________________________________________________________________________________________________
Isabel M. T. Moutinho 151
Raggedness is the measure of the irregularity of the line contour (the smaller the better).
Corresponds to the sum of the differences found between a straight line adjusted to the
image line, and the printed line.
When using water based inkjet inks, the extent of spreading and penetration of the ink
components in the paper surface and fibrous matrix has a major effect on all these print
quality parameters. Poor penetration of the ink vehicle means slow drying of the ink, which
results in problems of color bleeding and feathering. On the other hand, too much
penetration of the colored dye reduces color saturation, producing an image of inferior
quality. For good print quality a compromise must be achieved between ink drying (which
requires good penetration) and color saturation (which require poor penetration) (Keskitalo,
2000; Svanholm, 2004).
8.1.2.2 Methodology
For the evaluation of the inkjet printing quality of all the samples produced three main
aspects were addressed in this study: color reproduction intensity/range and image
definition, as quantitative information, and human perception of printing quality, as
subjective qualitative assessment of the papers performance in terms of inkjet printing
quality. For that a specific mask was selected were three zones can be isolated (Figure 8.9):
� Zone A – where the color related measurements were performed;
� Zone B – where the line quality was evaluated;
� Zone C – used for the subjective printing quality evaluation.
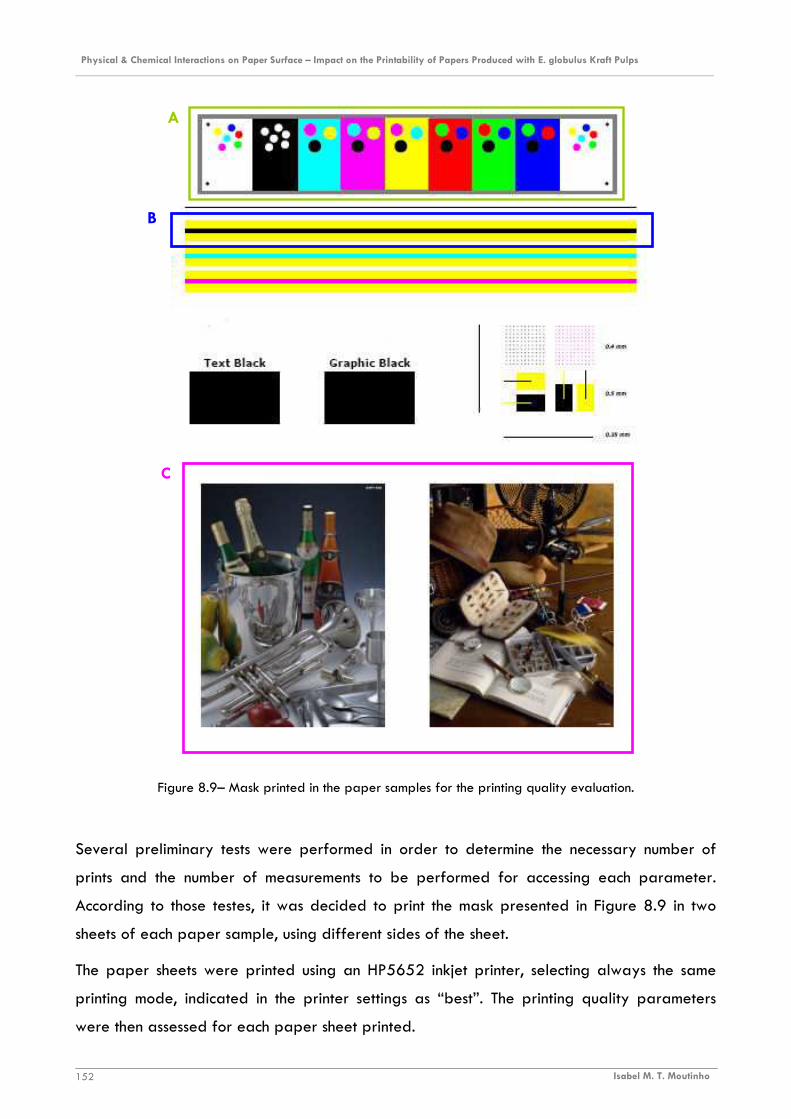
Physical & Chemical Interactions on Paper Surface – Impact on the Printability of Papers Produced with E. globulus Kraft Pulps ________________________________________________________________________________________________________________________
Isabel M. T. Moutinho 152
Figure 8.9– Mask printed in the paper samples for the printing quality evaluation.
Several preliminary tests were performed in order to determine the necessary number of
prints and the number of measurements to be performed for accessing each parameter.
According to those testes, it was decided to print the mask presented in Figure 8.9 in two
sheets of each paper sample, using different sides of the sheet.
The paper sheets were printed using an HP5652 inkjet printer, selecting always the same
printing mode, indicated in the printer settings as “best”. The printing quality parameters
were then assessed for each paper sheet printed.
A
B
C

Physical & Chemical Interactions on Paper Surface – Impact on the Printability of Papers Produced with E. globulus Kraft Pulps ________________________________________________________________________________________________________________________
Isabel M. T. Moutinho 153
Optical Density (OD) values were measured in the black, cyan, magenta and yellow areas in
the zone indicated as A in Figure 8.9 using the spectrophotometer Gretag D19C. At least
three measurements for each color were performed in each printed sample and an average
value was computed for the OD values of each color and paper.
The CIELab color coordinates (a*, b*) used to compute the gamut area values were assessed
using the AvaMouse spectrophotometer. For each paper sheet, two separate measurements
of a* and b* for each of the six colors (A zone of the mask) were performed, and the gamut
area was computed using the average values of those measurements. This procedure was
repeated for the two sheets printed for each paper type, and the average of the two values
was used for further analysis.
Regarding the image definition, accessed in this work by evaluation the line quality a
personal image analysis system PIA BASF – 8042319 was used in the black line with yellow
background (B zone of the mask). For each type of paper tested, the average of six
measurements was considered (three separated measurements for each printed sheet). Each
of the three measurements performed by sheet corresponds to a different zone of the
printed line and to six measurements of each property. The variables measured by this
device are named as plain (mm2), borderlenght (mm) and roughness and are used to access
the printing quality parameters gain, feathering and raggedness, respectively.
The subjective evaluation was based on the perception of an independent panel of ten
different persons, regarding the images printed (zone C of Figure 8.9). The following
procedure was used:
� The pictures were separated in four groups (corresponding to two pictures in two sheets
of each type of paper).
� Each panel member was asked, for each of the four groups separately, to classify the
images according to his personal preference in a 0 to 100 scale, assigning a different
classification only when perceiving a relevant difference between the samples.
� The results were normalized according to the maximum and minimum values used by
each person, in order to allow the comparison of the results.
� The average of the normalized rating achieved for each sample was computed and
used for further analysis.

Physical & Chemical Interactions on Paper Surface – Impact on the Printability of Papers Produced with E. globulus Kraft Pulps ________________________________________________________________________________________________________________________
Isabel M. T. Moutinho 154
8.2 RESULTS
As presented in Section 8.1.2.2, eight quantitative parameters were accessed for the paper
samples under analysis in this work (OD black, OD cyan, OD magenta, OD yellow, Gamut
area, gain, feathering and raggedness). To determine which parameters are the most
important to describe the samples printability, PCA was used, and a 73% degree of
explanation of the results variability (42% 1st component; 31% 2nd component) was obtained
(Figure 8.10).
Figure 8.10 – PCA for all the printing quality parameters.
Since the optical densities of the three colors cyan, magenta and yellow are in the same zone
of the plot, and yellow is the most critical in terms of achieving a good inkjet printing quality,
the OD of cyan and magenta were no further considered. The same overlapping was found
for the line quality parameters (feathering, raggedness and gain), after testing several
solutions it was decided to consider only the gain. Next, a new PCA was performed using the
remaining four variables (OD black, OD yellow, gamut area and gain) and the result is
presented in Figure 8.11.
Figure 8.11 – PCA using 4 printing quality parameters.
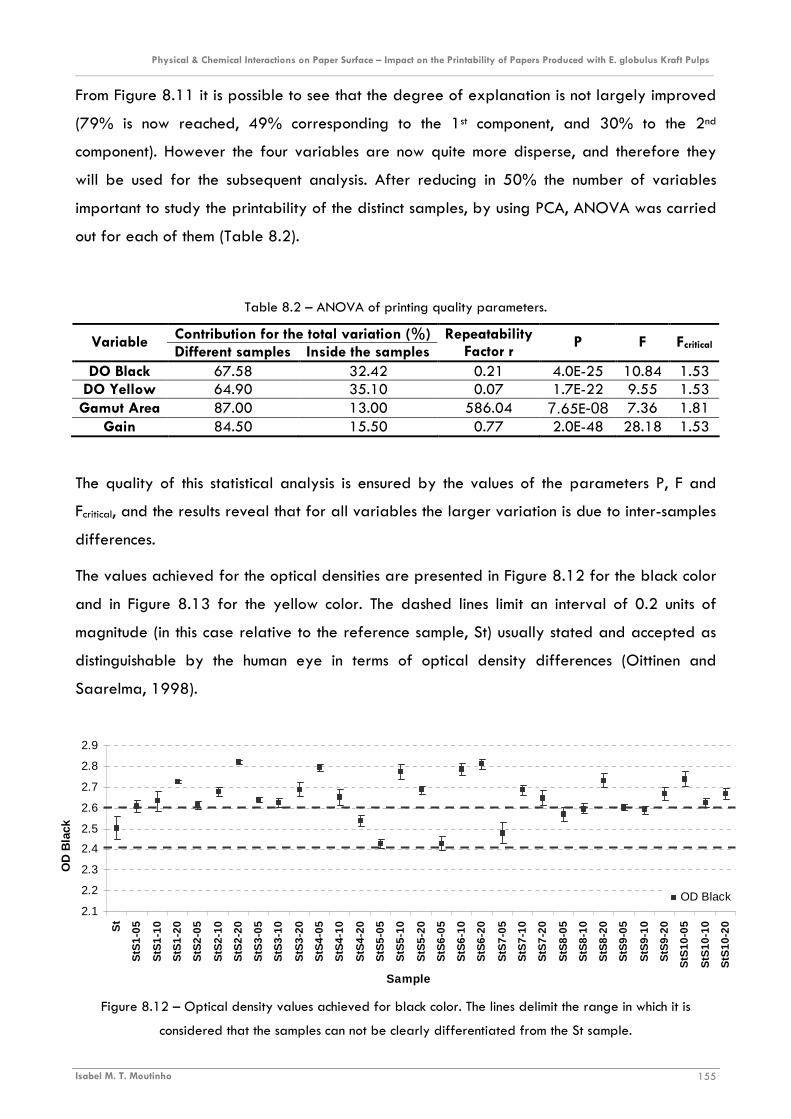
Physical & Chemical Interactions on Paper Surface – Impact on the Printability of Papers Produced with E. globulus Kraft Pulps ________________________________________________________________________________________________________________________
Isabel M. T. Moutinho 155
2.1
2.2
2.3
2.4
2.5
2.6
2.7
2.8
2.9
St
StS
1-05
StS
1-10
StS
1-20
StS
2-05
StS
2-10
StS
2-20
StS
3-05
StS
3-10
StS
3-20
StS
4-05
StS
4-10
StS
4-20
StS
5-05
StS
5-10
StS
5-20
StS
6-05
StS
6-10
StS
6-20
StS
7-05
StS
7-10
StS
7-20
StS
8-05
StS
8-10
StS
8-20
StS
9-05
StS
9-10
StS
9-20
StS
10-0
5
StS
10-1
0
StS
10-2
0
Sample
OD
Bla
ck
OD Black
From Figure 8.11 it is possible to see that the degree of explanation is not largely improved
(79% is now reached, 49% corresponding to the 1st component, and 30% to the 2nd
component). However the four variables are now quite more disperse, and therefore they
will be used for the subsequent analysis. After reducing in 50% the number of variables
important to study the printability of the distinct samples, by using PCA, ANOVA was carried
out for each of them (Table 8.2).
Table 8.2 – ANOVA of printing quality parameters.
Contribution for the total variation (%) Variable Different samples Inside the samples
Repeatability Factor r
P F Fcritical
DO Black 67.58 32.42 0.21 4.0E-25 10.84 1.53 DO Yellow 64.90 35.10 0.07 1.7E-22 9.55 1.53
Gamut Area 87.00 13.00 586.04 7.65E-08 7.36 1.81 Gain 84.50 15.50 0.77 2.0E-48 28.18 1.53
The quality of this statistical analysis is ensured by the values of the parameters P, F and
Fcritical, and the results reveal that for all variables the larger variation is due to inter-samples
differences.
The values achieved for the optical densities are presented in Figure 8.12 for the black color
and in Figure 8.13 for the yellow color. The dashed lines limit an interval of 0.2 units of
magnitude (in this case relative to the reference sample, St) usually stated and accepted as
distinguishable by the human eye in terms of optical density differences (Oittinen and
Saarelma, 1998).
Figure 8.12 – Optical density values achieved for black color. The lines delimit the range in which it is
considered that the samples can not be clearly differentiated from the St sample.
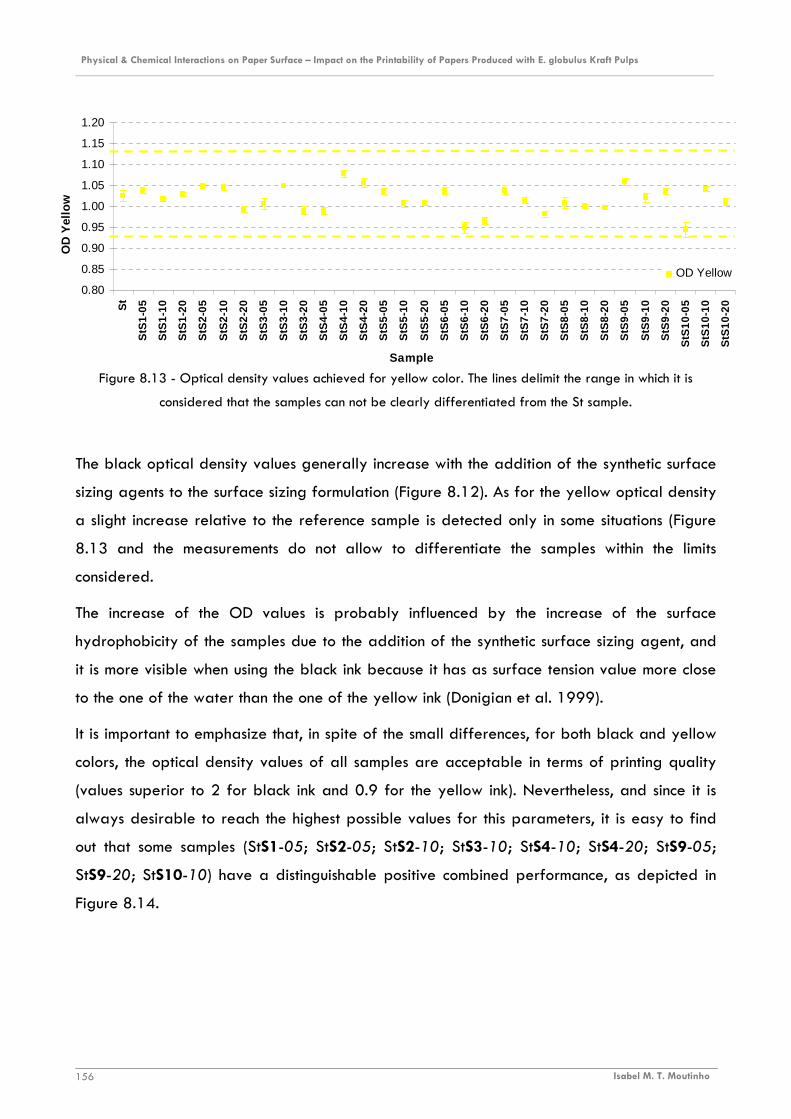
Physical & Chemical Interactions on Paper Surface – Impact on the Printability of Papers Produced with E. globulus Kraft Pulps ________________________________________________________________________________________________________________________
Isabel M. T. Moutinho 156
0.80
0.85
0.90
0.95
1.00
1.05
1.10
1.15
1.20S
t
StS
1-05
StS
1-10
StS
1-20
StS
2-05
StS
2-10
StS
2-20
StS
3-05
StS
3-10
StS
3-20
StS
4-05
StS
4-10
StS
4-20
StS
5-05
StS
5-10
StS
5-20
StS
6-05
StS
6-10
StS
6-20
StS
7-05
StS
7-10
StS
7-20
StS
8-05
StS
8-10
StS
8-20
StS
9-05
StS
9-10
StS
9-20
StS
10-0
5
StS
10-1
0
StS
10-2
0
Sample
OD
Yel
low
OD Yellow
Figure 8.13 - Optical density values achieved for yellow color. The lines delimit the range in which it is
considered that the samples can not be clearly differentiated from the St sample.
The black optical density values generally increase with the addition of the synthetic surface
sizing agents to the surface sizing formulation (Figure 8.12). As for the yellow optical density
a slight increase relative to the reference sample is detected only in some situations (Figure
8.13 and the measurements do not allow to differentiate the samples within the limits
considered.
The increase of the OD values is probably influenced by the increase of the surface
hydrophobicity of the samples due to the addition of the synthetic surface sizing agent, and
it is more visible when using the black ink because it has as surface tension value more close
to the one of the water than the one of the yellow ink (Donigian et al. 1999).
It is important to emphasize that, in spite of the small differences, for both black and yellow
colors, the optical density values of all samples are acceptable in terms of printing quality
(values superior to 2 for black ink and 0.9 for the yellow ink). Nevertheless, and since it is
always desirable to reach the highest possible values for this parameters, it is easy to find
out that some samples (StS1-05; StS2-05; StS2-10; StS3-10; StS4-10; StS4-20; StS9-05;
StS9-20; StS10-10) have a distinguishable positive combined performance, as depicted in
Figure 8.14.
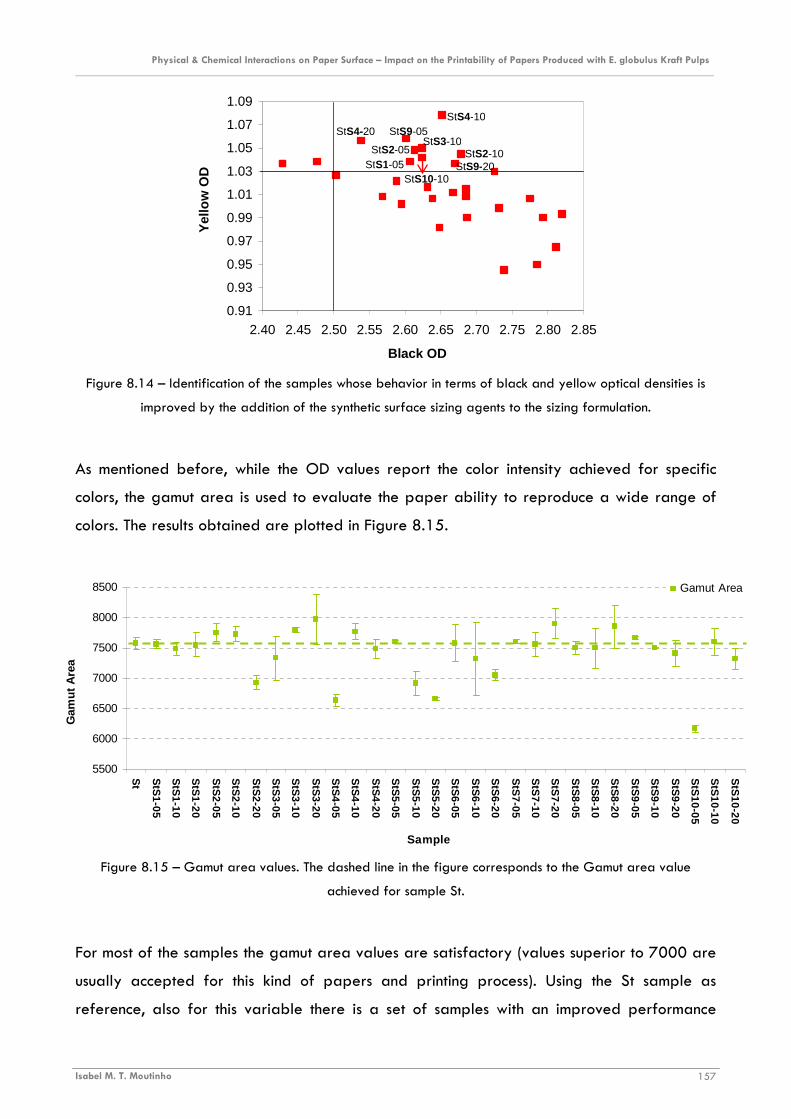
Physical & Chemical Interactions on Paper Surface – Impact on the Printability of Papers Produced with E. globulus Kraft Pulps ________________________________________________________________________________________________________________________
Isabel M. T. Moutinho 157
0.91
0.93
0.95
0.97
0.99
1.01
1.03
1.05
1.07
1.09
2.40 2.45 2.50 2.55 2.60 2.65 2.70 2.75 2.80 2.85
Black OD
Yel
low
OD
StS3-10StS2-05
StS4-10StS4-20 StS9-05
StS1-05StS10-10
StS2-10StS9-20
5500
6000
6500
7000
7500
8000
8500
St
StS
1-05
StS
1-10
StS
1-20
StS
2-05
StS
2-10
StS
2-20
StS
3-05
StS
3-10
StS
3-20
StS
4-05
StS
4-10
StS
4-20
StS
5-05
StS
5-10
StS
5-20
StS
6-05
StS
6-10
StS
6-20
StS
7-05
StS
7-10
StS
7-20
StS
8-05
StS
8-10
StS
8-20
StS
9-05
StS
9-10
StS
9-20
StS
10-05
StS
10-10
StS
10-20
Sample
Gam
ut A
rea
Gamut Area
Figure 8.14 – Identification of the samples whose behavior in terms of black and yellow optical densities is
improved by the addition of the synthetic surface sizing agents to the sizing formulation.
As mentioned before, while the OD values report the color intensity achieved for specific
colors, the gamut area is used to evaluate the paper ability to reproduce a wide range of
colors. The results obtained are plotted in Figure 8.15.
Figure 8.15 – Gamut area values. The dashed line in the figure corresponds to the Gamut area value
achieved for sample St.
For most of the samples the gamut area values are satisfactory (values superior to 7000 are
usually accepted for this kind of papers and printing process). Using the St sample as
reference, also for this variable there is a set of samples with an improved performance

Physical & Chemical Interactions on Paper Surface – Impact on the Printability of Papers Produced with E. globulus Kraft Pulps ________________________________________________________________________________________________________________________
Isabel M. T. Moutinho 158
resultant from the addition of the surface sizing agents to the sizing formulation: StS2-05;
StS2-10; StS3-10; StS3-20; StS4-10;StS7-20; StS8-20; StS9-05; StS10-10
The results for the gain are presented in Figure 8.16, and it is possible to see that most of the
sizing formulations improve the printing performance in terms of image definition.
Figure 8.16 – Gain values. The line in the figure refers to the value achieved for the St sample.
As previously mentioned, the printing quality parameters refer to different aspects of the
printed image (mainly color saturation or image definition) and thus they must not be
analyzed separately. In this context, combining the results obtained for the four parameters
(OD black, OD yellow, gamut area and gain), the samples with the best printing
performance reported by the quantitative parameters that were analyzed are: StS2-05;
StS9-05 and StS10-10.
These three samples have styrene in the composition of the sizing agent used in the sizing
blend, present values of wetting velocity between 0.09 and 0.2º/sec and polar components
of the surface free energy between 6 and 8 mN/m. However, other samples also fitting
these characteristics do not exhibit a good printing performance and therefore no definite
and unique conclusion can be drawn regarding their combined influence in the printing
quality
Besides this quantitative analysis of the inkjet printing performance, and as mentioned
before, this work also comprises a subjective evaluation of the printing quality obtained for
each sample, from the point of view of the human perception. The results achieved using the
methodology presented in Section 8.1.2.2 are plotted in Figure 8.17.
3.0
4.0
5.0
6.0
7.0
8.0
St
StS
1-0
5
StS
1-1
0
StS
1-2
0
StS
2-0
5
StS
2-1
0
StS
2-2
0
StS
3-0
5
StS
3-1
0
StS
3-2
0
StS
4-0
5
StS
4-1
0
StS
4-2
0
StS
5-0
5
StS
5-1
0
StS
5-2
0
StS
6-0
5
StS
6-1
0
StS
6-2
0
StS
7-0
5
StS
7-1
0
StS
7-2
0
StS
8-0
5
StS
8-1
0
StS
8-2
0
StS
9-0
5
StS
9-1
0
StS
9-2
0
StS
10-0
5
StS
10-1
0
StS
10-2
0
Sample
Gai
n (%
)
Gain
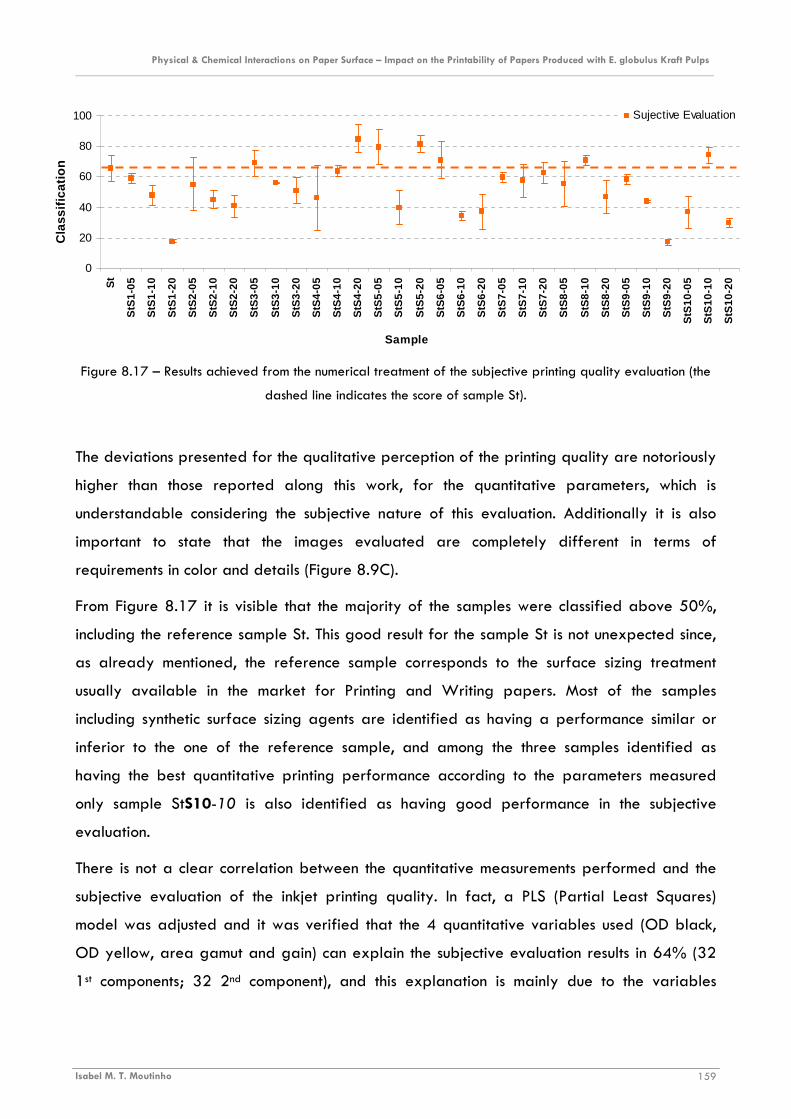
Physical & Chemical Interactions on Paper Surface – Impact on the Printability of Papers Produced with E. globulus Kraft Pulps ________________________________________________________________________________________________________________________
Isabel M. T. Moutinho 159
Figure 8.17 – Results achieved from the numerical treatment of the subjective printing quality evaluation (the
dashed line indicates the score of sample St).
The deviations presented for the qualitative perception of the printing quality are notoriously
higher than those reported along this work, for the quantitative parameters, which is
understandable considering the subjective nature of this evaluation. Additionally it is also
important to state that the images evaluated are completely different in terms of
requirements in color and details (Figure 8.9C).
From Figure 8.17 it is visible that the majority of the samples were classified above 50%,
including the reference sample St. This good result for the sample St is not unexpected since,
as already mentioned, the reference sample corresponds to the surface sizing treatment
usually available in the market for Printing and Writing papers. Most of the samples
including synthetic surface sizing agents are identified as having a performance similar or
inferior to the one of the reference sample, and among the three samples identified as
having the best quantitative printing performance according to the parameters measured
only sample StS10-10 is also identified as having good performance in the subjective
evaluation.
There is not a clear correlation between the quantitative measurements performed and the
subjective evaluation of the inkjet printing quality. In fact, a PLS (Partial Least Squares)
model was adjusted and it was verified that the 4 quantitative variables used (OD black,
OD yellow, area gamut and gain) can explain the subjective evaluation results in 64% (32
1st components; 32 2nd component), and this explanation is mainly due to the variables
0
20
40
60
80
100S
t
StS
1-05
StS
1-10
StS
1-20
StS
2-05
StS
2-10
StS
2-20
StS
3-05
StS
3-10
StS
3-20
StS
4-05
StS
4-10
StS
4-20
StS
5-05
StS
5-10
StS
5-20
StS
6-05
StS
6-10
StS
6-20
StS
7-05
StS
7-10
StS
7-20
StS
8-05
StS
8-10
StS
8-20
StS
9-05
StS
9-10
StS
9-20
StS
10-0
5
StS
10-1
0
StS
10-2
0
Sample
Cla
ssifi
catio
n
Sujective Evaluation

Physical & Chemical Interactions on Paper Surface – Impact on the Printability of Papers Produced with E. globulus Kraft Pulps ________________________________________________________________________________________________________________________
Isabel M. T. Moutinho 160
associated to color reproduction and intensity (aprox 60%), less than 4% are explained by
the image definition variable (gain).
Physical & Chemical Interactions on Paper Surface – Impact on the Printability of Papers Produced with E. globulus Kraft Pulps ________________________________________________________________________________________________________________________
Isabel M. T. Moutinho 161
8.3 CORRELATIONS AND MODELS
From the discussion presented so far and in the previous chapters, is possible to highlight that
the differentiation between samples in terms of printing performance and the detail of the
analysis did not reach the same level obtained with the surface characterization techniques,
which is a consequence of the differences in the corresponding capacity for the analysis of
small and specific differences such as surface properties. Therefore, the use of more precise
printing quality evaluation techniques to detect and quantify the differences between the
samples is desirable.
Nonetheless the remarks presented, it is possible to state that the addition of synthetic
surface sizing agents to the surface sizing formulation improves some printing quality
parameters and in some cases an overall improvement of the printing quality in terms of
both, quantitative parameters and perceived printing quality was noticed.
In order to relate this printing quality performance with the results of the previous analysis
regarding the interactions at the paper surface and the effect of each surface sizing agent
into the surface properties of the paper samples, partial least squares (PLS) numerical
models were used. Table 8.3 lists the variables used to perform the PLS analysis.
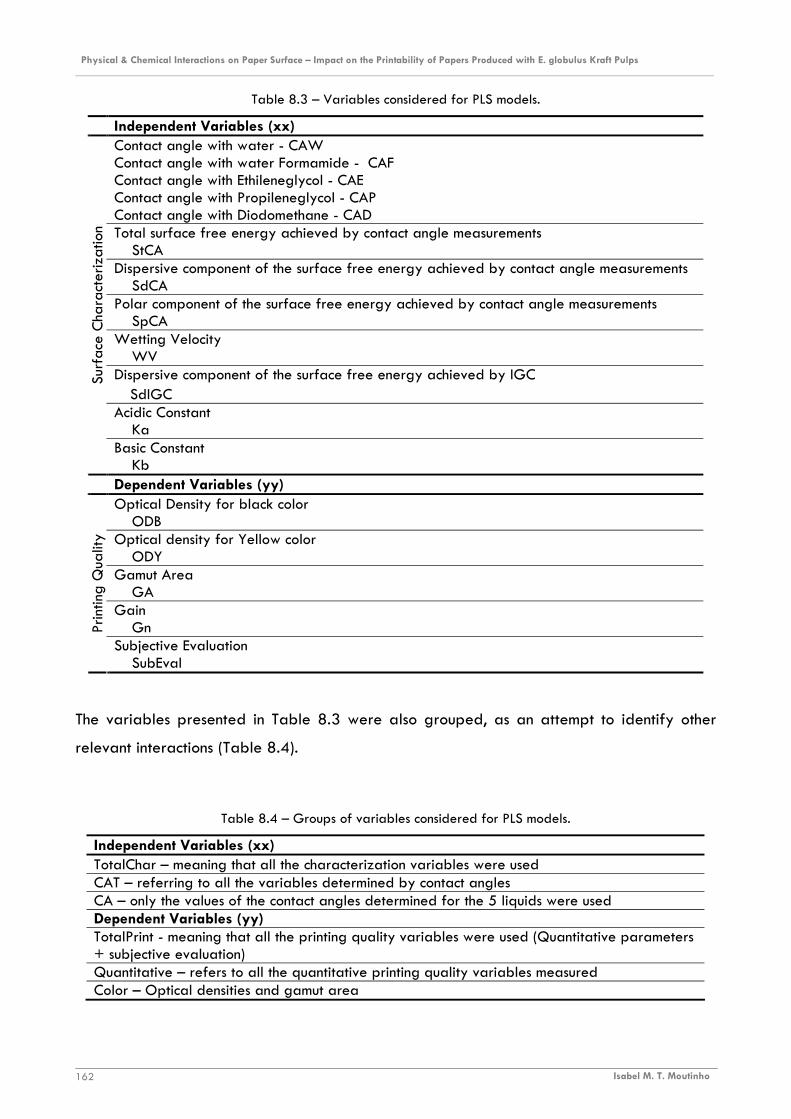
Physical & Chemical Interactions on Paper Surface – Impact on the Printability of Papers Produced with E. globulus Kraft Pulps ________________________________________________________________________________________________________________________
Isabel M. T. Moutinho 162
Table 8.3 – Variables considered for PLS models.
Independent Variables (xx) Contact angle with water - CAW Contact angle with water Formamide - CAF Contact angle with Ethileneglycol - CAE Contact angle with Propileneglycol - CAP Contact angle with Diodomethane - CAD Total surface free energy achieved by contact angle measurements StCA Dispersive component of the surface free energy achieved by contact angle measurements SdCA Polar component of the surface free energy achieved by contact angle measurements SpCA Wetting Velocity WV Dispersive component of the surface free energy achieved by IGC SdIGC Acidic Constant Ka
Surf
ace
Cha
ract
eriz
atio
n
Basic Constant Kb
Dependent Variables (yy) Optical Density for black color ODB Optical density for Yellow color ODY Gamut Area GA Gain Gn Pr
intin
g Q
ualit
y
Subjective Evaluation SubEval
The variables presented in Table 8.3 were also grouped, as an attempt to identify other
relevant interactions (Table 8.4).
Table 8.4 – Groups of variables considered for PLS models.
Independent Variables (xx) TotalChar – meaning that all the characterization variables were used CAT – referring to all the variables determined by contact angles CA – only the values of the contact angles determined for the 5 liquids were used Dependent Variables (yy) TotalPrint - meaning that all the printing quality variables were used (Quantitative parameters + subjective evaluation) Quantitative – refers to all the quantitative printing quality variables measured Color – Optical densities and gamut area
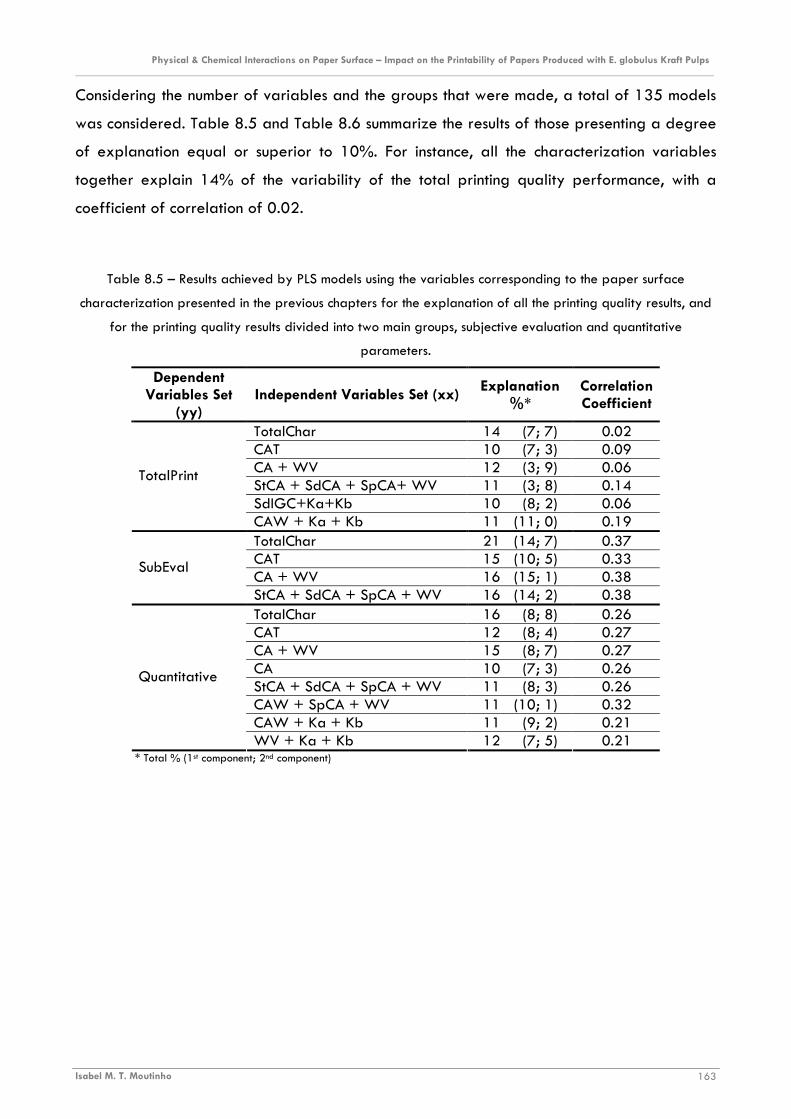
Physical & Chemical Interactions on Paper Surface – Impact on the Printability of Papers Produced with E. globulus Kraft Pulps ________________________________________________________________________________________________________________________
Isabel M. T. Moutinho 163
Considering the number of variables and the groups that were made, a total of 135 models
was considered. Table 8.5 and Table 8.6 summarize the results of those presenting a degree
of explanation equal or superior to 10%. For instance, all the characterization variables
together explain 14% of the variability of the total printing quality performance, with a
coefficient of correlation of 0.02.
Table 8.5 – Results achieved by PLS models using the variables corresponding to the paper surface
characterization presented in the previous chapters for the explanation of all the printing quality results, and
for the printing quality results divided into two main groups, subjective evaluation and quantitative
parameters.
Dependent Variables Set
(yy) Independent Variables Set (xx)
Explanation %*
Correlation Coefficient
TotalChar 14 (7; 7) 0.02 CAT 10 (7; 3) 0.09 CA + WV 12 (3; 9) 0.06 StCA + SdCA + SpCA+ WV 11 (3; 8) 0.14 SdIGC+Ka+Kb 10 (8; 2) 0.06
TotalPrint
CAW + Ka + Kb 11 (11; 0) 0.19 TotalChar 21 (14; 7) 0.37 CAT 15 (10; 5) 0.33 CA + WV 16 (15; 1) 0.38
SubEval
StCA + SdCA + SpCA + WV 16 (14; 2) 0.38 TotalChar 16 (8; 8) 0.26 CAT 12 (8; 4) 0.27 CA + WV 15 (8; 7) 0.27 CA 10 (7; 3) 0.26 StCA + SdCA + SpCA + WV 11 (8; 3) 0.26 CAW + SpCA + WV 11 (10; 1) 0.32 CAW + Ka + Kb 11 (9; 2) 0.21
Quantitative
WV + Ka + Kb 12 (7; 5) 0.21 * Total % (1st component; 2nd component)

Physical & Chemical Interactions on Paper Surface – Impact on the Printability of Papers Produced with E. globulus Kraft Pulps ________________________________________________________________________________________________________________________
Isabel M. T. Moutinho 164
Table 8.6 – Results achieved by PLS models using the variables corresponding to the paper surface
characterization presented in the previous chapters for the explanation of the quantitative quality results,
divided in groups.
Dependent Variables Set
(yy) Independent Variables Set (xx)
Explanation %*
Correlation Coefficient
TotalChar 16 (9; 7) 0.27 CAT 15 (9; 6) 0.27 CA + StCA + SdCA + SpCA 10 (8; 2) 0.26 CA + WV 19 (10; 9) 0.27 CA 12 (8; 4) 0.26 StCA + SdCA + SpCA + WV 13 (10; 3) 0.26 CAW + SpCA + WV 14 (12; 2) 0.32
Color
WV + Ka + Kb 12 (8; 4) 0.22 TotalChar 30 (18; 12) 0.42 CAT 25 (18; 7) 0.42 CA + StCA + SdCA + SpCA 24 (15; 9) 0.38 CA + WV 25 (19; 6) 0.43 CA 23 (15; 8) 0.39 StCA + SdCA + SpCA + WV 21 (19; 2) 0.44 StCA + SdCA + SpCA 13 (13; 0) 0.36 CAW + SpCA + WV 23 (20; 3) 0.44 CAW + Ka + Kb 12 (12; 0) 0.35
Gamut Area
WV + Ka + Kb 25 (21; 4) 0.43 TotalChar 16 (7; 9) 0.30 CAT 12 (6; 6) 0.29 CA + WV 16 (6; 10) 0.29
ODB + ODY
CA 11 (6; 5) 0.29 TotalChar 13 (8; 5) 0.29 CAT 11 (8; 3) 0.28 CA + WV 12 (8; 4) 0.28 CA 10 (8; 2) 0.28 StCA + SdCA + SpCA + WV 10 (8; 2) 0.28 CAW + SpCA + WV 10 (10; 0) 0.31
ODBlack
CAW + Ka + Kb 10 (10; 0) 0.31 TotalChar 21 (7; 14) 0.27 CAT 17 (6; 11) 0.23 CA + WV 21 (6; 15) 0.23 CA 13 (4; 9) 0.21
ODYellow
StCA + SdCA + SpCA + WV 10 (6; 4) 0.25 TotalChar 20 (12; 8) 0.34 CA + StCA + SdCA + SpCA 10 (5; 5) 0.23 CA 11 (6; 5) 0.24 SdIGC + Ka + Kb 16 (16; 0) 0.40 Ka + Kb 12 (12; 0) 0.25 SpCA + Ka + Kb 17 (16; 1) 0.40 CAW + Ka + Kb 18 (18; 0) 0.42
Gain
WV + Ka + Kb 12 (11; 1) 0.34 * Total % (1st component; 2nd component)
Physical & Chemical Interactions on Paper Surface – Impact on the Printability of Papers Produced with E. globulus Kraft Pulps ________________________________________________________________________________________________________________________
Isabel M. T. Moutinho 165
From both Table 8.5 and Table 8.6 it is visible that the explanation percentages as well as
the correlation coefficients are in general quite small.
The quantitative parameters are more explained by the surface properties determined, and
in particular, the gamut area values are quite well explained by the Ka and Kb values
achieved by IGC.
The previous analysis shows that the surface characteristics influence the printing quality
parameters that were evaluated. However, the techniques and parameters considered in this
study do not allow explain and anticipate the impact of the nature, structure or amount of
the surface sizing agents on the printing performance.
This means that other paper surface properties and maybe other printing variables than
those measured is this study and used in the PLS analysis should also be considered in order
to fully understand the paper-ink interactions.


CHAPTER 9
COMPLEMENTARY STUDIES


Physical & Chemical Interactions on Paper Surface – Impact on the Printability of Papers Produced with E. globulus Kraft Pulps ________________________________________________________________________________________________________________________
Isabel M. T. Moutinho 169
9 COMPLEMENTARY STUDIES
This chapter reports some relevant studies that were performed using paper samples
produced in this work, oriented to specific objectives, and thus subject of isolated papers.
The paper “Effect of surface sizing on the surface chemistry of paper containing
eucalyptus pulp” aims at verify for this type of papers the suitability of ESCA and ToF-SIMS
in obtaining detailed information about the chemical composition of the outermost surface
layers of the surface sized papers and at answering the question how those surface layers
are affected by the surface sizing formulations.
This specific study allowed to conclude that ESCA complemented with ToF-SIMS is a good
way to evaluate the effect of different sizing formulations. The elements present at the
samples surfaces were identified and their relative quantity could be evaluated. It was also
possible to confirm that the samples surfaces exhibited distinct chemical characteristics.
Although both formulations possessed the same percentage of cationic starch, relatively more
of this polymer was detected on the sample surfaces, if co-acrylonitrile-acrylate was
applied. This result was interpreted in terms of the properties of copolymers particles. It is
suggested that the co-acrylonitrile-acrylate particles penetrate deeper to the paper structure
than the co-styrene-acrylate particles due to their lower surface tension and therefore leave
behind relatively more starch at the paper surface. Additionally, it was found that the
increase of the sizing pick-up from 3.5 to 9.0 g m-2 only slightly changed the surface
characteristics. Accordingly, lower amount of size is enough for surface improvement.
The paper “On the evaluation of the topography of surface sized Eucalyptus based
papers” aims at compare the surface structure of two paper samples with different surface
sizing treatments by using Atomic Force Microscopy (AFM). The sizing performance is also
evaluated in terms of uniformity, particle size, shape and distribution over the paper surface
as well as in terms of surface topography.
This specific study indicated that AFM and SEM can be complementary used to study paper
surface sizing. SEM allows a general evaluation of the surface and AFM enables to resolve
small details on the paper surface, showing topographic differences not only between the
unsized and sized samples but also between samples sized with distinct surface sizing

Physical & Chemical Interactions on Paper Surface – Impact on the Printability of Papers Produced with E. globulus Kraft Pulps ________________________________________________________________________________________________________________________
Isabel M. T. Moutinho 170
formulations. In fact, differences both in the copolymer distribution on the paper surface and
in the copolymers particle size were clearly visible. Nonetheless, these differences were not
reflected in the roughness parameters quantified by AFM. Despite considerable differences
between the absolute values of AFM and profilometry, the results of the latter (with much less
deviations) confirm that both the unsized and the sized samples exhibited very similar
roughness parameter values.

Physical & Chemical Interactions on Paper Surface – Impact on the Printability of Papers Produced with E. globulus Kraft Pulps ________________________________________________________________________________________________________________________
Isabel M. T. Moutinho clxxi
PAPER
EFFECT OF SURFACE SIZING ON THE SURFACE CHEMISTRY OF PAPER
CONTAINING EUCALYPTUS PULP
Published in: Holforschung; 63; pp: 282-289; 2009

clxxii
clxxiii
Effect of surface sizing on the surface chemistry of paper containing eucalyptus pulp
Running title: Effect of surface sizing on paper surfaces
Isabel Maria Teixeira Moutinhoa*,
Anne Marjatta Kleenb,
Maria Margarida Lopes Figueiredoa,
Paulo Jorge Tavares Ferreiraa
a Departamento de Engenharia Química, Universidade de Coimbra
Pólo II – Pinhal de Marrocos, 3030-290 Coimbra, Portugal
b KCL, Tekniikantie 2, 02150 Espoo, Finland
* Corresponding Author:
Departamento de Engenharia Química, Universidade de Coimbra, Pólo II – Pinhal de Marrocos, 3030-
290 Coimbra, Portugal.
Phone: +351.239.798.700.
Fax: +351 239 798 703
E-mail: [email protected]
KEYWORDS
ESCA, Eucalyptus globulus, Kraft pulp, Surface chemistry, Surface properties, Surface sizing, ToF-SIMS.
Abstract
The effect of different surface sizing formulations on the chemical features of surfaces of the papers
produced from Eucalyptus kraft pulp has been studied. The surface analysis techniques electron
spectroscopy for chemical analysis (ESCA) and time of flight secondary ion mass spectrometry (ToF-SIMS)
has been applied. An uncoated base paper, the reference material, was sized with blends of cationic
starch with either co-acrylonitrile-acrylate or co-styrene-acrylate. The results of both techniques are in
good agreement and complete each other. It was possible not only to detect the presence of the surface
sizing agents on the paper surface but also to distinguish them and evaluate their distribution and
clxxiv
relative concentration. In addition, it was found that application of higher amounts of the sizing
formulations, at a constant ratio of 20% copolymer to starch, did not change significantly the chemical
properties of the paper surfaces.
Introduction
The papermaking industry has to increase its know-how and to improve the quality of all paper grades
(COST E32 2002; Pruszynski 2003) because of the increasing demand of costumers and the competition
between information media. For printing and writing papers and other special paper grades, physical
and chemical properties of paper surfaces are critical for achieving a good performance of the final
products (Lertsutthiwong et al. 2004; Carceller and Juppo 2004; Laleg 2004). The physical structure of
the paper surface – its roughness and porosity, for example – plays an outstanding role on the quality of
the printed details. The surface is influenced by the structural , and surface characteristics of the fibers,
fines, and mineral fillers of the paper matrix, Moreover, the surface chemistry of paper has a great
impact on the spreading and absorption rate of coating colors and inks. The surface characteristics of
papers depend on the base paper composition and on the surface treatments, such as coating and
surface sizing (Rutar and Hladnik 2000; Keskitalo 2000; Oliver et al. 2001; Koskela and Hormi 2003).
Surface sizing influences the porosity, roughness, internal strength of the paper, particles detachment, and
the hydrophobic character of surface. The latter is important to prevent excessive absorption of liquids.
Starch and synthetic polymers are common sizing chemicals and these also have an influence on the
physical and chemical properties of paper bulk (Pruszynski 2003; Koskela and Hormi 2003;
Lertsutthiwong et al. 2004; Laleg 2004; Mešic et al. 2004; Moutinho et al. 2007).
The characterization of paper surfaces is of outermost importance for evaluating the effect of sizing and
selecting the most appropriate chemicals for a specific base paper (Donigian et al. 1997; Shirazi et al.
2003; Forsström et al. 2003; Hladnik 2003; Lertsutthiwong et al. 2004; Carceller and Juppo 2004;
Mešic et al. 204; Ajerschi 2004; Hamers 2005).
From the techniques currently available for chemical characterization of the paper surfaces, the two most
capables were selected for this study. These are: 1) electron spectroscopy for chemical analysis (ESCA)
and 2) time of flight secondary ion mass spectrometry (ToF-SIMS). Since the fundamentals of these
techniques are well described in the literature, only a short description of each one is provided in this
text.
ESCA has proved to be a sensitive technique for obtaining information about the chemical composition
and structure of a solid surface, within a sampling depth of about 5 nm (Dorris and Gray 1978; Brinen,
1993; Kleen et al. 2003; Kangas and Kleen 2004; Hale et al. 2007). It is based on the energy changes
of the emitted electrons to generate a spectrum of peaks corresponding to the elements present on the
surface (except hydrogen and helium). The peak areas give measures of the relative amounts of each
element (absolute quantitative measurements are seldom feasible), whereas the shape and position of

clxxv
the peaks reflect the chemical environment of each element, namely their bonding structure (Dorris and
Gray 1978; Brinen, 1993; Ström et al. 1993; Kleen et al. 2003; Kangas and Kleen 2004; Hale et al.
2007).
ToF-SIMS analysis provides additional information regarding the identification of not only elements but
also molecular species present on the surface. The distribution of molecules at the surface can be
deduced from the data, also as a function of depth at a submicron scale. This technique is suited for
comparison of samples as it delivers semi-quantitative information of the surface constituents (Kleen
2000a; Kleen 2000b; Kristola 2001; Kangas and Kleen 2004; Kleen 2005; Lee t al. 2006; Parolis et al.
2007). ToF-SIMS is based on ionized particles which are emitted from a solid surface when energetic
primary particles bombard that surface. The secondary ions are accelerated into a mass spectrometer,
where they are analyzed by measuring their time-of-flight between the sample and the detector. Major
compounds in mixtures can be separated. The mass range and resolution of the technique are high. The
analyzed area in ToF-SIMS is smaller than that of ESCA, and the surface sensitivity is higher, because
ToF-SIMS analyzes the outermost surface layers of 1-2 nm.
There is large body of literature concerning paper analysis by ESCA (Dorris and Gray 1978; Kleen et
al. 2002; Shchukarev et al. 2003; Johansson et al. 2005; Freire et al. 2006) or by ToF-SIMS (Brinen
and Proverb 1991; Kleen 2000a; Kleen 2000b; Kleen 2005; Fardim and Hombom 2005a; Fardim and
Hombom 2005b), or both ESCA and ToF-SIMS (Brinen 1993; Kleen et al. 2003; Kangas and Kleen
2004).
The present work aims at obtaining detailed information about the chemical composition of the outermost
surface layers of the surface sized papers and at answering the question how those surface layers are
affected by the surface sizing formulations.
Experimental
Paper samples
A calendered uncoated base paper (80 g m-2) produced from bleached Eucalyptus globulus kraft pulp
(ISO Brightness ≈ 90) and without any surface treatment was the reference (denoted as RP). This paper
was surface sized with blends of cationic starch with either co-acrylonitrile-acrylate (samples A1 and A2)
or co-styrene-acrylate (samples B1 and B2), as described in Table 1.
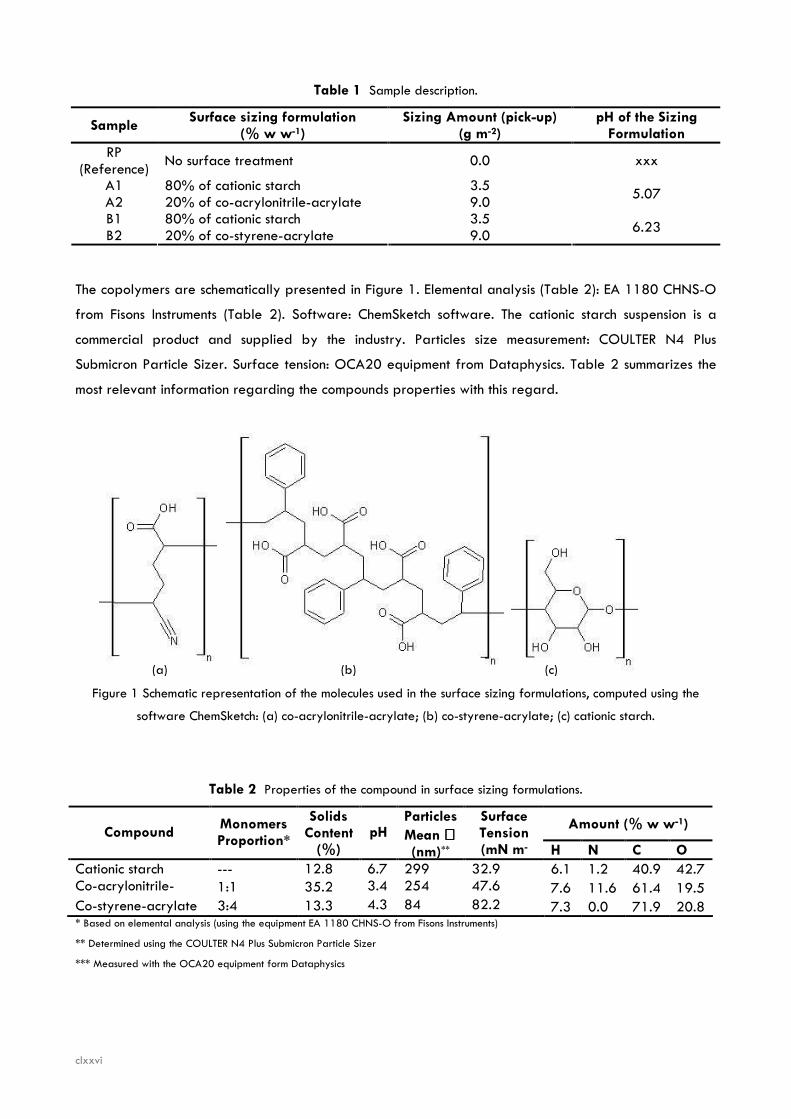
clxxvi
Table 1 Sample description.
Sample Surface sizing formulation
(% w w-1) Sizing Amount (pick-up)
(g m-2) pH of the Sizing
Formulation RP
(Reference) No surface treatment 0.0 xxx
A1 3.5 A2
80% of cationic starch 20% of co-acrylonitrile-acrylate 9.0
5.07
B1 3.5 B2
80% of cationic starch 20% of co-styrene-acrylate 9.0
6.23
The copolymers are schematically presented in Figure 1. Elemental analysis (Table 2): EA 1180 CHNS-O
from Fisons Instruments (Table 2). Software: ChemSketch software. The cationic starch suspension is a
commercial product and supplied by the industry. Particles size measurement: COULTER N4 Plus
Submicron Particle Sizer. Surface tension: OCA20 equipment from Dataphysics. Table 2 summarizes the
most relevant information regarding the compounds properties with this regard.
Figure 1 Schematic representation of the molecules used in the surface sizing formulations, computed using the
software ChemSketch: (a) co-acrylonitrile-acrylate; (b) co-styrene-acrylate; (c) cationic starch.
Table 2 Properties of the compound in surface sizing formulations.
Amount (% w w-1) Compound
Monomers Proportion*
Solids Content
(%) pH
Particles Mean ∅∅∅∅ (nm)**
Surface Tension (mN m-
1)*** H N C O
Cationic starch --- 12.8 6.7 299 32.9 6.1 1.2 40.9 42.7 Co-acrylonitrile-acrylate
1:1 35.2 3.4 254 47.6 7.6 11.6 61.4 19.5 Co-styrene-acrylate 3:4 13.3 4.3 84 82.2 7.3 0.0 71.9 20.8 * Based on elemental analysis (using the equipment EA 1180 CHNS-O from Fisons Instruments)
** Determined using the COULTER N4 Plus Submicron Particle Sizer
*** Measured with the OCA20 equipment form Dataphysics
(a) (b) (c)
clxxvii
The surface sizing formulations were applied by a Mathis laboratory coating device (SVA-IR-B), which
operates automatically with different velocities of the applicator roll. A 0.15 mm diameter roll was used
at a velocity of 6 m min–1. The total surface sizing pick-up was controlled by the weight applied on top
of the applicator roll: in case of no weight, a 3.5 ± 0.3 g m-2 pick-up was obtained (samples A1 and B1),
whereas by placing two weights of 730 g each on the applicator roll a 9.0 ± 0.3 g m-2 pick-up was
obtained (samples A2 and B2). The drying process was performed by an IR drier coupled to the
applicator roll (1.0 kW drying intensity), followed by air drying (for at least 10 min). The surface sized
samples were no further calendered.
Surface analyses
The ESCA analyses: AXIS 165 high-resolution electron spectrometer; monochromatic Al Kα irradiation
(12.5 kV, 8 mA). For each sample, survey scans in the range 0-1100 eV (1 eV step, 80 eV analyzer pass
energy) and high-resolution spectra of the C 1s region (0.1 eV step, 20 eV pass energy) were recorded
at three different locations. The areas of the peaks corresponding to carbon (200-300 eV), calcium (350
eV), nitrogen (400 eV), oxygen (500-600 eV), and sodium (1000-1100 eV) were measured. The
analyzed area was approximately 1 mm2 and the depth of analysis was 2-10 nm. The sample surfaces
were neutralized during the measurements with low-energy electrons.
ToF-SIMS measurements: PHI TRIFT II time-of-flight secondary ion mass spectrometer. High mass resolution
spectra and images in positive and negative ion modes were acquired by a 69Ga+ liquid metal ion gun
with 15 keV primary ions in bunched mode for mass spectra and with 25 keV primary ions in unbunched
mode for images over the mass range 2-2000 m z-1. The primary ion current was 600 pA and time per
channel 0.138 ns. The analysis area was 200 × 200 µm2 and the acquisition time 2 min for spectra and
5 min for images. Analytical charge compensation was used for insulating samples. The calculated ion
dose was 2.7⋅1011 cm-2, which ensured static conditions during data acquisition. Three replicate runs were
made for each sample. Selected peak areas were integrated from ToF-SIMS spectra and normalized to
the total ion intensity of the spectrum. Images were reconstructed from raw data files with the off-line
WinCadence software.
Results and discussion
Electron spectroscopy for chemical analysis (ESCA)
The elements present at the paper surface can be identified from the survey scans obtained by ESCA.
Figure 2 includes the results of the reference paper (RP) and of samples A1 and B1. The spectra of
samples A2 and B2 corresponding to the largest amount of sizing agents are not shown here because
they revealed only minor differences in the intensity of the peaks compared with samples A1 and B1,
respectively.
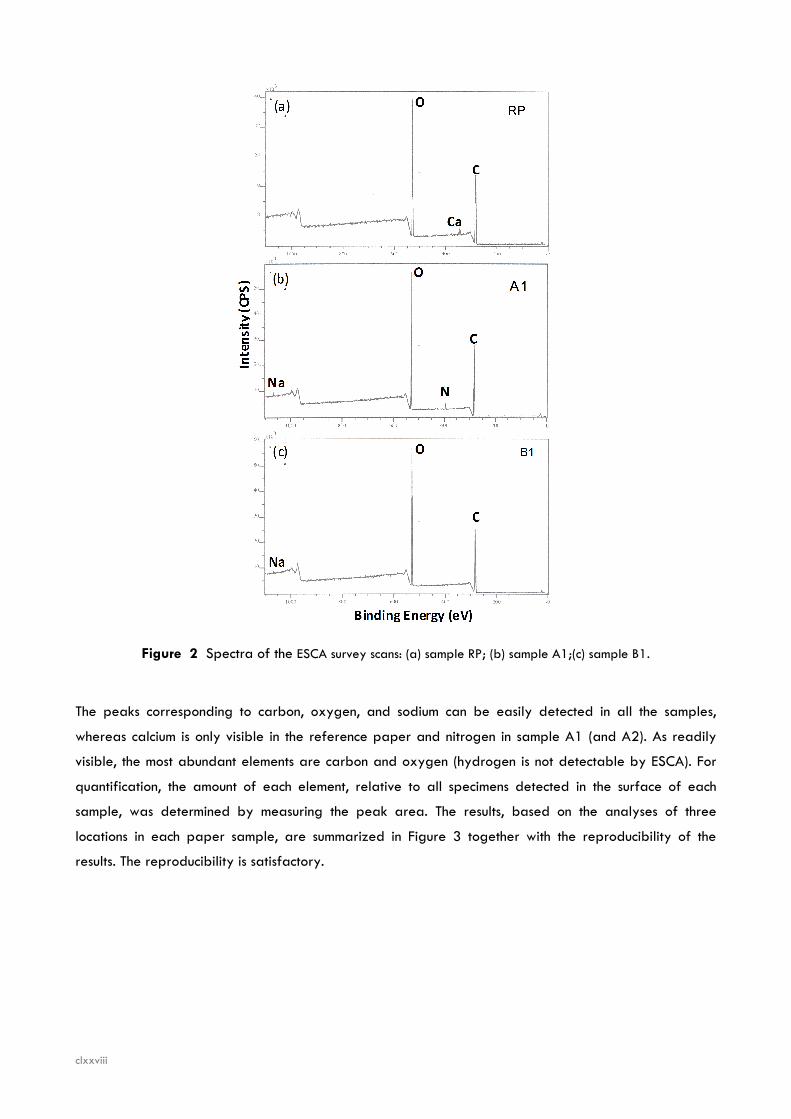
clxxviii
Figure 2 Spectra of the ESCA survey scans: (a) sample RP; (b) sample A1;(c) sample B1.
The peaks corresponding to carbon, oxygen, and sodium can be easily detected in all the samples,
whereas calcium is only visible in the reference paper and nitrogen in sample A1 (and A2). As readily
visible, the most abundant elements are carbon and oxygen (hydrogen is not detectable by ESCA). For
quantification, the amount of each element, relative to all specimens detected in the surface of each
sample, was determined by measuring the peak area. The results, based on the analyses of three
locations in each paper sample, are summarized in Figure 3 together with the reproducibility of the
results. The reproducibility is satisfactory.
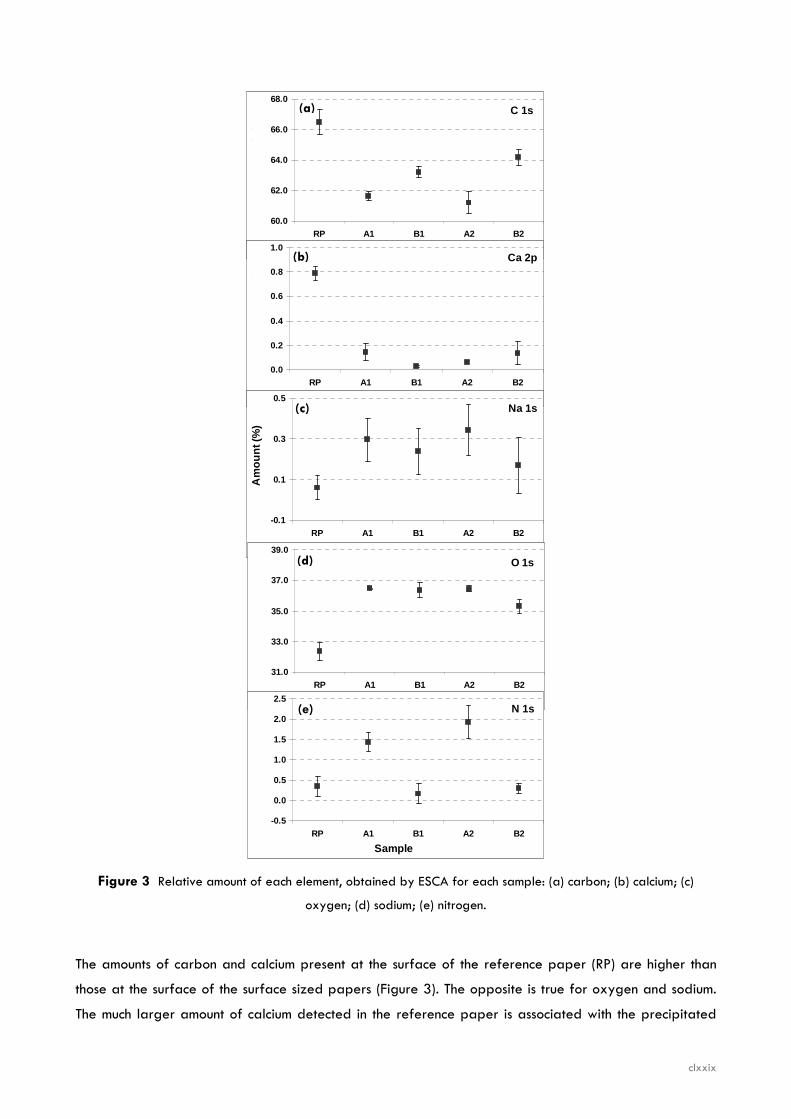
clxxix
C 1s
60.0
62.0
64.0
66.0
68.0
RP A1 B1 A2 B2
SampleA
mou
nt (%
)
(a)
Ca 2p
0.0
0.2
0.4
0.6
0.8
1.0
RP A1 B1 A2 B2
Sample
Am
ount
(%)
(b)
Na 1s
-0.1
0.1
0.3
0.5
RP A1 B1 A2 B2
Sample
Am
ount
(%)
(c)
O 1s
31.0
33.0
35.0
37.0
39.0
RP A1 B1 A2 B2
Sample
Am
ount
(%)
(d)
N 1s
-0.5
0.0
0.5
1.0
1.5
2.0
2.5
RP A1 B1 A2 B2
Sample
Am
ount
(%)
(e)
Figure 3 Relative amount of each element, obtained by ESCA for each sample: (a) carbon; (b) calcium; (c)
oxygen; (d) sodium; (e) nitrogen.
The amounts of carbon and calcium present at the surface of the reference paper (RP) are higher than
those at the surface of the surface sized papers (Figure 3). The opposite is true for oxygen and sodium.
The much larger amount of calcium detected in the reference paper is associated with the precipitated
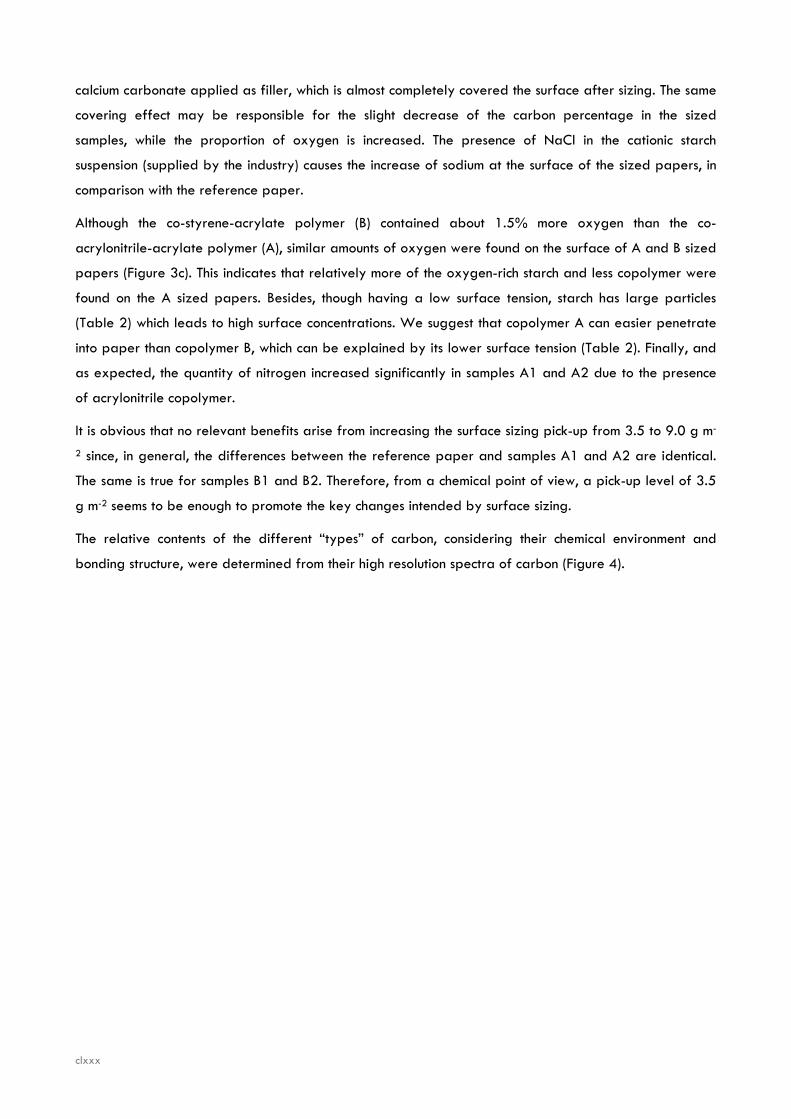
clxxx
calcium carbonate applied as filler, which is almost completely covered the surface after sizing. The same
covering effect may be responsible for the slight decrease of the carbon percentage in the sized
samples, while the proportion of oxygen is increased. The presence of NaCl in the cationic starch
suspension (supplied by the industry) causes the increase of sodium at the surface of the sized papers, in
comparison with the reference paper.
Although the co-styrene-acrylate polymer (B) contained about 1.5% more oxygen than the co-
acrylonitrile-acrylate polymer (A), similar amounts of oxygen were found on the surface of A and B sized
papers (Figure 3c). This indicates that relatively more of the oxygen-rich starch and less copolymer were
found on the A sized papers. Besides, though having a low surface tension, starch has large particles
(Table 2) which leads to high surface concentrations. We suggest that copolymer A can easier penetrate
into paper than copolymer B, which can be explained by its lower surface tension (Table 2). Finally, and
as expected, the quantity of nitrogen increased significantly in samples A1 and A2 due to the presence
of acrylonitrile copolymer.
It is obvious that no relevant benefits arise from increasing the surface sizing pick-up from 3.5 to 9.0 g m-
2 since, in general, the differences between the reference paper and samples A1 and A2 are identical.
The same is true for samples B1 and B2. Therefore, from a chemical point of view, a pick-up level of 3.5
g m-2 seems to be enough to promote the key changes intended by surface sizing.
The relative contents of the different “types” of carbon, considering their chemical environment and
bonding structure, were determined from their high resolution spectra of carbon (Figure 4).
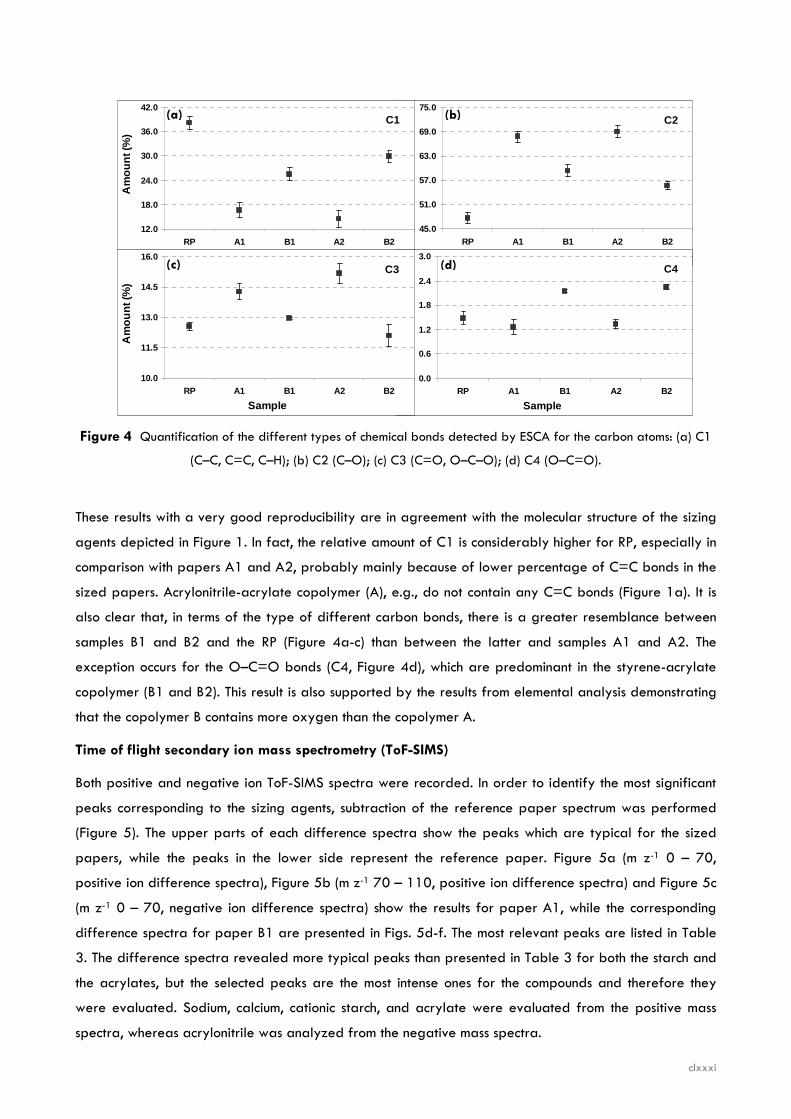
clxxxi
C2
45.0
51.0
57.0
63.0
69.0
75.0
RP A1 B1 A2 B2
Sample
Am
ount
(%)
C1
12.0
18.0
24.0
30.0
36.0
42.0
RP A1 B1 A2 B2
Sample
Am
ount
(%)
C4
0.0
0.6
1.2
1.8
2.4
3.0
RP A1 B1 A2 B2
SampleA
mou
nt (%
)
C3
10.0
11.5
13.0
14.5
16.0
RP A1 B1 A2 B2
Sample
Am
ount
(%)
(c) (d)
(a) (b)
Figure 4 Quantification of the different types of chemical bonds detected by ESCA for the carbon atoms: (a) C1
(C–C, C=C, C–H); (b) C2 (C–O); (c) C3 (C=O, O–C–O); (d) C4 (O–C=O).
These results with a very good reproducibility are in agreement with the molecular structure of the sizing
agents depicted in Figure 1. In fact, the relative amount of C1 is considerably higher for RP, especially in
comparison with papers A1 and A2, probably mainly because of lower percentage of C=C bonds in the
sized papers. Acrylonitrile-acrylate copolymer (A), e.g., do not contain any C=C bonds (Figure 1a). It is
also clear that, in terms of the type of different carbon bonds, there is a greater resemblance between
samples B1 and B2 and the RP (Figure 4a-c) than between the latter and samples A1 and A2. The
exception occurs for the O–C=O bonds (C4, Figure 4d), which are predominant in the styrene-acrylate
copolymer (B1 and B2). This result is also supported by the results from elemental analysis demonstrating
that the copolymer B contains more oxygen than the copolymer A.
Time of flight secondary ion mass spectrometry (ToF-SIMS)
Both positive and negative ion ToF-SIMS spectra were recorded. In order to identify the most significant
peaks corresponding to the sizing agents, subtraction of the reference paper spectrum was performed
(Figure 5). The upper parts of each difference spectra show the peaks which are typical for the sized
papers, while the peaks in the lower side represent the reference paper. Figure 5a (m z-1 0 – 70,
positive ion difference spectra), Figure 5b (m z-1 70 – 110, positive ion difference spectra) and Figure 5c
(m z-1 0 – 70, negative ion difference spectra) show the results for paper A1, while the corresponding
difference spectra for paper B1 are presented in Figs. 5d-f. The most relevant peaks are listed in Table
3. The difference spectra revealed more typical peaks than presented in Table 3 for both the starch and
the acrylates, but the selected peaks are the most intense ones for the compounds and therefore they
were evaluated. Sodium, calcium, cationic starch, and acrylate were evaluated from the positive mass
spectra, whereas acrylonitrile was analyzed from the negative mass spectra.
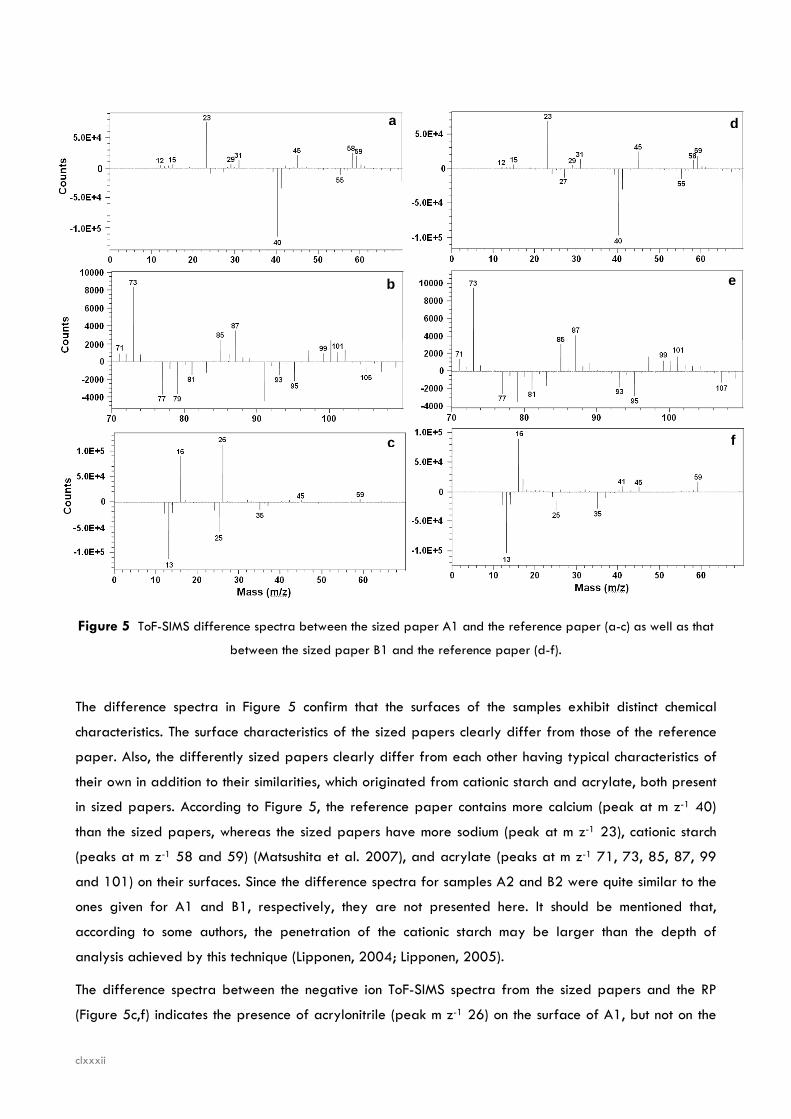
clxxxii
d a
e b
f c
Figure 5 ToF-SIMS difference spectra between the sized paper A1 and the reference paper (a-c) as well as that
between the sized paper B1 and the reference paper (d-f).
The difference spectra in Figure 5 confirm that the surfaces of the samples exhibit distinct chemical
characteristics. The surface characteristics of the sized papers clearly differ from those of the reference
paper. Also, the differently sized papers clearly differ from each other having typical characteristics of
their own in addition to their similarities, which originated from cationic starch and acrylate, both present
in sized papers. According to Figure 5, the reference paper contains more calcium (peak at m z-1 40)
than the sized papers, whereas the sized papers have more sodium (peak at m z-1 23), cationic starch
(peaks at m z-1 58 and 59) (Matsushita et al. 2007), and acrylate (peaks at m z-1 71, 73, 85, 87, 99
and 101) on their surfaces. Since the difference spectra for samples A2 and B2 were quite similar to the
ones given for A1 and B1, respectively, they are not presented here. It should be mentioned that,
according to some authors, the penetration of the cationic starch may be larger than the depth of
analysis achieved by this technique (Lipponen, 2004; Lipponen, 2005).
The difference spectra between the negative ion ToF-SIMS spectra from the sized papers and the RP
(Figure 5c,f) indicates the presence of acrylonitrile (peak m z-1 26) on the surface of A1, but not on the
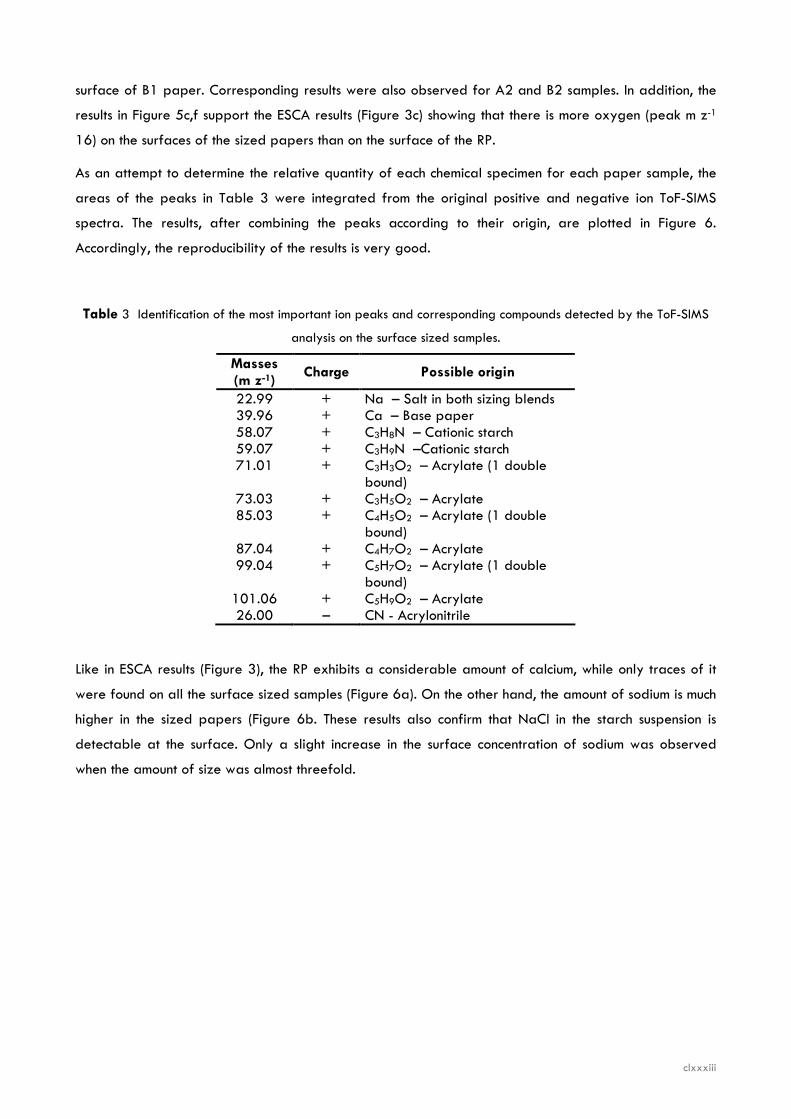
clxxxiii
surface of B1 paper. Corresponding results were also observed for A2 and B2 samples. In addition, the
results in Figure 5c,f support the ESCA results (Figure 3c) showing that there is more oxygen (peak m z-1
16) on the surfaces of the sized papers than on the surface of the RP.
As an attempt to determine the relative quantity of each chemical specimen for each paper sample, the
areas of the peaks in Table 3 were integrated from the original positive and negative ion ToF-SIMS
spectra. The results, after combining the peaks according to their origin, are plotted in Figure 6.
Accordingly, the reproducibility of the results is very good.
Table 3 Identification of the most important ion peaks and corresponding compounds detected by the ToF-SIMS
analysis on the surface sized samples.
Masses (m z-1)
Charge Possible origin
22.99 + Na – Salt in both sizing blends 39.96 + Ca – Base paper 58.07 + C3H8N – Cationic starch 59.07 + C3H9N –Cationic starch 71.01 + C3H3O2 – Acrylate (1 double
bound) 73.03 + C3H5O2 – Acrylate 85.03 + C4H5O2 – Acrylate (1 double
bound) 87.04 + C4H7O2 – Acrylate 99.04 + C5H7O2 – Acrylate (1 double
bound) 101.06 + C5H9O2 – Acrylate 26.00 – CN - Acrylonitrile
Like in ESCA results (Figure 3), the RP exhibits a considerable amount of calcium, while only traces of it
were found on all the surface sized samples (Figure 6a). On the other hand, the amount of sodium is much
higher in the sized papers (Figure 6b. These results also confirm that NaCl in the starch suspension is
detectable at the surface. Only a slight increase in the surface concentration of sodium was observed
when the amount of size was almost threefold.
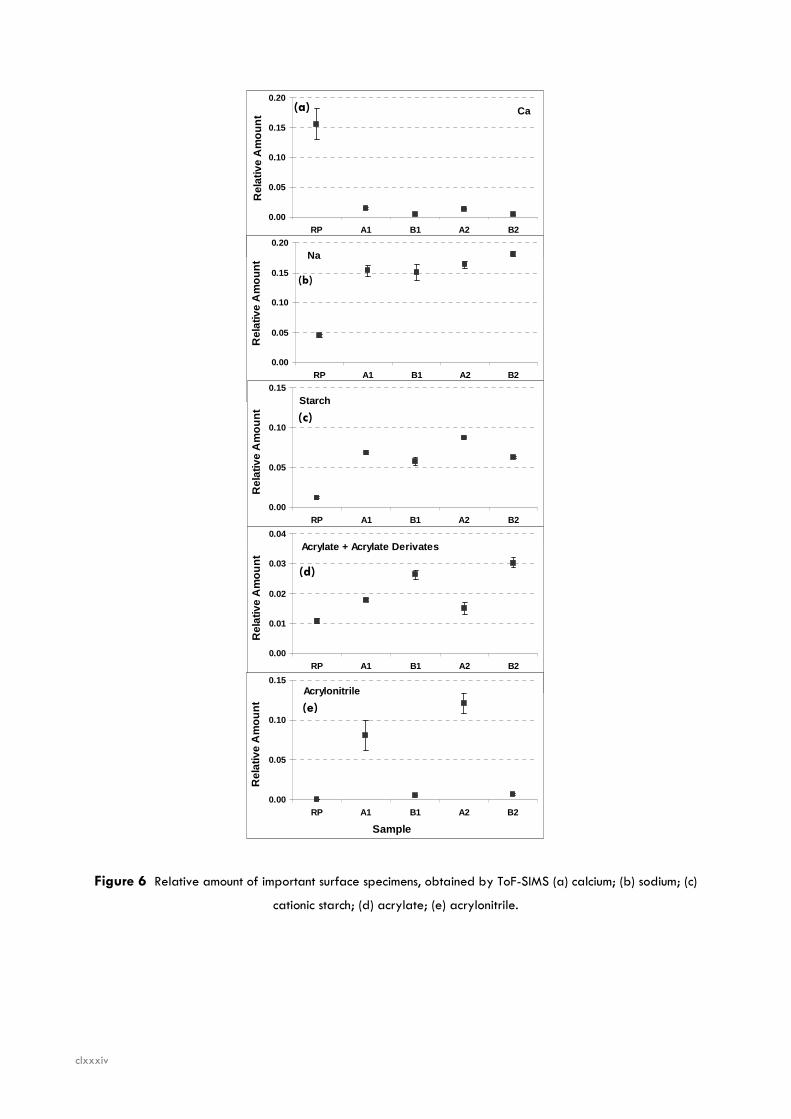
clxxxiv
Ca
0.00
0.05
0.10
0.15
0.20
RP A1 B1 A2 B2
SampleR
elat
ive
Am
ount
Na
0.00
0.05
0.10
0.15
0.20
RP A1 B1 A2 B2
Sample
Rel
ativ
e A
mou
nt
Starch
0.00
0.05
0.10
0.15
RP A1 B1 A2 B2
Sample
Rel
ativ
e A
mou
nt
Acrylate + Acrylate Derivates
0.00
0.01
0.02
0.03
0.04
RP A1 B1 A2 B2
Sample
Rel
ativ
e A
mou
nt
Acrylonitrile
0.00
0.05
0.10
0.15
RP A1 B1 A2 B2
Sample
Rel
ativ
e A
mou
nt
(a)
(b)
(c)
(d)
(e)
Figure 6 Relative amount of important surface specimens, obtained by ToF-SIMS (a) calcium; (b) sodium; (c)
cationic starch; (d) acrylate; (e) acrylonitrile.
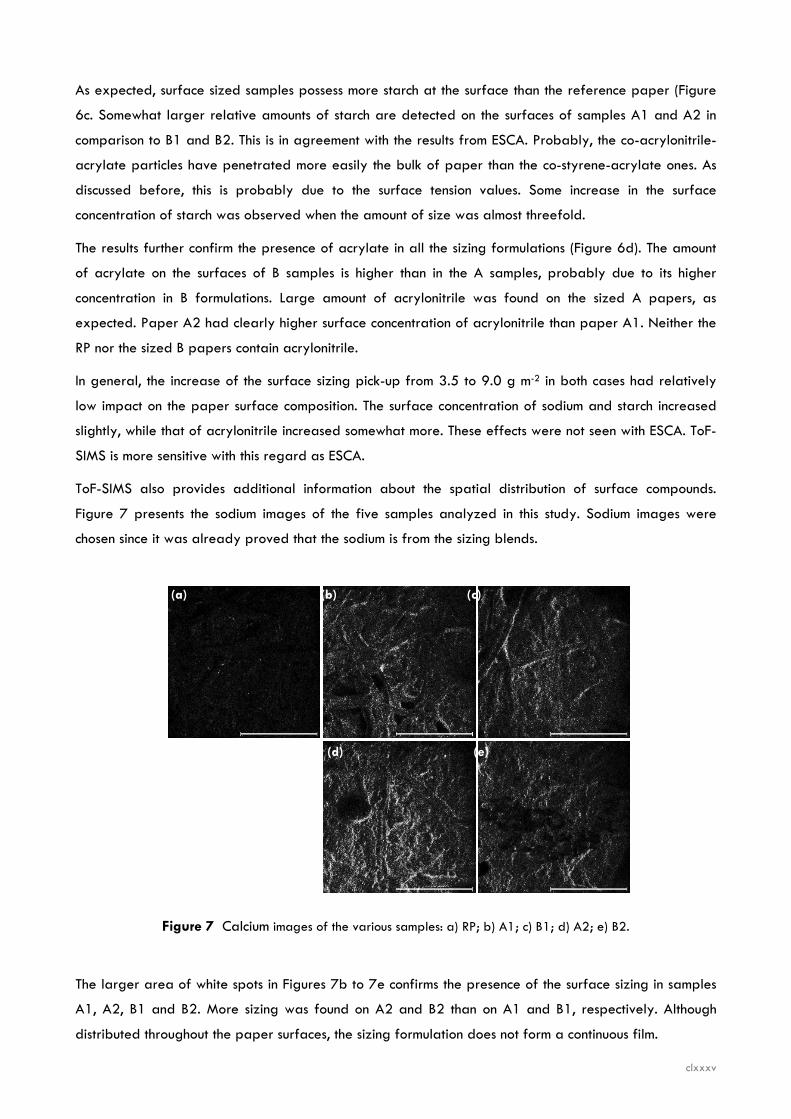
clxxxv
As expected, surface sized samples possess more starch at the surface than the reference paper (Figure
6c. Somewhat larger relative amounts of starch are detected on the surfaces of samples A1 and A2 in
comparison to B1 and B2. This is in agreement with the results from ESCA. Probably, the co-acrylonitrile-
acrylate particles have penetrated more easily the bulk of paper than the co-styrene-acrylate ones. As
discussed before, this is probably due to the surface tension values. Some increase in the surface
concentration of starch was observed when the amount of size was almost threefold.
The results further confirm the presence of acrylate in all the sizing formulations (Figure 6d). The amount
of acrylate on the surfaces of B samples is higher than in the A samples, probably due to its higher
concentration in B formulations. Large amount of acrylonitrile was found on the sized A papers, as
expected. Paper A2 had clearly higher surface concentration of acrylonitrile than paper A1. Neither the
RP nor the sized B papers contain acrylonitrile.
In general, the increase of the surface sizing pick-up from 3.5 to 9.0 g m-2 in both cases had relatively
low impact on the paper surface composition. The surface concentration of sodium and starch increased
slightly, while that of acrylonitrile increased somewhat more. These effects were not seen with ESCA. ToF-
SIMS is more sensitive with this regard as ESCA.
ToF-SIMS also provides additional information about the spatial distribution of surface compounds.
Figure 7 presents the sodium images of the five samples analyzed in this study. Sodium images were
chosen since it was already proved that the sodium is from the sizing blends.
Figure 7 Calcium images of the various samples: a) RP; b) A1; c) B1; d) A2; e) B2.
The larger area of white spots in Figures 7b to 7e confirms the presence of the surface sizing in samples
A1, A2, B1 and B2. More sizing was found on A2 and B2 than on A1 and B1, respectively. Although
distributed throughout the paper surfaces, the sizing formulation does not form a continuous film.
(d) (e)
(a) (b) (c)

clxxxvi
Conclusions
ESCA complemented with ToF-SIMS proved to be a good way to evaluate the effect of different sizing
formulations. The elements present at the samples surfaces were identified and their relative quantity
could be evaluated. It was also possible to confirm that the samples surfaces exhibited distinct chemical
characteristics. Although both formulations possessed the same percentage of cationic starch, relatively
more of this polymer was detected on the sample surfaces, if co-acrylonitrile-acrylate was applied. This
result was interpreted in terms of the properties of copolymers particles. It is suggested that the co-
acrylonitrile-acrylate particles penetrate deeper to the paper structure than the co-styrene-acrylate
particles due to their lower surface tension and therefore leave behind relatively more starch at the
paper surface. Additionally, it was found that the increase of the sizing pick-up from 3.5 to 9.0 g m-2
only slightly changed the surface characteristics. Accordingly, lower amount of size is enough for surface
improvement.
Acknowledgements
The authors acknowledge the EU COST E32 Action "Characterization of Paper Surfaces for Improved
Printing paper Grades” for the financial support to a STSM at the KCL Pulp and Paper institute, Espoo -
Finland and at the Åbo Akademi University, Turku - Finland.
References
Ajerschi, M., Poirier, N., Pikulik, I. (2004) Colagem superficial sem prensa de colagem – Resultados de
máquina de papel piloto. O Papel/Paprican pp. 47-58.
Carceller, R., Juppo, A. (2004) New surface size composition changes paper surface properties for
improving ink jet printability of copy paper. Pap. Puu-Pap. Tim. 86(3): 161-163.
COST E32 (2002) Memorandum of Understanding: Characterisation of paper surfaces for improved
printing paper grades. European Concerted Research Action COST Action E32, Brussels.
Brinen, J. S., Proverb, R. J. (1991) SIMS imaging of paper surfaces Part 2. Distribution of organic
surfactants. Nord. Pulp. Pap. Res. J 6 (4):177-183.
Brinen, J. S. (1993) The observation and distribution of organic additives on paper surfaces using surface
spectroscopic techniques. Nord. Pulp. Pap. Res. J 8(1):123-129.
Donigian, D. W., Ishley, J. N., Wise, K. J. (1997) Coating pore structure and offset printed gloss. TAPPI J
80(5):163-172.
clxxxvii
Dorris, G. M., Gray, D. (1978) The surface analysis of paper and wood fibres by ESCA (electron
spectroscopy for chemical analysis) Application to cellulose and lignin. Cell Chem. Technol. 12:9-23.
Fardim, P., Hombom, B. (2005a) Origin and surface distribution of anionic groups in different
papermaking fibers. Colloid Surface A 252: 237-242.
Fardim, P., Holmbom B. (2005b) ToF-SIMS imaging: a valuable chemical microscopy technique for paper
and paper coatings. Appl. Surf. Sci. 249:393-407.
Forsström, U., Fagerholm, K., Saharenen (2003) The role of base paper porosity in MSP coating. Pap.
Puu-Pap. Tim. 85(8):454-459.
Freire, C. S. R., Silvestre, A. J. D., Neto, C. P., Gandini, A., Fardim, P., Holmbom, B. (2006) Surface
characterization by XPS, contact angle measurements and ToF-SIMS of cellulose fibers partially
esterified with fatty acids. J Colloid Interf. Sci. 301:205-209.
Hale, P. S., Kappen, P., Prissanaroon, W., Brack, N., Pigram, P. J., Liesegang, J. (2007) Minimizing silicone
transfer during micro-contact printing. Appl. Surf. Sci. 253:3746-3750.
Hamers, C., others (2005) Curtain coating for graphic. Pulp & Paper Intern. 47:36-37.
Hladnik, A. (2003) Ink-jet printing and image analysis. Presentation at Universidade da Beira Interior,
Covilhã, Portugal.
Johansson, L. S., Campbell, J. M., Fardim, P., Hultén, A. H., Boisvert, J. P., Ernstsson, M. (2005) An XPS
round robin investigation on analysis of wood pulp fibers and filter paper. Surf. Sci. 584:126-132
Kangas, H., Kleen, M. (2004) Surface chemical and morphological properties of mechanical pulp fines.
Nord. Pulp. Pap. Res. J 19(2):191-199.
Keskitalo, I. The penetration of water-based inks into laboratory sheets made from bleached eucalipt
kraft pulp. Master’s Thesis, Luleå Tekniska Universitet, Sweden, 2000.
Kleen, M. (2000a) Surface chemistry of kraft pulp fibers during TCF bleaching studied by ToF-SIMS. 6th
EuropeanWorkshop on Lignocellulosics and Pulp (EWLP), September 3–6, 2000, Bordeaux, France, pp.
41–44.
Kleen, M. (2000b) ToF-SIMS as a new analytical tool for studies of pulp fiber surface chemistry.
International Symposium on cellulose and lignocellulosics chemistry 2000 (ISCLC), Dec. 16-18, 2000,
Kunming, China, pp. 290-294.
Kleen, M., Sjöberg, J., Dahlman, O., Johansson, L.-S., Koljonen, K., Stenius, P. (20002) The effect of ECF
and TCF bleaching on the chemical composition of soda-anthraquinone and kraft pulp surfaces. Nord.
Pulp. Pap. Res. J 17(3):357-363.
Kleen, M., Kangas, H., Laine, C. (2003) Chemical characterization of mechanical pulp fines and fiber
surface layers. Nord. Pulp. Pap. Res. J 18(4):61-368.
clxxxviii
Kleen, M. (2005) Surface lignin and extractives on hardwood RDH kraft pulp chemically
characterized by ToF-SIMS. Holzforschung 59(5):481-487.
Koskela, J P., Hormi, O. E. O. (2003) Improving the printability of paper with long-chain quaternaries.
APITTA J 56(4):296-300.
Kristola, J. Spatial distribution of wood extractives and lignin on the surface of mechanical pulp, fibers
and fines. Master of science thesis, Laboratory of Forest Products Chemistry, Faculty of chemical
Engineering, Åbo Akademi University, Finland, 2001.
Laleg, M. (2004) Colagem superficial com quitosana e com misturas de quitosana e amidos. O
Papel/Paprican 33-45.
Lee, T. G., Kim, J., Shon, H. K., Jung, D., Moon, D. W. (2006) Chemical derivatization technique in ToF-
SIMS for quantification analysis of surface amine groups. Appl. Surf. Sci. 252:6632-6635.
Lertsutthiwong, P., Nazhad, M. M., Chandrkrachang, S., Stevens, W. F. (2004) Chitosan as a surface
sizing agent for offset printing paper. APITTA J 57(4): 274-280.
Lipponen, J., Lappalainen, T., Astola, J., Grön, J. (2004) Novel method for quantitative starch penetration
analysis through iodine staining and image analysis of cross-sections of uncoated fine paper. Nord. Pulp.
Pap. Res. J 19(3): 300-308.
Lipponen, J. Surface sizing with starch solutions at high solids contents. Doctor’s Thesis, Laboratory of
Paper Technology, Helsinki University of Thechnology, Espoo, Finland, 2005.
Matsushita, Y., Sekiguchi, T., Saito, K., Kato, T., Imai, T., Fukushima, K. (2007) The characteristic fragment
ions and visualization of cationic starches on pulp fiber using ToF-SIMS. Surf. Interface Anal. 39
(2007):501-505.
Mešic, B., Järnström, L., Hjärthag, C., Lestelius, M. (2004) Effects of application temperature in paper
surface sizing with temperature-responsive starch on water repellency and flexographic printability.
APITTA J 57(4):281-285 & 298.
Moutinho, I. M. T., Ferreira, P. J. T., Figueiredo, M. M. L. (2007) Impact of surface sizing on inkjet printing
quality. Ind. Eng. Chem. Res. 46:6183-6188.
Oliver, J., Chen, J., Tosto, F. (2001) Impact of paper surface structure on print quality. COST European
E11 Meeting, 4-5 October, 2001, Espoo, Finland, pp.1-9.
Parolis, L. A. S., van der Merwe, R., van Leerdam, G. C., Prins, F. E., Smeink, R. G. (2007) The use of ToF-
SIMS and microflotation to assess the reversibility of binding of CMC onto talc. Minerals Eng. 20:970-
978.
Pruszynski, P. (2003) Recent developments in papermaking chemicals. WWP Keynote lectures pp. 82-90.
Rutar, V., Hladnik, A. (2000) Penetration tests and influence of paper sheet structure on its sorption
ability. Presented at the COST Action E11 Workshop, Grenoble, France.
clxxxix
Shchukarev, A. V., Mattsson, R., Ödberg, L. (2003) XPS imaging of surface diffusion of alkylketene
dimmer on paper surfaces. Colloid Surface A 219:35-43.
Shirazi, M., Esmail, N., Garnier, G., van de Ven, T. G. M. (2003) Starch penetration into paper in a size
press. Proc. 5th International Paper and Coating Symposium, Montreal, Canada.
Ström, G., Carlsson, G., Schulz, A. (1993) Chemical composition of coated paper surfaces determined by
means of ESCA. Nord. Pulp. Pap. Res. J 1:105-112.

Physical & Chemical Interactions on Paper Surface – Impact on the Printability of Papers Produced with E. globulus Kraft Pulps ________________________________________________________________________________________________________________________
Isabel M. T. Moutinho cxci
PAPER
ON THE EVALUATION OF THE TOPOGRAPHY OF SURFACE SIZED EUCALYPTUS
BASED PAPERS
Submitted to: Industrial & Engineering Chemistry Research (I&ECR); 2009.
(Under adjustment after Reviewers comments, for publication)

cxcii

cxciii
On the evaluation of the topography of surface sized Eucalyptus based papers
Isabel Moutinhoa*, Petri Ihalainenb, Margarida Figueiredoa, Jouko Peltonenb, Paulo Ferreiraa
a Chemical Engineering Department, Coimbra University, Pólo II – Pinhal de Marrocos, 3030-290
Coimbra, Portugal
b Department of Physical Chemistry, Åbo Akademi University, Domkyrkotorget 3, FI-20500 Åbo, Finland
* To whom correspondence should be addressed. Phone +351.239.798.700. Fax +351.239.798.703.
E-mail: [email protected]
ABSTRACT
The surface properties of paper depend not only on the fibrous matrix but also on the final treatment of
the paper surface. The present work compares paper samples with two different surface sizing
treatments by using AFM and profilometry to assess topography and roughness parameters as well as to
evaluate the spreading of the sizing formulation and to estimate sizing agent particle sizes. The results
were confronted with dynamic light scattering measurements regarding particle size. This work shows that
AFM is a valuable technique to visualize the effects of sizing onto the paper surface. However, due to the
small pick up applied no differences could be detected in terms of the surface roughness parameters.
KEYWORDS
AFM, Optical profilometry, Light scattering, Surface sizing, Surface roughness.
INTRODUCTION
Printing quality is strongly influenced by the structural and chemical properties of paper surface, which
depend not only on the fibrous matrix but also on the final treatment of the surface. This treatment may
be of physical nature, like calendering, and/or of chemical nature, like surface sizing or coating. A
common practice in industry regarding surface sizing, which was also followed in this work, is to use a
blend of cationic starch and a synthetic surface sizing agent1-3.
Many studies pertaining paper coating can be found in the open literature, concerning in particular the
characterization of paper surface in terms of physical and chemical properties4-7. However, not many of
these are related to the surface sizing of fine papers. The present work aims at comparing the surface
structure of two paper samples with different surface sizing treatments by using Atomic Force Microscopy
cxciv
(AFM). The sizing performance will be evaluated in terms of uniformity, particle size, shape and
distribution over the paper surface as well as in terms of surface topography.
Although Scanning Electron Microscopy (SEM) has been traditionally used for surface analysis, it requires
a laborious sample preparation (that can eventually change surface topography), needs vacuum and
does not provide high contrast images on flat surfaces8. To overcome these drawbacks, AFM has been
alternatively used, since it provides direct three-dimensional images of almost any type of surface in
ambient air conditions, requires no sample preparation and can resolve extremely small surface features
both at the micro- and nanoscale. Additionally, AFM images can be used to quantify surface roughness
parameters. Other surface properties as hardness and adhesion can also be assessed. The technique
seems therefore especially suited for the present study and has been previously applied by other authors
for pulp & paper characterization9-12. The principles of AFM are well described in the literature13-15 and
therefore will not be detailed here.
In the present work, the results obtained by AFM will be confronted with those of SEM in what concerns
the homogeneity of the surface treatment. The topographic parameters obtained by AFM will also be
compared with those provided by Optical Profilometry, a non-contact technique increasingly used for
studies of the paper surface3, 16. The equivalent mean diameter of the sizing particles estimated by AFM
will be further compared with measurements carried out in the sizing suspensions by Dynamic Light
Scattering (DLS).
EXPERIMENTAL METHODS
Two distinct surface sizing treatments applied on a calendered uncoated base paper produced with a
Eucalyptus globulus Kraft pulp were analyzed. Two different blends of cationic starch and acrylate
copolymers, described in Table 1, were used for surface sizing. A sample of the base paper without any
surface treatment was taken as reference (RP).
Table 1. Sample identification.
Sample Surface sizing formulation (% w/w) RP (Reference Paper)
No surface treatment
A1 80% of cationic starch*
20% of co-acrilonitryle-acrylate
B1 80% of cationic starch*
20% of co-styrene-acrylate
The surface sizing formulations were applied using a Mathis laboratory device, SVA-IR-B, which
operates automatically with different velocities of the applicator roll. A 0.15 mm roll was used
and its velocity adjusted to 6m/min, so that a total surface sizing pick-up of 3.5 ± 0.3 g/m2 (on
both sides of the sheet) was obtained. The drying process was performed in two steps: firstly
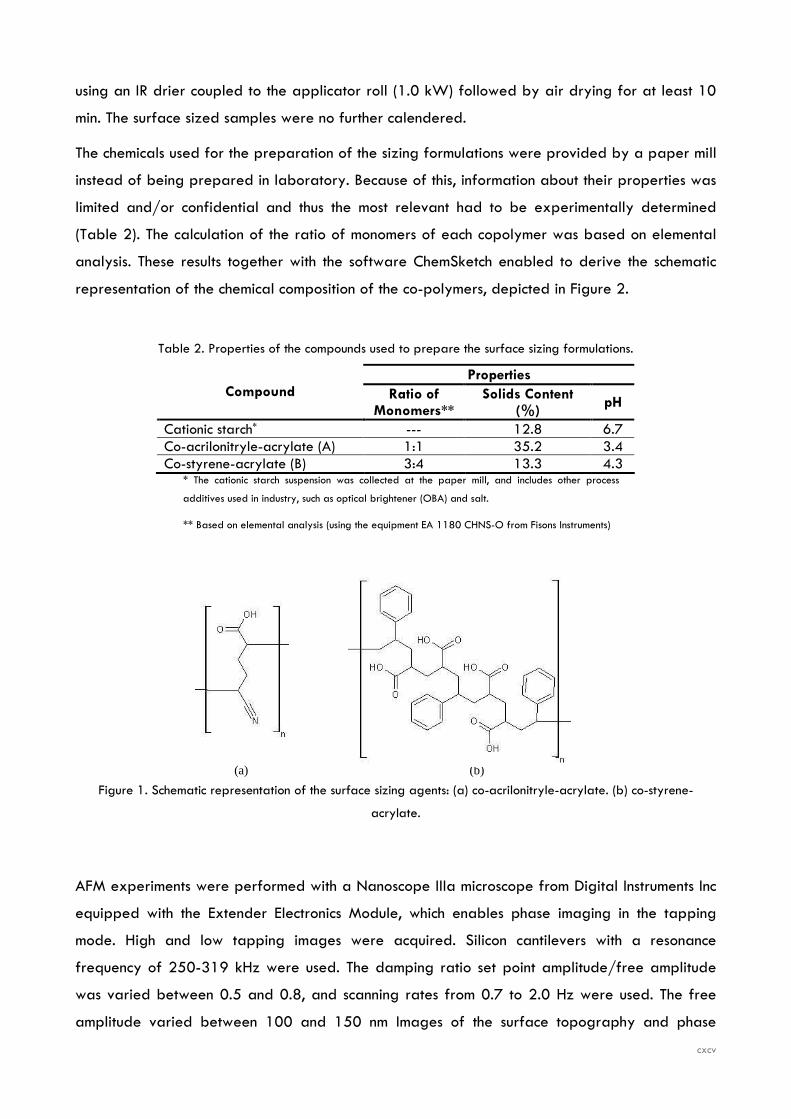
cxcv
(a) (b)
using an IR drier coupled to the applicator roll (1.0 kW) followed by air drying for at least 10
min. The surface sized samples were no further calendered.
The chemicals used for the preparation of the sizing formulations were provided by a paper mill
instead of being prepared in laboratory. Because of this, information about their properties was
limited and/or confidential and thus the most relevant had to be experimentally determined
(Table 2). The calculation of the ratio of monomers of each copolymer was based on elemental
analysis. These results together with the software ChemSketch enabled to derive the schematic
representation of the chemical composition of the co-polymers, depicted in Figure 2.
Table 2. Properties of the compounds used to prepare the surface sizing formulations.
Properties Compound Ratio of
Monomers** Solids Content
(%) pH
Cationic starch* --- 12.8 6.7 Co-acrilonitryle-acrylate (A) 1:1 35.2 3.4 Co-styrene-acrylate (B) 3:4 13.3 4.3
* The cationic starch suspension was collected at the paper mill, and includes other process
additives used in industry, such as optical brightener (OBA) and salt.
** Based on elemental analysis (using the equipment EA 1180 CHNS-O from Fisons Instruments)
Figure 1. Schematic representation of the surface sizing agents: (a) co-acrilonitryle-acrylate. (b) co-styrene-
acrylate.
AFM experiments were performed with a Nanoscope IIIa microscope from Digital Instruments Inc
equipped with the Extender Electronics Module, which enables phase imaging in the tapping
mode. High and low tapping images were acquired. Silicon cantilevers with a resonance
frequency of 250-319 kHz were used. The damping ratio set point amplitude/free amplitude
was varied between 0.5 and 0.8, and scanning rates from 0.7 to 2.0 Hz were used. The free
amplitude varied between 100 and 150 nm Images of the surface topography and phase
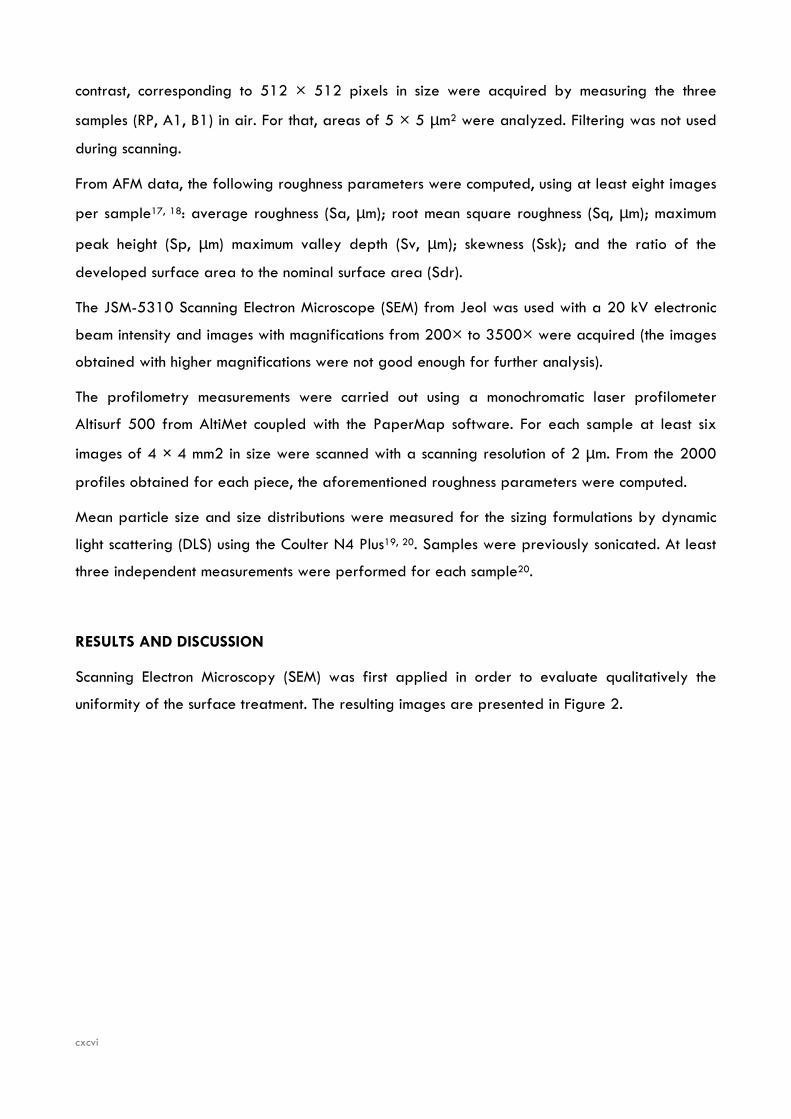
cxcvi
contrast, corresponding to 512 × 512 pixels in size were acquired by measuring the three
samples (RP, A1, B1) in air. For that, areas of 5 × 5 µm2 were analyzed. Filtering was not used
during scanning.
From AFM data, the following roughness parameters were computed, using at least eight images
per sample17, 18: average roughness (Sa, µm); root mean square roughness (Sq, µm); maximum
peak height (Sp, µm) maximum valley depth (Sv, µm); skewness (Ssk); and the ratio of the
developed surface area to the nominal surface area (Sdr).
The JSM-5310 Scanning Electron Microscope (SEM) from Jeol was used with a 20 kV electronic
beam intensity and images with magnifications from 200× to 3500× were acquired (the images
obtained with higher magnifications were not good enough for further analysis).
The profilometry measurements were carried out using a monochromatic laser profilometer
Altisurf 500 from AltiMet coupled with the PaperMap software. For each sample at least six
images of 4 × 4 mm2 in size were scanned with a scanning resolution of 2 µm. From the 2000
profiles obtained for each piece, the aforementioned roughness parameters were computed.
Mean particle size and size distributions were measured for the sizing formulations by dynamic
light scattering (DLS) using the Coulter N4 Plus19, 20. Samples were previously sonicated. At least
three independent measurements were performed for each sample20.
RESULTS AND DISCUSSION
Scanning Electron Microscopy (SEM) was first applied in order to evaluate qualitatively the
uniformity of the surface treatment. The resulting images are presented in Figure 2.
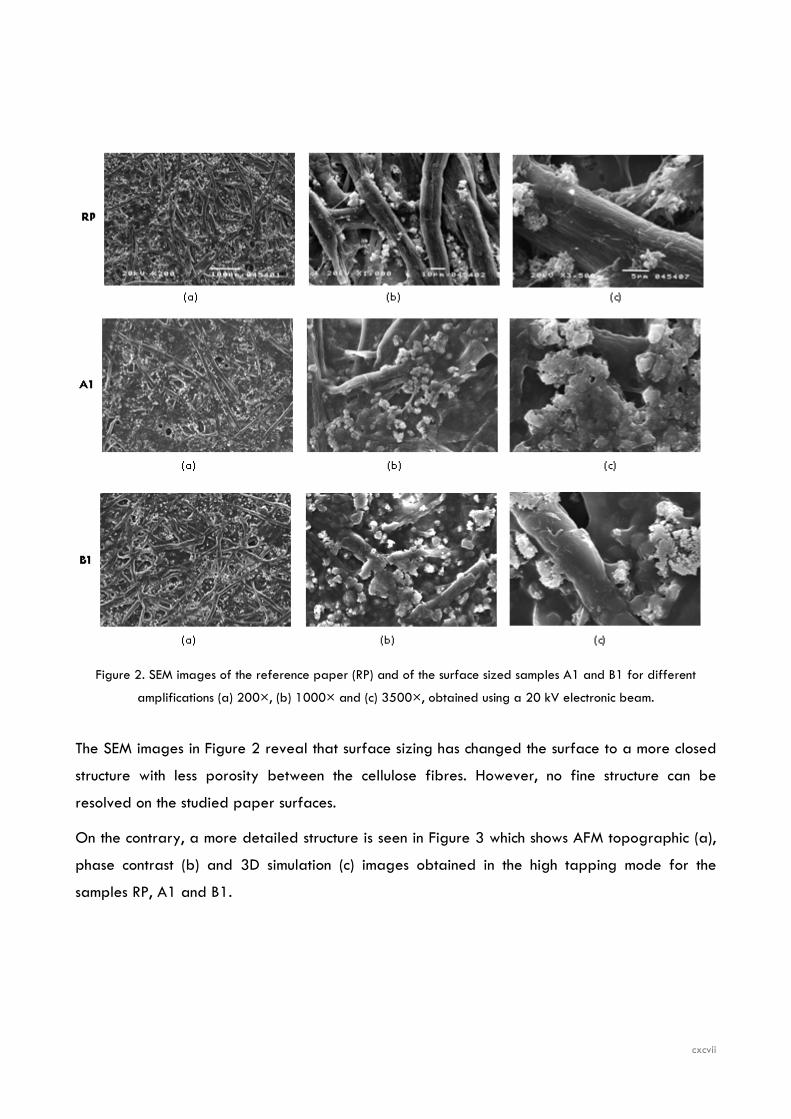
cxcvii
Figure 2. SEM images of the reference paper (RP) and of the surface sized samples A1 and B1 for different
amplifications (a) 200×, (b) 1000× and (c) 3500×, obtained using a 20 kV electronic beam.
The SEM images in Figure 2 reveal that surface sizing has changed the surface to a more closed
structure with less porosity between the cellulose fibres. However, no fine structure can be
resolved on the studied paper surfaces.
On the contrary, a more detailed structure is seen in Figure 3 which shows AFM topographic (a),
phase contrast (b) and 3D simulation (c) images obtained in the high tapping mode for the
samples RP, A1 and B1.
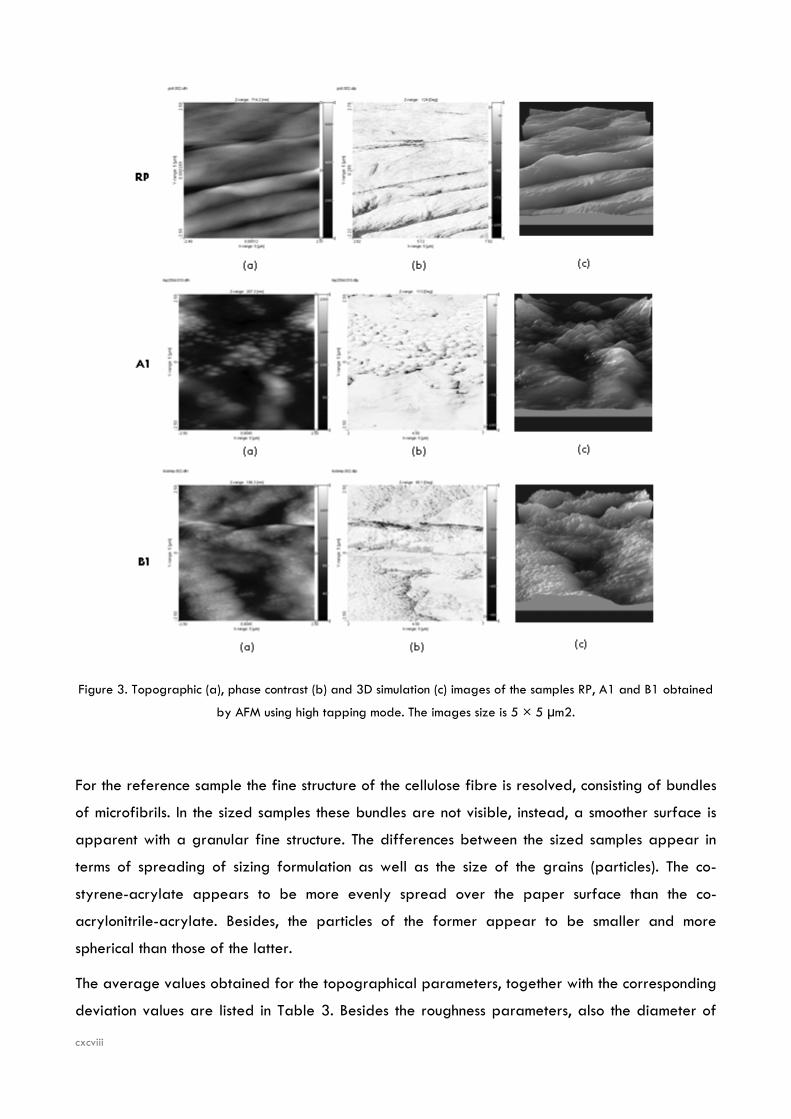
cxcviii
Figure 3. Topographic (a), phase contrast (b) and 3D simulation (c) images of the samples RP, A1 and B1 obtained
by AFM using high tapping mode. The images size is 5 × 5 µm2.
For the reference sample the fine structure of the cellulose fibre is resolved, consisting of bundles
of microfibrils. In the sized samples these bundles are not visible, instead, a smoother surface is
apparent with a granular fine structure. The differences between the sized samples appear in
terms of spreading of sizing formulation as well as the size of the grains (particles). The co-
styrene-acrylate appears to be more evenly spread over the paper surface than the co-
acrylonitrile-acrylate. Besides, the particles of the former appear to be smaller and more
spherical than those of the latter.
The average values obtained for the topographical parameters, together with the corresponding
deviation values are listed in Table 3. Besides the roughness parameters, also the diameter of
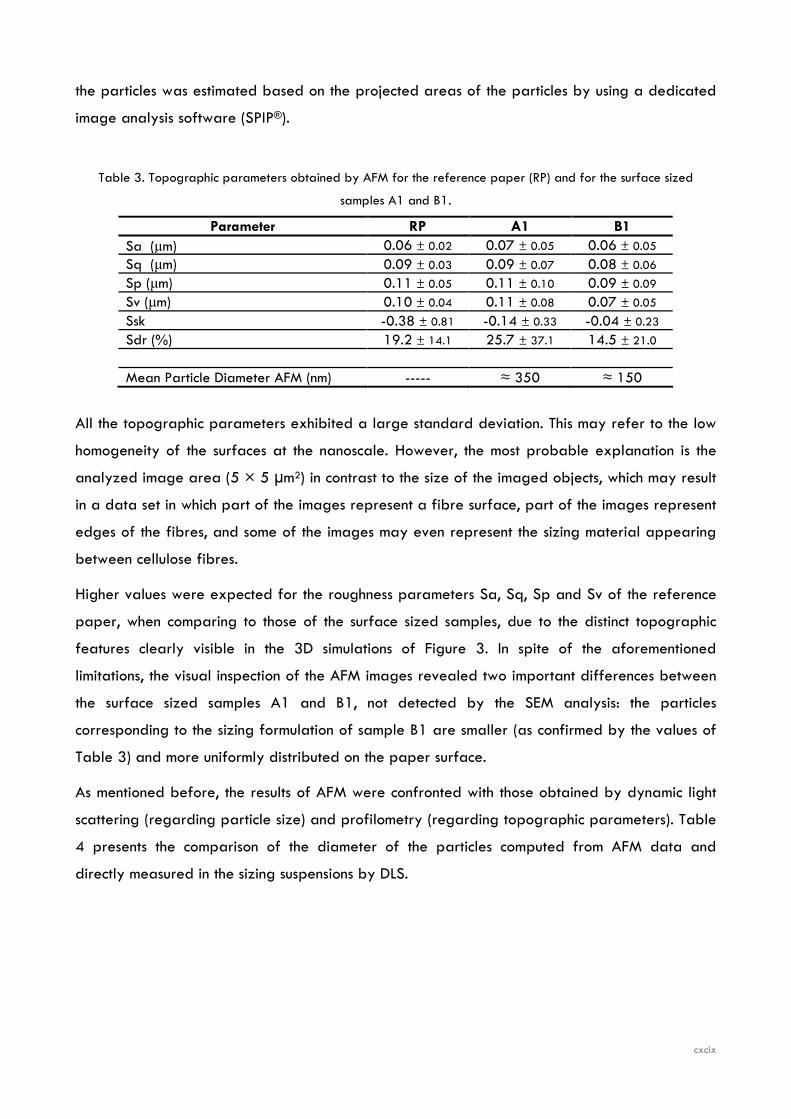
cxcix
the particles was estimated based on the projected areas of the particles by using a dedicated
image analysis software (SPIP®).
Table 3. Topographic parameters obtained by AFM for the reference paper (RP) and for the surface sized
samples A1 and B1.
Parameter RP A1 B1 Sa (µm) 0.06 ± 0.02 0.07 ± 0.05 0.06 ± 0.05
Sq (µm) 0.09 ± 0.03 0.09 ± 0.07 0.08 ± 0.06
Sp (µm) 0.11 ± 0.05 0.11 ± 0.10 0.09 ± 0.09
Sv (µm) 0.10 ± 0.04 0.11 ± 0.08 0.07 ± 0.05
Ssk -0.38 ± 0.81 -0.14 ± 0.33 -0.04 ± 0.23
Sdr (%) 19.2 ± 14.1 25.7 ± 37.1 14.5 ± 21.0
Mean Particle Diameter AFM (nm) ----- ≈ 350 ≈ 150
All the topographic parameters exhibited a large standard deviation. This may refer to the low
homogeneity of the surfaces at the nanoscale. However, the most probable explanation is the
analyzed image area (5 × 5 µm2) in contrast to the size of the imaged objects, which may result
in a data set in which part of the images represent a fibre surface, part of the images represent
edges of the fibres, and some of the images may even represent the sizing material appearing
between cellulose fibres.
Higher values were expected for the roughness parameters Sa, Sq, Sp and Sv of the reference
paper, when comparing to those of the surface sized samples, due to the distinct topographic
features clearly visible in the 3D simulations of Figure 3. In spite of the aforementioned
limitations, the visual inspection of the AFM images revealed two important differences between
the surface sized samples A1 and B1, not detected by the SEM analysis: the particles
corresponding to the sizing formulation of sample B1 are smaller (as confirmed by the values of
Table 3) and more uniformly distributed on the paper surface.
As mentioned before, the results of AFM were confronted with those obtained by dynamic light
scattering (regarding particle size) and profilometry (regarding topographic parameters). Table
4 presents the comparison of the diameter of the particles computed from AFM data and
directly measured in the sizing suspensions by DLS.
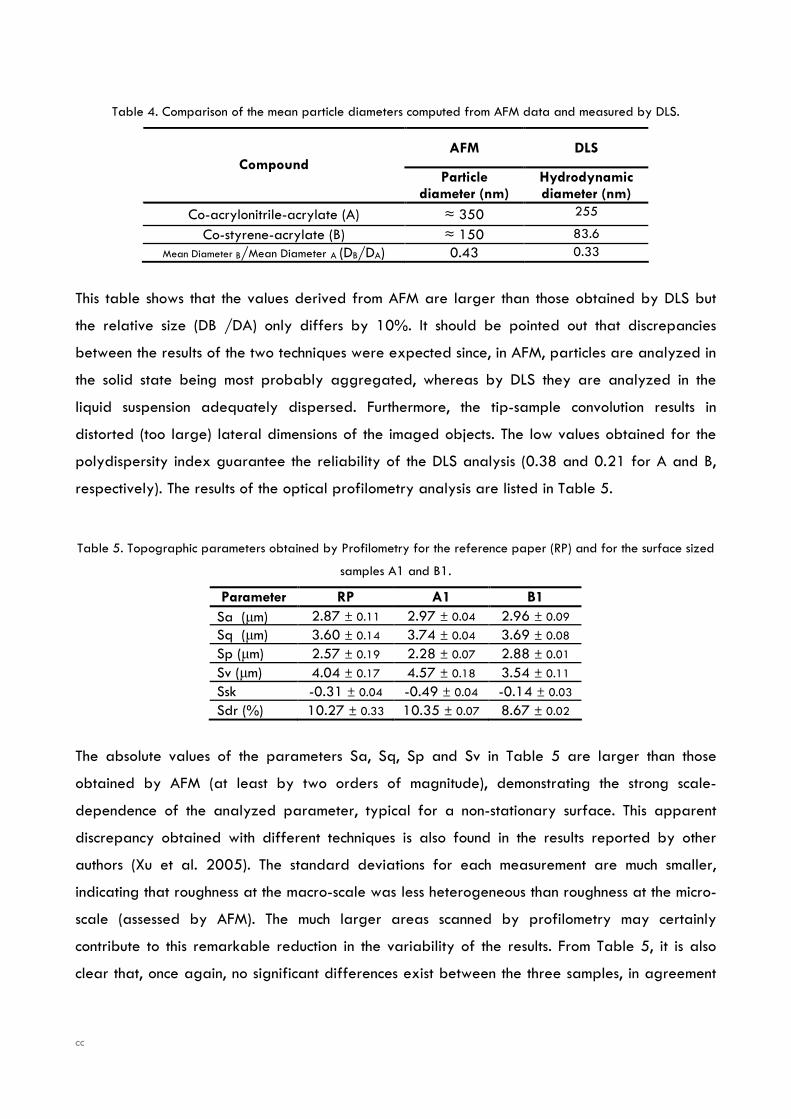
cc
Table 4. Comparison of the mean particle diameters computed from AFM data and measured by DLS.
AFM DLS Compound
Particle diameter (nm)
Hydrodynamic diameter (nm)
Co-acrylonitrile-acrylate (A) ≈ 350 255
Co-styrene-acrylate (B) ≈ 150 83.6
Mean Diameter B/Mean Diameter A (DB/DA) 0.43 0.33
This table shows that the values derived from AFM are larger than those obtained by DLS but
the relative size (DB /DA) only differs by 10%. It should be pointed out that discrepancies
between the results of the two techniques were expected since, in AFM, particles are analyzed in
the solid state being most probably aggregated, whereas by DLS they are analyzed in the
liquid suspension adequately dispersed. Furthermore, the tip-sample convolution results in
distorted (too large) lateral dimensions of the imaged objects. The low values obtained for the
polydispersity index guarantee the reliability of the DLS analysis (0.38 and 0.21 for A and B,
respectively). The results of the optical profilometry analysis are listed in Table 5.
Table 5. Topographic parameters obtained by Profilometry for the reference paper (RP) and for the surface sized
samples A1 and B1.
Parameter RP A1 B1 Sa (µm) 2.87 ± 0.11 2.97 ± 0.04 2.96 ± 0.09
Sq (µm) 3.60 ± 0.14 3.74 ± 0.04 3.69 ± 0.08
Sp (µm) 2.57 ± 0.19 2.28 ± 0.07 2.88 ± 0.01
Sv (µm) 4.04 ± 0.17 4.57 ± 0.18 3.54 ± 0.11
Ssk -0.31 ± 0.04 -0.49 ± 0.04 -0.14 ± 0.03
Sdr (%) 10.27 ± 0.33 10.35 ± 0.07 8.67 ± 0.02
The absolute values of the parameters Sa, Sq, Sp and Sv in Table 5 are larger than those
obtained by AFM (at least by two orders of magnitude), demonstrating the strong scale-
dependence of the analyzed parameter, typical for a non-stationary surface. This apparent
discrepancy obtained with different techniques is also found in the results reported by other
authors (Xu et al. 2005). The standard deviations for each measurement are much smaller,
indicating that roughness at the macro-scale was less heterogeneous than roughness at the micro-
scale (assessed by AFM). The much larger areas scanned by profilometry may certainly
contribute to this remarkable reduction in the variability of the results. From Table 5, it is also
clear that, once again, no significant differences exist between the three samples, in agreement
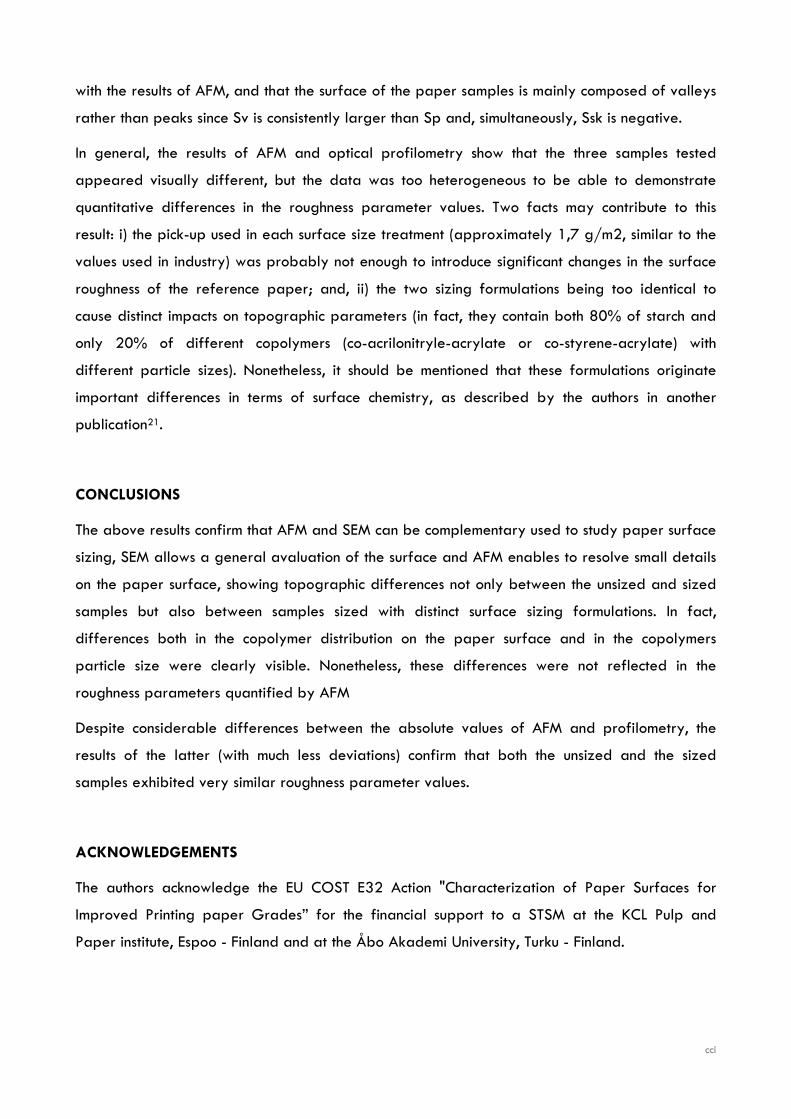
cci
with the results of AFM, and that the surface of the paper samples is mainly composed of valleys
rather than peaks since Sv is consistently larger than Sp and, simultaneously, Ssk is negative.
In general, the results of AFM and optical profilometry show that the three samples tested
appeared visually different, but the data was too heterogeneous to be able to demonstrate
quantitative differences in the roughness parameter values. Two facts may contribute to this
result: i) the pick-up used in each surface size treatment (approximately 1,7 g/m2, similar to the
values used in industry) was probably not enough to introduce significant changes in the surface
roughness of the reference paper; and, ii) the two sizing formulations being too identical to
cause distinct impacts on topographic parameters (in fact, they contain both 80% of starch and
only 20% of different copolymers (co-acrilonitryle-acrylate or co-styrene-acrylate) with
different particle sizes). Nonetheless, it should be mentioned that these formulations originate
important differences in terms of surface chemistry, as described by the authors in another
publication21.
CONCLUSIONS
The above results confirm that AFM and SEM can be complementary used to study paper surface
sizing, SEM allows a general avaluation of the surface and AFM enables to resolve small details
on the paper surface, showing topographic differences not only between the unsized and sized
samples but also between samples sized with distinct surface sizing formulations. In fact,
differences both in the copolymer distribution on the paper surface and in the copolymers
particle size were clearly visible. Nonetheless, these differences were not reflected in the
roughness parameters quantified by AFM
Despite considerable differences between the absolute values of AFM and profilometry, the
results of the latter (with much less deviations) confirm that both the unsized and the sized
samples exhibited very similar roughness parameter values.
ACKNOWLEDGEMENTS
The authors acknowledge the EU COST E32 Action "Characterization of Paper Surfaces for
Improved Printing paper Grades” for the financial support to a STSM at the KCL Pulp and
Paper institute, Espoo - Finland and at the Åbo Akademi University, Turku - Finland.
ccii
REFERENCES
(1) Koskela, J P., Hormi, O. E. O.; Improving the printability of paper with long-chain
quaternaries; Appita Journal; 2003; 56(4); 296-300.
(2) Pruszynski, P.; Recent developments in papermaking chemicals; WWP Keynote lectures; 2003;
82-90.
(3) Moutinho, I. M. T., Ferreira, P. J. T., Figueiredo, M. M. L.; Impact of surface sizing on inkjet
printing quality; Ind. Eng. Chem. Res.; 46(19); 2007; 6183-6188.
(4) Donigian, D. W., Ishley, J. N., Wise K. J.; Coating pore structure and offset printed gloss;
Tappi J; 80(5); 1997; 163-172
(5) Hladnik, A.; Ink-jet printing and image analysis; Technical Seminar, Beira Interior University,
Covilhã (Portugal); 2003.
(6) Forsström, U., Fagerholm, K., Saharenen; The role of base paper porosity in MSP coating;
Paperi ja Puu – Paper and Timber; 2003; 85(8); 454-459.
(7) Hamers, C., others; Curtain coating for graphics better coverage, printability and runnability
are among the advantages cited; Pulp and Paper Industry; July 2005; 36-37.
(8) Chinga, G., Helle, T.; Structure characterisation of pigment layer on paper by scanning
electron microscopy and image analysis; Nord. Pulp Pap. Res. J.; 17(3); 2002; 307-312.
(9) Koljonen, K., Österberg, M., Johansson, L.-S., Stenius, P.; Surface chemistry and morphology
of different mechnical pulps determined by ESCA and AFM; Colloids Surf:: Physicichem Eng.
Aspects; 228; 2003; 143-158.
(10) Gustafsson, J.; Surface characterization of chemical and mechanical pulp fibres by AFM and
XPS; Academic Dissertation; Department of Physical Chemistry; Åbo Akademi University
(Finland); 2004.
(11) Irvine, J. A., Aston, D. E., Berg, J. C.; The use of atomic force microscopy to measure the
adhesive properties of sized and unsized papers; Tappi J.; 82(5); 1999; 172-174.
(12) Xu, R., Fleming, P.D., Pekarovicova, A.; The effect of ink jet paper roughness on print gloss; J
Imag Sci Tech; 49(6); 2005; 660-666.
(13) Garcia, R., Perez, R.; Dynamic atomic force microscopy methods; Surface Science Reports;
47 (6-8); 2002; 197-301.
cciii
(14) Drelich, J., Tormoen, G. W., Beach, E. R.; Determination of solid surface tension from
particle-substrate pull-off forces measured with the atomic force microscope; J Colloid Interface
Sci; 280; 2004; 484-497.
(15) Das, S., Sreeram, P. A., Raychaudhuri, A. K., Sai, T. P., Brar L. K.; Non-contact dynamic
mode atomic force microscope: effects of nonlinear atomic forces; IEEE Conference; 2006; 458-
462.
(16) Ashori, A., Raverty, W. D., Vanderhoek, N., Ward, J. V. (); Surface topography of kenaf
(hibiscus cannabinus) sized papers; Bioresource Technology; 99(2); 2008; 404-410.
(17) Cohen, D. K.; Glossary of Surface Texture Parameters; Michigan Metrology ;
http://www.michmet.com/Download.htm; 2006.
(18) Stout, K.J., Sullivan, P.J., Dong, W.P., Mainsah, E., Luo, N., Mathia, T., Zahouani, H.,;
Publication no. EUR 15178 EN of the Commission of the European Communities; Luxembourg;
1994.
(19) Alince, B., Porubská, J., Van de Ven, T. G. M.; Light scattering and microporosity in paper;
JPPS; 28(3); 2002; 93-98.
(20) Elizalde, O., Leal, G., Leiza, J.; Particle Size Distribution Measurements of Polymeric
Dispersions: A Comparative Study; Part Part Syst Char; 17(5-6); 2001; 236 – 243.
(21) Moutinho, I. , Kleen, A. M., Figueiredo, M. M., Ferreira, P. J.; Effect of surface sizing on the
surface chemistry of paper containing eucalyptus pulp; Holzforschung; 63(3); 2009; 282-289.


CHAPTER 10
CONCLUSIONS

Physical & Chemical Interactions on Paper Surface – Impact on the Printability of Papers Produced with E. globulus Kraft Pulps ________________________________________________________________________________________________________________________
Isabel M. T. Moutinho 207
10 CONCLUSIONS
Having already outlined the relevant aspects of each of the covered topics within the
respective chapters, the main conclusions to be drawn relate essentially to the integration
and summary of these aspects. The major objective of this study was to analyze the
alterations in physical and chemical properties of the paper surface caused by the
application of different surface sizing formulations (constituted by mixtures of cationic starch
and minor quantities of distinct synthetic copolymers) and the impact of these physical and
chemical alterations on the inkjet printing quality of uncoated fine papers. The use of these
surface sizing blends raised additional difficulties due to the lack of information about the
chemical composition and structure of the copolymers, since these were industrial products
and the only information available was basically about the monomers that constituted each
copolymer. A trial and error procedure was then implemented to determine the monomers
proportion. This was based on the comparison between the elements ratios calculated from a
previous estimation and those measured by elemental analysis. Knowing the chemical
composition, a schematic representation of the molecules structure was then proposed and
validated by additional measurements of the compounds properties, such as particle size
and surface tension.
The different surface sizing formulations were applied to the paper sheets (≈ 3.5 g/m2) and
some surface properties of the treated papers were determined using distinct techniques
(some of them not routinely used for paper surfaces). The differences between the results
were explained in terms of composition of the corresponding copolymers used and their
quantities. Having in mind that the surface sizing is only a small percentage of a printing and
writing paper composition, that the variation of the applied sizing formulations was only in
the amount of copolymer added (20% at most, in order to be not far from the industrial
practice) and also that some of the copolymers had identical composition, the initial
expectation was for relatively small magnitude effects. Thus, and in order to guarantee that
the differences between the samples were statistically valid, an analysis of variance was
consistently applied to all the results of the various surface characterization techniques.
The results obtained can be divided in two major groups: those related to the physical
properties of the paper sheets (surface roughness and porosity) and those related to their
chemical characteristics (surface free energy, dispersive and polar components, and acid-
base character).
Physical & Chemical Interactions on Paper Surface – Impact on the Printability of Papers Produced with E. globulus Kraft Pulps ________________________________________________________________________________________________________________________
Isabel M. T. Moutinho 208
Regarding the 3D topographical parameters measured by laser profilometry, it was shown
that the surfaces are moderately rough with a predominance of valleys over peaks. With
respect to porosity, mercury porosimetry has shown that a value around 56% was found for
practically all samples. Additionally, the pore sizes exhibited a bimodal distribution with one
peak around 3 µm and another around 20 µm. The increase in the quantity of copolymer
incorporated in the blend led to a slight decrease in both porosity and pore size. In general,
it can be concluded that no significant changes were induced by the distinct sizing blends in
terms of surface roughness and paper porosity. As mentioned above, this is a logical
consequence of the surface sizing treatment, since only small amounts of sizing were applied
which in turn differed only in even smaller quantities of incorporated copolymers.
Nonetheless, complementary studies carried out with AFM for some of the samples enabled
to resolve small details on the paper surface allowing to detect differences in the size, shape
and spatial distribution of the surface sizing agents’ molecules at the paper surface.
Contrary to the results obtained in terms of surface topography, the differences in the
composition of the surface sizing blends had a relevant impact on the chemical properties of
the paper surface, as measured by contact angle and inverse gas chromatography. With
respect to the contact angle, both static and dynamic measurements were undertaken. A
preliminary study of paper topography’s influence revealed that surface roughness does not
significantly affect the contact angle values of the tested samples. As expected, the addition
of the copolymers to the cationic starch increased paper surface hydrophobicity in different
degrees according to the respective composition and concentration. As for the derived
surface energetics results, it was shown that the P&W papers’ surface is predominantly
dispersive, meaning that the polar and acid-base interactions have a smaller influence on
paper behavior. However, these secondary interactions allow detailing the influence of the
surface modifications, since they are more specific than the dispersive ones. In fact, the values
of the polar component of the surface free energy obtained for different copolymer
concentrations enabled to present solid hypotheses concerning the orientation of the
molecules at the paper surface, namely regarding the different functional groups.
Additionally, the dynamic contact angle measurements carried out with water to analyze the
wetting behavior have confirmed some of these hypotheses and revealed that the addition
of the synthetic surface sizing agents has an effect of controlling the wetting phenomena,
both in terms of spreading and absorption.
Physical & Chemical Interactions on Paper Surface – Impact on the Printability of Papers Produced with E. globulus Kraft Pulps ________________________________________________________________________________________________________________________
Isabel M. T. Moutinho 209
The IGC analysis of the dispersive interactions has not only confirmed but in some cases also
complemented the hypotheses raised for the molecules’ orientation based on the contact
angle measurements. Furthermore, it was verified that the paper’s dispersive component of
the surface free energy decreases as the temperature increases and that the values derived
from IGC are always above the ones determined from contact angle measurements, due to
the specificities of the techniques. As for the acid-base character it was found that the paper
surface is amphoteric with a slightly basic character (Kb values always higher than those of
Ka) and that the addition of the synthetic surface sizing agents to the traditional sizing
formulation increases the surface ability to establish acid-base interactions due to a general
increase of Ka and Kb values (more relevant for Kb).
From the results of both contact angle and IGC measurements, it was possible to find out that,
in general, styrene based surface sizing agents induce more consistent and logical variations,
associated to the chemical properties of the compounds. As for the distribution of the surface
sizing agents on the surface, it was verified that they stay at the paper surface in layers, and
the amount necessary to complete each layer depends on the size of the copolymer
molecules. Moreover, the functional groups of the sizing agent turned towards the air
interface are those that mostly influence the paper surface properties.
Complementary studies using ESCA and ToF-SIMS undertaken for some of the paper samples
enabled not only to confirm the above findings but also to detect differences in the
penetration of the copolymer particles into the paper structure, explained as a result of
distinct copolymer surface tensions. Furthermore, the use of these techniques has shown that
the increase of the sizing pick-up (up to 9.0 g/m2) does not significantly change the chemical
properties of the paper surfaces.
The final inkjet printing performance, evaluated through the determination of several
parameters related to color reproduction and image definition (as measured by optical
densities, gamut area and gain), has shown that the surface sizing agents including styrene
proved to be, in general, more successful than the remaining sizing agents tested.
Regarding the surface sizing agents’ molecules orientation, it was confirmed that for better
inkjet printing performances the predominance of non-polar rather than polar groups turned
outwards is desirable. However the predominance of these polar groups can not be
excessive since they must also be accessible for paper-ink interactions in order to allow the
ink to dry fast.
Physical & Chemical Interactions on Paper Surface – Impact on the Printability of Papers Produced with E. globulus Kraft Pulps ________________________________________________________________________________________________________________________
Isabel M. T. Moutinho 210
As for the subjective evaluation of the inkjet printing quality performed by a panel of end-
users, it was verified that the human perception of quality in a printed image is more
associated to parameters related with color reproduction quality (optical densities and
gamut area) than parameters reporting image definition (gain).
From all the available results, it can be concluded that the techniques used to analyze the
paper surface seem to be more sensitive to differences in the sizing blend formulations than
those specifically used to evaluate inkjet printing quality. This leads to the conclusion that the
final printing performance is clearly under-evaluated with the existing techniques.
Nonetheless, the results point to some recommended windows for the values of key variables
that potentiate a good printing quality:
75º < water contact angle < 85º;
0.09º/sec < wetting velocity < 0.19º/sec
6 mN/m < polar component of the surface free energy < 12 mN/m
Finally, in the total set of samples, those with an overall better performance are samples
StS9-05 and StS10-10, which include co-styrene-acrylate copolymers in the sizing blend.
Additionally, the work developed throughout these years and the results that were obtained
suggest some further studies in order to better understand the interactions ruling the printing
process and the sizing agents’ influence on inkjet printability of uncoated fine papers.
A deeper chemical characterization of the industrial compounds used in papermaking, taking
advantage of polymer chemistry, computational analysis and reversing engineering, would
be of utmost interest and usefulness.
In spite of the fact that the methodology used for the surface sizing operation in the
laboratory was quite reliable and sufficient to fulfil the objectives of the study, the
knowledge of other variables involved in the process such as the temperature and
rheological properties of the sizing formulations as well as the room temperature would be
helpful to better characterize the sizing process.
The delamination of the treated paper samples and the subsequent analysis of the distinct
layers both by SEM and FT-IR would contribute to a deeper insight on the effect of the
surface sizing process and of the absorption and spreading of inks.

Physical & Chemical Interactions on Paper Surface – Impact on the Printability of Papers Produced with E. globulus Kraft Pulps ________________________________________________________________________________________________________________________
Isabel M. T. Moutinho 211
Based on the results that were obtained with some of the copolymers, the use of tailor-made
sizing agents containing styrene would also provide a deeper insight on the interactions
occurring at paper surface. A larger variability in the composition of the surface sizing
formulations in terms of the percentage of surface sizing agent is also recommended, to
better understand the influence of each compound.
Finally, and in order to obtain printing quality results with a detail close to that provided by
the techniques used for the surface characterization, further developments in specific
techniques to evaluate printing parameters are mandatory. This would most certainly help to
achieve more comprehensive and reliable correlations between the surface properties and
the final inkjet printing quality as well as to establish more consistent mathematical models.


CHAPTER 11
REFERENCES

Physical & Chemical Interactions on Paper Surface – Impact on the Printability of Papers Produced with E. globulus Kraft Pulps ________________________________________________________________________________________________________________________
Isabel M. T. Moutinho 215
11 REFERENCES
A
Adamson A. W., Gast A. P. (1997); Physical chemistry of surfaces; 5th edition; John Wiley &
Sons Inc.; New York; 291-363 and 379-420.
Ahlroos J., Grön J. (2001); Coating-paper interactions for metered size press coated
mechanical grades based on TMP and SGW pulps; Tappi Journal; 84(5); 68.
Alince B., Porubská J., Van de Ven T. G. M. (2002); Light scattering and microporosity in
paper; Journal of Pulp and Paper Science; 28(3); 93-98.
Ajerschi M., Poirier N., Pikulik I. (2004.); Colagem superficial sem prensa de colagem –
Resultados de máquina de papel piloto; O Papel/Paprican; 47-58.
Andersson C., Järnström L., Mesic B. (2006); Controled penetration of starch and
hydrophobic sizing agent in surface sizing of porous materials; Appita Journal; 59(3);
207-212.
Aquino A. I., Martins A. A., Figueiredo M. M., Carvalho M. G. (2003); Effect of beating and
sizing on the surface properties of Eucalyptus globulus fibres; Proc. 28th Eucepa conference
– Sustainable Development for the pulp and paper industry; Lisbon.
Ashori A., Raverty W. D., Vanderhoek N., Ward J. V. (2008); Surface topography of kenaf
(hibiscus cannabinus) sized papers; Bioresource technology; 99(2); 404-410.
Aspler J. S., Davis S., Lyne M. B. (1987); The surface chemistry of paper in relation to
dynamic wetting and sorption of water and lithographic fountain solutions; Journal of
Pulp and Paper Science; 13(2); J55-J60.
Aspler J. S. (1993); Interactions of ink and water with the paper surface in printing;
Nordic Pulp and Paper Research Journal; 8(1); 68-74.
van Asten A., van Veenendaal N., Koster S. (2000); Surface characterization of industrial
fibers with inverse gas chromatography; Journal of Chromatography A; 888; 175-196.
B
Baoli S., Qianru Z., Lina J., Yang L., Bin L. (2007); Surface Lewis acid base properties of
polymers measured by inverse gas chromatography; Journal of Chromatography A; 1149;
390-393.
Physical & Chemical Interactions on Paper Surface – Impact on the Printability of Papers Produced with E. globulus Kraft Pulps ________________________________________________________________________________________________________________________
Isabel M. T. Moutinho 216
Bardavid S. M., Schulz P. C., Arancibia E. L. (2007); IGC studies of binary cationic
surfactants mixtures; Journal of Colloid and Interface Science; 316; 114-119.
Barros G. G. (2004); Optical topographical characterization for flexographic printability
assessment ; Licentiate Thesis; Karlstad University; Sweden.
Brandão E. (1999); Colagem superficial: Experiência e reflexões sobre sua aplicação;
Proc. 16º Encontro Tecnicelpa; Covilhã; 165-176.
Branton P., Baker R. R. (2002); Methods for the structural characterisation of cigarette
paper; Oral presentation - 56th Tobacco Science Research Conference; Lexington; Kentucky;
USA; September 29 to October 2.
Brinen J. S. (1993); The observation and distribution of organic additives on paper
surfaces using surface spectroscopic techniques; Nordic Pulp and Paper Research Journal;
(1); 123-129.
Bastos F. S. (2004); Avaliação da textura superficial e comportamento ao desgaste do
esmalte dentário; Tese de Mestrado; Universidade Federal de Minas Gerais; Brasil.
Bauer D., Bergh N. O., von Flaven A., Palm C., Lüttgen W., Baurneister M. (1999); Starch –
Characterization and use in the paper industry; Proc. APV annual conference; Damsladt.
Belgacem M. N., Czeremuszkin G., Sapieha S. (1995); Surface characterization of cellulose
fibers by XPS and inverse gas chromatograghy; Cellulose; 2; 145-157.
Belgacem M. N. (2000); Characterization of polysaccharides, lignin and other woody
components by inverse gas chromatography: A review; Cellulose Chemistry and
Technology; 34; 357-383.
Bico J., Thiele U., Quéré D. (2002); Wetting of textured surfaces; Colloids and Surfaces A:
Physicochemical and Engineering Aspects; 206; 41-46.
Böras L., Sjöström J., Gatenholm P. (1997); Characterization of surfaces of CTMP fibers
using inverse gas chromatography combined with multivariate data analysis; Nordic
Pulp and Paper Research Journal; 12(4); 220-224.
Borch J. (1982); Sizing additives affect polymer-paper adhesion; Tappi Journal; 65(2); 72-
73.
Physical & Chemical Interactions on Paper Surface – Impact on the Printability of Papers Produced with E. globulus Kraft Pulps ________________________________________________________________________________________________________________________
Isabel M. T. Moutinho 217
Bordurtha P. A., Matthews G. P., Kettle J. P., Roy I. M. (2005); Influence of anisotropy on
the dynamic wetting and permeation of paper coatings; journal of Colloid and Interface
Science; 283; 171-189.
Breda J. P. M. D. (2001); Estudo do efeito da composição da mistura fibrosa na
qualidade da impressão com jacto de tinta; Tese de Mestrado; Universidade da Beira
Interior.
Briggs D., Rance D.G., Briscoe B.J. (1989); Surface properties; In: Booth C., Price C. (book
eds.); Polymer characterization; In: Allen G, Bevington J.C. (series eds.); Comprehensive
Polymer Science - The Synthesis, Characterization, Reactions & Applications of Polymers;
Pergamon Press; Oxford; 707-732.
Browning B. L., (1977); Analysis of paper; 2nd edition; Marcel Dekker Inc.; New York.
C
Carvalho M. G. (2005); Surface characterization by using inverse gas chromatography:
application to fibres (pulp) and paper; Seminário; Universidad de Misiones; Argentina;
Setembro.
Carvalho M. G., Santos J. M. R. C. A., Martins A. A., Figueiredo M. M. (2005); The effects of
beating, web forming and sizing on the surface energy of Eucalyptus globules kraft fibres
evaluated by inverse gas chromatography; Cellulose; 12; 371-383.
Carceller R., Juppo A. (2004); New surface size composition changes paper surface
properties for improving ink jet printability of copy paper; Paperi ja Puu – Paper and
Timber; 86(3); 161-163.
Cassei A. B. D., Baxter S. (1944); Wettability of porous surfaces; Transactions of Faraday
Society; 40; 546-551.
Cassei A. B. D. (1948); Contact Angles; 11-15.
Chen J., Oliver J., Smith G., Haun J. (2002); A print quality minitoring program for roto-
grade newsprint, Part I: Preliminary desingn of printing quality evaluation; Pulp and
Paper Canada; 130 (3); 32-35.
Chhabra I., Spelt J. K., Yip C. M., Kortschot M. T. (2005); An Investigation of pulp fibe
surface by atomic force microscopy; Journal of Pulp and Paper Science; 31819; 52-56.
Physical & Chemical Interactions on Paper Surface – Impact on the Printability of Papers Produced with E. globulus Kraft Pulps ________________________________________________________________________________________________________________________
Isabel M. T. Moutinho 218
Chinga G., Helle T. (2002a); Quantification of structure details of LWC paper coating
layers; Nordic Pulp and Paper Research Journal; 17(3); 313-318.
Chinga G., Helle T. (2002b); Structure characterisation of pigment layer on paper by
scanning electron microscopy and image analysis; Nordic Pulp and Paper Research Journal;
17(3); 307-312.
Conners T. E., Banerjee S. (1995); Surface analysis of paper; CRC Press; New York.
Cohen D. K. (2006); Glossary of Surface Texture Parameters; Michigan Metrology;
http://www.michmet.com/Download.htm.
Conceição S., Santos N., Velho J., Ferreira J. M. (2003); Influence of rheology on paper
coated properties; WWP Pulp and Paper Science and Technology: Papermaking Science and
Technology; 199-204.
Cordeiro N., Neto C. P., Gandini A., Belgacem M. N. (1995); Characterization of the cork
surface by inverse gas chromatography; Journal of colloid and interface science; 174; 246-
249.
D
Danby R., Zhou H. (2004); Numerical evaluation of the printability of paper surfaces; Pulp
& Paper Canada; 105(9); 38-42.
Das S., Sreeram P. A., Raychaudhuri A. K., Sai T. P., Brar L. K. (2006); Non-contact dynamic
mode atomic force microscope: effects of nonlinear atomic forces; IEEE conference; 10-13
Jan; 458-462.
Dataphysics (n.d.); Surface chemistry – The Fundamentals of contact angle measurements;
Manual de instruções do equipamento OCA 20.
Donderi D. C., Jordan B., Aspler J., O’Neill M. (2003); The subjective print quality of
commercial heatset pffset prints on lightweight coated paper; Pulp & Paper Canada;
104(9); 35-37.
Dong W. P., Sullivan P. J., Stout K. J. (1994a); Comprehensive study of parameters for
characterizing three-dimensional surface topography III: Parameters for characterizing
amplitude and some functional properties; Wear; 178; 29-43.
Physical & Chemical Interactions on Paper Surface – Impact on the Printability of Papers Produced with E. globulus Kraft Pulps ________________________________________________________________________________________________________________________
Isabel M. T. Moutinho 219
Dong W. P., Sullivan P. J., Stout K. J. (1994b); Comprehensive study of parameters for
characterizing three-dimensional surface topography IV: Parameters for characterizing
spatial and hybrid properties; Wear; 178; 45-60.
Donigian D. W., Ishley J. N., Wise K. J. (1997); Coating pore structure and offset printed
gloss; Tappi Journal; 80(5); 163-172.
Donigian D. W., Wernett P. C., McFadden M. G., McKay J. (1999); Ink.jet dye fixation and
coating pigments; Tappi Journal; 82(8); 175-182.
E
Engström G. (2005); Interactions between coating colour and base sheet in pigment
coating; Proc. 13th Fundamental Research Symposium; Cambridge; 1011 – 1073.
Ernstsson M. (2005); Surface chemistry of paper – surface composition and spectroscopic
characterization techniques; FPIRC Course nº 14; Estocolmo; Setembro 2005.
Exner R. (2001); Synthesis & application of polymer sizing agents; Proc. Pira International
Conference - Scientific & Technical Advances In The Internal & Surface Sizing Of Paper &
Board; Prague.
F
Fardim P. (2002); Papel e química de superfície parte II – Revestimento e printabilidade;
O papel; Maio 2002; 75-83.
Fardim P., Durán N. (2005); Effects of kraft pulping on the interfacial properties of
Eucalyptus pulp fibers; J. Rraz. Chem. Soc.; 16(5); 915-921.
Felix J. M., Gatenholm P. (1993); Characterization of cellulose fibers using inverse gas
chromatography; Nordic Pulp and Paper Research journal; 1; 200-203.
Forsström U., Fagerholm K., Saharenen (2003); The role of base paper porosity in MSP
coating; Paperi ja Puu – Paper and Timber; 85(8); 454-459.
Fowkes F. M. (1987); Role of acid-base interfacial bonding in adhesion; Journal of
Adhesion Science and Technology; 1(1); 7-27.
G
Gadelmawla E. S., Koura M. M., Maksoud T. M. A., Elewa I. M., Soliman H. H. (2002);
Roughness parameters; Journal of Materials Processing Technology; 123; 133-145.
Garcia M. F. (2004); Revestimento: a evolução do papel; O Papel; (3); 41-46.
Physical & Chemical Interactions on Paper Surface – Impact on the Printability of Papers Produced with E. globulus Kraft Pulps ________________________________________________________________________________________________________________________
Isabel M. T. Moutinho 220
Garret P. D., Lee K. I. (1998); Characterization of polymers for paper surface sizings
using contact angle methods; Tappi Journal; 81(4); 198-203.
Gennes P. G. (1985); Wetting: statics and dynamics; Reviews of Modern Physics; 57(3);
827-863.
Glittenberg D., Voigt A. (2004); How to improve ink-jet papers Its possible to build in
desired properties without breaking the bank; Pulp and Paper International; 19-21.
Glittenberg D., Leonhardt P. (2007); High-dosable wet-end starch for strength
improvement allows new, more economic papermaking concepts; Scinece and Technology
– Das Papier; 9; 32-38.
Gu W., Bousfield W., Tripp C. P. (2007); The role of surface hydrophobicity in offset ink
setting; Nordic Pulp and Paper Research Journal; 22(1); 57-60.
Gurau V., Bluemle M. J., De Castro E. S., Tsou Y., Mann Jrª J. A., Zawodzinski Jrª T. A. (2006);
Characrerization of transport properties in gás diffusion layers for proton Exchange
menbrane fuel cells 1. wettability (internal contact angle to water and surface energy of
GDL fibers); Journal of Powder Sciences; 160; 1156-1162.
Gutierrez M. C., Rubio J., Rubio F., Oteo J. L. (1999); Inverse gas Chromatography: a new
approach to the estimation of specific interaction; Journal of Chromatography A; 845; 53-
66.
H
Hladnik A. (2003); Ink-jet printing and image analysis; Seminário; Universidade da Beira
Interior; Covilhã.
Hoang V., Ly H. H., Shen W., Parker I. H. (s.d.); The interaction of ink-jet inks and uncoated
papers; 269-276.
J
Johnson R. W., Abrams L., Maynard B., Amick T. J. (1999); Use of mercury porosimetry to
characterize pore structure and model end-use properties of coated papers – part I:
Optical and strength properties; Tappi Journal; 82(1); 239-251.
K
Kangas H., Kleen M. (2004); Surface chemical and morphological properties of
mechanical pulp fines; Nordic Pulp and Paper Research Journal; 19(2); 191-199.
Physical & Chemical Interactions on Paper Surface – Impact on the Printability of Papers Produced with E. globulus Kraft Pulps ________________________________________________________________________________________________________________________
Isabel M. T. Moutinho 221
Kannangara D., Zhang H., Shen W. (2006); Liquid-paper interactions during liquid drop
impact and recoil on paper surfaces; Colloids and Surfaces A: Physicochem. Eng. Aspects;
280; 203-215.
Keller D. S., Lune, P. (2009); Surface energetics of calcium carbonates using inverse gas
chromatography; colloids and surfaces A: Physicochemical and Engineering Aspects; 161;
401-415.
Keskitalo I. (2000); The penetration of water-based inks into laboratory sheets made from
bleached eucalypt Kraft pulp; Master’s Thesis; Luleå Tekniska Universitet; Sweden.
Kleen M., Kangas H., Laine C. (2003); Chemical characterization of mechanical pulp fines
and fiber surface layers; Nordic Pulp and Paper Reseach Journa; 18(4); 361-368.
Knauf G. H., Doshi M. R. (1986); Calculayions of aerodynamic porosity, specific surface
área, and specific volume from Gurley seconds measurements; Institute of Paper Chemistry
Technical Paper Series; 183; 1-7.
Koljonen K. (2004); Effect of surface properties of fibers on some paper properties of
mechanical and chemical pulp; Master of science thesis; Laboratory of Forest Products
Chemistry, Department of Forest Products Technology, Helsinki University of Technology;
Espoo; Finland.
Koljonen K., Stenius P. (2005), Surface characterization of single fibers from mechanical
pulps by contact angle measurements; Nordic Pulp and Paper Research Journal; 20(1), 107-
113.
Kowalczyk G. E., Trksak R. M. (1998); Image analysis of ink-jet quality for multi use office
paper; Tappi Journal; 81(110); 181-190.
Kunaver M., Zadnik J., Planinsek O., Srcic S. (2004); Inverse gas chromatography – A
different approach to characterization of solids and liquids; Acta Chim. Slov.; 51; 373-
394.
Kwok D. Y., Lam C. N. C., Li A., Leung A., Wu R., Mok E., Neuman A. W. (1998); Measuring
and interpreting contact angles: a complex issue; Colloids and Surfaces A. Physicochemical
and Engineering Aspects; 142; 219-235.
L
Lai S. C. S. (2003); Mimichink nature: Physical basis and artificial synthesis of the Lótus-
effect; Tese; Universidade de Leiden.
Physical & Chemical Interactions on Paper Surface – Impact on the Printability of Papers Produced with E. globulus Kraft Pulps ________________________________________________________________________________________________________________________
Isabel M. T. Moutinho 222
Laleg M. (2004); Colagem superficial com quitosana e com misturas de quitosana e
amidos; O Papel/Paprican, 33-45.
Lee H. L., Shin J. Y., Koh C., Ryu H., Lee D., Sohn C. (2002); Surface sizing with cationic
starch: its effect on paper quality and papermaking process; Tappi Journal; 1(1); 34-40.
Lee H., Joyce M. K., Fleming P. D., Cawthorne J. E. (2005); Influence of silica and alumina
oxide on coating structure and print quality of ink-jet papers; Tappi Journal; 4(1); 11-16.
Lee T. G., Kim J., Shon H. K., Jung D., Moon D. W. (2006); Chemical derivatization
technique in ToF-SIMS for quantification analysis of surface amine groups; Applied
Surface Science; 252; 6632-6635.
Lehtinen E. (2000); Pigment coating and surface sizing of paper; Papermaking Science and
Technology encyclopedia vol. 11; Fapet Oy; Helsinki; 2000
Lertsutthiwong P., Nazhad M. M., Chandrkrachang S., Stevens W. F. (2004); Chitosan as a
surface sizing agent for offset printing paper; Appita Journal; 57(4); 274-280.
Levlin J., Söderhjelm L. (2000); Pulp and paper testing; Papermaking Science and technology
encyclopedia vol 17; Fapet Oy; Helsinki; 2000.
Lindsay J. D. (1990); The Anisotropic Permeability of Paper; Tappi J.; 73(5): 223.
Lindsay J. D. (1998); The Anisotropic Permeability of Paper: Theory, Measurements, and
Analytical Tools; IPC Technical Paper Series #289; The Institute of Paper Chemistry;
Appleton; Wisconsin.
Lindsay B., Abel M. L., Watts J. F. (2007); A study of electrochemically treated PAN based
carbon fibers by IGC and XPS; Carbon; 45; 2433-2444.
Liu, F. P., Rials, T. G.; Simonsen, J. (1998); Relationship of wood surface energy to surface
composition; Langmuir; 14(2); 536-541.
Lohmander S., Rigdahl M. (2000); Influence of a shape factor of pigment particles on the
rheological properties of coating colours; Nordic Pulp and Paper Research Journal; 15(3);
231-236.
M
Marmur A. (2006); Soft contact: measurement and interpretation of contact angles; Soft
Metter; 2; 12-17.
Physical & Chemical Interactions on Paper Surface – Impact on the Printability of Papers Produced with E. globulus Kraft Pulps ________________________________________________________________________________________________________________________
Isabel M. T. Moutinho 223
Mangin P. J. (1993); A structural approach to paper surface characterization; Proc. Process
and product Quality Conference; Tappi; Atlanta; 17-23.
Martin A. H. (2008); Porosity Guide; at www.paperonewb.com.
Mäkinen M. O. A., Jääskeläinen T., Parkkinen J., (2007); Improving optical properties of
printing papers with dyes: A theoretical study; Nordic Pulp and Paper Research Journal;
22(2), 236-243.
Mattila U., Tahkola K., Nieminen S., Kleen M. (2003); Penetration and separation of coldset
ink resin and oils in uncoated paper studied by chromatographic methods; Nordic Pulp
and Paper Research Journa; 18(4); 413-420.
Mešic B., Järnström L., Hjärthag C., Lestelius M. (2004); Effects of application temperature in
paper surface sizing with temperature-responsive starch on water repellency and
flexographic printability; Appita Journal; 57(4); 281-285 & 298.
Micromeritics (2000); Autopore IV 9500 Operator’s manual.
Moura M. J., Ferreira P. J., Figueiredo M. M. (2005); Mercury intrusion porosimetry in pulp
and paper technology; Powder Technology; 160; 61-66.
Moutinho I., Figueiredo M. M., Ferreira P. J. (2004); Influência dos agentes de colagem
superficial na estrutura do papel – uma análise química; Relatório de Seminário;
Universidade de Coimbra.
Moutinho I., Oliveira P., Figueiredo M., Ferreira P. (2007a); Evaluating the surface energy
of surface sized printing and writing papers; Proc. XX Encontro Nacional Tecnicelpa; 10-12
Outubro 2007; Tomar; Portugal.
Moutinho I. M. T., Ferreira P. J. T., Figueiredo M. M. L. (2007b); Impact of surface sizing on
inkjet printing quality; Ind. Eng. Chem. Res.; 46 /(19); 6183-6188.
Moutinho I., Figueiredo M. M., Ferreira P. J. (2008a); “Caracterización de la Superficie de
Papeles de Impresión y Escritura con Encolado Superficial”; Celulosa y Papel; Vol 24 (nº
2); 6:15.
Murakami K., Imamura R. (1980); Porosity and gas permeability; Handbook of Physical and
Mechanical Testing of Paper and Paperboard; vol. 2; Marcel Dekker Inc.; New York; pp 57-
80.
N
Physical & Chemical Interactions on Paper Surface – Impact on the Printability of Papers Produced with E. globulus Kraft Pulps ________________________________________________________________________________________________________________________
Isabel M. T. Moutinho 224
Nissi M. V. H., Savolainen A., Talja M., Raija M., R. (1999); Polymer dispersion coated HD
papers; Tappi Journal; 82(1); 252-256.
O
Oittinen P., Saarelma H. (1998); Printing; Papermaking Science and Technology
encyclopedia vol. 13; Fapet Oy; Helsinki; 1998.
Olkkonen T., Lipponen J. (2007); Starch penetration in surface sizing at various
parameters – pilot and production machine experience; Science & Technology – Das Papier;
Olsson R., Yang L., van Stam J., Lestelius M. (2006), Effects on ink setting in flexographic
printing: Coating polarity and dot gain; Nordic Pulp and Paper Research Journal; 21(59);
569-574.
P
Paulapuro H. (2000); Papermaking Part 1, Stock Preparation and Wet End; Papermaking
Science and Technology encyclopedia vol. 11; Fapet Oy; Helsinki; 2000.
Planinšek O., Buckton G. (2003); Inverse gas chromatography: Considerations about
appropriate use for amorphous and crystalline powders; Journal of Pharmaceutical
Sciences; 92(6); 1286-1294.
Prinz M., Schultz W.-S. (2007); Sizing agents for surface and wet end application;
Professional Papermaking; 1; 44-49.
Putkisto K., Maijala J., Grön J., Rigdahl M. (2004); Polymer coating of paper using dry
surface treatment: Coating structure and performance; TAPPI JOURNAL; 3(11), 16-23.
Pyda M., Sidqi M., Keller D. S., Luner P. (1993); An inverse gas chromatographic study of
calcium carbonate with alkylketene dimmer; Tappi Journal; 76(4); 79-85.
R
Ridgway C. J., Gane P. A. C. (2003); Bulk density measurement and coating porosity
calculation for coated paper samples; Nordic Pulp and Paper Research Journal; 18(1); 24-
31.
Rjiba N., Nardin M., Dréan J. Y., Frydrych R. (2007); A study of the surface properties of
corron fibers by inverse gas chromatography; Journal of colloids and Interface Science;
314; 373-380.
Physical & Chemical Interactions on Paper Surface – Impact on the Printability of Papers Produced with E. globulus Kraft Pulps ________________________________________________________________________________________________________________________
Isabel M. T. Moutinho 225
Roe R., Baccheta V. L., Wong P. M. G. (1967); Refinement of pendant drop method for the
measurement of surface tension of vicous liquids; The Journla of Physical Chemistry;
71(13); 4190-4193.
Rosenberger R. R. (2003); Quantitatively relating ink jet print quality to human
perception; Pulp and Paper Canada; 104(3); 35-38.
S
Santos J. M. R. C. A., Gil M. H., Portugal A., Guthrie J. T. (2001); Characterisation of the
surfaceof a multi-purpose office paper by inverse gas chromatography; Cellulose; 8; 217-
224.
Santos J. M. R. C. A., Guthrie J. T. (2005); Analysis of interactions in multicomponent
polymeric systems: The key-role of inverse gas chromatography; Materials Science and
Engineering; 50; 79-107.
Saxena A., Kendrick J., Grisey I., Mackin L. (2007); Application of molecular modeling to
determine the surface energy of mannitol; International journal of Pharmaceutics; 343; 173-
180.
Seppänen R., von Bahr M., Tiberg F., Zhmud B. (2004); Surface energy characterization of
AKD sized papers; Journal of Pulp and Paper Science; 30(3); 70-73.
Sequera J. (1999); Encolado superficial para hacer papeles más competitivos; El Papel;
Noviembre, 50-52.
Shakeri A., Tabar-Haidar K. (2004); Surface characterization of pulp paper fibers using
inverse gas chromatography; Iranian Polymer Journal; 13(69; 471-478.
Shen W., Yao W., Li M., Parker I. (1998); Characterization of eucalypt fibre surface using
inverse gas chromatography and X-ray photoelectron spectroscopy; Appita Journal;
51(29);147-151.
Shen W., Parker I. H. (1999); Surface composition and surface energetics of various
eucalypt pulpsn; CELLULOSE; 41-55.
Shen W., Filonanko Y., Truong Y., Parker I. H., Brack N., Pigram P., Liesegang J. (2000);
Contact angle measurement and surface energetics of sized and unsized paper; Colloids
and Surfaces A: Physicochemical and Engineering Aspects; 173; 117-126.
Physical & Chemical Interactions on Paper Surface – Impact on the Printability of Papers Produced with E. globulus Kraft Pulps ________________________________________________________________________________________________________________________
Isabel M. T. Moutinho 226
Sreekumar J., Sain M., Farnood R., Dougherty W. (2007); Influence of styrene naleic
anhydride imide on onk-jet print quality and coating structure; Nordic Pulp and Paper
research Journal; 22(3); 307-313.
Stout K.J., Sullivan P.J., Dong W.P., Mainsah E., Luo N., Mathia T., Zahouani H. (1993); The
development of methods for the characterization of roughness on three dimension;
Publication no. EUR 15178 EN of the Commission of the European Communities; Luxembourg.
Ström G. (2005); Techniques to characterize surface energy - surface energy of papers;
FPIRC Course nº 14; Estocolmo; Setembro.
Svanholm E. (2004); An experimental study of inkjet receptive coatings; Graduation Thesis;
Karlstad University.
Swain P., Lipowsky R. (1998); Contact angles on heterogeneous surfaces: a new look at
Cassie’s and Wenzel’s laws; Cornell university library (http://arxiv.org);1-10.
T
Thomas T. R. (1998); Rough Surfaces; Imperial Colege Press; London.
TrueGage Surface Metrology (2008); TrueMap v4 Help System; URL:
http://www.truegage.com/help/TrueMap.
Tze W. T., Gardner, D. J. (2001); Contact angle and IGC measurements for probing
surface-chemical changes in the recycling of wood pulp fibers; J. Adhesion Sci.
Technology; 15(2); 223-241.
U
Uhlmann P., Schneider S. (2002); Acid-base and energy characterization of grafted
polyethylene using inverse gas chromatography; Journal of Chromatography A; 969; 73-
80.
Ungh J., Nilson C-M., Verikas A. (2007); Analysis of paper, print and press interaction
from online measurements in a press room; Nordic Pulp and Paper Research Journal; 22(3);
383-387.
URL 1: http://www.pharmainfo.net/ (22.12.2008)
URL 2: http://www.taylor-hobson.com/en/news-tutorials-publications/25/ (06.03.2009)
URL 3: http://www.surfoptic.com/sirs%20measurement%20parameters.htm

Physical & Chemical Interactions on Paper Surface – Impact on the Printability of Papers Produced with E. globulus Kraft Pulps ________________________________________________________________________________________________________________________
Isabel M. T. Moutinho 227
URL 4: http://www.paperonweb.com/grade11.htm (20.04.2009)
V
Varnell D. F. (1998); Paper properties that influence ink-jet printing; Pulp & Paper Canada;
99(4); 37-42.
Voelkel A., Strzemiecka B. (2007); Characterization of fillers used in abrasive articles by
means of inverse gas chromatography and principal component analysis; International
Journal of Adhesion & Adhesives; 27; 188194.
Vyörykkä J (2005); Confocal Raman Microscopy; FPIRC Course nº 14; Estocolmo; Setembro
2005.
W
Wågberg L., Westerlind C. (2000); Spreading of droplets of different liquids on specially
structured papers; Nordic Pulp and Paper Research Journal; 15(5); 598-606.
Wågberg L., Johansson P. (2002); Characterization of paper surfaces using optical
profilometry; In: Borch J., Lyne M. B., Mark R. E., Habeger Jr. C. C. (book eds.); Handbook of
physical testing of paper; Marcel Dekker Inc.; New York; 429-435.
Wålinder M. E. P., Gardner D. J. (2000); Surface energy of extracted and non-extracted
Norway spruce wood particles studied by inverse gas chromatography (IGC); Wood and
Fiber Science; 32(4); 478-488.
Wang B., Sain M. (2007); The effect of chemically coated nanofiber reinforcement on
biopolymer based nanocomposites; BioResources; 2(3); 371-388.
Wenzel R. N. (1936); Resistance of solid surfaces to wetting by water; Industrial and
Engineering Chemistry; 28(8); 988-994.
Wenzel R. N. (1949); Surface roughness and contact angle; 1466-1467; DOI:
10.1021/j1547a015.
Y
Yang L., Fogden A., Pauler N., Sävborg Ö., Kruse B. (2005), Anovel method for studying
ink penetration of a print; Nordic Pulp and Paper Research Journal; 20(4), 423-429.


Physical & Chemical Interactions on Paper Surface – Impact on the Printability of Papers Produced with E. globulus Kraft Pulps ________________________________________________________________________________________________________________________
Isabel M. T. Moutinho i
FIGURES INDEX
Figure 1.1 - Trends in maximum operating speeds of paper machines (Paulapuro 2000). ....................5
Figure 1.2 – Schematic representation of the production process for printing and writing papers.......6
Figure 1.3 - Structure of starch and cellulose. ..................................................................................................9
Figure 1.4 - Starch during cooking. ................................................................................................................. 10
Figure 1.5 - Polymer-starch film formation on paper surface. ................................................................... 11
Figure 1.6 – Schematic representation of a pond size press...................................................................... 11
Figure 1.7 – Schematic representation of a film size press. ....................................................................... 12
Figure 1.8 - Schematic representation of flexography printing principle................................................ 15
Figure 1.9 – Schematic representation of rotogravure printing principle. ............................................... 15
Figure 1.10 - Schematic representation of offset printing principle. ........................................................ 16
Figure 2.1 – Schematic representation of the methodology used in this work ........................................ 23
Figure 2.2 – Equipment used in the surface sizing process (a) picture; (b) schematic representation.
The paper sheet is placed in the support table and secured with the sample holder,
after, using a syringe, a straight line of sizing blend is manually spread in front of the
applicator roll, with it in the start position (right in front of the sample holder) by
pressing the start bottom on the control panel, the applicator roll spreads the sizing
blend at the paper surface and the IR dryer dries it partially immediately after the
application. ................................................................................................................................... 25
Figure 2.3 – Mask used to evaluate inkjet printing quality. ....................................................................... 30
Figure 3.1 – Example of the information available in a product datasheet ........................................... 33
Figure 3.2 – Algorithm used for the determination of the monomers’ proportion of each of the
copolymers used. ......................................................................................................................... 35
Figure 3.3 – Schematic representation of the molecules’ structure of the compound used in the surface
sizing: (a) cationic starch; (b) Co-styrene-acrylate; (c) Co-styrene-maleic anhydride; (d)
Co-acrylonitrile-acrylate; (e) Co-styrene-maleic anhydride; (f) Quaternary ditallow
methyl epoxypropyl ammonium; (g) Methylated Melamine; (h) Co-styrene-
Physical & Chemical Interactions on Paper Surface – Impact on the Printability of Papers Produced with E. globulus Kraft Pulps ________________________________________________________________________________________________________________________
Isabel M. T. Moutinho ii
dimethylaminopropylamine maleimide; (i) Co-styrene-butyl acrylate; (j) Co-styrene-
acrylate; (k) Co-styrene-acrylate............................................................................................. 37
Figure 4.1 – Different surface texture components (URL 2; URL 3). .......................................................... 43
Figure 4.2 – Exemplification of the deviations from the reference plane for a given profile line
(Gadelmawla et al. 2002). ....................................................................................................... 45
Figure 4.3 – Representation of the surface height deviations for a given profile line: (a) real values;
(b) absolute values (Cohen 2006). ........................................................................................... 46
Figure 4.4 – Typical surface structure, demonstrating peaks and valleys (Cohen 2006). .................... 47
Figure 4.5 - Exemplification of the peaks height and valleys depth measurement for a given profile
line (Gadelmawla et al. 2002)................................................................................................. 48
Figure 4.6 – Example of a surface with an Sds value of 2600 peacks/mm2 (Cohen 2006). .............. 49
Figure 4.7 – Exemplification of the summits identification (Cohen 2006). ............................................... 49
Figure 4.8 – Exemplification of the differentiation between two samples with similar Sa using the
Sdq values (Cohen 2006). ......................................................................................................... 50
Figure 4.9 - Principle of a contacting stylus instrument profilometer: A cantilever (1) is holding a small
tip (2) that is sliding along the horizontal direction (3) over the object's surface (5).
Following the profile the cantilever is moving vertically (4). The vertical position is
recorded as the measured profile (6) shown in light green. ............................................... 52
Figure 4.10 – Schematic representation of the different types for reflection of the incident radiation.
........................................................................................................................................................ 53
Figure 4.11– Schematic representation of the optical profilometer used in this work (Ashori et al.
2008). ............................................................................................................................................ 54
Figure 4.12 – Exemplification of the 3D surface profile (topographic map) obtained from the
profilometry measurements for one of the samples tested: (a) profile without any
mathematical treatment; (b) profile after the leveling operation; (c) profile after form
removal; (d) profile after filtering waviness and roughness; (e) final topographic
profile, after thresholding.......................................................................................................... 56
Figure 4.13 – Exemplification, for one of the samples tested, of all the parameters obtained from
the profilometry measurements performed with Altisurf® 500........................................... 57
Figure 4.14 - Output obtained from each of the profilometry measurements. In this case, for sample
St as an example......................................................................................................................... 58
Figure 4.15 - PCA using the descriptive variables obtained by profilometry. ....................................... 59
Physical & Chemical Interactions on Paper Surface – Impact on the Printability of Papers Produced with E. globulus Kraft Pulps ________________________________________________________________________________________________________________________
Isabel M. T. Moutinho iii
Figure 4.16 - PCA using 7 of the descriptive variables............................................................................... 59
Figure 4.17 – Sa and values obtained for all the paper samples, divided according to the amount of
surface sizing agent added; (a) Sa values for samples with 5% of surface sizing agent;
(b) Sa values of the samples with 10% of surface sizing agent, (c) Sa values of the
samples with 20% of surface sizing agent. Lines delimit the interval (based
on ANOVA) in which the samples are not distinguishable from the St sample................ 61
Figure 4.18 – Influence of the surface sizing agent concentration in the Sa values; (a) surface sizing
agent S1; (b) surface sizing agent S4, (c) surface sizing agent S5, (d) surface sizing
agent S7........................................................................................................................................ 62
Figure 4.19 – Str values obtained for all the samples. ............................................................................... 64
Figure 5.1 – Schematic representation of a penetrometer used in mercury intrusion porosimetry (URL1
2008). It is constituted by a small reservoir where the sample is placed and a long
stem. All this is full of mercury at the lowest pressure. As pressure is increased, mercury
penetrates into the sample pores (intrusion) and the length of penetrometer stem that is
filled with mercury decreases. The difference in mercury level corresponds to the
volume intruded in the sample. ................................................................................................. 69
Figure 5.2 – Mercury porosimeter AutoPore IV 9500. ................................................................................ 70
Figure 5.3 - Differential (a) and cumulative (b) pore size distribution diagrams for sample St.......... 72
Figure 5.4 – Differential (a) and cumulative (b) pore size distribution diagrams for samples St, StS6-
05, StS6-10 and StS6-20.......................................................................................................... 72
Figure 5.5 – Total porosity values obtained for all paper samples. ........................................................ 74
Figure 5.6 – Total porosity values, compared with sample St, of the samples (a) with 5% of surface
sizing agent; (b) with 10% of Surface sizing agent; (c) with 20% of surface sizing
agent. The dashed lines delimit the interval (based on ANOVA) in which the
samples are not distinguishable from the St sample............................................................. 74
Figure 6.1 – Schematic representation of paper-ink interaction. .............................................................. 79
Figure 6.2 – Contact angle formation on a solid surface according to the Young equation................ 80
Figure 6.3 – Representation of the possible wetting situations: (a) non wetting, (b) partial wetting
and (c) complete wetting............................................................................................................ 80
Figure 6.4 – Equipment used for the contact angle measurement - OCA 20 from Dataphysics. ........ 87
Physical & Chemical Interactions on Paper Surface – Impact on the Printability of Papers Produced with E. globulus Kraft Pulps ________________________________________________________________________________________________________________________
Isabel M. T. Moutinho iv
Figure 6.5 – Schematic representation of the surface roughness influence in contact angle values. .. 89
Figure 6.6 – Schematic representation of a drop on a rough surface according to Cassei model..... 90
Figure 6.7 - Schematic representation of a drop on a rough surface according to Wenzel. .............. 90
Figure 6.8 - Comparison of the contact angle values before and after the application of the Wenzel
correction for water (a) and diodomethane (b). ................................................................... 94
Figure 6.9 - Contact angle values with water, measured for the reference samples and the samples
sized with the addition of 5% of synthetic surface sizing agent. ....................................... 95
Figure 6.10 – Influence of the amount of the sizing agent on the contact angle values measured with
the liquids tested (water, formamide, ethileneghycol, propileneglycol and
diodomethane). ............................................................................................................................ 96
Figure 6.11 - Graphical representation of the polar and dispersive components of the surface
energy for the various samples tested. ................................................................................... 98
Figure 6.12 – Normalized values (relative to the standard sample) of the total surface free energy
(a), dispersive component (b) and polar component (c) of the paper samples............... 99
Figure 6.13 – Polar component of the surface free energy for all the samples tested. .....................100
Figure 6.14 - Variation of the water contact angle with the polar component of the surface energy.
......................................................................................................................................................102
Figure 6.15 – Water contact angle variation for sample St, normalized relatively to the initial value
(t=0) .............................................................................................................................................106
Figure 6.16 – Normalized (relatively to the initial values (t=0)) drop base diameters and drop
volume values for sample St....................................................................................................106
Figure 6.17 – Normalized contact angle and normalized drop volume for sample StS4-05............107
Figure 6.18 – Normalized contact angle for samples sized with the synthetic surface sizing agent S2.
......................................................................................................................................................108
Figure 6.19 – Normalized drop base diameter and drop volume for the samples sized with the
synthetic surface sizing agent S2............................................................................................109
Figure 6.20 – Comparison of the normalized water contact angle values of the sizing agents S2 and
S4 for the three different incorporation percentages (5%, 10% and 20%). ...............110
Figure 6.21 – Comparison of the normalized drop base diameter and drop volume for the samples
sized with the synthetic surface sizing agents S2 and S4. .................................................110
Physical & Chemical Interactions on Paper Surface – Impact on the Printability of Papers Produced with E. globulus Kraft Pulps ________________________________________________________________________________________________________________________
Isabel M. T. Moutinho v
Figure 6.22 - Normalized contact angle for samples sized with the synthetic surface sizing agent S9.
......................................................................................................................................................111
Figure 6.23 - Normalized drop base diameter and drop volume for the samples sized with the
synthetic surface sizing agent S9............................................................................................111
Figure 6.24 - Comparison of the normalized contact angle values at each incorporation percentage
for the sizing agents S9 and S1. ............................................................................................112
Figure 7.1 – Schematic representation of conventional gas chromatography (GC) and inverse gas
chromatography (IGC) analysis..............................................................................................117
Figure 7.2 – Schematic representation of the method used to calculate σSD at a given temperature
using IGC.....................................................................................................................................121
Figure 7.3 - Schematic representation of the calculation method for the ∆Η and the ∆S determination
at a given temperatures using IGC........................................................................................122
Figure 7.4 - Schematic representation of the calculation method for the Ka and Kb determination
using IGC.....................................................................................................................................123
Figure 7.5 – Gas chromatograph DANI GC1000, used in the IGC measurements..............................123
Figure 7.6 –Preparation of samples for IGC measurements: (a) pieces of a paper sample prepared
to be packed into the IGC column; (b) Experimental assembly used for packing the
columns; (c) ICG column packed and folded, ready to be introduced into the equipment.
......................................................................................................................................................124
Figure 7.7 – Exemplification of the output undertaken after the injection of a probe into the IGC
column: peak obtained for sample StS3-10 after the injection of C7 at 45ºC.............126
Figure 7.8 – Retention times obtained at 35ºC with the n-alkanes for the reference sample and for
the samples with 10% of the different surface sizing agents...........................................127
Figure 7.9 - Retention times obtained at 35ºC with the polar probes for the reference sample and
for the samples with 10% of the different surface sizing agents ....................................128
Figure 7.10 –Relation between the retention time of the polar probes and their AN* values plotted
for samples S1, S3, S5 and S7 at 45ºC (the information is divided in two plots for
easier visualization)...................................................................................................................128
Figure 7.11 – Effect of temperature on the retention times measured with the non-polar probes. ..129
Figure 7.12 - Effect of temperature on the retention times measured with the polar probes. ..........129
Physical & Chemical Interactions on Paper Surface – Impact on the Printability of Papers Produced with E. globulus Kraft Pulps ________________________________________________________________________________________________________________________
Isabel M. T. Moutinho vi
Figure 7.13 - Effect of temperature on the retention times obtained with C9 for all the samples. ..130
Figure 7.14 - Effect of temperature in the retention times obtained with ETA for all the samples. ..130
Figure 7.15 – Influence of the temperature on the dispersive component of the surface free energy,
for the samples sized with 5% incorporation of synthetic sizing agents (the straight line
indicates the behavior of sample St). ....................................................................................131
Figure 7.16 - Variation of σSD with concentration and temperature for he samples sized with the
surface sizing agents S2 and S4 (St sample is also included, as reference)..................134
Figure 7.17 – Comparison of the σSD values calculated from the contact angle measurements and
from the extrapolation of the IGC data (based on the correlations of Table 7.2)......135
Figure 7.18 – Values σSD (normalized relatively to the reference sample, St) determined for all the
samples tested: (a) by contact angle method; (b) by IGC (using the regressions of Table
7.3). ..............................................................................................................................................136
Figure 7.19 – Values of Ka and Kb computed from the IGC measurements for the different sizing
agents and different concentrations. .....................................................................................137
Figure 8.1 – Example of (a) continuous and (b) Drop on Demand inkjet printers.................................144
Figure 8.2 – Schematic representation of the continuous inkjet printing system....................................144
Figure 8.3 - Schematic representation of the thermal inkjet DoD printing system................................145
Figure 8.4 - Schematic representation of the piezoelectric inkjet DoD printing system.......................145
Figure 8.5 - Schematic representation of the light beams involved in the optical density measurement.
......................................................................................................................................................148
Figure 8.6 – Representation of the CIELAB color space. ...........................................................................149
Figure 8.7 - Exemplification of Gamut Area’s Graphic representation. ................................................150
Figure 8.8 – Exemplification of feathering of a printed area. ................................................................150
Figure 8.9– Mask printed in the paper samples for the printing quality evaluation. ..........................152
Figure 8.10 – PCA for all the printing quality parameters.......................................................................154
Figure 8.11 – PCA using 4 printing quality parameters............................................................................154
Figure 8.12 – Optical density values achieved for black color. The lines delimit the range in which it
is considered that the samples can not be clearly differentiated from the St sample.155
Physical & Chemical Interactions on Paper Surface – Impact on the Printability of Papers Produced with E. globulus Kraft Pulps ________________________________________________________________________________________________________________________
Isabel M. T. Moutinho vii
Figure 8.13 - Optical density values achieved for yellow color. The lines delimit the range in which it
is considered that the samples can not be clearly differentiated from the St sample.156
Figure 8.14 – Identification of the samples whose behavior in terms of black and yellow optical
densities is improved by the addition of the synthetic surface sizing agents to the sizing
formulation. .................................................................................................................................157
Figure 8.15 – Gamut area values. The dashed line in the figure corresponds to the Gamut area
value achieved for sample St. ................................................................................................157
Figure 8.16 – Gain values. The line in the figure refers to the value achieved for the St sample....158
Figure 8.17 – Results achieved from the numerical treatment of the subjective printing quality
evaluation (the dashed line indicates the score of sample St). .........................................159

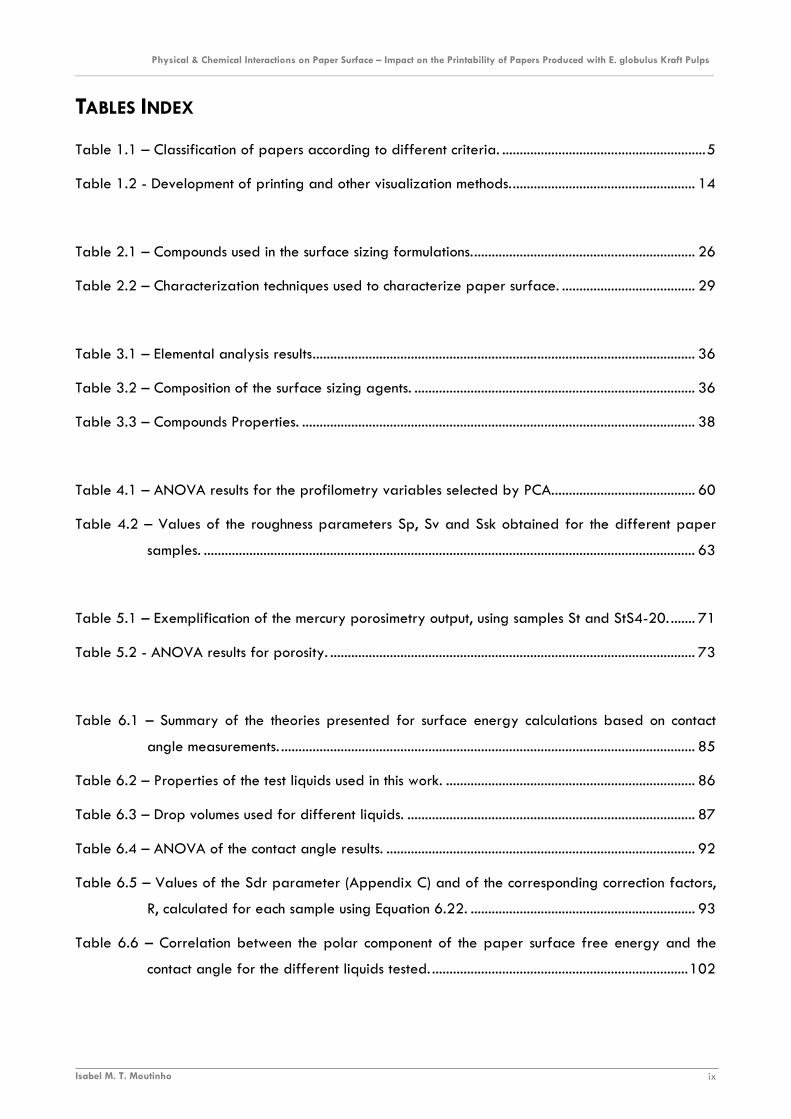
Physical & Chemical Interactions on Paper Surface – Impact on the Printability of Papers Produced with E. globulus Kraft Pulps ________________________________________________________________________________________________________________________
Isabel M. T. Moutinho ix
TABLES INDEX
Table 1.1 – Classification of papers according to different criteria. ..........................................................5
Table 1.2 - Development of printing and other visualization methods..................................................... 14
Table 2.1 – Compounds used in the surface sizing formulations................................................................ 26
Table 2.2 – Characterization techniques used to characterize paper surface. ...................................... 29
Table 3.1 – Elemental analysis results............................................................................................................. 36
Table 3.2 – Composition of the surface sizing agents. ................................................................................ 36
Table 3.3 – Compounds Properties. ................................................................................................................ 38
Table 4.1 – ANOVA results for the profilometry variables selected by PCA......................................... 60
Table 4.2 – Values of the roughness parameters Sp, Sv and Ssk obtained for the different paper
samples. ............................................................................................................................................ 63
Table 5.1 – Exemplification of the mercury porosimetry output, using samples St and StS4-20. ....... 71
Table 5.2 - ANOVA results for porosity. ........................................................................................................ 73
Table 6.1 – Summary of the theories presented for surface energy calculations based on contact
angle measurements. ...................................................................................................................... 85
Table 6.2 – Properties of the test liquids used in this work. ....................................................................... 86
Table 6.3 – Drop volumes used for different liquids. .................................................................................. 87
Table 6.4 – ANOVA of the contact angle results. ........................................................................................ 92
Table 6.5 – Values of the Sdr parameter (Appendix C) and of the corresponding correction factors,
R, calculated for each sample using Equation 6.22. ................................................................ 93
Table 6.6 – Correlation between the polar component of the paper surface free energy and the
contact angle for the different liquids tested. .........................................................................102
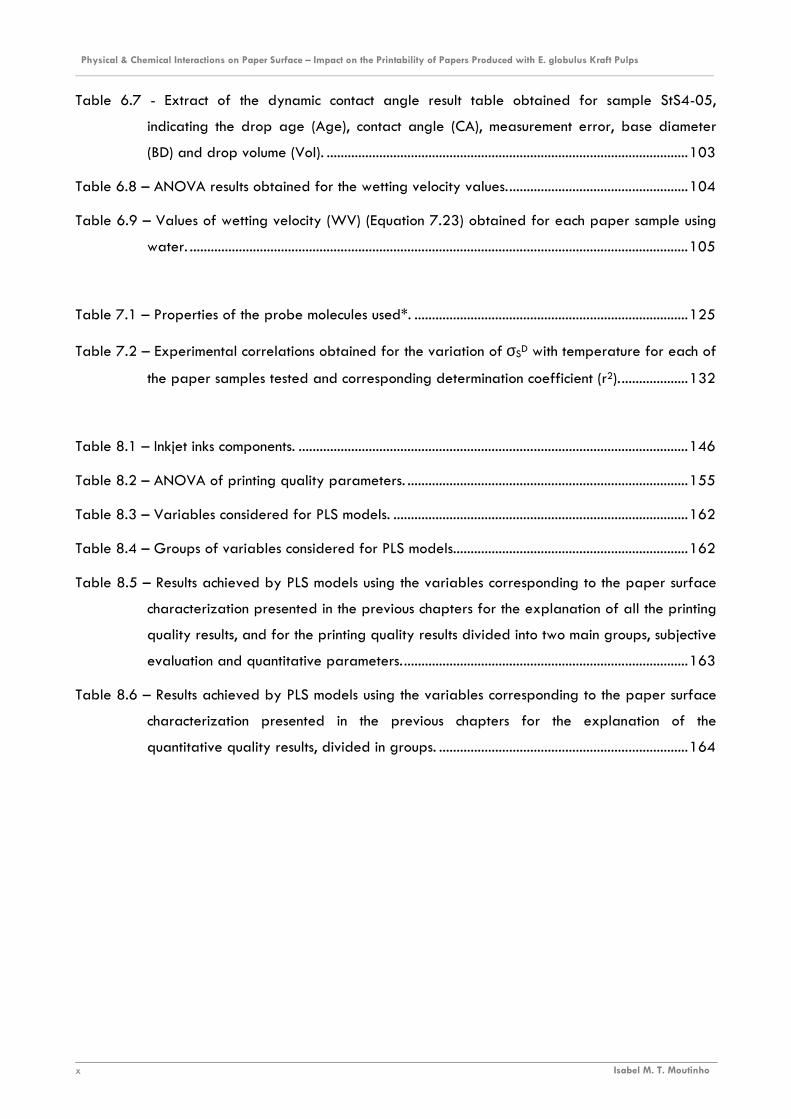
Physical & Chemical Interactions on Paper Surface – Impact on the Printability of Papers Produced with E. globulus Kraft Pulps ________________________________________________________________________________________________________________________
Isabel M. T. Moutinho x
Table 6.7 - Extract of the dynamic contact angle result table obtained for sample StS4-05,
indicating the drop age (Age), contact angle (CA), measurement error, base diameter
(BD) and drop volume (Vol). .......................................................................................................103
Table 6.8 – ANOVA results obtained for the wetting velocity values....................................................104
Table 6.9 – Values of wetting velocity (WV) (Equation 7.23) obtained for each paper sample using
water. ..............................................................................................................................................105
Table 7.1 – Properties of the probe molecules used*. ..............................................................................125
Table 7.2 – Experimental correlations obtained for the variation of σSD with temperature for each of
the paper samples tested and corresponding determination coefficient (r2)....................132
Table 8.1 – Inkjet inks components. ...............................................................................................................146
Table 8.2 – ANOVA of printing quality parameters. ................................................................................155
Table 8.3 – Variables considered for PLS models. ....................................................................................162
Table 8.4 – Groups of variables considered for PLS models...................................................................162
Table 8.5 – Results achieved by PLS models using the variables corresponding to the paper surface
characterization presented in the previous chapters for the explanation of all the printing
quality results, and for the printing quality results divided into two main groups, subjective
evaluation and quantitative parameters..................................................................................163
Table 8.6 – Results achieved by PLS models using the variables corresponding to the paper surface
characterization presented in the previous chapters for the explanation of the
quantitative quality results, divided in groups. .......................................................................164
APPENDIX

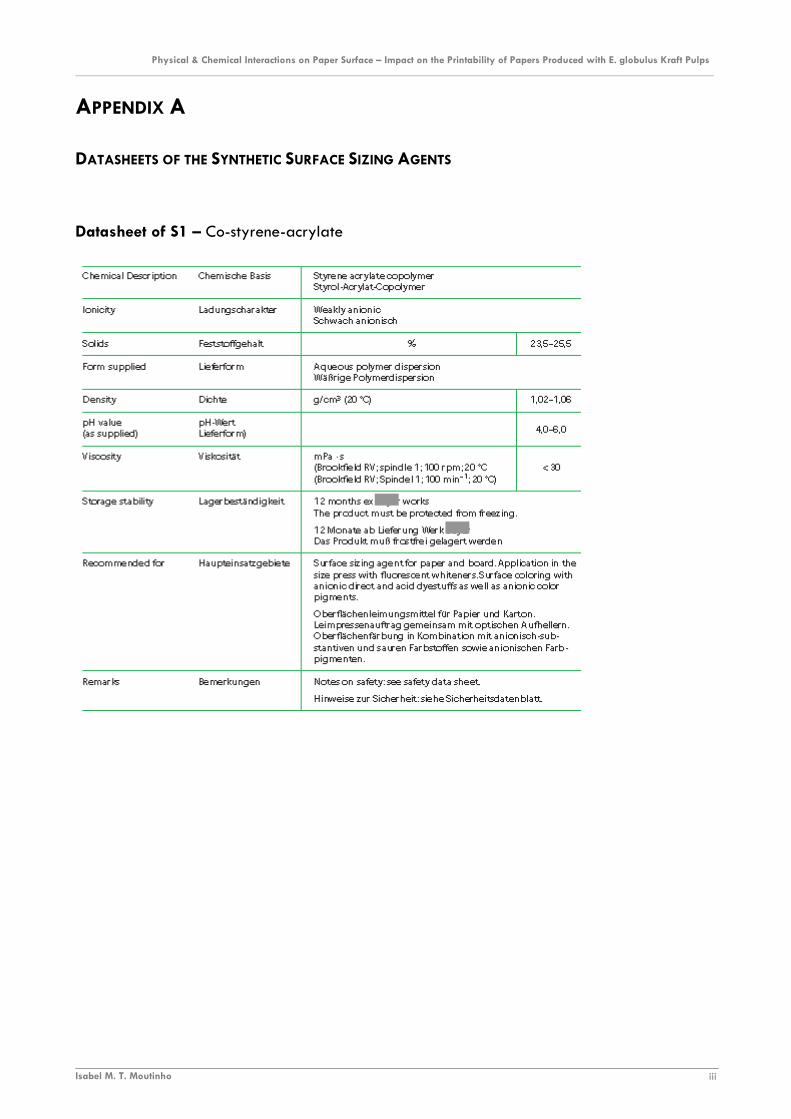
Physical & Chemical Interactions on Paper Surface – Impact on the Printability of Papers Produced with E. globulus Kraft Pulps ________________________________________________________________________________________________________________________
Isabel M. T. Moutinho iii
APPENDIX A
DATASHEETS OF THE SYNTHETIC SURFACE SIZING AGENTS
Datasheet of S1 – Co-styrene-acrylate
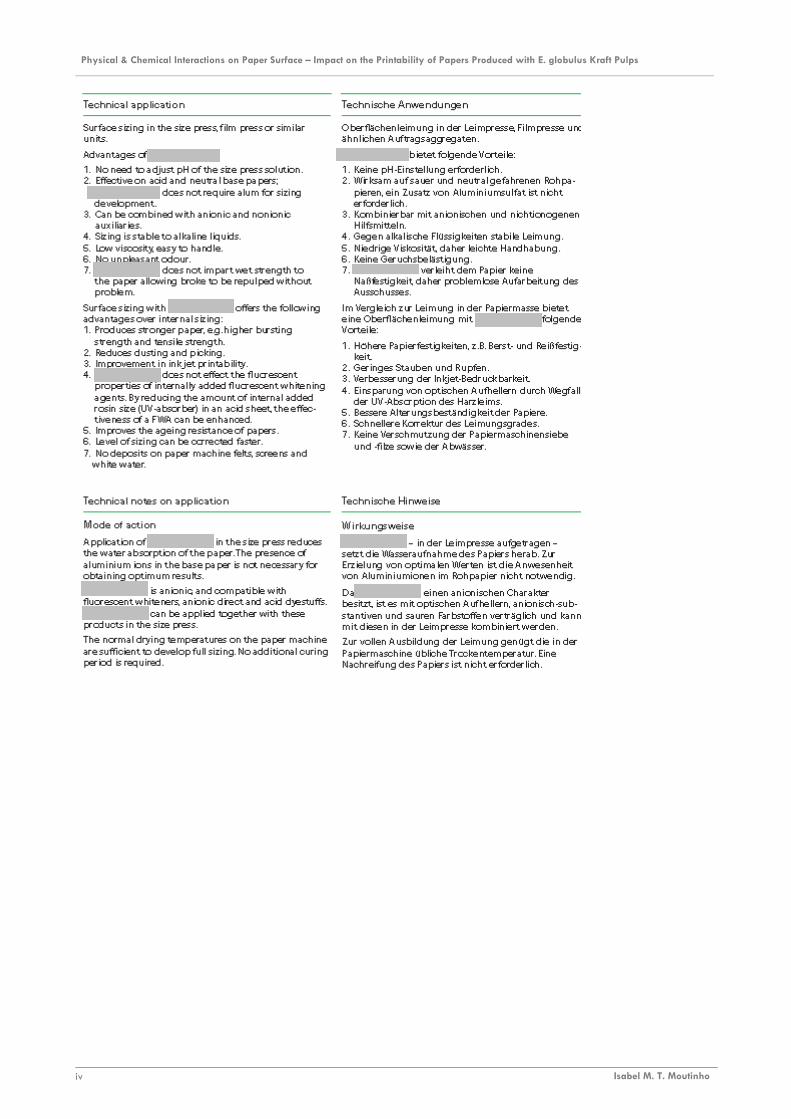
Physical & Chemical Interactions on Paper Surface – Impact on the Printability of Papers Produced with E. globulus Kraft Pulps ________________________________________________________________________________________________________________________
Isabel M. T. Moutinho iv

Physical & Chemical Interactions on Paper Surface – Impact on the Printability of Papers Produced with E. globulus Kraft Pulps ________________________________________________________________________________________________________________________
Isabel M. T. Moutinho v
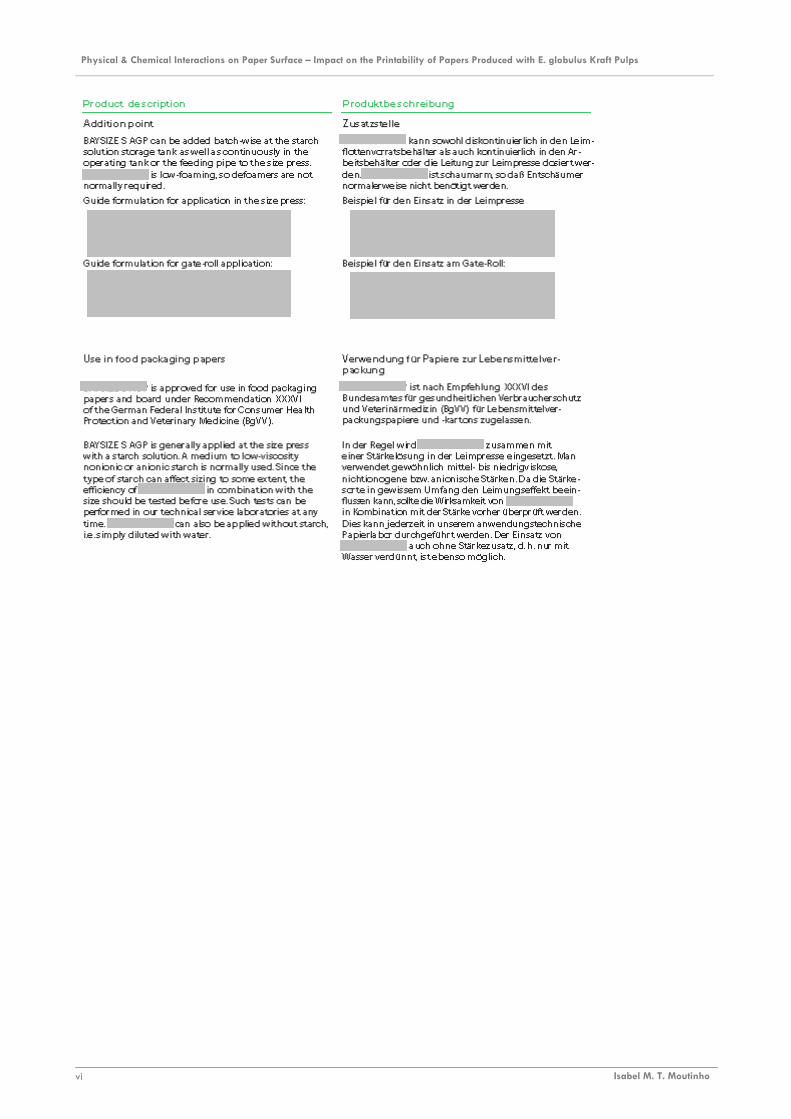
Physical & Chemical Interactions on Paper Surface – Impact on the Printability of Papers Produced with E. globulus Kraft Pulps ________________________________________________________________________________________________________________________
Isabel M. T. Moutinho vi

Physical & Chemical Interactions on Paper Surface – Impact on the Printability of Papers Produced with E. globulus Kraft Pulps ________________________________________________________________________________________________________________________
Isabel M. T. Moutinho vii
Datasheet of S2 – Co-styrene-maleic anhydride
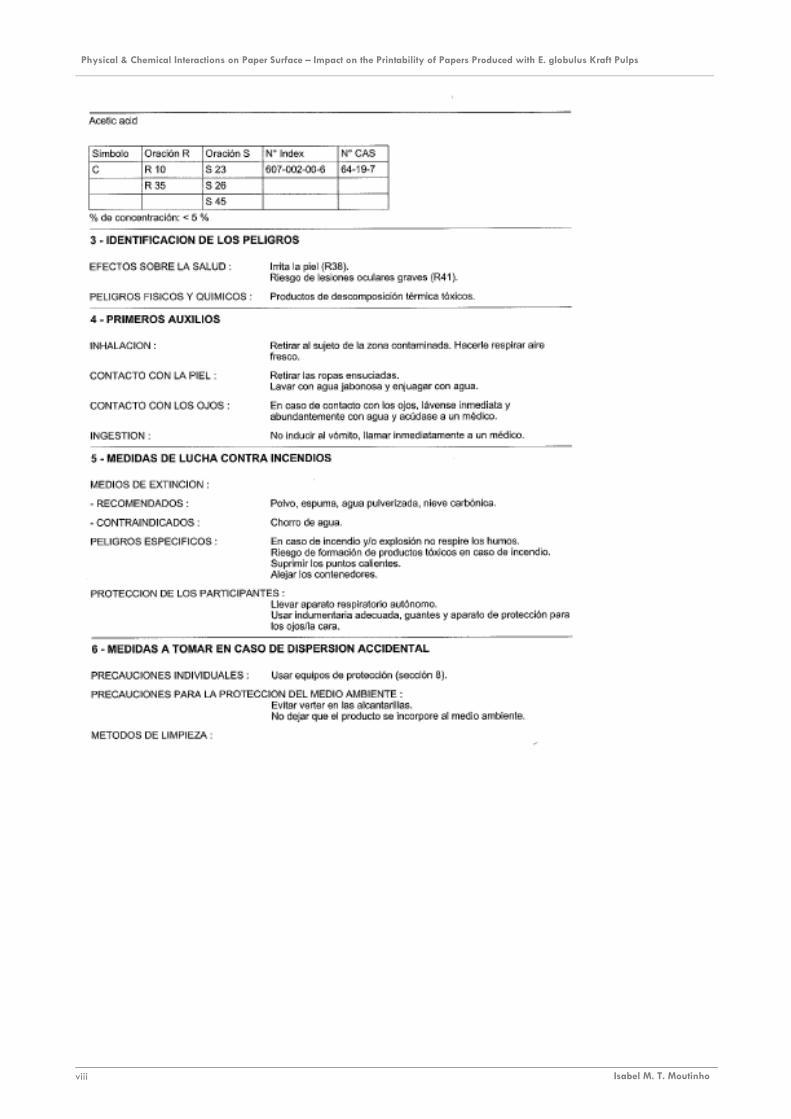
Physical & Chemical Interactions on Paper Surface – Impact on the Printability of Papers Produced with E. globulus Kraft Pulps ________________________________________________________________________________________________________________________
Isabel M. T. Moutinho viii
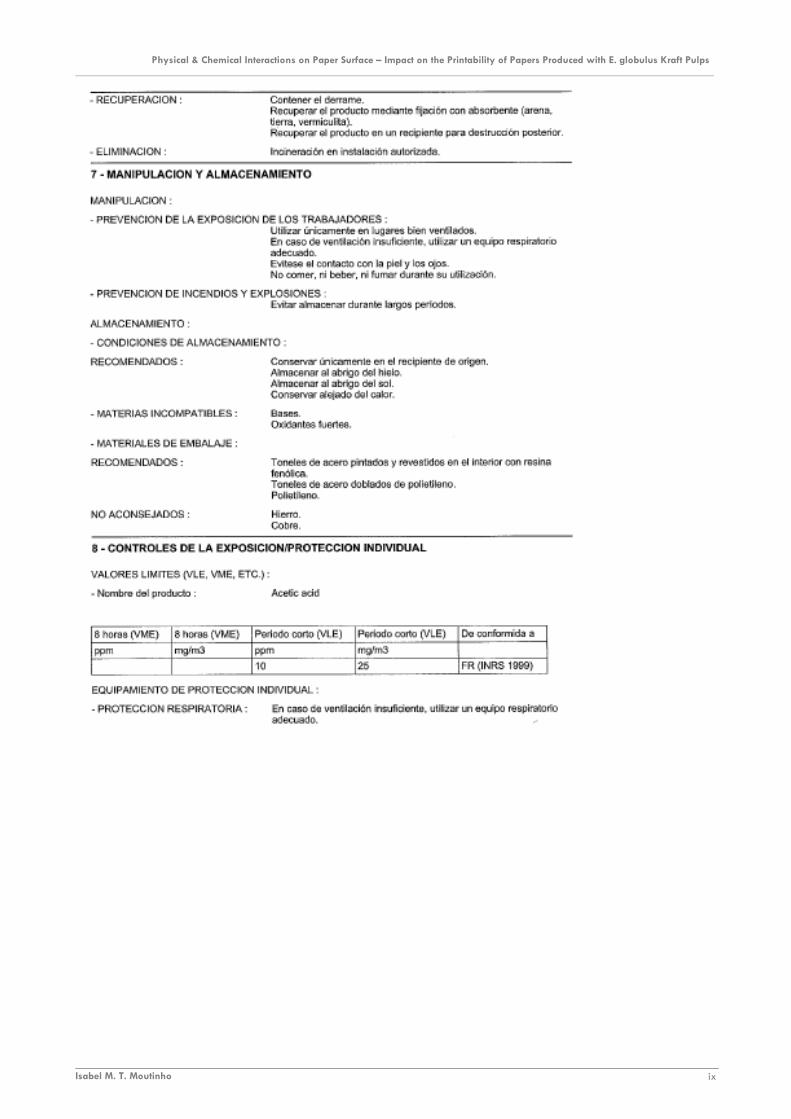
Physical & Chemical Interactions on Paper Surface – Impact on the Printability of Papers Produced with E. globulus Kraft Pulps ________________________________________________________________________________________________________________________
Isabel M. T. Moutinho ix
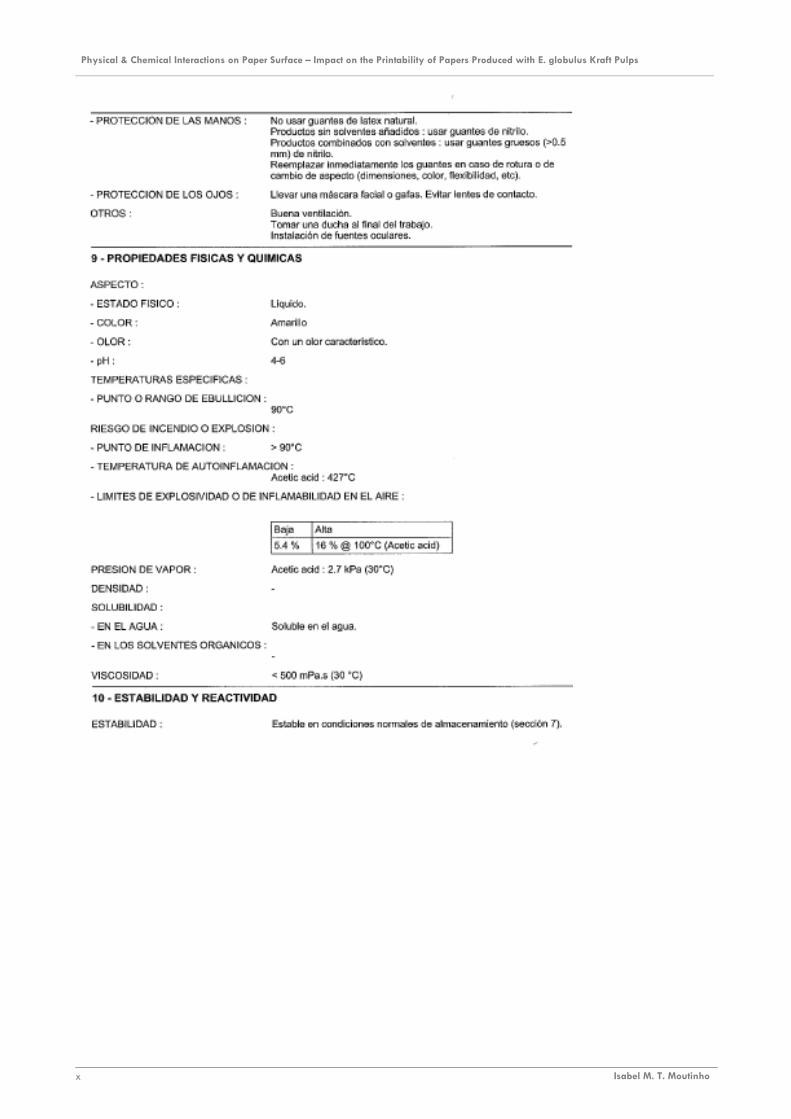
Physical & Chemical Interactions on Paper Surface – Impact on the Printability of Papers Produced with E. globulus Kraft Pulps ________________________________________________________________________________________________________________________
Isabel M. T. Moutinho x

Physical & Chemical Interactions on Paper Surface – Impact on the Printability of Papers Produced with E. globulus Kraft Pulps ________________________________________________________________________________________________________________________
Isabel M. T. Moutinho xi

Physical & Chemical Interactions on Paper Surface – Impact on the Printability of Papers Produced with E. globulus Kraft Pulps ________________________________________________________________________________________________________________________
Isabel M. T. Moutinho xii
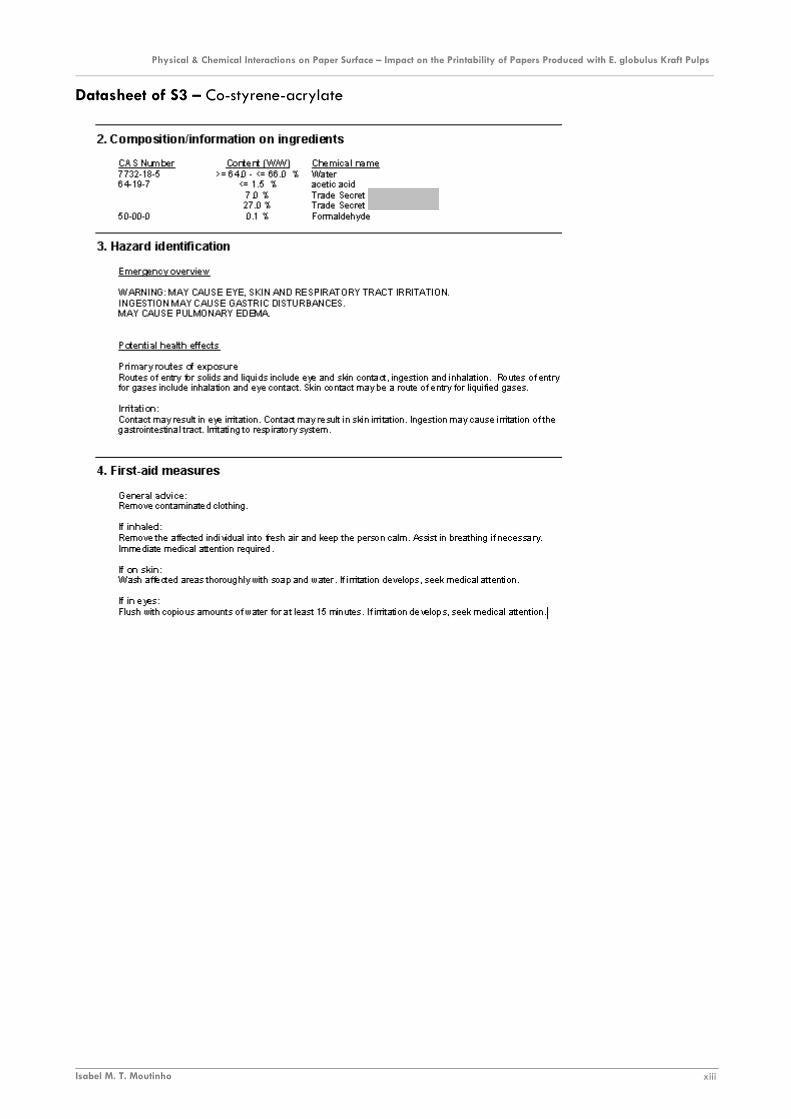
Physical & Chemical Interactions on Paper Surface – Impact on the Printability of Papers Produced with E. globulus Kraft Pulps ________________________________________________________________________________________________________________________
Isabel M. T. Moutinho xiii
Datasheet of S3 – Co-styrene-acrylate
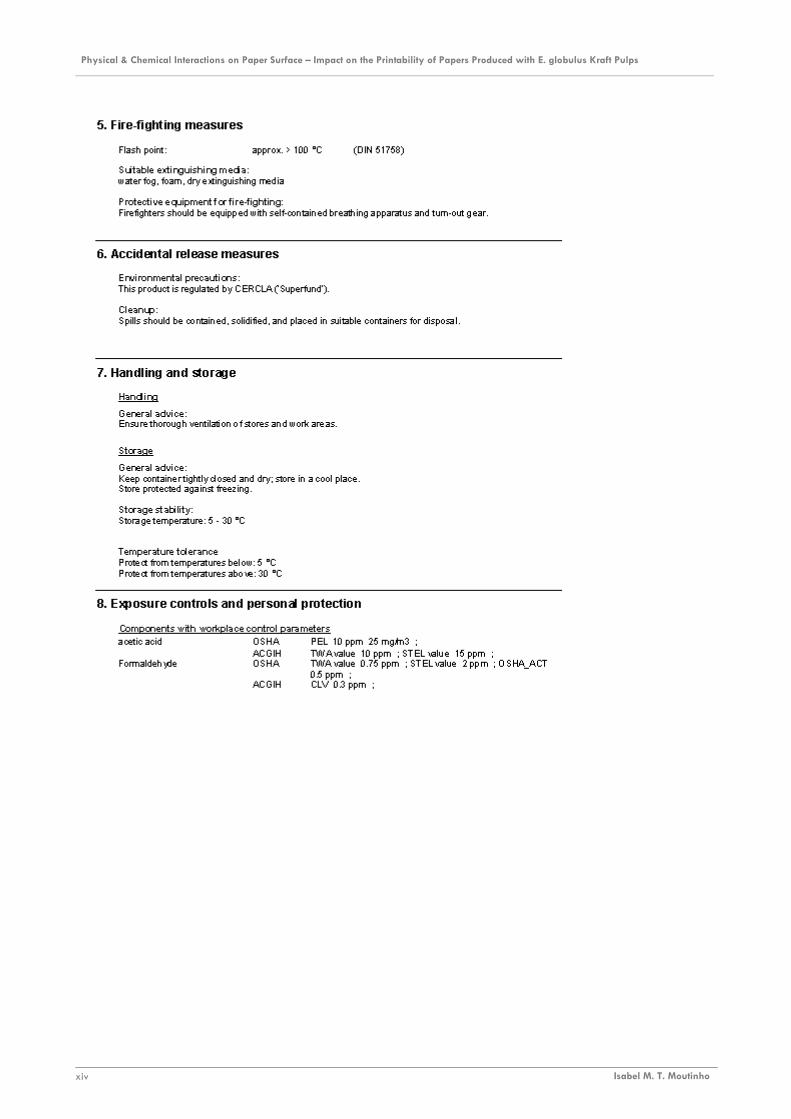
Physical & Chemical Interactions on Paper Surface – Impact on the Printability of Papers Produced with E. globulus Kraft Pulps ________________________________________________________________________________________________________________________
Isabel M. T. Moutinho xiv
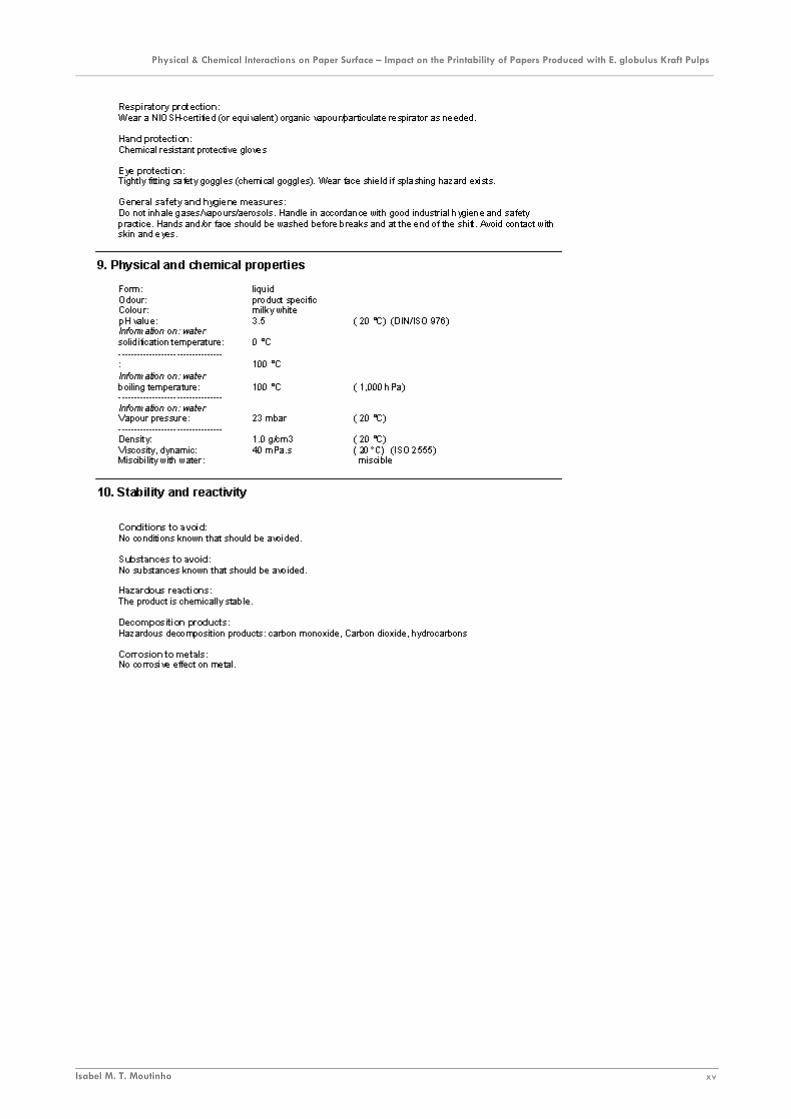
Physical & Chemical Interactions on Paper Surface – Impact on the Printability of Papers Produced with E. globulus Kraft Pulps ________________________________________________________________________________________________________________________
Isabel M. T. Moutinho xv
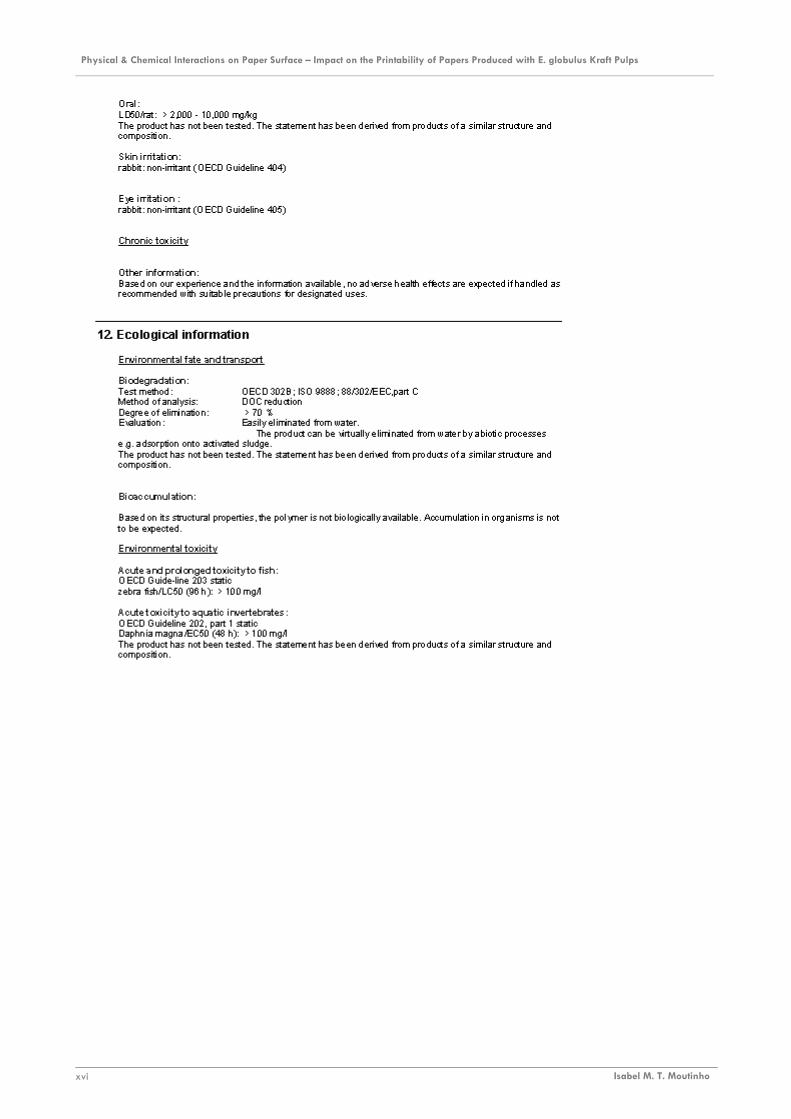
Physical & Chemical Interactions on Paper Surface – Impact on the Printability of Papers Produced with E. globulus Kraft Pulps ________________________________________________________________________________________________________________________
Isabel M. T. Moutinho xvi
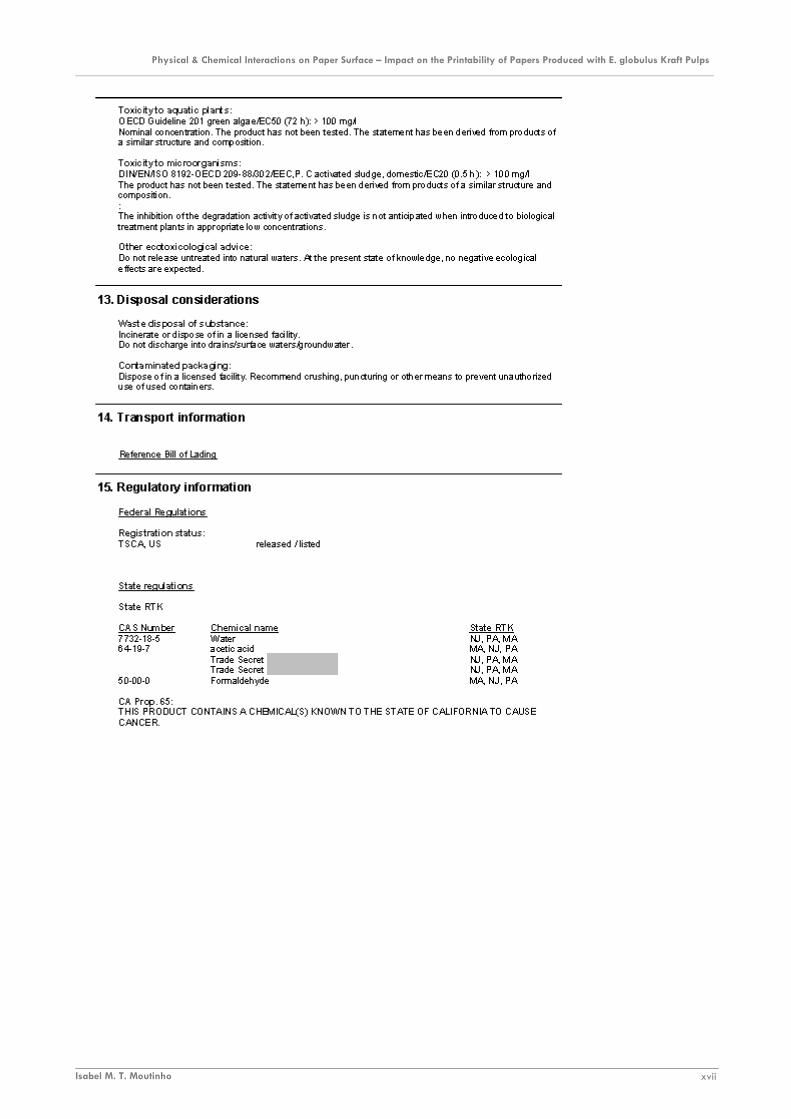
Physical & Chemical Interactions on Paper Surface – Impact on the Printability of Papers Produced with E. globulus Kraft Pulps ________________________________________________________________________________________________________________________
Isabel M. T. Moutinho xvii
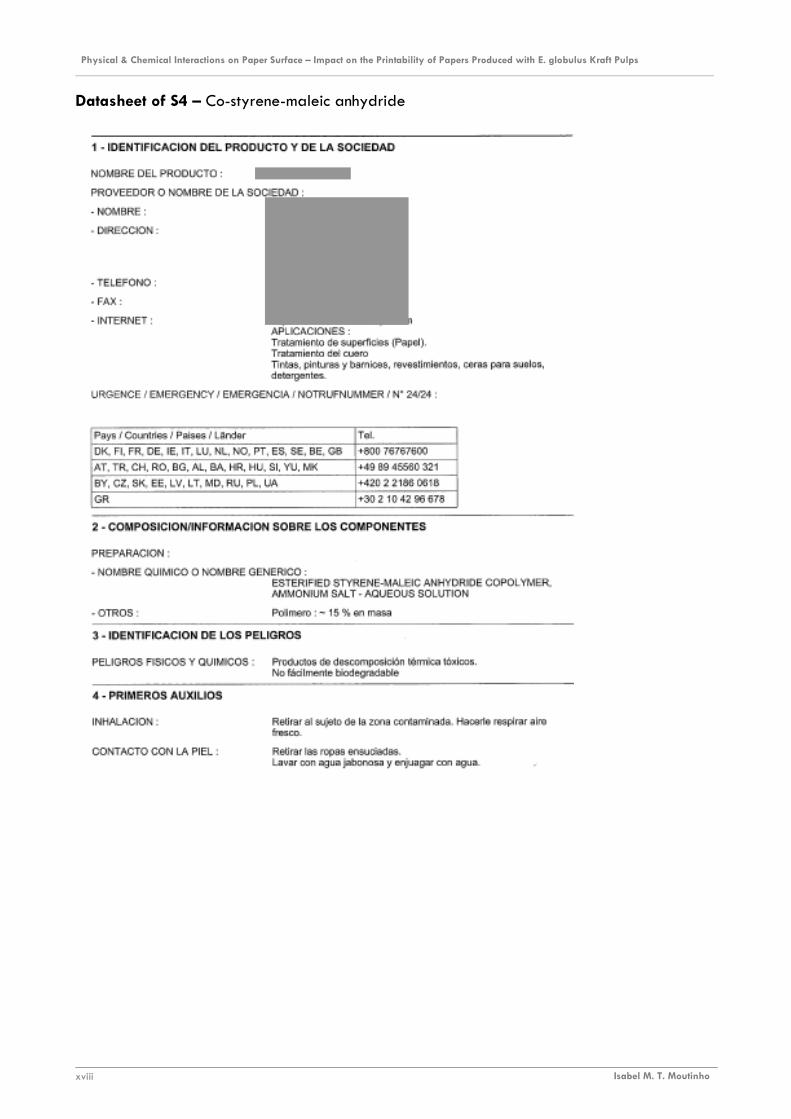
Physical & Chemical Interactions on Paper Surface – Impact on the Printability of Papers Produced with E. globulus Kraft Pulps ________________________________________________________________________________________________________________________
Isabel M. T. Moutinho xviii
Datasheet of S4 – Co-styrene-maleic anhydride
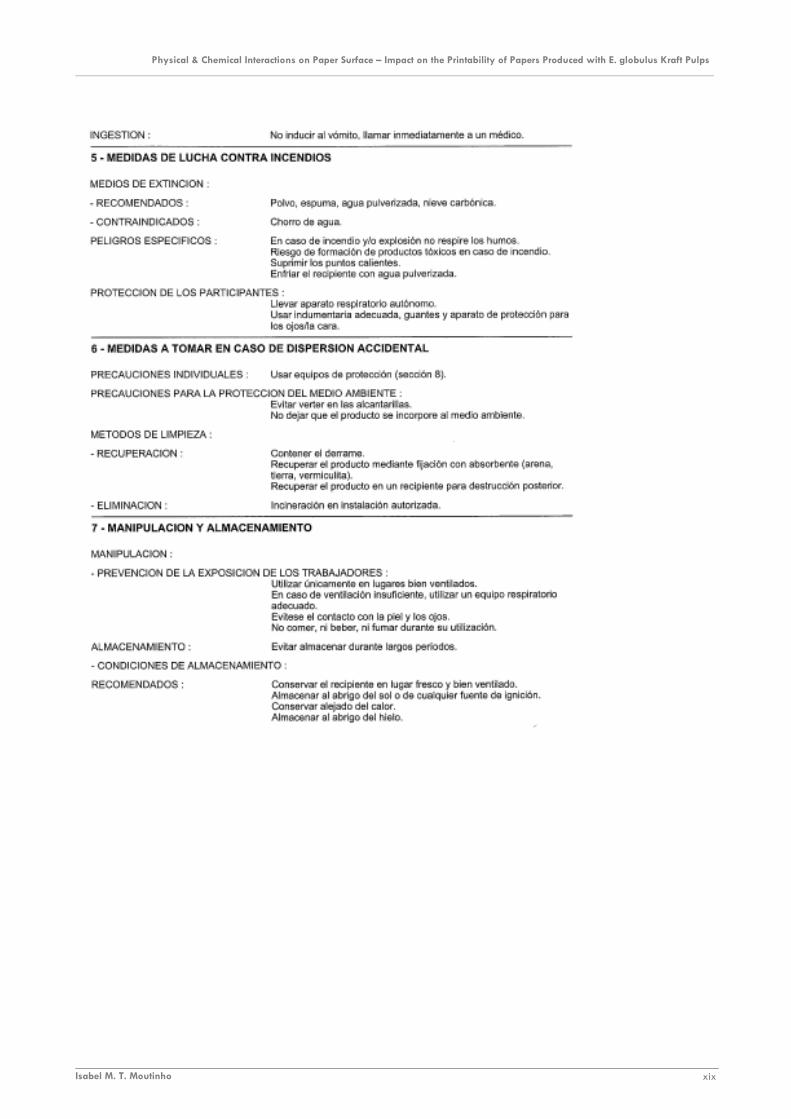
Physical & Chemical Interactions on Paper Surface – Impact on the Printability of Papers Produced with E. globulus Kraft Pulps ________________________________________________________________________________________________________________________
Isabel M. T. Moutinho xix

Physical & Chemical Interactions on Paper Surface – Impact on the Printability of Papers Produced with E. globulus Kraft Pulps ________________________________________________________________________________________________________________________
Isabel M. T. Moutinho xx

Physical & Chemical Interactions on Paper Surface – Impact on the Printability of Papers Produced with E. globulus Kraft Pulps ________________________________________________________________________________________________________________________
Isabel M. T. Moutinho xxi
Datasheet of S6 – Methylated Melamine
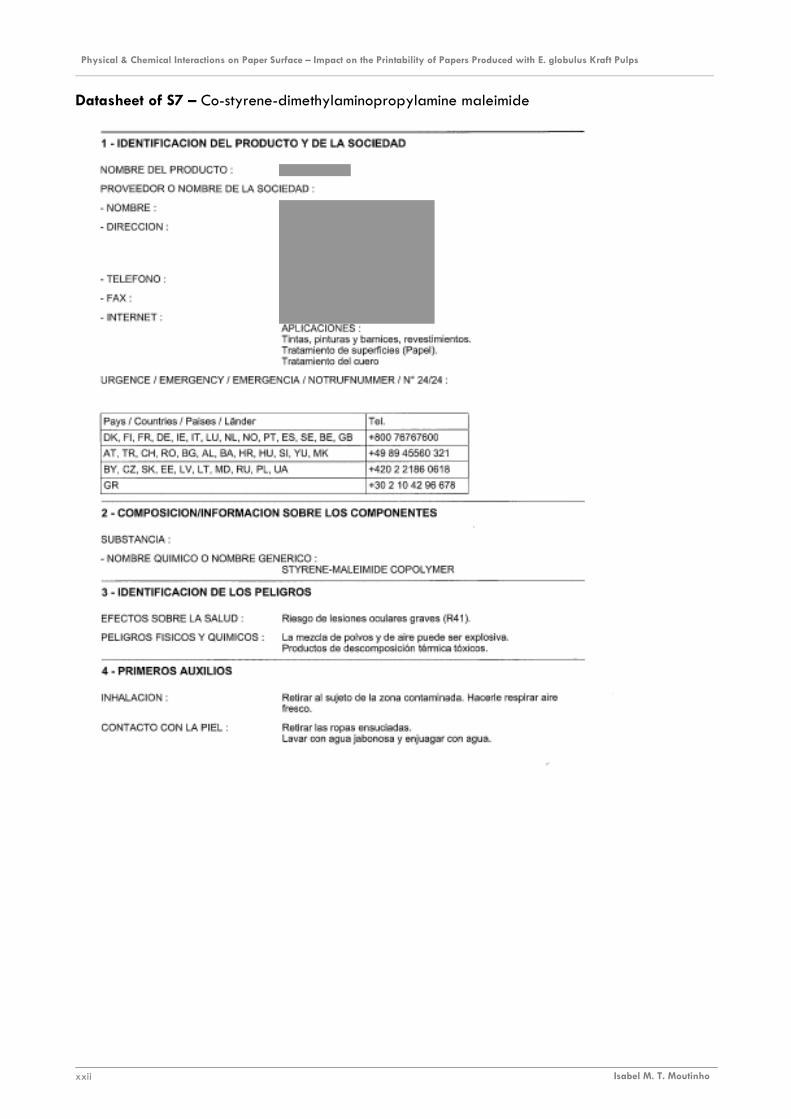
Physical & Chemical Interactions on Paper Surface – Impact on the Printability of Papers Produced with E. globulus Kraft Pulps ________________________________________________________________________________________________________________________
Isabel M. T. Moutinho xxii
Datasheet of S7 – Co-styrene-dimethylaminopropylamine maleimide

Physical & Chemical Interactions on Paper Surface – Impact on the Printability of Papers Produced with E. globulus Kraft Pulps ________________________________________________________________________________________________________________________
Isabel M. T. Moutinho xxiii

Physical & Chemical Interactions on Paper Surface – Impact on the Printability of Papers Produced with E. globulus Kraft Pulps ________________________________________________________________________________________________________________________
Isabel M. T. Moutinho xxiv
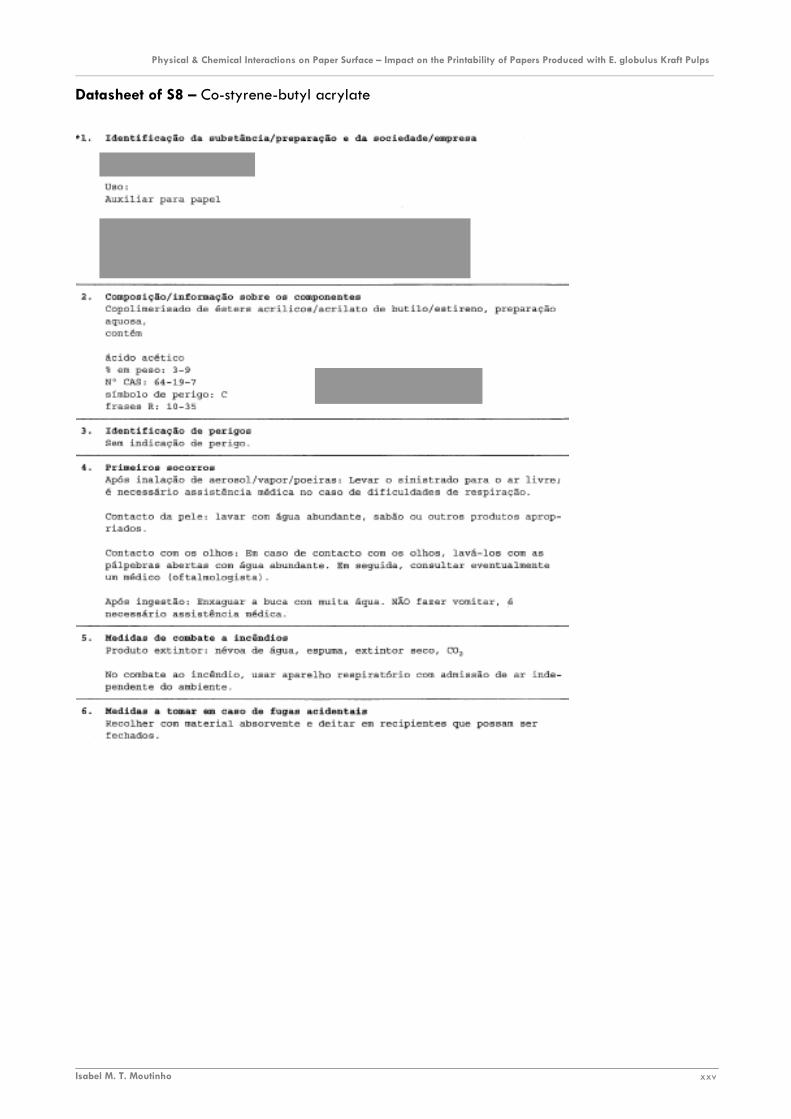
Physical & Chemical Interactions on Paper Surface – Impact on the Printability of Papers Produced with E. globulus Kraft Pulps ________________________________________________________________________________________________________________________
Isabel M. T. Moutinho xxv
Datasheet of S8 – Co-styrene-butyl acrylate
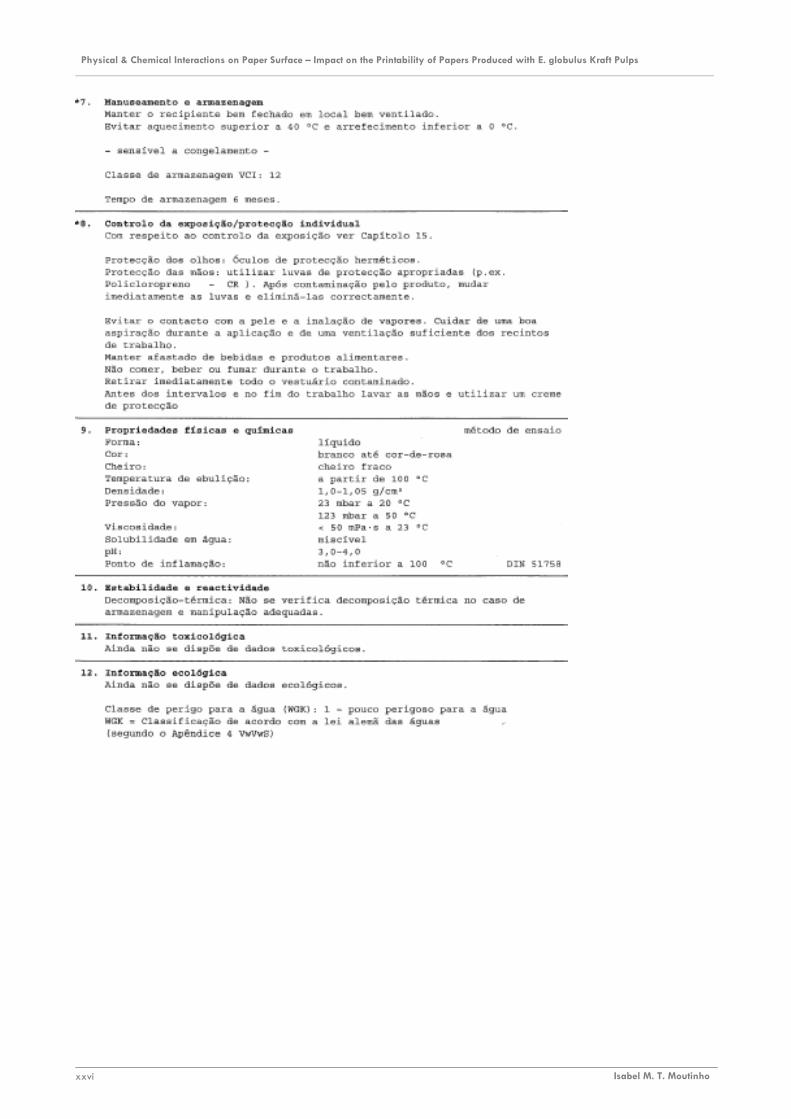
Physical & Chemical Interactions on Paper Surface – Impact on the Printability of Papers Produced with E. globulus Kraft Pulps ________________________________________________________________________________________________________________________
Isabel M. T. Moutinho xxvi
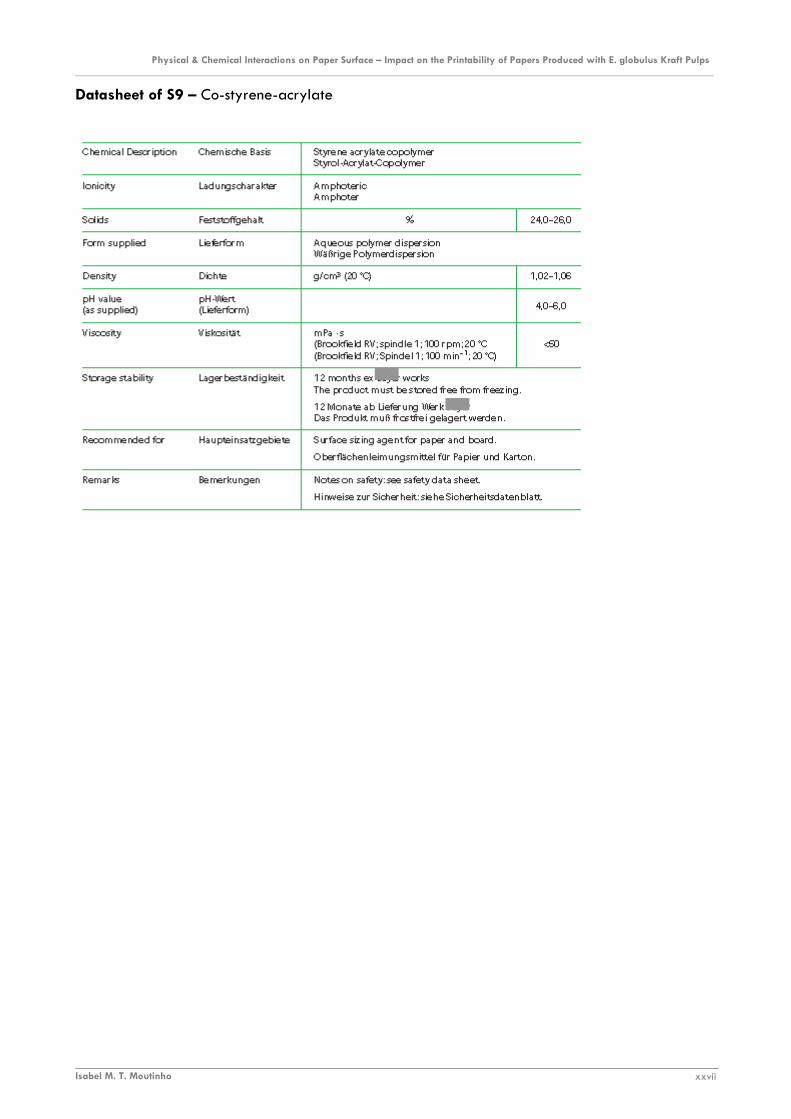
Physical & Chemical Interactions on Paper Surface – Impact on the Printability of Papers Produced with E. globulus Kraft Pulps ________________________________________________________________________________________________________________________
Isabel M. T. Moutinho xxvii
Datasheet of S9 – Co-styrene-acrylate
Physical & Chemical Interactions on Paper Surface – Impact on the Printability of Papers Produced with E. globulus Kraft Pulps ________________________________________________________________________________________________________________________
Isabel M. T. Moutinho xxviii
Physical & Chemical Interactions on Paper Surface – Impact on the Printability of Papers Produced with E. globulus Kraft Pulps ________________________________________________________________________________________________________________________
Isabel M. T. Moutinho xxix

Physical & Chemical Interactions on Paper Surface – Impact on the Printability of Papers Produced with E. globulus Kraft Pulps ________________________________________________________________________________________________________________________
Isabel M. T. Moutinho xxx

Physical & Chemical Interactions on Paper Surface – Impact on the Printability of Papers Produced with E. globulus Kraft Pulps ________________________________________________________________________________________________________________________
Isabel M. T. Moutinho xxxi
Datasheet of S10 – Co-styrene-acrylate
Physical & Chemical Interactions on Paper Surface – Impact on the Printability of Papers Produced with E. globulus Kraft Pulps ________________________________________________________________________________________________________________________
Isabel M. T. Moutinho xxxii

Physical & Chemical Interactions on Paper Surface – Impact on the Printability of Papers Produced with E. globulus Kraft Pulps ________________________________________________________________________________________________________________________
Isabel M. T. Moutinho xxxiii
Physical & Chemical Interactions on Paper Surface – Impact on the Printability of Papers Produced with E. globulus Kraft Pulps ________________________________________________________________________________________________________________________
Isabel M. T. Moutinho xxxiv
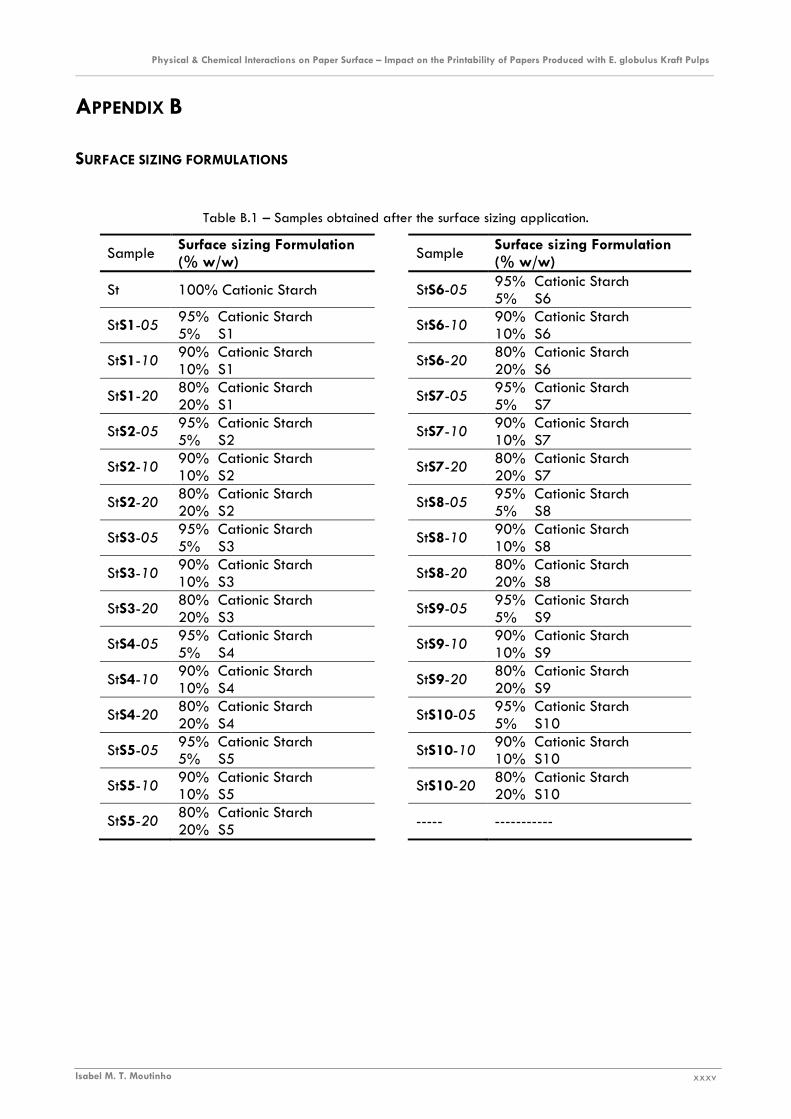
Physical & Chemical Interactions on Paper Surface – Impact on the Printability of Papers Produced with E. globulus Kraft Pulps ________________________________________________________________________________________________________________________
Isabel M. T. Moutinho xxxv
APPENDIX B
SURFACE SIZING FORMULATIONS
Table B.1 – Samples obtained after the surface sizing application.
Sample Surface sizing Formulation (% w/w)
Sample Surface sizing Formulation (% w/w)
St 100% Cationic Starch StS6-05 95% Cationic Starch 5% S6
StS1-05 95% Cationic Starch 5% S1
StS6-10 90% Cationic Starch 10% S6
StS1-10 90% Cationic Starch 10% S1
StS6-20 80% Cationic Starch 20% S6
StS1-20 80% Cationic Starch 20% S1
StS7-05 95% Cationic Starch 5% S7
StS2-05 95% Cationic Starch 5% S2
StS7-10 90% Cationic Starch 10% S7
StS2-10 90% Cationic Starch 10% S2
StS7-20 80% Cationic Starch 20% S7
StS2-20 80% Cationic Starch 20% S2
StS8-05 95% Cationic Starch 5% S8
StS3-05 95% Cationic Starch 5% S3
StS8-10 90% Cationic Starch 10% S8
StS3-10 90% Cationic Starch 10% S3
StS8-20 80% Cationic Starch 20% S8
StS3-20 80% Cationic Starch 20% S3
StS9-05 95% Cationic Starch 5% S9
StS4-05 95% Cationic Starch 5% S4
StS9-10 90% Cationic Starch 10% S9
StS4-10 90% Cationic Starch 10% S4
StS9-20 80% Cationic Starch 20% S9
StS4-20 80% Cationic Starch 20% S4
StS10-05 95% Cationic Starch 5% S10
StS5-05 95% Cationic Starch 5% S5
StS10-10 90% Cationic Starch 10% S10
StS5-10 90% Cationic Starch 10% S5
StS10-20 80% Cationic Starch 20% S10
StS5-20 80% Cationic Starch 20% S5
----- -----------

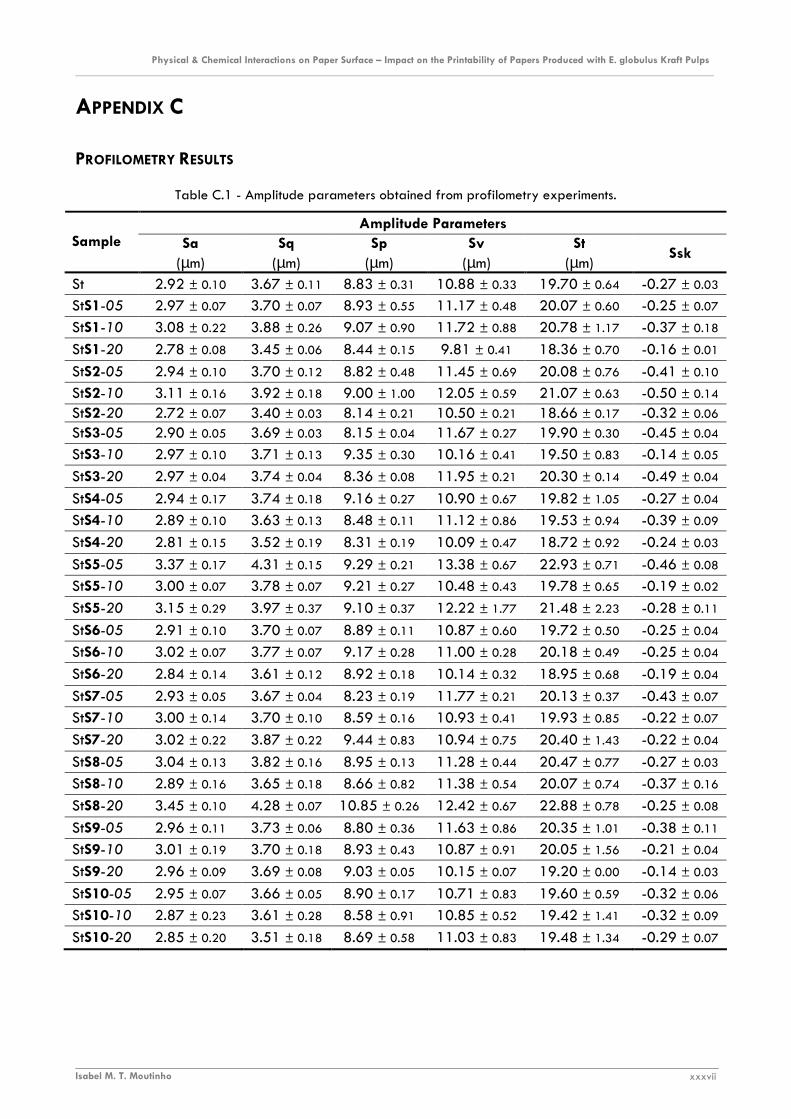
Physical & Chemical Interactions on Paper Surface – Impact on the Printability of Papers Produced with E. globulus Kraft Pulps ________________________________________________________________________________________________________________________
Isabel M. T. Moutinho xxxvii
APPENDIX C
PROFILOMETRY RESULTS
Table C.1 - Amplitude parameters obtained from profilometry experiments.
Amplitude Parameters Sample Sa
(µm) Sq
(µm) Sp
(µm) Sv
(µm) St
(µm) Ssk
St 2.92 ± 0.10 3.67 ± 0.11 8.83 ± 0.31 10.88 ± 0.33 19.70 ± 0.64 -0.27 ± 0.03
StS1-05 2.97 ± 0.07 3.70 ± 0.07 8.93 ± 0.55 11.17 ± 0.48 20.07 ± 0.60 -0.25 ± 0.07
StS1-10 3.08 ± 0.22 3.88 ± 0.26 9.07 ± 0.90 11.72 ± 0.88 20.78 ± 1.17 -0.37 ± 0.18
StS1-20 2.78 ± 0.08 3.45 ± 0.06 8.44 ± 0.15 9.81 ± 0.41 18.36 ± 0.70 -0.16 ± 0.01
StS2-05 2.94 ± 0.10 3.70 ± 0.12 8.82 ± 0.48 11.45 ± 0.69 20.08 ± 0.76 -0.41 ± 0.10
StS2-10 3.11 ± 0.16 3.92 ± 0.18 9.00 ± 1.00 12.05 ± 0.59 21.07 ± 0.63 -0.50 ± 0.14 StS2-20 2.72 ± 0.07 3.40 ± 0.03 8.14 ± 0.21 10.50 ± 0.21 18.66 ± 0.17 -0.32 ± 0.06 StS3-05 2.90 ± 0.05 3.69 ± 0.03 8.15 ± 0.04 11.67 ± 0.27 19.90 ± 0.30 -0.45 ± 0.04
StS3-10 2.97 ± 0.10 3.71 ± 0.13 9.35 ± 0.30 10.16 ± 0.41 19.50 ± 0.83 -0.14 ± 0.05
StS3-20 2.97 ± 0.04 3.74 ± 0.04 8.36 ± 0.08 11.95 ± 0.21 20.30 ± 0.14 -0.49 ± 0.04
StS4-05 2.94 ± 0.17 3.74 ± 0.18 9.16 ± 0.27 10.90 ± 0.67 19.82 ± 1.05 -0.27 ± 0.04
StS4-10 2.89 ± 0.10 3.63 ± 0.13 8.48 ± 0.11 11.12 ± 0.86 19.53 ± 0.94 -0.39 ± 0.09
StS4-20 2.81 ± 0.15 3.52 ± 0.19 8.31 ± 0.19 10.09 ± 0.47 18.72 ± 0.92 -0.24 ± 0.03
StS5-05 3.37 ± 0.17 4.31 ± 0.15 9.29 ± 0.21 13.38 ± 0.67 22.93 ± 0.71 -0.46 ± 0.08
StS5-10 3.00 ± 0.07 3.78 ± 0.07 9.21 ± 0.27 10.48 ± 0.43 19.78 ± 0.65 -0.19 ± 0.02
StS5-20 3.15 ± 0.29 3.97 ± 0.37 9.10 ± 0.37 12.22 ± 1.77 21.48 ± 2.23 -0.28 ± 0.11
StS6-05 2.91 ± 0.10 3.70 ± 0.07 8.89 ± 0.11 10.87 ± 0.60 19.72 ± 0.50 -0.25 ± 0.04
StS6-10 3.02 ± 0.07 3.77 ± 0.07 9.17 ± 0.28 11.00 ± 0.28 20.18 ± 0.49 -0.25 ± 0.04
StS6-20 2.84 ± 0.14 3.61 ± 0.12 8.92 ± 0.18 10.14 ± 0.32 18.95 ± 0.68 -0.19 ± 0.04
StS7-05 2.93 ± 0.05 3.67 ± 0.04 8.23 ± 0.19 11.77 ± 0.21 20.13 ± 0.37 -0.43 ± 0.07
StS7-10 3.00 ± 0.14 3.70 ± 0.10 8.59 ± 0.16 10.93 ± 0.41 19.93 ± 0.85 -0.22 ± 0.07
StS7-20 3.02 ± 0.22 3.87 ± 0.22 9.44 ± 0.83 10.94 ± 0.75 20.40 ± 1.43 -0.22 ± 0.04
StS8-05 3.04 ± 0.13 3.82 ± 0.16 8.95 ± 0.13 11.28 ± 0.44 20.47 ± 0.77 -0.27 ± 0.03
StS8-10 2.89 ± 0.16 3.65 ± 0.18 8.66 ± 0.82 11.38 ± 0.54 20.07 ± 0.74 -0.37 ± 0.16
StS8-20 3.45 ± 0.10 4.28 ± 0.07 10.85 ± 0.26 12.42 ± 0.67 22.88 ± 0.78 -0.25 ± 0.08
StS9-05 2.96 ± 0.11 3.73 ± 0.06 8.80 ± 0.36 11.63 ± 0.86 20.35 ± 1.01 -0.38 ± 0.11
StS9-10 3.01 ± 0.19 3.70 ± 0.18 8.93 ± 0.43 10.87 ± 0.91 20.05 ± 1.56 -0.21 ± 0.04
StS9-20 2.96 ± 0.09 3.69 ± 0.08 9.03 ± 0.05 10.15 ± 0.07 19.20 ± 0.00 -0.14 ± 0.03
StS10-05 2.95 ± 0.07 3.66 ± 0.05 8.90 ± 0.17 10.71 ± 0.83 19.60 ± 0.59 -0.32 ± 0.06
StS10-10 2.87 ± 0.23 3.61 ± 0.28 8.58 ± 0.91 10.85 ± 0.52 19.42 ± 1.41 -0.32 ± 0.09
StS10-20 2.85 ± 0.20 3.51 ± 0.18 8.69 ± 0.58 11.03 ± 0.83 19.48 ± 1.34 -0.29 ± 0.07
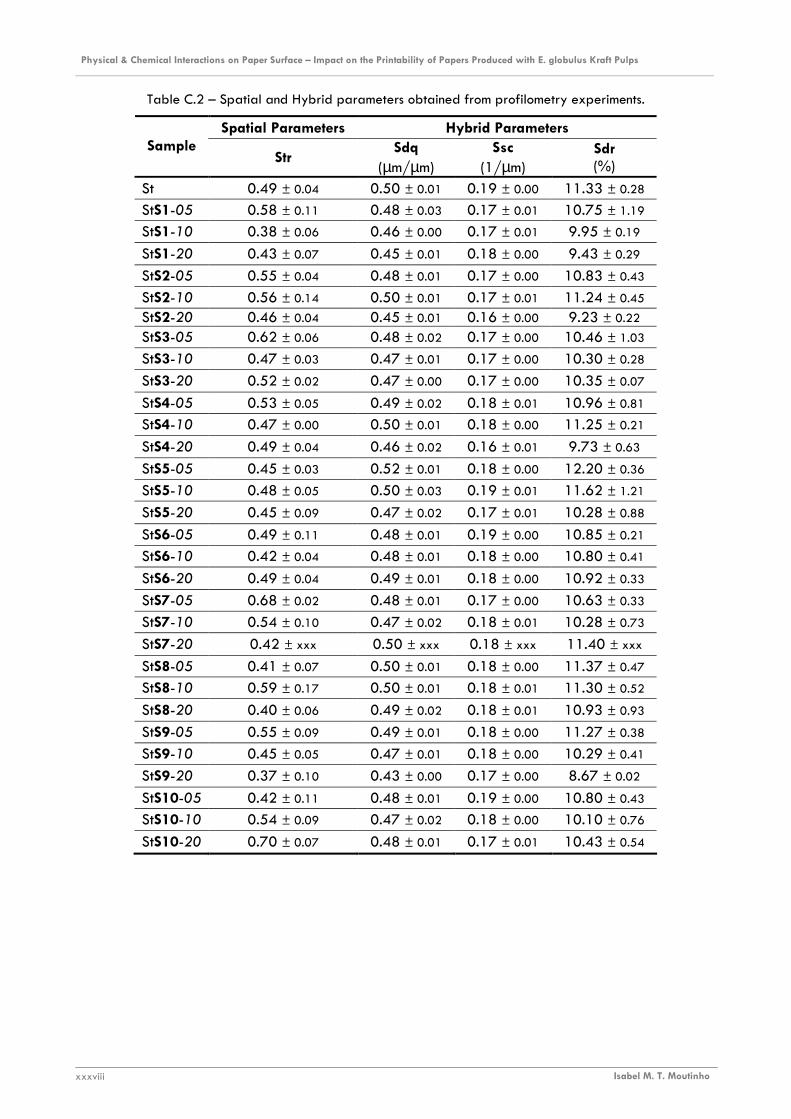
Physical & Chemical Interactions on Paper Surface – Impact on the Printability of Papers Produced with E. globulus Kraft Pulps ________________________________________________________________________________________________________________________
Isabel M. T. Moutinho xxxviii
Table C.2 – Spatial and Hybrid parameters obtained from profilometry experiments.
Spatial Parameters Hybrid Parameters Sample
Str Sdq
(µm/µm) Ssc
(1/µm) Sdr (%)
St 0.49 ± 0.04 0.50 ± 0.01 0.19 ± 0.00 11.33 ± 0.28
StS1-05 0.58 ± 0.11 0.48 ± 0.03 0.17 ± 0.01 10.75 ± 1.19
StS1-10 0.38 ± 0.06 0.46 ± 0.00 0.17 ± 0.01 9.95 ± 0.19
StS1-20 0.43 ± 0.07 0.45 ± 0.01 0.18 ± 0.00 9.43 ± 0.29
StS2-05 0.55 ± 0.04 0.48 ± 0.01 0.17 ± 0.00 10.83 ± 0.43
StS2-10 0.56 ± 0.14 0.50 ± 0.01 0.17 ± 0.01 11.24 ± 0.45 StS2-20 0.46 ± 0.04 0.45 ± 0.01 0.16 ± 0.00 9.23 ± 0.22 StS3-05 0.62 ± 0.06 0.48 ± 0.02 0.17 ± 0.00 10.46 ± 1.03
StS3-10 0.47 ± 0.03 0.47 ± 0.01 0.17 ± 0.00 10.30 ± 0.28
StS3-20 0.52 ± 0.02 0.47 ± 0.00 0.17 ± 0.00 10.35 ± 0.07
StS4-05 0.53 ± 0.05 0.49 ± 0.02 0.18 ± 0.01 10.96 ± 0.81
StS4-10 0.47 ± 0.00 0.50 ± 0.01 0.18 ± 0.00 11.25 ± 0.21
StS4-20 0.49 ± 0.04 0.46 ± 0.02 0.16 ± 0.01 9.73 ± 0.63
StS5-05 0.45 ± 0.03 0.52 ± 0.01 0.18 ± 0.00 12.20 ± 0.36
StS5-10 0.48 ± 0.05 0.50 ± 0.03 0.19 ± 0.01 11.62 ± 1.21
StS5-20 0.45 ± 0.09 0.47 ± 0.02 0.17 ± 0.01 10.28 ± 0.88
StS6-05 0.49 ± 0.11 0.48 ± 0.01 0.19 ± 0.00 10.85 ± 0.21
StS6-10 0.42 ± 0.04 0.48 ± 0.01 0.18 ± 0.00 10.80 ± 0.41
StS6-20 0.49 ± 0.04 0.49 ± 0.01 0.18 ± 0.00 10.92 ± 0.33
StS7-05 0.68 ± 0.02 0.48 ± 0.01 0.17 ± 0.00 10.63 ± 0.33
StS7-10 0.54 ± 0.10 0.47 ± 0.02 0.18 ± 0.01 10.28 ± 0.73
StS7-20 0.42 ± xxx 0.50 ± xxx 0.18 ± xxx 11.40 ± xxx
StS8-05 0.41 ± 0.07 0.50 ± 0.01 0.18 ± 0.00 11.37 ± 0.47
StS8-10 0.59 ± 0.17 0.50 ± 0.01 0.18 ± 0.01 11.30 ± 0.52
StS8-20 0.40 ± 0.06 0.49 ± 0.02 0.18 ± 0.01 10.93 ± 0.93
StS9-05 0.55 ± 0.09 0.49 ± 0.01 0.18 ± 0.00 11.27 ± 0.38
StS9-10 0.45 ± 0.05 0.47 ± 0.01 0.18 ± 0.00 10.29 ± 0.41
StS9-20 0.37 ± 0.10 0.43 ± 0.00 0.17 ± 0.00 8.67 ± 0.02
StS10-05 0.42 ± 0.11 0.48 ± 0.01 0.19 ± 0.00 10.80 ± 0.43
StS10-10 0.54 ± 0.09 0.47 ± 0.02 0.18 ± 0.00 10.10 ± 0.76
StS10-20 0.70 ± 0.07 0.48 ± 0.01 0.17 ± 0.01 10.43 ± 0.54
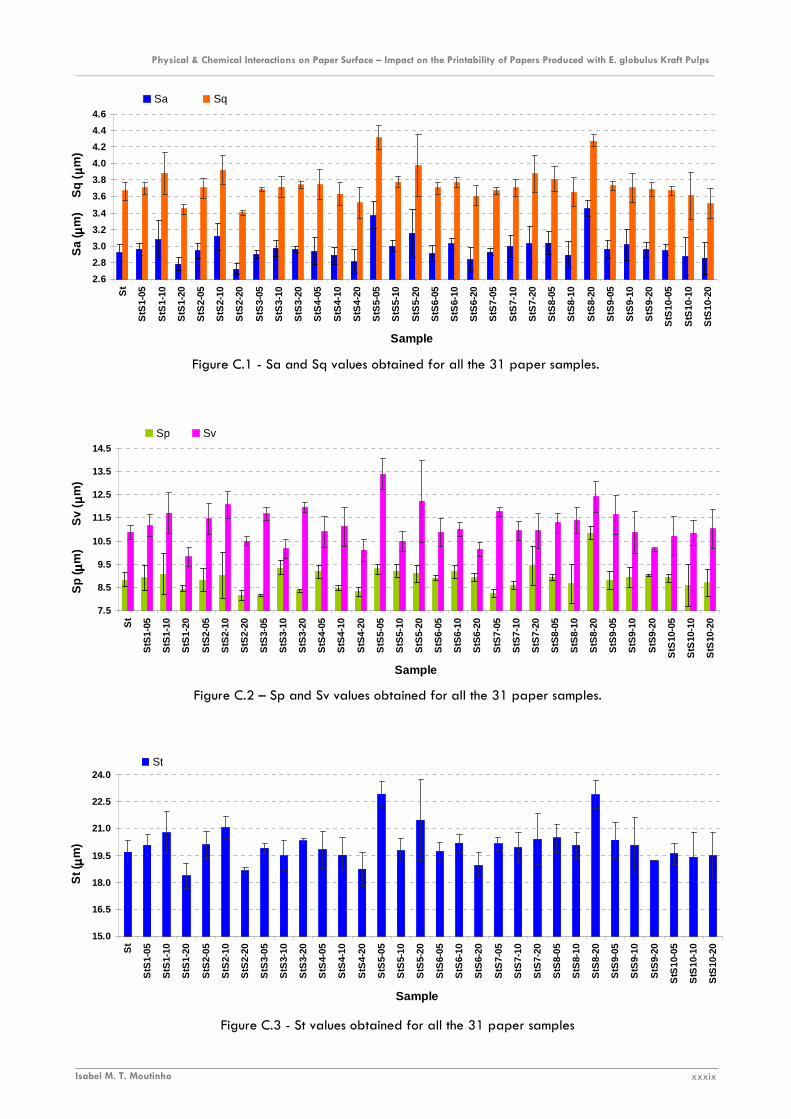
Physical & Chemical Interactions on Paper Surface – Impact on the Printability of Papers Produced with E. globulus Kraft Pulps ________________________________________________________________________________________________________________________
Isabel M. T. Moutinho xxxix
2.6
2.8
3.0
3.2
3.4
3.6
3.8
4.0
4.2
4.4
4.6S
t
StS
1-05
StS
1-10
StS
1-20
StS
2-05
StS
2-10
StS
2-20
StS
3-05
StS
3-10
StS
3-20
StS
4-05
StS
4-10
StS
4-20
StS
5-05
StS
5-10
StS
5-20
StS
6-05
StS
6-10
StS
6-20
StS
7-05
StS
7-10
StS
7-20
StS
8-05
StS
8-10
StS
8-20
StS
9-05
StS
9-10
StS
9-20
StS
10-0
5
StS
10-1
0
StS
10-2
0
Sample
Sa
( µµ µµm
)
Sq
( µµ µµm
)
Sa Sq
7.5
8.5
9.5
10.5
11.5
12.5
13.5
14.5
St
StS
1-05
StS
1-10
StS
1-20
StS
2-05
StS
2-10
StS
2-20
StS
3-05
StS
3-10
StS
3-20
StS
4-05
StS
4-10
StS
4-20
StS
5-05
StS
5-10
StS
5-20
StS
6-05
StS
6-10
StS
6-20
StS
7-05
StS
7-10
StS
7-20
StS
8-05
StS
8-10
StS
8-20
StS
9-05
StS
9-10
StS
9-20
StS
10-0
5
StS
10-1
0
StS
10-2
0
Sample
Sp
( µµ µµm
)
S
v ( µµ µµ
m)
Sp Sv
15.0
16.5
18.0
19.5
21.0
22.5
24.0
St
StS
1-05
StS
1-10
StS
1-20
StS
2-05
StS
2-10
StS
2-20
StS
3-05
StS
3-10
StS
3-20
StS
4-05
StS
4-10
StS
4-20
StS
5-05
StS
5-10
StS
5-20
StS
6-05
StS
6-10
StS
6-20
StS
7-05
StS
7-10
StS
7-20
StS
8-05
StS
8-10
StS
8-20
StS
9-05
StS
9-10
StS
9-20
StS
10-0
5
StS
10-1
0
StS
10-2
0
Sample
St (
µµ µµm
)
St
Figure C.1 - Sa and Sq values obtained for all the 31 paper samples.
Figure C.2 – Sp and Sv values obtained for all the 31 paper samples.
Figure C.3 - St values obtained for all the 31 paper samples
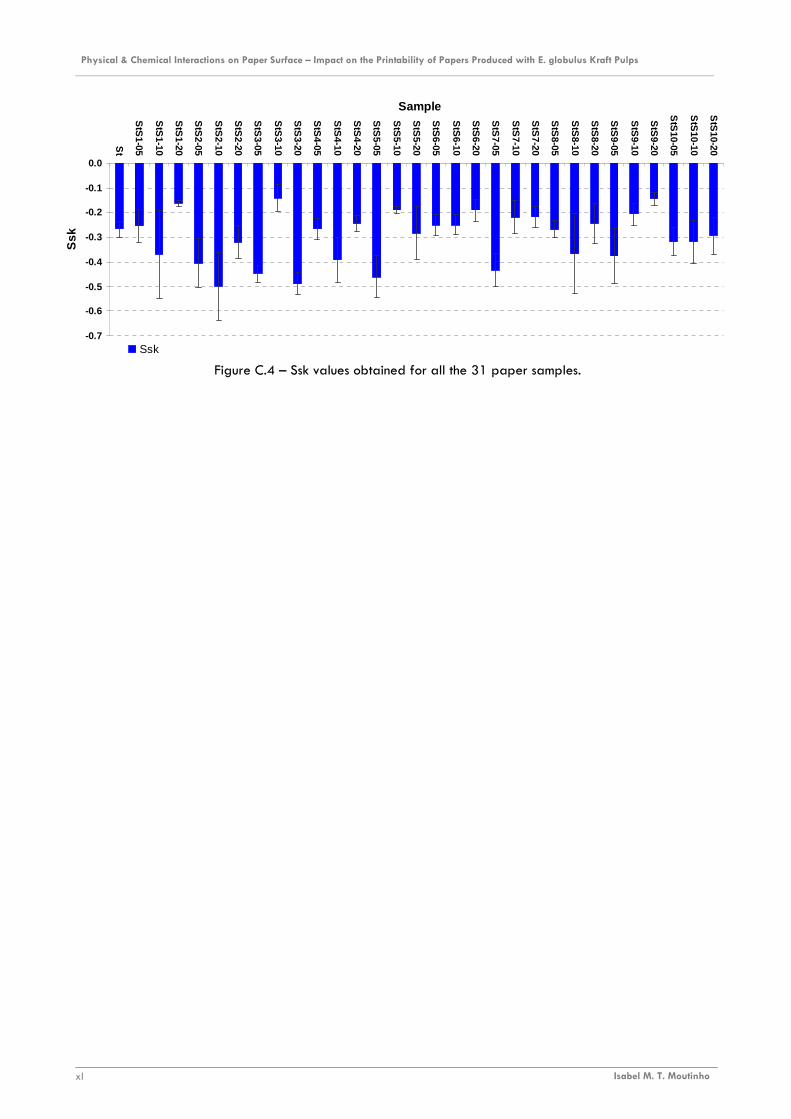
Physical & Chemical Interactions on Paper Surface – Impact on the Printability of Papers Produced with E. globulus Kraft Pulps ________________________________________________________________________________________________________________________
Isabel M. T. Moutinho xl
-0.7
-0.6
-0.5
-0.4
-0.3
-0.2
-0.1
0.0
St
StS
1-05
StS
1-10
StS
1-20
StS
2-05
StS
2-10
StS
2-20
StS
3-05
StS
3-10
StS
3-20
StS
4-05
StS
4-10
StS
4-20
StS
5-05
StS
5-10
StS
5-20
StS
6-05
StS
6-10
StS
6-20
StS
7-05
StS
7-10
StS
7-20
StS
8-05
StS
8-10
StS
8-20
StS
9-05
StS
9-10
StS
9-20
StS
10-05
StS
10-10
StS
10-20
Sample
Ssk
Ssk
Figure C.4 – Ssk values obtained for all the 31 paper samples.

Physical & Chemical Interactions on Paper Surface – Impact on the Printability of Papers Produced with E. globulus Kraft Pulps ________________________________________________________________________________________________________________________
Isabel M. T. Moutinho xli
APPENDIX D
11.1 MERCURY POROSIMETRY RESULTS
Table D.1a – Information achieved by mercury porosimetry for the reference samples and the samples sized
with the synthetic surface sizing agents S1, S2 and S4at the three different amounts.
Sample Total intrusion volume
(ml/g) Bulk Density at 0.52 psia
(g/ml) Apparent Skeletal
Density (g/ml) Porosity
(%) 0.762 0.745 1.715 56.800 0.794 0.724 1.701 57.447 0.711 0.787 1.785 55.940
St
0.788 0.729 1.710 57.391 0.770 0.732 1.683 56.467 0.751 0.739 1.662 55.536 StS1-05 0.764 0.731 1.658 55.888 0.714 0.762 1.671 54.406 0.756 0.751 1.743 56.884 StS1-10 0.729 0.764 1.723 55.683 0.748 0.745 1.684 55.754 0.810 0.724 1.752 58.689 StS1-20 0.769 0.737 1.699 56.654 0.789 0.743 1.799 58.682 0.777 0.727 1.672 56.522 StS2-05 0.810 0.709 1.666 57.452 0.745 0.761 1.761 56.775 0.726 0.764 1.716 55.486 StS2-10 0.757 0.751 1.742 56.897 0.730 0.756 1.687 55.172 0.824 0.710 1.715 58.567 0.753 0.750 1.728 56.551
StS2-20
0.755 0.739 1.674 55.837 0.710 0.752 1.616 53.443 0.823 0.709 1.702 58.336 0.790 0.720 1.73 58.010
StS3-05
0.768 0.733 1.676 56.272 0.808 0.713 1.681 57.596 0.772 0.728 1.665 56.256 0.829 0.707 1.707 58.581
StS3-10
0.839 0.691 1.646 58.007 0.789 0.726 1.701 57.338 0.809 0.722 1.736 58.411 0.712 0.766 1.689 54.615
StS3-20
0.730 0.759 1.702 55.417

Physical & Chemical Interactions on Paper Surface – Impact on the Printability of Papers Produced with E. globulus Kraft Pulps ________________________________________________________________________________________________________________________
Isabel M. T. Moutinho xlii
Table D.1b – Information achieved by mercury porosimetry for samples sized with the synthetic surface sizing
agents S4, S5, S6, S7 and S8 at the three different amounts.
Sample Total intrusion volume
(ml/g) Bulk Density at 0.52 psia
(g/ml) Apparent Skeletal
Density (g/ml) Porosity
(%) 0.730 0.750 1.710 55.860 0.726 0.759 1.691 55.126 StS4-05 0.782 0.729 1.696 57.023 0.830 0.691 1.622 57.396 0.786 0.725 1.687 57.020 StS4-10 0.780 0.723 1.659 56.411 0.785 0.718 1.646 56.383 0.739 0.748 1.674 55.306 StS4-20 0.758 0.732 1.649 55.570 0.778 0.708 1.577 55.099 0.728 0.756 1.685 55.119 StS5-05 0.747 0.703 1.483 52.561 0.753 0.740 1.673 55.756 0.850 0.677 1.598 57.611 StS5-10 0.774 0.710 1.574 54.914 0.784 0.729 1.706 57.229 0.776 0.704 1.557 54.743 StS5-20 0.853 0.664 1.531 56.637 0.817 0.711 1.698 58.117 0.732 0.748 1.652 54.731 StS6-05 0.731 0.739 1.608 54.036 0.766 0.741 1.717 56.816 0.742 0.754 1.714 56.001 StS6-10 0.742 0.727 1.577 53.913 0.783 0.718 1.640 56.233 0.754 0.714 1.550 53.910 StS6-20 0.824 0.681 1.554 56.146 0.817 0.695 1.610 56.826 0.765 0.686 1.448 52.588 StS7-05 0.793 0.683 1.495 54.285 0.707 0.772 1.700 54.588 0.759 0.735 1.666 55.857 StS7-10 0.757 0.706 1.518 53.489 0.810 0.710 1.710 58.430 0.774 0.722 1.641 55.975 StS7-20 0.728 0.724 1.534 52.766 0.767 0.732 1.670 56.139 0.711 0.746 1.592 53.108 StS8-05 0.759 0.709 1.536 53.845 0.825 0.705 1.686 58.190 0.777 0.713 1.600 55.440 StS8-10 0.718 0.730 1.533 52.390 0.821 0.701 1.653 57.595 0.733 0.706 1.462 51.726 StS8-20 0.735 0.731 1.581 53.735
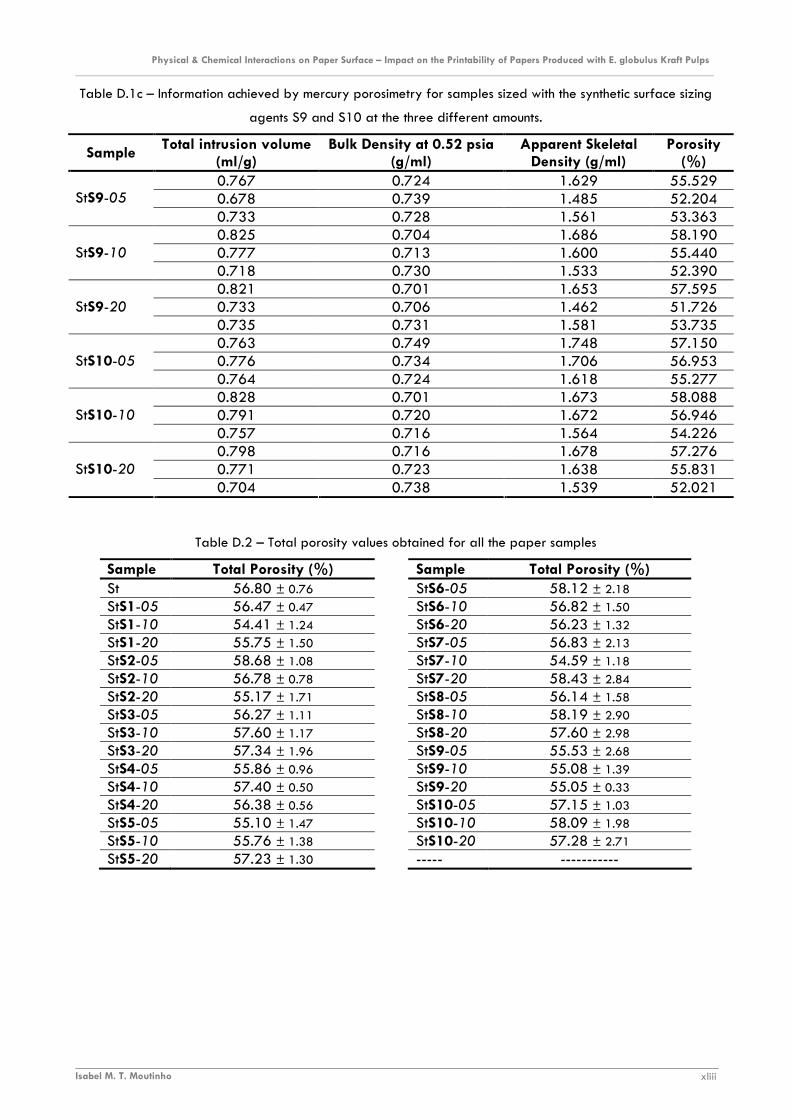
Physical & Chemical Interactions on Paper Surface – Impact on the Printability of Papers Produced with E. globulus Kraft Pulps ________________________________________________________________________________________________________________________
Isabel M. T. Moutinho xliii
Table D.1c – Information achieved by mercury porosimetry for samples sized with the synthetic surface sizing
agents S9 and S10 at the three different amounts.
Sample Total intrusion volume
(ml/g) Bulk Density at 0.52 psia
(g/ml) Apparent Skeletal
Density (g/ml) Porosity
(%) 0.767 0.724 1.629 55.529 0.678 0.739 1.485 52.204 StS9-05 0.733 0.728 1.561 53.363 0.825 0.704 1.686 58.190 0.777 0.713 1.600 55.440 StS9-10 0.718 0.730 1.533 52.390 0.821 0.701 1.653 57.595 0.733 0.706 1.462 51.726 StS9-20 0.735 0.731 1.581 53.735 0.763 0.749 1.748 57.150 0.776 0.734 1.706 56.953 StS10-05 0.764 0.724 1.618 55.277 0.828 0.701 1.673 58.088 0.791 0.720 1.672 56.946 StS10-10 0.757 0.716 1.564 54.226 0.798 0.716 1.678 57.276 0.771 0.723 1.638 55.831 StS10-20 0.704 0.738 1.539 52.021
Table D.2 – Total porosity values obtained for all the paper samples
Sample Total Porosity (%) Sample Total Porosity (%) St 56.80 ± 0.76 StS6-05 58.12 ± 2.18 StS1-05 56.47 ± 0.47 StS6-10 56.82 ± 1.50 StS1-10 54.41 ± 1.24 StS6-20 56.23 ± 1.32 StS1-20 55.75 ± 1.50 StS7-05 56.83 ± 2.13 StS2-05 58.68 ± 1.08 StS7-10 54.59 ± 1.18 StS2-10 56.78 ± 0.78 StS7-20 58.43 ± 2.84 StS2-20 55.17 ± 1.71 StS8-05 56.14 ± 1.58 StS3-05 56.27 ± 1.11 StS8-10 58.19 ± 2.90 StS3-10 57.60 ± 1.17 StS8-20 57.60 ± 2.98 StS3-20 57.34 ± 1.96 StS9-05 55.53 ± 2.68 StS4-05 55.86 ± 0.96 StS9-10 55.08 ± 1.39 StS4-10 57.40 ± 0.50 StS9-20 55.05 ± 0.33 StS4-20 56.38 ± 0.56 StS10-05 57.15 ± 1.03 StS5-05 55.10 ± 1.47 StS10-10 58.09 ± 1.98 StS5-10 55.76 ± 1.38 StS10-20 57.28 ± 2.71 StS5-20 57.23 ± 1.30 ----- -----------
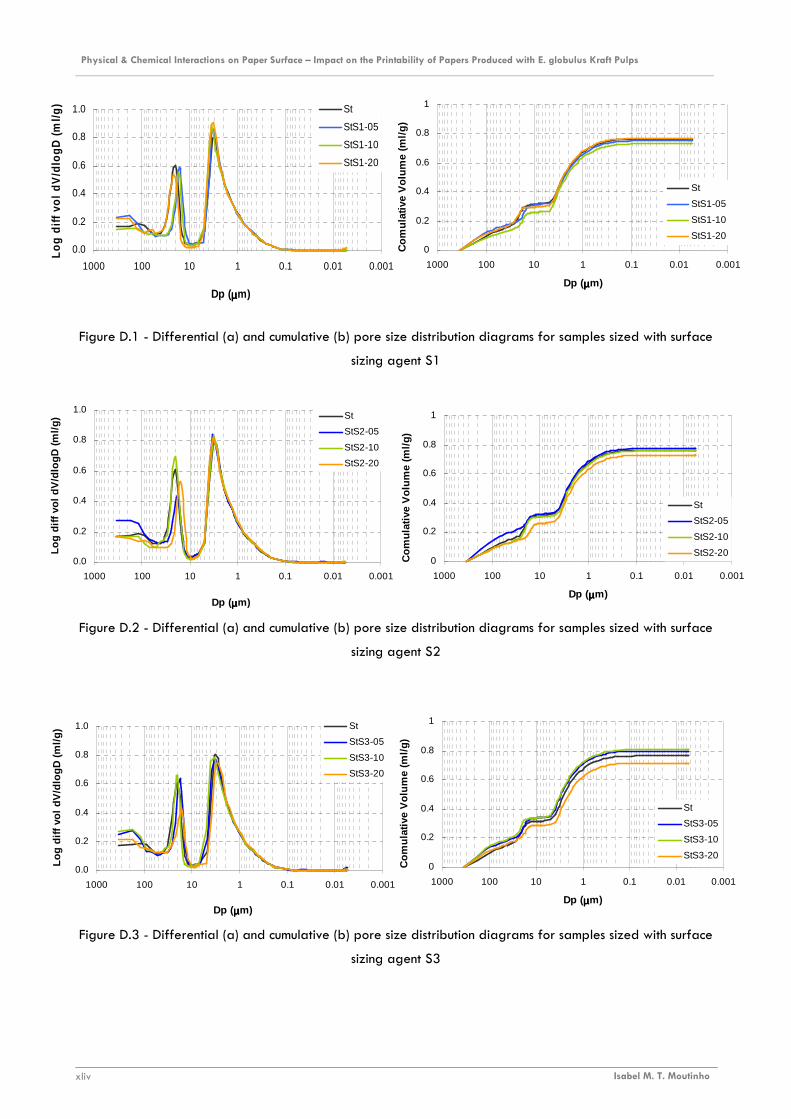
Physical & Chemical Interactions on Paper Surface – Impact on the Printability of Papers Produced with E. globulus Kraft Pulps ________________________________________________________________________________________________________________________
Isabel M. T. Moutinho xliv
0.0
0.2
0.4
0.6
0.8
1.0
0.0010.010.11101001000
Dp (µµµµm)
Log
diff
vol d
V/d
logD
(m
l/g)
St
StS2-05
StS2-10
StS2-20
0
0.2
0.4
0.6
0.8
1
0.0010.010.11101001000
Dp (µµµµm)
Com
ulat
ive
Vol
ume
(ml/g
)
St
StS2-05
StS2-10
StS2-20
0.0
0.2
0.4
0.6
0.8
1.0
0.0010.010.11101001000
Dp (µµµµm)
Log
diff
vol d
V/d
logD
(m
l/g)
St
StS3-05
StS3-10
StS3-20
0
0.2
0.4
0.6
0.8
1
0.0010.010.11101001000
Dp (µµµµm)
Com
ulat
ive
Vol
ume
(ml/g
)
St
StS3-05
StS3-10
StS3-20
Figure D.1 - Differential (a) and cumulative (b) pore size distribution diagrams for samples sized with surface
sizing agent S1
Figure D.2 - Differential (a) and cumulative (b) pore size distribution diagrams for samples sized with surface
sizing agent S2
Figure D.3 - Differential (a) and cumulative (b) pore size distribution diagrams for samples sized with surface
sizing agent S3
0.0
0.2
0.4
0.6
0.8
1.0
0.0010.010.11101001000
Dp (µµµµm)
Log
diff
vol d
V/d
logD
(m
l/g) St
StS1-05
StS1-10
StS1-20
0
0.2
0.4
0.6
0.8
1
0.0010.010.11101001000
Dp (µµµµm)
Com
ulat
ive
Vol
ume
(ml/g
)
St
StS1-05
StS1-10
StS1-20
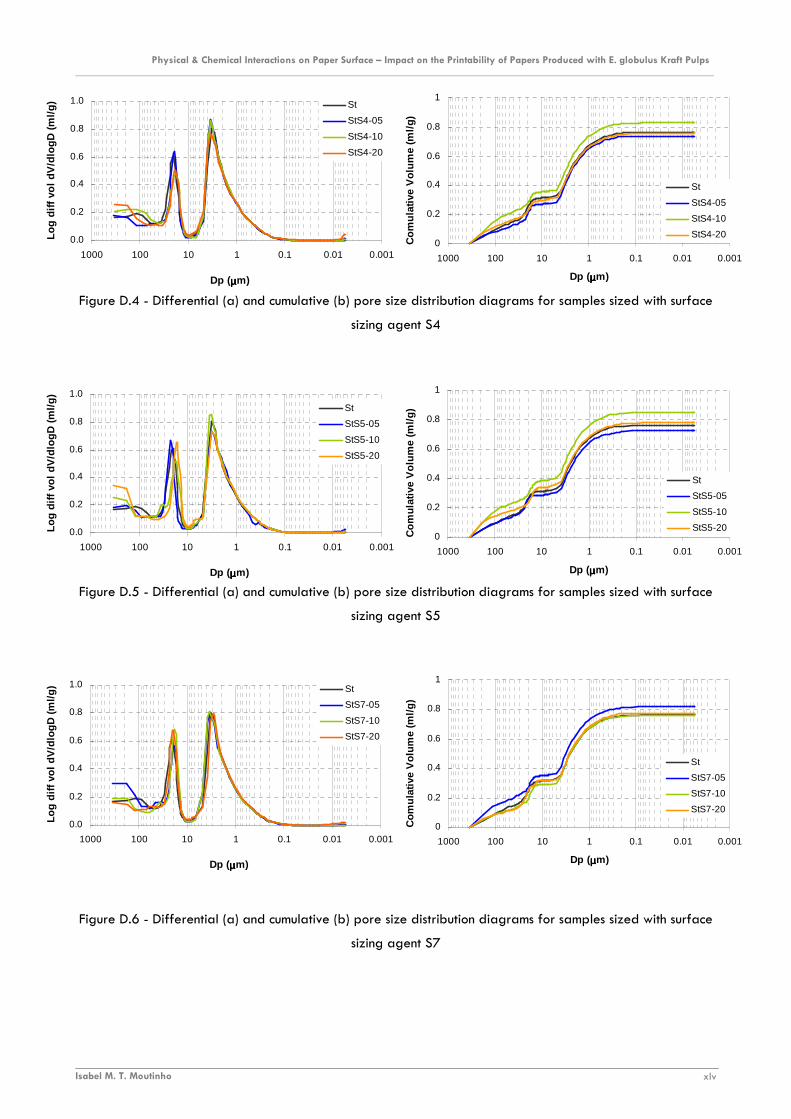
Physical & Chemical Interactions on Paper Surface – Impact on the Printability of Papers Produced with E. globulus Kraft Pulps ________________________________________________________________________________________________________________________
Isabel M. T. Moutinho xlv
0.0
0.2
0.4
0.6
0.8
1.0
0.0010.010.11101001000
Dp (µµµµm)
Log
diff
vol d
V/d
logD
(m
l/g)
St
StS4-05
StS4-10
StS4-20
0
0.2
0.4
0.6
0.8
1
0.0010.010.11101001000
Dp (µµµµm)
Com
ulat
ive
Vol
ume
(ml/g
)
St
StS4-05
StS4-10
StS4-20
0.0
0.2
0.4
0.6
0.8
1.0
0.0010.010.11101001000
Dp (µµµµm)
Log
diff
vol d
V/d
logD
(m
l/g) St
StS5-05
StS5-10
StS5-20
0
0.2
0.4
0.6
0.8
1
0.0010.010.11101001000
Dp (µµµµm)
Com
ulat
ive
Vol
ume
(ml/g
)
St
StS5-05
StS5-10
StS5-20
0.0
0.2
0.4
0.6
0.8
1.0
0.0010.010.11101001000
Dp (µµµµm)
Log
diff
vol d
V/d
logD
(m
l/g)
St
StS7-05
StS7-10
StS7-20
0
0.2
0.4
0.6
0.8
1
0.0010.010.11101001000
Dp (µµµµm)
Com
ulat
ive
Vol
ume
(ml/g
)
St
StS7-05
StS7-10
StS7-20
Figure D.4 - Differential (a) and cumulative (b) pore size distribution diagrams for samples sized with surface
sizing agent S4
Figure D.5 - Differential (a) and cumulative (b) pore size distribution diagrams for samples sized with surface
sizing agent S5
Figure D.6 - Differential (a) and cumulative (b) pore size distribution diagrams for samples sized with surface
sizing agent S7
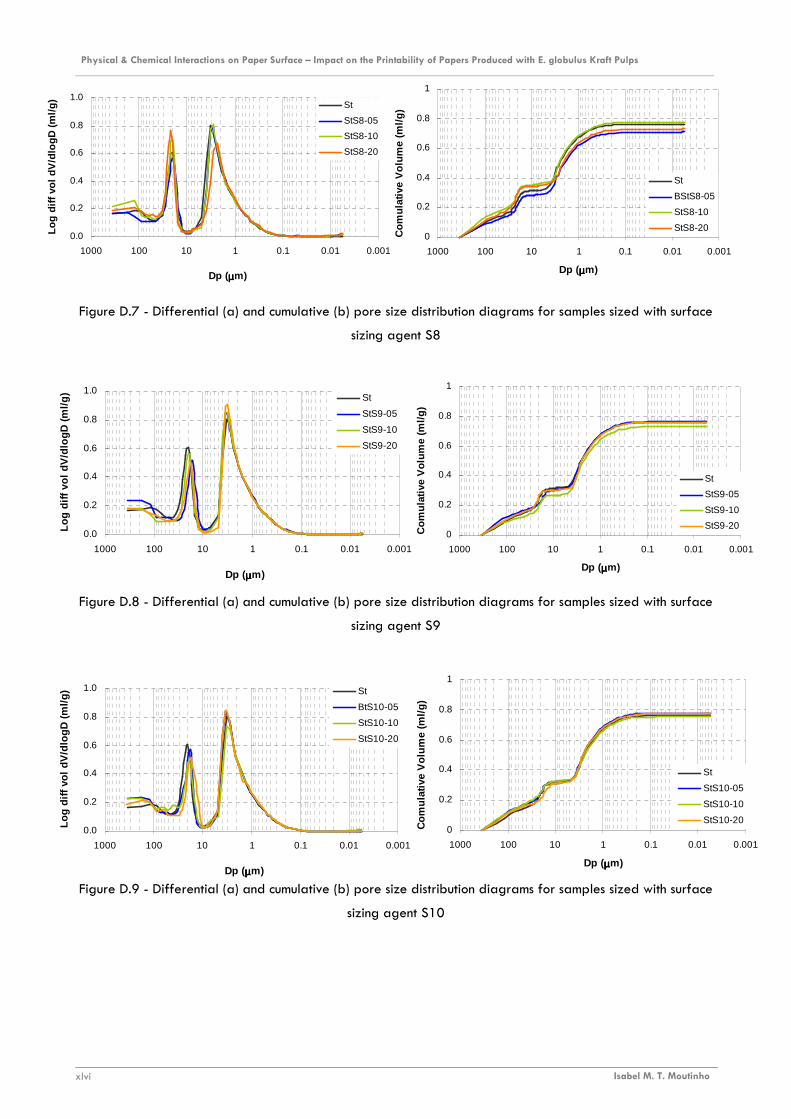
Physical & Chemical Interactions on Paper Surface – Impact on the Printability of Papers Produced with E. globulus Kraft Pulps ________________________________________________________________________________________________________________________
Isabel M. T. Moutinho xlvi
0.0
0.2
0.4
0.6
0.8
1.0
0.0010.010.11101001000
Dp (µµµµm)
Log
diff
vol d
V/d
logD
(m
l/g)
St
BtS10-05
StS10-10
StS10-20
0
0.2
0.4
0.6
0.8
1
0.0010.010.11101001000
Dp (µµµµm)
Com
ulat
ive
Vol
ume
(ml/g
)
St
StS10-05
StS10-10
StS10-20
Figure D.7 - Differential (a) and cumulative (b) pore size distribution diagrams for samples sized with surface
sizing agent S8
Figure D.8 - Differential (a) and cumulative (b) pore size distribution diagrams for samples sized with surface
sizing agent S9
Figure D.9 - Differential (a) and cumulative (b) pore size distribution diagrams for samples sized with surface
sizing agent S10
0.0
0.2
0.4
0.6
0.8
1.0
0.0010.010.11101001000
Dp (µµµµm)
Log
diff
vol d
V/d
logD
(m
l/g) St
StS8-05
StS8-10
StS8-20
0
0.2
0.4
0.6
0.8
1
0.0010.010.11101001000
Dp (µµµµm)
Com
ulat
ive
Vol
ume
(ml/g
)
St
BStS8-05
StS8-10
StS8-20
0.0
0.2
0.4
0.6
0.8
1.0
0.0010.010.11101001000
Dp (µµµµm)
Log
diff
vol d
V/d
logD
(m
l/g) St
StS9-05
StS9-10
StS9-20
0
0.2
0.4
0.6
0.8
1
0.0010.010.11101001000
Dp (µµµµm)
Com
ulat
ive
Vol
ume
(ml/g
)
St
StS9-05
StS9-10
StS9-20

Physical & Chemical Interactions on Paper Surface – Impact on the Printability of Papers Produced with E. globulus Kraft Pulps ________________________________________________________________________________________________________________________
Isabel M. T. Moutinho xlvii
APPENDIX E
CONTACT ANGLE MEASUREMENTS
Table E.1 – Contact angle values measured with each of the five liquids tested for all samples (before
correction).
Sample Diodomethane
(º) Propileneglycol
(º) Ethylenglycol
(º) Formamide
(º) Water
(º) St 33.0 ± 1.4 26.9 ± 1.1 27.3 ± 1.0 17.0 ± 0.8 30.3 ± 1.5 StS1-05 32.9 ± 1.4 37.0 ± 1.7 41.8 ± 1.6 42.2 ± 1.5 50.4 ± 1.9 StS1-10 29.8 ± 1.2 38.1 ± 1.6 40.8 ± 1.5 37.9 ± 1.6 50.6 ± 1.5 StS1-20 35.6 ± 1.1 41.8 ± 1.8 50.7 ± 1.0 49.7 ± 1.1 57.0 ± 1.3 StS2-05 28.6 ± 1.0 31.2 ± 1.5 40.3 ± 1.8 37.6 ± 1.7 53.5 ± 1.6 StS2-10 29.5 ± 1.0 34.7 ± 1.5 52.8 ± 1.3 53.6 ± 1.5 68.7 ± 1.6 StS2-20 28.2 ± 1.4 41.4 ± 1.4 64.7 ± 0.9 51.7 ± 1.5 79.6 ± 2.6 StS3-05 25.1 ± 0.9 28.9 ± 0.8 32.9 ± 1.5 31.8 ± 0.8 36.5 ± 0.9 StS3-10 30.2 ± 1.4 30.6 ± 1.0 33.9 ± 1.5 31.7 ± 1.0 52.6 ± 1.6 StS3-20 26.6 ± 1.0 31.3 ± 1.2 29.8 ± 0.9 20.7 ± 0.9 36.5 ± 0.9 StS4-05 34.1 ± 1.4 39.6 ± 1.5 57.4 ± 0.9 57.3 ± 1.1 72.6 ± 1.4 StS4-10 32.8 ± 1.2 39.2 ± 1.8 47.2 ± 1.5 52.6 ± 1.3 60.0 ± 2.4 StS4-20 33.8 ± 1.5 41.6 ± 1.5 60.9 ± 1.6 57.7 ± 1.4 70.7 ± 1.7 StS5-05 38.5 ± 1.8 42.6 ± 0.9 50.5 ± 1.5 45.2 ± 1.0 57.2 ± 1.2 StS5-10 53.8 ± 1.0 58.1 ± 1.4 51.5 ± 1.2 50.7 ± 1.0 52.9 ± 1.5 StS5-20 55.9 ± 1.3 72.6 ± 1.7 70.8 ± 1.1 65.9 ± 1.7 64.0 ± 0.8 StS6-05 30.6 ± 0.6 38.5 ± 1.7 43.2 ± 1.3 45.3 ± 0.7 64.6 ± 1.4 StS6-10 30.9 ± 1.1 40.8 ± 1.6 42.9 ± 1.2 44.2 ± 0.8 67.0 ± 1.4 StS6-20 32.0 ± 1.6 42.8 ± 1.7 51.4 ± 1.1 53.5 ± 1.3 81.4 ± 1.5 StS7-05 31.4 ± 1.4 39.2 ± 1.8 44.8 ± 1.0 45.3 ± 1.7 62.2 ± 1.4 StS7-10 30.7 ± 1.4 32.6 ± 1.0 44.0 ± 1.6 45.0 ± 1.7 57.8 ± 1.2 StS7-20 31.8 ± 1.3 31.6 ± 1.4 60.9 ± 1.6 21.3 ± 1.0 37.2 ± 1.0 StS8-05 34.1 ± 1.1 37.5 ± 1.6 45.8 ± 1.2 48.7 ± 1.4 61.4 ± 1.4 StS8-10 35.4 ± 1.5 43.1 ± 1.6 54.7 ± 1.8 58.6 ± 1.8 74.1 ± 1.3 StS8-20 34.1 ± 0.9 45.1 ± 1.4 57.5 ± 1.8 59.8 ± 1.4 68.9 ± 1.8 StS9-05 26.3 ± 0.6 29.6 ± 0.9 32.4 ± 0.9 28.0 ± 1.3 39.9 ± 0.9 StS9-10 29.4 ± 0.8 36.4 ± 1.8 43.1 ± 1.2 45.9 ± 1.6 55.2 ± 0.8 StS9-20 31.1 ± 1.3 28.0 ± 0.8 37.0 ± 1.5 29.0 ± 0.8 42.8 ± 1.9 StS10-05 22.3 ± 1.1 31.9 ± 1.4 40.3 ± 1.8 34.4 ± 1.4 55.3 ± 1.0 StS10-10 34.1 ± 1.2 36.2 ± 1.7 40.1 ± 1.3 37.8 ± 1.5 48.3 ± 0.8 StS10-20 34.6 ± 1.2 49.5 ± 1.4 63.8 ± 1.3 63.3 ± 1.5 82.6 ± 1.5

Physical & Chemical Interactions on Paper Surface – Impact on the Printability of Papers Produced with E. globulus Kraft Pulps ________________________________________________________________________________________________________________________
Isabel M. T. Moutinho xlviii
Table E.2 – Contact angle values with each of the five liquids tested for all samples, after the application of
the Wenzel correction (corrected values).
Contact angles (º) Sample
Diodomethane Propileneglycol Ethylenglycol Formamide Water St 41.12 36.77 37.04 30.80 39.15 StS1-05 40.70 43.85 47.69 48.02 54.86 StS1-10 37.89 44.30 46.49 44.14 54.74 StS1-20 42.01 47.06 54.63 53.77 60.15 StS2-05 37.61 39.49 46.52 44.37 57.54 StS2-10 38.52 42.35 57.08 57.76 70.94 StS2-20 36.21 46.63 66.97 55.43 80.49 StS3-05 34.93 37.57 40.53 39.70 43.30 StS3-10 38.41 38.71 41.19 39.52 56.59 StS3-20 35.88 39.26 38.15 32.04 43.24 StS4-05 41.73 46.02 60.95 60.86 74.37 StS4-10 40.93 45.85 52.36 56.91 63.29 StS4-20 40.77 47.04 63.69 60.86 72.47 StS5-05 45.77 49.00 55.46 51.10 61.13 StS5-10 58.05 61.74 56.10 55.43 57.29 StS5-20 59.44 74.27 72.65 68.27 66.58 StS6-05 39.06 45.09 48.88 50.61 67.24 StS6-10 39.25 46.91 48.61 49.68 69.35 StS6-20 40.13 48.59 55.77 57.57 82.25 StS7-05 39.51 45.53 50.10 50.52 65.07 StS7-10 38.77 40.19 49.29 50.12 61.11 StS7-20 40.28 40.13 64.11 33.24 44.36 StS8-05 41.97 44.57 51.25 53.66 64.54 StS8-10 42.91 49.00 58.72 62.09 75.75 StS8-20 41.71 50.48 61.03 63.03 71.06 StS9-05 36.32 38.61 40.64 37.48 46.41 StS9-10 37.82 43.13 48.54 50.88 58.84 StS9-20 38.01 35.66 42.70 36.41 47.53 StS10-05 33.38 39.98 46.50 41.87 59.08 StS10-10 41.23 42.87 45.99 44.14 52.83 StS10-20 41.81 53.98 66.43 65.99 83.30
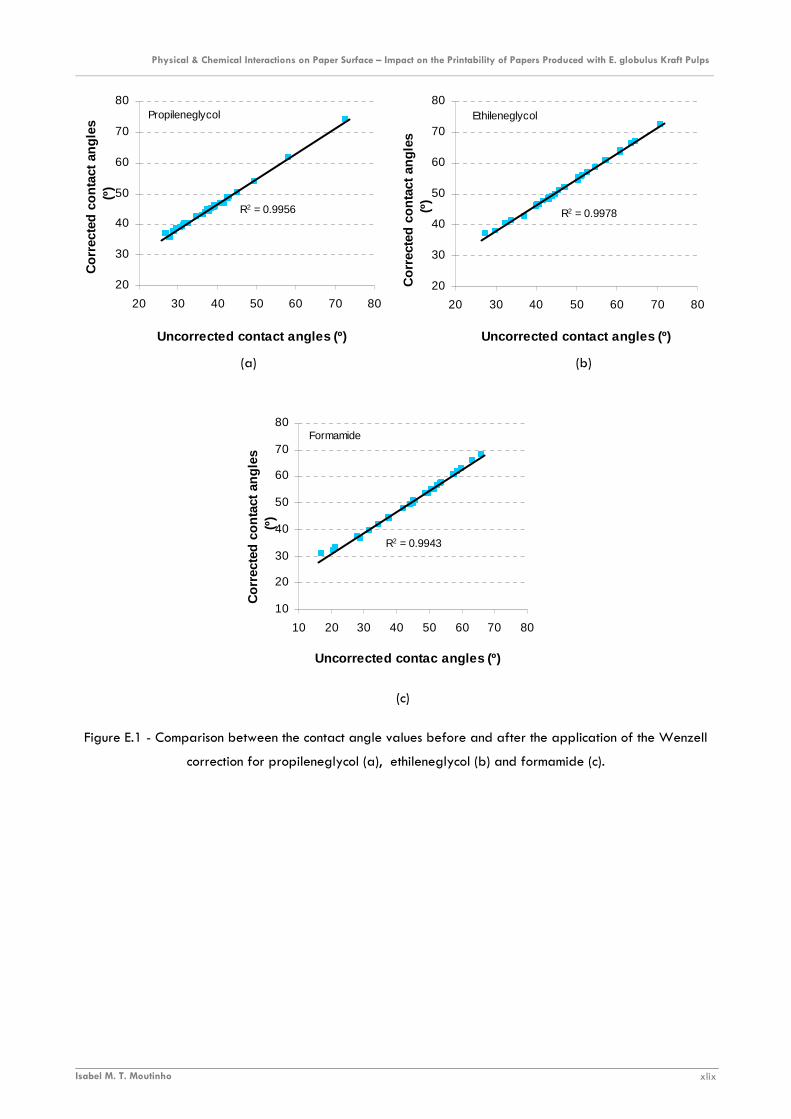
Physical & Chemical Interactions on Paper Surface – Impact on the Printability of Papers Produced with E. globulus Kraft Pulps ________________________________________________________________________________________________________________________
Isabel M. T. Moutinho xlix
Propileneglycol
R2 = 0.9956
20
30
40
50
60
70
80
20 30 40 50 60 70 80
Uncorrected contact angles (º)
Cor
rect
ed c
onta
ct a
ngle
s (º
)Ethileneglycol
R2 = 0.9978
20
30
40
50
60
70
80
20 30 40 50 60 70 80
Uncorrected contact angles (º)
Cor
rect
ed c
onta
ct a
ngle
s (º
)
Formamide
R2 = 0.9943
10
20
30
40
50
60
70
80
10 20 30 40 50 60 70 80
Uncorrected contac angles (º)
Cor
rect
ed c
onta
ct a
ngle
s (º
)
Figure E.1 - Comparison between the contact angle values before and after the application of the Wenzell
correction for propileneglycol (a), ethileneglycol (b) and formamide (c).
(a) (b)
(c)

Physical & Chemical Interactions on Paper Surface – Impact on the Printability of Papers Produced with E. globulus Kraft Pulps ________________________________________________________________________________________________________________________
Isabel M. T. Moutinho l
Table E.3 – Surface free energy, corresponding dispersive and polar components of the surface energy and
polar character computed before the correction of the contact angle values.
Surface Energy (mN/m) Sample
σσσσs σσσσsd σσσσsp σσσσsp/σσσσs (%)
St 51.83 ± 0.69 32.20 ± 0.5 19.63 ± 0.48 37.87 StS1-05 44.52 ± 0.69 39.35 ± 0.58 5.17 ± 0.37 11.61 StS1-10 46.24 ± 0.56 41.06 ± 0.46 5.18 ± 0.32 11.20 StS1-20 42.39 ± 0.55 38.52 ± 0.48 3.87 ± 0.26 9.13 StS2-05 46.68 ± 0.47 42.79 ± 0.39 3.89 ± 0.27 8.33 StS2-10 43.95 ± 0.42 43.13 ± 0.39 0.83 ± 0.13 1.89 StS2-20 43.34 ± 0.54 43.33 ± 0.54 0.00 ± 0.01 0.00 StS3-05 52.45 ± 0.39 42.34 ± 0.30 10.12 ± 0.24 19.29 StS3-10 46.77 ± 0.65 38.26 ± 0.51 8.51 ± 0.39 18.20 StS3-20 52.81 ± 0.45 40.39 ± 0.34 12.42 ± 0.29 23.52 StS4-05 40.34 ± 0.61 39.24 ± 0.59 1.10 ± 0.16 2.73 StS4-10 43.06 ± 0.56 41.22 ± 0.51 1.84 ± 0.22 4.27 StS4-20 40.37 ± 0.66 39.46 ± 0.63 0.91 ± 0.17 2.25 StS5-05 38.47 ± 0.84 28.8 ± 0.64 9.67 ± 0.54 25.14 StS5-10 36.58 ± 0.68 27.58 ± 0.50 9.00 ± 0.46 24.60 StS5-20 30.88 ± 0.75 21.92 ± 0.57 8.95 ± 0.48 28.98 StS6-05 46.99 ± 0.31 43.30 ± 0.25 3.68 ± 0.18 7.83 StS6-10 45.58 ± 0.50 41.64 ± 0.45 3.94 ± 0.23 8.64 StS6-20 41.93 ± 0.67 40.89 ± 0.65 1.04 ± 0.17 2.48 StS7-05 43.35 ± 0.62 40.32 ± 0.56 3.03 ± 0.26 6.99 StS7-10 42.88 ± 0.61 38.72 ± 0.53 4.16 ± 0.31 9.70 StS7-20 51.6 ± 0.64 35.28 ± 0.47 16.31 ± 0.43 31.61 StS8-05 43.01 ± 0.64 39.9 ± 0.48 3.11 ± 0.25 7.23 StS8-10 39.90 ± 0.67 38.52 ± 0.64 1.38 ± 0.22 3.46 StS8-20 41.69 ± 0.42 41.18 ± 0.40 0.51 ± 0.11 1.22 StS9-05 51.49 ± 0.30 43.74 ± 0.21 7.75 ± 0.21 15.05 StS9-10 48.01 ± 0.40 42.51 ± 0.31 5.50 ± 0.25 11.46 StS9-20 48.35 ± 0.62 37.19 ± 0.47 11.16 ± 0.40 23.08 StS10-05 58.03 ± 0.47 45.88 ± 0.35 12.16 ± 0.32 20.95 StS10-10 47.5 ± 0.61 36.54 ± 0.47 10.95 ± 0.39 23.05 StS10-20 40.42 ± 0.53 40.36 ± 0.53 0.06 ± 0.04 0.15

Physical & Chemical Interactions on Paper Surface – Impact on the Printability of Papers Produced with E. globulus Kraft Pulps ________________________________________________________________________________________________________________________
Isabel M. T. Moutinho li
Table E.4 – Surface free energy, dispersive and polar components of the surface energy and polar character
computed after the correction of the contact angle values..
Surface Energy (mN/m) Sample
σσσσs σσσσsd σσσσsp σσσσsp/σσσσs (%)
St 49.65 ± 0.10 38.68 ± 0.05 10.97 ± 0.09 22.09 StS1-05 44.49 ± 0.09 38.89 ± 0.05 5.60 ± 0.07 12.59 StS1-10 46.01 ± 0.09 40.32 ± 0.05 5.69 ± 0.07 12.37 StS1-20 42.02 ± 0.07 38.17 ± 0.05 3.85 ± 0.05 9.16 StS2-05 45.93 ± 0.08 40.49 ± 0.05 5.44 ± 0.06 11.84 StS2-10 41.71 ± 0.06 39.54 ± 0.05 2.16 ± 0.04 5.18 StS2-20 41.88 ± 0.05 41.15 ± 0.05 0.73 ± 0.02 1.74 StS3-05 48.99 ± 0.09 41.75 ± 0.05 7.24 ± 0.07 14.78 StS3-10 47.15 ± 0.09 40.13 ± 0.05 7.02 ± 0.08 14.89 StS3-20 50.16 ± 0.10 41.30 ± 0.05 8.85 ± 0.09 17.64 StS4-05 40.02 ± 0.06 38.38 ± 0.05 1.63 ± 0.03 4.07 StS4-10 42.13 ± 0.07 38.79 ± 0.05 3.33 ± 0.04 7.90 StS4-20 40.20 ± 0.06 38.82 ± 0.05 1.38 ± 0.03 3.43 StS5-05 40.94 ± 0.08 36.14 ± 0.05 4.81 ± 0.06 11.75 StS5-10 36.67 ± 0.10 29.08 ± 0.06 7.59 ± 0.08 20.70 StS5-20 30.63 ± 0.07 27.92 ± 0.06 2.72 ± 0.04 8.88 StS6-05 43.71 ± 0.07 39.82 ± 0.05 3.89 ± 0.05 8.90 StS6-10 43.61 ± 0.07 39.74 ± 0.05 3.88 ± 0.05 8.90 StS6-20 40.99 ± 0.06 39.38 ± 0.05 1.61 ± 0.03 3.93 StS7-05 43.56 ± 0.07 39.56 ± 0.05 4.01 ± 0.05 9.21 StS7-10 44.25 ± 0.08 39.92 ± 0.05 4.33 ± 0.06 9.79 StS7-20 44.01 ± 0.08 38.78 ± 0.05 5.23 ± 0.07 11.88 StS8-05 42.26 ± 0.08 38.28 ± 0.05 3.99 ± 0.05 9.44 StS8-10 39.56 ± 0.06 37.8 ± 0.05 1.76 ± 0.03 4.45 StS8-20 39.90 ± 0.06 38.34 ± 0.05 1.56 ± 0.03 3.91 StS9-05 48.76 ± 0.10 41.10 ± 0.05 7.66 ± 0.09 15.71 StS9-10 44.64 ± 0.08 40.37 ± 0.05 4.27 ± 0.06 9.57 StS9-20 48.15 ± 0.09 40.26 ± 0.05 7.88 ± 0.08 16.37 StS10-05 47.35 ± 0.08 42.51 ± 0.04 4.84 ± 0.06 10.22 StS10-10 45.29 ± 0.09 38.62 ± 0.05 6.67 ± 0.07 14.73 StS10-20 38.89 ± 0.05 38.35 ± 0.05 0.53 ± 0.02 1.36
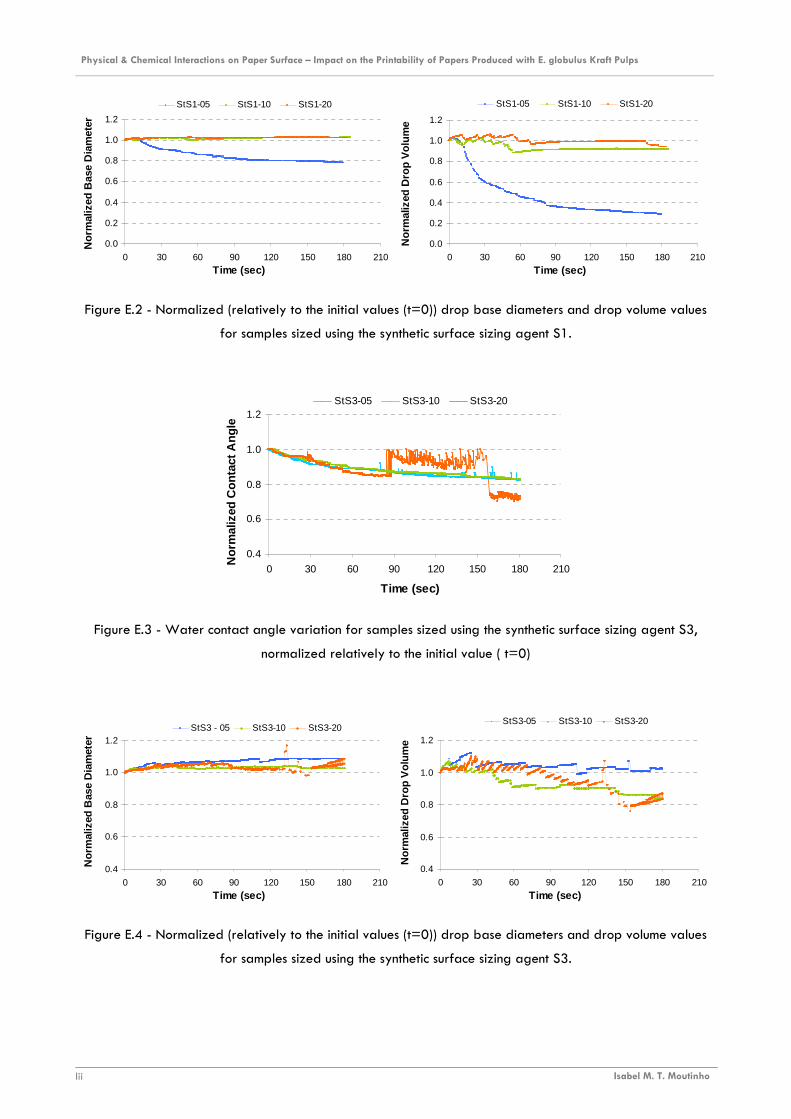
Physical & Chemical Interactions on Paper Surface – Impact on the Printability of Papers Produced with E. globulus Kraft Pulps ________________________________________________________________________________________________________________________
Isabel M. T. Moutinho lii
0.0
0.2
0.4
0.6
0.8
1.0
1.2
0 30 60 90 120 150 180 210
Time (sec)
Nor
mal
ized
Bas
e D
iam
eter
StS1-05 StS1-10 StS1-20
0.0
0.2
0.4
0.6
0.8
1.0
1.2
0 30 60 90 120 150 180 210
Time (sec)
Nor
mal
ized
Dro
p V
olum
e
StS1-05 StS1-10 StS1-20
Figure E.2 - Normalized (relatively to the initial values (t=0)) drop base diameters and drop volume values
for samples sized using the synthetic surface sizing agent S1.
0.4
0.6
0.8
1.0
1.2
0 30 60 90 120 150 180 210
Time (sec)
Nor
mal
ized
Con
tact
Ang
le
StS3-05 StS3-10 StS3-20
Figure E.3 - Water contact angle variation for samples sized using the synthetic surface sizing agent S3,
normalized relatively to the initial value ( t=0)
0.4
0.6
0.8
1.0
1.2
0 30 60 90 120 150 180 210
Time (sec)
Nor
mal
ized
Bas
e D
iam
eter
StS3 - 05 StS3-10 StS3-20
0.4
0.6
0.8
1.0
1.2
0 30 60 90 120 150 180 210
Time (sec)
Nor
mal
ized
Dro
p V
olum
e
StS3-05 StS3-10 StS3-20
Figure E.4 - Normalized (relatively to the initial values (t=0)) drop base diameters and drop volume values
for samples sized using the synthetic surface sizing agent S3.
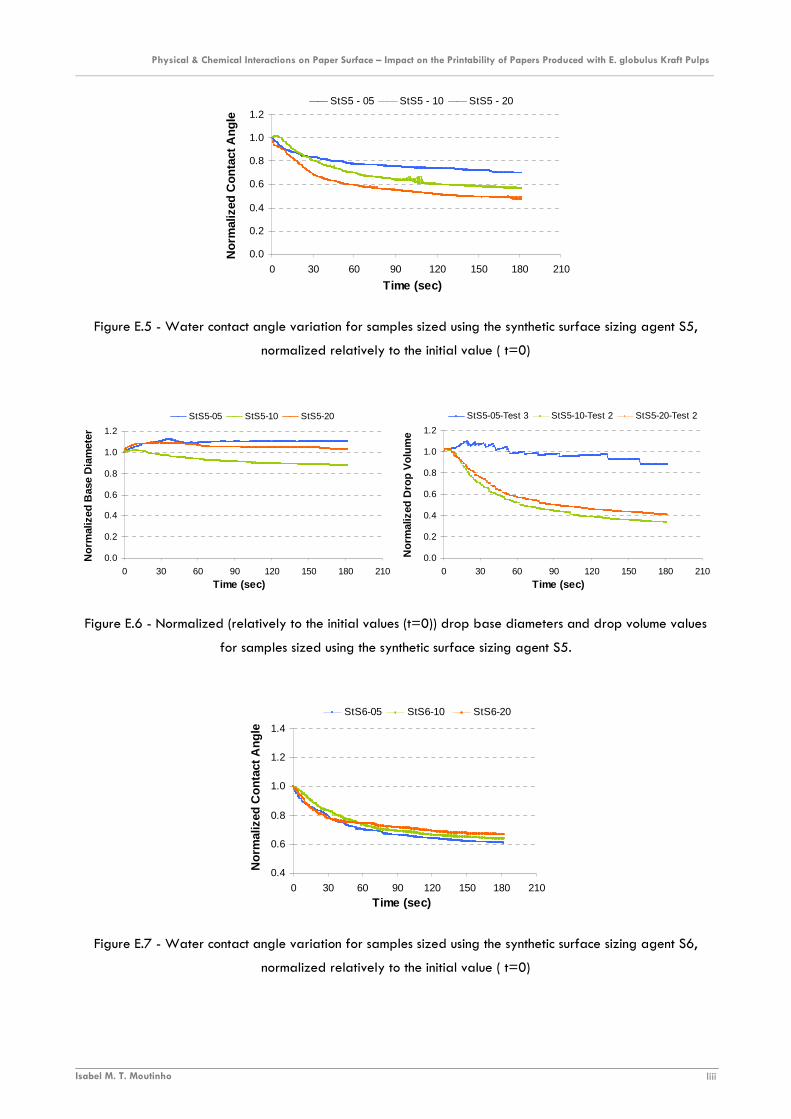
Physical & Chemical Interactions on Paper Surface – Impact on the Printability of Papers Produced with E. globulus Kraft Pulps ________________________________________________________________________________________________________________________
Isabel M. T. Moutinho liii
0.0
0.2
0.4
0.6
0.8
1.0
1.2
0 30 60 90 120 150 180 210
Time (sec)
Nor
mal
ized
Con
tact
Ang
le
StS5 - 05 StS5 - 10 StS5 - 20
Figure E.5 - Water contact angle variation for samples sized using the synthetic surface sizing agent S5,
normalized relatively to the initial value ( t=0)
0.0
0.2
0.4
0.6
0.8
1.0
1.2
0 30 60 90 120 150 180 210
Time (sec)
Nor
mal
ized
Bas
e D
iam
eter
StS5-05 StS5-10 StS5-20
0.0
0.2
0.4
0.6
0.8
1.0
1.2
0 30 60 90 120 150 180 210
Time (sec)
Nor
mal
ized
Dro
p V
olum
eStS5-05-Test 3 StS5-10-Test 2 StS5-20-Test 2
Figure E.6 - Normalized (relatively to the initial values (t=0)) drop base diameters and drop volume values
for samples sized using the synthetic surface sizing agent S5.
0.4
0.6
0.8
1.0
1.2
1.4
0 30 60 90 120 150 180 210
Time (sec)
Nor
mal
ized
Con
tact
Ang
le
StS6-05 StS6-10 StS6-20
Figure E.7 - Water contact angle variation for samples sized using the synthetic surface sizing agent S6,
normalized relatively to the initial value ( t=0)
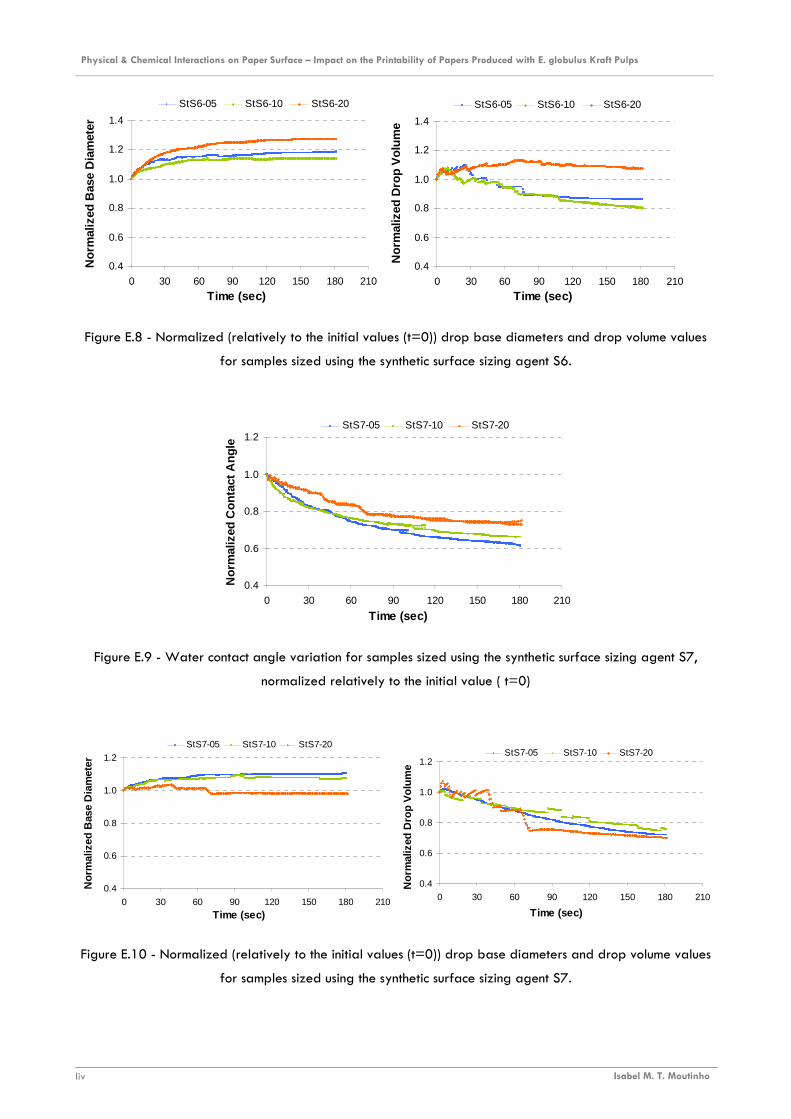
Physical & Chemical Interactions on Paper Surface – Impact on the Printability of Papers Produced with E. globulus Kraft Pulps ________________________________________________________________________________________________________________________
Isabel M. T. Moutinho liv
0.4
0.6
0.8
1.0
1.2
1.4
0 30 60 90 120 150 180 210
Time (sec)
Nor
mal
ized
Bas
e D
iam
eter
StS6-05 StS6-10 StS6-20
0.4
0.6
0.8
1.0
1.2
1.4
0 30 60 90 120 150 180 210
Time (sec)
Nor
mal
ized
Dro
p V
olum
e
StS6-05 StS6-10 StS6-20
Figure E.8 - Normalized (relatively to the initial values (t=0)) drop base diameters and drop volume values
for samples sized using the synthetic surface sizing agent S6.
0.4
0.6
0.8
1.0
1.2
0 30 60 90 120 150 180 210
Time (sec)
Nor
mal
ized
Con
tact
Ang
le
StS7-05 StS7-10 StS7-20
Figure E.9 - Water contact angle variation for samples sized using the synthetic surface sizing agent S7,
normalized relatively to the initial value ( t=0)
0.4
0.6
0.8
1.0
1.2
0 30 60 90 120 150 180 210
Time (sec)
Nor
mal
ized
Bas
e D
iam
eter
StS7-05 StS7-10 StS7-20
0.4
0.6
0.8
1.0
1.2
0 30 60 90 120 150 180 210
Time (sec)
Nor
mal
ized
Dro
p V
olum
e
StS7-05 StS7-10 StS7-20
Figure E.10 - Normalized (relatively to the initial values (t=0)) drop base diameters and drop volume values
for samples sized using the synthetic surface sizing agent S7.
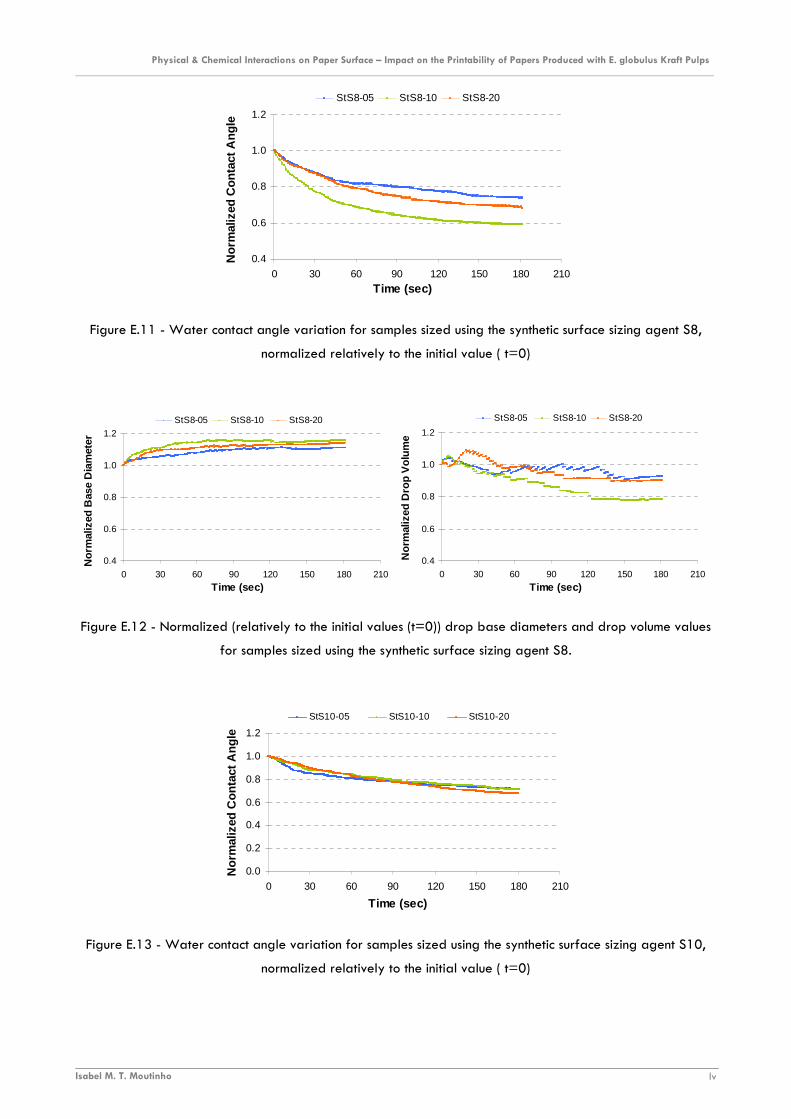
Physical & Chemical Interactions on Paper Surface – Impact on the Printability of Papers Produced with E. globulus Kraft Pulps ________________________________________________________________________________________________________________________
Isabel M. T. Moutinho lv
0.4
0.6
0.8
1.0
1.2
0 30 60 90 120 150 180 210
Time (sec)
Nor
mal
ized
Con
tact
Ang
le
StS8-05 StS8-10 StS8-20
Figure E.11 - Water contact angle variation for samples sized using the synthetic surface sizing agent S8,
normalized relatively to the initial value ( t=0)
0.4
0.6
0.8
1.0
1.2
0 30 60 90 120 150 180 210
Time (sec)
Nor
mal
ized
Bas
e D
iam
eter
StS8-05 StS8-10 StS8-20
0.4
0.6
0.8
1.0
1.2
0 30 60 90 120 150 180 210
Time (sec)
Nor
mal
ized
Dro
p V
olum
eStS8-05 StS8-10 StS8-20
Figure E.12 - Normalized (relatively to the initial values (t=0)) drop base diameters and drop volume values
for samples sized using the synthetic surface sizing agent S8.
0.0
0.2
0.4
0.6
0.8
1.0
1.2
0 30 60 90 120 150 180 210
Time (sec)
Nor
mal
ized
Con
tact
Ang
le
StS10-05 StS10-10 StS10-20
Figure E.13 - Water contact angle variation for samples sized using the synthetic surface sizing agent S10,
normalized relatively to the initial value ( t=0)
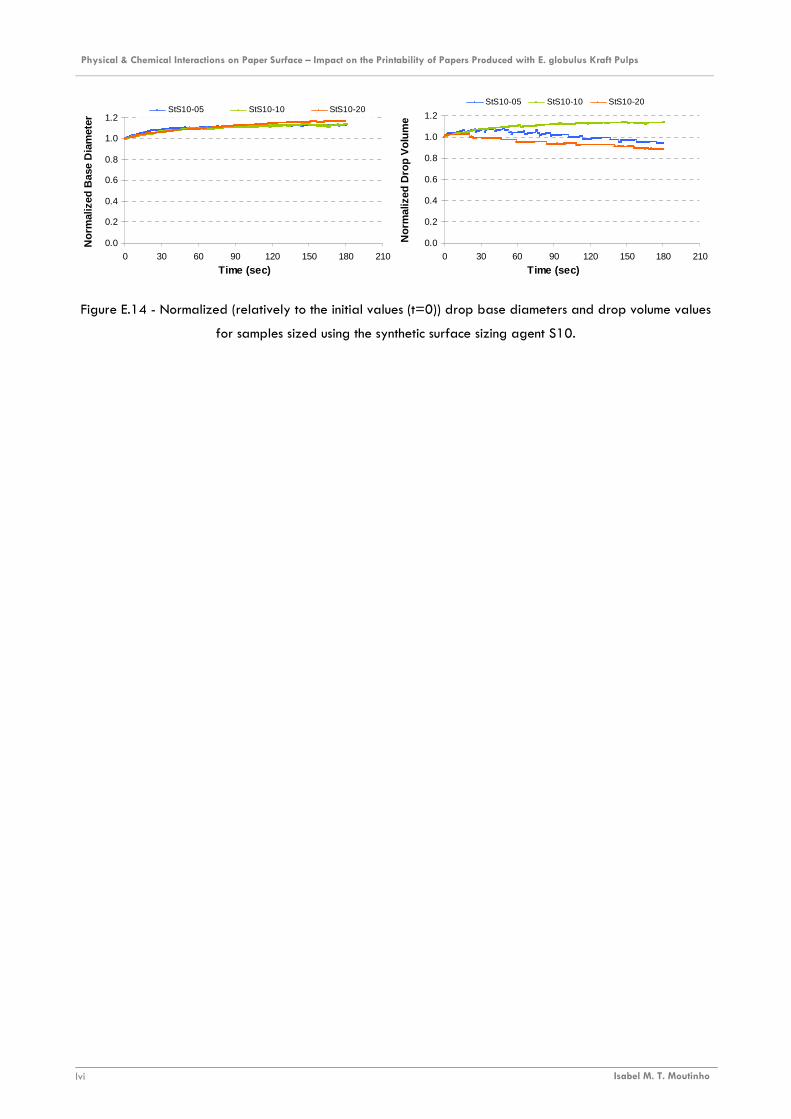
Physical & Chemical Interactions on Paper Surface – Impact on the Printability of Papers Produced with E. globulus Kraft Pulps ________________________________________________________________________________________________________________________
Isabel M. T. Moutinho lvi
0.0
0.2
0.4
0.6
0.8
1.0
1.2
0 30 60 90 120 150 180 210
Time (sec)
Nor
mal
ized
Bas
e D
iam
eter
StS10-05 StS10-10 StS10-20
0.0
0.2
0.4
0.6
0.8
1.0
1.2
0 30 60 90 120 150 180 210
Time (sec)
Nor
mal
ized
Dro
p V
olum
e
StS10-05 StS10-10 StS10-20
Figure E.14 - Normalized (relatively to the initial values (t=0)) drop base diameters and drop volume values
for samples sized using the synthetic surface sizing agent S10.

Physical & Chemical Interactions on Paper Surface – Impact on the Printability of Papers Produced with E. globulus Kraft Pulps ________________________________________________________________________________________________________________________
Isabel M. T. Moutinho lvii
APPENDIX F
INVERSE GAS CHROMATOGRAPHY
Tabel F.1 - ANOVA of the retention times determined by IGC.
Contribution for the total variation (%)
Variable (Probe)
T (ºC) Inter-Samples Intra-Samples
Reproducibility Factor (r)
P F Fcritical
35 99.19 0.81 0.004 5.47E-27 134.70 1.81 40 99.24 0.76 0.004 5.04E-21 113.32 1.90 45 99.19 0.81 0.005 3.12E-24 122.00 1.84 50 99.09 0.91 0.004 1.74E-23 108.60 1.84 55 99.38 0.62 0.005 6.80E-29 176.34 1.81
Methane
60 99.88 0.12 0.003 5.87E-34 768.72 1.87 35 99.63 0.37 0.003 1.96E-31 284.75 1.82 40 99.33 0.67 0.005 2.95E-29 167.07 1.80 45 99.84 0.16 0.003 3.67E-32 571.62 1.87 50 99.32 0.68 0.004 1.67E-23 136.26 1.87 55 99.90 0.10 0.003 1.54E-25 666.50 2.01
C6
60 99.82 0.18 0.004 1.71E-31 511.92 1.87 35 99.59 0.41 0.005 9.42E-31 257.95 1.82 40 99.88 0.12 0.003 9.45E-37 844.57 1.84 45 99.88 0.12 0.003 1.70E-35 825.30 1.85 50 99.72 0.28 0.003 1.11E-26 311.61 1.90 55 99.85 0.15 0.004 1.74E-31 607.72 1.88
C7
60 99.96 0.04 0.002 3.47E-36 2132.78 1.92 35 99.91 0.09 0.005 1.72E-46 1267.17 1.78 40 99.87 0.13 0.006 1.66E-41 886.44 1.80 45 99.90 0.10 0.006 1.89E-43 1154.17 1.80 50 99.88 0.12 0.003 5.31E-29 692.37 1.94 55 99.36 0.64 0.013 6.35E-23 139.70 1.88
C8
60 99.93 0.07 0.004 2.62E-38 1290.75 1.85 35 99.86 0.14 0.016 3.53E-50 996.47 1.74 40 99.90 0.10 0.015 4.77E-47 1173.64 1.77 45 99.95 0.05 0.009 1.68E-46 2078.99 1.81 50 99.79 0.21 0.008 2.89E-34 494.63 1.83 55 99.93 0.07 0.007 1.09E-37 1421.23 1.87
C9
60 99.92 0.08 0.008 3.86E-36 1101.41 1.87 35 99.84 0.16 0.049 4.76E-54 944.58 1.71 40 99.81 0.19 0.060 5.00E-46 701.13 1.74 45 99.91 0.09 0.030 1.59E-48 1410.92 1.77 50 99.90 0.10 0.016 5.59E-42 1105.34 1.81 55 97.19 2.81 0.111 5.32E-15 32.27 1.87
C10
60 99.96 0.04 0.011 4.29E-48 2597.47 1.81 35 91.80 8.20 0.021 4.23E-15 16.04 1.72 40 95.97 4.03 0.017 4.43E-22 34.97 1.72 45 99.19 0.81 0.008 9.37E-30 147.09 1.78 50 97.97 2.03 0.007 2.23E-23 59.66 1.77 55 99.58 0.42 0.006 2.14E-26 220.36 1.87
DCM
60 99.73 0.27 0.006 4.74E-29 341.97 1.87 TCM 35 94.83 5.17 0.017 1.28E-17 24.45 1.74
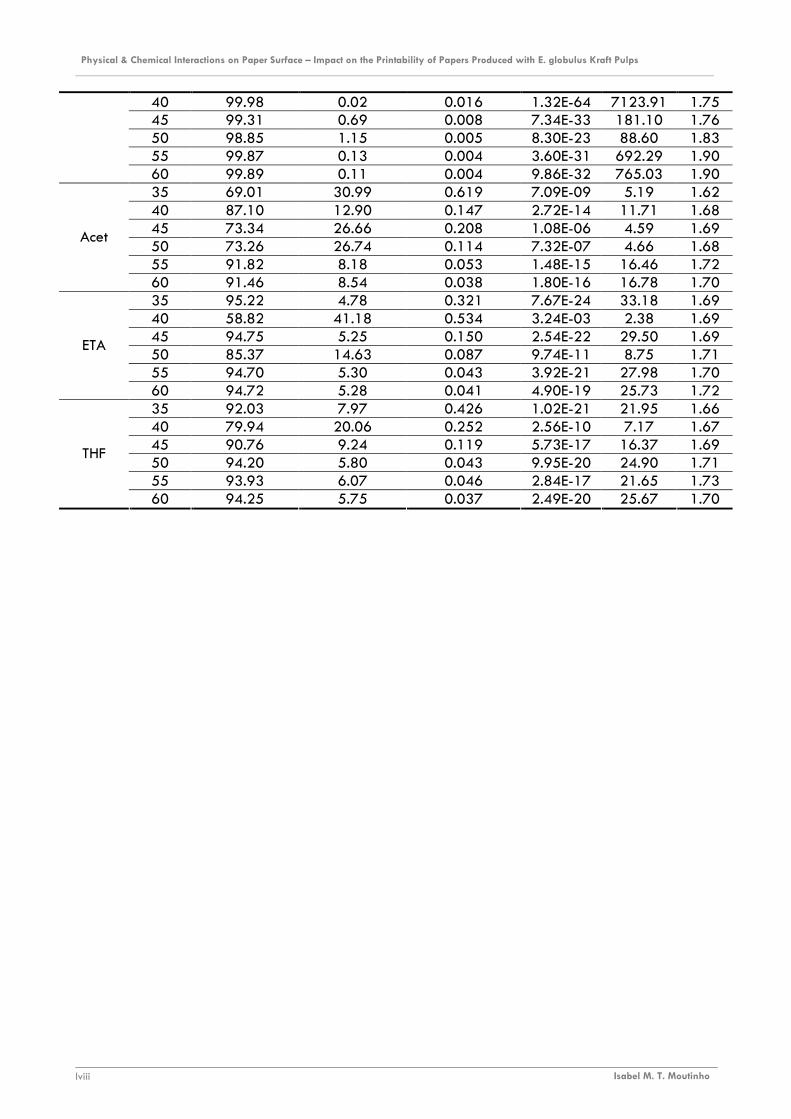
Physical & Chemical Interactions on Paper Surface – Impact on the Printability of Papers Produced with E. globulus Kraft Pulps ________________________________________________________________________________________________________________________
Isabel M. T. Moutinho lviii
40 99.98 0.02 0.016 1.32E-64 7123.91 1.75 45 99.31 0.69 0.008 7.34E-33 181.10 1.76 50 98.85 1.15 0.005 8.30E-23 88.60 1.83 55 99.87 0.13 0.004 3.60E-31 692.29 1.90 60 99.89 0.11 0.004 9.86E-32 765.03 1.90 35 69.01 30.99 0.619 7.09E-09 5.19 1.62 40 87.10 12.90 0.147 2.72E-14 11.71 1.68 45 73.34 26.66 0.208 1.08E-06 4.59 1.69 50 73.26 26.74 0.114 7.32E-07 4.66 1.68 55 91.82 8.18 0.053 1.48E-15 16.46 1.72
Acet
60 91.46 8.54 0.038 1.80E-16 16.78 1.70 35 95.22 4.78 0.321 7.67E-24 33.18 1.69 40 58.82 41.18 0.534 3.24E-03 2.38 1.69 45 94.75 5.25 0.150 2.54E-22 29.50 1.69 50 85.37 14.63 0.087 9.74E-11 8.75 1.71 55 94.70 5.30 0.043 3.92E-21 27.98 1.70
ETA
60 94.72 5.28 0.041 4.90E-19 25.73 1.72 35 92.03 7.97 0.426 1.02E-21 21.95 1.66 40 79.94 20.06 0.252 2.56E-10 7.17 1.67 45 90.76 9.24 0.119 5.73E-17 16.37 1.69 50 94.20 5.80 0.043 9.95E-20 24.90 1.71 55 93.93 6.07 0.046 2.84E-17 21.65 1.73
THF
60 94.25 5.75 0.037 2.49E-20 25.67 1.70
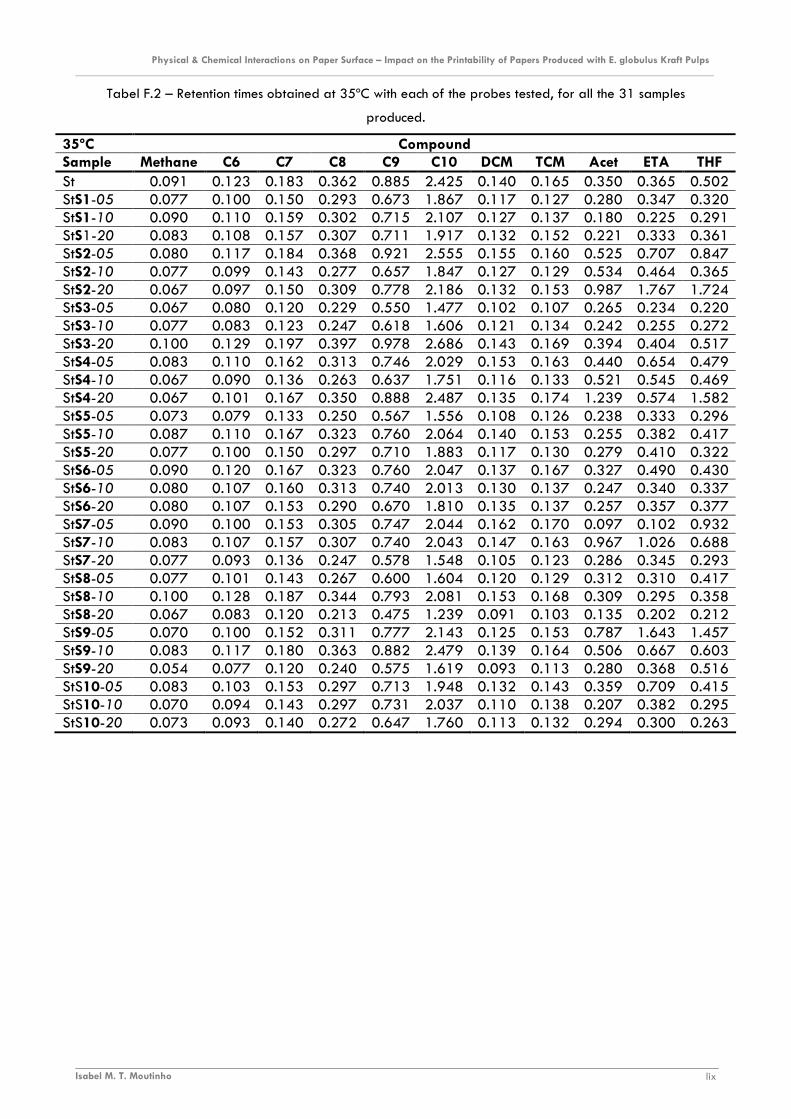
Physical & Chemical Interactions on Paper Surface – Impact on the Printability of Papers Produced with E. globulus Kraft Pulps ________________________________________________________________________________________________________________________
Isabel M. T. Moutinho lix
Tabel F.2 – Retention times obtained at 35ºC with each of the probes tested, for all the 31 samples
produced.
35ºC Compound Sample Methane C6 C7 C8 C9 C10 DCM TCM Acet ETA THF St 0.091 0.123 0.183 0.362 0.885 2.425 0.140 0.165 0.350 0.365 0.502 StS1-05 0.077 0.100 0.150 0.293 0.673 1.867 0.117 0.127 0.280 0.347 0.320 StS1-10 0.090 0.110 0.159 0.302 0.715 2.107 0.127 0.137 0.180 0.225 0.291 StS1-20 0.083 0.108 0.157 0.307 0.711 1.917 0.132 0.152 0.221 0.333 0.361 StS2-05 0.080 0.117 0.184 0.368 0.921 2.555 0.155 0.160 0.525 0.707 0.847 StS2-10 0.077 0.099 0.143 0.277 0.657 1.847 0.127 0.129 0.534 0.464 0.365 StS2-20 0.067 0.097 0.150 0.309 0.778 2.186 0.132 0.153 0.987 1.767 1.724 StS3-05 0.067 0.080 0.120 0.229 0.550 1.477 0.102 0.107 0.265 0.234 0.220 StS3-10 0.077 0.083 0.123 0.247 0.618 1.606 0.121 0.134 0.242 0.255 0.272 StS3-20 0.100 0.129 0.197 0.397 0.978 2.686 0.143 0.169 0.394 0.404 0.517 StS4-05 0.083 0.110 0.162 0.313 0.746 2.029 0.153 0.163 0.440 0.654 0.479 StS4-10 0.067 0.090 0.136 0.263 0.637 1.751 0.116 0.133 0.521 0.545 0.469 StS4-20 0.067 0.101 0.167 0.350 0.888 2.487 0.135 0.174 1.239 0.574 1.582 StS5-05 0.073 0.079 0.133 0.250 0.567 1.556 0.108 0.126 0.238 0.333 0.296 StS5-10 0.087 0.110 0.167 0.323 0.760 2.064 0.140 0.153 0.255 0.382 0.417 StS5-20 0.077 0.100 0.150 0.297 0.710 1.883 0.117 0.130 0.279 0.410 0.322 StS6-05 0.090 0.120 0.167 0.323 0.760 2.047 0.137 0.167 0.327 0.490 0.430 StS6-10 0.080 0.107 0.160 0.313 0.740 2.013 0.130 0.137 0.247 0.340 0.337 StS6-20 0.080 0.107 0.153 0.290 0.670 1.810 0.135 0.137 0.257 0.357 0.377 StS7-05 0.090 0.100 0.153 0.305 0.747 2.044 0.162 0.170 0.097 0.102 0.932 StS7-10 0.083 0.107 0.157 0.307 0.740 2.043 0.147 0.163 0.967 1.026 0.688 StS7-20 0.077 0.093 0.136 0.247 0.578 1.548 0.105 0.123 0.286 0.345 0.293 StS8-05 0.077 0.101 0.143 0.267 0.600 1.604 0.120 0.129 0.312 0.310 0.417 StS8-10 0.100 0.128 0.187 0.344 0.793 2.081 0.153 0.168 0.309 0.295 0.358 StS8-20 0.067 0.083 0.120 0.213 0.475 1.239 0.091 0.103 0.135 0.202 0.212 StS9-05 0.070 0.100 0.152 0.311 0.777 2.143 0.125 0.153 0.787 1.643 1.457 StS9-10 0.083 0.117 0.180 0.363 0.882 2.479 0.139 0.164 0.506 0.667 0.603 StS9-20 0.054 0.077 0.120 0.240 0.575 1.619 0.093 0.113 0.280 0.368 0.516 StS10-05 0.083 0.103 0.153 0.297 0.713 1.948 0.132 0.143 0.359 0.709 0.415 StS10-10 0.070 0.094 0.143 0.297 0.731 2.037 0.110 0.138 0.207 0.382 0.295 StS10-20 0.073 0.093 0.140 0.272 0.647 1.760 0.113 0.132 0.294 0.300 0.263
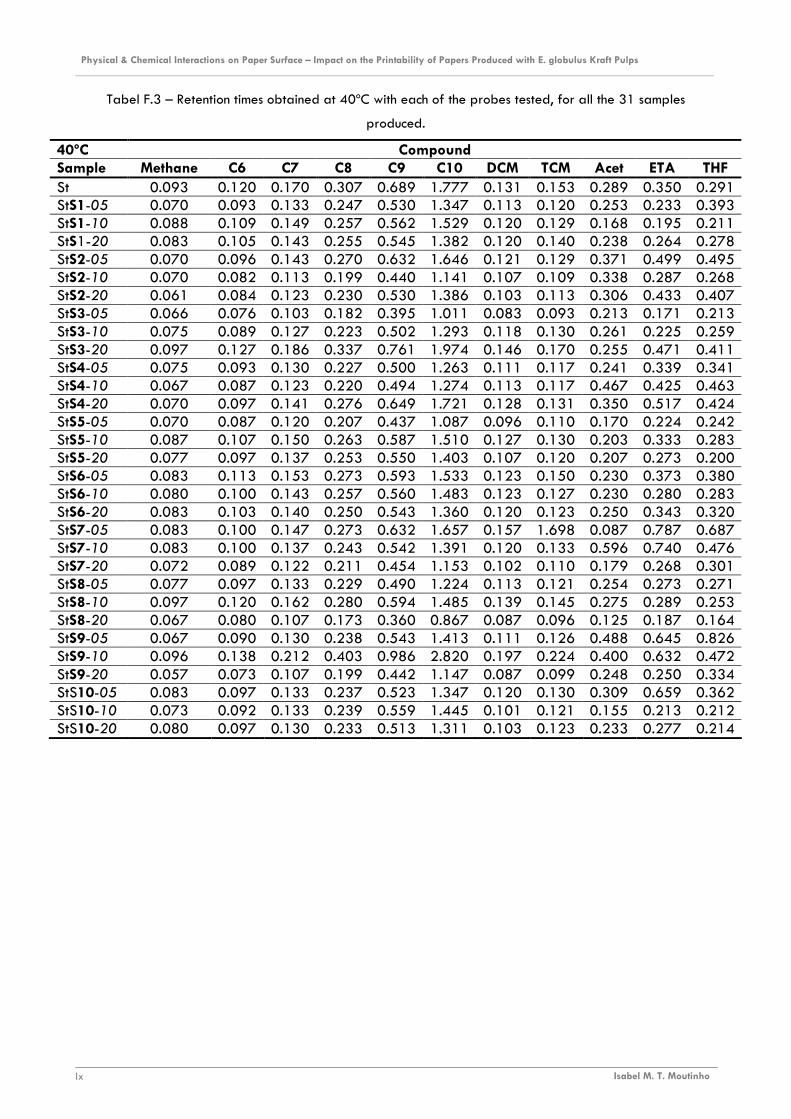
Physical & Chemical Interactions on Paper Surface – Impact on the Printability of Papers Produced with E. globulus Kraft Pulps ________________________________________________________________________________________________________________________
Isabel M. T. Moutinho lx
Tabel F.3 – Retention times obtained at 40ºC with each of the probes tested, for all the 31 samples
produced.
40ºC Compound Sample Methane C6 C7 C8 C9 C10 DCM TCM Acet ETA THF St 0.093 0.120 0.170 0.307 0.689 1.777 0.131 0.153 0.289 0.350 0.291 StS1-05 0.070 0.093 0.133 0.247 0.530 1.347 0.113 0.120 0.253 0.233 0.393 StS1-10 0.088 0.109 0.149 0.257 0.562 1.529 0.120 0.129 0.168 0.195 0.211 StS1-20 0.083 0.105 0.143 0.255 0.545 1.382 0.120 0.140 0.238 0.264 0.278 StS2-05 0.070 0.096 0.143 0.270 0.632 1.646 0.121 0.129 0.371 0.499 0.495 StS2-10 0.070 0.082 0.113 0.199 0.440 1.141 0.107 0.109 0.338 0.287 0.268 StS2-20 0.061 0.084 0.123 0.230 0.530 1.386 0.103 0.113 0.306 0.433 0.407 StS3-05 0.066 0.076 0.103 0.182 0.395 1.011 0.083 0.093 0.213 0.171 0.213 StS3-10 0.075 0.089 0.127 0.223 0.502 1.293 0.118 0.130 0.261 0.225 0.259 StS3-20 0.097 0.127 0.186 0.337 0.761 1.974 0.146 0.170 0.255 0.471 0.411 StS4-05 0.075 0.093 0.130 0.227 0.500 1.263 0.111 0.117 0.241 0.339 0.341 StS4-10 0.067 0.087 0.123 0.220 0.494 1.274 0.113 0.117 0.467 0.425 0.463 StS4-20 0.070 0.097 0.141 0.276 0.649 1.721 0.128 0.131 0.350 0.517 0.424 StS5-05 0.070 0.087 0.120 0.207 0.437 1.087 0.096 0.110 0.170 0.224 0.242 StS5-10 0.087 0.107 0.150 0.263 0.587 1.510 0.127 0.130 0.203 0.333 0.283 StS5-20 0.077 0.097 0.137 0.253 0.550 1.403 0.107 0.120 0.207 0.273 0.200 StS6-05 0.083 0.113 0.153 0.273 0.593 1.533 0.123 0.150 0.230 0.373 0.380 StS6-10 0.080 0.100 0.143 0.257 0.560 1.483 0.123 0.127 0.230 0.280 0.283 StS6-20 0.083 0.103 0.140 0.250 0.543 1.360 0.120 0.123 0.250 0.343 0.320 StS7-05 0.083 0.100 0.147 0.273 0.632 1.657 0.157 1.698 0.087 0.787 0.687 StS7-10 0.083 0.100 0.137 0.243 0.542 1.391 0.120 0.133 0.596 0.740 0.476 StS7-20 0.072 0.089 0.122 0.211 0.454 1.153 0.102 0.110 0.179 0.268 0.301 StS8-05 0.077 0.097 0.133 0.229 0.490 1.224 0.113 0.121 0.254 0.273 0.271 StS8-10 0.097 0.120 0.162 0.280 0.594 1.485 0.139 0.145 0.275 0.289 0.253 StS8-20 0.067 0.080 0.107 0.173 0.360 0.867 0.087 0.096 0.125 0.187 0.164 StS9-05 0.067 0.090 0.130 0.238 0.543 1.413 0.111 0.126 0.488 0.645 0.826 StS9-10 0.096 0.138 0.212 0.403 0.986 2.820 0.197 0.224 0.400 0.632 0.472 StS9-20 0.057 0.073 0.107 0.199 0.442 1.147 0.087 0.099 0.248 0.250 0.334 StS10-05 0.083 0.097 0.133 0.237 0.523 1.347 0.120 0.130 0.309 0.659 0.362 StS10-10 0.073 0.092 0.133 0.239 0.559 1.445 0.101 0.121 0.155 0.213 0.212 StS10-20 0.080 0.097 0.130 0.233 0.513 1.311 0.103 0.123 0.233 0.277 0.214
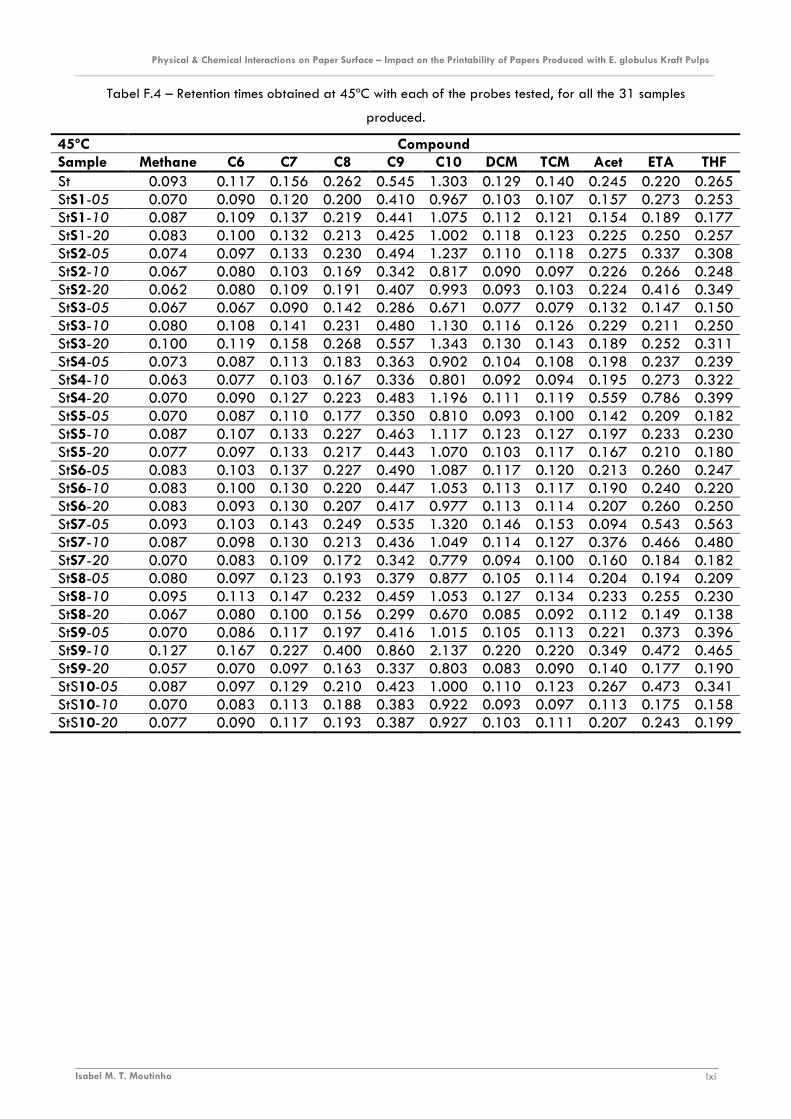
Physical & Chemical Interactions on Paper Surface – Impact on the Printability of Papers Produced with E. globulus Kraft Pulps ________________________________________________________________________________________________________________________
Isabel M. T. Moutinho lxi
Tabel F.4 – Retention times obtained at 45ºC with each of the probes tested, for all the 31 samples
produced.
45ºC Compound Sample Methane C6 C7 C8 C9 C10 DCM TCM Acet ETA THF St 0.093 0.117 0.156 0.262 0.545 1.303 0.129 0.140 0.245 0.220 0.265 StS1-05 0.070 0.090 0.120 0.200 0.410 0.967 0.103 0.107 0.157 0.273 0.253 StS1-10 0.087 0.109 0.137 0.219 0.441 1.075 0.112 0.121 0.154 0.189 0.177 StS1-20 0.083 0.100 0.132 0.213 0.425 1.002 0.118 0.123 0.225 0.250 0.257 StS2-05 0.074 0.097 0.133 0.230 0.494 1.237 0.110 0.118 0.275 0.337 0.308 StS2-10 0.067 0.080 0.103 0.169 0.342 0.817 0.090 0.097 0.226 0.266 0.248 StS2-20 0.062 0.080 0.109 0.191 0.407 0.993 0.093 0.103 0.224 0.416 0.349 StS3-05 0.067 0.067 0.090 0.142 0.286 0.671 0.077 0.079 0.132 0.147 0.150 StS3-10 0.080 0.108 0.141 0.231 0.480 1.130 0.116 0.126 0.229 0.211 0.250 StS3-20 0.100 0.119 0.158 0.268 0.557 1.343 0.130 0.143 0.189 0.252 0.311 StS4-05 0.073 0.087 0.113 0.183 0.363 0.902 0.104 0.108 0.198 0.237 0.239 StS4-10 0.063 0.077 0.103 0.167 0.336 0.801 0.092 0.094 0.195 0.273 0.322 StS4-20 0.070 0.090 0.127 0.223 0.483 1.196 0.111 0.119 0.559 0.786 0.399 StS5-05 0.070 0.087 0.110 0.177 0.350 0.810 0.093 0.100 0.142 0.209 0.182 StS5-10 0.087 0.107 0.133 0.227 0.463 1.117 0.123 0.127 0.197 0.233 0.230 StS5-20 0.077 0.097 0.133 0.217 0.443 1.070 0.103 0.117 0.167 0.210 0.180 StS6-05 0.083 0.103 0.137 0.227 0.490 1.087 0.117 0.120 0.213 0.260 0.247 StS6-10 0.083 0.100 0.130 0.220 0.447 1.053 0.113 0.117 0.190 0.240 0.220 StS6-20 0.083 0.093 0.130 0.207 0.417 0.977 0.113 0.114 0.207 0.260 0.250 StS7-05 0.093 0.103 0.143 0.249 0.535 1.320 0.146 0.153 0.094 0.543 0.563 StS7-10 0.087 0.098 0.130 0.213 0.436 1.049 0.114 0.127 0.376 0.466 0.480 StS7-20 0.070 0.083 0.109 0.172 0.342 0.779 0.094 0.100 0.160 0.184 0.182 StS8-05 0.080 0.097 0.123 0.193 0.379 0.877 0.105 0.114 0.204 0.194 0.209 StS8-10 0.095 0.113 0.147 0.232 0.459 1.053 0.127 0.134 0.233 0.255 0.230 StS8-20 0.067 0.080 0.100 0.156 0.299 0.670 0.085 0.092 0.112 0.149 0.138 StS9-05 0.070 0.086 0.117 0.197 0.416 1.015 0.105 0.113 0.221 0.373 0.396 StS9-10 0.127 0.167 0.227 0.400 0.860 2.137 0.220 0.220 0.349 0.472 0.465 StS9-20 0.057 0.070 0.097 0.163 0.337 0.803 0.083 0.090 0.140 0.177 0.190 StS10-05 0.087 0.097 0.129 0.210 0.423 1.000 0.110 0.123 0.267 0.473 0.341 StS10-10 0.070 0.083 0.113 0.188 0.383 0.922 0.093 0.097 0.113 0.175 0.158 StS10-20 0.077 0.090 0.117 0.193 0.387 0.927 0.103 0.111 0.207 0.243 0.199

Physical & Chemical Interactions on Paper Surface – Impact on the Printability of Papers Produced with E. globulus Kraft Pulps ________________________________________________________________________________________________________________________
Isabel M. T. Moutinho lxii
Tabel F.5 – Retention times obtained at 35ºC with each of the probes tested, for all the 31 samples
produced.
50ºC Compound Sample Methane C6 C7 C8 C9 C10 DCM TCM Acet ETA THF St 0.093 0.113 0.140 0.219 0.419 0.937 0.124 0.129 0.171 0.205 0.220 StS1-05 0.073 0.087 0.110 0.173 0.323 0.717 0.097 0.107 0.157 0.163 0.223 StS1-10 0.073 0.087 0.107 0.160 0.293 0.652 0.091 0.099 0.117 0.139 0.140 StS1-20 0.083 0.096 0.120 0.177 0.322 0.710 0.107 0.113 0.166 0.225 0.194 StS2-05 0.070 0.088 0.117 0.187 0.370 0.855 0.103 0.112 0.208 0.307 0.306 StS2-10 0.067 0.080 0.097 0.147 0.276 0.612 0.090 0.093 0.148 0.183 0.181 StS2-20 0.063 0.080 0.100 0.160 0.316 0.716 0.087 0.094 0.168 0.207 0.233 StS3-05 0.063 0.070 0.087 0.130 0.240 0.527 0.073 0.080 0.124 0.130 0.139 StS3-10 0.074 0.093 0.111 0.167 0.310 0.690 0.114 0.124 0.184 0.175 0.184 StS3-20 0.083 0.093 0.117 0.183 0.347 0.786 0.106 0.110 0.137 0.182 0.180 StS4-05 0.076 0.087 0.107 0.160 0.294 0.661 0.099 0.103 0.172 0.208 0.195 StS4-10 0.063 0.073 0.093 0.140 0.260 0.577 0.084 0.088 0.162 0.210 0.238 StS4-20 0.063 0.080 0.103 0.167 0.332 0.767 0.098 0.097 0.320 0.318 0.274 StS5-05 0.070 0.087 0.103 0.157 0.287 0.623 0.090 0.097 0.130 0.160 0.145 StS5-10 0.087 0.100 0.127 0.200 0.373 0.873 0.113 0.123 0.194 0.220 0.227 StS5-20 0.080 0.097 0.123 0.193 0.377 0.847 0.103 0.113 0.143 0.173 0.167 StS6-05 0.083 0.103 0.123 0.190 0.353 0.790 0.109 0.110 0.173 0.223 0.220 StS6-10 0.083 0.100 0.123 0.187 0.347 0.803 0.107 0.113 0.157 0.220 0.210 StS6-20 0.080 0.093 0.117 0.173 0.317 0.707 0.100 0.112 0.167 0.193 0.180 StS7-05 0.083 0.090 0.117 0.189 0.376 0.873 0.110 0.117 0.084 0.229 0.189 StS7-10 0.083 0.093 0.113 0.177 0.335 0.747 0.106 0.113 0.286 0.358 0.302 StS7-20 0.067 0.082 0.100 0.150 0.267 0.583 0.089 0.093 0.125 0.151 0.153 StS8-05 0.082 0.090 0.113 0.167 0.302 0.652 0.101 0.107 0.155 0.175 0.174 StS8-10 0.097 0.111 0.138 0.202 0.362 0.780 0.121 0.129 0.187 0.202 0.190 StS8-20 0.070 0.079 0.097 0.139 0.249 0.520 0.083 0.090 0.109 0.134 0.132 StS9-05 0.063 0.076 0.096 0.147 0.281 0.638 0.084 0.093 0.182 0.247 0.267 StS9-10 xxx xxx xxx xxx xxx xxx xxx xxx xxx xxx xxx StS9-20 0.057 0.070 0.087 0.135 0.259 0.580 0.075 0.083 0.157 0.162 0.194 StS10-05 0.083 0.090 0.113 0.170 0.317 0.700 0.100 0.110 0.199 0.235 0.202 StS10-10 0.073 0.080 0.102 0.157 0.300 0.677 0.087 0.096 0.117 0.156 0.149 StS10-20 0.077 0.087 0.107 0.160 0.300 0.670 0.097 0.103 0.177 0.200 0.167
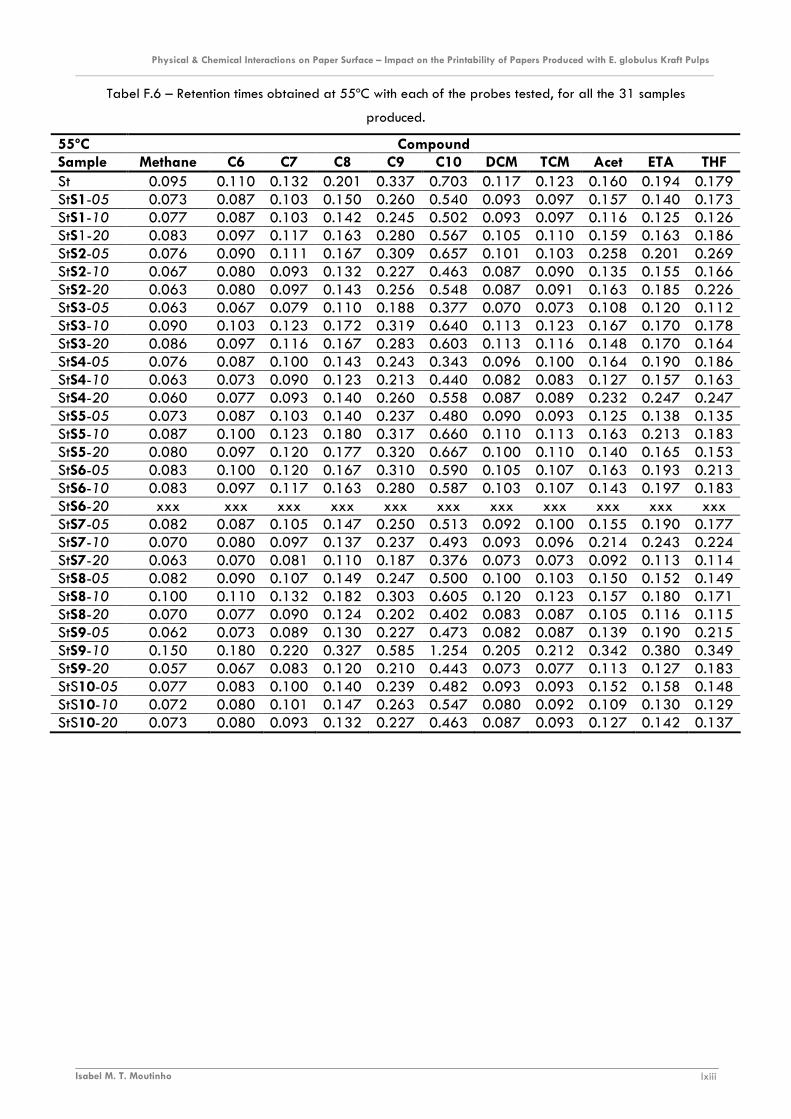
Physical & Chemical Interactions on Paper Surface – Impact on the Printability of Papers Produced with E. globulus Kraft Pulps ________________________________________________________________________________________________________________________
Isabel M. T. Moutinho lxiii
Tabel F.6 – Retention times obtained at 55ºC with each of the probes tested, for all the 31 samples
produced.
55ºC Compound Sample Methane C6 C7 C8 C9 C10 DCM TCM Acet ETA THF St 0.095 0.110 0.132 0.201 0.337 0.703 0.117 0.123 0.160 0.194 0.179 StS1-05 0.073 0.087 0.103 0.150 0.260 0.540 0.093 0.097 0.157 0.140 0.173 StS1-10 0.077 0.087 0.103 0.142 0.245 0.502 0.093 0.097 0.116 0.125 0.126 StS1-20 0.083 0.097 0.117 0.163 0.280 0.567 0.105 0.110 0.159 0.163 0.186 StS2-05 0.076 0.090 0.111 0.167 0.309 0.657 0.101 0.103 0.258 0.201 0.269 StS2-10 0.067 0.080 0.093 0.132 0.227 0.463 0.087 0.090 0.135 0.155 0.166 StS2-20 0.063 0.080 0.097 0.143 0.256 0.548 0.087 0.091 0.163 0.185 0.226 StS3-05 0.063 0.067 0.079 0.110 0.188 0.377 0.070 0.073 0.108 0.120 0.112 StS3-10 0.090 0.103 0.123 0.172 0.319 0.640 0.113 0.123 0.167 0.170 0.178 StS3-20 0.086 0.097 0.116 0.167 0.283 0.603 0.113 0.116 0.148 0.170 0.164 StS4-05 0.076 0.087 0.100 0.143 0.243 0.343 0.096 0.100 0.164 0.190 0.186 StS4-10 0.063 0.073 0.090 0.123 0.213 0.440 0.082 0.083 0.127 0.157 0.163 StS4-20 0.060 0.077 0.093 0.140 0.260 0.558 0.087 0.089 0.232 0.247 0.247 StS5-05 0.073 0.087 0.103 0.140 0.237 0.480 0.090 0.093 0.125 0.138 0.135 StS5-10 0.087 0.100 0.123 0.180 0.317 0.660 0.110 0.113 0.163 0.213 0.183 StS5-20 0.080 0.097 0.120 0.177 0.320 0.667 0.100 0.110 0.140 0.165 0.153 StS6-05 0.083 0.100 0.120 0.167 0.310 0.590 0.105 0.107 0.163 0.193 0.213 StS6-10 0.083 0.097 0.117 0.163 0.280 0.587 0.103 0.107 0.143 0.197 0.183 StS6-20 xxx xxx xxx xxx xxx xxx xxx xxx xxx xxx xxx StS7-05 0.082 0.087 0.105 0.147 0.250 0.513 0.092 0.100 0.155 0.190 0.177 StS7-10 0.070 0.080 0.097 0.137 0.237 0.493 0.093 0.096 0.214 0.243 0.224 StS7-20 0.063 0.070 0.081 0.110 0.187 0.376 0.073 0.073 0.092 0.113 0.114 StS8-05 0.082 0.090 0.107 0.149 0.247 0.500 0.100 0.103 0.150 0.152 0.149 StS8-10 0.100 0.110 0.132 0.182 0.303 0.605 0.120 0.123 0.157 0.180 0.171 StS8-20 0.070 0.077 0.090 0.124 0.202 0.402 0.083 0.087 0.105 0.116 0.115 StS9-05 0.062 0.073 0.089 0.130 0.227 0.473 0.082 0.087 0.139 0.190 0.215 StS9-10 0.150 0.180 0.220 0.327 0.585 1.254 0.205 0.212 0.342 0.380 0.349 StS9-20 0.057 0.067 0.083 0.120 0.210 0.443 0.073 0.077 0.113 0.127 0.183 StS10-05 0.077 0.083 0.100 0.140 0.239 0.482 0.093 0.093 0.152 0.158 0.148 StS10-10 0.072 0.080 0.101 0.147 0.263 0.547 0.080 0.092 0.109 0.130 0.129 StS10-20 0.073 0.080 0.093 0.132 0.227 0.463 0.087 0.093 0.127 0.142 0.137
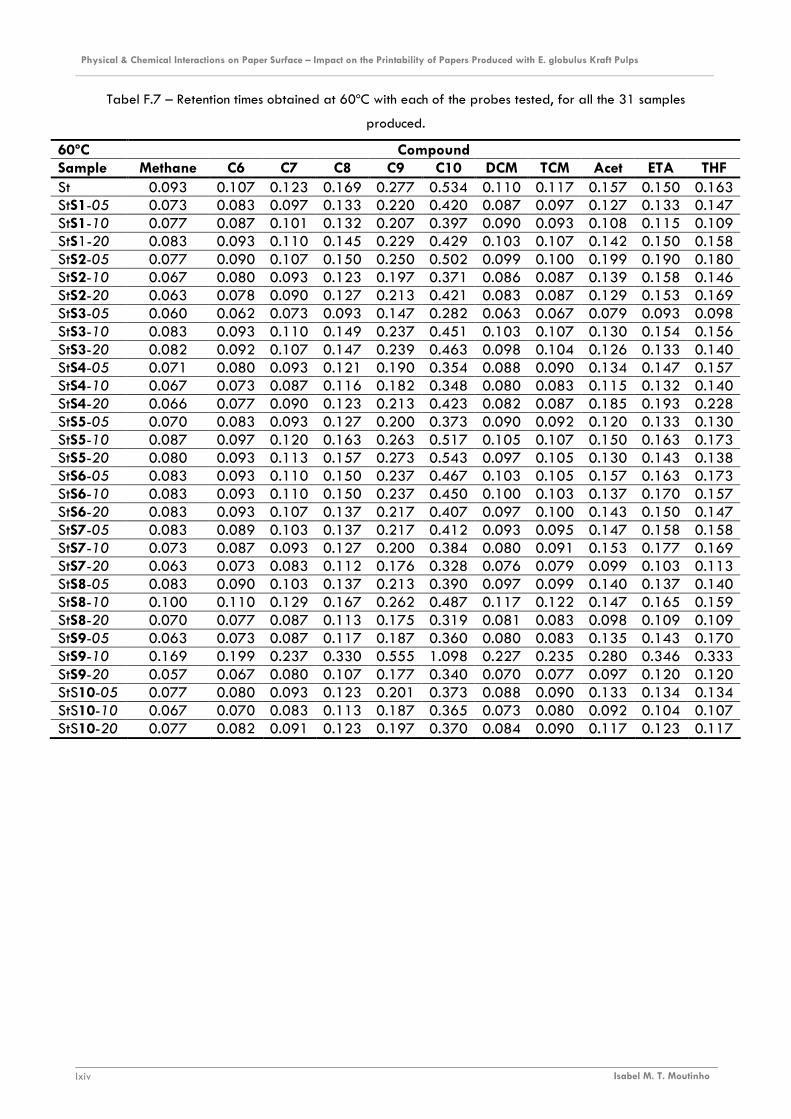
Physical & Chemical Interactions on Paper Surface – Impact on the Printability of Papers Produced with E. globulus Kraft Pulps ________________________________________________________________________________________________________________________
Isabel M. T. Moutinho lxiv
Tabel F.7 – Retention times obtained at 60ºC with each of the probes tested, for all the 31 samples
produced.
60ºC Compound Sample Methane C6 C7 C8 C9 C10 DCM TCM Acet ETA THF St 0.093 0.107 0.123 0.169 0.277 0.534 0.110 0.117 0.157 0.150 0.163 StS1-05 0.073 0.083 0.097 0.133 0.220 0.420 0.087 0.097 0.127 0.133 0.147 StS1-10 0.077 0.087 0.101 0.132 0.207 0.397 0.090 0.093 0.108 0.115 0.109 StS1-20 0.083 0.093 0.110 0.145 0.229 0.429 0.103 0.107 0.142 0.150 0.158 StS2-05 0.077 0.090 0.107 0.150 0.250 0.502 0.099 0.100 0.199 0.190 0.180 StS2-10 0.067 0.080 0.093 0.123 0.197 0.371 0.086 0.087 0.139 0.158 0.146 StS2-20 0.063 0.078 0.090 0.127 0.213 0.421 0.083 0.087 0.129 0.153 0.169 StS3-05 0.060 0.062 0.073 0.093 0.147 0.282 0.063 0.067 0.079 0.093 0.098 StS3-10 0.083 0.093 0.110 0.149 0.237 0.451 0.103 0.107 0.130 0.154 0.156 StS3-20 0.082 0.092 0.107 0.147 0.239 0.463 0.098 0.104 0.126 0.133 0.140 StS4-05 0.071 0.080 0.093 0.121 0.190 0.354 0.088 0.090 0.134 0.147 0.157 StS4-10 0.067 0.073 0.087 0.116 0.182 0.348 0.080 0.083 0.115 0.132 0.140 StS4-20 0.066 0.077 0.090 0.123 0.213 0.423 0.082 0.087 0.185 0.193 0.228 StS5-05 0.070 0.083 0.093 0.127 0.200 0.373 0.090 0.092 0.120 0.133 0.130 StS5-10 0.087 0.097 0.120 0.163 0.263 0.517 0.105 0.107 0.150 0.163 0.173 StS5-20 0.080 0.093 0.113 0.157 0.273 0.543 0.097 0.105 0.130 0.143 0.138 StS6-05 0.083 0.093 0.110 0.150 0.237 0.467 0.103 0.105 0.157 0.163 0.173 StS6-10 0.083 0.093 0.110 0.150 0.237 0.450 0.100 0.103 0.137 0.170 0.157 StS6-20 0.083 0.093 0.107 0.137 0.217 0.407 0.097 0.100 0.143 0.150 0.147 StS7-05 0.083 0.089 0.103 0.137 0.217 0.412 0.093 0.095 0.147 0.158 0.158 StS7-10 0.073 0.087 0.093 0.127 0.200 0.384 0.080 0.091 0.153 0.177 0.169 StS7-20 0.063 0.073 0.083 0.112 0.176 0.328 0.076 0.079 0.099 0.103 0.113 StS8-05 0.083 0.090 0.103 0.137 0.213 0.390 0.097 0.099 0.140 0.137 0.140 StS8-10 0.100 0.110 0.129 0.167 0.262 0.487 0.117 0.122 0.147 0.165 0.159 StS8-20 0.070 0.077 0.087 0.113 0.175 0.319 0.081 0.083 0.098 0.109 0.109 StS9-05 0.063 0.073 0.087 0.117 0.187 0.360 0.080 0.083 0.135 0.143 0.170 StS9-10 0.169 0.199 0.237 0.330 0.555 1.098 0.227 0.235 0.280 0.346 0.333 StS9-20 0.057 0.067 0.080 0.107 0.177 0.340 0.070 0.077 0.097 0.120 0.120 StS10-05 0.077 0.080 0.093 0.123 0.201 0.373 0.088 0.090 0.133 0.134 0.134 StS10-10 0.067 0.070 0.083 0.113 0.187 0.365 0.073 0.080 0.092 0.104 0.107 StS10-20 0.077 0.082 0.091 0.123 0.197 0.370 0.084 0.090 0.117 0.123 0.117
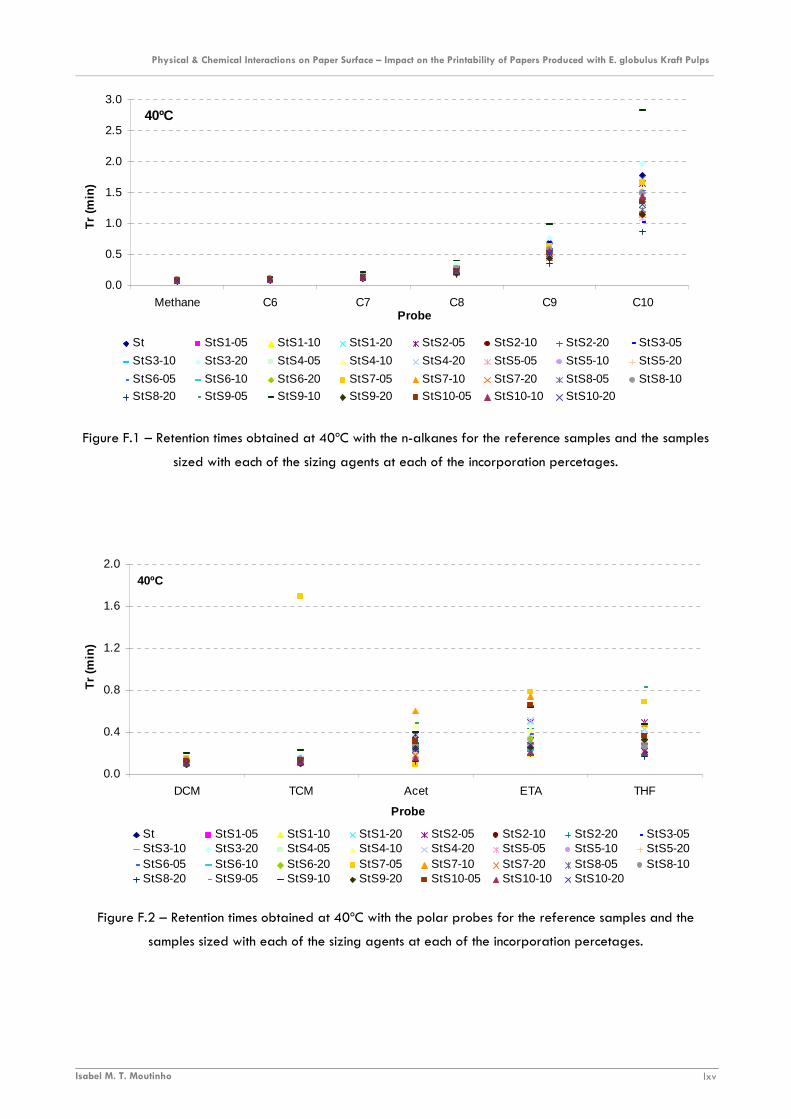
Physical & Chemical Interactions on Paper Surface – Impact on the Printability of Papers Produced with E. globulus Kraft Pulps ________________________________________________________________________________________________________________________
Isabel M. T. Moutinho lxv
40ºC
0.0
0.5
1.0
1.5
2.0
2.5
3.0
Methane C6 C7 C8 C9 C10Probe
Tr
(min
)
St StS1-05 StS1-10 StS1-20 StS2-05 StS2-10 StS2-20 StS3-05
StS3-10 StS3-20 StS4-05 StS4-10 StS4-20 StS5-05 StS5-10 StS5-20
StS6-05 StS6-10 StS6-20 StS7-05 StS7-10 StS7-20 StS8-05 StS8-10
StS8-20 StS9-05 StS9-10 StS9-20 StS10-05 StS10-10 StS10-20
Figure F.1 – Retention times obtained at 40ºC with the n-alkanes for the reference samples and the samples
sized with each of the sizing agents at each of the incorporation percetages.
40ºC
0.0
0.4
0.8
1.2
1.6
2.0
DCM TCM Acet ETA THF
Probe
Tr
(min
)
St StS1-05 StS1-10 StS1-20 StS2-05 StS2-10 StS2-20 StS3-05StS3-10 StS3-20 StS4-05 StS4-10 StS4-20 StS5-05 StS5-10 StS5-20StS6-05 StS6-10 StS6-20 StS7-05 StS7-10 StS7-20 StS8-05 StS8-10StS8-20 StS9-05 StS9-10 StS9-20 StS10-05 StS10-10 StS10-20
Figure F.2 – Retention times obtained at 40ºC with the polar probes for the reference samples and the
samples sized with each of the sizing agents at each of the incorporation percetages.
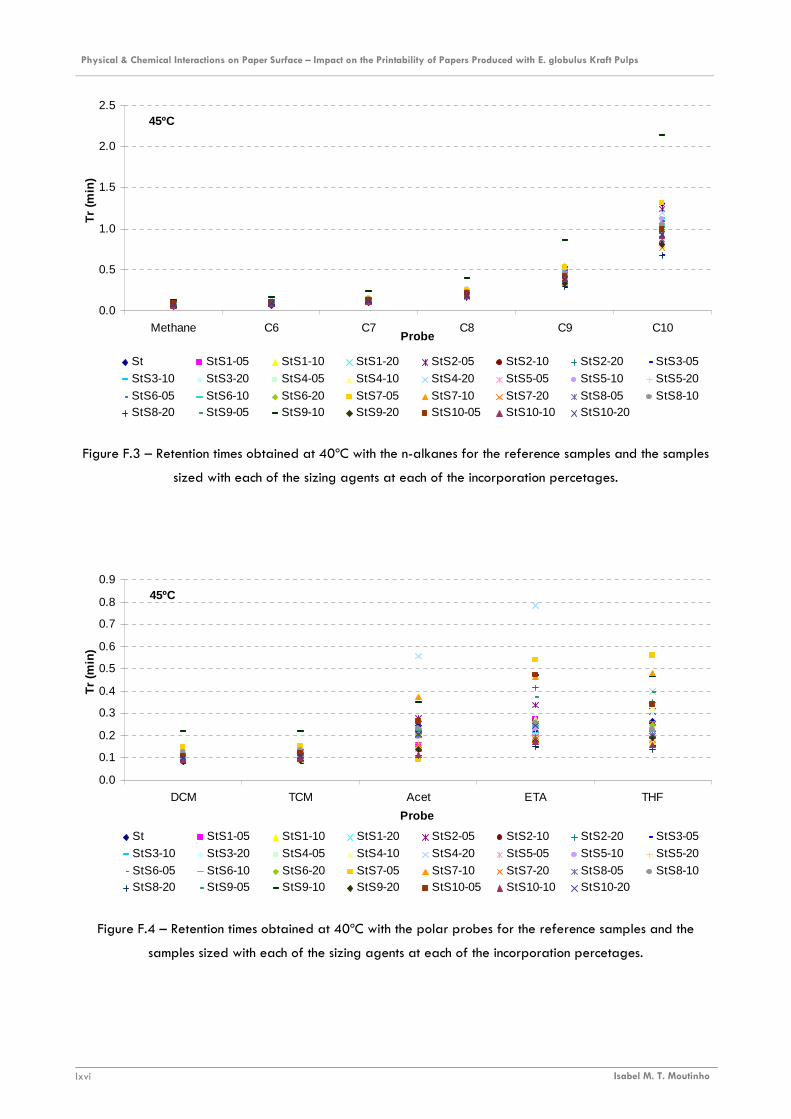
Physical & Chemical Interactions on Paper Surface – Impact on the Printability of Papers Produced with E. globulus Kraft Pulps ________________________________________________________________________________________________________________________
Isabel M. T. Moutinho lxvi
45ºC
0.0
0.5
1.0
1.5
2.0
2.5
Methane C6 C7 C8 C9 C10Probe
Tr
(min
)
St StS1-05 StS1-10 StS1-20 StS2-05 StS2-10 StS2-20 StS3-05
StS3-10 StS3-20 StS4-05 StS4-10 StS4-20 StS5-05 StS5-10 StS5-20
StS6-05 StS6-10 StS6-20 StS7-05 StS7-10 StS7-20 StS8-05 StS8-10StS8-20 StS9-05 StS9-10 StS9-20 StS10-05 StS10-10 StS10-20
Figure F.3 – Retention times obtained at 40ºC with the n-alkanes for the reference samples and the samples
sized with each of the sizing agents at each of the incorporation percetages.
45ºC
0.0
0.1
0.2
0.3
0.4
0.5
0.6
0.7
0.8
0.9
DCM TCM Acet ETA THF
Probe
Tr
(min
)
St StS1-05 StS1-10 StS1-20 StS2-05 StS2-10 StS2-20 StS3-05
StS3-10 StS3-20 StS4-05 StS4-10 StS4-20 StS5-05 StS5-10 StS5-20
StS6-05 StS6-10 StS6-20 StS7-05 StS7-10 StS7-20 StS8-05 StS8-10StS8-20 StS9-05 StS9-10 StS9-20 StS10-05 StS10-10 StS10-20
Figure F.4 – Retention times obtained at 40ºC with the polar probes for the reference samples and the
samples sized with each of the sizing agents at each of the incorporation percetages.
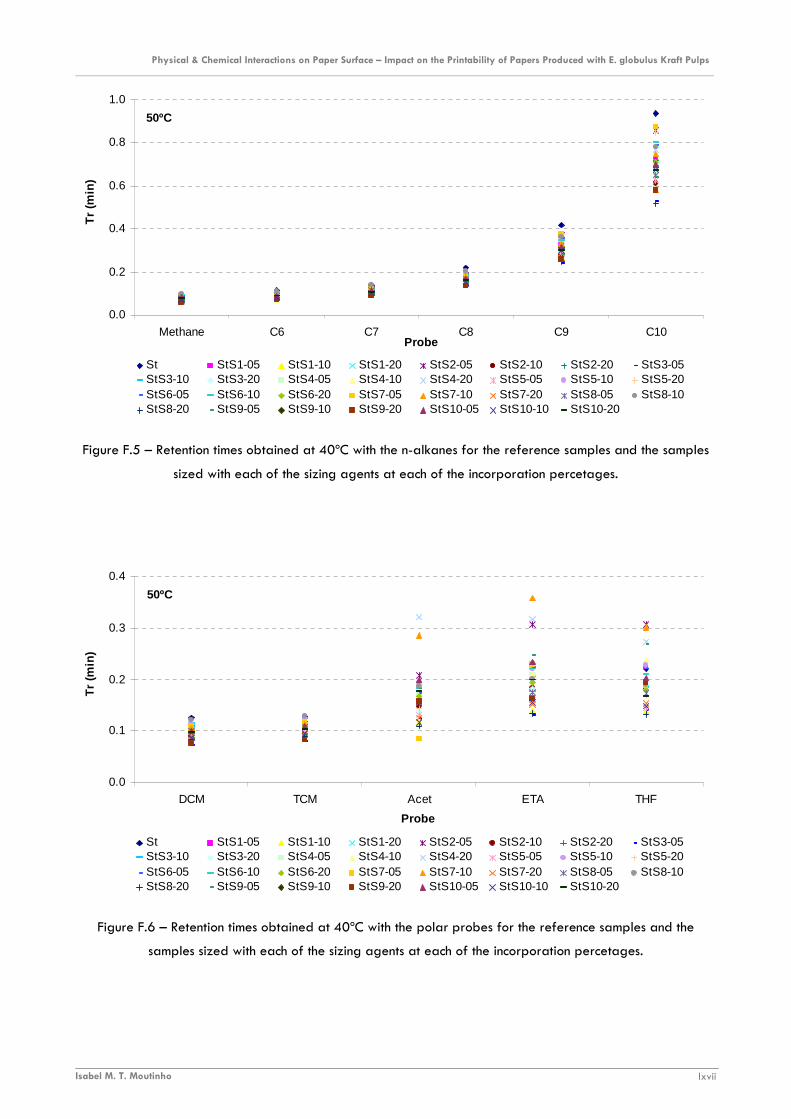
Physical & Chemical Interactions on Paper Surface – Impact on the Printability of Papers Produced with E. globulus Kraft Pulps ________________________________________________________________________________________________________________________
Isabel M. T. Moutinho lxvii
50ºC
0.0
0.2
0.4
0.6
0.8
1.0
Methane C6 C7 C8 C9 C10Probe
Tr
(min
)
St StS1-05 StS1-10 StS1-20 StS2-05 StS2-10 StS2-20 StS3-05StS3-10 StS3-20 StS4-05 StS4-10 StS4-20 StS5-05 StS5-10 StS5-20StS6-05 StS6-10 StS6-20 StS7-05 StS7-10 StS7-20 StS8-05 StS8-10StS8-20 StS9-05 StS9-10 StS9-20 StS10-05 StS10-10 StS10-20
Figure F.5 – Retention times obtained at 40ºC with the n-alkanes for the reference samples and the samples
sized with each of the sizing agents at each of the incorporation percetages.
50ºC
0.0
0.1
0.2
0.3
0.4
DCM TCM Acet ETA THF
Probe
Tr
(min
)
St StS1-05 StS1-10 StS1-20 StS2-05 StS2-10 StS2-20 StS3-05StS3-10 StS3-20 StS4-05 StS4-10 StS4-20 StS5-05 StS5-10 StS5-20StS6-05 StS6-10 StS6-20 StS7-05 StS7-10 StS7-20 StS8-05 StS8-10StS8-20 StS9-05 StS9-10 StS9-20 StS10-05 StS10-10 StS10-20
Figure F.6 – Retention times obtained at 40ºC with the polar probes for the reference samples and the
samples sized with each of the sizing agents at each of the incorporation percetages.
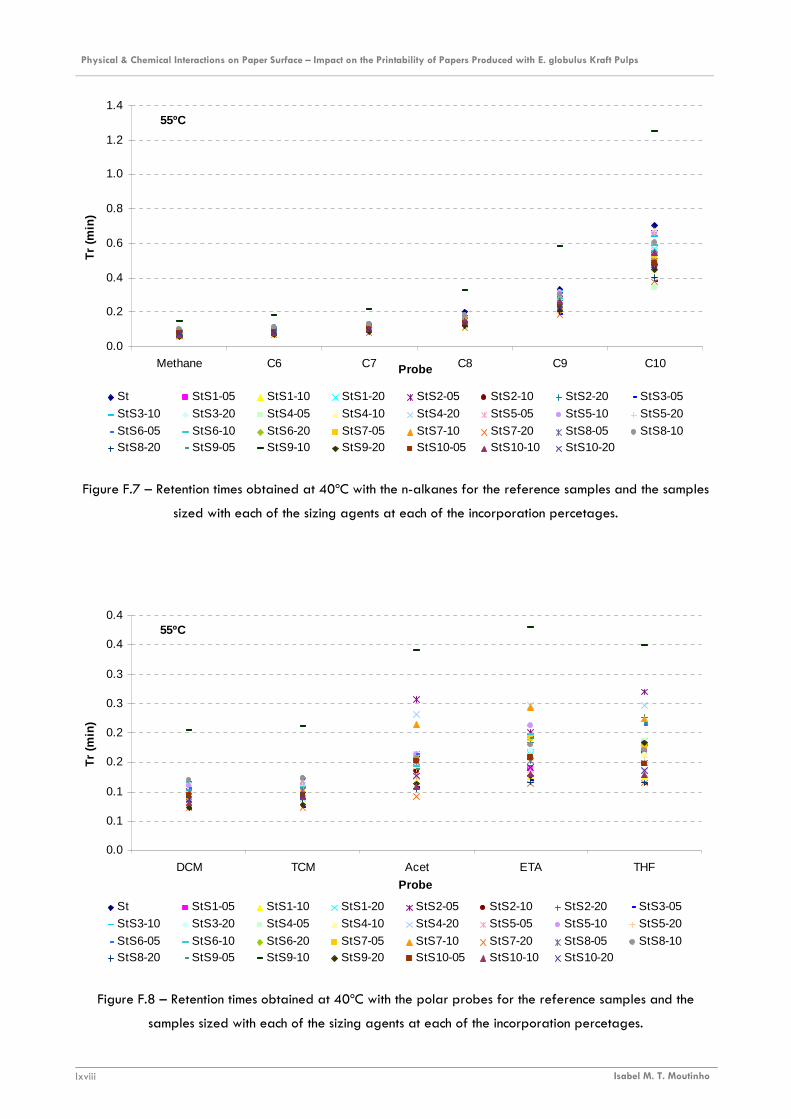
Physical & Chemical Interactions on Paper Surface – Impact on the Printability of Papers Produced with E. globulus Kraft Pulps ________________________________________________________________________________________________________________________
Isabel M. T. Moutinho lxviii
55ºC
0.0
0.2
0.4
0.6
0.8
1.0
1.2
1.4
Methane C6 C7 C8 C9 C10Probe
Tr
(min
)
St StS1-05 StS1-10 StS1-20 StS2-05 StS2-10 StS2-20 StS3-05
StS3-10 StS3-20 StS4-05 StS4-10 StS4-20 StS5-05 StS5-10 StS5-20
StS6-05 StS6-10 StS6-20 StS7-05 StS7-10 StS7-20 StS8-05 StS8-10StS8-20 StS9-05 StS9-10 StS9-20 StS10-05 StS10-10 StS10-20
Figure F.7 – Retention times obtained at 40ºC with the n-alkanes for the reference samples and the samples
sized with each of the sizing agents at each of the incorporation percetages.
55ºC
0.0
0.1
0.1
0.2
0.2
0.3
0.3
0.4
0.4
DCM TCM Acet ETA THF
Probe
Tr
(min
)
St StS1-05 StS1-10 StS1-20 StS2-05 StS2-10 StS2-20 StS3-05
StS3-10 StS3-20 StS4-05 StS4-10 StS4-20 StS5-05 StS5-10 StS5-20
StS6-05 StS6-10 StS6-20 StS7-05 StS7-10 StS7-20 StS8-05 StS8-10StS8-20 StS9-05 StS9-10 StS9-20 StS10-05 StS10-10 StS10-20
Figure F.8 – Retention times obtained at 40ºC with the polar probes for the reference samples and the
samples sized with each of the sizing agents at each of the incorporation percetages.

Physical & Chemical Interactions on Paper Surface – Impact on the Printability of Papers Produced with E. globulus Kraft Pulps ________________________________________________________________________________________________________________________
Isabel M. T. Moutinho lxix
20.0
25.0
30.0
35.0
40.0
45.0
50.0
35ºC 40ºC 45ºC 50ºC 55ºC 60ºC
T (ºC)
σσ σσS
D (m
N/m
)
St
StS1-10
StS2-10
StS3-10
StS4-10
StS5-10
StS6-10
StS7-10
StS8-10
StS9-10
StS10-10
Figure F.9 - Influence of the temperature on the dispersive component of the surface free energy, for the
samples sized with 10% incorporation of synthetic sizing agents (the strainght line indicates the behavior of
sample St).
20.0
25.0
30.0
35.0
40.0
45.0
35ºC 40ºC 45ºC 50ºC 55ºC 60ºC
T (ºC)
σσ σσS
D (m
N/m
)
St
StS1-20
StS2-20StS3-20
StS4-20
StS5-20
StS6-20
StS7-20
StS8-20StS9-20
StS10-20
Figure F.10 - Influence of the temperature on the dispersive component of the surface free energy, for the
samples sized with 20% incorporation of synthetic sizing agents (the strainght line indicates the behavior of
sample St).

Physical & Chemical Interactions on Paper Surface – Impact on the Printability of Papers Produced with E. globulus Kraft Pulps ________________________________________________________________________________________________________________________
Isabel M. T. Moutinho lxx
20.0
25.0
30.0
35.0
40.0
45.0
50.0
35ºC 40ºC 45ºC 50ºC 55ºC 60ºC
T (ºC)
σσ σσS
D (m
N/m
)St StS1-05 StS1-10 StS1-20 Linear (St)
20.0
25.0
30.0
35.0
40.0
45.0
50.0
35ºC 40ºC 45ºC 50ºC 55ºC 60ºC
T (ºC)
σσ σσS
D (m
N/m
)
St StS3-05 StS3-10 StS3-20 Linear (St)
Figure F.11 - Variation of σSD with concentration and temperature for he samples sized with the surface sizing
agents S1 and S3 (St sample is also included, as reference).
20.0
25.0
30.0
35.0
40.0
45.0
35ºC 40ºC 45ºC 50ºC 55ºC 60ºC
T (ºC)
σσ σσS
D (m
N/m
)
St StS5-05 StS5-10 StS5-20 Linear (St)
20.0
25.0
30.0
35.0
40.0
45.0
35ºC 40ºC 45ºC 50ºC 55ºC 60ºC
T (ºC)
σσ σσS
D (
mN
/m)
St StS6-05 StS6-10 StS6-20 Linear (St)
Figure F.12 - Variation of σSD with concentration and temperature for he samples sized with the surface sizing
agents S5 and S6 (St sample is also included, as reference).
20.0
25.0
30.0
35.0
40.0
45.0
50.0
35ºC 40ºC 45ºC 50ºC 55ºC 60ºC
T (ºC)
σσ σσS
D (m
N/m
)
St StS7-05 StS7-10 StS7-20 Linear (St)
20.0
25.0
30.0
35.0
40.0
45.0
35ºC 40ºC 45ºC 50ºC 55ºC 60ºC
T (ºC)
σσ σσS
D (
mN
/m)
St StS8-05 StS8-10 StS8-20 Linear (St)
Figure F.13 - Variation of σSD with concentration and temperature for he samples sized with the surface sizing
agents S7 and S8 (St sample is also included, as reference).
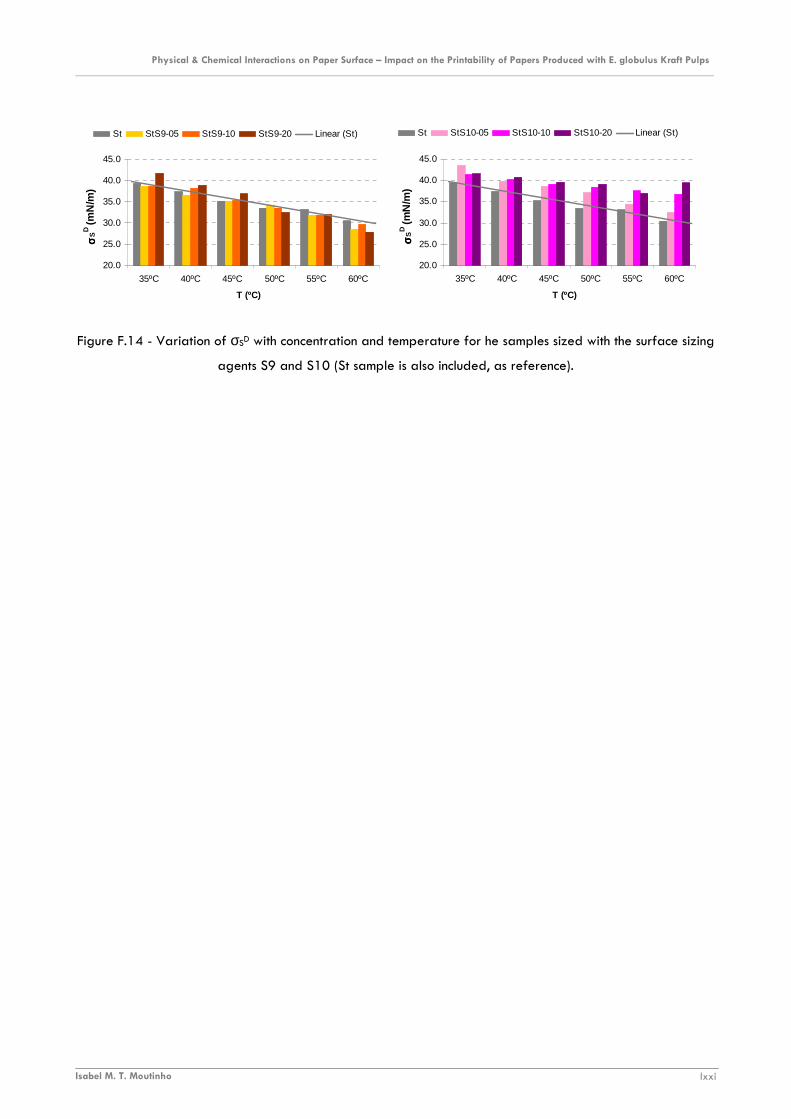
Physical & Chemical Interactions on Paper Surface – Impact on the Printability of Papers Produced with E. globulus Kraft Pulps ________________________________________________________________________________________________________________________
Isabel M. T. Moutinho lxxi
20.0
25.0
30.0
35.0
40.0
45.0
35ºC 40ºC 45ºC 50ºC 55ºC 60ºC
T (ºC)
σσ σσS
D (m
N/m
)
St StS9-05 StS9-10 StS9-20 Linear (St)
20.0
25.0
30.0
35.0
40.0
45.0
35ºC 40ºC 45ºC 50ºC 55ºC 60ºC
T (ºC)
σσ σσS
D (m
N/m
)
St StS10-05 StS10-10 StS10-20 Linear (St)
Figure F.14 - Variation of σSD with concentration and temperature for he samples sized with the surface sizing
agents S9 and S10 (St sample is also included, as reference).
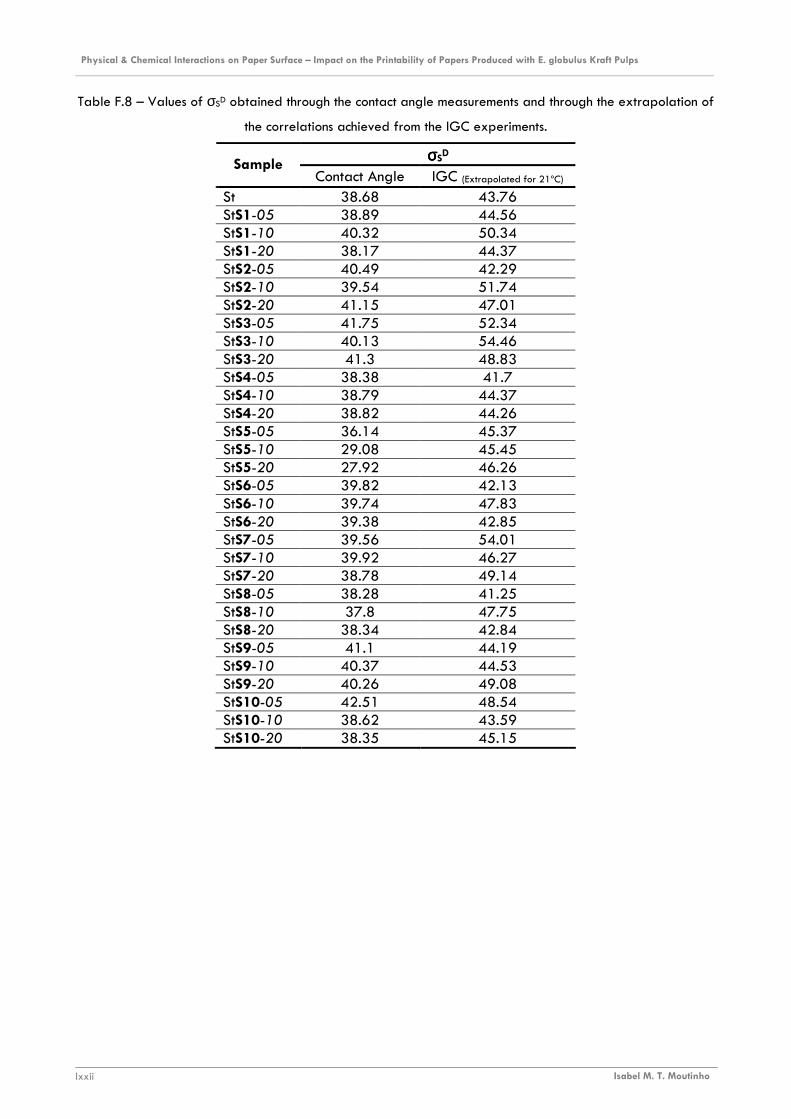
Physical & Chemical Interactions on Paper Surface – Impact on the Printability of Papers Produced with E. globulus Kraft Pulps ________________________________________________________________________________________________________________________
Isabel M. T. Moutinho lxxii
Table F.8 – Values of σSD obtained through the contact angle measurements and through the extrapolation of
the correlations achieved from the IGC experiments.
σσσσSD Sample
Contact Angle IGC (Extrapolated for 21ºC) St 38.68 43.76 StS1-05 38.89 44.56 StS1-10 40.32 50.34 StS1-20 38.17 44.37 StS2-05 40.49 42.29 StS2-10 39.54 51.74 StS2-20 41.15 47.01 StS3-05 41.75 52.34 StS3-10 40.13 54.46 StS3-20 41.3 48.83 StS4-05 38.38 41.7 StS4-10 38.79 44.37 StS4-20 38.82 44.26 StS5-05 36.14 45.37 StS5-10 29.08 45.45 StS5-20 27.92 46.26 StS6-05 39.82 42.13 StS6-10 39.74 47.83 StS6-20 39.38 42.85 StS7-05 39.56 54.01 StS7-10 39.92 46.27 StS7-20 38.78 49.14 StS8-05 38.28 41.25 StS8-10 37.8 47.75 StS8-20 38.34 42.84 StS9-05 41.1 44.19 StS9-10 40.37 44.53 StS9-20 40.26 49.08 StS10-05 42.51 48.54 StS10-10 38.62 43.59 StS10-20 38.35 45.15
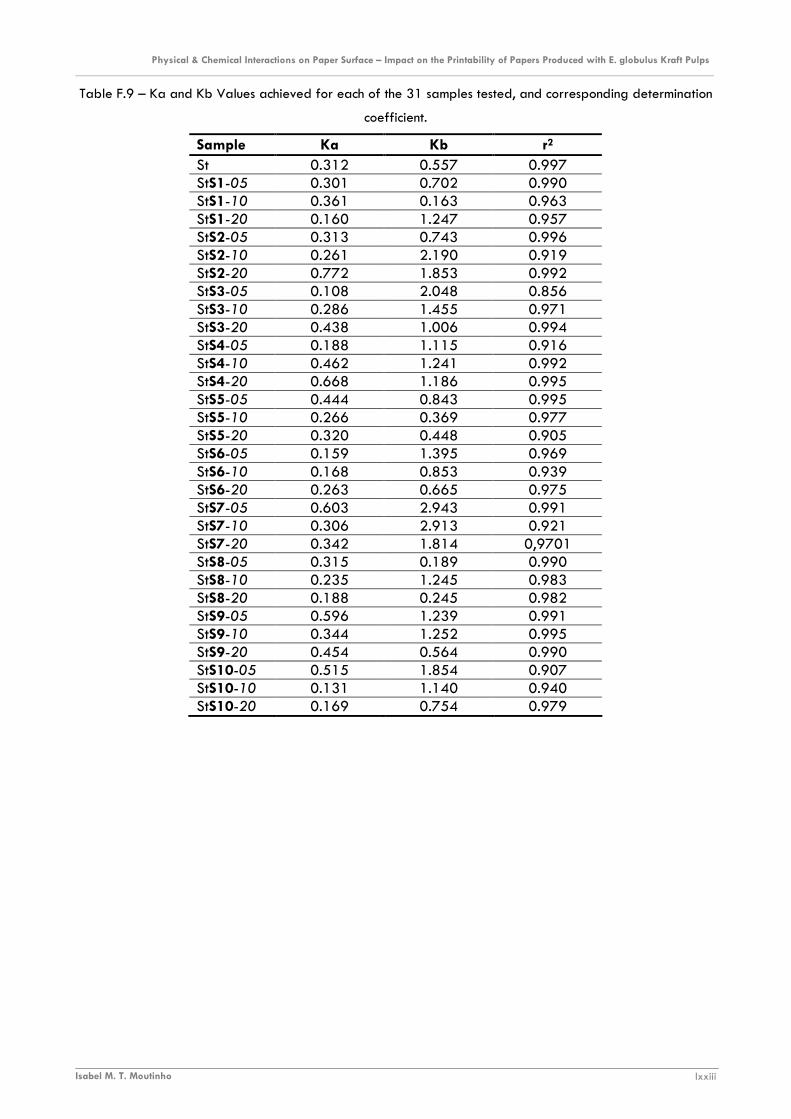
Physical & Chemical Interactions on Paper Surface – Impact on the Printability of Papers Produced with E. globulus Kraft Pulps ________________________________________________________________________________________________________________________
Isabel M. T. Moutinho lxxiii
Table F.9 – Ka and Kb Values achieved for each of the 31 samples tested, and corresponding determination
coefficient.
Sample Ka Kb r2 St 0.312 0.557 0.997 StS1-05 0.301 0.702 0.990 StS1-10 0.361 0.163 0.963 StS1-20 0.160 1.247 0.957 StS2-05 0.313 0.743 0.996 StS2-10 0.261 2.190 0.919 StS2-20 0.772 1.853 0.992 StS3-05 0.108 2.048 0.856 StS3-10 0.286 1.455 0.971 StS3-20 0.438 1.006 0.994 StS4-05 0.188 1.115 0.916 StS4-10 0.462 1.241 0.992 StS4-20 0.668 1.186 0.995 StS5-05 0.444 0.843 0.995 StS5-10 0.266 0.369 0.977 StS5-20 0.320 0.448 0.905 StS6-05 0.159 1.395 0.969 StS6-10 0.168 0.853 0.939 StS6-20 0.263 0.665 0.975 StS7-05 0.603 2.943 0.991 StS7-10 0.306 2.913 0.921 StS7-20 0.342 1.814 0,9701 StS8-05 0.315 0.189 0.990 StS8-10 0.235 1.245 0.983 StS8-20 0.188 0.245 0.982 StS9-05 0.596 1.239 0.991 StS9-10 0.344 1.252 0.995 StS9-20 0.454 0.564 0.990 StS10-05 0.515 1.854 0.907 StS10-10 0.131 1.140 0.940 StS10-20 0.169 0.754 0.979

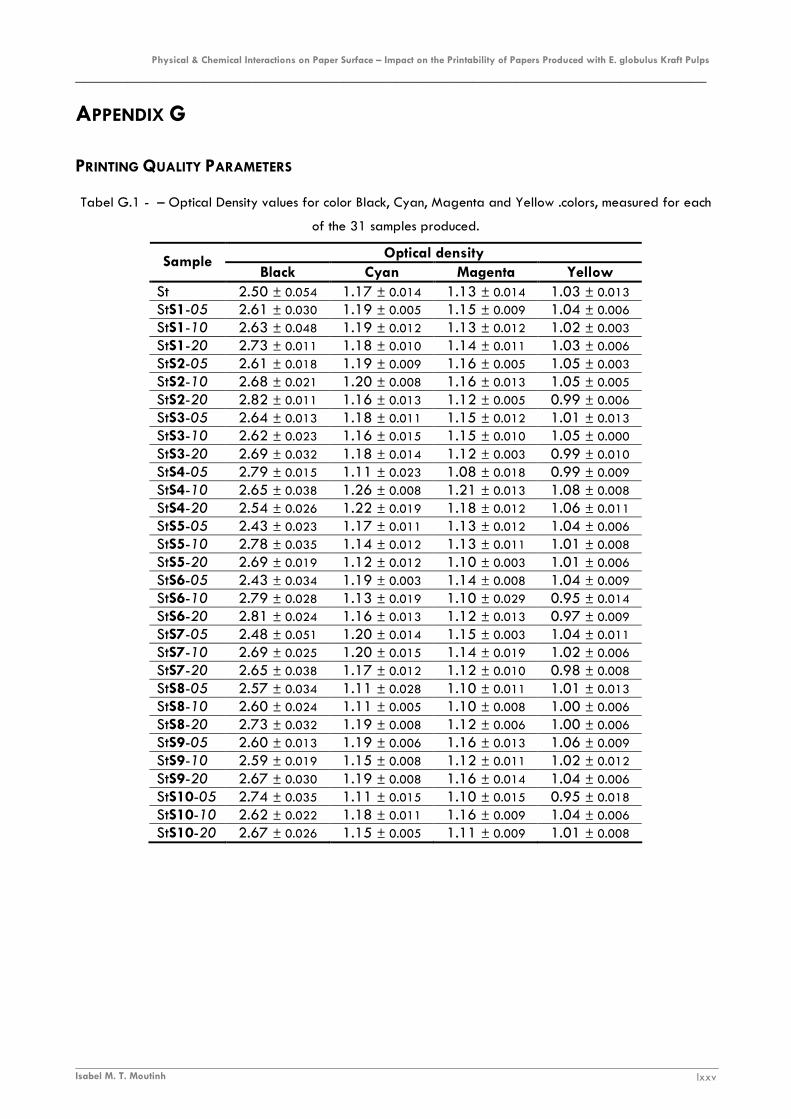
Physical & Chemical Interactions on Paper Surface – Impact on the Printability of Papers Produced with E. globulus Kraft Pulps
_________________________________________________________________________
Isabel M. T. Moutinh lxxv
APPENDIX G
PRINTING QUALITY PARAMETERS
Tabel G.1 - – Optical Density values for color Black, Cyan, Magenta and Yellow .colors, measured for each
of the 31 samples produced.
Optical density Sample
Black Cyan Magenta Yellow St 2.50 ± 0.054 1.17 ± 0.014 1.13 ± 0.014 1.03 ± 0.013 StS1-05 2.61 ± 0.030 1.19 ± 0.005 1.15 ± 0.009 1.04 ± 0.006 StS1-10 2.63 ± 0.048 1.19 ± 0.012 1.13 ± 0.012 1.02 ± 0.003 StS1-20 2.73 ± 0.011 1.18 ± 0.010 1.14 ± 0.011 1.03 ± 0.006 StS2-05 2.61 ± 0.018 1.19 ± 0.009 1.16 ± 0.005 1.05 ± 0.003 StS2-10 2.68 ± 0.021 1.20 ± 0.008 1.16 ± 0.013 1.05 ± 0.005 StS2-20 2.82 ± 0.011 1.16 ± 0.013 1.12 ± 0.005 0.99 ± 0.006 StS3-05 2.64 ± 0.013 1.18 ± 0.011 1.15 ± 0.012 1.01 ± 0.013 StS3-10 2.62 ± 0.023 1.16 ± 0.015 1.15 ± 0.010 1.05 ± 0.000 StS3-20 2.69 ± 0.032 1.18 ± 0.014 1.12 ± 0.003 0.99 ± 0.010 StS4-05 2.79 ± 0.015 1.11 ± 0.023 1.08 ± 0.018 0.99 ± 0.009 StS4-10 2.65 ± 0.038 1.26 ± 0.008 1.21 ± 0.013 1.08 ± 0.008 StS4-20 2.54 ± 0.026 1.22 ± 0.019 1.18 ± 0.012 1.06 ± 0.011 StS5-05 2.43 ± 0.023 1.17 ± 0.011 1.13 ± 0.012 1.04 ± 0.006 StS5-10 2.78 ± 0.035 1.14 ± 0.012 1.13 ± 0.011 1.01 ± 0.008 StS5-20 2.69 ± 0.019 1.12 ± 0.012 1.10 ± 0.003 1.01 ± 0.006 StS6-05 2.43 ± 0.034 1.19 ± 0.003 1.14 ± 0.008 1.04 ± 0.009 StS6-10 2.79 ± 0.028 1.13 ± 0.019 1.10 ± 0.029 0.95 ± 0.014 StS6-20 2.81 ± 0.024 1.16 ± 0.013 1.12 ± 0.013 0.97 ± 0.009 StS7-05 2.48 ± 0.051 1.20 ± 0.014 1.15 ± 0.003 1.04 ± 0.011 StS7-10 2.69 ± 0.025 1.20 ± 0.015 1.14 ± 0.019 1.02 ± 0.006 StS7-20 2.65 ± 0.038 1.17 ± 0.012 1.12 ± 0.010 0.98 ± 0.008 StS8-05 2.57 ± 0.034 1.11 ± 0.028 1.10 ± 0.011 1.01 ± 0.013 StS8-10 2.60 ± 0.024 1.11 ± 0.005 1.10 ± 0.008 1.00 ± 0.006 StS8-20 2.73 ± 0.032 1.19 ± 0.008 1.12 ± 0.006 1.00 ± 0.006 StS9-05 2.60 ± 0.013 1.19 ± 0.006 1.16 ± 0.013 1.06 ± 0.009 StS9-10 2.59 ± 0.019 1.15 ± 0.008 1.12 ± 0.011 1.02 ± 0.012 StS9-20 2.67 ± 0.030 1.19 ± 0.008 1.16 ± 0.014 1.04 ± 0.006 StS10-05 2.74 ± 0.035 1.11 ± 0.015 1.10 ± 0.015 0.95 ± 0.018 StS10-10 2.62 ± 0.022 1.18 ± 0.011 1.16 ± 0.009 1.04 ± 0.006 StS10-20 2.67 ± 0.026 1.15 ± 0.005 1.11 ± 0.009 1.01 ± 0.008
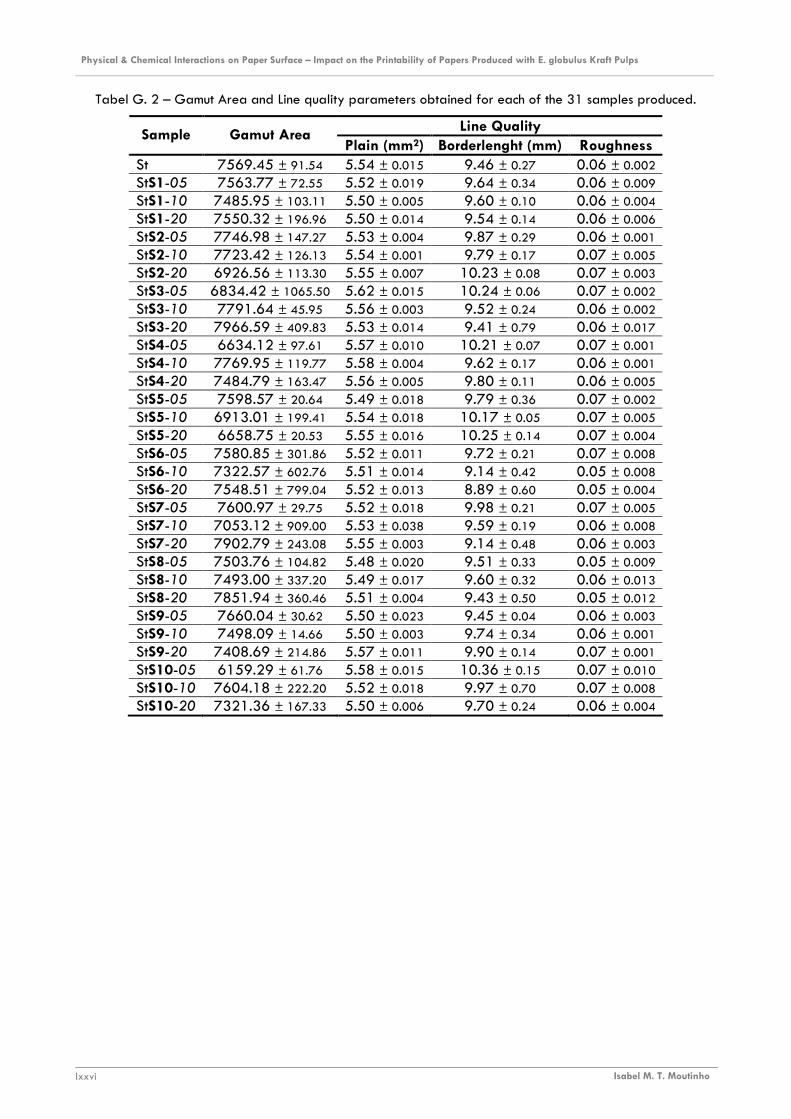
Physical & Chemical Interactions on Paper Surface – Impact on the Printability of Papers Produced with E. globulus Kraft Pulps ________________________________________________________________________________________________________________________
Isabel M. T. Moutinho lxxvi
Tabel G. 2 – Gamut Area and Line quality parameters obtained for each of the 31 samples produced.
Line Quality Sample Gamut Area
Plain (mm2) Borderlenght (mm) Roughness St 7569.45 ± 91.54 5.54 ± 0.015 9.46 ± 0.27 0.06 ± 0.002 StS1-05 7563.77 ± 72.55 5.52 ± 0.019 9.64 ± 0.34 0.06 ± 0.009 StS1-10 7485.95 ± 103.11 5.50 ± 0.005 9.60 ± 0.10 0.06 ± 0.004 StS1-20 7550.32 ± 196.96 5.50 ± 0.014 9.54 ± 0.14 0.06 ± 0.006 StS2-05 7746.98 ± 147.27 5.53 ± 0.004 9.87 ± 0.29 0.06 ± 0.001 StS2-10 7723.42 ± 126.13 5.54 ± 0.001 9.79 ± 0.17 0.07 ± 0.005 StS2-20 6926.56 ± 113.30 5.55 ± 0.007 10.23 ± 0.08 0.07 ± 0.003 StS3-05 6834.42 ± 1065.50 5.62 ± 0.015 10.24 ± 0.06 0.07 ± 0.002 StS3-10 7791.64 ± 45.95 5.56 ± 0.003 9.52 ± 0.24 0.06 ± 0.002 StS3-20 7966.59 ± 409.83 5.53 ± 0.014 9.41 ± 0.79 0.06 ± 0.017 StS4-05 6634.12 ± 97.61 5.57 ± 0.010 10.21 ± 0.07 0.07 ± 0.001 StS4-10 7769.95 ± 119.77 5.58 ± 0.004 9.62 ± 0.17 0.06 ± 0.001 StS4-20 7484.79 ± 163.47 5.56 ± 0.005 9.80 ± 0.11 0.06 ± 0.005 StS5-05 7598.57 ± 20.64 5.49 ± 0.018 9.79 ± 0.36 0.07 ± 0.002 StS5-10 6913.01 ± 199.41 5.54 ± 0.018 10.17 ± 0.05 0.07 ± 0.005 StS5-20 6658.75 ± 20.53 5.55 ± 0.016 10.25 ± 0.14 0.07 ± 0.004 StS6-05 7580.85 ± 301.86 5.52 ± 0.011 9.72 ± 0.21 0.07 ± 0.008 StS6-10 7322.57 ± 602.76 5.51 ± 0.014 9.14 ± 0.42 0.05 ± 0.008 StS6-20 7548.51 ± 799.04 5.52 ± 0.013 8.89 ± 0.60 0.05 ± 0.004 StS7-05 7600.97 ± 29.75 5.52 ± 0.018 9.98 ± 0.21 0.07 ± 0.005 StS7-10 7053.12 ± 909.00 5.53 ± 0.038 9.59 ± 0.19 0.06 ± 0.008 StS7-20 7902.79 ± 243.08 5.55 ± 0.003 9.14 ± 0.48 0.06 ± 0.003 StS8-05 7503.76 ± 104.82 5.48 ± 0.020 9.51 ± 0.33 0.05 ± 0.009 StS8-10 7493.00 ± 337.20 5.49 ± 0.017 9.60 ± 0.32 0.06 ± 0.013 StS8-20 7851.94 ± 360.46 5.51 ± 0.004 9.43 ± 0.50 0.05 ± 0.012 StS9-05 7660.04 ± 30.62 5.50 ± 0.023 9.45 ± 0.04 0.06 ± 0.003 StS9-10 7498.09 ± 14.66 5.50 ± 0.003 9.74 ± 0.34 0.06 ± 0.001 StS9-20 7408.69 ± 214.86 5.57 ± 0.011 9.90 ± 0.14 0.07 ± 0.001 StS10-05 6159.29 ± 61.76 5.58 ± 0.015 10.36 ± 0.15 0.07 ± 0.010 StS10-10 7604.18 ± 222.20 5.52 ± 0.018 9.97 ± 0.70 0.07 ± 0.008 StS10-20 7321.36 ± 167.33 5.50 ± 0.006 9.70 ± 0.24 0.06 ± 0.004