Embed Size (px)
Citation preview
8/10/2019 Effect of Asperity Interactions on Rough Surface Elastic Contact Behavior- Hard Film o
http://slidepdf.com/reader/full/effect-of-asperity-interactions-on-rough-surface-elastic-contact-behavior- 1/11
Effect of asperity interactions on rough surface elastic contact behavior: Hard
film on soft substrate
Chang-Dong Yeo 1, Raja R. Katta, Jungkyu Lee, Andreas A. Polycarpou
Department of Mechanical Science and Engineering, University of Illinois at Urbana-Champaign, Urbana, IL 61801, USA
a r t i c l e i n f o
Article history:
Received 3 December 2009
Received in revised form24 January 2010
Accepted 28 January 2010Available online 2 February 2010
Keywords:
Contact mechanics
Surface roughness
Asperity i nteractions
Coating
a b s t r a c t
An improved elastic micro-contact model of rough surfaces accounting for asperity interactions is
proposed. The contact behavior of a single asperity system is composed of a stiffer hemi-spherical
asperity deformation and bellowing softer substrate deformation, which is then extended to roughsurface contact including asperity interactions. Using the solution of substrate deformation, normal
positions of individual asperities are adjusted during quasi-static contact, from which surface
interactive forces are obtained. Analytical simulations are performed using the proposed rough surface
contact model, whose results are compared to Greenwood–Williamson-based models and with
experimental measurements.
& 2010 Elsevier Ltd. All rights reserved.
1. Introduction
The Greenwood–Williamson contact model (GW model) [1]
has been used as the basis of rough surface contact models. In theGW model, only elastic asperity deformation is considered
neglecting substrate deformation and asperity interactions that
could occur during contact. Moreover GW assumes that all surface
asperities are spherical with the same radius of curvature, whose
heights follow a normal (Gaussian) distribution. Chang et al.
(CEB model) extended the GW model to include elastic–plastic
deformation of the contacting asperities [2]. An improved version
of the basic adhesion model by Derjaguin et al. (improved DMT
model) [3] was employed in the CEB model to determine adhesive
forces during rough surface contacts. Kogut and Etsion (KE model)
proposed a further improvement in the CEB model based on finite
element method (FEM) simulations to describe elastic, elastic–
plastic, and fully plastic deformation of the contacting asperities
during rough surface contact [4]. Stanley et al. [5] and Polycarpouand Etsion [6] included the effects of molecularly thin lubricant
film on the adhesive forces during elastic–plastic rough surface
contacts.
In recent thin solid film applications, for improved reliability
and performance, very hard and extremely thin solid films are
typically applied onto softer substrate materials [7–9]. For
example, in magnetic recording disks of current hard-disk-drives
(HDD), an amorphous carbon film of few nanometers thickness is
deposited onto a softer magnetic material, and its root-mean-
square (RMS) roughness is sub-nanometer [9]. Considering the
small carbon film thickness and surface roughness values, it canbe said that surface asperities are composed of harder carbon
material, while the substrate is a softer magnetic material [10].
For the contact of such ultra-thin and hard film applications, the
contact behavior cannot be modeled by asperity deformation only
(GW-type model) due to the presence of considerable substrate
deformation. Shi and Polycarpou [11] experimentally measured
contact stiffness values between a recording slider and a typical
magnetic recording disk, and compared the measurements to a
GW-based model. It was found that the contact stiffness predicted
using GW-based asperity deformation alone was 107–108 N/m,
which was significantly higher than the experimental measure-
ments of 106 N/m. Therefore, to correctly predict the contact
behavior of such ultra-thin films, the contact model should
include the effects of substrate deformation and asperity interac-tions.
Researchers have proposed contact models to account for
substrate deformation and asperity interactions for rough con-
tacting surfaces [12–17]. Iida and Ono [12] used a stiffness model
for substrate deformation and an elastic point contact solution for
asperity interactions. Zhao and Chang [14] applied a uniform
mean contact pressure to calculate the mean of asperity heights
and asperity deformation caused by adjacent contacting aspe-
rities. Ciavarella et al. [15] used a discretized version of the GW
model which accounts for first order interaction effects. This was
done by assuming that for every asperity contact, a displacement
will be imposed on the half-space such that the magnitude
ARTICLE IN PRESS
Contents lists available at ScienceDirect
journal homepage: www.elsevier.com/locate/triboint
Tribology International
0301-679X/$- see front matter & 2010 Elsevier Ltd. All rights reserved.
doi:10.1016/j.triboint.2010.01.021
Corresponding author.
E-mail address: [email protected] (A.A. Polycarpou).1 Currently with Texas Tech University, Lubbock, TX.
Tribology International 43 (2010) 1438–1448
8/10/2019 Effect of Asperity Interactions on Rough Surface Elastic Contact Behavior- Hard Film o
http://slidepdf.com/reader/full/effect-of-asperity-interactions-on-rough-surface-elastic-contact-behavior- 2/11
ARTICLE IN PRESS
(but not shape) of the pressure distribution due to other
contacting asperities will also get affected accordingly. Subse-
quently, using a different approach, Ciavarella et al. [16] improved
upon the integral formulation of the original GW model to include
0th order asperity interactions by treating the contact pressure as
uniformly distributed over the apparent contact area and the
resulting deformation as uniform (in addition to the Hertzian
asperity deformation). The validity and applicability of these
contact models have not been investigated through experiments.
In this study, an elastic rough surface contact model of ultra-
thin harder film on a substrate accounting for asperity interac-
tions is proposed. Based on the Hertzian contact solution, the
normal positions of individual asperities are adjusted during
contact, which are then used to calculate the surface normal
interactive and lateral friction forces. Analytical contact simula-
tions were performed using the proposed model, and the results
were compared with GW-based models and experimental
measurements.
2. Modeling of elastic rough surface contact
2.1. Single asperity contact
A simplified single asperity contact model accounting for
substrate deformation was developed and verified by Yeo et al.
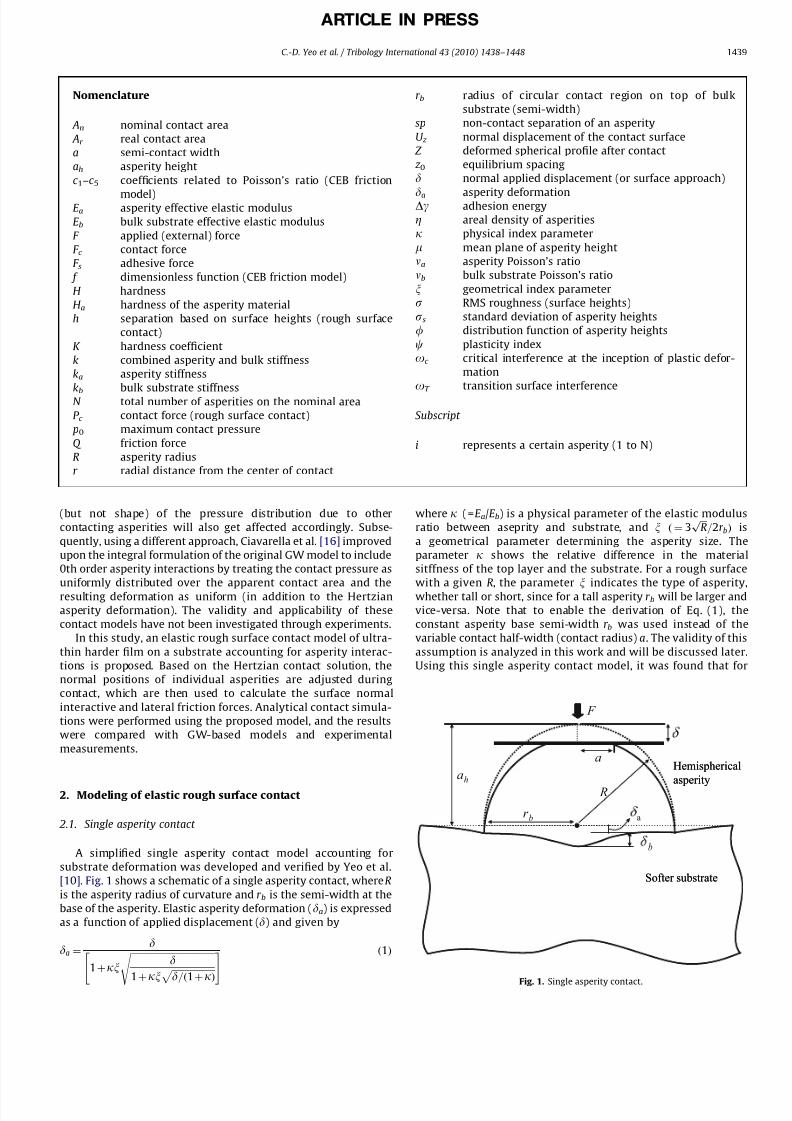
[10]. Fig. 1 shows a schematic of a single asperity contact, where R
is the asperity radius of curvature and r b is the semi-width at the
base of the asperity. Elastic asperity deformation (da) is expressed
as a function of applied displacement (d) and given by
da ¼ d
1þkx ffiffiffiffiffiffiffiffiffiffiffiffiffiffiffiffiffiffiffiffiffiffiffiffiffiffiffiffiffiffiffiffiffiffiffiffiffid
1þkx ffiffiffiffiffiffiffiffiffiffiffiffiffiffiffiffiffiffiffid=ð1þkÞp s " #
ð1Þ
where k ( =E a/E b) is a physical parameter of the elastic modulus
ratio between aseprity and substrate, and x ð ¼ 3 ffiffiffi
Rp
=2r bÞ is
a geometrical parameter determining the asperity size. The
parameter k shows the relative difference in the material
sitffness of the top layer and the substrate. For a rough surface
with a given R, the parameter x indicates the type of asperity,
whether tall or short, since for a tall asperity r b will be larger and
vice-versa. Note that to enable the derivation of Eq. (1), the
constant asperity base semi-width r b was used instead of the
variable contact half-width (contact radius) a. The validity of this
assumption is analyzed in this work and will be discussed later.
Using this single asperity contact model, it was found that for
Nomenclature
An nominal contact area
Ar real contact area
a semi-contact width
ah asperity height
c 1–c 5 coefficients related to Poisson’s ratio (CEB friction
model)E a asperity effective elastic modulus
E b bulk substrate effective elastic modulus
F applied (external) force
F c contact force
F s adhesive force
f dimensionless function (CEB friction model)
H hardness
H a hardness of the asperity material
h separation based on surface heights (rough surface
contact)
K hardness coefficient
k combined asperity and bulk stiffness
ka asperity stiffness
kb bulk substrate stiffnessN total number of asperities on the nominal area
P c contact force (rough surface contact)
p0 maximum contact pressure
Q friction force
R asperity radius
r radial distance from the center of contact
r b radius of circular contact region on top of bulk
substrate (semi-width)
sp non-contact separation of an asperity
U z normal displacement of the contact surface
Z deformed spherical profile after contact
z 0 equilibrium spacing
d normal applied displacement (or surface approach)
da asperity deformationDg adhesion energy
Z areal density of asperities
k physical index parameter
m mean plane of asperity height
na asperity Poisson’s ratio
nb bulk substrate Poisson’s ratio
x geometrical index parameter
s RMS roughness (surface heights)
ss standard deviation of asperity heights
f distribution function of asperity heights
c plasticity index
oc critical interference at the inception of plastic defor-
mation
oT transition surface interference
Subscript
i represents a certain asperity (1 to N)
r b
F
b
a
R
ah
Softer substrate
Hemispherical
asperity
a
Softer substrate
Hemispherical
asperity
Fig. 1. Single asperity contact.
C.-D. Yeo et al. / Tribology International 43 (2010) 1438–1448 1439
8/10/2019 Effect of Asperity Interactions on Rough Surface Elastic Contact Behavior- Hard Film o
http://slidepdf.com/reader/full/effect-of-asperity-interactions-on-rough-surface-elastic-contact-behavior- 3/11
ARTICLE IN PRESS
single asperity surfaces representative of micro and nanoscale
applications with harder films (coating) on a substrate
(x48.66 103 m1/2 and k41.25), the proposed model is more
accurate compared to the conventional Hertz contact solution by
20–70% [10].
2.2. Rough surface contact
As used in many GW-based contact models, the statistical(Gaussian) distribution function (f) is convenient to describe the
contact behavior of randomly distributed asperity heights.
However, it is not feasible to determine the contact behavior of
each individual asperity separately from the statistical distribu-
tion function, thus making it difficult to include the effects of
asperity interaction into rough surface contact. Hence in this
work, the approach of replacing the integrals with discrete sums
of each asperity contact, similar to the approaches taken by Iida
and Ono [12] and Ciavarella et al. [15] was adopted.
2.2.1. Surface asperity geometry and position
To account for asperity interaction as well as asperity and
substrate deformation, it is necessary to determine the geome-
trical dimensions (asperity height ah, semi-width of asperity r b,and asperity radius R) and spatial information ( x y z coordinate
data) for individual asperities on the rough surface. In this study it
was assumed that the asperity heights follow a normal (Gaussian)
distribution function. Note that other asperity height distribution
functions could also be used e.g. asymmetric distribution [18]
All asperities are positioned on the same base plane, whose
z -level (height) was determined from the distribution of asperity
heights as shown schematically in Fig. 2. Based on the value of
the nominal mean plane of asperity heights (m) and the
standard deviation of the asperity heights (ss) obtained from
experimentally measured roughness parameters, a plane which is
3 ss below the mean plane (m) was chosen as the base plane, on
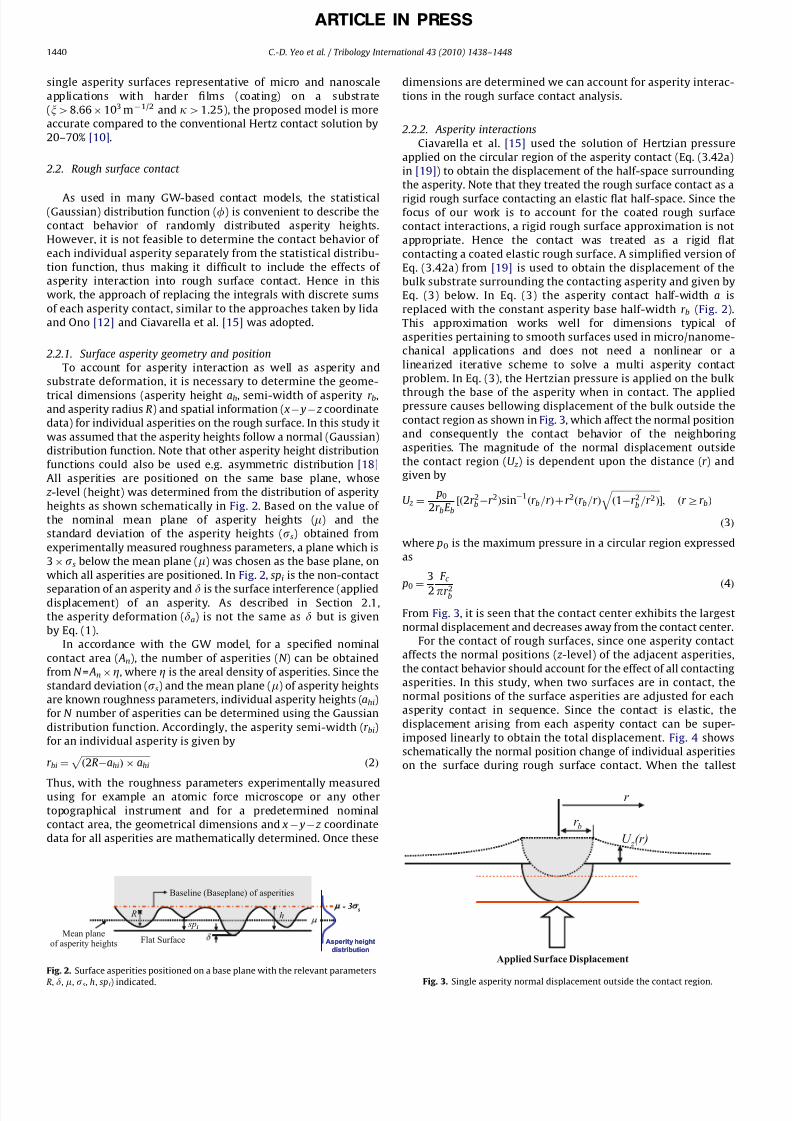
which all asperities are positioned. In Fig. 2, spi is the non-contact
separation of an asperity and d is the surface interference (applieddisplacement) of an asperity. As described in Section 2.1,
the asperity deformation (da) is not the same as d but is given
by Eq. (1).
In accordance with the GW model, for a specified nominal
contact area ( An), the number of asperities (N ) can be obtained
from N = AnZ, where Z is the areal density of asperities. Since the
standard deviation (ss) and the mean plane (m) of asperity heights
are known roughness parameters, individual asperity heights (ahi)
for N number of asperities can be determined using the Gaussian
distribution function. Accordingly, the asperity semi-width (r bi)
for an individual asperity is given by
r bi ¼ ffiffiffiffiffiffiffiffiffiffiffiffiffiffiffiffiffiffiffiffiffiffiffiffiffiffiffiffiffiffið2RahiÞ ahi
p ð2Þ
Thus, with the roughness parameters experimentally measuredusing for example an atomic force microscope or any other
topographical instrument and for a predetermined nominal
contact area, the geometrical dimensions and x y z coordinate
data for all asperities are mathematically determined. Once these
dimensions are determined we can account for asperity interac-
tions in the rough surface contact analysis.
2.2.2. Asperity interactions
Ciavarella et al. [15] used the solution of Hertzian pressure
applied on the circular region of the asperity contact (Eq. (3.42a)
in [19]) to obtain the displacement of the half-space surrounding
the asperity. Note that they treated the rough surface contact as a
rigid rough surface contacting an elastic flat half-space. Since thefocus of our work is to account for the coated rough surface
contact interactions, a rigid rough surface approximation is not
appropriate. Hence the contact was treated as a rigid flat
contacting a coated elastic rough surface. A simplified version of
Eq. (3.42a) from [19] is used to obtain the displacement of the
bulk substrate surrounding the contacting asperity and given by
Eq. (3) below. In Eq. (3) the asperity contact half-width a is
replaced with the constant asperity base half-width r b (Fig. 2).
This approximation works well for dimensions typical of
asperities pertaining to smooth surfaces used in micro/nanome-
chanical applications and does not need a nonlinear or a
linearized iterative scheme to solve a multi asperity contact
problem. In Eq. (3), the Hertzian pressure is applied on the bulk
through the base of the asperity when in contact. The appliedpressure causes bellowing displacement of the bulk outside the
contact region as shown in Fig. 3, which affect the normal position
and consequently the contact behavior of the neighboring
asperities. The magnitude of the normal displacement outside
the contact region (U z ) is dependent upon the distance (r ) and
given by
U z ¼ p0
2r bE b½ð2r 2b r 2Þsin
1ðr b=r Þþr 2ðr b=r Þ ffiffiffiffiffiffiffiffiffiffiffiffiffiffiffiffiffiffiffiffiffið1r 2
b=r 2Þ
q ; ðr Zr bÞ
ð3Þwhere p0 is the maximum pressure in a circular region expressed
as
p0 ¼
3
2
F c
pr 2b ð4Þ
From Fig. 3, it is seen that the contact center exhibits the largest
normal displacement and decreases away from the contact center.
For the contact of rough surfaces, since one asperity contact
affects the normal positions ( z -level) of the adjacent asperities,
the contact behavior should account for the effect of all contacting
asperities. In this study, when two surfaces are in contact, the
normal positions of the surface asperities are adjusted for each
asperity contact in sequence. Since the contact is elastic, the
displacement arising from each asperity contact can be super-
imposed linearly to obtain the total displacement. Fig. 4 shows
schematically the normal position change of individual asperities
on the surface during rough surface contact. When the tallest
Mean planeof asperity heights
- 3 s
spi
R
Baseline (Baseplane) of asperities
Flat Surface Asperity height
distribution
h- 3 s
i
R
Baseline (Baseplane) of asperities
Flat Surface Asperity height
distribution
h
Fig. 2. Surface asperities positioned on a base plane with the relevant parameters
R, d, m, ss, h, spi) indicated.
Applied Surface Displacement
U z (r)
r b
r
Fig. 3. Single asperity normal displacement outside the contact region.
C.-D. Yeo et al. / Tribology International 43 (2010) 1438–14481440
8/10/2019 Effect of Asperity Interactions on Rough Surface Elastic Contact Behavior- Hard Film o
http://slidepdf.com/reader/full/effect-of-asperity-interactions-on-rough-surface-elastic-contact-behavior- 4/11
ARTICLE IN PRESS
asperity (denoted a in the figure) initiates contact with the
counteracting surface, the neighboring asperities also move
upward with a magnitude that depends on their distance from
the contacting asperity determined by Eq. (3). Thus, the normal
positions of all asperities are adjusted accordingly. Since the
force on one contacting asperity results on neighboring asperities
adjust their positions, this process is termed as asperity
interaction. In the new configuration, subsequent contact on the
next asperity (denoted b in the figure) enables the neighboring
asperities to move further, thus re-adjusting the normal positions
of the surface asperities. In this manner, the normal positions of
all asperities are adjusted based on the deformation induced by
the pressure acting on the substrate through the contacting
asperities. Once the equilibrated normal positions of the surfaceasperities are determined from all the asperity interactions, the
adjusted interference on each contacting asperity is determined
from which the interfacial forces, namely contact, adhesion and
friction could be calculated.
2.2.3. Interfacial forces
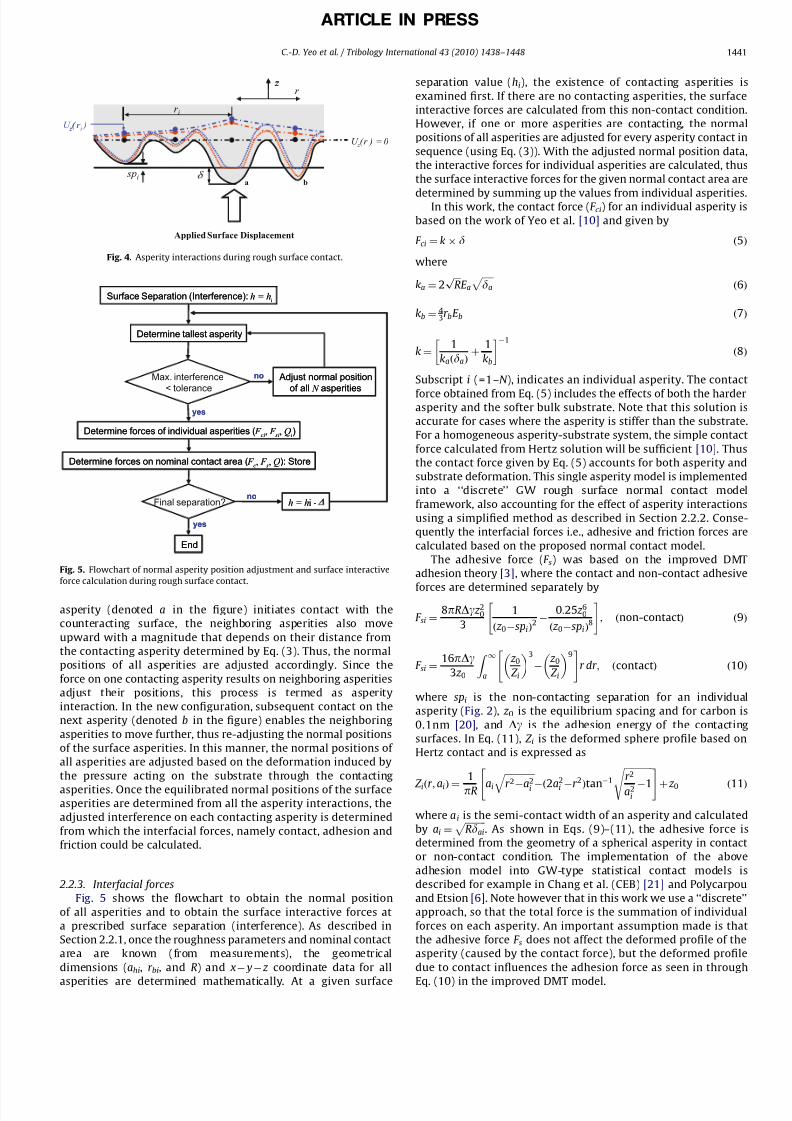
Fig. 5 shows the flowchart to obtain the normal position
of all asperities and to obtain the surface interactive forces at
a prescribed surface separation (interference). As described in
Section 2.2.1, once the roughness parameters and nominal contact
area are known (from measurements), the geometrical
dimensions (ahi, r bi, and R) and x y z coordinate data for all
asperities are determined mathematically. At a given surface
separation value (hi), the existence of contacting asperities is
examined first. If there are no contacting asperities, the surface
interactive forces are calculated from this non-contact condition.
However, if one or more asperities are contacting, the normal
positions of all asperities are adjusted for every asperity contact in
sequence (using Eq. (3)). With the adjusted normal position data,
the interactive forces for individual asperities are calculated, thus
the surface interactive forces for the given normal contact area are
determined by summing up the values from individual asperities.In this work, the contact force (F ci) for an individual asperity is
based on the work of Yeo et al. [10] and given by
F ci ¼ k d ð5Þwhere
ka ¼ 2 ffiffiffi
Rp
E a ffiffiffiffiffida
p ð6Þ
kb ¼ 43r bE b ð7Þ
k ¼ 1
kaðdaÞþ 1
kb
1
ð8Þ
Subscript i (=1–N ), indicates an individual asperity. The contact
force obtained from Eq. (5) includes the effects of both the harderasperity and the softer bulk substrate. Note that this solution is
accurate for cases where the asperity is stiffer than the substrate.
For a homogeneous asperity-substrate system, the simple contact
force calculated from Hertz solution will be sufficient [10]. Thus
the contact force given by Eq. (5) accounts for both asperity and
substrate deformation. This single asperity model is implemented
into a ‘‘discrete’’ GW rough surface normal contact model
framework, also accounting for the effect of asperity interactions
using a simplified method as described in Section 2.2.2. Conse-
quently the interfacial forces i.e., adhesive and friction forces are
calculated based on the proposed normal contact model.
The adhesive force (F s) was based on the improved DMT
adhesion theory [3], where the contact and non-contact adhesive
forces are determined separately by
F si ¼ 8pRDg z 20
3
1
ð z 0spiÞ2 0:25 z 60
ð z 0spiÞ8
" #; ðnon-contactÞ ð9Þ
F si ¼ 16pDg
3 z 0
Z 1
a
z 0 Z i
3
z 0 Z i
9" #
r dr ; ðcontactÞ ð10Þ
where spi is the non-contacting separation for an individual
asperity (Fig. 2), z 0 is the equilibrium spacing and for carbon is
0.1nm [20], and Dg is the adhesion energy of the contacting
surfaces. In Eq. (11), Z i is the deformed sphere profile based on
Hertz contact and is expressed as
Z iðr ; aiÞ ¼ 1
pR ai ffiffiffiffiffiffiffiffiffiffiffiffiffi
r 2a
2i
q ð2a2i r
2
Þtan1 ffiffiffiffiffiffiffiffiffiffiffiffiffir 2
a2i1
s " #þ z 0 ð11Þ
where a i is the semi-contact width of an asperity and calculated
by ai ¼ ffiffiffiffiffiffiffiffiffi
Rdaip
. As shown in Eqs. (9)–(11), the adhesive force is
determined from the geometry of a spherical asperity in contact
or non-contact condition. The implementation of the above
adhesion model into GW-type statistical contact models is
described for example in Chang et al. (CEB) [21] and Polycarpou
and Etsion [6]. Note however that in this work we use a ‘‘discrete’’
approach, so that the total force is the summation of individual
forces on each asperity. An important assumption made is that
the adhesive force F s does not affect the deformed profile of the
asperity (caused by the contact force), but the deformed profile
due to contact influences the adhesion force as seen in through
Eq. (10) in the improved DMT model.
r i
z r
U z ( r i )
U z (r ) = 0
Applied Surface Displacement
a b spi
r i
z r
z ( r i )
Fig. 4. Asperity interactions during rough surface contact.
Surface Separation (Interference): h = hi
Max. interference
< tolerance
Determine forces of individual asperities ( F ci, F si, Qi)
Determine tallest asperity
Adjust normal position
of all N asperities
Final separation?
End
no
yes
Determine forces on nominal contact area ( F c, F s, Q): Store
h = hi -
yes
no
Fig. 5. Flowchart of normal asperity position adjustment and surface interactive
force calculation during rough surface contact.
C.-D. Yeo et al. / Tribology International 43 (2010) 1438–1448 1441
8/10/2019 Effect of Asperity Interactions on Rough Surface Elastic Contact Behavior- Hard Film o
http://slidepdf.com/reader/full/effect-of-asperity-interactions-on-rough-surface-elastic-contact-behavior- 5/11
ARTICLE IN PRESS
The friction force (Q ) was based on the CEB friction model [22],
where the shear strength is influenced by the normal contact load
and uses the von Mises yield criterion to calculate the tangential
(friction) force that will cause failure of the contacting asperities.
The friction force is given by
Q i ¼ F ci f di
oc ; n
ð12Þ
where n is Poisson’s ratio and the dimensionless function, f , isgiven by
f ¼ c 4 þðc 244c 3c 5Þ1=2
2c 3ðdiooT Þ ð13Þ
f ¼ 0:2045
K jc 1joc
di
1
1=2
ðdiZoT Þ ð14Þ
where
oc ¼ pKH
2E
2
R ð15Þ
oT
oc ¼ 0:9860:111n ð16Þ
oc is the critical interference to initiate plastic deformation
(material failure) and oT is the transition interference, where the
location of material yield changes: When the surface interference
(di) is smaller than oT , material failure occurs on the surface
and the dimensionless function, f , is expressed by Eq. (13).
When di4oT , material failure occurs below the surface and the
dimensionless function, f , is expressed by Eq. (14). The hardness
coefficient (K ) is given by K =0.454+0.41n, and the coefficients
c 1–c 5 in Eqs. (13) and (14) are related to the Poisson’s ratio and
can be found in [22]. Note that more advanced friction models
than the CEB friction model have been proposed; see for example
[23]. However the CEB model was chosen due to its seminal
nature and accuracy despite its simplicity (note that we only use
the elastic part of the CEB model).
The rough surface adhesive and friction models are imple-
mented in this work to demonstrate the effect/significance of
the rough surface with asperity interaction model in practical
predictions of interface parameters (e.g., friction and friction
coefficient). As has been shown in the literature, e.g., Refs. [2,4],
once the normal contact model is established, at a specified
external normal load, one calculates the mean normal separation
between the two contacting bodies and at this mean separation,
one can then calculate the interfacial contact parameters, such as
real contact area, normal, adhesion and friction forces. This is
what is also done in this work, namely the proposed improved
normal contact model that accounts for asperity interactions
and the presence of a hard coating, is first derived and then
implemented to show its effects in the contact parameters. At a
given surface separation, the interactive forces for individualasperities could be calculated from Eqs. (9)–(16), and then the
total interactive forces and real contact area Ar for the given
nominal contact area could be determined by summing up the
values of N number of asperities expressed as
F c ¼XN
i
F ci ð17Þ
F s ¼XN
i
F si ð18Þ
Q ¼ XN
i
Q i ð19Þ
Ar ¼XN
i
pRoi ð20Þ
3. Simulation results and discussion
Using the rough surface contact model described in Section 2,
analytical simulations were performed for a typical head-disk-
interface (HDI) contact and compared with experimental data
reported in [11]. The measured combined roughness parameters
are as follows: average radius of asperity curvature R=3.73mm,
RMS roughness (standard deviation of surface heights)
s=1.03 nm, standard deviation of asperity heights ss=0.94nm,
areal density of asperities Z=12.48mm2, asperity elastic mod-
ulus E a=139.6 GPa, asperity Poisson’s ratio na=0.24, substrate
elastic modulus E b=80 GPa, and substrate Poisson’s ratio nb=0.30.
Since the above roughness measurements depend on scan size
and sampling interval [24], a digital filtering methodology to
reduce scale-of-measurement effects was implemented to obtain
the above roughness parameters [25]. Note that these parameters
are representative of extremely smooth surfaces used in nano-
mechanical applications. Based on contact experiments per-
formed on a typical HDI [11], the nominal contact area wasestimated to be around 250mm2 (though in some cases it could be
as large as 1000mm2). Once the nominal contact area is known,
the number of asperities (N ) is calculated by N = AnZ. For N
number of asperities, the individual asperity height is mathema-
tically determined using the one standard deviation (ss) and
normal distribution function of the asperity heights.
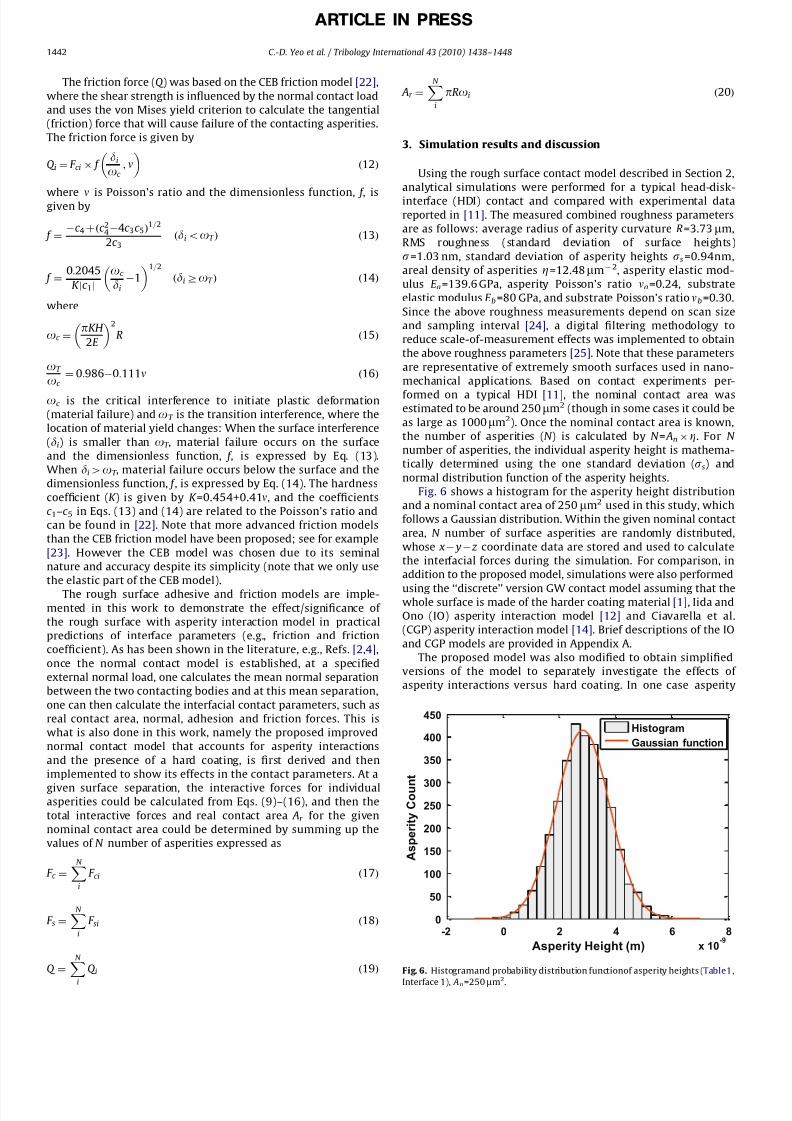
Fig. 6 shows a histogram for the asperity height distribution
and a nominal contact area of 250 mm2 used in this study, which
follows a Gaussian distribution. Within the given nominal contact
area, N number of surface asperities are randomly distributed,
whose x y z coordinate data are stored and used to calculate
the interfacial forces during the simulation. For comparison, in
addition to the proposed model, simulations were also performed
using the ‘‘discrete’’ version GW contact model assuming that thewhole surface is made of the harder coating material [1], Iida and
Ono (IO) asperity interaction model [12] and Ciavarella et al.
(CGP) asperity interaction model [14]. Brief descriptions of the IO
and CGP models are provided in Appendix A.
The proposed model was also modified to obtain simplified
versions of the model to separately investigate the effects of
asperity interactions versus hard coating. In one case asperity
-2 0 2 4 6 8
x 10-9
0
50
100
150
200
250
300
350
400
450
Asperity Height (m)
A s p e r i t y C o u n
t
Histogram
Gaussian function
Fig. 6. Histogramand probability distribution functionof asperity heights (Table1,
Interface 1), An=250mm2.
C.-D. Yeo et al. / Tribology International 43 (2010) 1438–14481442
8/10/2019 Effect of Asperity Interactions on Rough Surface Elastic Contact Behavior- Hard Film o
http://slidepdf.com/reader/full/effect-of-asperity-interactions-on-rough-surface-elastic-contact-behavior- 6/11
ARTICLE IN PRESS
interactions are not accounted for and the model is referred as
‘‘w/o interaction.’’ This model is similar to the discrete GW model
but accounting for the hard asperity over soft substrate contact
behavior. The asperity interaction model is also implemented
assuming the whole surface is made of the hard asperity coating
material along with the discrete GW model and is referred to as
‘‘GW w/interaction.’’ ‘‘Proposed’’ model is referred to the complete
model that captures both the asperity interactions and the hard
asperity over soft substrate behavior. Note that another casewhere the discrete GW model with asperity interaction included
and with the rough surface assumed to be made of the softer bulk
material could also be examined. For the cases considered in this
work, the results are similar to the proposed model since asperity
heights are extremely small in nanoscale applications, thus
showing that the softer bulk dominates the contact. For conven-
tional hard coated surfaces where asperities tend to be taller, the
coating will also influence the contact. In these cases it will
require a fair amount of trial-and-error approach to determine an
appropriate composite modulus or use only the softer substrate
properties to treat the contact. Hence the proposed model is a
unified approach where it can capture the effects of both hard
asperities and softer bulk without the need of a trial-and-error
approach to obtain an appropriate composite reduced modulus
for the contact.
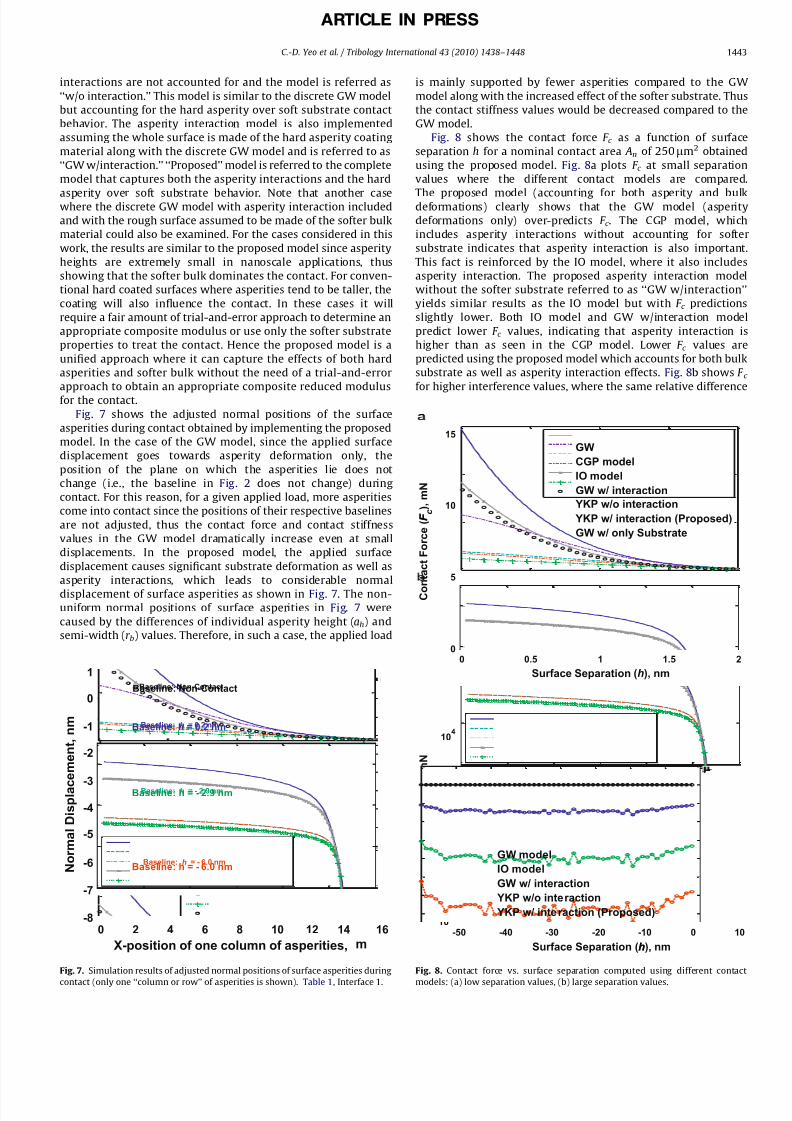
Fig. 7 shows the adjusted normal positions of the surface
asperities during contact obtained by implementing the proposed
model. In the case of the GW model, since the applied surface
displacement goes towards asperity deformation only, the
position of the plane on which the asperities lie does not
change (i.e., the baseline in Fig. 2 does not change) during
contact. For this reason, for a given applied load, more asperities
come into contact since the positions of their respective baselines
are not adjusted, thus the contact force and contact stiffness
values in the GW model dramatically increase even at small
displacements. In the proposed model, the applied surface
displacement causes significant substrate deformation as well as
asperity interactions, which leads to considerable normal
displacement of surface asperities as shown in Fig. 7. The non-
uniform normal positions of surface asperities in Fig. 7 were
caused by the differences of individual asperity height (ah) and
semi-width (r b) values. Therefore, in such a case, the applied load
is mainly supported by fewer asperities compared to the GW
model along with the increased effect of the softer substrate. Thus
the contact stiffness values would be decreased compared to the
GW model.
Fig. 8 shows the contact force F c as a function of surface
separation h for a nominal contact area An of 250mm2 obtained
using the proposed model. Fig. 8a plots F c at small separation
values where the different contact models are compared.
The proposed model (accounting for both asperity and bulkdeformations) clearly shows that the GW model (asperity
deformations only) over-predicts F c . The CGP model, which
includes asperity interactions without accounting for softer
substrate indicates that asperity interaction is also important.
This fact is reinforced by the IO model, where it also includes
asperity interaction. The proposed asperity interaction model
without the softer substrate referred to as ‘‘GW w/interaction’’
yields similar results as the IO model but with F c predictions
slightly lower. Both IO model and GW w/interaction model
predict lower F c values, indicating that asperity interaction is
higher than as seen in the CGP model. Lower F c values are
predicted using the proposed model which accounts for both bulk
substrate as well as asperity interaction effects. Fig. 8b shows F c for higher interference values, where the same relative difference
Baseline: Non-Contact
Baseline: h = 0.2 nm
Baseline: h = - 2.9 nm
Baseline: h = - 6.0 nm
Baseline: Non-Contact
Baseline: h = 0.2 nm
Baseline: h = - 2.9 nm
Baseline: h = - 6.0 nm
1
0
-1
-2
-3
-4
-5
-6
-7
-8
X-position of one column of asperities, m
Baseline: Non-Contact
Baseline: h = 0.2 nm
Baseline: h = - 2.9 nm
Baseline: h = - 6.0 nm N o r m a l D i s p l a c
e m e n t , n m
0 2 4 6 8 10 12 14 16
Baseline: Non-Contact
Baseline: h = 0.2 nm
Baseline: h = - 2.9 nm
Baseline: h = - 6.0 nm
Fig. 7. Simulation results of adjusted normal positions of surface asperities during
contact (only one ‘‘column or row’’ of asperities is shown). Table 1, Interface 1.
-50 -40 -30 -20 -10 0 1010
-2
100
102
104
GW model
IO model
GW w/ interaction
YKP w/o interaction
YKP w/ interaction (Proposed)
0 0.5 1 1.5 20
5
10
15
Surface Separation (h), nm
GW
CGP model
IO model
GW w/ interaction
YKP w/o interaction
YKP w/ interaction (Proposed)
GW w/ only Substrate
Surface Separation (h), nmh
C o n t a c t F o r c e ( F c ) , m N
F
GW model
IO model
GW w/ interaction
YKP w/o interaction
YKP w/ interaction (Proposed)
C o
n t a c t F o r c e ( F c ) , m N
F
GW
CGP model
IO model
GW w/ interaction
YKP w/o interaction
YKP w/ interaction (Proposed)
GW w/ only Substrate
Fig. 8. Contact force vs. surface separation computed using different contact
models: (a) low separation values, (b) large separation values.
C.-D. Yeo et al. / Tribology International 43 (2010) 1438–1448 1443

8/10/2019 Effect of Asperity Interactions on Rough Surface Elastic Contact Behavior- Hard Film o
http://slidepdf.com/reader/full/effect-of-asperity-interactions-on-rough-surface-elastic-contact-behavior- 7/11
ARTICLE IN PRESS
between the contact models can be seen, however the increase in
F c with h is lower at higher h. The CGP model is not shown in
Fig. 8b since there were some complexities in implementing the
model for large interference values.
Since the proposed model was developed for elastic contact,
it is also critical to check if the ensuing contact will result in
most asperities deforming elastically. To determine if the contact
deformation is primarily elastic or plastic, a parameter called
plasticity index c proposed by GW [1] was used, where it is afunction of the material and geometric parameters of the
contacting interfaces:
c¼ 2E r
pKH
ffiffiffiffiffiss
R
r ð21Þ
If co0.6, as long as the applied nominal pressure is not
extremely high, asperities will undergo elastic deformation only.
However, when c41, even under light loads, most asperities
deform plastically. For the current case, conservatively estimating
the hardness H =10 GPa (asperity hardness H a is 30GPa, bulk
substrate hardness H b7.5 GPa), c =0.27, which clearly indicates
that the deformation is elastic, thus validating the applicability of
the proposed model for the HDI case. It also has to be noted that
the effect of asperity interactions is to reduce the interference of the asperities. This means that asperities which undergo plastic
deformation when asperity interaction is not accounted, might in
reality still be in elastic state due to asperity interactions.
4. Comparison with experiments
Fig. 9 depicts the contact stiffness (K c ) values with respect to
the applied contact force values. It is observed that the GW model
(asperity deformation only) shows contact stiffness values of the
order of 107 N/m at contact force values of 10–60 mN, while the
contact stiffness values from the proposed model are of the order
of 105 N/m. Comparing the model predictions to the experimental
measurements, it was found that the GW model significantlyoverestimates the contact stiffness values, whereas the model
predictions from the proposed model are close to the
experimental measurements. Comparing the contact stiffness
values between the simplified proposed model (substrate effect
only ‘‘w/o interaction’’) and complete proposed (substrate and
asperity interaction), it was indicative that even though the
substrate deformation itself contributes to reduce the contact
stiffness, its values were still higher than the experimental
measurements. In other words, for sub-nm surface roughness,
asperity interaction effect is more critical compared to the bulk
compliance effect, as far as affecting the contact stiffness in the
contact of rough surfaces.
Examining the trends of contact stiffness values from the
proposed model (Fig. 9), it was also observed that when the
applied force (or surface interference) is very low (less than10 mN in this case), contact stiffness values increased with
contact force. This trend is similar to the GW predictions because
asperity deformation (as compared to bulk) is dominant during
the contact behavior at very low applied forces. However, once
the applied force is beyond a certain value, the contact stiffness
dramatically decreased with the contact force, because the softer
substrate deformation and asperity interaction become dominant.
It was also observed that the effect of increased nominal area
An results in increased contact stiffness. Ono et al. [26] showed
that the contact stiffness K c increases as square-root of An for
smooth contact, i.e., when roughness is presumed not to affect the
contact compliance, K c ¼ 1:79E r
ffiffiffiffiffiffi An
p . The proposed contact model
was also used to estimate the contact stiffness when An=1000
mm2 (4 times larger). It was observed that the contact stiffness
initially was higher by a factor of 2.35 and with increased
interference it decreased to 1.4. This is because roughness
induced asperity interaction also affects the contact stiffness.
However, for simplicity the relationship provided by Ono et al.
[26] can be used to estimate the effect of An on the contact
stiffness.
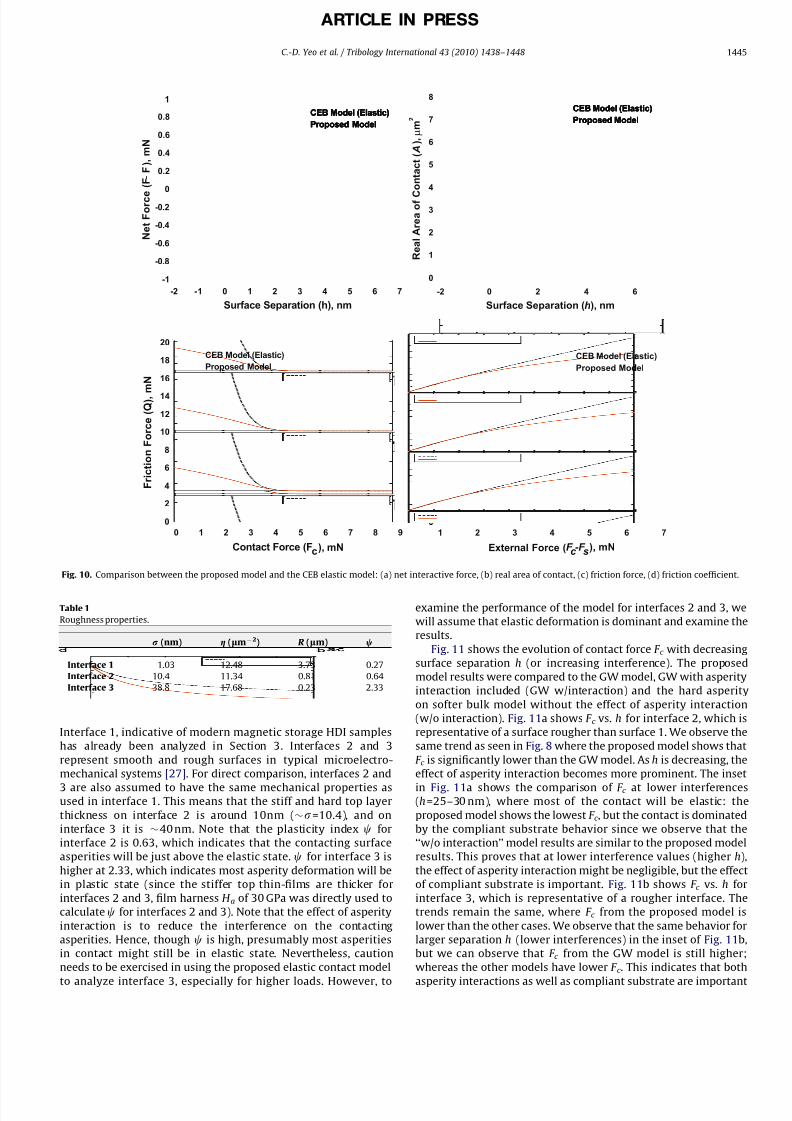
The simulation results from the proposed model were
compared with a representative GW-based contact model (CEB
model) [11], assuming the whole surface properties are those of
the harder coating. Fig. 10 shows the comparisons (using a
nominal contact area of 250 mm2) between the proposed model
and the CEB model in regards to the net interface normal force
(F c F s), friction force (Q ), real area of contact ( Ar ) and static
friction coefficient (m). Since the proposed model is for elastic
contact, the implementation of the CEB adhesion [21] and CEB
friction [22] models was done only within the elastic contact
regime. In the case of the GW-based CEB model, since only
asperity interaction was not included, it showed dramatic
increase of the contact force and real contact area even at small
interference values as shown in Figs. 10(a) and (b), respectively.
As expected, the predicted increase is significantly smaller with
the proposed model. Examining the results of net normal force, it
was also observed that the maximum attractive force of the
proposed model was larger and occurred at a smaller surface
separation compared to the CEB model, as shown in Fig. 10a. The
increase in the friction force Q with respect to the contact force F c is also lower using the proposed model as seen in Fig. 10c, which
is due to considerable substrate deformation. Accordingly, the
friction coefficient using the proposed model was lower than thatof the CEB model at higher net forces where the effect of asperity
interaction is predominant, as shown in Fig. 10d.
5. Analysis for sub-10 nm and sub-100nm rough surfaces
The above analysis clearly showed that the effect of asperity
interaction and harder coating layer need to be considered to
accurately model the contact of sub-nm surface roughness. To
verify if the effect of asperity interaction will be critical for
rougher surfaces, two different rough surfaces indicative of higher
roughness values are examined for their contact behavior using
the proposed contact model. Table 1 shows the combined surface
parameters for the different rough surfaces used in this analysis.
0 10 20 30 40 50 60 7010
5
106
107
108
Contact Force (F c ), mN
C o n t a c t S t i f f n e s s ( K
c ) , N / m
GW YKP w/o interaction
YKP w/ interaction (Proposed)
Experiments
Fig. 9. Contact stiffness values with respect to the contact force values.
C.-D. Yeo et al. / Tribology International 43 (2010) 1438–14481444
8/10/2019 Effect of Asperity Interactions on Rough Surface Elastic Contact Behavior- Hard Film o
http://slidepdf.com/reader/full/effect-of-asperity-interactions-on-rough-surface-elastic-contact-behavior- 8/11
ARTICLE IN PRESS
Interface 1, indicative of modern magnetic storage HDI samples
has already been analyzed in Section 3. Interfaces 2 and 3
represent smooth and rough surfaces in typical microelectro-
mechanical systems [27]. For direct comparison, interfaces 2 and
3 are also assumed to have the same mechanical properties asused in interface 1. This means that the stiff and hard top layer
thickness on interface 2 is around 10nm (s=10.4), and on
interface 3 it is 40 nm. Note that the plasticity index c for
interface 2 is 0.63, which indicates that the contacting surface
asperities will be just above the elastic state. c for interface 3 is
higher at 2.33, which indicates most asperity deformation will be
in plastic state (since the stiffer top thin-films are thicker for
interfaces 2 and 3, film harness H a of 30 GPa was directly used to
calculate c for interfaces 2 and 3). Note that the effect of asperity
interaction is to reduce the interference on the contacting
asperities. Hence, though c is high, presumably most asperities
in contact might still be in elastic state. Nevertheless, caution
needs to be exercised in using the proposed elastic contact model
to analyze interface 3, especially for higher loads. However, to
examine the performance of the model for interfaces 2 and 3, we
will assume that elastic deformation is dominant and examine the
results.
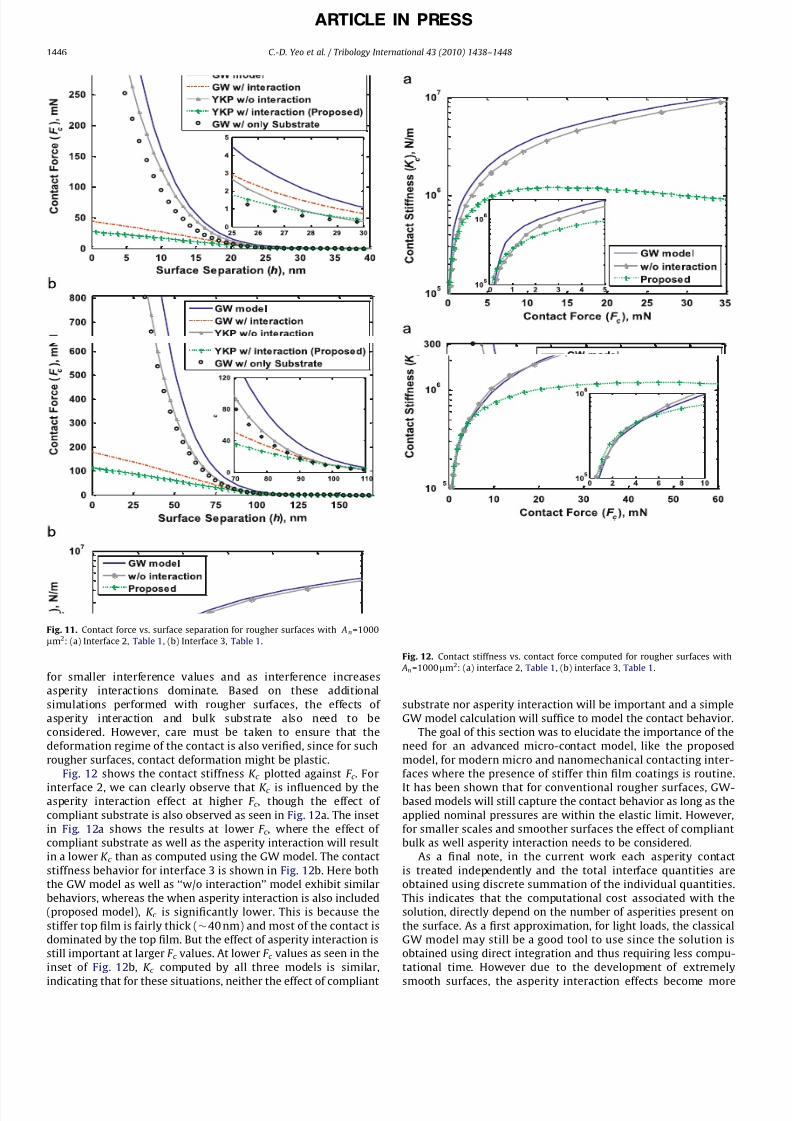
Fig. 11 shows the evolution of contact force F c with decreasing
surface separation h (or increasing interference). The proposed
model results were compared to the GW model, GW with asperity
interaction included (GW w/interaction) and the hard asperity
on softer bulk model without the effect of asperity interaction
(w/o interaction). Fig. 11a shows F c vs. h for interface 2, which is
representative of a surface rougher than surface 1. We observe the
same trend as seen in Fig. 8 where the proposed model shows that
F c is significantly lower than the GW model. As h is decreasing, the
effect of asperity interaction becomes more prominent. The inset
in Fig. 11a shows the comparison of F c at lower interferences(h =25–30 nm), where most of the contact will be elastic: the
proposed model shows the lowest F c , but the contact is dominated
by the compliant substrate behavior since we observe that the
‘‘w/o interaction’’ model results are similar to the proposed model
results. This proves that at lower interference values (higher h),
the effect of asperity interaction might be negligible, but the effect
of compliant substrate is important. Fig. 11b shows F c vs. h for
interface 3, which is representative of a rougher interface. The
trends remain the same, where F c from the proposed model is
lower than the other cases. We observe that the same behavior for
larger separation h (lower interferences) in the inset of Fig. 11b,
but we can observe that F c from the GW model is still higher;
whereas the other models have lower F c . This indicates that both
asperity interactions as well as compliant substrate are important
CEB Model (Elastic)
Proposed Model
CEB Model (Elastic)
Proposed Model
8
CEB Model (Elastic)
Proposed Model
CEB Model (Elastic)
Proposed Model
CEB Model (Elastic)
Proposed Model
CEB Model (Elastic)
Proposed Model
CEB Model (Elastic)
Proposed Model
CEB Model (Elastic)
Proposed Model
CEB Model (Elastic)
Proposed Model
-2 -1 0 1 2 3 4 5 6 7
-1
-0.8
-0.6
-0.4
-0.2
0
0.2
0.4
0.6
0.8
1
Surface Separation (h), nm
N e t F o r c e
( F - F ) , m N
CEB Model (Elastic)
Proposed Model
R e a l A r e a o f C
o n t a c t ( A ) , µ m 2
CEB Model (Elastic)
Proposed Model
-2 0 2 4 6
0
1
2
3
4
5
6
7
Surface Separation (h), nm
CEB Model (Elastic)
Proposed Model
CEB Model (Elastic)
Proposed Model
0 1 2 3 4 5 6 7 8 9
0
2
4
6
8
10
12
14
16
18
20
Contact Force (Fc), mN
F r i c t i o n F o r c e ( Q ) , m
N
CEB Model (Elastic)
Proposed Model
CEB Model (Elastic)
Proposed Model
1 2 3 4 5 6 7
0
1
2
3
4
5
6
7
8
External Force (F -F sc
), mN
F r i c t i o n c o e f f i c i e n t ,
CEB Model (Elastic)
Proposed Model
Fig. 10. Comparison between the proposed model and the CEB elastic model: (a) net interactive force, (b) real area of contact, (c) friction force, (d) friction coefficient.
Table 1
Roughness properties.
r (nm) g (lm2) R (lm) w
Interface 1 1.03 12.48 3.73 0.27
Interface 2 10.4 11.34 0.81 0.64
Interface 3 38.8 17.68 0.23 2.33
C.-D. Yeo et al. / Tribology International 43 (2010) 1438–1448 1445
8/10/2019 Effect of Asperity Interactions on Rough Surface Elastic Contact Behavior- Hard Film o
http://slidepdf.com/reader/full/effect-of-asperity-interactions-on-rough-surface-elastic-contact-behavior- 9/11
ARTICLE IN PRESS
for smaller interference values and as interference increases
asperity interactions dominate. Based on these additional
simulations performed with rougher surfaces, the effects of
asperity interaction and bulk substrate also need to be
considered. However, care must be taken to ensure that the
deformation regime of the contact is also verified, since for such
rougher surfaces, contact deformation might be plastic.
Fig. 12 shows the contact stiffness K c plotted against F c . For
interface 2, we can clearly observe that K c is influenced by theasperity interaction effect at higher F c , though the effect of
compliant substrate is also observed as seen in Fig. 12a. The inset
in Fig. 12a shows the results at lower F c , where the effect of
compliant substrate as well as the asperity interaction will result
in a lower K c than as computed using the GW model. The contact
stiffness behavior for interface 3 is shown in Fig. 12b. Here both
the GW model as well as ‘‘w/o interaction’’ model exhibit similar
behaviors, whereas the when asperity interaction is also included
(proposed model), K c is significantly lower. This is because the
stiffer top film is fairly thick (40 nm) and most of the contact is
dominated by the top film. But the effect of asperity interaction is
still important at larger F c values. At lower F c values as seen in the
inset of Fig. 12b, K c computed by all three models is similar,
indicating that for these situations, neither the effect of compliant
substrate nor asperity interaction will be important and a simple
GW model calculation will suffice to model the contact behavior.
The goal of this section was to elucidate the importance of the
need for an advanced micro-contact model, like the proposed
model, for modern micro and nanomechanical contacting inter-
faces where the presence of stiffer thin film coatings is routine.
It has been shown that for conventional rougher surfaces, GW-based models will still capture the contact behavior as long as the
applied nominal pressures are within the elastic limit. However,
for smaller scales and smoother surfaces the effect of compliant
bulk as well asperity interaction needs to be considered.
As a final note, in the current work each asperity contact
is treated independently and the total interface quantities are
obtained using discrete summation of the individual quantities.
This indicates that the computational cost associated with the
solution, directly depend on the number of asperities present on
the surface. As a first approximation, for light loads, the classical
GW model may still be a good tool to use since the solution is
obtained using direct integration and thus requiring less compu-
tational time. However due to the development of extremely
smooth surfaces, the asperity interaction effects become more
Fig. 11. Contact force vs. surface separation for rougher surfaces with An=1000
mm2: (a) Interface 2, Table 1, (b) Interface 3, Table 1.
Fig. 12. Contact stiffness vs. contact force computed for rougher surfaces with
An=1000mm2: (a) interface 2, Table 1, (b) interface 3, Table 1.
C.-D. Yeo et al. / Tribology International 43 (2010) 1438–14481446
8/10/2019 Effect of Asperity Interactions on Rough Surface Elastic Contact Behavior- Hard Film o
http://slidepdf.com/reader/full/effect-of-asperity-interactions-on-rough-surface-elastic-contact-behavior- 10/11
ARTICLE IN PRESS
dominant and need to be considered. The proposed model is one
such model to capture this effect without dealing with computa-
tional efficiency. In the future greater emphasis also needs to
place in developing contact solutions that include asperity
interaction and are computationally more efficient.
6. Conclusions
An elastic rough surface contact model accounting for asperity
interactions and substrate deformation was proposed. Using the
proposed model, simulations were performed to investigate the
contact behavior of sub-nanometer roughness and microscale
contact areas. Compared to a representative GW-based contact
model where asperity interaction is not considered, the proposed
model showed significantly lower contact stiffness values, which is
in good agreement with experimental measurements. The applic-
ability of the proposed model to rougher surfaces under elastic
contact was also performed. It was found that for smooth as well as
slightly rough surfaces (sub-10nm RMS roughness), consideration of
the bulk deformation and asperity interaction, along with asperity
deformation are important. For RMS roughness in the range of 10 s
of nanometer and meso-scale rough surfaces, the GW model will
suffice to estimate the contact behavior under light loads [28], but
asperity interaction becomes important at heavier loads. However,
caution needs to be exercised in using the proposed model for
situations where significant plastic deformation may occur. Due to
the influence of asperity interaction and compliant bulk substrate,
the resulting real contact area and contact force are lower than
estimated using a GW-based model. Also, the maximum attractive
force is higher and occurs at a smaller surface separation. At higher
contact forces, where the effects of softer substrate and asperity
interactions become significant, friction force is lower in magnitude
compared to elastic CEB model-based results.
Acknowledgments
The initial motivation of this work was through a sponsored
research program from Seagate Technology LLC through Grant no.
SRA-64828. Support by Grants from the National Science
Foundation under Grant number CAREER CMS-0239232 and
Information Storage Industry Consortium (INSIC) Extremely High
Density Recording (EHDR) program are also acknowledged.
Appendix A. Summary of asperity interaction models
A.1. Iida and Ono (IO) model [12]
The contact force F ci and contact area Ai of each asperity are
calculated from Hertzian theory as follows:
F ci ¼4
3E r R
1=2d3=2i
ðdi40Þ0 ðdir0Þ
8<: ðA:1Þ
Aci ¼pRdi ðdi40Þ0 ðdir0Þ
( ðA:2Þ
When the rigid plane comes in contact with an asperity i, the
bases of the other asperities are deformed by the contact force F ciof the contacting asperity i. If the ratio of the real contact area Ar is
o1% of the nominal area An, then the contact on the asperity
summit can be regarded as a concentrated force. Thus, the normal
deformation of asperity i by contact force F cj on another asperity j
is obtained using a Green function for a semi-infinite elastic body
as follows:
u zij ¼F cj
pE r
ffiffiffiffiffiffiffiffiffiffiffiffiffiffiffiffiffiffiffiffiffiffiffiffiffiffiffiffiffiffiffiffiffiffiffiffiffið xi x jÞ2ð yi y jÞ2
q ðA:3Þ
where ( xi, yi) and ( x j, y j) are positions of asperities i and j on the
surface, respectively. The total deformation depth of asperity i due
to contact force on other asperities is given by
u zi ¼XN
j ¼ 1
u zij ðia jÞ ðA:4Þ
and correspondingly the asperity height from the original base
plane is adjusted to z iu zi. In the contact calculation, asperities
are generated randomly using a Gaussian distribution with
heights z i and positions ( xi, yi) calculated similar to the method
used in Section 2.2. During the calculation, F ci and Ai are
iteratively calculated after updating the normal positions of the
asperities until the change in total contact force F c converges to a
value with o0.01% error.
A.2. Ciavarella, Greenwood and Paggi (CGP) model [15]
In this model, the fundamental assumption was that forheavier loads, the asperity contacts can be treated as uniformly
distributed over the apparent area of contact and thus the
resulting deformation will be uniform. The average deformation
over a nominal area An due to a nominal pressure pnom is given
as mpnom
ffiffiffiffiffiffi An
p =E r , where for a Hertzian pressure distribution
m ¼ ð 916Þ
ffiffiffiffip
p ¼ 0:997 1. Based on the GW model, the total
nominal pressure acting on the rough surface is
pnom ¼ F
An¼ 4
3 ffiffiffiffiffiffi
2pp ZE r R
1=2s3=2 f 3=2ðdÞ ðA:5Þ
where f 3=2ðdÞ ¼ R 1d ð z dÞ3=2expð0:5 z 2Þdz , and z is the height
of the asperity from the base plane of the asperity heights (which
is 3ss) below the mean plane of asperity heights and d is the
distance between the rigid plane and base plane of the asperity
heights. Therefore, the effect of the asperity interaction is to
modify Eq. (A.5) to
pnom ¼ 4
3 ffiffiffiffiffiffi
2pp ZE r R
1=2s3=2 f 3=2 dþ pnom
ffiffiffiffiffiffi An
p E r
! ðA:6Þ
Hence, the total nominal pressure acting on all contacting
asperities is assumed to act on the bulk in an ‘‘average’’ sense
which would result in increasing the distance between the rigid
plane and base plane of the asperities. Equation (A.6) has to be
solved iteratively, but a good approximation can be found by the
first iteration only, i.e. using the original GW theory to estimate
pnom as shown in Eq. (A.5) and then substitute that pnom on the
right hand side of Eq. (A.6) to obtain the actual pnom.
References
[1] Greenwood JA, Williamson BP. Contact of nominally flat surfaces. Proc R SocLondon A 1966;295:300–19.
[2] Chang WR, Etsion I, Bogy DB. An elastic–plastic model for the contact of roughsurfaces. ASME J Tribol 1987;109:257–63.
[3] Derjaguin BV, Muller VM, Toporov YP. Effect of contact deformation on theadhesion of elastic solids. J Colloid Interf Sci 1975;53:314–26.
[4] Kogut L, Etsion I. Elastic–plastic contact analysis of a sphere and a rigid flat.ASME J Appl Mech 2002;69:657–62.
[5] Stanley HM, Etsion I, Bogy DB. Adhesion of contacting rough surfaces in thepresence of sub-boundary lubrication. ASME J Tribol 1990;112:98–104.
[6] Polycarpou AA, Etsion I. Static friction of contacting real surfaces in thepresence of sub-boundary lubrication. ASME J Tribol 1998;120:296–303.
[7] Tsui TY, Vlassak J, Nix WD. Indentation plastic deformation field: part II. Thecase of harder films on soft substrates. J Mater Res 1999;14:2204–9.
[8] Karimi A, Wang Y, Cselle T, Morstein M. Fracture mechanisms in nanoscale
layered hard films. Thin Solid Films 2002;420–421:275–80.
C.-D. Yeo et al. / Tribology International 43 (2010) 1438–1448 1447

8/10/2019 Effect of Asperity Interactions on Rough Surface Elastic Contact Behavior- Hard Film o
http://slidepdf.com/reader/full/effect-of-asperity-interactions-on-rough-surface-elastic-contact-behavior- 11/11
ARTICLE IN PRESS
[9] Yeo CD, Polycarpou AA, Kiely JD, Hsia YT. Nanomechanical properties of ultra-thin carbon film overcoats using the nanoindentation technique. J Mater Res2007;22:141–51.
[10] Yeo CD, Katta RR, Polycarpou AA. Improved elastic contact model accountingfor asperity and bulk substrate deformation. Tribol Lett 2009;35:191–203.
[11] Shi X, Polycarpou AA. Investigation of contact stiffness and contact dampingfor magnetic storage head-disk interfaces. ASME J Tribol 2008;130:021901–9.
[12] Iida K, Ono K. Design consideration of contact/near-contact sliders based on arough surface contact model. ASME J Tribol 2003;125:562–70.
[13] Bahrami M, Yovanovich MM, Chulham JR. A compact model for sphericalrough contacts. ASME J Tribol 2005;127:884–9.
[14] Zhao Y, Chang L. A model of asperity interactions in elastic–plastic contact of rough surfaces. ASME J Tribol 2002;123:857–64.
[15] Ciavarella M, Delfine V, Demelio G. A ‘‘revitalized’’ Greenwood and William-son model of elastic contact between fractal surfaces. J Mech Phys Solids2006;54:2569–91.
[16] Ciavarella M, Greenwood JA, Paggi M. Inclusion of ‘‘interaction’’ in theGreenwood and Williamson contact theory. Wear 2008;265:729–34.
[17] Sahoo P, Banerjee A. Asperity interaction in adhesive contact of metallicrough surfaces. J Phys D: Appl Phys 2005;38:4096–103.
[18] Yu N, Polycarpou AA. Contact of rough surfaces with asymmetric distributionof asperity heights. ASME J Tribol 2002;124:367–76.
[19] Johnson KL. Contact mechanics. Cambridge: Cambridge University Press;1985.
[20] Yu N, Polycarpou AA. Adhesive contact based on Lennard-Jones potential: acorrection to the value of the equilibrium distance as used in the potential. JColl Int Sci 2004;278:428–35.
[21] Chang WR, Etsion I, Bogy DB. Adhesion model for metallic rough surfaces.ASME J Tribol 1988;110:50–6.
[22] Chang WR, Etsion I, Bogy DB. Static friction coefficient model for metallicrough surfaces. ASME J Tribol 1988;110:57–63.
[23] Cohen D, Kligerman Y, Etsion I. A model of contact and static friction of nominally flat surfaces under full stick contact condition. ASME J Tribol2008;130:031401.
[24] Thomas TR, Rosen B-G. Determination of the optimum sampling interval for
rough contact mechanics. Tribol Int 2000;33:601–10.[25] Suh A, Polycarpou AA. Digital filtering methodology used to reduce scale of
measurement effects in roughness parameters for magnetic storage super-smooth hard disks. Wear 2005;260:538–48.
[26] Ono K, Takahashi K, Iida K. Computer analysis of bouncing vibration andtracking characteristics of a point contact slider model over random disksurfaces. ASME J Tribol 1999;121:587–95.
[27] Tayebi N, Polycarpou AA. Reducing the effect of adhesion and frictionin microelectromechanical systems (MEMs) through surface roughening:comparison between theory and experiment. J Appl Phys 2005;78:0735281–13.
[28] Shi X, Polycarpou AA. Measurement and modeling of normal contact stiffnessand contact damping at the meso scale. ASME J Tribol 2008;127:52–60.
C.-D. Yeo et al. / Tribology International 43 (2010) 1438–14481448