Embed Size (px)
Citation preview
PHYSICAL-CHEMICAL CHARACTERIZATIONOF HISTORIC PORTUGUESE TILES
RELATÓRIO 23/2011 – NPC/NMM

PHYSICAL-CHEMICAL CHARACTERIZATION OF HISTORIC PORTUGUESE TILES
RELATÓRIO 23/2011 – NPC/NMM
I&D MATERIAIS
Lisboa • Janeiro de 2011
DEPARTAMENTO DE MATERIAISNúcleo de Materiais Pétreos e CerâmicosNúcleo de Materiais Metálicos
Proc. 0205/11/17684Proc. 0204/11/17692
Plano de Investigação Programada do LNEC


LNEC- Procº0205/11/17684 Procº 0204/11/17692
i
PHYSICAL-CHEMICAL CHARACTERIZATION OF HISTORIC PORTUGUESE
TILES
ABSTRACT
A group of Portuguese tiles (azulejos) from the 17th to the early 19th centuries
have been assessed for their chemical and mineralogical compositions and
physical properties.
This LNEC Research Report includes the results of the characterization
campaign that included chemical and mineralogical characterization of the glaze
and ceramic bodies through x-ray fluorescence (XRF), x-ray diffraction (XRD)
and thermogravimetric and differential thermal analysis (TGA-DTA). The pore
structure and hydric behaviour of the azulejos have been studied through
mercury intrusion porosimetry (MIP), BET specific surface measurements, water
imbibition tests and hydrostatic weighing. The thermal and moisture expansion
behaviours have also been assessed through dilatometric measurements.
Following the present results a data base was started where all similar data will
be collected in the future to support consistently future research in the field.

LNEC- Procº0205/11/17684 Procº 0204/11/17692
ii
CARACTERIZAÇÃO FÍSICO-QUÍMICA E MINERALÓGICA DE UM
CONJUNTO DE AZULEJOS HISTÓRICOS PORTUGUESES DOS SÉCULOS
XVII A XIX
RESUMO
Um grupo de azulejos portugueses dos séculos XVII a XIX foi caracterizado
quanto à composição químico-mineralógica e propriedades físicas.
Este Relatório do LNEC inclui os resultados da campanha experimental que
incluiu a caracterização química e mineralógica do vidrado e corpo cerâmico dos
azulejos através das técnicas de fluorescência de raios X (FRX), difracção de
raios X (DRX) e análises termogravimétrica e térmica diferencial. A estrutura
porosa e o comportamento hídrico dos azulejos foram estudados através de
porosimetria de intrusão de mercúrio, análise da superfície específica pelo
método de adsorção de azoto - BET, testes de imbibição de água e de pesagem
hidrostática. Os comportamentos de expansibilidade térmica e hídrica foram
estudados através de medições dilatométricas.
Utilizando os resultados deste relatório foi iniciada a construção de uma base de
dados onde os resultados analíticos similares serão reunidos de forma
consistente de maneira a poderem ser utilizados em projectos de investigação
futuros na área dos azulejos históricos.

LNEC- Procº0205/11/17684 Procº 0204/11/17692
iii
PHYSICAL-CHEMICAL CHARACTERIZATION OF HISTORIC PORTUGUESE
TILES
INDEX ABSTRACT ............................................................................................................ i
RESUMO .............................................................................................................. ii
1- INTRODUCTION .............................................................................................. 1
1.1 – Azulejos production process and resulting composition ........................... 3
2- MATERIALS AND METHODS .......................................................................... 6
2.1- Azulejo samples ......................................................................................... 6
2.2- XRF analysis .............................................................................................. 7
2.3- DRX analysis .............................................................................................. 7
2.4- Thermogravimetric and differential thermal analysis (TGA-DTA)
measurements ................................................................................................... 8
2.5- Water absorption coefficient and imbibition capacity .................................. 8
2.6- Hydrostatic weighing .................................................................................. 8
2.7- Mercury intrusion porosimetry (MIP) .......................................................... 9
2.8- Surface area by nitrogen adsorption (BET) ................................................ 9
2.9- Moisture dilation ......................................................................................... 9
2.10- Thermal expansion coefficient ................................................................ 10
3- RESULTS AND DISCUSSION ....................................................................... 11
3.1- Macroscopic and microscopic observations ............................................. 11
3.2- Chemical and mineralogical characterization ........................................... 13
3.2.1- Ceramic body composition by XRF.................................................... 13
3.2.2- Ceramic body composition by XRD ................................................... 16
3.2.3- Ceramic body TGA-DTA analysis ...................................................... 17
3.2.4- Glaze composition by XRF ................................................................ 18
3.3- Physical characterization and hydric behaviour ....................................... 20
3.3.1- Open porosity and maximum water uptake ....................................... 21
3.3.2- Mercury intrusion porosimetry analysis .............................................. 21
3.3.3- BET Surface area .............................................................................. 23

LNEC- Procº0205/11/17684 Procº 0204/11/17692
iv
3.3.4- Capillary water absorption coefficient and water imbibition capacity . 23
3.3.5- Moisture expansibility ........................................................................ 25
3.3.6- Thermal expansibility ......................................................................... 26
4- CONCLUSIONS ............................................................................................. 28
BIBLIOGRAPHIC REFERENCES ....................................................................... 29
APPENDIX A – XRF SPECTRA AND REFERENCE SAMPLES USED FOR
AZULEJOS GLAZE AND BISCUIT ANALYSIS ................................................... 33
APPENDIX B – XRD DIFRACTOGRAMS .......................................................... 35
APPENDIX C – TGA-DTA CURVES ................................................................... 37
APPENDIX D – SUB-SAMPLES USED FOR WATER IMBIBITIONS TESTS .... 38
APPENDIX E – SUB-SAMPLES USED FOR THE MOISTURE DILATION AND
THERMAL EXPANSIBILITY TESTS ................................................................... 39

LNEC- Procº0205/11/17684 Procº 0204/11/17692
v
PHYSICAL-CHEMICAL CHARACTERIZATION OF HISTORIC PORTUGUESE
TILES
FIGURES INDEX
Figure 1 – Azulejo samples studied ...................................................................... 6
Figure 2 - Moisture expansibility measurement set-up. ....................................... 10
Figure 3 - Schematic view of the XRF composition of the biscuits ...................... 15
Figure 4 - Schematic representation of the chemical composition of the glazes . 20
Figure 5 - Pore size distribution curves of the samples obtained with MIP ......... 22
Figure 6 - Capillary water absorption curves. ...................................................... 24
Figure 7 - Samples water dilation with time ........................................................ 25
Figure 8 - Thermal expansion curves of the sample tiles. ................................... 26
Figure 9 - XRF spectrum of SP1-A1 biscuit. ....................................................... 33
Figure 10 - XRF spectrum of SP1-A1 glaze. ....................................................... 33
Figure 11 – Difractograms of the azulejos studied. ............................................ 36
Figure 12 - TGA and DTA curves of the analyzed samples. ............................... 37
Figure 13 – Sub-samples from the azulejo tiles studied during water imbibitions
tests ............................................................................................................. 38
Figure 14 - Azulejo sub-samples used for the moisture and thermal expansion
tests. ............................................................................................................ 39

LNEC- Procº0205/11/17684 Procº 0204/11/17692
vi
PHYSICAL-CHEMICAL CHARACTERIZATION OF HISTORIC PORTUGUESE
TILES
TABLES INDEX
Table 1 - Ceramic biscuit macroscopic observations. ......................................... 11
Table 2 - Macroscopic characteristics of the glaze of the samples studied ......... 12
Table 3 - XRF results for the elemental composition of the ceramic bodies
interpreted as oxides (weight %, normalized to 100%) ................................ 14
Table 4 - XRD results of the mineralogical composition of the ceramic bodies ... 16
Table 5 – Weight percentage of calcite present in the ceramic body of tiles. ...... 17
Table 6 - XRF results of the elemental composition of the glazes ...................... 19
Table 7 - Hydrostatic weighing and vacuum saturation measurements. ............. 21
Table 8 - Mercury intrusion porosimetry results. ................................................. 22
Table 9 – Specific surface area of the ceramic biscuits ...................................... 23
Table 10 - Capillary water absorption coefficient ................................................ 24
Table 11 – Readings and values of water expansibility at 48 h .......................... 26
Table 12 - Thermal expansibilities of the sample tiles. ........................................ 27
Table 13 - Standards used for Glaze and biscuit quantification and indicative
accuracy measurements (%) ....................................................................... 34

LNEC- Procº0205/11/17684 Procº 0204/11/17692
1
PHYSICAL-CHEMICAL CHARACTERIZATION OF HISTORIC PORTUGUESE
TILES
1- INTRODUCTION
Architectural glazed ceramics – azulejos – are an important part of the cultural
heritage of Portugal. But a sizeable part of this rich heritage is lost every year
through continuous decay and neglect which results in the loss of the glaze layer
that contains the decoration and in the desegregation of the ceramic body (the
“biscuit”). This issue is particularly felt for glazed ceramics in architectural usage
since they are subjected to much harsher environmental conditions. The
physical, chemical and mineralogical characterization of azulejos is essential for
a better understanding of their decay forms and mechanisms and to support
studies on the best conservation and restoration measures to apply in order to
protect this national heritage. It can also give information about their production
technology, raw materials used and possible geographical provenance. However,
despite the fact that many art history studies about Portuguese azulejos exist,
there are only a few physical, chemical and mineralogical studies published on
them.
Sanjad et al. made chemical and mineralogical characterizations of a group of
19th-early 20th century Portuguese tiles used in Belém do Pará in Brasil,
contributing towards a better understanding of their constituent materials [1]. F.
Antunes et al and Coroado et at have made some physical and mineralogical
characterisations of a small group of Portuguese tiles from the 17th century [2, 3].
A. P. Carvalho made characterization studies of the ceramic pastes of historic
tiles [4]. Other authors have performed studies in the characterisation of the
glaze and pigments used in azulejos [5], including a Master Thesis by S. Coentro
prepared at Laboratório Nacional de Engenharia Civil (LNEC) focusing on the

LNEC- Procº0205/11/17684 Procº 0204/11/17692
2
study of 17th century tiles glaze and pigments [6]. Despite the fact that such
partial studies have been done on the physical, chemical and mineralogical
characterization of azulejos glaze and biscuit materials there is not a
comprehensive study on the matter.
Research needs on decay and how to deal with it have been pointed by J-M.
Mimoso et al. in 2009 [7]. Such research must be based on a sound knowledge
of the physical and chemical nature of azulejos and that need has been asserted
in the research planning on the subject proposed also in 2009 by our group for
internal financing. The approval of that plan lead to inspections to sites [8],
research on decay [9] and a characterization campaign that included the previous
study by S. Coentro [6] and now a more comprehensive study of which the first
results are presented in this Report. The whole makes up a base of knowledge
on historic Portuguese tiles that will allow a better understanding of their material
properties, their influence on decay forms and mechanisms and hopefully a
grounded effort on methods and materials for their conservation.
The main goal of the present study is to provide a detailed physical-chemical and
mineralogical characterization of a group of ceramic tiles that present defects in
their glaze layer. A further aim to be developed in future work at LNEC is to try
and obtain correlations between the physical-chemical and mineralogical
properties of the set of tiles studied in this report and their degradation
mechanisms through the crystallization of soluble salts during accelerated ageing
tests. Another aim is to survey the characterization techniques available that may
be used by LNEC with a view to establish a preliminary database of the
properties of historical Portuguese tiles that will be made available to all
researchers working in the field.
The physical properties that have been studied presently were: i) the pore
structure of the tiles ceramic body through mercury intrusion porosimetry (MIP);
ii) the specific surface area through the BET method; iii) the water absorption
curves; and iv) the thermal and moisture expansibility by dilatometric

LNEC- Procº0205/11/17684 Procº 0204/11/17692
3
measurements. The chemical and mineralogical constituents have been
determined by x-ray fluorescence (XRF) of both the ceramic body and the glaze
and x-ray diffractometry (XRD) of the ceramic body.
1.1 – Azulejos production process and resulting composition
Ceramic tiles have generally a square shape and are considered a composite
material made up of a ceramic body and a thin glass layer where the decorative
pigments are integrated.
The raw clay materials used to prepare the ceramic biscuits were generally
constituted by a mixture of crystalline minerals of diverse grain sizes such as
clays, quartz, and feldspars. Calcite and dolomite could also be present on the
raw materials or purposely added to them in order to promote the fusibility upon
firing and to lighten the color of the final ceramic body. Other compounds such as
organic matter, iron oxides, titanium oxide, pyrite, etc. could also be found in the
raw materials in the form of impurities [10]. After the preparation of the ceramic
paste and the molding of the biscuit, the raw ceramic bodies were fired in a
traditional wood fuelled kiln. The use of such kilns made it difficult to control the
firing procedure leading to inhomogeneous heating inside the oven, uncontrolled
oxygenation and a range of firing temperatures that could range from around
800ºC to circa 1100ºC.
When fired in an oxidizing atmosphere the ceramic raw materials would react
according to their initial composition, granulometry and firing temperature. At
around 450-550ºC the clay mineral structures dehydroxilate collapsing into illite -
like structures [11]. Alkaline-earth silicates such as wollastonite and diopsides,
earth-alkali aluminosilicates (such as gehlenite and anorthite); aluminosilicates
(such as mullite), and other silicates such as cristobalite are formed together with
fused vitreous phases [10]. At about 750ºC calcium carbonate starts
decomposing into calcium oxide. The smaller the grains of calcium carbonate the

LNEC- Procº0205/11/17684 Procº 0204/11/17692
4
faster and most complete will the transformation be [12]. The resulting calcium
oxide reacts at carbonate-silicate interfaces with the clay minerals decomposition
products to produce calcium aluminosilicates such as gehlenite and/or calcium
magnesium aluminosilicates such as diopsides when magnesium is present. If
this reaction is not complete residual calcium oxide main remain on the azulejos,
this could re-hydrate and later re-carbonate originating a volume increase that
may cause damage to the ceramic tiles structure, delayed distortion and crazing
[12].
If the firing temperature is too low, un-reacted feldspars may remain, together
with metakaolinite and un-bonded calcium or magnesium oxides [10]. After being
fired, the ceramic body is composed of a highly heterogeneous matrix of crystal
minerals and vitreous phases. The ratio of vitreous to amorphous phases
depends on the raw materials and the firing temperatures, the vitreous phase
increasing with the maximum temperature [10].
The glaze layer is thought to have been applied to the fired ceramic base by
several procedures described elsewhere [10]. The glaze can be applied as a frit,
as raw glaze materials or as a mixture of both. The final glaze is composed by an
amorphous matrix with some crystalline inclusions such as quartz and chamotte
(powdered ceramic biscuit). The vitreous matrix is composed mainly of a silica
and lead oxide network with some alumina. Silica makes up the main vitreous
network and lead oxide and alkaline oxides work as major fusing agents and
network stabilizers. The use of lead oxide provides a suitable viscosity and
elasticity during the firing procedure and produces a smooth and shiny glaze
surface. Aluminum oxide is added to the glaze to stabilize and increase the
chemical and physical resistance of the glaze structure, increase viscosity and to
decrease the lead solubility. Calcium oxide acts as a network modifier. Historic
Portuguese tiles are constituted by a lead-based glaze with minor amounts of
sodium and potassium oxides and tin oxide as opacifying agent.

LNEC- Procº0205/11/17684 Procº 0204/11/17692
5
The common method of tiles production involves the initial firing of the clay body,
as described, and the subsequent firing of the glaze. During the firing of the glaze
a bonding is originated by the connection of the glaze to the ceramic body with
integration between the materials in contact. The interface thus formed is highly
important for establishing a good connection of the glaze to the ceramic body and
may be determinant for better resistance to the decay factors that affect azulejos,
particular the shear stresses that tend to delaminate the glaze from the biscuit
[13].
The susceptibility of the azulejos towards decay depends on production
parameters such as the raw clay and glaze compositions, the additions used, the
moulding method, and the firing cycles. It also depends on the environmental
exposure (particularly moisture), maintenance and contaminations that it may
have withstood during its lifespan.

LNEC- Procº0205/11/17684 Procº 0204/11/17692
6
2- MATERIALS AND METHODS
2.1- Azulejo samples
Figure 1 shows the azulejo samples studied.
SP1-A1 SP2-A2 SP1-A3 SP1-A5
SP1-A6 SP1-A7 SP1-A8
Figure 1 – Azulejo samples studied
Samples were tentatively dated taking in consideration their stylistic and technical
features as follows:
SP1-A1....... 18th century
SP1-A2....... late 17th - early 18th century
SP1-A3....... late 18th – early 19th century
SP1-A5....... late 18th – early 19th century
SP1-A6....... 17th century
SP1-A7....... late 17th - early 18th century
SP1-A8....... late 18th - early 19th century

LNEC- Procº0205/11/17684 Procº 0204/11/17692
7
2.2- XRF analysis
The samples were analysed by XRF at Universidade Nova de Lisboa (UNL)
within a research partnership between LNEC and UNL. The analysis were
performed directly on an ArtTAX Pro spectrometer manufactured by Intax GmbH
and equipped with a Molybdenum X- ray source of about 70 µm diameter and a
siliceous detector X-Flash. This equipment allowed sample analysis of elements
between aluminium (Al) and uranium (U).
For the glaze analysis direct measurements were performed on the white surface
areas of the tiles. For the analysis of the ceramic biscuit, the samples were
powdered to a grain size <106 µm and used simultaneously for XRF and DRX
analyses. The powdered samples were put on top of a glass slide and
compacted with a spatula into a layer or about 3 mm thickness. Three
measurements were taken at distinct spots of the samples in a helium
atmosphere with an acquisition time of 300s at 40 kV and 600 µA excitation
source intensity.
The quantitative analysis of the spectra was performed with the WinAxil and
Winfund programs using the fundamental parameters method. A lead glass
reference (CMOG C) and a lead and tin glass standard prepared by UNL
(LeadTin) were used for the calibration of the glazes. A red brick clay standard
(Red Brick Clay 679) and a Plastic clay standard (Plastic clay 98b) were used for
the calibration of the ceramic biscuit measurements. The standards composition
is presented in Appendix A.
The accuracy of the method has been determined through the analysis of the
(CMOG C) standard for the glaze and plastic clay standard for the ceramic
biscuits (Appendix A).
2.3- DRX analysis
A part of the ceramic body was removed from the tile, separated from the glaze
layer with a saw and carefully cleaned of any remaining mortar. The ceramic
body samples were then dried at 60ºC up to constant weight, and crushed until
all particles passed a 106 µm sieve. A total of 2 g per sample has been analysed

LNEC- Procº0205/11/17684
Procº 0204/11/17692
8
on a Philips X-Pert X-ray diffractometer with cobalt Kα radiation. The analysis
conditions used were: screening between 3 and 74º 2θ, 0.05º2θ /s; 35 kV and 45
mA.
2.4- Thermogravimetric and differential thermal analysis (TGA-DTA)
measurements
The powdered samples (<106 µm) were dried at 60ºC and analysed in a Setaram
TGA 92 thermal analysis equipment (TGA-DTA) in an argon atmosphere (3L/h).
The heating rate was 10ºC/min from room temperature to 1000ºC.
2.5- Water absorption coefficient and imbibition capacity
The samples have been isolated laterally with Sikadur 32N epoxy resin and dried
at 60ºC up to constant weight. The samples were then positioned flat over a
container with demineralised water. The water wetted about 0.5 cm of the tile
height. The water absorption increment was monitored by periodic weighing of
the samples.
2.6- Hydrostatic weighing
The experimental was made according to a LNEC procedure [14] based on the
EN-1936 European Standard. The tile samples are dried up to constant weight at
60ºC. Their dry weight (M1) is noted. They are then put in a vacuum chamber
and let to degasify for 24 h, after which demineralised water is introduced until
the samples are covered and then again let in a vacuum for another 24 h. The
atmospheric pressure is then re-established and the samples are left immersed
in water for another 24 h. Their weights while immersed in water (M2) and
removed but still wet (M3) are taken. The values for open porosity (P), maximal
water uptake (MWU), real (DR) and apparent densities (AD) are then obtained
through the following equations:
).()21( 3−−= mKgMMDR Eq. 1
).()23
1( 3−
−= mKg
MM
MAD Eq. 2

LNEC- Procº0205/11/17684 Procº 0204/11/17692
9
(%))23
13(
MM
MMP
Eq. 3
(%))1
13(
M
MMMWU
Eq. 4
2.7- Mercury intrusion porosimetry (MIP)
Before the MIP analysis the samples are dried up to constant weight at 60ºC in a
ventilated oven, cooled down in an exsicator and weighed with an analytical
scale. The MIP measurements have been performed with a Quantachrome
Autoscan porosimeter at LNEC according to an LNEC procedure LERO-PE15
[15], based on the ASTM D4404-84 American Standard.
2.8- Surface area by nitrogen adsorption (BET)
The samples are dried up to constant weight at 60ºC in a ventilated oven, cooled
down in an excicator and weighed in an analytical scale. The surface area
determination by the BET theory has been measured with Quantachrome
AutoSorb1 equipment, according to LNEC E412 Specification [16].
2.9- Moisture dilation
The moisture expansion has been measured using Linear Strain Conversion
(LSC) transducers Full Bridge 350 according to LNEC procedure LERO PE-10
[17] based on the RILEM 25 PEM Provisional Recommendations.
The samples were cut in lengths from 50 to 85 mm. On the top was glued a glass
slice with a small incision to allow the transducer point to rest and avoid any
slippage or penetration into the ceramic body. The samples are dried at 60ºC in a
ventilated oven and allowed to cool down in an excicator before the
measurement procedure. Each sample and transducer were mounted on a
stainless steel structure, put inside a cylindrical acrylic container and covered
with deionised water (see Figure 2). The tests were performed at laboratory
conditions (20 ± 2ºC). The lengths were registered every 5 min up to 48 h.
The linear coefficient of hydric dilation (ε) is calculated after 48 h of immersion
through the formula:

LNEC- Procº0205/11/17684 Procº 0204/11/17692
10
)(0
0
l
LLf Eq. 5
where Lf is the transducer reading at 48 h; L0 the initial transducer reading; and l0
the initial sample length.
Figure 2 - Moisture expansibility measurement set-up.
2.10- Thermal expansion coefficient
The thermal expansibility is measured with an automatic dilatometer Dilatomic
1200C manufactured by Theta Industries, with 1 µm resolution on the length
measurement and 0.1ºC on the surface temperature of the sample. The
experimental procedure was performed according to the EN-14581 Standard
[18].
The temperature program initiated at around 20ºC with temperature increments
of 20ºC, a stabilization period of 120 min at each temperature step up to a
temperature of 120ºC. The thermal expansion coefficients (ξ) were calculated by
regression from the ΔL / L values obtained at the end of each temperature step,
where L is the initial sample length and ΔL is the length variation measured at the
end of each step.

LNEC- Procº0205/11/17684 Procº 0204/11/17692
11
3- RESULTS AND DISCUSSION
3.1- Macroscopic and microscopic observations
The ceramic body is generally characterized by a light yellow-cream to pink-
oranje colour, fine texture, sometimes with long pores oriented parallel to the
surface and dispersed in the matrix (Table 1).
Table 1 - Ceramic biscuit macroscopic observations.
Samples Picture thickness Observations
SP1-A1
11-12mm Yellow colour with small
circular and elongated pores.
SP1-A2
14mm Yellow colour with small
circular and elongated pores.
SP1-A3
11mm Yellow-orange colour with small circular and elongated pores.
SP1-A5 11-12mm Yellow colour with large and small elongated pores. Large air pockets resulting from the plastic conformation method of the ceramic paste used to shape the biscuit.
SP1-A6 15mm Yellow colour with small circular and elongated pores. The ceramic matrix has a less consistent appearance.
SP1-A7 13mm Yellow-orange colour with small circular and elongated pores.
SP1-A8 10mm Main body pink with a yellowish sub-layer bellow the glaze. Elongated pores.
LNEC- Procº0205/11/17684 Procº 0204/11/17692
12
In some cases there are heterogeneities in the ceramic matrix, such as red
inclusions several mm in length. These aspects indicate the use of a rather rough
ceramic paste or mixture of clays. The presence of elongated pores is a
consequence of the plastic conformation of the raw clay materials for shaping the
tiles where the largest dimension of the pores is parallel to the tile surface. The
layering of colours usually indicates a poor mixing of the clays used but in the
case of sample SP1-A8 (see Table 1) it suggests the application of a lighter clay
layer under the glaze in order to lighten the biscuit and avoid a dark shade under
the partially transparent glaze.
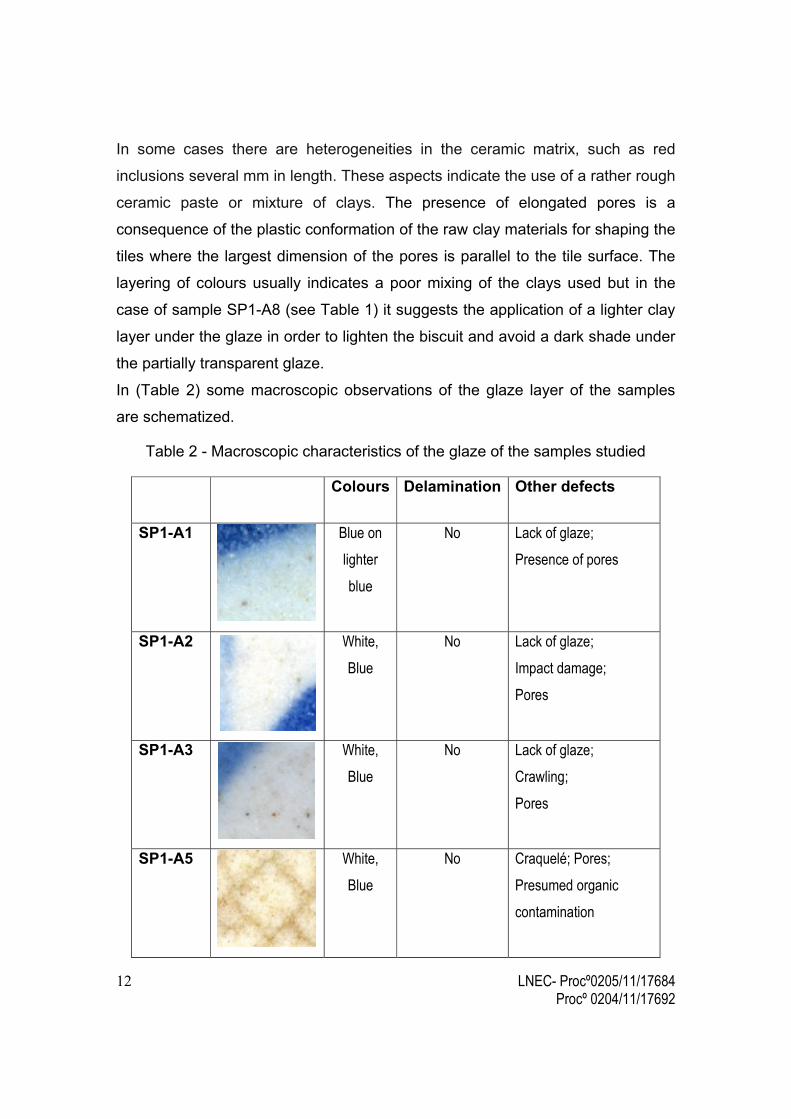
In (Table 2) some macroscopic observations of the glaze layer of the samples
are schematized.
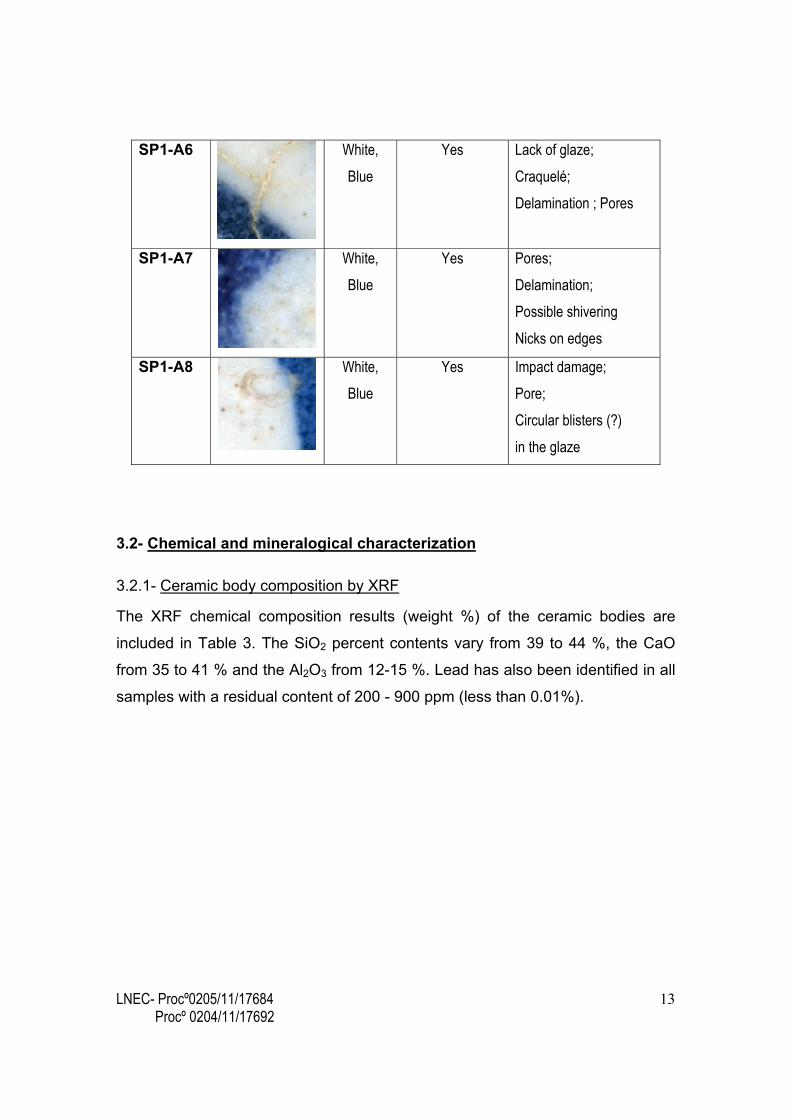
Table 2 - Macroscopic characteristics of the glaze of the samples studied
Colours Delamination Other defects
SP1-A1
Blue on
lighter
blue
No Lack of glaze;
Presence of pores
SP1-A2
White,
Blue
No Lack of glaze;
Impact damage;
Pores
SP1-A3
White,
Blue
No Lack of glaze;
Crawling;
Pores
SP1-A5
White,
Blue
No Craquelé; Pores;
Presumed organic
contamination
LNEC- Procº0205/11/17684 Procº 0204/11/17692
13
SP1-A6
White,
Blue
Yes Lack of glaze;
Craquelé;
Delamination ; Pores
SP1-A7
White,
Blue
Yes Pores;
Delamination;
Possible shivering
Nicks on edges
SP1-A8
White,
Blue
Yes Impact damage;
Pore;
Circular blisters (?)
in the glaze
3.2- Chemical and mineralogical characterization
3.2.1- Ceramic body composition by XRF
The XRF chemical composition results (weight %) of the ceramic bodies are
included in Table 3. The SiO2 percent contents vary from 39 to 44 %, the CaO
from 35 to 41 % and the Al2O3 from 12-15 %. Lead has also been identified in all
samples with a residual content of 200 - 900 ppm (less than 0.01%).

LNEC- Procº0205/11/17684 Procº 0204/11/17692
14
Table 3 - XRF results for the elemental composition of the ceramic bodies
interpreted as oxides (weight %, normalized to 100%)
Oxides
Al2O3 CaO
Cr2O3
CuO
Fe2O3
K2O
MnO
NiO
PbO
SiO2
SrO
TiO2
ZnO
Samples % % % % % % % % % % % % %
SP1-A1 13.4 35.5 0.01 0.01 5.4 1.3 0.03 0.01 .0002 43.5 0.05 0.8 0.02
STD 0.5 0.5 0.001 0.001 0.1 0.3 0.003 .002 .0001 1.3 .0002 0.2 .001
SP1-A2 12.1 39.0 0.01 0.01 4.9 1.9 0.04 0.01 0.07 41.3 0.05 0.7 0.02
STD 1.1 2.3 0.001 0.001 1.2 0.4 0.008 .001 0.003 3.9 0.004 0.1 .003
SP1-A3 12.5 38.2 0.01 0.01 5.2 1.8 0.04 0.01 0.002 41.6 0.06 0.6 0.03
STD 0.5 1.3 0.006 0.003 0.3 0.2 0.002 .002 .0004 1.6 .0004 0.06 0.5
SP1-A5 14.6 36.4 0.01 0.01 5.4 1.6 0.04 0.01 0.05 41.0 0.05 0.8 0.02
STD 0.8 0.5 0.001 .0001 0.4 0.3 0.005 .002 0.06 1.5 0.003 0.03 0.8
SP1-A6 12.5 37.2 0.01 0.01 4.8 1.2 0.05 0.01 0.03 42.9 0.06 1.1 0.02
STD 0.7 2.5 0.004 0.002 0.2 0.1 0.008 .001 0.06 2.7 0.001 0.52 0.7
SP1-A7 12.1 41.3 0.01 0.02 5.1 1.5 0.05 0.01 0.002 39.0 0.06 0.9 0.02
STD 1.0 1.3 0.001 0.004 0.4 0.1 0.004 .001 .0001 1.9 0.005 0.25 1.0
SP1-A8 13.7 35.2 0.01 0.01 6.6 2.4 0.04 0.01 0.09 40.9 0.04 0.9 0.02
STD 0.5 1.5 0.000 0.003 1.0 0.4 0.003 .003 0.003 0.9 0.002 0.16 0.5
The presence of lead in the ceramic biscuit could be explained by the absorption
of the soluble lead oxide used in the glaze formulation, or because of leaching of
soluble lead from the glaze. In order to be able to discriminate between the use
of a raw glaze or frit, comparative studies should be performed on the contents of
lead present in the ceramic body when each preparation method is used for the
manufacture of azulejos (through reproductions). However, the low content in
lead seems compatible with the use of previously prepared frits.
The body colour is generally related to the amount and distribution of Fe3+ ions
such as in Fe2O3 present in the ceramic matrix. The samples usually presented a
cream or light yellow-orange colour indicative of a low content of Fe2O3. Sample

LNEC- Procº0205/11/17684 Procº 0204/11/17692
15
SP1-A8 depicted the darkest shade of pink-orange (Table 1) which corresponds
to the slightly higher amount of Fe2O3 detected by XRF.
A schematic representation of the ceramic biscuit azulejos composition is
presented in Figure 3.
Figure 3 - Schematic view of the XRF composition of the biscuits
The results of the elemental composition may indicate that the raw materials
used in the production of the ceramic pastes had similar compositions. The raw
materials could be classified as high Ca-rich (CaO > 6%) and low refractory
(fluxes such as K2O, CaO, TiO2 > 9%) clays [19]. The mineralogical composition
(Table 4) is more distinct suggesting that the raw materials mineralogy,
granulometry and/or firing conditions were considerably different.
A: SiO2100
C: CaO and others100
B: Al2O3100
0 0
0
22

LNEC- Procº0205/11/17684 Procº 0204/11/17692
16
3.2.2- Ceramic body composition by XRD
The minerals identified by XRD are presented in Table 4. The minerals identified
in the set of tile samples are similar with different semi-quantitative amounts. The
corresponding difractrograms can be found in Annex C.
Table 4 - XRD results of the mineralogical composition of the ceramic bodies
Mineral name
Quartz
(Q)
Cristobalite
(Cr)
Calcite
(C)
Gehlenite
(G)
Wollastonite
(W)
K-Feldspars
(F)
Hematite
(H)
Analcime
(A)
Chemical formula
SiO2 SiO2 CaCO3 Ca2Al[AlSiO7] CaSiO3 KAlSi3O8 Fe2O3 NaAlSi2O6·H2
O
Samples Q Cr C G W F H A
SP1-A1 ++/+++ - - ++ ++/+++ + + Tr/+
SP1-A2 +/++ Tr ++ ++ + + Tr Tr
SP1-A3 ++/+++ - +/++ ++ ++ + Tr/+ -
SP1-A5 +/++ Tr + ++ ++ + Tr/+ +
SP1-A6 ++/+++ + ++ ++/+++ Tr ++ Tr/+ +/++
SP1-A7 ++ - ++ ++/+++ Tr/+ + Tr/+ -
SP1-A8 ++/+++ - +/++ ++ ++ +/++ Tr/+ Tr
Semi-quantitative analysis of the minerals: +++ high, ++ medium, + low, “Tr” traces and “-“ not
detected
Quartz is generally used as main constituent of the body and glaze compositions,
acts as filler and contributes to dimensional stability by reducing firing shrinkage
[12]. Quartz was present in all samples and was one of the major minerals
present together with wollastonite for SP1-A1 and gehlenite for SP1-A6 and SP1-
A7. The other mineral phases encountered were cristobalite, calcite, hematite,
feldspars and analcime. Gehlenite and wollastonite are reported to be formed at
temperatures > 800ºC [11] being present in all samples. Besides cristobalite,
other minerals formed at high firing temperatures such as mullite (>900ºC) [11],
were not detected in the samples analysis.

LNEC- Procº0205/11/17684 Procº 0204/11/17692
17
Calcite is present in all samples and it was doubly confirmed through the TGA-
DTA measurements (Table 5) but due to the low amount present in SP1-A1 its
presence could not be identified via XRD. The calcite present can be the result
of contamination from the mortars or due to re-hydration of the CaO formed
during the firing and later re-carbonation into calcite.
3.2.3- Ceramic body TGA-DTA analysis
Thermal variations associated with the chemical and physical transformations,
such as decomposition of carbonates (CaCO3) in the range 600-850ºC, were
obtained by TGA-DTA analysis. From these data, the amount of calcite was
calculated (Table 5) and the results of XRD could be confirmed (Table 4). All de-
carbonation registered was assumed to be due to the decomposition of calcite
since there was no information about the existence of other carbonates in the
samples by XRD or XRF. The graphical results obtained are presented on
Appendix C.
Table 5 – Weight percentage of calcite present in the ceramic body of tiles.
Samples Calcite (%)
SP1-A1 1.0
SP1-A2 25.3
SP1-A3 11.7
SP1-A5 3.0
SP1-A6 18.6
SP1-A7 24.5
SP1-A8 12.0
LNEC- Procº0205/11/17684 Procº 0204/11/17692
18
The results show large variations on the calcite present in the samples but there
is a group of high content (SP1-A2 and SP1-A7) and a group of very low content
(SP-A1 and SP-A5).
The presence of calcite may have several origins: incomplete de-carbonation in
the core of the ceramic tile during firing, re-carbonation of un-reacted calcium
oxide and contamination with soluble CaO/CaCO2 from the mortars [20, 21]. The
presence of high level of carbonates in the raw ceramic materials promotes high
porosity due to de-carbonation during firing, lowers the vitrification temperature
(to 700-800ºC) [22] and may produce lighter colored ceramic pastes.
3.2.4- Glaze composition by XRF
The results of the compositional analysis of the glazes are included in Table 6 in
the form of oxides. The content of SiO2 measured varied from 52% to 71%. Due
to u-XRF low sensitivity to Al determination and the small amounts present in the
samples the quantification of Al2O3 present, the other network forming oxide,
could not be accurately measured. In relation to the network modification oxides
the values of PbO vary from 15 to 31%; K2O form 5 to 9%; CaO from 0.6 to 1.1 %
while Na2O could not be determined again due to XRF limitations. Opacifying or
colouring oxides such as CuO and Fe2O3 were found as minor components
(<0.4%) while SnO2 was found with a content of 5-11 %.

LNEC- Procº0205/11/17684 Procº 0204/11/17692
19
Table 6 - XRF results of the elemental composition of the glazes
(Weight %, normalized to 100%)
Oxides
CaO CuO Fe2O3 K2O MnO NiO PbO SiO2 SnO2
Samples % % % % % % % % %
SP1-A1 0.8 0.1 0.1 6.3 0.01 0.04 19.6 62.7 10.3
STD 0.081 0.003 0.0211 0.3 0.0016 0.009 1.46 1.4 0.20
SP1-A2 0.7 0.02 0.3 6.1 0.01 0.02 24.7 63.5 4.7
STD 0.081 0.003 0.0211 0.3 0.0016 0.009 1.46 1.4 0.20
SP1-A3 0.6 0.02 0.3 7.2 0.01 0.06 24.9 60.3 6.7
STD 0.030 0.001 0.0109 0.2 0.0003 0.002 0.46 0.7 0.07
SP1-A5 0.6 0.02 0.3 7.2 0.01 0.03 19.7 68.0 4.2
STD 0.044 0.002 0.0237 0.3 0.0011 0.008 0.75 1.1 0.04
SP1-A6 1.1 0.01 0.4 8.5 0.01 0.07 14.8 70.5 4.6
STD 0.046 0.001 0.0527 0.2 0.0005 0.011 0.40 0.3 0.27
SP1-A7 0.9 0.03 0.4 6.4 0.02 0.02 24.9 58.0 9.3
STD 0.064 0.001 0.0250 0.2 0.0006 0.004 0.38 1.7 1.10
SP1-A8 0.8 0.02 0.2 5.4 0.01 0.03 31.1 51.8 10.7
STD 0.001 0.001 0.0002 0.1 - 0.000 0.03 0.2 0.01
A schematic representation of the ceramic biscuit azulejos composition is
presented in Figure 4.

LNEC- Procº0205/11/17684 Procº 0204/11/17692
20
A: SiO2100
B: PbO100
C: SnO2, K2O and others100
0 0
0
Figure 4 - Schematic representation of the chemical composition of the glazes
3.3- Physical characterization and hydric behaviour
Physical characteristics of the samples such as porosity, density and water
absorption capacity are directly related with the raw materials used, the
morphologic and mineralogical transformations occurred in kiln atmosphere and
the later degradation mechanisms of porous architectural ceramic materials.
The structure of the ceramic paste is composed of irregular unions between very
thin grains to vitreous masses that connect larger and harder grains such as
quartz, chamotte, etc [10]. These agglomerate masses are crossed by numerous
thin pores, with micro-fissures and other cavities of different sizes filled with air
usually resulting from the ceramic paste preparation methods. The pore structure
of the ceramic paste is also a consequence of the loss of structural water from
the clay minerals, the (α-β) quartz transformation and consequent volumetric

LNEC- Procº0205/11/17684 Procº 0204/11/17692
21
expansion at 575ºC and the release of CO2 from the carbonate materials [10]. As
the firing temperature increases, the vitrification also increases and the pore size
decreases [10].
In architectural ceramics the pore volume and pore size determine the capacity of
fluids storage and ease of fluid circulation within the materials.
3.3.1- Open porosity and maximum water uptake
Table 7 - Hydrostatic weighing and vacuum saturation measurements.
Samples
Real
density
(kg/m3)
Apparent
density
(kg/m3)
Open
porosity
(vol %)
Maximum
water uptake
(mass %)
SP1-A1 2870 1600 44.3 27.6
SP1-A2 2730 1730 36.6 21.1
SP1-A3 2820 1620 42.7 26.4
SP1-A5 2740 1620 40.9 25.3
SP1-A6 2750 1720 37.7 22.0
SP1-A7 2810 1710 39.0 22.8
SP1-A8 2790 1712 38.6 22.6
The densities of the samples tested are relatively similar with a higher open
porosity for the SP1-A1 tile and lower for SPA-A2 and SP1-A6 tiles with a
corresponding water uptake. Some differences exist in the porosity accessible to
water with higher open porosity values for SP1-A1 and SP1-A3 tiles and lower
values for SP1-A2 and SP1-A6 tiles.
3.3.2- Mercury intrusion porosimetry analysis
The porosity values obtained through mercury intrusion porosimetry (MIP) follow
the general trend values obtained from the measurement of the water intake

LNEC- Procº0205/11/17684
Procº 0204/11/17692
22
(Table 7) except for SP1-A5. The difference obtained for this sample could be
explained by the existence of large pores (see Table 1) which are beyond the
measuring capability of the protocol used.
The pore size distribution of the samples are presented in Figure 5 and Table 8.
Most samples present unimodal pore distributions in the region of 0.5 – 0.7 µm.
However SP1-A2, SP1-A7 and SP1-A8 present a bimodal pore size distribution
where SP1-A8 presenting a high rate of small pores with diameters around 0.02-
0.07 µm.
Table 8 - Mercury intrusion porosimetry results.
Samples Porosity (%) Pores (µm )
SP1-A1 46.9 0.7
SP1-A2 34 0.04 - 0.46
SP1-A3 45.5 0.45
SP1-A5 31.7 0.7
SP1-A6 38.7 0.29 - 0.68
SP1-A7 33.3 0.03 – 0.45
SP1-A8 36.2 0.02 - 0.065
Figure 5 - Pore size distribution curves of the samples obtained with MIP
-1.00E-01
0.00E+00
1.00E-01
2.00E-01
3.00E-01
4.00E-01
5.00E-01
6.00E-01
7.00E-01
8.00E-01
0.001 0.01 0.1 1 10
Raio (micrometro)
dV
/dlo
gr
(cc/
g)
SP1_A1
SP1_A2
SP1_A3
SP1_A6
SP1_A5
SP1_A7
SP1_A8

LNEC- Procº0205/11/17684 Procº 0204/11/17692
23
3.3.3- BET Surface area
Nitrogen adsorption analysis according to the BET theory was the reference
method for specific surface area analysis. The results for the ceramic biscuits are
presented in Table 9. Samples SP1-A7 and SP1-A8 could not be measured due
to an equipment malfunction.
Table 9 – Specific surface area of the ceramic biscuits
Samples Spec. surf. area
(m2/g)
SP1-A1 3.77
SP1-A2 3.68
SP1-A3 1.69
SP1-A5 3.91
SP1-A6 1.63
SP1-A7 -
SP1-A8 -
3.3.4- Capillary water absorption coefficient and water imbibition capacity
The results seen on Figure 6 and Table 10 relate to the different capacities of
fluids transfer of the tiles. The higher open porosity measured for SP1-A1 results
in a much higher speed of water imbibition of this sample compared to the others.
A correlation may in fact be established between the values of the open porosity
determined through water intake and MIP and the water absorption coefficients
presented in Table 7 and Table 8.
The capillary water absorption curves of SP1-A1 and SP1-A3, made up of two
straight lines, are characteristic of materials whose pores are well interconnected
and lay in a defined pore dimensional range as observed in Figure 6. The low
imbibition capacity and small capillarity coefficient observed for sample SP1-A5
may be explained by the presence of organic contamination materials
impregnated in the ceramic body and glaze of the sample that could act as water

LNEC- Procº0205/11/17684 Procº 0204/11/17692
24
repellent hydrophobic agents. That sample has in fact been collected from the
oven area of an old kitchen.
The low water absorption coefficients of samples SP1-A8, SP1-A7 and SP1-A2
can be explained by the existence of pores with distinct sizes (bimodal pore size
distribution, Figure 5).
Figure 6 - Capillary water absorption curves.
Table 10 - Capillary water absorption coefficient
Samples
Cap. Coef.
(Kg/m2/h1/2)
Imbibition
capacity
(% Wt)
SP1-A1-P2 3.1 16
SP1-A1-P3 3.0 15
SP1-A2-P1 0.4 12
SP1-A3-P1 1.2 17
SP1-A5-P1 0.2 7
SP1-A6-P1 0.5 17
SP1-A7-P1 0.3 12
SP1-A8-P1 0.2 12
0.00
0.25
0.50
0.75
1.00
1.25
1.50
1.75
0.0 1.0 2.0 3.0 4.0 5.0 6.0
Time (h1/2)
Δm
/s (
Kg
/m2)
SP1_A1_P2 SP1_A1_P3 SP1_A2_P1 SP1_A3_P1
SP1_A5_P1 SP1_A6_P1 SP1_A7_P1 SP1_A8_P1

LNEC- Procº0205/11/17684 Procº 0204/11/17692
25
Note: the additional codes “P1”, “P2” and “P3” in Table 10 indicate sub-samples
cut from each tile (Appendix D).
3.3.5- Moisture expansibility
The expansion of fired-clay materials is considered irreversible under natural
environmental conditions. It starts as soon as the ceramic materials are removed
from the kiln and occur throughout the years [23]. Ceramics moisture expansion
is considered a time-dependent phenomenon where ceramic materials become
more susceptible as they age. This phenomenon is believed to be largely
dependent on the proportion of amorphous or vitreous phases present in the
ceramic material [23].
The dilation resulting from water absorption is presented in Figure 7 and Table
11. In Appendix E the sub-samples used in the moisture expansibility tests are
presented. After 60 h, the dilation had not stabilized yet, keeping a slow
increasing pace. SP1-A2 showed the largest expansibility while SP1-A1 was the
least water-expansible. The expansibility of SP1-A6 could not be measured for
technical reasons.
0
0.1
0.2
0.3
0.4
0.5
0 10 20 30 40 50 60
Time (h)
Exp
ans.
ε (
mm
/m
SP1_A1 SP1_A2 SP1_A3 SP1_A8 SP1_A5 SP1_A7
Figure 7 - Samples water dilation with time

LNEC- Procº0205/11/17684 Procº 0204/11/17692
26
Table 11 – Readings and values of water expansibility at 48 h
Samples
l0
(mm)
L0
(mm)
Lf
(mm)
(Lf-Lo)
(mm)
ε
(mm/m)
SP1-A1-P5 75.66 2.486 2.496 0.01 0.13
SP1-A2-P3 82.86 2.836 2.871 0.035 0.42
SP1-A3-P3 83.10 2.215 2.232 0.017 0.21
SP1-A5-P3 84.12 2.328 2.35 0.022 0.26
SP1-A6-P3 69.59 nd nd nd nd
SP1-A7-P3 76.00 2.005 2.03 0.025 0.33
SP1-A8-P3 50.00 2.450 2.465 0.015 0.30
In Table 11, lo is the dry sample length; Lo the initial transducer reading, Lf the
final transducer reading and ε the moisture expansibility at 48 h.
3.3.6- Thermal expansibility
The thermal expansion of composite materials can be roughly considered as an
additive property of all the crystalline and glass phases present in the material
[24]. Azulejos being a layered material made up of a thin glaze layer, largely
vitreous, and a larger ceramic layer with a high proportion of crystalline phases,
their thermal expansibility bears the contribution of both layers with the ceramic
body in principal prevailing. The sub-samples used in the thermal expansibility
tests are presented in Appendix E and the results obtained shown in Figure 8
and Table 12.
Figure 8 - Thermal expansion curves of the sample tiles.
0.00
0.20
0.40
0.60
0.80
20 40 60 80 100 120 140
T(ºC)
DL
/L (
mm
/m)
SP1_A1 SP1_A2 SP1_A3
SP1_A5 SP1_A7 SP1_A8

LNEC- Procº0205/11/17684 Procº 0204/11/17692
27
Table 12 - Thermal expansibilities of the sample tiles.
Sample
Coeff.
thermal exp.
(ξ) ºC-1 R2
dL/L (mm/m)
(ΔT =25ºC)
SP1-A1-P5 7.9E-03 0.999 0.20
SP1-A2-P3 6.9E-03 0.992 0.17
SP1-A3-P3 6.6E-03 0.999 0.16
SP1-A5-P3 6.8E-03 0.992 0.17
SP1-A6-P3 nd nd nd
SP1-A7-P3 7.1E-03 0.994 0.18
SP1-A8-P3 6.9E-03 0.990 0.17
In Table 12, the coefficient of thermal expansion was found by linear regression
of the measurements and R2 is the correlation coefficient measuring the
goodness of fit. The last column indicates the expansion expected for an
increase of 25ºC in the temperature of that tile.
As can be seen, the thermal expansibilities are largely similar with a temperature
difference of about 25ºC resulting in a thermal expansion of 0.024 to 0.030 mm in
a 15cm square tile. Such expansions should, however, not be minimized since
they add to the moisture expansions and in a panel several meters across can
bring about large stresses, causing interference between the tiles with damage to
their glaze and ultimately resulting in potential detachment from the walls.

LNEC- Procº0205/11/17684 Procº 0204/11/17692
28
4- CONCLUSIONS
Several physical, chemical and mineralogical properties of a set of historical
azulejos ranging from the 17th to the early 19th centuries have been measured or
assessed. The results allowed a better understanding of the composition and
behaviour of the samples and are indicative of the properties of historical
Portuguese azulejos. The similarity of some of the results points to a similar use
of raw materials and/or production techniques indicating the possibility of a
common geographical origin (probably the Lisbon workshops). The results
obtained allowed a better understanding of the correlations between the physical-
chemical and mineralogical properties and the decay mechanisms and forms.
Characterization of a larger and more representative number of samples would
be necessary to encompass the particularities of the different provenances,
types, and decay patterns of historic Portuguese azulejos. This work is planned
to be done within a future research project and the results fed into a data base
called LNEC-AZUL which has started to be built with the results now obtained.
The database will have initially the form of an Excel file but can be easily
upgraded to an Access database format when justified by its size. The purpose
of the database is to consistently gather the analytical information obtained in
order to be able to use this information in future azulejos studies. The database is
organized by physical, chemical and mineralogical properties and it is hoped to
feed it with results already obtained on previous studies, as well as results
published by other researchers.

LNEC- Procº0205/11/17684 Procº 0204/11/17692
29
ACKNOWLEDGEMENTS
Solange Muralha contributed to the XRF analyses that were performed under her
supervision at Universidade Nova de Lisboa (UNL);
Susana Coentro of the Vicarte Institute of UNL helped with the quantification of
the XRF results;
Luis Nunes performed the open porosity, hydric and thermal expansion
measurements. João Junior did the MIP measurements;
Susana Couto performed the XRD and TGA-DTA measurements and analysis.
BIBLIOGRAPHIC REFERENCES
1 Sanjad, Thais A B C e Da Costa, Marcondes L, 2009, Azulejaria histórica em Belém do Pará:
Contribuição tecnológica para réplicas e restauro, Edição do autor, Belém: UFPA/SEDECT.
2 Antunes J L, 1992, Caracterização de azulejos do século XVII: Estudos para a sua consolidação,
Tese de Mestrado em Engenharia Química, Instituto Superior Técnico.
3 Coroado J and Gomes C, Physico-chemical characterization of ceramic glazed wall tiles dated of
the 17th century, from the "Convento de Cristo”, in Tomar, Portugal; Proceedings of the 7th
European Metting of Ancient Ceramics (EMAC’03). Trabalhos de Arqueologia 42, pp. 33 - 39.
4 Carvalho A P, Vaz M F, Samora M J and Pires J, Characterisation of ceramic pastes of
Portuguese ancient tiles, Materials Science Forum, 2006, Vol. 514-516, pp. 1648-1652.
5 Perera M, Lacerda-Aroso T, Gomes M J M, Mata A, Alves L C and Colomban P, Ancient
Portuguese ceramic wall tiles (“Azulejos”): Characterization of the glaze and ceramic pigments,
Journal of Nano Research, 2009, 8, pp. 79-88.
6 Coentro S X, Estudo da camada pictórica na azulejaria portuguesa do século XVII, Série Teses
de Mestrado TM 30, LNEC, Lisboa 2011.

LNEC- Procº0205/11/17684 Procº 0204/11/17692
30
7 Mimoso J-M, Santos Silva A, Abreu M, Costa D, Gonçalvez Diaz T and Coentro S, Decay of
historic azulejos in Portugal: an assessment of research needs, in Proc. Int.Sem.Conservation
of Glazed Ceramic Tiles- research and practice, LNEC, Lisbon, April 2009.
8 Mimoso, J-M., “Levantamento em obra de patologias em azulejos históricos- visitas realizadas
em 2009-2010”, LNEC Research Report 22/2010 DM, Lisbon, January 2011
9 Mimoso J-M, Pereira S R M, Santos Silva A, A research on manufacturing defects and decay by
glaze loss in historical Portuguese azulejos, LNEC Research Report 24/2010 DM, Lisbon,
January 2011.
10 Matthes W E, Vidrados Cerámicos: Fundamentos, Propriedades, Recetas, Métodos, Ediciones
Ómega, Barcelona.
11 Cultrone G, Rodrigues-Navarro C, Sebastian E, Cazalla O and de la Torre M J, Carbonate and
silicate phase reactions during ceramic firing, Eur. J. Mineral, 2001, 13, pp. 621-634.
12 Amorós J L, Orts M J, Mestre S Garcia-Ten J and Feliu C, Porous single-fired wall tile bodies:
Influence of quartz particle size on tile properties, Jour. Eur. Ceram. Soc., 2010, 30, pp. 17-28.
13 Coentro, S X, Mimoso, J-M and Silva, S S, Investigação da morfologia da interface
vidrado/chacota em azulejos históricos, Relatório LNEC 27/2010-NPC, 2010.
14 Nunes, Luis, 2005, Uncertainty of tests and measurements in a testing laboratory of natural
stones, LNEC, Relatório 313/05 NCMC, LNEC, 2005..
15 LERO PE-15, Ensaio de determinação da porometria por mercúrio, Manual de Procedimentos de
Ensaio, LNEC, 1996.
16 E 412, 1993, Materiais em pó. Determinação da superfície específica. Método de B.E.T,
Especificação LNEC.

LNEC- Procº0205/11/17684 Procº 0204/11/17692
31
17 LERO PE-10, Ensaio de determinação do coeficiente de dilatação por absorção de água, Manual
de Procedimentos de Ensaio, LNEC, 1996.
18 EN 14581, 2005, Natural stone test methods - Determination of linear thermal expansion
coefficient.
19 Musthafa A M, Janaki K and Velraj G, Microscopy, porosimetry and chemical analysis to
estimate the firing temperature of some archaeological pottery shreds from India, Microchemical
journal, 2010, 95, pp.311-314.
20 Perés-Rodrigues J L, Maqueda C, Justo A, Morillo E and Jimenez de Haro M C, Characterization
of decayed ceramic sculptures decorating the Pardon portico of Seville cathedral, Spain,
Applied Clay Sciences, 9, 1994, pp. 211-223.
21 Sanjad T A B C, Angélica R S, Oliveira M M and Costa W A M, Caracterização mineralogica de
azulejos de Salvador e Belém dos séculos XVI, XVII e XIX, R. Esc. Minas Ouro Preto, 2004, 57,
4, pp. 255-260.
22 Trindade M J, Dias M I, Coroado J and Rocha F, Mineralogical transformations of calcareous
rich clays with firing: a comparative study between calcite and dolomite rich clays from Algarve,
Portugal, Applied Clay Science, 2009, 42, pp. 345-335.
23 Segadães A M, Carvalho M A and Ferreira H C, Using phase diagrams to deal with moisture
expansion, Ceramics International, 2003, 29, pp. 947-954.
24 Strnad Z, Glass-Ceramic Materials: Glass Science and Technology 8, Elsevier, 1986, pp. 174-
175.


LNEC- Procº0205/11/17684 Procº 0204/11/17692
33
APPENDIX A – XRF SPECTRA AND REFERENCE SAMPLES USED FOR
AZULEJOS GLAZE AND BISCUIT ANALYSIS
Bellow are presented exemplificative spectra of the XRF results for the ceramic
biscuit (Figure 9) and glaze (Figure 10) respectively.
Figure 9 - XRF spectrum of SP1-A1 biscuit.
Figure 10 - XRF spectrum of SP1-A1 glaze.
0 5 10 15 20- keV -
0 5 10 15 20- keV -
1
10
102
103
Pulses
Al Si
Si K K
Ca
Ca
Fe Fe Pb Pb
0 5 10 15 20- keV -
1
10
102
103
104 Pulses
Mg Si Si K K
Ca
Ca
Ti
Ti
Fe Fe Co Co
Ni
Ni Sn
Sn
Pb Pb

LNEC- Procº0205/11/17684 Procº 0204/11/17692
34
The percent composition of the reference samples used for the XRF calibration is
presented in Table 13 together with the expected accuracy for the quantitative
elemental analyses.
Table 13 - Standards used for Glaze and biscuit quantification and indicative accuracy
measurements (%)
Red Brick Clay 679
(%)
Plastic Clay 98b (%)
CMOG C
(%)
UN LeadTin
(%)
Ceramics accuracy*
(%)
Glaze accuracy*
(%) Al2O3 20.8 27.02 0.87 2.58 70 23 BaO 0.0482 - 11.4 - 2 CaO 0.23 0.1 5.07 2.37 16 5 Cr2O3 0.0159 0.017 0.18 - 22 CuO - - 1.13 - 2 Fe2O3 12.94 1.69 0.34 0.02 46 7 K2O 2.93 3.38 2.84 2.67 8 5 Li2O 0.0152 0.046 - - MgO 1.25 0.59 2.76 - MnO - 0.015 - - 13 Na2O 0.18 0.2 1.07 3.22 P2O5 - - 0.14 - 0 PbO - - 36.7 44.3 9 Sb2O5 - - 0.03 - 0 SiO2 52.07 57.01 36.15 40.8 7 10 SnO2 - - 0.19 4.02 74 SrO 0.0086 0.022 0.29 - 2 33 TiO2 0.96 1.35 0.79 - 21 ZnO - - 0.05 - 6 OH 8.55 8.56 - - Total 100% 100% 100% 100% * (standard measured value – standard reference content)/standard reference content
LNEC- Procº0205/11/17684 Procº 0204/11/17692
35
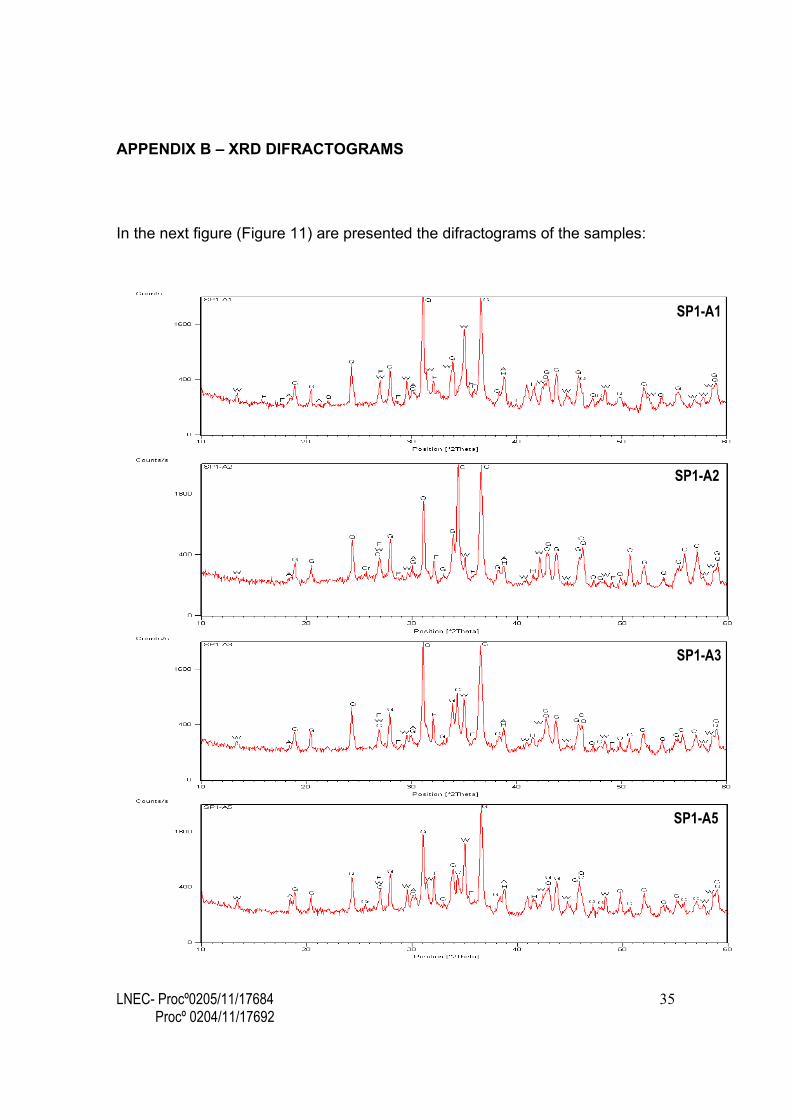
APPENDIX B – XRD DIFRACTOGRAMS
In the next figure (Figure 11) are presented the difractograms of the samples:
SP1-A1
SP1-A2
SP1-A3
SP1-A5

LNEC- Procº0205/11/17684 Procº 0204/11/17692
36
Figure 11 – Difractograms of the azulejos studied.
SP1-A6
SP1-A8
SP1-A7

LNEC- Procº0205/11/17684 Procº 0204/11/17692
37
APPENDIX C – TGA-DTA CURVES
Figure 12 - TGA and DTA curves of the analyzed samples.
SP1_A2
-18
-16
-14
-12
-10
-8
-6
-4
-2
0
Temperature (º C)
Mas
s va
riat
ion
(%
)
-20
-15
-10
-5
0
5
0 100 200 300 400 500 600 700 800 900 1000
En
talp
hy
(mic
roV
)
TGA DTA
SP1_A1
-18
-16
-14
-12
-10
-8
-6
-4
-2
0
Temperature (º C)
Mas
s va
riat
ion
(%
)
-20
-15
-10
-5
0
5
0 100 200 300 400 500 600 700 800 900 1000
En
talp
hy
(mic
roV
)
TGA DTA
SP1_A5
-18
-16
-14
-12
-10
-8
-6
-4
-2
0
Temperature (º C)
Mas
s va
riat
ion
(%
)
-20
-15
-10
-5
0
5
0 100 200 300 400 500 600 700 800 900 1000
En
talp
hy
(mic
roV
)
TGA DTA
SP1_A6
-18
-16
-14
-12
-10
-8
-6
-4
-2
0
Temperature (º C)
Mas
s va
riat
ion
(%
)
-20
-15
-10
-5
0
5
0 100 200 300 400 500 600 700 800 900 1000
En
talp
hy
(mic
roV
)
TGA DTA
SP1_A7
-18
-16
-14
-12
-10
-8
-6
-4
-2
0
Temperature (º C)
Mas
s va
riat
ion
(%
)
-20
-15
-10
-5
0
5
0 100 200 300 400 500 600 700 800 900 1000
En
talp
hy
(mic
roV
)
TGA DTA
SP1_A8
-18
-16
-14
-12
-10
-8
-6
-4
-2
0
Temperature (º C)
Mas
s va
riat
ion
(%
)
-20
-15
-10
-5
0
5
0 100 200 300 400 500 600 700 800 900 1000
En
talp
hy
(mic
roV
)
TGA DTA
SP1_A3
-18
-16
-14
-12
-10
-8
-6
-4
-2
0
Temperature (º C)
Mas
s va
riat
ion
(%
)
-20
-15
-10
-5
0
5
0 100 200 300 400 500 600 700 800 900 1000E
nta
lph
y (m
icro
V)
TGA DTA
LNEC- Procº0205/11/17684 Procº 0204/11/17692
38
APPENDIX D – SUB-SAMPLES USED FOR WATER IMBIBITIONS TESTS
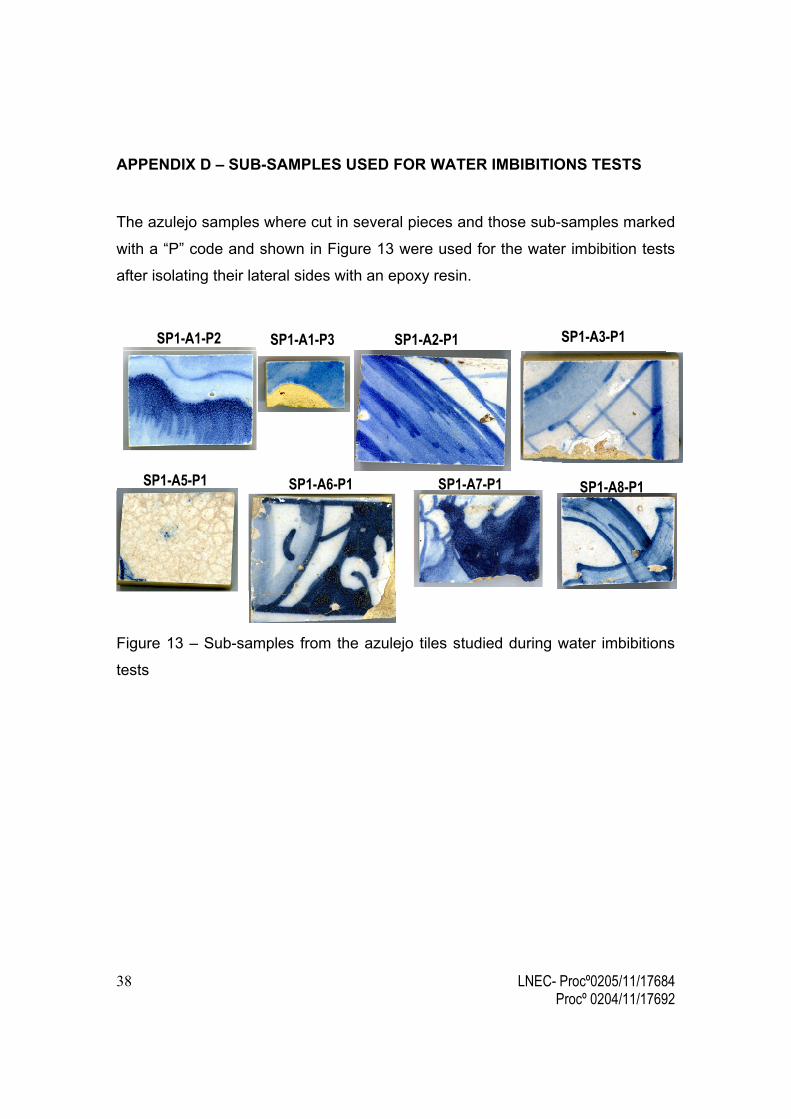
The azulejo samples where cut in several pieces and those sub-samples marked
with a “P” code and shown in Figure 13 were used for the water imbibition tests
after isolating their lateral sides with an epoxy resin.
Figure 13 – Sub-samples from the azulejo tiles studied during water imbibitions
tests
SP1-A1-P2 SP1-A1-P3 SP1-A2-P1 SP1-A3-P1
SP1-A5-P1 SP1-A6-P1 SP1-A7-P1 SP1-A8-P1

LNEC- Procº0205/11/17684 Procº 0204/11/17692
39
APPENDIX E – SUB-SAMPLES USED FOR THE MOISTURE DILATION AND
THERMAL EXPANSIBILITY TESTS
SP1-A1-P5 SP1-A2-P3 SP1-A3-P3 SP1-A5-P3
SP1-A6-P3 SP1-A8-P3 SP1-A8-P3
Figure 14 - Azulejo sub-samples used for the moisture and thermal expansion
tests.

Divisão de Divulgação Científica e Técnica - LNEC