Embed Size (px)
Citation preview

Physical activity patterns of ethnic children from low socio-economic environments within the UK Eyre ELJ Duncan MJ Birch S Cox V and Blackett M Revised pre-print deposited in CURVE September 2014 Original citation Eyre ELJ Duncan MJ Birch S Cox V and Blackett M (2014) Physical activity patterns of ethnic children from low socio-economic environments within the UK Journal of Sports Sciences httpdxdoiorg101080026404142014934706 Publisher Taylor and Francis Statement This is an Authors Original Manuscript of an article published by Taylor amp Francis Group in Journal of Sports Sciences on 772014 available online httpwwwtandfonlinecom DOI 101080026404142014934706rdquo Copyright copy and Moral Rights are retained by the author(s) and or other copyright owners This copy may differ from the published PDF A copy can be downloaded for personal non-commercial research or study without prior permission or charge This item cannot be reproduced or quoted extensively from without first obtaining permission in writing from the copyright holder(s) The content must not be changed in any way or sold commercially in any format or medium without the formal permission of the copyright holders
CURVE is the Institutional Repository for Coventry University
httpcurvecoventryacukopen
Environment and PA in low socio-economic children 1
Physical activity patterns of ethnic children from low socio-economic environments
within the UK
Manuscript type Original research
Abstract 199 Original Research
Submission Date 09092013
Resubmission date 13032014
Environment and PA in low socio-economic children 2
ABSTRACT Many children fail to meet physical activity (PA) guidelines for health
benefits PA behaviours are complex and depend on numerous interrelated factors The study aims to develop current understanding of how children from low Socio-economic environments within the UK use their surrounding built environments for PA by using advanced technology The environment was assessed in 96 school children (7 ndash 9 years) using GPS monitoring (Garmin Forerunner 305) In a subsample of 46 children the environment and physical activity was assessed using an integrated GPS and heart rate monitor The percentage of time spent indoor outdoor in green and non-green environments along with time spent in MVPA in indoor and outdoor environments were assessed A 2-by-2 repeated measures ANCOVA controlling for BMI BF assessed environmental differences The findings show that 42 of children from deprived wards of Coventry fail to meet PA guidelines of which 43 was accumulated during school Children engaged in more MVPA outdoor than indoor environments (p lt001) and a greater amount of time was spent in non-green environments (p lt001) Increased time outdoors was negatively associated with BF In conclusion outdoor environments are important for health enhancing PA and reducing fatness in deprived and ethnic children Keywords Deprivation South Asian Fatness Youth
Environment and PA in low socio-economic children 3
1 INTRODUCTION Large numbers of children are still obese and continue to have obesity related
complications causing a global health burden (WHO 2010) The benefits of engaging
in physical activity for weight management (Reichert Baptista Menezes Wells
Dumith amp Curi Hallal 2009) physiological and psychological health is well
acknowledged (Janssen amp LeBlanc 2010 WHO 2010) Children who engage in
more physical activity have less adiposity and improved cardiovascular risk profiles
(Andersen Riddoch Kriemler amp Hills 2011) However many children fail to meet
the recommended 60 minutes of health enhancing physical activity per day and even
fewer when ethnicity (eg South Asian is considered (Eyre amp Duncan 2013 Eyre
Duncan Smith amp Matyka 2013a Owens et al 2009)
The determinants of physical activity behaviour are complex and depend upon
a number of factors including socio-economic status and environmental influences
The built environment refers to all features that children encounter in their
neighbourhood (ie roads buildings recreational facilities) (Sallis amp Glanz 2006)
and these features are associated with inactiveunhealthy behaviours (Mota Santoa
Pereira Teixeira amp Santos 2011 Swinburn et al 2011 Zhu amp Lee 2009)
Understanding how aspects of the environment shape physical activity and obesity is
important because children spend a large proportion of their time in these
environments playing living and being educated
However a systematic review by Dunton Kaplan Wolch Jerrett amp Reynolds
(2009) reports there is no strong empirical evidence for most environmental factors
noting a lack of consistency in results and variances dependent upon population age
and socio-economic status For example the neighbourhood where an individual
resides is affected by socio-economic status (Fernandes amp Sturm 2010 Kimbro
Environment and PA in low socio-economic children 4
Brooks-Gunn amp McLanahans 2011) but the findings are equivocal In some studies
low socio-economic areas are associated with greater public open spaces increased
amenities (ie cycle paths and trees) (Crawford et al 2008) and increased
walkability thus increasing physical activity (De Meester van Dyck Bourdeaudhuiji
Deforche amp Cardon 2012 De Meester et al 2013 Kimbro et al 2011 Zhu amp Lee
2008) In others low socio-economic status are associated with reduced physical
activity (Bolte Tamburlini amp Kohlhuber 2010 Griew Page Thomas Hulsdon amp
Cooper 2010 Pabayo Belsky Gauvin amp Curtis 2011 Panter Jones van Sluijs amp
Griffin 2010 Spengler et al 2011) the causes of which may in part relate to poorer
access and provision of playground facilities
Secondly ethnicity is also a key socio-demographic variable that needs
considering Ethnicity appears to be associated with deprivation but the direction of
these effects are also conflicting (Conrad et al 2013 Franzini et al 2010) In non-
white neighbourhoods Franzini et al (2010) reported increased poverty increased
access to facilities for physical activity but low parental perceptions of these
environments (ie less safe comfortable and pleasurable for outdoor physical
activity) However Conrad et al (2013) suggests that children in low socio-economic
areas spend more time outdoors
The lack of consistency in the role of the environment on physical activity
patterns across studies may be due to methodological weaknesses and failure to
account for the combined influences relating to the population and socio-economic
status (Dunton et al 2009) Scarce previous research has explored socio-economic
status and ethnic differences in the physical activity of youth by objectively tracking
young peoplersquos movement patterns Using global positioning system monitoring
Environment and PA in low socio-economic children 5
allows the researcher a detailed insight into how youth from differing ethnic
backgrounds may utilise their surrounding built environment for physical activity
Furthermore the wealth of information comes from non-UK studies and so the
direct application in terms of built environments socio-economic status and ethnic
groups in the UK is limited In order to undertake such a study within the UK
geographical areas are needed that have high levels of deprivation and an ethnic mix
In the UK people from South Asian backgrounds have been described as living in the
most socio-economically disadvantaged areas (Jayaweera Hockely Redshaw amp
Quigley 2007 Williams Steptoe Chambers amp Kooner 2009) Coventry is ranked
52nd out of 326 local authority districts (1 being most deprived) In comparison to
England as whole the ethnic population of Coventry is increased (17 black and 6
Asian vs 26 and 12 Asian for England and Coventry respectively) with large
ethnic populations residing in the most deprived areas (Coventry City Council 2010)
In the two most deprived wards in Coventry (Foleshill and St Michaels) Asian and
Black people make up 34 - 58 of the total population In addition studies
objectively measuring physical activity in Coventry have found that 67 of all
children meet the current physical activity guidelines but this adherence is lowered in
South Asian children (35) (Eyre et al 2013a) Therefore the primary aim of this
study was to develop current understanding of how children from a low socio-
economic area within the UK use their surrounding built environments for physical
activity by using advanced technology (global positioning system) The secondary
aim was to consider how ethnicity might impact on the primary aim
2 METHOD An observational design was employed to collect information on 96 primary school
childrenrsquos (7 - 9 years white = 24 South Asian (Indian Pakistani Bangladeshi) = 60
Environment and PA in low socio-economic children 6
other = 12) physical activity patterns during winter (23rd Jan 2012 - 13th Feb 2012)
Data were collected from the two most deprived wards in Coventry with similar
socio-economic status UK (Coventry City Council 2010) Schools were recruited
using cluster sampling at ward level (two most deprived) Two schools (out of 5)
participated as they represented 50 (113 out of 225 children available) of the
primary school children aged 7 - 9 years within the geographical area The second
school within the two clusters were invited to participate Once schools had agreed to
participate children within those schools were asked to participate Study information
was presented to the school the children and their parents during an information
session A translator was present to communicate with parents whose first language
was not English Informed consent and assent was obtained from all children and
parents The protocol and procedures were reviewed and approved by Coventry
University Ethics Committee
21 Body Fatness
All measures were taken in light indoor clothing and bare feet Stature was measured
using a stadiometer (Leicester portable height measure UK) to the nearest 1mm
Body mass was measured to the nearest 01kg using weighing scales (Tanita Tokyo
Japan BF350) BMI was determined as kgm2 and 1990 British reference curves for
age-and-sex were used to identify overweight and obese children (Cole Freeman amp
Preece 1995 Cole amp Pan 1999) Overweight was defined as 85th centile and obesity
defined as 95th in accordance with epidemiological monitoring (Cole amp Pan 1999)
Waist circumference was measured using a non-stretchable tape midway between the
10th rib and the superior iliac crest Leg to leg bioelectrical impedance was also used
to determine the body fat of participants All measurements were conducted in the
Environment and PA in low socio-economic children 7
morning at least two hours following breakfast and with an empty bladder in light
sports clothing in accordance with the leg to leg protocol in Sung Lau Yu Lam amp
Nelson (2001) validation paper The stature and age of the child were input into the
leg to leg bioelectrical impedance analyser (Tanita Tokyo Japan BF350) This is a
reliable acceptable and validated method for assessing body fat in children (Sung
et al 2001 Tyrell et al 2001)
22 Measurement of the environment and PA
The measurement of location was determined using a global positioning system
device This was synchronised and wirelessly connected with a heart rate monitor to
measure PA (Garmin Forerunner 305 Garmin Ltd USA) sampled at 10 second
epochs Global positioning system monitoring is a reliable measure of physical
activity (Maddison et al 2010) with its feasibility in both British (Collins Al-
Nakeeb Nevill amp Lyons 2012) and international children reported (Duncan Badland
amp Schofield 2009 Fjortoft Kristoffersen amp Sageie 2009 Fjortoft Lofman amp
Thoren 2010)
23 Procedure
The global positioning system devices were fitted to a wrist of all consented children
at school on the initial wear day Due to limitations we were able to monitor heart
rate in a subsample of 46 only The heart rate monitor (Garmin Forerunner 305
Garmin Ltd USA) was fitted around the chest at the sternum and tightened
accordingly All participants wore the monitor for 4 consecutive days including two
weekend days (Friday Saturday Sunday Monday) from 900am to 900pm Any
participants that did not record four days monitoring data were omitted The reliability
of a 4 day and 10-hour monitoring period of physical activity in children is reported
Environment and PA in low socio-economic children 8
(Riddoch 2004 Penpraze et al 2006) Data were included in the analysis if there was
180 minutes of data for at least 1 day this is consistent with previous global
positioning system monitoring in British children (Collins et al 2012) At this stage
23 children failed to record 180 minutes global positioning system data This left a
final sample of 73 children (76 response rate) of which 9 were from other
backgrounds and so data will be presented on 64 children from White or South Asian
backgrounds From the children excluded from the final analysis 25 were
overweightobese This is consistent with overweight and obesity data from the
National Child Measurement programme for England and Coventry (NHS 2010) and
thus fatness is not deemed a bias in this physical activity study relating to lack of
compliance All the global positioning system units were given a cold start
(initialised) in a stationary outdoors environment as recommended by Duncan and
Mummery (2007) This took no longer than 1 minute (Maddison et al 2010)
Participants were instructed to remove the monitor for water based activity and
sleeping The battery on the global positioning system monitor operates a short life of
12 - hours and consequently the monitors needed to recharge at home during sleeping
periods Children and parents were shown how to charge the monitors and reminder
instructions were sent home
24 Global positioning system analysis
The data were downloaded from the monitor to the Garmin training centre and
Garmin connect (Garmin Ltd USA) where they were converted to the KML format
The KML file containing the data were manually cleaned for erroneous data points
mapped and analysed in ArcGIS 10 (ESRI CA USA) for time spent in different
environments These environments were classified into street green space house
Environment and PA in low socio-economic children 9
school (school field school playground school indoors) garden and indoor building
(any other indoor building) Calculations were made for time spent in indoor
environments which were classified as house other building or school building
Outdoor environments were classified together as green space and non-green space
Greenspace was defined as park public gardens children play areas outdoors sports
facilities (playing pitches sports grounds) woodlands nature reserves allotments
and linear green space in accordance with Coventry City Council (2010) and is
congruent with other studies (Jones Hillsdon amp Coombes 2009 Wheeler Cooper
Page amp Jago 2010) Non-green space was defined as buildings built land (car park
hard surface play areas) road and pavements This is consistent with prior definitions
of such environments (Coombes van Sluijs and Jones 2013) Average daily minutes
in each environment and the percentage of the total time spent (ie total minutes in
school total recorded time for all environments) in each environment were calculated
These calculations were made for weekdays weekends and all days and are consistent
with the calculations used in the Personal and Environmental Associations with
Childrenrsquos Health (PEACH) project (Wheeler et al 2010)
25 Heart rate and global positioning analysis
Heart rate and location (Garmin connect and Google earth) for time and day (Garmin
training) were manually cleaned and calculated in a subsample of children These data
were then used to calculate time spent in environments such as indoor outdoor as well
as percentage of the time spent in these environments that represented moderate and
vigorous physical activity The intensity of physical activity was assessed as 50 of
heart rate reserve (moderate) and 75 (vigorous) (Ridgers amp Stratton 2005) Resting
heart rate reserve was assessed as the average five lowest heart rates during the
Environment and PA in low socio-economic children 10
sampling period in accordance with Ridgers and Stratton (2005) This method
considers individual variation in resting heart rate and intensity thresholds between
children instead of using generic physical activity cut points such as lt120bpm
(inactive) 120ndash139bpm (low to moderate) 140ndash159bpm (moderate to vigorous) and
gt160bpm (vigorous) which have been used in previous studies (Collins et al 2012
Fjortoft Lofman et al 2010) The percentage of moderate to vigorous physical
activity time (time spent total time recorded)100) was then calculated for daily
(average of all days) week (average of weekdays) and weekend (average of
weekend) Total daily minutes in moderate to vigorous physical activity were also
assessed to determine whether children were meeting current physical activity
guidelines for health (60 minutes of moderate to vigorous physical activity daily)
(World Health Organisation 2010)
26 Statistical analysis
All analyses were conducted using SPSS version 20 The alpha level was set at p =
005 a priori Kolmogorov- Smirnov and Shapiro-Wilk tests were used to assess
normality of all variables Data were normally distributed (p gt005) and independent
t-tests were used to assess ethnic and gender differences in anthropometric variables
(BMI BMI SDS BMI centile and body fat ) reporting no significant differences (p
gt005) Following this Pearsons product moment correlationrsquos assessed the
associations between environmental conditions and fatness (BMI body fat ) A 2
(ie indoor weekday vs indoor weekend) by 2 (ie male and female) repeated
measures ANCOVA controlling for independent covariates (BMI body fat
separately) was used to assess any effects of day and sex on time spent in different
environments A 2 (ie White vs South Asian) by 2 (ie male and female)
Environment and PA in low socio-economic children 11
ANCOVA controlling for independent covariates (BMI body fat waist
circumference separately) assessed ethnic differences in time spent in different
environments On the subsample who also had their heart rate recorded (n = 46 South
Asian = 25 and White = 21) a paired t-test was used to assess differences in time spent
in moderate to vigorous physical activity between environmental conditions (ie
indoors vs outdoors) Independent t-tests were used to assess ethnic differences in
MVPA between environmental conditions 95 confidence intervals (CIs) and effect
sizes using cohens d were also calculated for ethnic and gender differences for
descriptive variables and time spent in environments and for estimated time spent in
moderate to vigorous physical activity in different environments
3 RESULTS The means and SDrsquos are displayed in Table 1 amp 2 The final sample included 70
normal weight children and 30 of overweightobese children (BMI = 17 plusmn 3 kgm2
body fat = 23) with an average global positioning system recording time of 388 plusmn
179 minutes No significant ethnic or gender differences were found for
anthropometric variables (Table 1)
3 1 Global positioning system and environmental data
311 Environment and adiposity
The results showed a significant positive relationship between the percentage of total
time spent in indoor environments on weekends with body fat (r = 039 p = 002)
and BMI-Age and sex percentile (r = 028 p lt005) Spending a greater percentage of
total time in outdoor environments was negatively associated with body fat (r = -
036 p = 002 Figure 1) The percentage of time spent in non-green space was
negatively associated with BMI (r = -026 p lt005)
Environment and PA in low socio-economic children 12
312 Day (weekday vs weekend) and sex effects on time spent in the environment
Results from repeated measures ANCOVA indicated a significant day by sex effect
for percentage of time in outdoor environments (p = 002) Females spent less time
engaged in outdoor environments on weekdays than weekends (32 plusmn 4 vs 54 plusmn 3
95 CI -23 -21 d = 622 controlled for BMI) When body fat was controlled
similar findings were observed A day by sex effect (p lt001) for percentage of time
spent in outdoor environments also revealed that females spent less time on weekdays
in outdoors than weekends (23 plusmn 4 vs 53 plusmn 8 95 CI -32 -28 d = 474)
Percentage of time spent in non-green space was also significantly lower on weekdays
(15 plusmn 7 vs 31 plusmn 6 95 CI -18 -14 d = 245 p = 001) In addition males spent
more time outdoors on weekdays than weekends (41 plusmn 5 vs 33 plusmn 44 95 CI -1
17 d = 026 p lt001)
313 Indoor vs outdoor environments
No sex differences were observed between engagement in time indoor to outdoor
environments for all days weekday or weekend day Children spent a significantly
greater percentage of time in outdoor environments than indoor for all days (mean
difference = 25 p = 001) and weekdays (mean difference = 34 p lt001)
controlling for BF (Table 2) These differences were not found when BMI was
considered or for weekend days
314 Green space vs non-green space
No significant sex differences were observed for green space compared to outdoors
for all days weekdays or weekend days Children spent a greater percentage of time
Environment and PA in low socio-economic children 13
in non green space compared to green space for all days (mean difference = 174 p
gt001) weekdays (mean difference = 21 p = 001) and weekend days (mean
difference =17 p gt001) adjusted for body fat (Table 2)
32 Global positioning system environment and activity intensity data
Heart rate data were also collected on a subsample 42 of children met the current
guideline of 60 minutes of moderate to vigorous physical activity Of this time 43
was achieved at school 23 from playing outside (streetgarden) 20 at home and
14 from active travel (walking one journey)
321 Percentage of time spent in MVPA in outdoor vs indoor environments
Children spent more daily (average week and weekend) time in moderate to vigorous
physical activity in outdoor than indoor environments (59 plusmn 45 vs 27 plusmn 27 95 CI
15 49 d = 086 p lt001) Time spent in moderate to vigorous physical activity in
outdoor environments was greater than indoor environments for both week (76 plusmn 24
vs 31 plusmn 29 95 CI 29 60 d = 169 p lt001) and weekend days (49 plusmn 35 vs
23 plusmn 30 95 CI 10 42 d = 080 p = 001) Figure 2)
323 Time spent in moderate to vigorous physical activity and fatness
There was no significant relationship found between BMI BMI centile body fat
and time spent in moderate to vigorous physical activity for outside inside on week
weekend or all days (p gt005)
33 Ethnic differences
Environment and PA in low socio-economic children 14
The results showed no significant ethnic differences in time spent indoors (week)
outdoor (week and weekend) greenspace (week and weekend) or in outdoors other
(week and weekend) p gt005 However South Asian children spent significantly
more time indoors on weekends when compared to White children (52 plusmn 5 vs 34 plusmn
7 95 CI of difference in time spent indoors in White vs South Asian 2 34 d =
296 p = 003) For moderate to vigorous physical activity no significant ethnic
differences were found for time spent in moderate to vigorous physical activity
(weekdays or weekends) or moderate to vigorous physical activity outside (p gt005)
Yet South Asian children achieved significantly less moderate to vigorous physical
activity indoors than White children (17 plusmn 6 vs 33 plusmn 46 95 CI for difference in
moderate to vigorous physical activity in White vs South Asian difference -1 -32
d = 049 p = 004)
4 DISCUSSION The major novel finding of the study is that health enhancing physical activity
adherence was very low in low socio-economic status groups with less than half of
children (42) meeting the 60 minute daily guideline Secondly children spent little
time engaged in green space for activity This might in part relate to environment and
socio-economic status challenges within deprived areas such as limited provision and
accessibility of green space in the area as well as high crime rates resulting in low
perception of safety Children thus spent greater time in non-green environments
closer to home than local green space environments South Asian children spent more
time indoors but less of this time in moderate to vigorous physical activity than White
children It is apparent that increasing time spent in outdoor environments was
important for health enhancing physical activity and reduced body fat
Environment and PA in low socio-economic children 15
41 Environment and fatness The results show that spending more time in indoor environments was associated with
greater fatness In addition spending more time outdoors and specifically in non-
green environments was associated with lower fatness However the associations
were weak and the cross sectional nature of the study limits the ability to infer cause
thus it is not known whether there was reverse causality also When moderate to
vigorous physical activity time in environmental conditions was considered no
relationship was evident with measures of fatness The lack of relationship between
moderate to vigorous physical activity in different environments and fatness could be
due to a number of reasons Firstly fatness differences exist between white and South
Asian children (Deurenberg Chew amp Deurenberg 2002 Nightingale Rudnicka
Owen Cook amp Whincup 2011 Saxena Ambler Cole amp Majeed 2004) and the
existing criteria for determining adiposity is validated in white populations providing
mean bias in ethnic populations (Haroun et al 2010) The lack of ethnic specific cut-
offs thus might make this challenging (Jebb Cole Doman Murgatroyd amp Prentice
2000 Frisard et al 2005 Sun et al 2003) The majority of the study sample was
South Asian which may limit associations In addition factors leading to obesity and
lsquoobesogenic environmentsrsquo are complex which might not have been captured during
this analysis Finally the measurement of activity came from heart rate which is the
response to activity energy expenditure might be more important In future studies
using global positioning system heart rate monitoring and accelerometry could
provide detailed information regarding physical behaviour and the built environment
42 Environmental differences
Environment and PA in low socio-economic children 16
The findings show that females spent more time in outdoor environments on
weekends than weekdays which was attributed to increased time in non-green
environments For males there were no differences in time spent in outdoor
environments even though males spent less time in non-green space on weekend days
than weekdays Given that the children have the same exposure to non-green space at
school the sex differences observed appears to relate to engagement with the
environment outside of school hours The social cultural and environmental
influences might explain some of these differences In a qualitative study conducted
on the same children as the present study parental constraints weather religious
practice and safety were identified as the main barriers for physical activity
engagement with the environment (Eyre Duncan Birch amp Cox 2013b) The notion
that young children are not autonomous in their decision making and so parental
constraints limit their activity behaviour are supported by prior research (Brockman
Jago amp Fox 2011 Veitch Salmon amp Ball 2010) However these constraints might
be experienced differently amongst sexes Previous research suggests males had
greater independent mobility than females and that increased independent mobility is
associated with increased play physical activity and active commuting in children
(Page Cooper Griew amp Jago 2010) Another large study using global positioning
system monitoring and accelerometer was able to explore this is more depth and
found that males were more likely to roam outside of neighbourhoods whereas
females used the garden and street spaces for physical activity (Jones et al 2009b) In
winter months the hours of sunlight are reduced which may limit time available for
physical activity in females for whom parents might exert more constraints due to
safety concerns This is supported by Pabayo et al (2011) who found increased
moderate to vigorous physical activity with greater deprivation in males when
Environment and PA in low socio-economic children 17
measured objectively but that greater deprivation in females was associated with
lower moderate to vigorous physical activity
In addition cultural factors may inhibit time spent in environments and also
affect parental constraints A large proportion of the sample was made up of South
Asian children and parental restrictions on activities might be experienced differently
for South Asian females and males Moreover socio-economic and environmental
issues must be considered For both males and females a large proportion of their
outdoors physical activity is made up of non-green which suggests that children spent
most of their time in street This agrees with prior research on this topic (Wheeler et
al 2010) and highlights the importance of understanding non-green space activity It
is not known whether living in a deprived area might affect parentrsquos safety concerns
and result in the children playing closer to home (ie street) instead of green space
The consensus data for these two Coventry wards suggest that 33 and 41 of the
community perceive their neighbourhood as unsafe at night (Coventry City Council
2010) Secondly the green space provision in these wards is described as deficient
across all areas (ie park green space outdoor sport pitches provision for young
children and allotments) (Coventry City Council 2008) In addition the wards have
the highest population density (568 per hectare and 518 per hectare vs mean 398 per
hectare) resulting in high numbers of flats in blocks flatsapartments shared
dwellings and the lowest percentage of owned houses (Coventry City Council 2011)
The availability of recreational space or public open spaces (eg park playgrounds
playing fields or courts) and proximity to these sites is also associated with increased
activity (Chomitz Aske McDonald Cabral amp Hacker 2011 Grow Saelens Durant
Norman amp Sallis 2008 Loureiro Matos Santos Mota amp Diniz 2010 Nielsen
Taylor Williams amp Mann 2010 Timperio et al 2008 Vietch et al 2010)
Environment and PA in low socio-economic children 18
Therefore it is clear that both provision and accessibility of green space is low
and safety concern high within the environments examined in the present study These
are likely to be a main cause of increased engagement in non-green environments
(which from observation were close to home) in the autumn for physical activity It is
also apparent that outdoors physical activity is important for health enhancing
physical activity but that environmental and socio-economic factors are key
determinants of behaviour Future research needs to assess how patterns of behaviour
are affected by hours of sunlight (ie changes in greenery with seasons) In addition
understanding the proximity in which children play from the home with seasonality
environment and socio-economic status may enhance understanding
The results of the current study indicate that less than half of the children from
low socio-economic status and ethnic backgrounds meet the current physical activity
guidelines Low levels of adherence to physical activity in South Asian children are
already described previously (Eyre amp Duncan 2013 Eyre et al 2012a Owens et al
2009) However in this current study the adherence is lower this could be due to the
specific socio-economic groups assessed ie the two most deprived wards and
monitoring by heart rate not accelerometry Secondly of this time spent in moderate
to vigorous to physical activity physical activity in school contributed to nearly half
of this (43) followed by playing outside (23 in streetgarden) home (20) and
from active travel (14 walking one journey) Previous literature has highlighted the
significant positive impact that school (Ridgers Timperio Crawford amp Salmon
2011 Fairclough Beighle Erwin amp Ridgers 2012 Stratton amp Mullen 2005)
spending time in outdoors environments (Dunton Ligo Instule Wolch amp Pentz
2011 Perry Saelens amp Thompson 2011 Cleland et al 2008 Jones et al 2009a
McCurdy Winterbottom Mehta amp Roberts 2010 ) and active commuting (Lubans
Environment and PA in low socio-economic children 19
Boreham Kelly amp Foster 2011 Lee Orenstein amp Richardson 2008) has on daily
moderate to vigorous to physical activity levels Therefore it is clear that physical
activity policies focused on school and active commuting are important for increasing
physical activity in children from deprived and ethnic environments
The present findings also suggest that these children were most active
spending more time in health enhancing physical activity in outdoor environments
irrespective of week or weekend days Previous research is supportive of these
findings (Dunton et al 2011 Perry et al 2011 Cleland et al 2008 McCurdy et al
2010) with some research yielding a positive relationship between and time spent in
moderate to vigorous to physical activity in outdoors environments (Jones et al
2009b Cooper et al 2010) However when examining the association between the
variables in this present study no significant relationship (not presented) was found
for moderate to vigorous to physical activity and time spent outdoors This might be
due to population differences (ethnicity and low socio-economic status) between the
present study and previous studies (Jones et al 2009b Cooper et al 2010) or due to
a smaller subsample of heart rate analysis undertaken in the present study
For indoor time time spent in moderate to vigorous to physical activity was
increased during weekdays which may be attributable to physical education lessons
conducted in the school hall during autumn and media engagement indoors at home
on weekends moderated by weather constraints (Eyre et al 2013b) In addition the
children in this study spent a significantly greater percentage of time on weekdays in
outdoor environments This is surprising and is likely to reflect an under
representation of indoor time spent at school due to spatial error (Elgethun Fenske
Yost amp Palcisko 2003) unworn monitors when inactive at home and is supportive of
the lower contribution of school recording time Secondly ethnic differences were
Environment and PA in low socio-economic children 20
found with South Asian children spending more time indoors on weekends than
White but when indoors South Asian children engaged in less moderate to vigorous
to physical activity than White children This is the first study to explore ethnic
differences using global positioning system and suggests that low physical activity
previously described (Eyre et al 2013a Owens et al 2009) in South Asian children
may in part relate to cultural differences (indoors activity) and socio-demographic
factors (ie deprivation)
Previous studies have found that children are more active on weekdays
(Duncan Schofield amp Duncan 2006 Duncan Al-Nakeeb Woodfield amp Lyons 2007
McGall McGuigan amp Nottle 2011 Oliver Schofield amp Kilt 2007 Owens et al
2009 Riddoch Mattocks et al 2007) Research suggests that highly active children
spend more time in physical activity before school during class lunch and after
school (Rowlands Pilgrim amp Eston 2008) However it is not apparent what the
school to after-school contribution plays on these patterns Other research suggests
that greater physical activity engagement occurs school time (Fairclough et al 2012
Ridgers Timperio et al 2011) because school provides specific physical activity
opportunities within the school day (physical education recess) contributing to
overall physical activity (Stratton amp Mullen 2005) However other research suggests
that children are most active after school and that it is the differences in after school
activity accounts for differences in overweightobese vs normal children and inactive
vs active children (Deforche et al 2009 Riddoch Mattocks et al 2007 Olds
Maher amp Ridley 2011) Eyre et al (2013a) is the only study to consider within day
patterns of PA in SA children The study concluded that South Asian children are less
active because they engage in less activity and expend less energy after school than
Environment and PA in low socio-economic children 21
White children Further research needs to clarify these differences to better focus
future interventions
This study shows the feasibility of global positioning monitors and heart rate
monitoring in young children from low SES and ethnic groups to explore differences
in their engagement with environmental features This study also used a protocol
requiring participants to wear the heart rate and global positioning system monitors
throughout 4 whole days unlike other work where smaller windows of wear time have
been presented (Collins et al 2012) Adherence to the monitoring period is also good
indicated by high response rate and an average monitoring compliance time of 65
hours (ranging to 95 hours) For a weekday on average 63 of this time was worn
for free living and 37 at school thus confirming that weekday contributions were in
both school and out of school environments However it is acknowledged that there
could be some inflation in the findings between outdoors vs indoors due to increased
spatial error indoors (Elgethun et al 2003) The current sample size although small
is consistent with other published studies utilising global positioning systems to assess
young peoplersquos physical activity (Duncan Badland et al 2009 Fjortoft Kristoffersen
et al 2009 Fjortoft Lofman et al 2010 Maddison et al 2010 Collins et al 2012)
It is acknowledged that in future studies a larger sample size would enable more
sophisticated statistical analyses in future research This would also enable subgroups
analysis of South Asian children in order to account for heterogeneity in the ethnic
sample and to establish if the limited ethnic findings relate to grouped effect
CONCLUSION
Outdoor non-green environments are important for health enhancing physical activity
in children from low socio-economic status and ethnic groups but complex and
Environment and PA in low socio-economic children 22
interrelated factors environmental and socio-economic status challenges within the
neighbourhood limit engagement in physical activity Interventions aimed at
increasing physical activity in these environments may need to consider a holistic
social environment and cultural approach to challenging both the physical
environment and perceptions associated with the environment for ethnic groups A
school based approach to increasing physical activity in people from ethnic low
socio-economic status and living within challenging environments may be beneficial
for policy makers
REFERENCES
Environment and PA in low socio-economic children 23
Andersen L Riddoch C Kriemler S Hills A (2011) Physical activity and cardiovascular risk factors in children British Journal of Sports Medicine 45 1063
Bolte G Tamburlini G Kohlhuber M (2010) Environmental inequalities among children in Europe- evaluation of scientific evidence and policy implications European Journal of Public Health 20 14-20
Brockman R Jago R Fox KR (2011) Childrenrsquos active play self-reported motivators barriers and facilitators BMC Public Health 10 461
Chomitz VR Aske DB McDonald J Cabral H Hacker KA (2011) The role of recreational spaces in meeting physical activity recommendation among middle school students Journal of Physical Activity and Health 8 S8-S16
Cleland V Crawford D Baur LA Hume C Timperio A Salmon J (2008) A prospective examination of childrenrsquos time spent outdoor objectively measured physical activity and overweight International Journal of Obesity 32 1685-93
Cole TJ Freeman JV Preece MA (1995) Body mass index reference curves for the UK 1990 Archives Disease Childhood 73 25-29
Cole TJ Pan H (1999) LMS Growth An Excel Add-in to convert measurements to Z-Scores Centre for Epidemiology and Biostatistics [Internet] CDC Retrieved from httpwwwhealthforallchildrencouk
Collins P Al-Nakeeb Y Nevill A Lyons M (2012) The impact of the built environment on young peoplersquos physical activity patterns A suburban-rural comparison using GPS International Journal Environmental Research and Public Health 9 3030-3050
Conrad A Seiwert M Huumlnken A Quarcoo D Schlaud M Groneberg D (2013) The German Environmental Survey for Children (GerES IV) Reference values and distributions for time-location patterns of German children International Journal of Hygiene and Environmental Health 216 25-34
Coombes E van Sluijs E Jones A (2013) Is environmental setting associated with the intensity and duration of childrenrsquos physical activity Findings from the SPEEDY GPS study Health and Place 20 62-65
Cooper AR Page AS Wheeler BW Hillsdon M Griew P Jago R (2010) Patterns of GPS measured time outdoors after school and objective physical activity in English children the PEACH Project International Journal of Behavioural Nutrition and Physical Activity 7(31) doi 1011861479-5868
Coventry City Council (2008) [Internet] Green space strategy 2008- 2018 Planning and regeneration Retrieved from httpwwwcoventrygovukdownloadsdownload370green_space_strategy
Coventry City Council (2011) [Internet] Area Profile for people and place census 2011 Coventry City Council (2010) [Internet] Facts about Coventry Corporate research team Retrieved from httpwwwfacts-about-coventrycomtextonlyphp
Corporate research team (2008) Retrieved from httpwwwfacts-about-coventrycomtextonlyphp
Crawford D Timperio A Giles-Corti B Ball K Hume C Roberts R (2008) Andrianopoulos N Salmon J Do features of public open spaces vary according to GIS to neighbourhood socio-economic status Health and Place 14 889-93
Deforche B De Bourdeaudhuil I Drsquohondt E Cardon G (2009) Objectively measured physical activity physical activity related personaluty and body mass index in 6-to 10- year old children a cross sectiional study International Journal of Behavioural Nutrition and Physical Activity 6 25 doi 1011861479-5868-6-25
Environment and PA in low socio-economic children 24
De Meester F Van Dyck D Boudeaudhuij I Deforche B Sallis JF Cardon G (2012) Active living neighbourhoods is neighbourhood walkability a key element for Belgian adolescents BMC Public Health 4 7
De Meester F Van Dyck D De Bourdeaudhuij I Deforche B Cardon G (2013) Do psychosocial factors moderate the association between neighbourhood walkability and adolescentsrsquo physical activity Social Science and Medicine 811-9
Deurenberg-Yap M Chew SK Deurenberg P (2002) Elevated body fat percentage and cardiovascular risks at low body mass index levelrsquos among singaporean chinese malaysians and indians Obesity Reviews 3 209-15
Duncan MJ Al-Nakeeb Y Woodfield L Lyons M (2007) Pedometer determined physical activity levels in primary school children from central England Preventive Medicine 44(5) 416-420
Duncan JS Badland HM Schofield G (2009) Combining GPS with heart rate monitoring to measure physical activity in children A feasibility study Journal of Science and Medicine in Sport 12 583ndash585
Duncan JS Schofield G Duncan EK (2006) Pedometer- Determined Physical Activity and Body Composition in New Zealand Children Medicine and Science in Sports and Exercise 38 1402- 1409
Duncan MJ Mummery WK (2007) GIS or GPS A comparison of two methods for assessing route taken during active transport American Journal of Preventive Medicine 33 51ndash53
Dunton GF Kaplan J Wolch J Jerrett M Reynolds KD (2009) Physical environmental correlates of childhood obesity a systematic review Obesity Reviews 10 393-402
Dunton GF LiaoY Intule S Wolch J Pentz MA (2011) Physical electronic survey and social contextual influences on childrenrsquos leisure- time physical activity an ecological momentary assessments study Journal of Physical Activity and Health 8 S103-8
Elegethun K Fenske RA Yost MG Palcisko GJ (2003) Time-location analysis for exposure assessment studies of children using a novel global positioning system instrument Environmental Health Perspective 111 115-22
Eyre ELJ Duncan MJ (2013) The impact of ethnicity on objectively measured physical activity in children ISRN Obesity 1-15 doi 757431
Eyre ELJ Duncan MJ Smith E Matyka KA (2013a) Objectively measured patterns of physical activity in primary school children in Coventry the influence of ethnicity Diabetic Medicine 30939-45
Eyre ELJ Duncan MJ Birch SL Cox V (2013b) Environmental and school influences on physical activity in South Asian children from low socio-economic backgrounds A qualitative study Journal of Child Health Care 21 doi 136749513508845
Fairclough SJ Beighle A Erwin H Ridgers ND (2012) School day segmented physical activity patterns in high and low active children BMC Public Health 12 406
Fernandes M Sturm R (2010) Facility provision in elementary school correlates with physical education recess and obesity Preventive Medicine 50 s30-5
Fjortoft I Kristoffersen B Sageie J (2009) Children in schoolyards Tracking movement patterns and physical activity in schoolyards using global positioning system and heart rate monitoring Land Use and Urban Planning 2210ndash217
Fjortoft I Lofman O Thoren KH (2010) Schoolyard physical activity in 14-year-old adolescents assessed by mobile GPS and heart rate monitoring analysed by GIS Scandinavian Journal of Public Health 38 28ndash38
Environment and PA in low socio-economic children 25
Franzini L Taylor W Elliot MN Cuccaro P Tortolero SR Gilliland JM Grunbaum J Schuster MA (2010) Neighbourhood characteristics favourable to outdoor physical activity disparities by socioeconomic and racialethnic composition Health place 16 267-74
Frisard MI Greenway FL Delany JP (2005) Comparison of methods to assess body composition changes during a period of weight loss Obesity Research13845ndash854
Griew P Page A Thomas S Hulsdon M Cooper AR (2010) The school effect on childrenrsquos school time physical activity the Peach project Preventive Medicine 51 282-6
Grow HM Saelens BE Durant NH Norman GJ Sallis JF (2008) Where are youth active Roles of proximity active transport and built environment Medicine and Science in Sports and Exercise 40 2071-9
Haroun D Taylor SJ Viner RM Hayward RS Darch TS Eaton S Cole TJ Wells JC (2010) Validation of biolelectrical impedance analysis in adolescents across different ethnic groups Obesity 18 1252- 1259
Jackson M Crawford D Campbell K Salmon J (2008) Are parental concerns about childrenrsquos inactivity warranted and are they associated with a supportive home environment Research Quarterly Exercise and Sport 79(3) 274-82
Janssen I LeBlanc AG (2010) Systematic review of the health benefits of physical activity and fitness in school-aged children and youth International Journal of Behavioural Nutrition and Physical Activity 7 1ndash40
Jayaweera H Hockley CA Redshaw ME Quigley MA (2007) Demographic and socio-economic characteristics of ethnic minority mothers in England The millennium cohort study Centre for longitudinal studies [Internet] Available from www CLSioeacuk (accessed on 13th Feb 2013)
Jebb SA Cole TJ Doman D Murgatroyd PR Prentice AM (2000) Evaluation of the novel Tanita body-fat analyser to measure body composition by comparison with a four-compartment model British Journal of Nutrition 83 115-123
Jones AP Coombes EG Griffin SJ van Sluijs EMF (2009a) Environmental supportiveness for physical activity in English schoolchildren A study using Global Positioning Systems International Journal of Behavioural Nutrition and Physical Activity 6 1ndash42
Jones A Hillsdon M Coombes E (2009b) Greenspace access use and physical activity understanding the effects of area deprivation Preventive Medicine 49(6) 500-505
Kimbro RT Brooks-Gunn J McLanahans S (2011) Young children in urban areas links among neighbourhood characteristics Weight status outdoor play and television watching Social Science and Medicine 72 668-76
Lee MC Orenstein MR Richardson MJ (2008) Systematic review of active commuting to school and childrenrsquos physical activity and weight Journal of Physical Activity Health 5(6) 930-49
Loureiro N Matos MG Santos MM Mota J Diniz JA (2010) Neighbourhood and physical activities of Portuguese adolescents International Journal of Behavioural Nutrition and Physical Activity 5(7) 33
Lubans D Boreham CA Kelly P Foster CE (2011) The relationship between active travel to school and health-related fitness in children and adolescents a systematic review International Journal of Behavioural Nutrition and Physical Activity 8 5 doi 1011861479-5868-8-5
Maddison R Jiang Y Hoorn SV Exeter D Mhurchu CN Dorey E (2010) Describing patterns of physical activity in adolescents using global positioning systems and accelerometry Pediatric Exercise Science 22 392ndash407
Environment and PA in low socio-economic children 26
McAlexander KM Mama SK Medina AV OrsquoConnor DP Lee RE (2012) Concordance and correlates of direct and indirect built environment measurement among minority Journal of Health Promotion 26 (4)
McCurdy LE Winterbottom KE Mehta SS Roberts JR (2010) Using Nature and Outdoor Activity to Improve Childrenlsquos Health Current Problems in Pediatric and Adolescent Health Care 5102-117
McGall SE McGuigan MR Nottle C (2011) Contribution of free play towards physical activity guidelines for New Zealand primary school children aged 7-9 years British Journal of Sports Medicine 45 120- 124
Mota J Santos R Pereira M Teixeira L Santos MP (2011) Perceived neighbourhood environmental characteristics and physical activity according to socioeconomic status in adolescent girls Annuals Human Biology 38 1ndash6
NHS Information Centre National Child Measurement Programme England 20092010 Department of Health [Internet] Available from wwwicnhsuk 2010 (accessed on 12 Feb 2013)
Nightingale CM Rudnicka AR Owen CG Cook DG Whincup PH (2011) Patterns of body size and adipsity in UK children of South Asian Black African-Caribbean and white european origin Child heart and health study in England (CHASE study) International Journal of Epidemiology 40 33- 44
Nielsen G Taylor R Williams S Mann J (2010) Permanent play facilities in school playgrounds as a determinant of childrenrsquos activity Journal of Physical Activity and Health 7 490-6
Olds T Maher CA Ridley K (2011) The place of physical activity in the time budgets of 10 -13 year old Australian Children Journal of Physical Activity and Health 8 584-57
Oliver M Schofield GM Kilt GS (2007) Physical activity in pre schoolers understanding prevalence and measurement issues Journal of Sports Medicine 32 1045-70
Owens CG Nightingale CM Rudnicka AR Cook DG Ekelund U Whincup PH (2009) Ethnic and gender differences in physical activity levels among 9-10 year old children of white European south asian and african caribbean origin The child heart health study in england (CHASE) International Journal of Epidemiology 18 1082-1093
Pabayo R Belsky J Gauvin L Curtis S (2011) Do area characteristics predict change in moderate ndashto-vigorous physical activity from ages 11 to 15 years Social Science and Medicine 72 430
Page AS Cooper AR Griew P Jago R (2010) Independent mobility perceptions of the built environment and childrenrsquos participation in play active travel and structured exercise and sport The PEACH project International Journal of Behavioural Nutrition and Physical Activity 19 17
Panter JR Jones AP van Sluijs EM Griffin SJ (2010) Neighbourhood route and school environments and childrenrsquos active commuting American Journal of Preventive Medicine 38 268-78
Penpraze V Reilly J MacLean CM Montgomery C Kelly L Paton JY Aitchison T Grant S (2006) Monitoring of physical activity in young children Pediatric Exercise Science 18 483ndash492
Perry CK Saelens BE Thompson B (2011) Rural Latino youth park use characteristics park amenities and physical activity Journal of Community Health 36 389- 97
Environment and PA in low socio-economic children 27
Reichert EF Baptista Menezes AM Wells JC Dumith CD Curi Hallal P (2009) Physical activity as a predictor of adolescent body fatness A systematic review Sports Medicine 39 279-94
Reilly JJ (2006) Diagnostic accuracy of the BMI for age in paediatrics International Journal of Obesity 30 595ndash597
Riddoch CJ Andersen LB Wedderkopp B Harro M Klasson-Heggerbo L Cooper AR Ekelund U (2004) Physical activity levels and patterns of 9-and 15-yr-old European children Medicine and Science in Sport and Exercise 36 86-92
Riddoch CJ Mattocks C Deere K Saunders J Kirkby J Tilling K Leary SD Blair SN Ness AR (2007) Objective measurement of levels and patterns of physical activity Archives of Disease in Childhood 92 963-969
Ridgers ND Stratton G (2005) Physical activity during school recess the Liverpool sporting playgrounds project Pediatric Exercise Science 17 281
Ridgers ND Timperio A Crawford D Salmon J (2011) Five year changes in school recess and lunchtime and the contirbution to childrenrsquos daily physical activity British Journal of Sports Medicine 45 120-124
Rowlands AV Pilgrim EL Eston RG (2008) Patterns of habitual activity across weekdays and weekend days in 9-11 year-old-children Preventive Medicine 46 317-324
Sallis JF Glanz K (2006)The role of built environments in physical activity eating and obesity in childhood The Future of Children16 89-108
Saxena S Ambler G Cole TJ Majeed A (2004) Ethnic group differences in overweight and obese children and young people in England cross sectional survey Archives of Disease in Childhood 89 30 -36
Spengler JO Floyd MF Maddock JE Gobster PH Suau LJ Norman GJ (2011) Correlates of park-based physical activity among children in diverse communities results from an observational study in two cities American Journal of Health Promotion 25 1-9
Stratton G Mullan E (2005) The effect of multicolour playground markings on childrenrsquos physical activity level during recess Preventive Medicine 41 828 ndash 833
Sun SS Chumlea WC Heymsfield SB Lukasi HC Schoeller D Friedl K et al (2003) Development of bioelectrical impedance analysis prediction equations for body composition with the use of a multicomponent model for use in epidemiologic surveys American Journal of Clinical Nutrition 77331ndash340
Sung RY Lau P Yu CW Lam PK Nelson EA (2001) Measurement of body fat using leg to leg impedance Archives of Disease in Childhood 263-267
Swinburn BA Sacks G Hall KD McPherson K Finegood DT Moodie ML Gortmaker SL (2011) The global obesity pandemic Shaped by global drivers and local environments Lancet 378 804ndash814
Timperio A Giles-Corti B Crawford D Andrianopoulos N Ball K Salmon J Hume C (2008) Features of public open spaces and physical activity among children findings from the CLAN study Preventive Medicine 47 514-8
Tyrrell VJ Richards G Hofman P Gillies GF Robinson E Cutfield WS (2001) Foot-to-foot bioelectrical impedance analysis a valueable tool for measurement of body composition in children International Journal of Obesity Related Metabolic Disorder 25 273-8
Veitch J Salmon J Ball K (2010) Individual social and physical environmental correlates of childrenrsquos active free-play a cross sectional study International Journal of Behavioural Nutrition and Physical Activity 2 7-11
Environment and PA in low socio-economic children 28
Wheeler BW Cooper AR Page AS Jago R (2010) Greenspace and childrenrsquos physical activity A GPSGIS analysis of the PEACH project Preventive Medicine 51 2010 148-152
Williams ED Steptoe A Chambers JC Kooner JS (2009) Psychosocial risk factors for coronary heart disease in the United Kingdom South Asian men and women Journal of Epidemiology and Community Health 63 986-991
Williams AJ Wyatt KM Hurst AJ Williams CA (2012) A systematic review of associations between primary school built environment and childhood overweight and obesity Health and Place 18 504-14
WHO (2010)[Internet] Global recommendation on physical activity for health Retrieved from httpwhqlibdocwhointpublications20109789241599979_engpdf 2010
Zhu X Lee C (2008) Walkability and safety around elementary school Economic and ethnic disparities American Journal of Preventive Medicine 34 282ndash290
Environment and PA in low socio-economic children 29
TABLE 1 here Table 1 descriptive variable by sex and ethnicity
All Males Females p South Asian d White p d n = 64 n = 30 n = 34 (95 CI) n = 46 n = 18 (95 CI)
Height (cm) 130 plusmn 7 130 plusmn 8 131 plusmn 7 060 (-3 4) 130 plusmn 7 013 133 plusmn 8 021 (-7 2) 041 weight (kg) 31 plusmn 9 31 plusmn 10 30 plusmn 7 053 (-3 6) 29 plusmn 8 000 33 plusmn 11 040 (-7 3) 045
BMI (kgm2) 17 plusmn 3 18 plusmn 4 17 plusmn 3 065 (-1 2) 17 plusmn 3 029 19 plusmn 4 062 (-3 2) 061 BMI centile 60 plusmn 31 61 plusmn 33 59 plusmn 30 068 (-12 18) 57 plusmn 31 006 70 plusmn 31 055 (-24 13) 042 Body Fat 23 plusmn 9 22 plusmn 10 22 plusmn 9 073 (-6 4) 22 plusmn 9 000 23 plusmn 9 073 (-11 1) 011
Waist Circumference (cm) 57 plusmn 25 57 plusmn 29 57 plusmn 21 023 (-3 12) 57 plusmn 24 000 57 plusmn 21 067 (-14 1) 000 Waist circumference centile 57 plusmn 43 46 plusmn 46 65 plusmn 37 070 (-24 16) 57 plusmn 42 046 52 plusmn 45 035 (-32 12) 012
Mean plusmn SD Table 2 The percentage of time spent in environments Indoor Outdoor d Green space Non green space d
of total time spent All days 20 plusmn 2 (25 34) 45 plusmn 4 (38 52) 822 13 plusmn 1 (10 16) 30 plusmn 2 (26 35) 1075 Weekdays 18 plusmn 4 (10 26) 52 plusmn 5 (42 63) 751 15 plusmn 2 (11 18) 36 plusmn 4 (29 43) 664 Weekend 47 plusmn 3 (39 54) 54 plusmn 3 (45 61) 233 16 plusmn 2 (11 21) 33 plusmn 3 (27 39) 667 Mean plusmn SE (CI) gtindoors (Plt001) gtgreen space (Plt001)
Environment and PA in low socio-economic children 30
FIGURE 1 HERE
Figure 1 Relationship between time spent outdoors on weekends with body fat ()
r = -036 p = 002
FIGURE 2 HERE
(See attached file) Figure 2 Percentage of time in MVPA for daily week and weekend activity
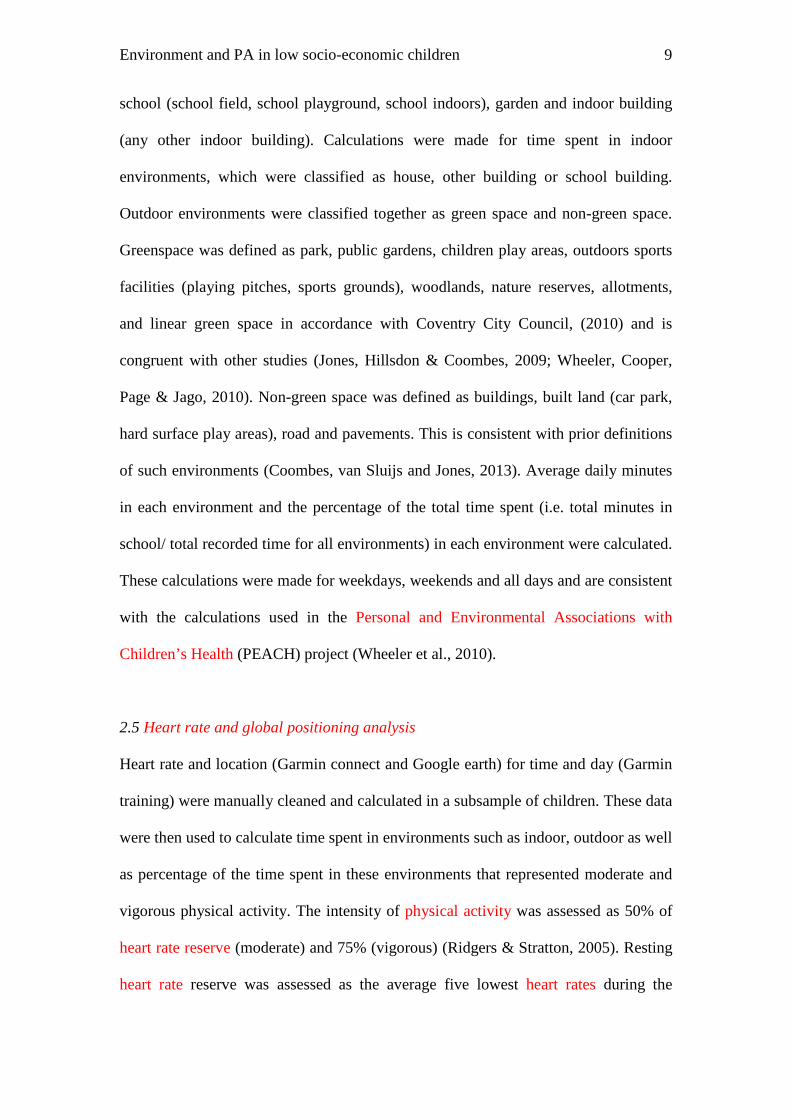

Environment and PA in low socio-economic children 30
FIGURE 1 HERE
Figure 1 Relationship between time spent outdoors on weekends with body fat ()
r = -036 p = 002
FIGURE 2 HERE
(See attached file) Figure 2 Percentage of time in MVPA for daily week and weekend activity

FIGURE 1 HERE
Figure 1 Relationship between time spent outdoors on weekends with body fat ()
r = -036 p = 002
FIGURE 2 HERE
(See attached file) Figure 2 Percentage of time in MVPA for daily week and weekend activity

FIGURE 2 HERE
(See attached file) Figure 2 Percentage of time in MVPA for daily week and weekend activity