Embed Size (px)
Citation preview
PHYS 406 Final Project: Musical Saw Case Study
Report By:
John Meehan / [email protected]
Kyle Heywood / [email protected]
May 16th, 2014
2
Table of Contents
Objective ....................................................................................................................................................... 3
Background ................................................................................................................................................... 3
Research ........................................................................................................................................................ 4
Procedure ...................................................................................................................................................... 7
Test Setup ..................................................................................................................................................... 9
Results & Data ............................................................................................................................................. 11
Conclusions & Recommendations .............................................................................................................. 17
References .................................................................................................................................................. 19
3
Objective
The objective of this case study was to become familiar with the physics behind the musical saw.
We use the term “case study” because we did not have a finite number of goals to achieve, but instead
wanted to learn as much as possible throughout the semester.
Background
What is a Musical Saw?
It is not known when it was first discovered that a carpenter’s saw could also produce musical
notes. By bending the saw into an S-shape and bowing the toothless side just as you would a violin, the
steel resonates at a frequency that is audible. To achieve this, saw players – sometimes called “sawyers”
– sit and place the handle of the saw between their thighs, and bend the saw to one side while
simultaneously bending the tip of the saw in the opposite direction to complete the S-curve. Next, they
bow the toothless edge (or strike with a mallet) between the two inflection points of the bent saw to
create a two-dimensional standing wave within the “trapezoid” that is formed on the face of the blade.
The perceived pitch can be changed by increasing the curvature of the S-curve at either or both
inflection points, causing the inflection points to travel along the long axis, thus the standing wave
travels on a trapezoid of different width.
The sound that is produced is quite eerie, resembling that of a Theremin. Each note heard is
almost completely at one frequency, giving the tone a creepy timbre. A saw player can sustain a note for
a considerable period of time, or add vibrato by bouncing his/her knee. While very difficult, it is also
possible to play harmonics at certain configurations, since more than one eigenfrequency is present in
each configuration.

4
Why Learn About the Musical Saw?
When the semester started, we only viewed a saw as a tool that cuts wood. Upon realizing that
the saw was capable of making music, we were immediately interested by the concept. Since the
purpose of this class is to become familiar with the physics of music, this project made great sense to
investigate. Additionally, the opportunity to learn another instrument was very appealing, especially one
that is of the continuous pitch variety. Continuous pitch instruments are much harder to play since the
notes are not predefined; you must adjust the pitch to be in tune. This is much different than a guitar,
for example, which is a discrete pitch instrument. On a guitar, the frets allow only certain pitches to be
played, and the distances are measured such that half-step intervals are heard when moving to adjacent
frets. Learning to play a continuous pitch instrument presented a unique challenge and further
motivated us to study the musical saw.
Research
To begin understanding the musical saw and how it functions, we looked into any existing
literature or research done on the topic. Folk instruments as obscure as this typically don’t receive much
academic attention; however, we were able to find a few surprisingly comprehensive articles on the
musical saw.
In “Vibration of an Elastic Strip with Varying Curvature”, J. Scott and J. Woodhouse investigate
the vibration properties of the musical saw by simplifying the problem as a rectangular strip of metal
held in an inflected S-shape. First, the paper derives a theoretical model for predicting the frequency
and mode shape for a metal strip of slowly varying curvature. Then, by running experimental
measurements on a piece of steel, the theoretical predictions were verified.
5
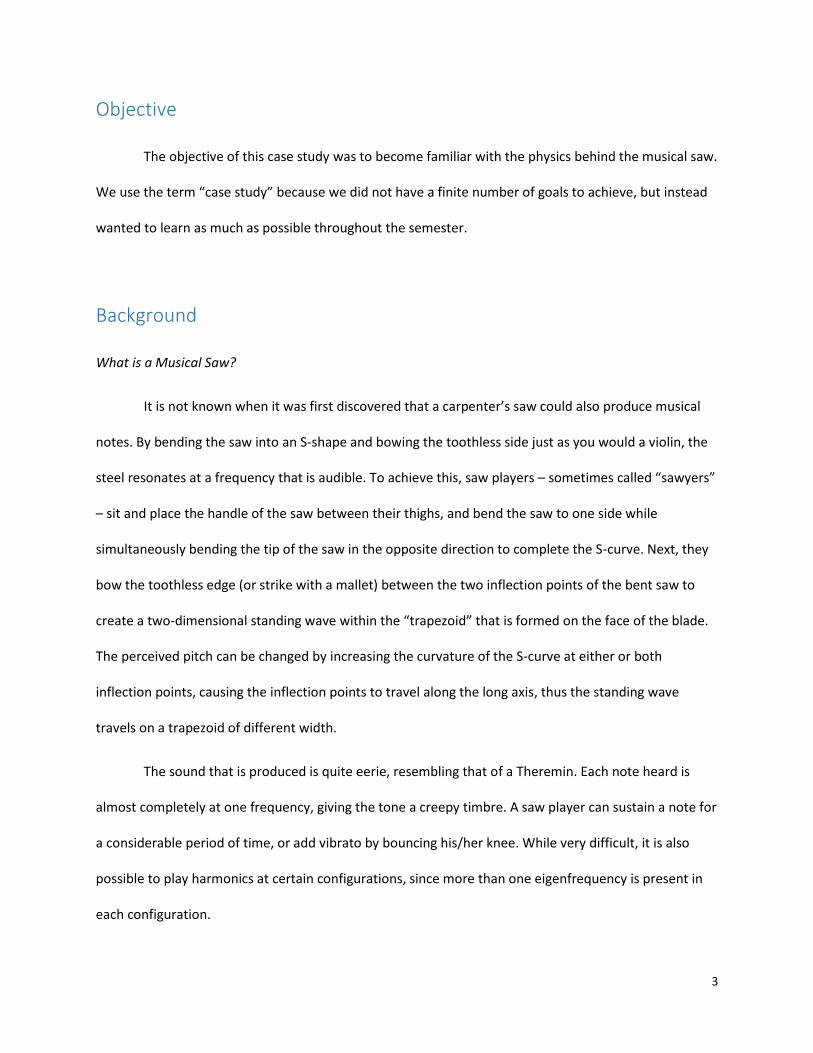
Some aspects of this paper were valuable to our project; although we do not wish to test
anything other than a hand-saw to achieve experimental results, the theoretical modeling and test setup
of their experiment are invaluable to our analysis. They were able to do more than us: by developing a
thorough theoretical model, they are capable of predicting frequency and mode shape for different
inflections, material types, and geometries. They determined that the main source of sound from a
musical saw is the inflection point of the S-bend, in the vicinity of which the vibrational modes are
confined by the process of total internal reflection from points of critical curvature. Surprisingly, as a
result of this observation, the vibrational modes are not influenced by the boundary conditions at the
end of the strip.
Figure 1: S-shape strip test configuration (Scott & Woodhouse)
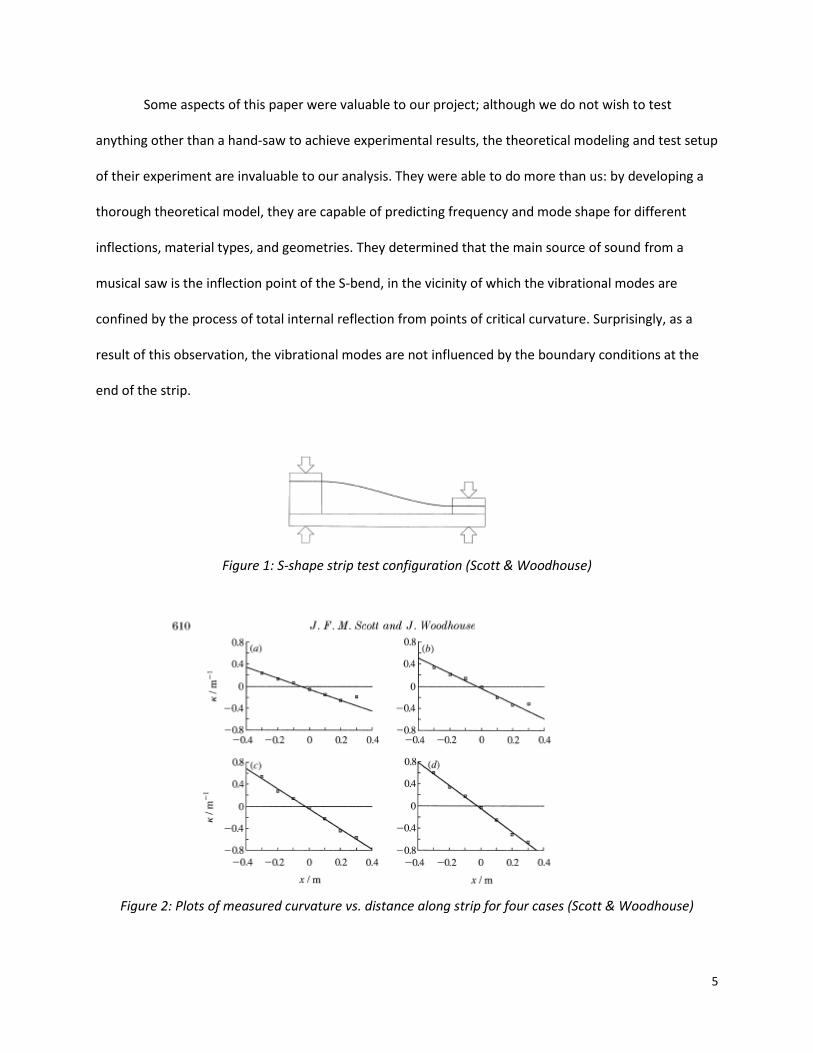
Figure 2: Plots of measured curvature vs. distance along strip for four cases (Scott & Woodhouse)
6
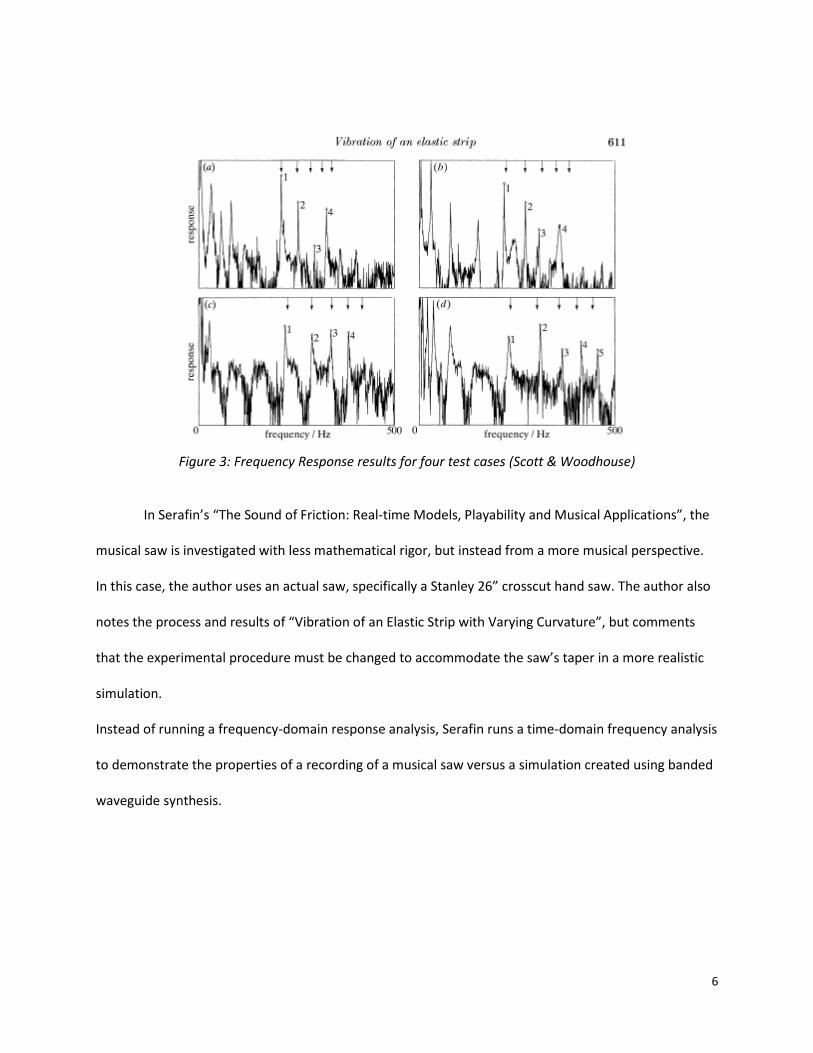
Figure 3: Frequency Response results for four test cases (Scott & Woodhouse)
In Serafin’s “The Sound of Friction: Real-time Models, Playability and Musical Applications”, the
musical saw is investigated with less mathematical rigor, but instead from a more musical perspective.
In this case, the author uses an actual saw, specifically a Stanley 26” crosscut hand saw. The author also
notes the process and results of “Vibration of an Elastic Strip with Varying Curvature”, but comments
that the experimental procedure must be changed to accommodate the saw’s taper in a more realistic
simulation.
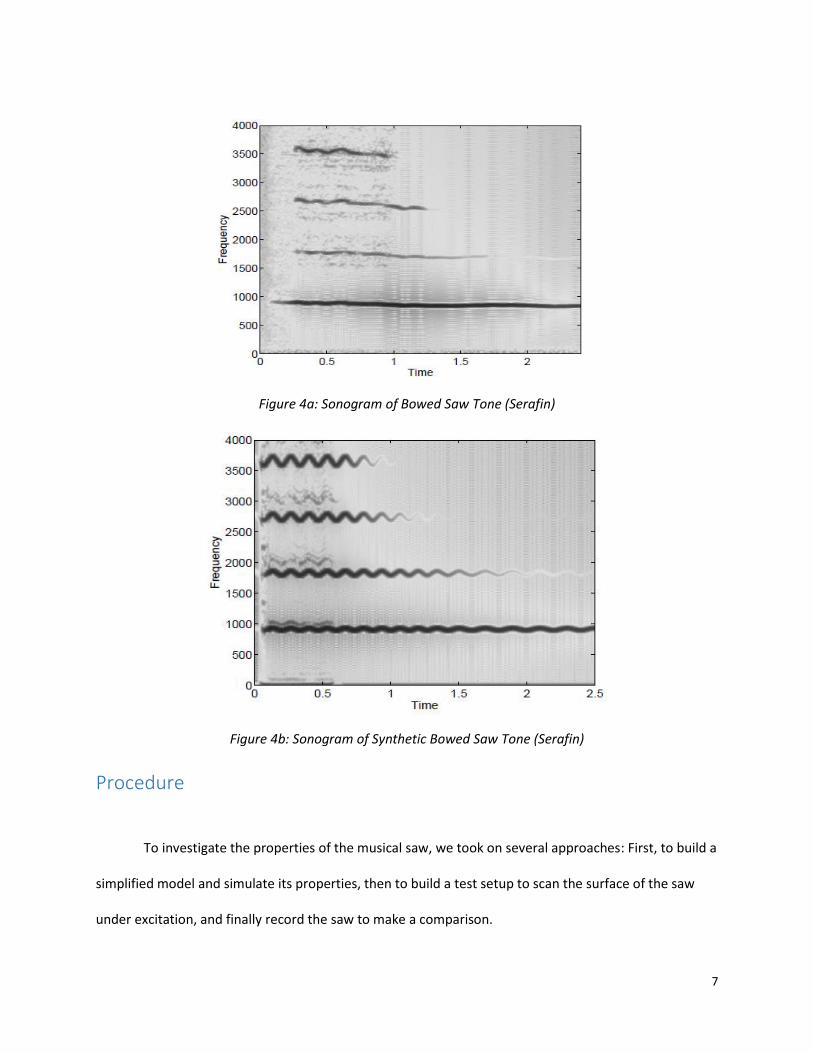
Instead of running a frequency-domain response analysis, Serafin runs a time-domain frequency analysis
to demonstrate the properties of a recording of a musical saw versus a simulation created using banded
waveguide synthesis.
7
Figure 4a: Sonogram of Bowed Saw Tone (Serafin)
Figure 4b: Sonogram of Synthetic Bowed Saw Tone (Serafin)
Procedure
To investigate the properties of the musical saw, we took on several approaches: First, to build a
simplified model and simulate its properties, then to build a test setup to scan the surface of the saw
under excitation, and finally record the saw to make a comparison.
8
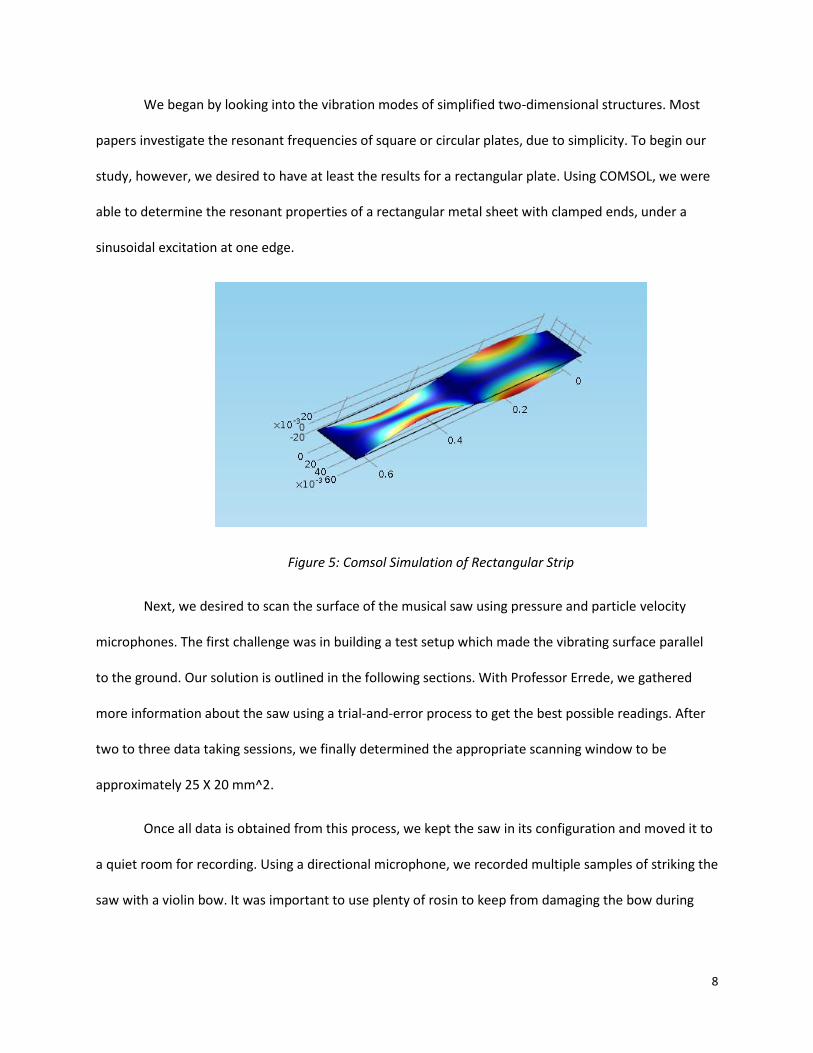
We began by looking into the vibration modes of simplified two-dimensional structures. Most
papers investigate the resonant frequencies of square or circular plates, due to simplicity. To begin our
study, however, we desired to have at least the results for a rectangular plate. Using COMSOL, we were
able to determine the resonant properties of a rectangular metal sheet with clamped ends, under a
sinusoidal excitation at one edge.
Figure 5: Comsol Simulation of Rectangular Strip
Next, we desired to scan the surface of the musical saw using pressure and particle velocity
microphones. The first challenge was in building a test setup which made the vibrating surface parallel
to the ground. Our solution is outlined in the following sections. With Professor Errede, we gathered
more information about the saw using a trial-and-error process to get the best possible readings. After
two to three data taking sessions, we finally determined the appropriate scanning window to be
approximately 25 X 20 mm^2.
Once all data is obtained from this process, we kept the saw in its configuration and moved it to
a quiet room for recording. Using a directional microphone, we recorded multiple samples of striking the
saw with a violin bow. It was important to use plenty of rosin to keep from damaging the bow during
9
this process. Next, we also used a hammer, and struck the saw in two places: once, on the edge of the
blade, and again on the same place the saw was excited during scanning.
Test Setup
The idea for the test setup was to construct a platform that could support the saw while bent
into a specific S-curve, and that kept the essentially flat area of the saw (between the two inflection
points) level to within +2mm in the z-direction to prevent negative clearance, where z points from the
floor to the ceiling of the laboratory. There was no tolerance in the negative z-direction. To construct
such a design, a piano bench was selected for the base platform because of its appropriate height and
surface area. Next, two rotating mechanical claws mounted to a flat wood base were secured to the
piano bench. A flat wood plate was secured to one of the claws and the handle of the saw was clamped
to the plate. The tip of the saw was placed inside of the second pair of claws and clamped into place.
This allowed us to rotate both ends of the saw into a desirable configuration and keep the “sweet spot”
flat.
10
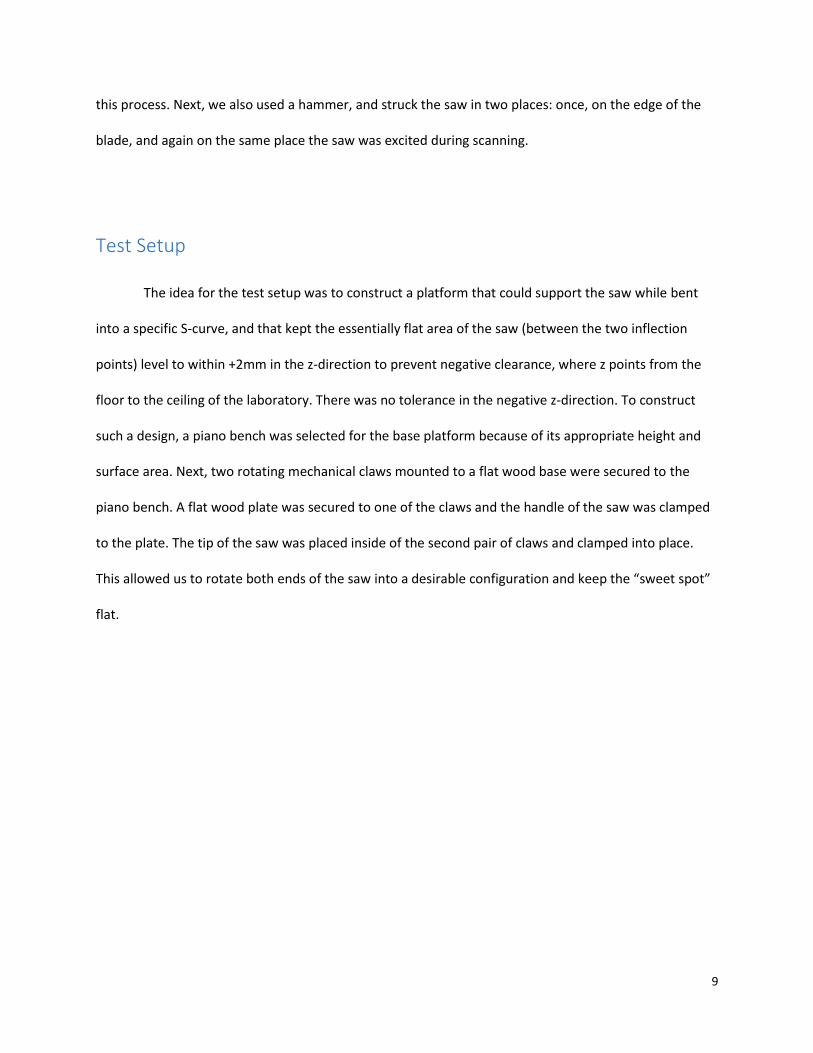
Figure 6: A photograph of the test setup used in the frequency sweep experiment.
The particle velocity microphone moved in the x and y directions, covering the essentially flat
region (and some free space around it). First, the scanner performed a frequency sweep to measure the
eigenfrequencies of the particular S-curve configuration. Then, at each point, the real and imaginary
parts of the particle velocity, the pressure, the impedance, the intensity, and displacement were
measured and plotted using MATLAB.
Despite its appearance, this test setup was actually quite stable and no difficulties were
encountered during the experiment once the building stage was completed.
11
Results & Data
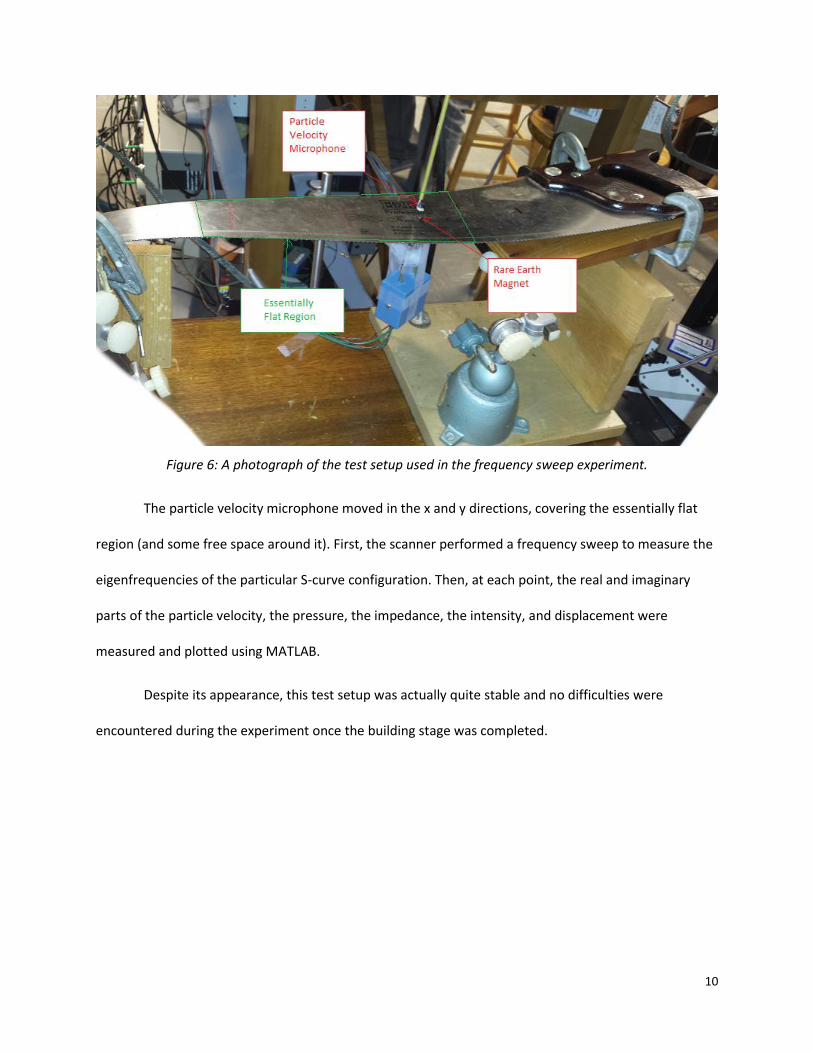
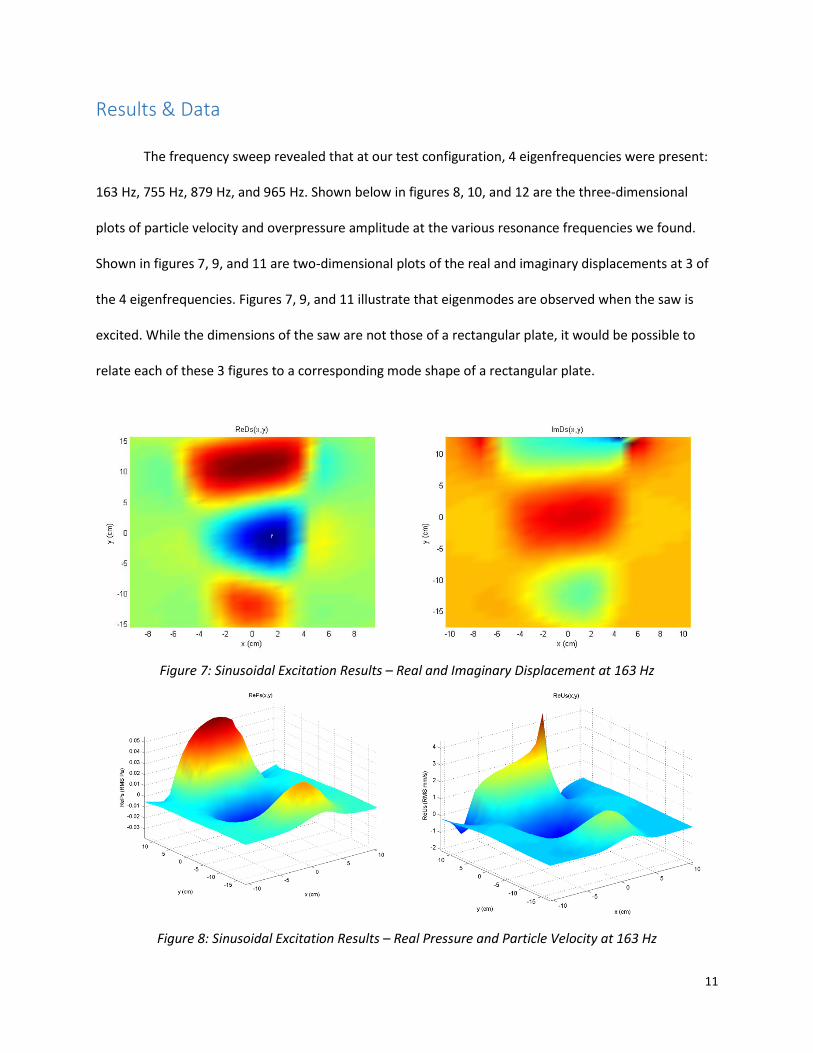
The frequency sweep revealed that at our test configuration, 4 eigenfrequencies were present:
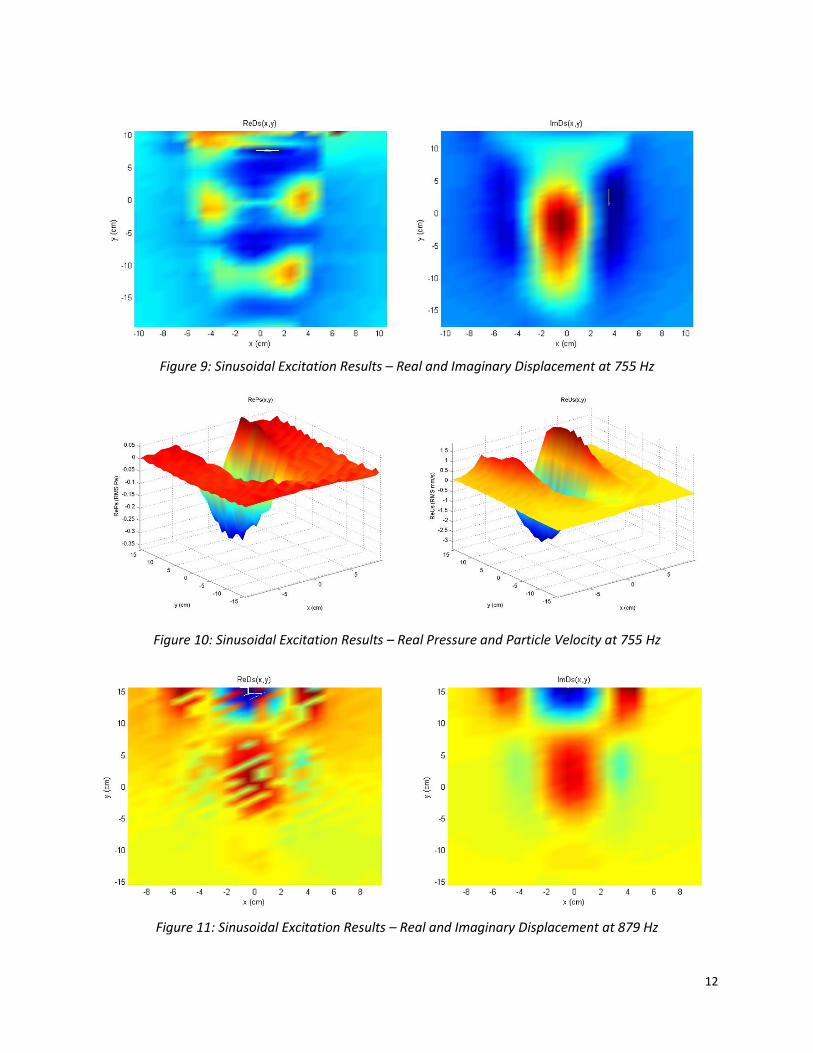
163 Hz, 755 Hz, 879 Hz, and 965 Hz. Shown below in figures 8, 10, and 12 are the three-dimensional
plots of particle velocity and overpressure amplitude at the various resonance frequencies we found.
Shown in figures 7, 9, and 11 are two-dimensional plots of the real and imaginary displacements at 3 of
the 4 eigenfrequencies. Figures 7, 9, and 11 illustrate that eigenmodes are observed when the saw is
excited. While the dimensions of the saw are not those of a rectangular plate, it would be possible to
relate each of these 3 figures to a corresponding mode shape of a rectangular plate.
Figure 7: Sinusoidal Excitation Results – Real and Imaginary Displacement at 163 Hz
Figure 8: Sinusoidal Excitation Results – Real Pressure and Particle Velocity at 163 Hz
12
Figure 9: Sinusoidal Excitation Results – Real and Imaginary Displacement at 755 Hz
Figure 10: Sinusoidal Excitation Results – Real Pressure and Particle Velocity at 755 Hz
Figure 11: Sinusoidal Excitation Results – Real and Imaginary Displacement at 879 Hz
13
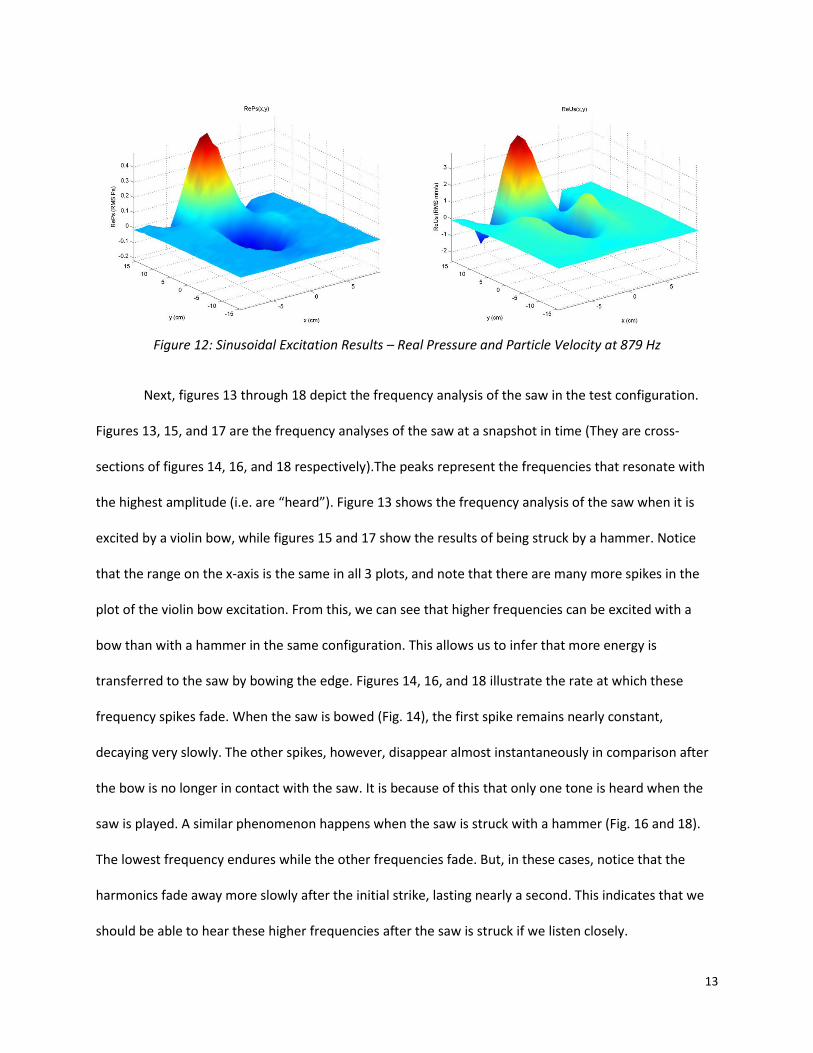
Figure 12: Sinusoidal Excitation Results – Real Pressure and Particle Velocity at 879 Hz
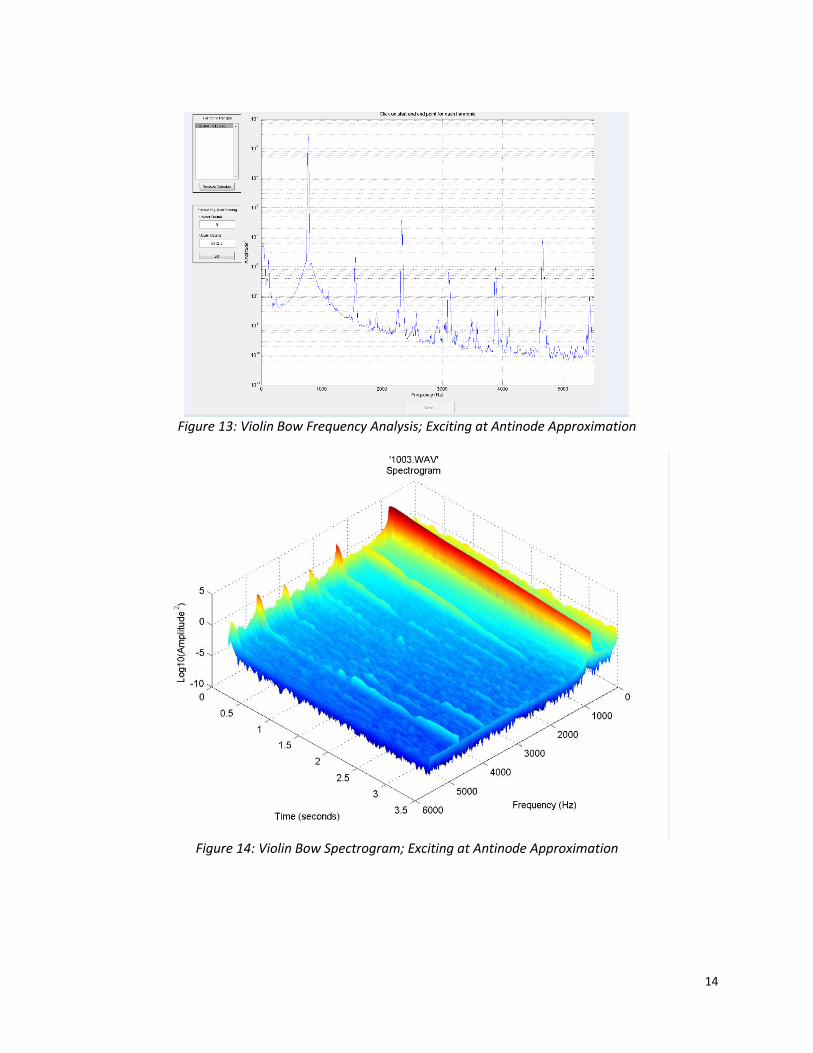
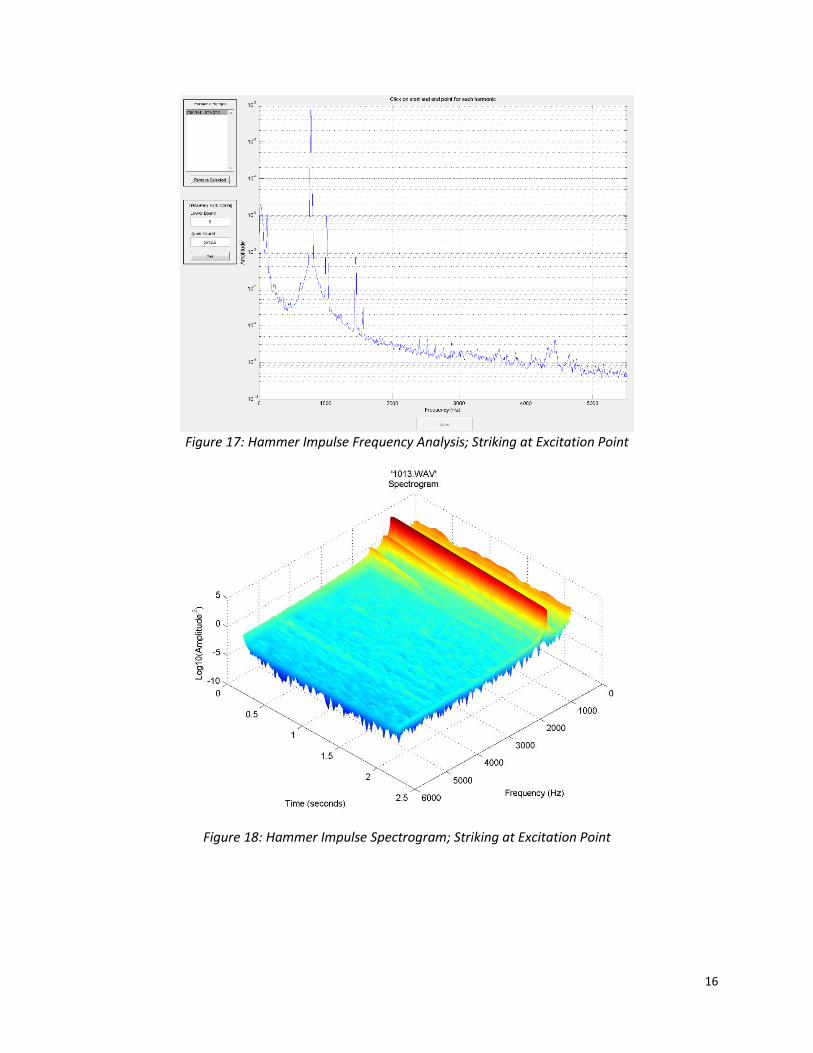
Next, figures 13 through 18 depict the frequency analysis of the saw in the test configuration.
Figures 13, 15, and 17 are the frequency analyses of the saw at a snapshot in time (They are cross-
sections of figures 14, 16, and 18 respectively).The peaks represent the frequencies that resonate with
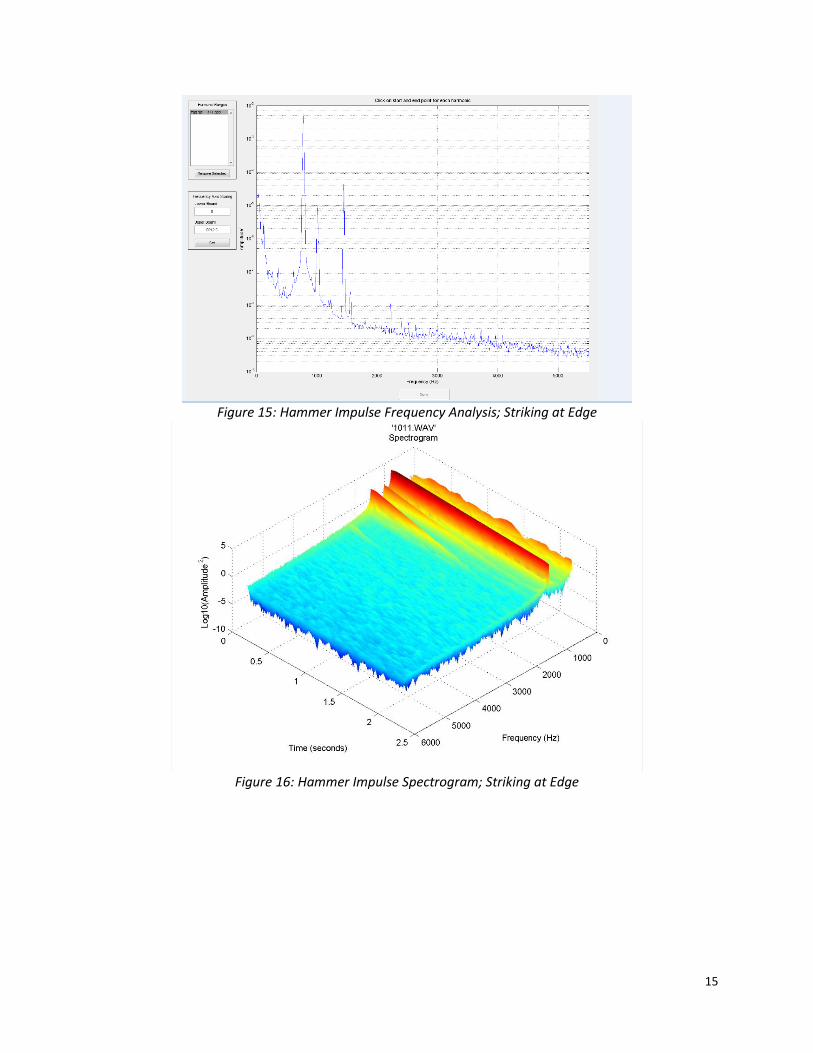
the highest amplitude (i.e. are “heard”). Figure 13 shows the frequency analysis of the saw when it is
excited by a violin bow, while figures 15 and 17 show the results of being struck by a hammer. Notice
that the range on the x-axis is the same in all 3 plots, and note that there are many more spikes in the
plot of the violin bow excitation. From this, we can see that higher frequencies can be excited with a
bow than with a hammer in the same configuration. This allows us to infer that more energy is
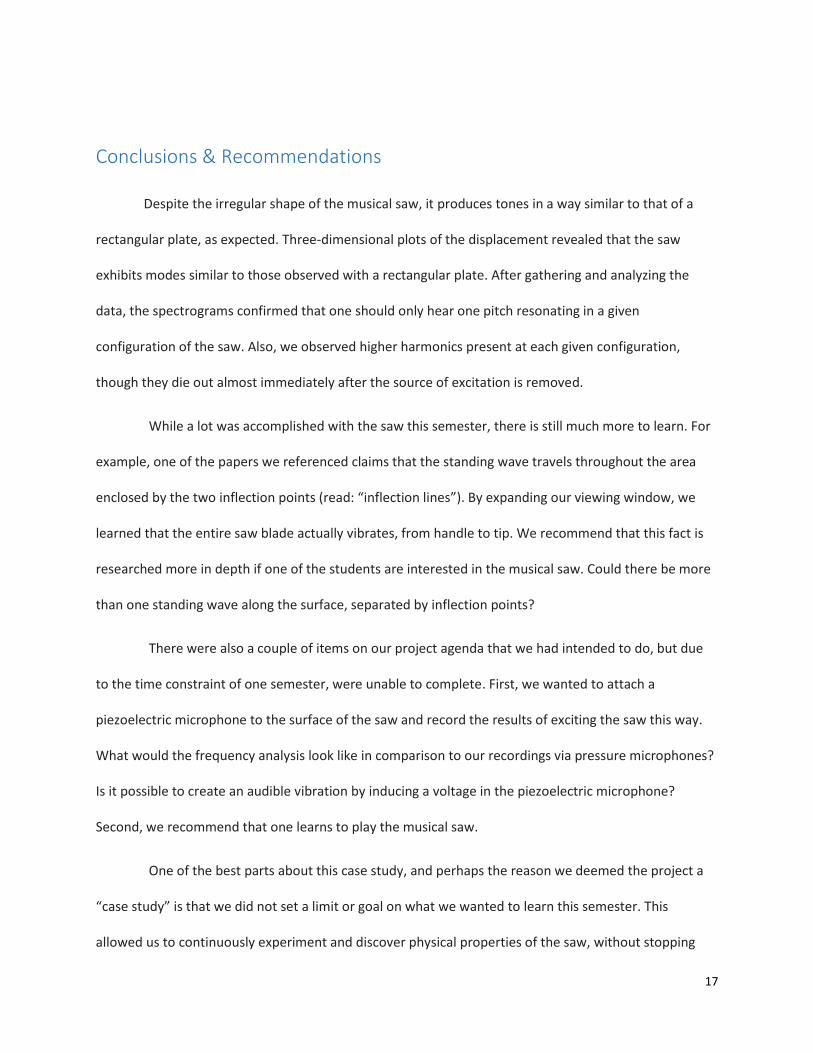
transferred to the saw by bowing the edge. Figures 14, 16, and 18 illustrate the rate at which these
frequency spikes fade. When the saw is bowed (Fig. 14), the first spike remains nearly constant,
decaying very slowly. The other spikes, however, disappear almost instantaneously in comparison after
the bow is no longer in contact with the saw. It is because of this that only one tone is heard when the
saw is played. A similar phenomenon happens when the saw is struck with a hammer (Fig. 16 and 18).
The lowest frequency endures while the other frequencies fade. But, in these cases, notice that the
harmonics fade away more slowly after the initial strike, lasting nearly a second. This indicates that we
should be able to hear these higher frequencies after the saw is struck if we listen closely.
14
Figure 13: Violin Bow Frequency Analysis; Exciting at Antinode Approximation
Figure 14: Violin Bow Spectrogram; Exciting at Antinode Approximation
15
Figure 15: Hammer Impulse Frequency Analysis; Striking at Edge
Figure 16: Hammer Impulse Spectrogram; Striking at Edge
16
Figure 17: Hammer Impulse Frequency Analysis; Striking at Excitation Point
Figure 18: Hammer Impulse Spectrogram; Striking at Excitation Point
17
Conclusions & Recommendations
Despite the irregular shape of the musical saw, it produces tones in a way similar to that of a
rectangular plate, as expected. Three-dimensional plots of the displacement revealed that the saw
exhibits modes similar to those observed with a rectangular plate. After gathering and analyzing the
data, the spectrograms confirmed that one should only hear one pitch resonating in a given
configuration of the saw. Also, we observed higher harmonics present at each given configuration,
though they die out almost immediately after the source of excitation is removed.
While a lot was accomplished with the saw this semester, there is still much more to learn. For
example, one of the papers we referenced claims that the standing wave travels throughout the area
enclosed by the two inflection points (read: “inflection lines”). By expanding our viewing window, we
learned that the entire saw blade actually vibrates, from handle to tip. We recommend that this fact is
researched more in depth if one of the students are interested in the musical saw. Could there be more
than one standing wave along the surface, separated by inflection points?
There were also a couple of items on our project agenda that we had intended to do, but due
to the time constraint of one semester, were unable to complete. First, we wanted to attach a
piezoelectric microphone to the surface of the saw and record the results of exciting the saw this way.
What would the frequency analysis look like in comparison to our recordings via pressure microphones?
Is it possible to create an audible vibration by inducing a voltage in the piezoelectric microphone?
Second, we recommend that one learns to play the musical saw.
One of the best parts about this case study, and perhaps the reason we deemed the project a
“case study” is that we did not set a limit or goal on what we wanted to learn this semester. This
allowed us to continuously experiment and discover physical properties of the saw, without stopping
18
because a target number of configurations were tested. We recommend that future students of this
course approach the project with this mindset so that they get the most out of what they focus on.
Furthermore, we recommend students to choose a topic that is not enormously researched, like the
musical saw. While it is interesting to learn more about any topic, it is more fulfilling to experiment and
be at the frontier of a new field of research.
19
References
Essl, Georg, Stefania Serafin, Perry R. Cook, and Julius O. Smith. "Musical Applications of Banded
Waveguides." Computer Music Journal 28.1 (2004): 53-55. Print.
Scott, J. F. M., and J. Woodhouse. "Vibration of an Elastic Strip with Varying Curvature." Philosophical
Transactions of the Royal Society A: Mathematical, Physical and Engineering Sciences 339.1655
(1992): 587-625. Print.