Embed Size (px)
Citation preview
Blaimer et al. BMC Evolutionary Biology (2015) 15:271 DOI 10.1186/s12862-015-0552-5
RESEARCH ARTICLE Open Access
Phylogenomic methods outperformtraditional multi-locus approaches inresolving deep evolutionary history: a casestudy of formicine ants
Bonnie B. Blaimer1*, Seán G. Brady1, Ted R. Schultz1, Michael W. Lloyd1, Brian L. Fisher2 and Philip S. Ward3Abstract
Background: Ultraconserved elements (UCEs) have been successfully used in phylogenomics for a variety of taxa,but their power in phylogenetic inference has yet to be extensively compared with that of traditional Sangersequencing data sets. Moreover, UCE data on invertebrates, including insects, are sparse. We compared thephylogenetic informativeness of 959 UCE loci with a multi-locus data set of ten nuclear markers obtained viaSanger sequencing, testing the ability of these two types of data to resolve and date the evolutionary history of thesecond most species-rich subfamily of ants in the world, the Formicinae.
Results: Phylogenetic analyses show that UCEs are superior in resolving ancient and shallow relationships informicine ants, demonstrated by increased node support and a more resolved phylogeny. Phylogeneticinformativeness metrics indicate a twofold improvement relative to the 10-gene data matrix generated from theidentical set of taxa. We were able to significantly improve formicine classification based on our comprehensiveUCE phylogeny. Our divergence age estimations, using both UCE and Sanger data, indicate that crown-groupFormicinae are older (104–117 Ma) than previously suggested. Biogeographic analyses infer that the diversificationof the subfamily has occurred on all continents with no particular hub of cladogenesis.
Conclusions: We found UCEs to be far superior to the multi-locus data set in estimating formicine relationships.The early history of the clade remains uncertain due to ancient rapid divergence events that are unresolvable evenwith our genomic-scale data, although this might be largely an effect of several problematic taxa subtended bylong branches. Our comparison of divergence ages from both Sanger and UCE data demonstrates the effectivenessof UCEs for dating analyses. This comparative study highlights both the promise and limitations of UCEs for insectphylogenomics, and will prove useful to the growing number of evolutionary biologists considering the transitionfrom Sanger to next-generation sequencing approaches.
Keywords: Ultraconserved elements, Insect phylogenomics, Ancient rapid radiations, Formicinae, Ant evolution
* Correspondence: [email protected] of Entomology, National Museum of Natural History,Smithsonian Institution, Washington, DC 20560, USAFull list of author information is available at the end of the article
© 2015 Blaimer et al. Open Access This article is distributed under the terms of the Creative Commons Attribution 4.0International License (http://creativecommons.org/licenses/by/4.0/), which permits unrestricted use, distribution, andreproduction in any medium, provided you give appropriate credit to the original author(s) and the source, provide a link tothe Creative Commons license, and indicate if changes were made. The Creative Commons Public Domain Dedication waiver(http://creativecommons.org/publicdomain/zero/1.0/) applies to the data made available in this article, unless otherwise stated.
Blaimer et al. BMC Evolutionary Biology (2015) 15:271 Page 2 of 14
BackgroundCurrent target-enrichment and next-generation sequen-cing techniques allow for the rapid generation of hun-dreds of loci for use as phylogenetic markers. This isdemonstrated by an increasing number of studies,largely conducted on vertebrates (e.g., [1–4]). One of themost promising approaches focuses on capturing ultra-conserved elements (UCEs)—regions in the genome thathave remained highly conserved across great evolution-ary distances. Core UCEs are sequenced together withtheir more variable flanking regions, producing markersfor phylogenetic reconstruction [5, 6]. Recently, thismethod has been adapted and applied to insects, inform-ing family-level relationships among Hymenoptera (bees,ants and wasps) [7]. Although these prior studies reportthe successful use of UCEs in phylogenetics, we are notaware of any study directly comparing this phyloge-nomic method to the longstanding use of multi-locus se-quence data in phylogenetics. In an important recentexercise, Gilbert et al. [8] calculated and compared thephylogenetic informativeness of UCEs and severalsingle-copy nuclear markers extracted in silico fromeight published fish genomes. Here we address an unre-solved phylogenetic problem by simultaneously generat-ing both UCE and traditional Sanger-sequenced data forthe same 82 ant species, estimating and directly compar-ing phylogenies separately produced by each source ofinformation. Many biologists require such an appliedcomparison as they evaluate the costs and benefits ofnext-generation techniques over Sanger sequencing inadvance of the data collection phases of their nextprojects.The evolutionary history and ecological success of the
ants (family Formicidae) have been illuminated recentlyin multiple studies using a variety of approaches. For ex-ample, recent molecular phylogenetic research has clari-fied relationships among and within subfamilies [9–14],while other research has focused on diversification pat-terns [15–17] or the evolution of successful behaviors[18, 19]. The ant subfamily Formicinae is the secondmost species-rich subfamily of ants with around 3000described species, trumped in diversity only by the Myr-micinae [20]. The group contains the well-known, eco-nomically important carpenter ants of the genusCamponotus, presently the most diverse genus-levelclade of ants in the world with over 1,000 described spe-cies. Other prominent members of this group includethe silk-spinning weaver ants (Oecophylla) and spinyants (Polyrhachis), which dominate the forest canopiesof the Old World, as well as the yellow crazy ant Ano-plolepis gracilipes, one of the world’s most destructiveand invasive ant species. Despite being stingless, formi-cines have derived a defensive venom exceptional amongthe arthropods, formic acid (well described e.g. in
Camponotus, Formica, Lasius [21]), and also have beenidentified recently as the only known dietary source ofpumiliotoxins sequestered by dendrobatid poison dart frogs[22]. Many formicine ants also exhibit intriguing slave-making behavior (e.g. Polyergus, Rossomyrmex) or otherforms of social parasitism (e.g. Lasius, Plagiolepis) [23].Recent phylogenetic research has focused on resolving
generic relationships within subfamily-level groups ofants such as the Myrmicinae [14], Ponerinae [13], andDorylinae [12]. The evolution of the subfamily Formici-nae, however, has not yet been comprehensively scruti-nized, with the exception of one particular subgroup, thePrenolepis genus-group [24, 25]. Prior studies of genericrelationships within these subfamilies were based ondata sets composed of multiple nuclear loci generated bytraditional Sanger sequencing. Particularly in the casesof the Myrmicinae and the Dorylinae, these methodswere not able to provide information adequate for en-tirely resolving lineage diversification [12, 14].We compare the efficacy of a UCE-based phyloge-
nomic data set to that of a high-quality nuclear-genedata set for resolving phylogenetic relationships andobtaining divergence estimates within formicine ants. Todo so, we assembled a data set of 959 UCE loci bymeans of target enrichment and multiplexed sequencingfor 82 formicine taxa, and simultaneously generated adata set of ten PCR-amplified and Sanger-sequenced nu-clear loci (eight of these protein-coding) for the same 82taxa. We then use these combined results to investigate(i) the power of each data set for resolving the phylogenyof the subfamily Formicinae and (ii) the evolutionaryand biogeographic history of the subfamily.
MethodsMolecular data collectionTaxon samplingA more extensive description of all methods can befound in Additional file 1. Our data set comprised 82ant species, which represent 48 of the 51 currently-validformicine genera. We further included eight outgrouptaxa from seven other ant subfamilies (Myrmicinae, Ecta-tomminae, Heteroponerinae, Pseudomyrmecinae, Myrme-ciinae, Aneuretinae, Dolichoderinae) belonging to theformicoid clade of ants (sensu Brady et al. [9]), and treeswere rooted using the four subfamilies most distantlyrelated to the formicines. Ants for this study werecollected at the following locations, and with respectiveinstitutions providing authorizations for the capture, col-lection and exportation: AUSTRALIA: EnvironmentalProtection Agency, Queensland Parks and Wildlife Ser-vice; BRUNEI: Universiti Brunei Darussalam and theBrunei Museums; CENTRAL AFRICAN REPUBLIC:Ministère de l'Environnement des Eaux, Forest, Chasses etPêche; COSTA RICA: Ministerio del Ambiente y Energia;
Blaimer et al. BMC Evolutionary Biology (2015) 15:271 Page 3 of 14
Direction General de Vida Silvestre, Ministerio de Recur-sos Naturales Energia y Minas; FIJI: Ministry of Fisheriesand Forests, Department of Forestry; GABON: NationalCenter for Scientific and Technological Research; HONGKONG: Agriculture, Fisheries and Conservation Depart-ment, Kowloon; MADAGASCAR: Ministère de l'Environ-nement et des Forêts, Madagascar National Parks;MALAYSIA: Sabah Biodiversity Council; UGANDA:Uganda National Council for Science and Technology,Uganda Wildlife Authority; UNITED STATES: NationalPark Service; and State of California Natural ResourcesAgency, Department of Parks and Recreation. Vouchershave been deposited at the University of California, Davis,at the National Museum of Natural History, and at theCalifornia Academy of Sciences. Additional file 2 listsspecimen identifiers; collection data can be found bysearching for these CASENT numbers on the AntWeb(www.antweb.org) database. DNA was extracted destruc-tively or non-destructively from worker ants or pupaeusing a DNeasy Blood and TissueKit (Qiagen, Valencia,CA, USA).
Library preparation, target enrichment and sequencing ofUCEsWe sheared 2.8–497 ng (139 ng mean) DNA to a targetsize of approximately 500–600 bp by sonication andused this sheared DNA as input for a modified genomicDNA library preparation protocol following Fairclothet al. ([7], but see Additional file 1). We enriched pooledlibraries using a set of 2749 custom-designed probes(MYcroarray, Inc.) targeting 1510 UCE loci in Hymenop-tera [7]. We followed library enrichment procedures forthe MYcroarray MYBaits kit [26], except we used a 0.1Xconcentration of the standard MYBaits concentration,and added 0.7 μL of 500 μM custom blocking oligos de-signed against our custom sequence tags. We used thewith-bead approach for PCR recovery of enriched librar-ies as described in Faircloth et al. [7]. Following post-enrichment PCR, we purified resulting reactions using1.0X speedbeads and rehydrated the enriched pools in22 μL EB.We performed qPCR using a SYBRW FAST qPCR kit
(Kapa Biosystems) on a ViiATM 7 (Life Technologies),and based on the size-adjusted concentrations estimatedby qPCR, we pooled libraries at equimolar concentra-tions and size-selected for 250–800 with a BluePippin(SageScience). The pooled libraries were sequencedusing two partial lanes of a 150-bp paired-end IlluminaHiSeq 2500 run (U Cornell Genomics Facility). All ofthe UCE laboratory work was conducted in and withsupport of the Laboratories of Analytical Biology(L.A.B.) facilities of the National Museum of NaturalHistory (NMNH). Quality-trimmed sequence reads gen-erated as part of this study are available from the NCBI
Sequence Read Archive (http://www.ncbi.nlm.nih.gov/sra; SUB1067415).
Amplification, Sanger sequencing, and alignment of nuclearlociTen nuclear markers commonly used in ant systematicswere selected for amplification ([for primers see [9, 11,27, 28]): Long-wavelength rhodopsin (LW Rh, 458 bp),elongation factor 1-alpha F1 (EF1aF1, 359 bp), elong-ation factor 1-alpha F2 (EF1aF2, 517 bp), abdominal-A(abdA, 606 bp), arginine kinase (argK, 673 bp), ultra-bithorax (Ubx, 630 bp), 18S ribosomal DNA (1851 bp),28S rDNA (825 bp), wingless (Wg, 412 bp) and topo-isomerase 1 (Top1, 883 bp), for a total of 7214 bp in thealigned data matrix. Amplifications were performedusing standard PCR methods outlined in Ward andDownie [27] and cycle sequencing reactions were per-formed using PCR primers and BigDye W Terminatorver. 3.1 Cycle Sequencing chemistry. Amplicons wereanalyzed on ABI 3730 Sequencers © (2011 Life Tech-nologies, Frederick, MA) housed at the College of Bio-logical Sciences DNA Sequencing Facility, University ofCalifornia, Davis, CA and at L.A.B. at the NMNH,Washington, DC. Sequence data were aligned withMAFFT v7.017 [29]. All newly generated sequences havebeen deposited in GenBank, under accessions KT443144-KT443783 (see Additional file 2).
Processing and alignment of UCE dataWe trimmed the demultiplexed FASTQ data output foradapter contamination and low-quality bases using Illu-miprocessor [30], based on the package Trimmomatic[31]. All further data processing described in the follow-ing relied on the PHYLUCE package [6, 32]; a detaileddescription of this pipeline and its scripts can be foundin Additional file 1.We computed summary statistics on the data and as-
sembled the cleaned reads using Trinity (version trinityr-naseq_r20140717) [33]. To identify contigs representingenriched UCE loci from each species, species-specificcontig assemblies were aligned to a FASTA file of all en-richment baits (min_coverage = 50, min_identity = 80),and sequence coverage statistics (avg, min, max) for con-tigs containing UCE loci were calculated. We createdFASTA files for each UCE locus containing sequencedata for taxa present at that particular locus and alignedthese using MAFFT [29] (min-length = 20, no-trim). Wefurther trimmed our alignments using Gblocks [34]. Ini-tially, we selected the following subsets of UCE align-ments depending on the captured UCE loci across taxa:1) 50 % complete (containing data from ≥ 45 of the 90taxa for each locus), 2) 60 % complete (≥54 of 90 taxa),3) 70 % complete (≥63 of 90 taxa) and 4) 95 % (≥85 of90 taxa).
Blaimer et al. BMC Evolutionary Biology (2015) 15:271 Page 4 of 14
Phylogenetic inferenceFor the 10-gene data set, PartitionFinder v.1.1.1 [35] wasused to simultaneously select data partitions and esti-mate appropriate models of evolution, for subsequentanalyses with maximum likelihood (ML) and Bayesianmethods. ML analyses were carried out in the programsRAxML v7.7.7 [36] and GARLI v.2.0 [37] and includedboth best tree and bootstrap searches. Bayesian inference(BI) was performed in MRBAYES 3.2 [38] with 2 inde-pendent runs of 40 million generations, summarizing72000 trees after discarding a burnin of 10 %. MCMCconvergence was checked visually and with Bayes Factorcomparisons using TRACER v1.6 (http://tree.bio.ed.a-c.uk/software/tracer/) and by examining PSRF values inMrBayes .stat output files. All analyses were carried outusing parallel processing (one chain per CPU) on a 12-core Intel-processor Apple computer or on the Smithson-ian NMNH L.A.B Topaz network of Apple computerswith Intel processors.To select data partitions for the UCE phylogenomic
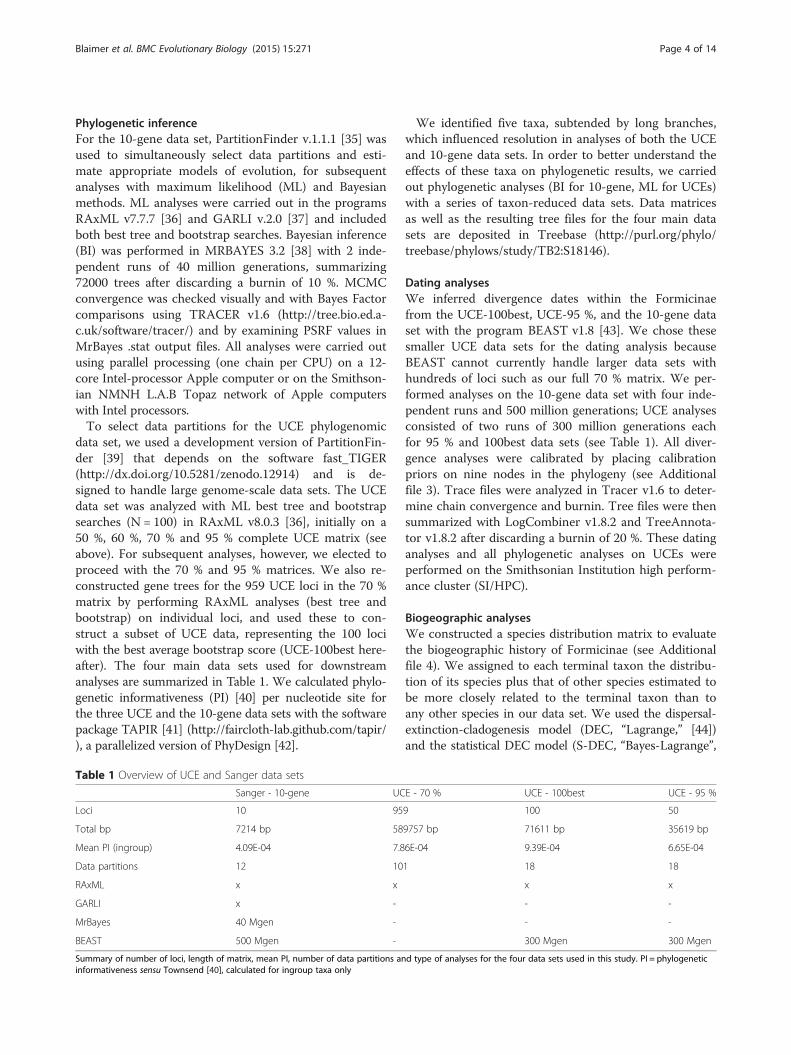
data set, we used a development version of PartitionFin-der [39] that depends on the software fast_TIGER(http://dx.doi.org/10.5281/zenodo.12914) and is de-signed to handle large genome-scale data sets. The UCEdata set was analyzed with ML best tree and bootstrapsearches (N = 100) in RAxML v8.0.3 [36], initially on a50 %, 60 %, 70 % and 95 % complete UCE matrix (seeabove). For subsequent analyses, however, we elected toproceed with the 70 % and 95 % matrices. We also re-constructed gene trees for the 959 UCE loci in the 70 %matrix by performing RAxML analyses (best tree andbootstrap) on individual loci, and used these to con-struct a subset of UCE data, representing the 100 lociwith the best average bootstrap score (UCE-100best here-after). The four main data sets used for downstreamanalyses are summarized in Table 1. We calculated phylo-genetic informativeness (PI) [40] per nucleotide site forthe three UCE and the 10-gene data sets with the softwarepackage TAPIR [41] (http://faircloth-lab.github.com/tapir/), a parallelized version of PhyDesign [42].
Table 1 Overview of UCE and Sanger data sets
Sanger - 10-gene UC
Loci 10 95
Total bp 7214 bp 58
Mean PI (ingroup) 4.09E-04 7.8
Data partitions 12 10
RAxML x x
GARLI x -
MrBayes 40 Mgen -
BEAST 500 Mgen -
Summary of number of loci, length of matrix, mean PI, number of data partitions aninformativeness sensu Townsend [40], calculated for ingroup taxa only
We identified five taxa, subtended by long branches,which influenced resolution in analyses of both the UCEand 10-gene data sets. In order to better understand theeffects of these taxa on phylogenetic results, we carriedout phylogenetic analyses (BI for 10-gene, ML for UCEs)with a series of taxon-reduced data sets. Data matricesas well as the resulting tree files for the four main datasets are deposited in Treebase (http://purl.org/phylo/treebase/phylows/study/TB2:S18146).
Dating analysesWe inferred divergence dates within the Formicinaefrom the UCE-100best, UCE-95 %, and the 10-gene dataset with the program BEAST v1.8 [43]. We chose thesesmaller UCE data sets for the dating analysis becauseBEAST cannot currently handle larger data sets withhundreds of loci such as our full 70 % matrix. We per-formed analyses on the 10-gene data set with four inde-pendent runs and 500 million generations; UCE analysesconsisted of two runs of 300 million generations eachfor 95 % and 100best data sets (see Table 1). All diver-gence analyses were calibrated by placing calibrationpriors on nine nodes in the phylogeny (see Additionalfile 3). Trace files were analyzed in Tracer v1.6 to deter-mine chain convergence and burnin. Tree files were thensummarized with LogCombiner v1.8.2 and TreeAnnota-tor v1.8.2 after discarding a burnin of 20 %. These datinganalyses and all phylogenetic analyses on UCEs wereperformed on the Smithsonian Institution high perform-ance cluster (SI/HPC).
Biogeographic analysesWe constructed a species distribution matrix to evaluatethe biogeographic history of Formicinae (see Additionalfile 4). We assigned to each terminal taxon the distribu-tion of its species plus that of other species estimated tobe more closely related to the terminal taxon than toany other species in our data set. We used the dispersal-extinction-cladogenesis model (DEC, “Lagrange,” [44])and the statistical DEC model (S-DEC, “Bayes-Lagrange”,
E - 70 % UCE - 100best UCE - 95 %
9 100 50
9757 bp 71611 bp 35619 bp
6E-04 9.39E-04 6.65E-04
1 18 18
x x
- -
- -
300 Mgen 300 Mgen
d type of analyses for the four data sets used in this study. PI = phylogenetic
Blaimer et al. BMC Evolutionary Biology (2015) 15:271 Page 5 of 14
[45]) implemented in the program RASP [46] to estimateancestral ranges from the set of trees and the respectiveMCC tree from our BEAST analysis on the UCE-100bestdata set. Under both models, outgroups were removedbefore the analyses. We followed Ward et al. [14] in desig-nating six biogeographic areas (Neotropical, Nearctic,Palearctic, Afrotropical, Indomalayan and Australa-sian) and defined different dispersal constraints fortwo time slices (0–50 Ma and 50–105 Ma) based onpaleogeography (Scotese, 2010, PALEOMAP project;http://www.scotese.com/) (see Additional file 5).
ResultsUCE capture statisticsMultiplexed sequencing of UCEs resulted in an averageof 1.6 million reads per sample (see Additional file 6)with an average length of 290 base pairs (bp). An aver-age of 29655 contigs with a mean length of 359.2 bp wasassembled by Trinity after adapter- and quality-trimming, with an average coverage of 17.4X. From allof the assembled contigs, we recovered an average of936 UCE loci per sample with a mean length of 805 bp.The average coverage per captured UCE locus was92.3X. Following alignment of individual UCE loci, wefiltered these data for loci captured for ≥70 % of taxa
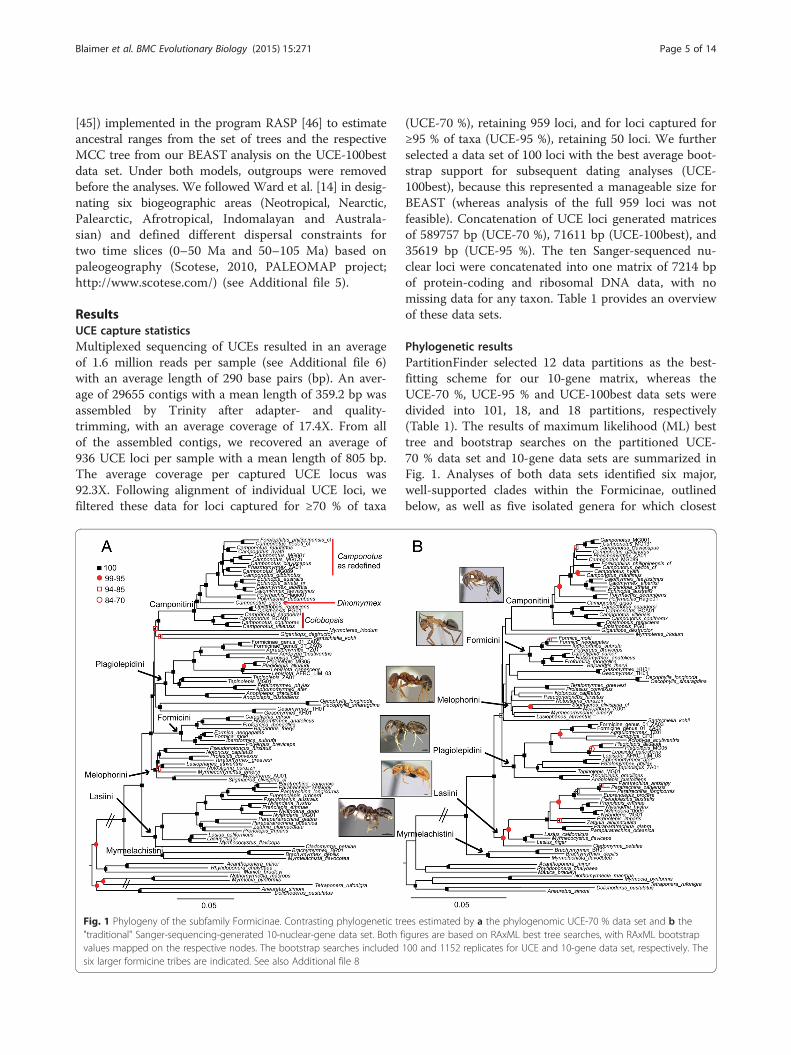
Fig. 1 Phylogeny of the subfamily Formicinae. Contrasting phylogenetic tre"traditional" Sanger-sequencing-generated 10-nuclear-gene data set. Both fvalues mapped on the respective nodes. The bootstrap searches includedsix larger formicine tribes are indicated. See also Additional file 8
(UCE-70 %), retaining 959 loci, and for loci captured for≥95 % of taxa (UCE-95 %), retaining 50 loci. We furtherselected a data set of 100 loci with the best average boot-strap support for subsequent dating analyses (UCE-100best), because this represented a manageable size forBEAST (whereas analysis of the full 959 loci was notfeasible). Concatenation of UCE loci generated matricesof 589757 bp (UCE-70 %), 71611 bp (UCE-100best), and35619 bp (UCE-95 %). The ten Sanger-sequenced nu-clear loci were concatenated into one matrix of 7214 bpof protein-coding and ribosomal DNA data, with nomissing data for any taxon. Table 1 provides an overviewof these data sets.
Phylogenetic resultsPartitionFinder selected 12 data partitions as the best-fitting scheme for our 10-gene matrix, whereas theUCE-70 %, UCE-95 % and UCE-100best data sets weredivided into 101, 18, and 18 partitions, respectively(Table 1). The results of maximum likelihood (ML) besttree and bootstrap searches on the partitioned UCE-70 % data set and 10-gene data sets are summarized inFig. 1. Analyses of both data sets identified six major,well-supported clades within the Formicinae, outlinedbelow, as well as five isolated genera for which closest
es estimated by a the phylogenomic UCE-70 % data set and b theigures are based on RAxML best tree searches, with RAxML bootstrap100 and 1152 replicates for UCE and 10-gene data set, respectively. The
Blaimer et al. BMC Evolutionary Biology (2015) 15:271 Page 6 of 14
relatives remain uncertain. We propose tribal andgenus-level revisions to the classification of the subfam-ily based on our phylogenetic results (as detailed inAdditional file 7), intended for formal publication else-where (Ward et al., in review).
1) Camponotini: This clade is recovered with highbootstrap support (BS = 100) in both UCE and 10-gene analyses, and includes the genera Camponotus,Polyrhachis, Opisthopsis, Echinopla, Phasmomyrmex,and Forelophilus.
2) Plagiolepidini (redefined): We recovered very goodsupport (BS = 100 in both analyses) for a cladecontaining the genera Acropyga, Anoplolepis,Agraulomyrmex, Aphomomyrmex, Lepiosota,Petalomyrmex, Plagiolepis, Tapinolepis, and anundescribed formicine genus. Lepisiota was furtherrecovered as paraphyletic with respect to Plagiolepis(Fig. 1).
3) Formicini: All current members of the tribeFormicini form another highly-supported clade inboth UCE and 10-gene analyses (BS = 100/100),including Bajcaridris, Cataglyphis, Formica,Ibericoformica, Rossomyrmex, Polyergus, andProformica.
4) Melophorini (redefined): The UCE phylogeny revealsa well-supported clade (BS = 100) containingLasiophanes, Melophorus, Myrmecorhynchus,Notoncus, Pseudonotoncus, Notostigma, Prolasius,Stigmacros, and Teratomyrmex. This clade is alsorecovered in analyses of the 10-gene data set, butwith lower support (BS: GARLI = 64, RAxML = 55;BI/PP: 1.0).
5) Lasiini (redefined): Both UCE and 10-gene data setsfurther highly support (BS = 100/95) a clade consistingof ten genera: Cladomyrma, Euprenolepis, Lasius,Myrmecocystus, Nylanderia, Paraparatrechina,Paratrechina, Prenolepis, Pseudolasius and Zatania.Two genera, Prenolepis and Nylanderia, were furtherrecovered as paraphyletic with respect to each other.
6) Myrmelachistini (resurrected): Both data setsrecover Brachymyrmex and Myrmelachista as sisterto all other formicines, forming a highly supportedclade (BS = 100/100).
Performance of UCE versus 10-gene data setsOverall, phylogenies resulting from maximum-likelihoodanalyses of each of our two main data sets (UCE-70 %and 10-gene data set) are congruent in topology for allparts of the phylogeny that receive high support, withdisagreements restricted only to poorly resolved areas.The single exception is the position of Myrmecocystus.In the UCE-70 % phylogeny Myrmecocystus is sister toLasius, whereas in the 10-gene data set this taxon arises
within Lasius. The UCE-70 % phylogeny (Fig. 1a) ishighly supported with only 12 (out of 85) nodes with BS< 100, whereas the 10-gene phylogeny (Fig. 1b), in con-trast, retains 42 nodes with BS < 100. For example, gen-eric relationships within the tribe Melophorini are wellsupported in the UCE tree, whereas these remain fairlyunresolved in the 10-gene analysis. Interestingly, neitherof the phylogenies resulting from the two data sets isable to fully resolve the relationships between the above-described major formicine lineages, i.e., both contain anancient, unresolved polytomy. The UCE data set, how-ever, provides substantially more resolution in this areaof the phylogeny (Fig. 1a) than does the 10-gene phyl-ogeny (Fig. 1b), reconstructing the Melophorini as sisterto a clade containing the Camponotini, Plagiolepidini,and Formicini (in a polytomy). Figs. 2a&b provide con-trasting summary sketches of the tribal relationshipsbased on these two data sets. Bayesian analyses of the10-gene data set produced very similar results (seeAdditional file 8). Maximum-likelihood analyses for theUCE-100best and 95 % data sets also show Lasius asparaphyletic, and overall phylogenies from these smallerUCE subsets are less well supported than from the full70 % data set (see Additional file 9).Phylogenetic informativeness (PI) increases in both
data sets asymptotically with increasing divergence ages,but is much higher in the UCE data sets than in the 10-gene data set (Fig. 3a). The UCE-70 %, UCE-100best andUCE-95 % data sets show a 2.0-, 2.5- and 1.5-fold in-crease in PI relative to the 10-gene data set, respectively(Fig. 3a and Table 1).
Taxa with uncertain relationshipsWe identified five taxa (Gigantiops, Myrmoteras, Oeco-phylla, Gesomyrmex, Santschiella) that are subtended byvery long branches in phylogenies resulting from ana-lyses of both data sets (Fig. 1). No analysis of either dataset is decisively able to resolve the precise positionswithin the subfamily of Gigantiops or Santschiella.Strongly supported by the UCE but not by the ten-genedata, however, are a sister-group relationship betweenMyrmoteras and the tribe Camponotini (BS = 100) and agrouping of Gesomyrmex and Oecophylla as sister taxa(BS = 100).We investigated the effect of these potential rogue taxa
on tree topology, especially on the deep polytomy be-tween subfamilies, and summarize results in Fig. 2 (seealso Additional file 10). Excluding all five taxa resultedin a fully resolved, well-supported UCE phylogeny forthe remaining six formicine lineages (Fig. 2c). This treeresolves the major polytomy with a relatively well-supported (BS = 93) sister-group relationship betweenFormicini and Camponotini, and with Plagiolepidini asthe sister to (Formicini + Camponotini). In analyses of
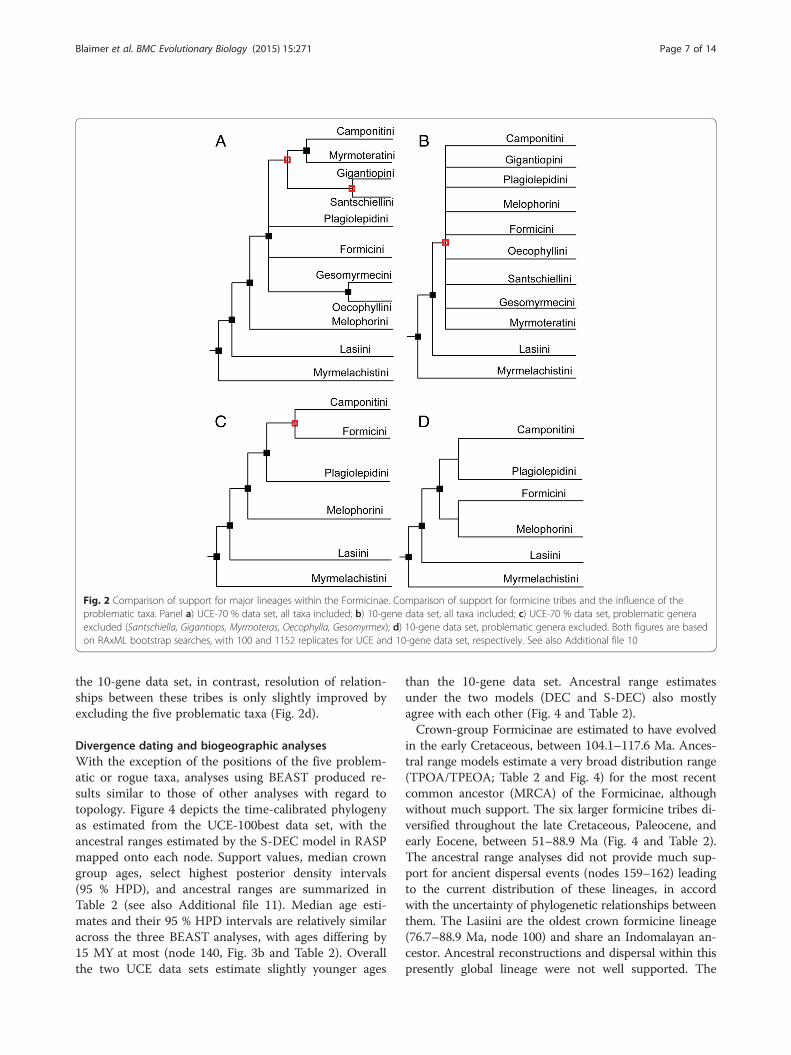
Fig. 2 Comparison of support for major lineages within the Formicinae. Comparison of support for formicine tribes and the influence of theproblematic taxa. Panel a) UCE-70 % data set, all taxa included; b) 10-gene data set, all taxa included; c) UCE-70 % data set, problematic generaexcluded (Santschiella, Gigantiops, Myrmoteras, Oecophylla, Gesomyrmex); d) 10-gene data set, problematic genera excluded. Both figures are basedon RAxML bootstrap searches, with 100 and 1152 replicates for UCE and 10-gene data set, respectively. See also Additional file 10
Blaimer et al. BMC Evolutionary Biology (2015) 15:271 Page 7 of 14
the 10-gene data set, in contrast, resolution of relation-ships between these tribes is only slightly improved byexcluding the five problematic taxa (Fig. 2d).
Divergence dating and biogeographic analysesWith the exception of the positions of the five problem-atic or rogue taxa, analyses using BEAST produced re-sults similar to those of other analyses with regard totopology. Figure 4 depicts the time-calibrated phylogenyas estimated from the UCE-100best data set, with theancestral ranges estimated by the S-DEC model in RASPmapped onto each node. Support values, median crowngroup ages, select highest posterior density intervals(95 % HPD), and ancestral ranges are summarized inTable 2 (see also Additional file 11). Median age esti-mates and their 95 % HPD intervals are relatively similaracross the three BEAST analyses, with ages differing by15 MY at most (node 140, Fig. 3b and Table 2). Overallthe two UCE data sets estimate slightly younger ages
than the 10-gene data set. Ancestral range estimatesunder the two models (DEC and S-DEC) also mostlyagree with each other (Fig. 4 and Table 2).Crown-group Formicinae are estimated to have evolved
in the early Cretaceous, between 104.1–117.6 Ma. Ances-tral range models estimate a very broad distribution range(TPOA/TPEOA; Table 2 and Fig. 4) for the most recentcommon ancestor (MRCA) of the Formicinae, althoughwithout much support. The six larger formicine tribes di-versified throughout the late Cretaceous, Paleocene, andearly Eocene, between 51–88.9 Ma (Fig. 4 and Table 2).The ancestral range analyses did not provide much sup-port for ancient dispersal events (nodes 159–162) leadingto the current distribution of these lineages, in accordwith the uncertainty of phylogenetic relationships betweenthem. The Lasiini are the oldest crown formicine lineage(76.7–88.9 Ma, node 100) and share an Indomalayan an-cestor. Ancestral reconstructions and dispersal within thispresently global lineage were not well supported. The
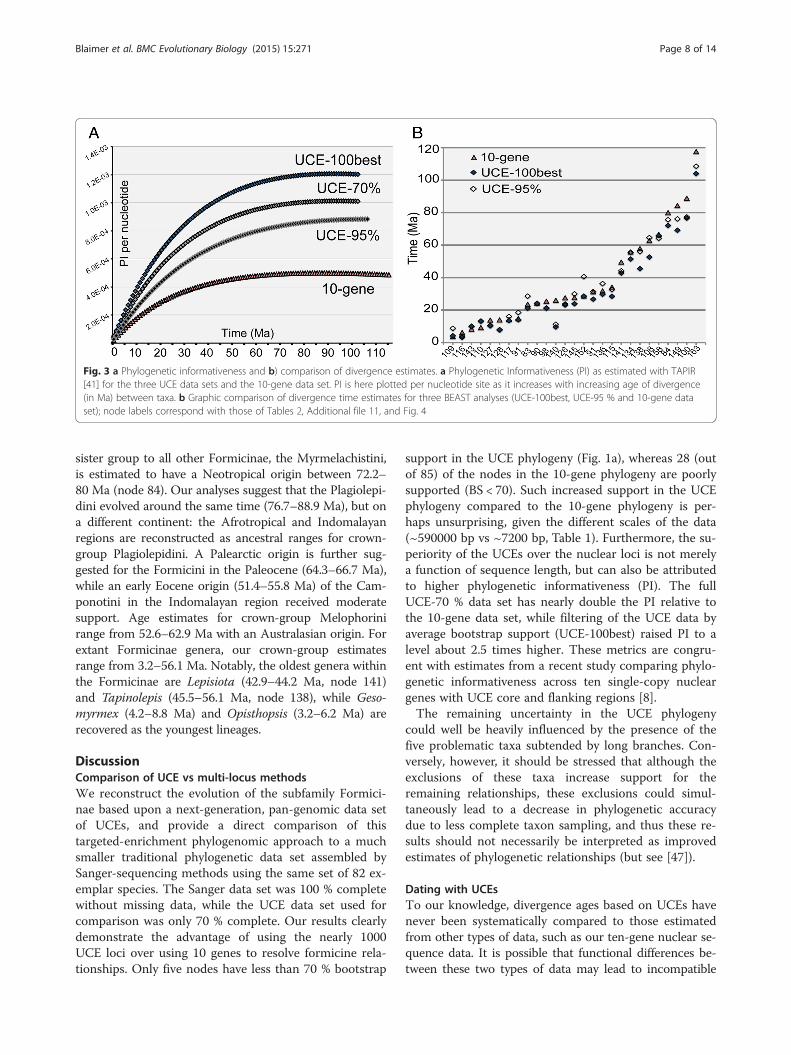
Fig. 3 a Phylogenetic informativeness and b) comparison of divergence estimates. a Phylogenetic Informativeness (PI) as estimated with TAPIR[41] for the three UCE data sets and the 10-gene data set. PI is here plotted per nucleotide site as it increases with increasing age of divergence(in Ma) between taxa. b Graphic comparison of divergence time estimates for three BEAST analyses (UCE-100best, UCE-95 % and 10-gene dataset); node labels correspond with those of Tables 2, Additional file 11, and Fig. 4
Blaimer et al. BMC Evolutionary Biology (2015) 15:271 Page 8 of 14
sister group to all other Formicinae, the Myrmelachistini,is estimated to have a Neotropical origin between 72.2–80 Ma (node 84). Our analyses suggest that the Plagiolepi-dini evolved around the same time (76.7–88.9 Ma), but ona different continent: the Afrotropical and Indomalayanregions are reconstructed as ancestral ranges for crown-group Plagiolepidini. A Palearctic origin is further sug-gested for the Formicini in the Paleocene (64.3–66.7 Ma),while an early Eocene origin (51.4–55.8 Ma) of the Cam-ponotini in the Indomalayan region received moderatesupport. Age estimates for crown-group Melophorinirange from 52.6–62.9 Ma with an Australasian origin. Forextant Formicinae genera, our crown-group estimatesrange from 3.2–56.1 Ma. Notably, the oldest genera withinthe Formicinae are Lepisiota (42.9–44.2 Ma, node 141)and Tapinolepis (45.5–56.1 Ma, node 138), while Geso-myrmex (4.2–8.8 Ma) and Opisthopsis (3.2–6.2 Ma) arerecovered as the youngest lineages.
DiscussionComparison of UCE vs multi-locus methodsWe reconstruct the evolution of the subfamily Formici-nae based upon a next-generation, pan-genomic data setof UCEs, and provide a direct comparison of thistargeted-enrichment phylogenomic approach to a muchsmaller traditional phylogenetic data set assembled bySanger-sequencing methods using the same set of 82 ex-emplar species. The Sanger data set was 100 % completewithout missing data, while the UCE data set used forcomparison was only 70 % complete. Our results clearlydemonstrate the advantage of using the nearly 1000UCE loci over using 10 genes to resolve formicine rela-tionships. Only five nodes have less than 70 % bootstrap
support in the UCE phylogeny (Fig. 1a), whereas 28 (outof 85) of the nodes in the 10-gene phylogeny are poorlysupported (BS < 70). Such increased support in the UCEphylogeny compared to the 10-gene phylogeny is per-haps unsurprising, given the different scales of the data(~590000 bp vs ~7200 bp, Table 1). Furthermore, the su-periority of the UCEs over the nuclear loci is not merelya function of sequence length, but can also be attributedto higher phylogenetic informativeness (PI). The fullUCE-70 % data set has nearly double the PI relative tothe 10-gene data set, while filtering of the UCE data byaverage bootstrap support (UCE-100best) raised PI to alevel about 2.5 times higher. These metrics are congru-ent with estimates from a recent study comparing phylo-genetic informativeness across ten single-copy nucleargenes with UCE core and flanking regions [8].The remaining uncertainty in the UCE phylogeny
could well be heavily influenced by the presence of thefive problematic taxa subtended by long branches. Con-versely, however, it should be stressed that although theexclusions of these taxa increase support for theremaining relationships, these exclusions could simul-taneously lead to a decrease in phylogenetic accuracydue to less complete taxon sampling, and thus these re-sults should not necessarily be interpreted as improvedestimates of phylogenetic relationships (but see [47]).
Dating with UCEsTo our knowledge, divergence ages based on UCEs havenever been systematically compared to those estimatedfrom other types of data, such as our ten-gene nuclear se-quence data. It is possible that functional differences be-tween these two types of data may lead to incompatible
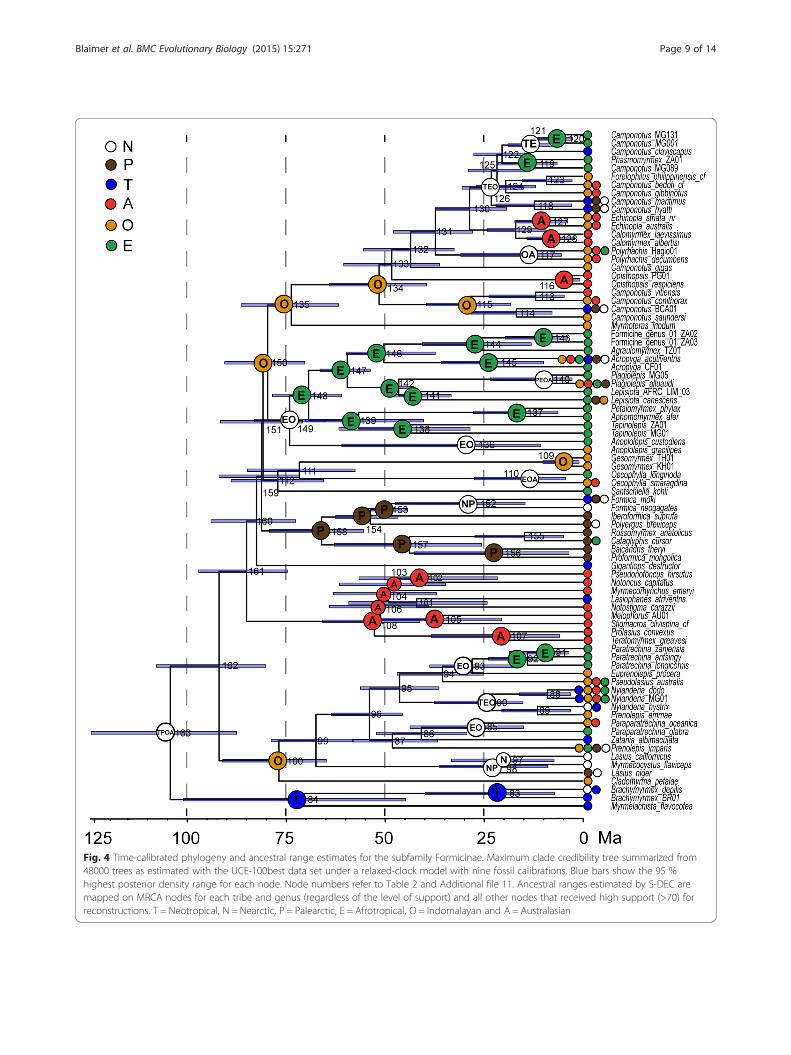
Fig. 4 Time-calibrated phylogeny and ancestral range estimates for the subfamily Formicinae. Maximum clade credibility tree summarized from48000 trees as estimated with the UCE-100best data set under a relaxed-clock model with nine fossil calibrations. Blue bars show the 95 %highest posterior density range for each node. Node numbers refer to Table 2 and Additional file 11. Ancestral ranges estimated by S-DEC aremapped on MRCA nodes for each tribe and genus (regardless of the level of support) and all other nodes that received high support (>70) forreconstructions. T = Neotropical, N = Nearctic, P = Palearctic, E = Afrotropical, O = Indomalayan and A = Australasian
Blaimer et al. BMC Evolutionary Biology (2015) 15:271 Page 9 of 14
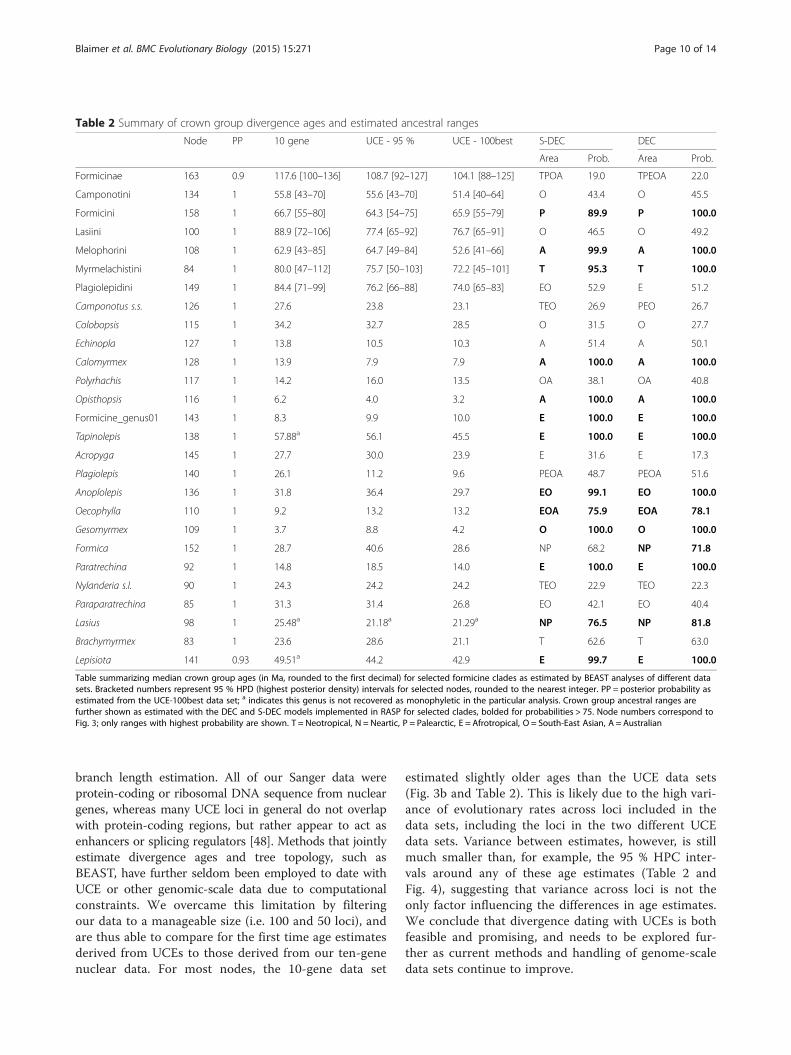
Table 2 Summary of crown group divergence ages and estimated ancestral ranges
Node PP 10 gene UCE - 95 % UCE - 100best S-DEC DEC
Area Prob. Area Prob.
Formicinae 163 0.9 117.6 [100–136] 108.7 [92–127] 104.1 [88–125] TPOA 19.0 TPEOA 22.0
Camponotini 134 1 55.8 [43–70] 55.6 [43–70] 51.4 [40–64] O 43.4 O 45.5
Formicini 158 1 66.7 [55–80] 64.3 [54–75] 65.9 [55–79] P 89.9 P 100.0
Lasiini 100 1 88.9 [72–106] 77.4 [65–92] 76.7 [65–91] O 46.5 O 49.2
Melophorini 108 1 62.9 [43–85] 64.7 [49–84] 52.6 [41–66] A 99.9 A 100.0
Myrmelachistini 84 1 80.0 [47–112] 75.7 [50–103] 72.2 [45–101] T 95.3 T 100.0
Plagiolepidini 149 1 84.4 [71–99] 76.2 [66–88] 74.0 [65–83] EO 52.9 E 51.2
Camponotus s.s. 126 1 27.6 23.8 23.1 TEO 26.9 PEO 26.7
Colobopsis 115 1 34.2 32.7 28.5 O 31.5 O 27.7
Echinopla 127 1 13.8 10.5 10.3 A 51.4 A 50.1
Calomyrmex 128 1 13.9 7.9 7.9 A 100.0 A 100.0
Polyrhachis 117 1 14.2 16.0 13.5 OA 38.1 OA 40.8
Opisthopsis 116 1 6.2 4.0 3.2 A 100.0 A 100.0
Formicine_genus01 143 1 8.3 9.9 10.0 E 100.0 E 100.0
Tapinolepis 138 1 57.88a 56.1 45.5 E 100.0 E 100.0
Acropyga 145 1 27.7 30.0 23.9 E 31.6 E 17.3
Plagiolepis 140 1 26.1 11.2 9.6 PEOA 48.7 PEOA 51.6
Anoplolepis 136 1 31.8 36.4 29.7 EO 99.1 EO 100.0
Oecophylla 110 1 9.2 13.2 13.2 EOA 75.9 EOA 78.1
Gesomyrmex 109 1 3.7 8.8 4.2 O 100.0 O 100.0
Formica 152 1 28.7 40.6 28.6 NP 68.2 NP 71.8
Paratrechina 92 1 14.8 18.5 14.0 E 100.0 E 100.0
Nylanderia s.l. 90 1 24.3 24.2 24.2 TEO 22.9 TEO 22.3
Paraparatrechina 85 1 31.3 31.4 26.8 EO 42.1 EO 40.4
Lasius 98 1 25.48a 21.18a 21.29a NP 76.5 NP 81.8
Brachymyrmex 83 1 23.6 28.6 21.1 T 62.6 T 63.0
Lepisiota 141 0.93 49.51a 44.2 42.9 E 99.7 E 100.0
Table summarizing median crown group ages (in Ma, rounded to the first decimal) for selected formicine clades as estimated by BEAST analyses of different datasets. Bracketed numbers represent 95 % HPD (highest posterior density) intervals for selected nodes, rounded to the nearest integer. PP = posterior probability asestimated from the UCE-100best data set; a indicates this genus is not recovered as monophyletic in the particular analysis. Crown group ancestral ranges arefurther shown as estimated with the DEC and S-DEC models implemented in RASP for selected clades, bolded for probabilities > 75. Node numbers correspond toFig. 3; only ranges with highest probability are shown. T = Neotropical, N = Neartic, P = Palearctic, E = Afrotropical, O = South-East Asian, A = Australian
Blaimer et al. BMC Evolutionary Biology (2015) 15:271 Page 10 of 14
branch length estimation. All of our Sanger data wereprotein-coding or ribosomal DNA sequence from nucleargenes, whereas many UCE loci in general do not overlapwith protein-coding regions, but rather appear to act asenhancers or splicing regulators [48]. Methods that jointlyestimate divergence ages and tree topology, such asBEAST, have further seldom been employed to date withUCE or other genomic-scale data due to computationalconstraints. We overcame this limitation by filteringour data to a manageable size (i.e. 100 and 50 loci), andare thus able to compare for the first time age estimatesderived from UCEs to those derived from our ten-genenuclear data. For most nodes, the 10-gene data set
estimated slightly older ages than the UCE data sets(Fig. 3b and Table 2). This is likely due to the high vari-ance of evolutionary rates across loci included in thedata sets, including the loci in the two different UCEdata sets. Variance between estimates, however, is stillmuch smaller than, for example, the 95 % HPC inter-vals around any of these age estimates (Table 2 andFig. 4), suggesting that variance across loci is not theonly factor influencing the differences in age estimates.We conclude that divergence dating with UCEs is bothfeasible and promising, and needs to be explored fur-ther as current methods and handling of genome-scaledata sets continue to improve.
Blaimer et al. BMC Evolutionary Biology (2015) 15:271 Page 11 of 14
Practical considerations of UCEs vs Sanger sequencingWhile most researchers would agree that our resultsclearly show the advantage of using the nearly 1000 UCEloci over the 10-gene data set for phylogenetic inference,there are also practical aspects to consider regarding thecost and time spent in obtaining these data sets. We donot aim to provide a detailed analysis here, because bothtime and cost factors are highly variable and dependenton, e.g., sample DNA quality, available laboratory sup-plies, accumulated experience with a given technique,and sequencing cost at the respective genomic facilityused. In our case, however, we found that the cost andtime to generate both of these data sets are similar.Labor time associated with next-generation library prep-aration and target enrichment for UCEs for 90 taxa(~3 weeks for one full-time person) is roughly the sameas for a single attempt at PCR-amplification and cyclesequencing of 10 individual genes, if not less. Processingtime of the sequence data through the bioinformaticspipeline further is negligible compared to the time spentediting individual sequences. Cost of supplies and se-quencing to generate ~1000 UCE loci can be as low as~ $40–60/sample, compared to an estimate of $5/sam-ple/gene fragment for PCR amplifications and Sanger se-quencing. Thus, from our perspective, we found theUCE methodology comparable with regard to cost andtime input and superior in terms of data output whencompared to Sanger sequencing.
Implications for formicine systematicsBased on our UCE phylogeny, we propose several taxo-nomic changes at the tribal level (see Additional file 7)for the subfamily Formicinae that aim to improve antsystematics while simultaneously keeping names fairlystable. These results partly agree with Bolton’s [49] priorsystem of formicine tribes based on morphology, al-though major changes have to be made in the composi-tions of Lasiini, Melophorini and Plagiolepidini, and theMyrmelachistini must be resurrected.The five problematic taxa were previously unassoci-
ated with any of the larger clades, and to some extentthis ambiguity persists. However, the UCE data firmlysupport the close relationship of Gesomyrmex and Oeco-phylla, and of Myrmoteras as the sister group of Campo-notini; these relationships are poorly supported by the10-gene data set. The phylogenetic positions of Gigan-tiops and Santschiella remain less clear, although theUCE data provide some support for a close relationshipof these two taxa with Camponotini +Myrmoteras. An-cient radiation events are common throughout the in-sect tree of life [50], and other phylogenomic-scalestudies have tried to resolve these with varying success([e.g., [51–53]). Deep lineage diversification within theFormicinae appears to have occurred very rapidly, over a
period of 10–12 MY in the Cretaceous (Fig. 4), and maychallenge the information content of even phylogenomicdata. In addition, although our sampling comprised repre-sentatives of nearly all extant formicine genera, our resultscould have been influenced by limited taxon samplingwithin these lineages, and thus increased taxon samplingmay be able to improve phylogenetic resolution.Our analyses recovered four formicine genera as non-
monophyletic: Nylanderia, Prenolepis, Lepisiota, andCamponotus. Additional taxon sampling will be neces-sary to resolve the generic limits of the first three, al-though other unpublished data suggest that Prenolepisemmae may be misplaced in Prenolepis and actually be-longs in Nylanderia (J. LaPolla, pers. comm.). Wepropose taxonomic changes here only for the carpenterants (Ward et al., in review; see also Additional file 7),Camponotus, a genus for which paraphyly has been re-peatedly indicated [16, 53–56]. Based on a strongly sup-ported, well-sampled phylogeny, we resurrect the generaColobopsis and Dinomyrmex for the two divergent line-ages, and redefine Camponotus to include Forelophilusand Phasmomyrmex, thus making it monophyletic(Additional file 7). We found Colobopsis to be well sepa-rated from other Camponotus and sister to all otherCamponotini, a result mirrored by phylogenetic analysesof their obligate bacterial endosymbionts, Blochmannia,unique to Camponotini [57]. The newly discovered sisterrelationship of Myrmoteras with Camponotini now raisesthe intriguing question of whether the former also har-bor Blochmannia or related endosymbionts. Remarkably,we found the genera known to harbor the pumiliotoxins(Brachymyrmex and Paratrechina) sequestered by den-drobatid poison frogs [22] to be part of the two earliestbranching lineages within the Formicinae, Myrmelachis-tini and Lasiini. This interesting pattern calls for a widersampling and thorough investigation of these chemicalsthroughout the subfamily.
Formicine biogeographyOur dating analyses extend formicine evolution deepinto the Cretaceous (104.1–117.6 Ma). These mediancrown-group age estimates are considerably older thanthe fossil record suggests, with Kyromyrma (~92 Ma),the oldest known stem-group formicine fossil, relativelyolder than previous molecular dating estimates for thesubfamily (77–83 Ma, [9]; 80–100 Ma, [10]; 75–90 Ma,[16]). The origin of the ant subfamily Myrmicinae waslikewise recently estimated to be about 10 MY olderthan previous estimates [14]. Divergence dating analysescan be sensitive with regard to incorrectly placed fossilcalibrations [58–60], but our analyses, sampling fromthe prior, show no indication of detrimental interactionsbetween calibration priors. Another possibility is that animbalance of ingroup vs. outgroup sampling and a lack
Blaimer et al. BMC Evolutionary Biology (2015) 15:271 Page 12 of 14
of calibrations in the outgroup part of the phylogenymay be driving our age estimates, although we used out-group taxa very similar to those in previous subfamily-level studies [11, 12, 14]. Conversely, our estimates maypresent a considerable improvement to previous studiesfor the very reason that our sampling of formicine line-ages is more comprehensive.The origin of the Formicinae was placed in the Neo-
tropics by Moreau & Bell [16]. Our inference of a Neo-tropical origin for the Myrmelachistini—the oldest tribeand the sister lineage to the remaining formicines—agrees with this hypothesis. Further inference of biogeo-graphic range evolution in the Formicinae was impededin our study by the remaining phylogenetic uncertaintysurrounding tribal relationships, but nonetheless we ob-tained highly supported crown-group ancestral range es-timates for a number of lineages. The evolution ofMelophorini took place mainly in Australasia (Fig. 4 andTable 2), which seems a natural result given that extantmembers of this tribe are largely confined to Australia.Along the same lines, the Formicini appeared to havehad a history of evolution mainly in the Palearctic re-gion, except for one dispersal to the Neotropics in theEocene to Oligocene. For the Plagiolepidini, our analysesreconstructed an ancestral dispersal from the Oriental tothe Afrotropical region (Fig. 3, node 150 to 151 to 148)where this tribe then appears to have undergone the ma-jority of its diversification. Camponotini and Lasiini aretwo species-rich clades of formicine ants with represen-tatives across all continents. For both of these globallydistributed groups our estimates point to an origin inthe Oriental region, although with mediocre support(Table 2, 43.4–45.5 % and 46.5–49.2 %). Moreau & Bell[16] have suggested that the Neotropics functioned as acradle for ant diversification; however, our biogeographicresults are not fully consistent with this hypothesis.While there are indications of a Formicinae origin in theNeotropics, our analyses overall do not associate the di-versification of formicine ants with any particular region.
ConclusionsWe compared the phylogenetic informativeness of a 10-nuclear-gene data set produced by Sanger sequencingwith a next-generation, phylogenomic data set of nearly1000 UCE loci. This comparison, executed within thecontext of a case study of the same 82 species, tested theability of these two types of data to resolve the evolu-tionary history of formicine ants. We found UCEs to befar superior to the multi-locus data set in estimating for-micine relationships and noted a 1.5–2.5-fold increase inphylogenetic informativeness relative to the Sanger-produced data. Some ancient rapid divergence eventsremained unresolved even by our genomic data, indicat-ing that phylogenetic reconstruction may in these cases
only be improved with whole-genome data or, alterna-tively, that genuinely rapid radiations may have pro-duced unresolvable hard polytomies. We successfullyused BEAST to infer divergence ages from the UCEdata, overcoming computational limitations throughdata filtering. These analyses reconstructed formicineants and their major lineages to be relatively older com-pared to previous estimates for the group. The subfamilyappears to have diversified across all biogeographic re-gions and to have had no particular evolutionary cradle,although much of the early history of the clade remainsunclear. UCEs were able to significantly improve formi-cine tribal classification based on the comprehensivephylogeny for the group estimated here. Our study high-lights both the promise and possible limitations of UCEsfor evolutionary biologists considering the transitionfrom Sanger to next-generation sequencing approaches:Taken together, our findings indicate UCEs are highlyuseful for insect phylogenomics. The resulting phylogenyreveals exciting foci for the study of behavior and chem-ical ecology in formicine ants.
Availability of supporting dataThe data sets supporting the results of this article areavailable in GenBank (Accessions KT443144–KT443783)and in the Sequence Read Archive (SUB1067415); datamatrices and associated tree files are deposited in Tree-base (TB2:S18146).
Additional files
Additional file 1: Comprehensive description of methods. Anextensive version of the methods section, giving a more detailed accountof laboratory and bioinformatics procedures. (PDF 132 kb)
Additional file 2: Genbank accessions for PCR-amplified sequencesincluded in this study. Table including specimen identifiers andGenbank accession numbers for all study taxa. (PDF 94 kb)
Additional file 3: Calibration points used to define prior calibrationdensities for dating analyses with BEAST. (PDF 91 kb)
Additional file 4: Taxon distribution matrix used in the biogeographicanalyses. (PDF 81 kb)
Additional file 5: Dispersal constraint matrices used for DEC andS-DEC analyses in RASP. (PDF 75 kb)
Additional file 6: Summary of UCE capture statistics. (PDF 95 kb)
Additional file 7: Revised tribal classification for the Formicinae.(PDF 84 kb)
Additional file 8: Phylogenetic trees from analyses not illustrated inthe main text. Additional results from Bayesian and MaximumLikelihood bootstrap analyses. (PDF 2225 kb)
Additional file 9: Phylogenetic trees from analyses not illustrated inthe main text, continued. Additional results from Maximum Likelihoodanalyses on UCE data subsets. (PDF 669 kb)
Additional file 10: Summary of taxon exclusion experiments.Summary sketches of phylogenetic relationships contrasting theplacement of the seven rogue taxa between UCE and 10-gene data set.(PDF 248 kb)
Blaimer et al. BMC Evolutionary Biology (2015) 15:271 Page 13 of 14
Additional file 11: Comprehensive results of ancestral rangeestimations under the DEC and S-DEC models. Extended version ofTable 2 including all crown group ancestral ranges as estimated with theDEC and S-DEC models implemented in RASP. (PDF 97 kb)
AbbreviationsBI: Bayesian inference; BS: Bootstrap support; bp: base pairs; DEC: Dispersal-extinction-cladogenesis; HPD: Highest posterior density; Ma: Million yearsago; MCC: Maximum clade credibility; ML: Maximum Likelihood; MRCA: Mostrecent common ancestor; MY: Million years; PI: Phylogenetic informativeness;PP: Posterior Probability; S-DEC: Statistical Dispersal-extincton-cladogenesis;SI/HPC: Smithsonian Institution high performance cluster; UCEs: Ultraconservedelements.
Competing interestsThe authors declare that they have no competing interest.
Authors’ contributionsPSW, SGB, BLF, TRS, and BBB conceived the study and participated in itsdesign and coordination. BBB generated and analyzed the UCE data,conducted phylogenetic and divergence dating analyses, and led manuscriptwriting. SGB generated and edited Sanger data, and helped to draft themanuscript. BLF obtained specimens, databased specimen information andimages, and helped to draft the manuscript. MWL generated and analyzedUCE data, and helped to draft the manuscript. TRS conducted phylogeneticanalyses and helped to draft the manuscript. PSW obtained specimens,databased specimen information, generated and edited the Sanger data, andhelped to draft the manuscript. All authors read and approved the finalmanuscript.
AcknowledgmentsThis study was supported by NSF grants EF-0431330 (to PSW, SGB, TRS &BLF), DEB-0743542 (to SGB), DEB-0949689 (to TRS), DEB-0842204 (to PSW),and the Competitive Grants Program for Science (Smithsonian Institution, toSGB & TRS). BBB was partly supported by a Peter Buck Postdoctoral Fellow-ship. We are grateful to A. Jesovnik and J. Sosa-Calvo for help with laboratoryprocedures, and M. Branstetter for guidance on UCE methods. Portions ofthe laboratory and the computer work were conducted in and with thesupport of the L.A.B. facilities of the National Museum of Natural History.
Author details1Department of Entomology, National Museum of Natural History,Smithsonian Institution, Washington, DC 20560, USA. 2Department ofEntomology, California Academy of Sciences, San Francisco, CA 94118, USA.3Department of Entomology and Nematology, University of California-Davis,Davis, CA 95616, USA.
Received: 8 October 2015 Accepted: 26 November 2015
References1. McCormack JE, Faircloth BC, Crawford NG, Gowaty PA, Brumfield RT, Glenn
TC. Ultraconserved elements are novel phylogenomic markers that resolveplacental mammal phylogeny when combined with species-tree analysis.Gen Res. 2012;22(4):746–54.
2. Lemmon EM, Lemmon AR. High-throughput genomic data in systematicsand phylogenetics. Annu Rev Ecol Syst. 2013;44:99–121.
3. Smith BT, Harvey MG, Faircloth BC, Glenn TC, Brumfield RT. Target captureand massively parallel sequencing of ultraconserved elements forcomparative studies at shallow evolutionary time scales. Syst Biol. 2013;63:83–95.
4. Smith BT, McCormack JE, Cuervo AM, Hickerson MJ, Aleixo A, Cadena CD,et al. The drivers of tropical speciation. Nature. 2014;515:406–9.
5. Crawford NG, Faircloth BC, McCormack JE, Brumfield RT, Winker K, Glenn TC.More than 1000 ultraconserved elements provide evidence that turtles arethe sister group of archosaurs. Biol Lett. 2012;8:783–6.
6. Faircloth BC, McCormack JE, Crawford NG, Harvey MG, Brumfield RT, GlennTC. Ultraconserved elements anchor thousands of genetic markers spanningmultiple evolutionary timescales. Syst Biol. 2012;61:717–26.
7. Faircloth BC, Branstetter MG, White ND, Brady SG. Target enrichment ofultraconserved elements from arthropods provides a genomic perspectiveon relationships among Hymenoptera. Mol Ecol Res. 2015;15:489–501.
8. Gilbert PS, Chang J, Pan C, Sobel EM, Sinsheimer JS, Faircloth BC, et al.Genome-wide ultraconserved elements exhibit higher phylogeneticinformativeness than traditional gene markers in percomorph fishes. MolPhylogenet Evol. 2015;92:140–6.
9. Brady SG, Schultz TR, Fisher BL, Ward PS. Evaluating alternative hypotheses forthe early evolution and diversification of ants. Proc Natl Acad Sci. 2006;103:18172–7.
10. Moreau CS, Bell CD, Vila R, Archibald SB, Pierce NE. Phylogeny of the ants:Diversification in the age of angiosperms. Science. 2006;312:101–4.
11. Ward PS, Brady SG, Fisher BL, Schultz TR. Phylogeny and biogeography ofdolichoderine ants: effects of data partitioning and relict taxa on historicalinference. Syst Biol. 2010;59:342–62.
12. Brady SG, Fisher BL, Schultz TR, Ward PS. The rise of army ants and their relatives:diversification of specialized predatory doryline ants. BMC Evol Biol. 2014;14:93.
13. Schmidt CA, Shattuck SO. The higher classification of the ant subfamilyPonerinae (Hymenoptera: Formicidae), with a review of ponerine ecologyand behavior. Zootaxa. 2014;3817:1–242.
14. Ward PS, Brady SG, Fisher BL, Schultz TR. The evolution of myrmicine ants:phylogeny and biogeography of a hyperdiverse ant clade (Hymenoptera:Formicidae). Syst Ent. 2015;40:61–81.
15. Lucky A, Trautwein MD, Guenard BS, Weiser MD, Dunn RR. Tracing the riseof ants-out of the ground. PLoS ONE. 2013;8(12):e84012.
16. Moreau CS, Bell CD. Testing the museum versus cradle tropical biologicaldiversity hypothesis: phylogeny, diversification, and ancestral biogeographicrange evolution of the ants. Evolution. 2013;67:2240–57.
17. Blaimer BB, Brady SG, Schultz TR, Fisher BL. Functional and phylogeneticapproaches reveal the evolution of diversity in a hyper diverse biota.Ecography. 2015;38:901–12.
18. Schultz TR, Brady SG. Major evolutionary transitions in ant agriculture. ProcNatl Acad Sci. 2008;105:5435–40.
19. Price SL, Powell S, Kronauer DJC, Tran LAP, Pierce NE, Wayne RK. Reneweddiversification is associated with new ecological opportunity in theNeotropical turtle ants. J Evol Biol. 2014;27:242–58.
20. Ward PS. The phylogeny and evolution of ants. Annu Rev Ecol Syst.2014;45:23–43.
21. Schmidt JO. Chemistry, pharmacology, and chemical ecology of antvenoms. In: Piek T, editor. Venoms of the Hymenoptera. London: AcademicPress; 1986: 425–508
22. Saporito RA, Garraffo HM, Donnelly MA, Edwards AL, Longino JT, Daly JW.Formicine ants: An arthropod source for the pumiliotoxin alkaloids ofdendrobatid poison frogs. Proc Natl Acad Sci. 2004;101:8045–50.
23. Buschinger A. Social parasitism among ants: a review (Hymenoptera:Formicidae). Myrmecol News. 2009;12:219–35.
24. LaPolla JS, Brady SG, Shattuck SO. Phylogeny and taxonomy of thePrenolepis genus-group of ants (Hymenoptera: Formicidae). Syst Ent. 2010;35:118–31.
25. Lapolla JS, Kallal RJ, Brady SG. A new ant genus from the GreaterAntilles and Central America, Zatania (Hymenoptera: Formicidae),exemplifies the utility of male and molecular character systems. SystEnt. 2012;37:200–14.
26. Blumenstiel B, Cibulskis K, Fisher S, DeFelice M, Barry A, Fennell T, et al.Targeted exon sequencing by in-solution hybrid selection. Curr Protoc HumGenet. 2010;Unit 18.4.1–18.4.24, Supplement 66.
27. Ward PS, Downie DA. The ant subfamily Pseudomyrmecinae (Hymenoptera:Formicidae): phylogeny and evolution of big-eyed arboreal ants. Syst Ent.2005;30:310–35.
28. Ward PS, Sumnicht TP. Molecular and morphological evidence for threesympatric species of Leptanilla (Hymenoptera: Formicidae) on the Greekisland of Rhodes. Myrmecol News. 2012;17:5–11.
29. Katoh K, Asimenos G, Toh H. Multiple alignment of DNA sequences withMAFFT. In: Bioinformatics for DNA sequence analysis. Humana Press, NewYork City; 2009: 39–64
30. Faircloth B. Illumiprocessor: a trimmomatic wrapper for parallel adapter andquality trimming. 2013. doi: 10.6079/J9ILL
31. Bolger AM, Lohse M, Usadel B. Trimmomatic: a flexible trimmer for Illuminasequence data. Bioinformatics 2014; btu170:1–7.
32. Faircloth B. PHYLUCE is a software package for the analysis of conservedgenomic loci. 2015. doi:10.6079/J9PHYL
Blaimer et al. BMC Evolutionary Biology (2015) 15:271 Page 14 of 14
33. Grabherr MG, Haas BJ, Yassour M, Levin JZ, Thompson DA, Amit I, et al.Full-length transcriptome assembly from RNA-Seq data without a referencegenome. Nat Biotech. 2011;29:644–52.
34. Castresana J. Selection of conserved blocks from multiple alignments fortheir use in phylogenetic analysis. Mol Biol Evol. 2000;17:540–52.
35. Lanfear R, Calcott B, Ho SYW, Guindon S. PartitionFinder: Combinedselection of partitioning schemes and substitution models for phylogeneticanalyses. Mol Biol Evol. 2012;29:1695–701.
36. Stamatakis A. RAxML-VI-HPC: maximum likelihood-based phylogeneticanalyses with thousands of taxa and mixed models. Bioinformatics. 2006;22:2688–90.
37. Zwickl DJ. Genetic algorithm approaches for the phylogenetic analysis oflarge biological sequence datasets under the maximum likelihood criterion.The University of Texas at Austin; 2006; accessible at: https://repositories.lib.utexas.edu/handle/2152/2666
38. Ronquist F, Teslenko M, van der Mark P, Ayres DL, Darling A, Höhna S, et al.MrBayes 3.2: efficient Bayesian phylogenetic inference and model choiceacross a large model space. Syst Biol. 2012;61:539–42.
39. Frandsen PB, Calcott B, Mayer C, Lanfear R. Automatic selection ofpartitioning schemes for phylogenetic analyses using iterative k-meansclustering of site rates. BMC Evol Biol. 2015;15:13.
40. Townsend JP. Profiling Phylogenetic Informativeness. Syst Biol. 2007;56:222–31.41. Faircloth BC, Chang J, Alfaro ME. TAPIR enables high-throughput estimation
and comparison of phylogenetic informativeness using locus-specificsubstitution models. 2012. arXiv preprint arXiv:12021215.
42. López-Giráldez F, Townsend JP. PhyDesign: an online application forprofiling phylogenetic informativeness. BMC Evol Biol. 2011;11:152.
43. Drummond AJ, Suchard MA, Xie D, Rambaut A. Bayesian Phylogenetics withBEAUti and the BEAST 1.7. Mol Biol Evol. 2012;29:1969–73.
44. Ree RH, Smith SA. Maximum likelihood inference of geographic rangeevolution by dispersal, local extinction, and cladogenesis. Syst Biol. 2008;57:4–14.
45. Beaulieu JM, Tank DC, Donoghue MJ. A Southern Hemisphere origin forcampanulid angiosperms, with traces of the break-up of Gondwana. BMCEvol Biol. 2013;13:80.
46. Yu Y, Harris AJ, Blair C, He X. RASP (Reconstruct Ancestral State in Phylogenies):a tool for historical biogeography. Mol Phylogen Evol. 2015;87:46–9.
47. Aberer AJ, Krompass D, Stamatakis A. Pruning rogue taxa improves phylogeneticaccuracy: an efficient algorithm and webservice. Syst Biol. 2013;62:162–6.
48. Makunin IV, Shloma VV, Stephen SJ, Pheasant M, Belyakin SN. Comparison ofultra-conserved elements in Drosophilids and Vertebrates. PLoS ONE. 2013;8:e82362.
49. Bolton B. Synopsis and classification of Formicidae. Mem Am Entomol Inst.2003;71:1–370.
50. Whitfield JB, Kjer KM. Ancient rapid radiations of insects: challenges forphylogenetic analysis. Ann Rev Ent. 2008;53:449–72.
51. Wiegmann BM, Trautwein MD, Winkler IS, Barr NB, Kim J-W, Lambkin C, et al.Episodic radiations in the fly tree of life. Proc Natl Acad Sci. 2011;108:5690–5.
52. Bazinet AL, Cummings MP, Mitter KT, Mitter CW. Can RNA-Seq resolve therapid radiation of advanced moths and butterflies (Hexapoda: Lepidoptera:Apoditrysia)? An exploratory study. PLoS ONE. 2013; 8(12):e82615.
53. Johnson BR, Borowiec ML, Chiu JC, Lee EK, Atallah J, Ward PS.Phylogenomics resolves evolutionary relationships among ants, bees, andwasps. Curr Biol. 2013;23:2058–62.
54. Brady SG, Gadau J, Ward PS. Systematics of the ant genus Camponotus(Hymenoptera: Formicidae): a preliminary analysis using data from themitochondrial gene cytochrome oxidase I. In: Austin AD, Dowton M, editors.Hymenoptera: evolution, biodiversity and biological control. Canberra:Fourth International Hymenoptera Conference; 2000.
55. Chen Z, Zhou S, Ye D, Chen Y, Lu C. Molecular phylogeny of the antsubfamily Formicinae (Hymenoptera, Formicidae) from China based onmitochondrial genes. Sociobiology. 2013;60:135–44.
56. Williams LE, Wernegreen JJ. Genome evolution in an ancient bacteria-antsymbiosis: parallel gene loss among Blochmannia spanning the origin ofthe ant tribe Camponotini. PeerJ. 2015;3:e881.
57. Wernegreen JJ, Kauppinen SN, Brady SG, Ward PS. One nutritional symbiosisbegat another: phylogenetic evidence that the ant tribe Camponotiniacquired Blochmannia by tending sap-feeding insects. BMC Evol Biol. 2009;9:292.
58. Near TJ, Sanderson MJ. Assessing the quality of molecular divergence timeestimates by fossil calibrations and fossil-based model selection. PhilosTrans R Soc Lond B Biol Sci. 2004;359:1477–83.
59. Ho SYW, Phillips MJ. Accounting for calibration uncertainty in phylogeneticestimation of evolutionary divergence times. Syst Biol. 2009;58:367–80.
60. Brady SG. Effects of fossil calibration-uncertainty on divergence dating inants and bees. Am Ent. 2011;57:56.
• We accept pre-submission inquiries
• Our selector tool helps you to find the most relevant journal
• We provide round the clock customer support
• Convenient online submission
• Thorough peer review
• Inclusion in PubMed and all major indexing services
• Maximum visibility for your research
Submit your manuscript atwww.biomedcentral.com/submit
Submit your next manuscript to BioMed Central and we will help you at every step: